
Bowyer and others want to know.
On March 18th, look for a huge tornado outbreak!
Wait a minute, that was exactly 100 years ago.
More on that event in 1925 and this years growing season coming up.
https://www.climate.gov/news-features/blogs/enso/january-2025-update-la-nina-here
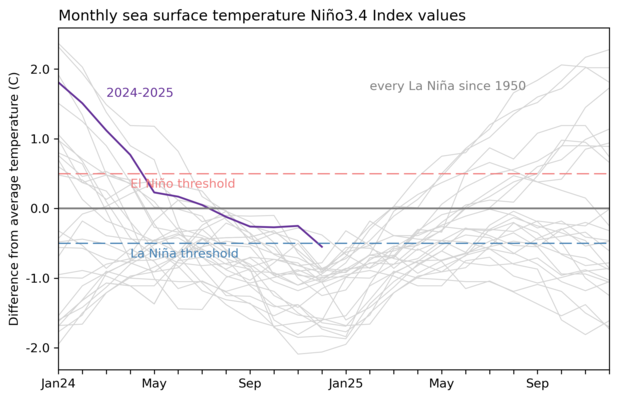
La Nina years usually produce favorable conditions for hurricanes to develop. Last years hurricane season was a massive bust, over prediction by EVERY source. Though we never hit the official La Nina standard designated by NOAA, the atmosphere doesn't wait to be told how to act by NOAA.
The atmosphere WAS in La Nina mode based on the La Nina-like temperature configuration in the Pacific and this was a huge factor in the flash drought to end the 2024 growing season..........which caused adversity to the late developing corn and beans crops, resulting in shocking cuts in production, yesterday, more than 3 months after all the damage was done.
USDA January 10, 2025/grains
Started by metmike - Jan. 10, 2025, 11:38 a.m.
https://www.marketforum.com/forum/topic/109451/
+++++++++++++++++
Potential for HUGE extremely needed rain event!
60 responses |
Started by metmike - Sept. 9, 2024, 12:05 a.m.
https://www.marketforum.com/forum/topic/107280/
This is being caused by the rapidly developing La Nina:
La Nina here we come!
8 responses |
Started by metmike - June 14, 2024, 10:23 a.m.
https://www.marketforum.com/forum/topic/104931/
https://www.marketforum.com/forum/topic/104931/#107114
+++++++++++++
No question that the La Nina analog for growing seasons in the US Cornbelt are hot and dry. El Nino's often feature the best growing seasons.
To try to figure out what configuration the atmosphere will be in during the 2025 growing season, let's look at the latest weekly update by NOAA:
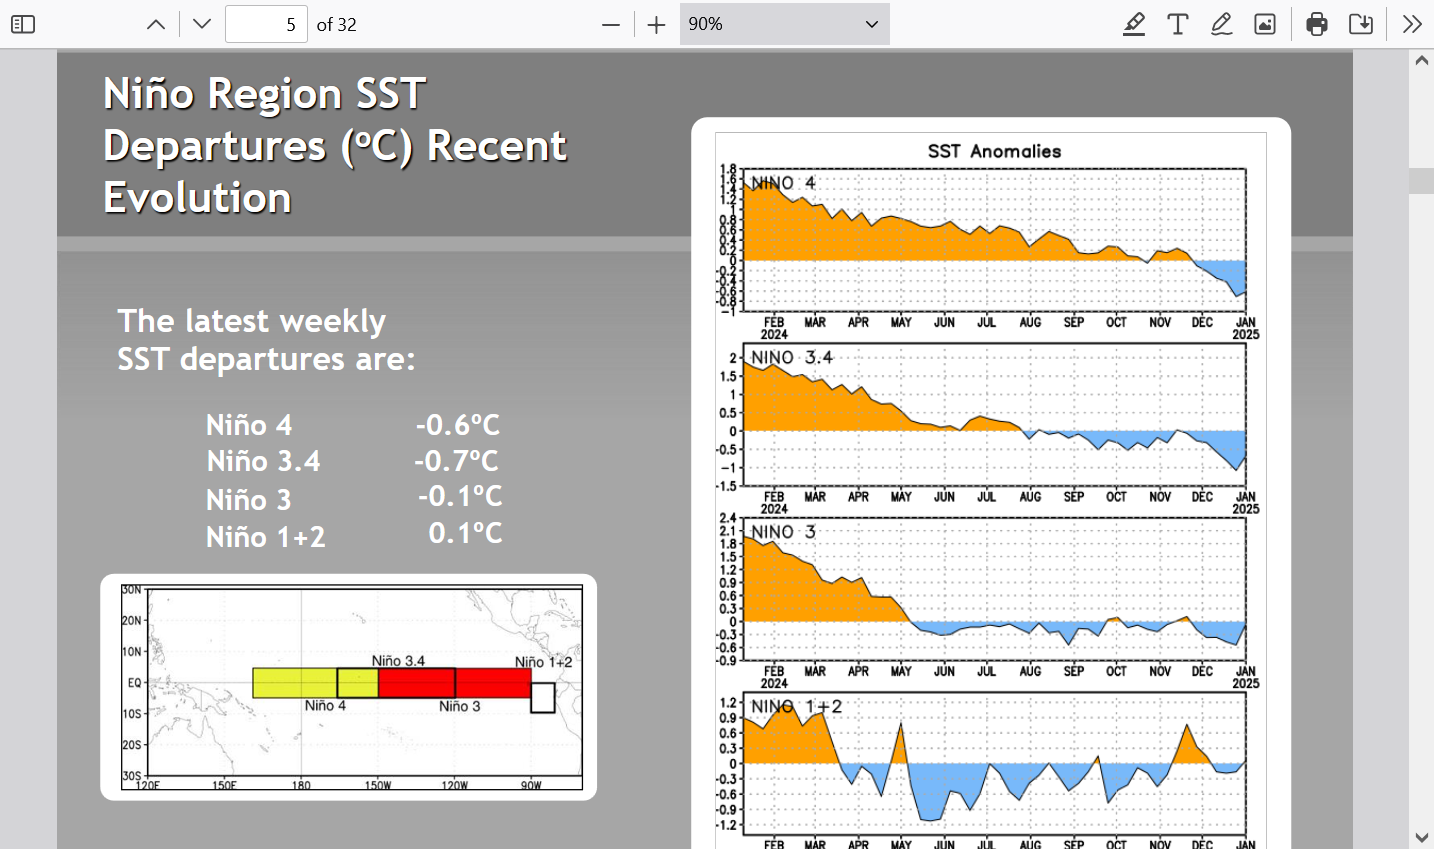
You can see below that Nino Region 3.4 was on the verge of a NOAA defined La Nina late Summer and Fall, then pulled back, finally surging colder in the past month. What I have noticed is that sometimes it not just a matter of whether we have a La Nina but also surrounding ocean temps and HOW FAST ENSO temps are dropping or rising.
At the start of 2024, Nino 3.4 was near 2.0 and crashed lower to negative values by then end of July. That rapid drop may have been a factor in the flash drought in the Midwest during late Summer.
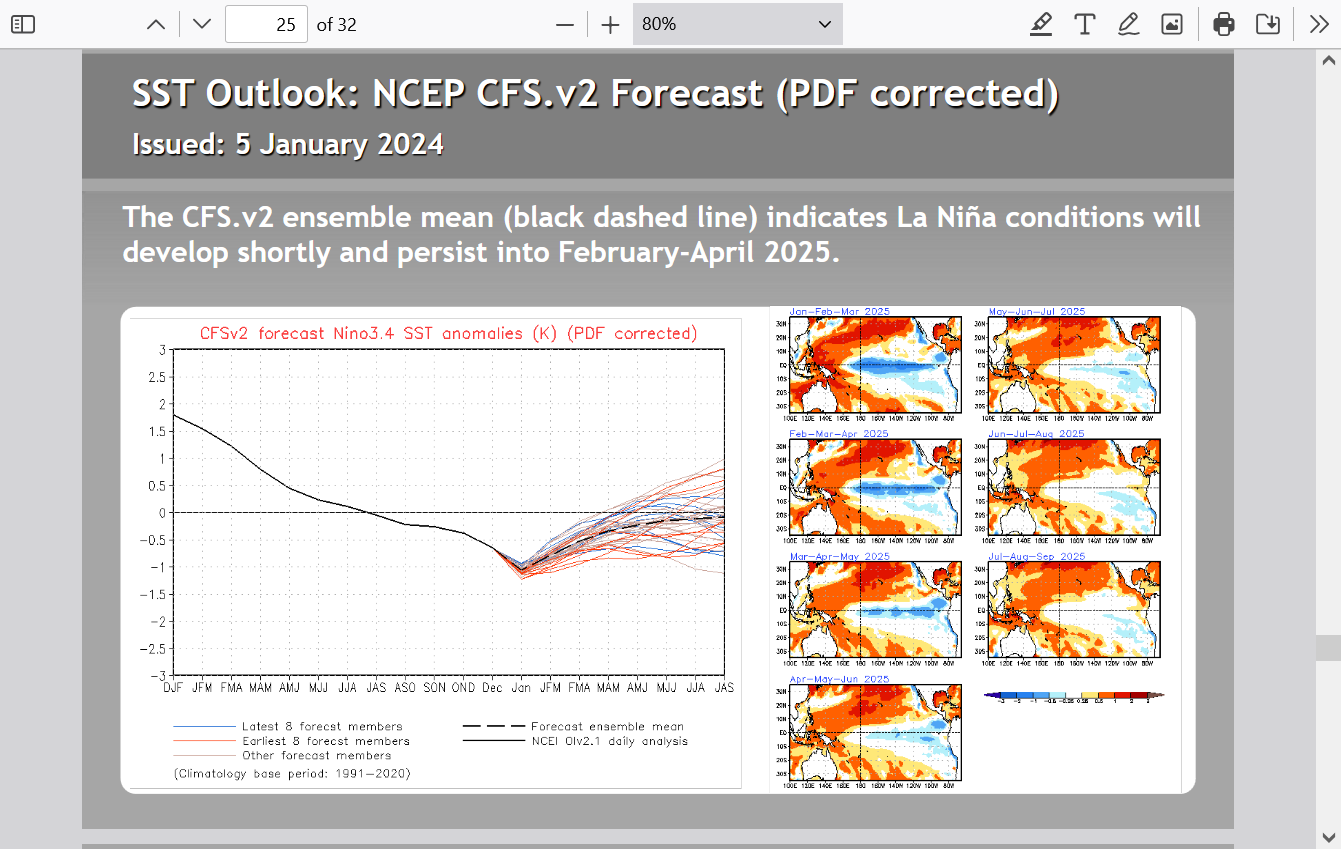
A key thing that we want to know to try to guess what the weather will be like this growing season, is where will ENSO be during that time?
All the models make this a short lived, weak La Nina. I would make the case that we have had an ALMOST La Nina since late last Summer, so it's actually not that short lived.
Regardless, all the models indicate a La Nada(neutral ENSO) this Summer. This means ENSO is not a powerful force 1 way or the other.
Mike,
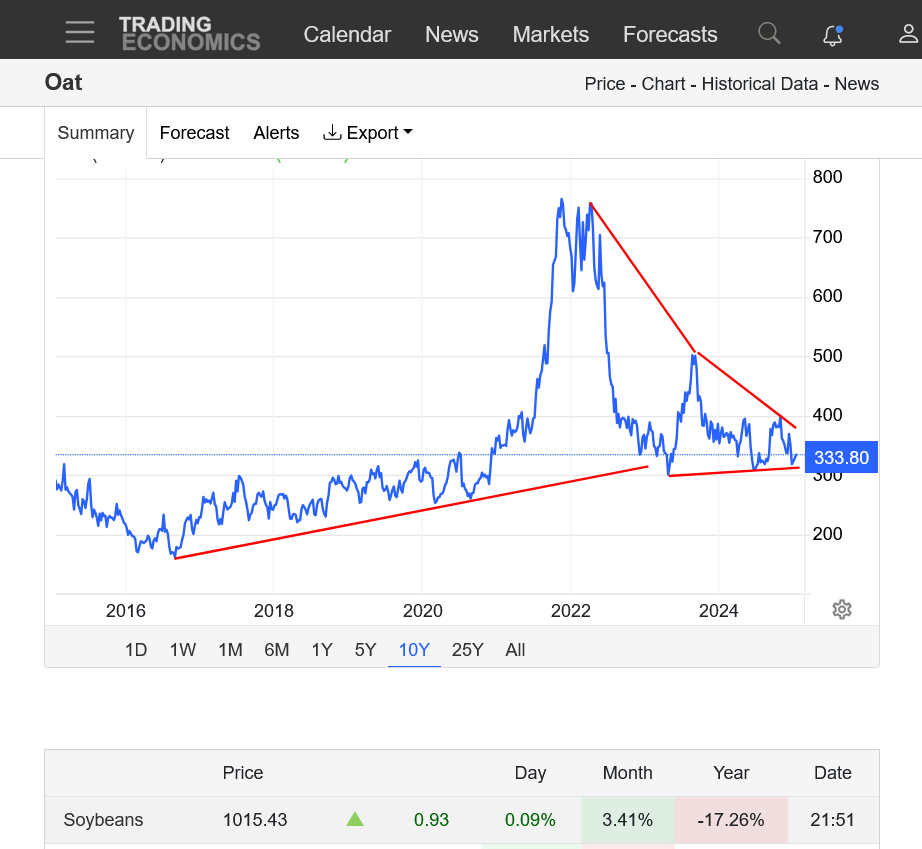
What is your view on the oats market? The chart is looking ripe? What is the vibe?
Oats is so thinly traded that I don’t trust anything about it.
it does look like a triple bottom with the $3 low in April 2023, then just above that with the July 2024 low, then the recent one near the end of December 2024 around $3.18.
we can draw a little uptrend line from those lows that isn't very steep.
we can also go back to the low around $1.60 back in August 2016 and draw a steeper up trend.
at the same time, we have a very STEEP downtrend from the February 2022 highs to the September 2023 highs.
Then, the slope of the downtrend after that was less steep to the October 2024 high.
This means that we have a symmetrical wedge formation(lower high and higher lows). We might look for either an upside break out when the price closes solidly above the downtrend or a downside break out when it closes solidly below the uptrend.
However we already closed below the initial, steeper uptrend in 2023 and it was a false downside break out.
Then in 2024 we closed above the initial steeper downtrend and it too was a false upside breakout.
What this means is that you can do perfect technical analysis and draw great lines on a graph but more often than not, the market doesn't follow exactly what the formation says it should do.
Technical analysis can be a helpful indicator, like in being long or short during a lengthy trend is your friend pattern.
However, in a market like the one below, there has been no solid trend the past year. More like choppy. sideways trading in all of 2024.
https://tradingeconomics.com/commodity/oat
Back at my computer and I just checked the total volume for March oats, the front month after more than 2.5 hours of trading this evening.
60 contracts!!!
Compare that to March corn with more than 29,000 contracts traded and thinly traded March Chicago wheat with 3,228 contracts traded.
20 years ago when I had a large 6 figure account, I traded in 200 lot-corn and 100-lot bean orders.
60 total contracts wouldn't even get close to filling 1 order!
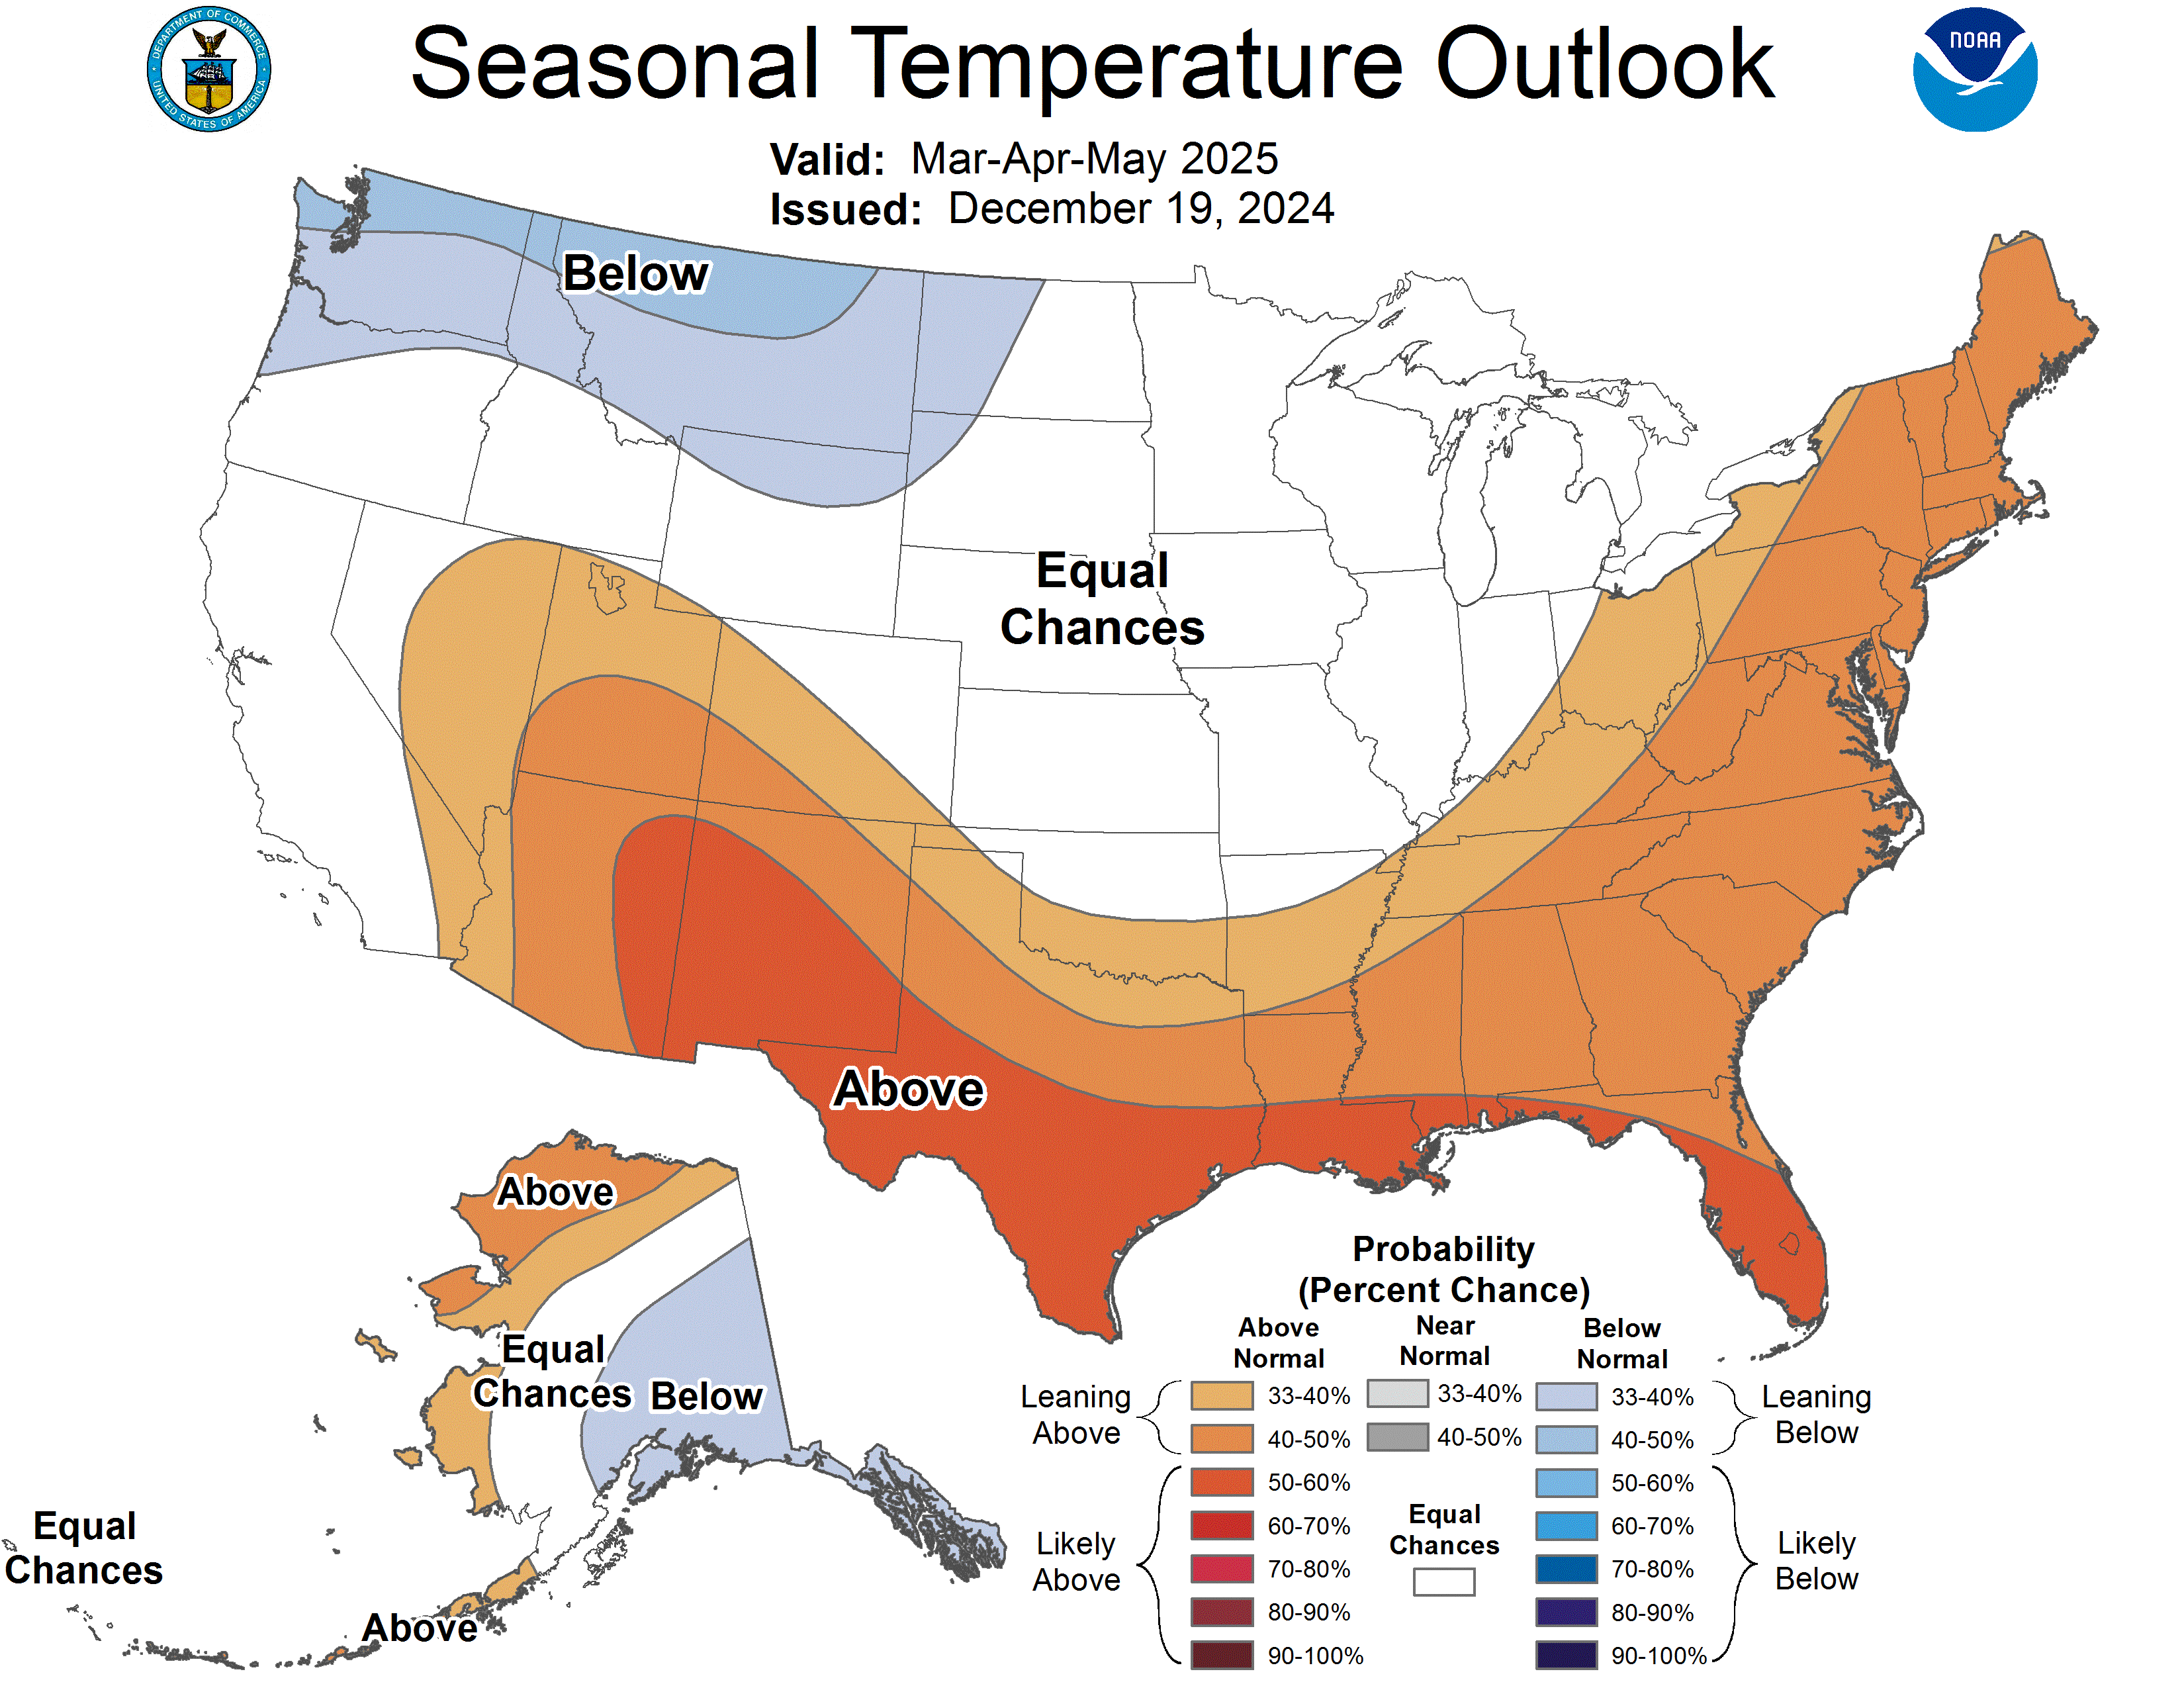
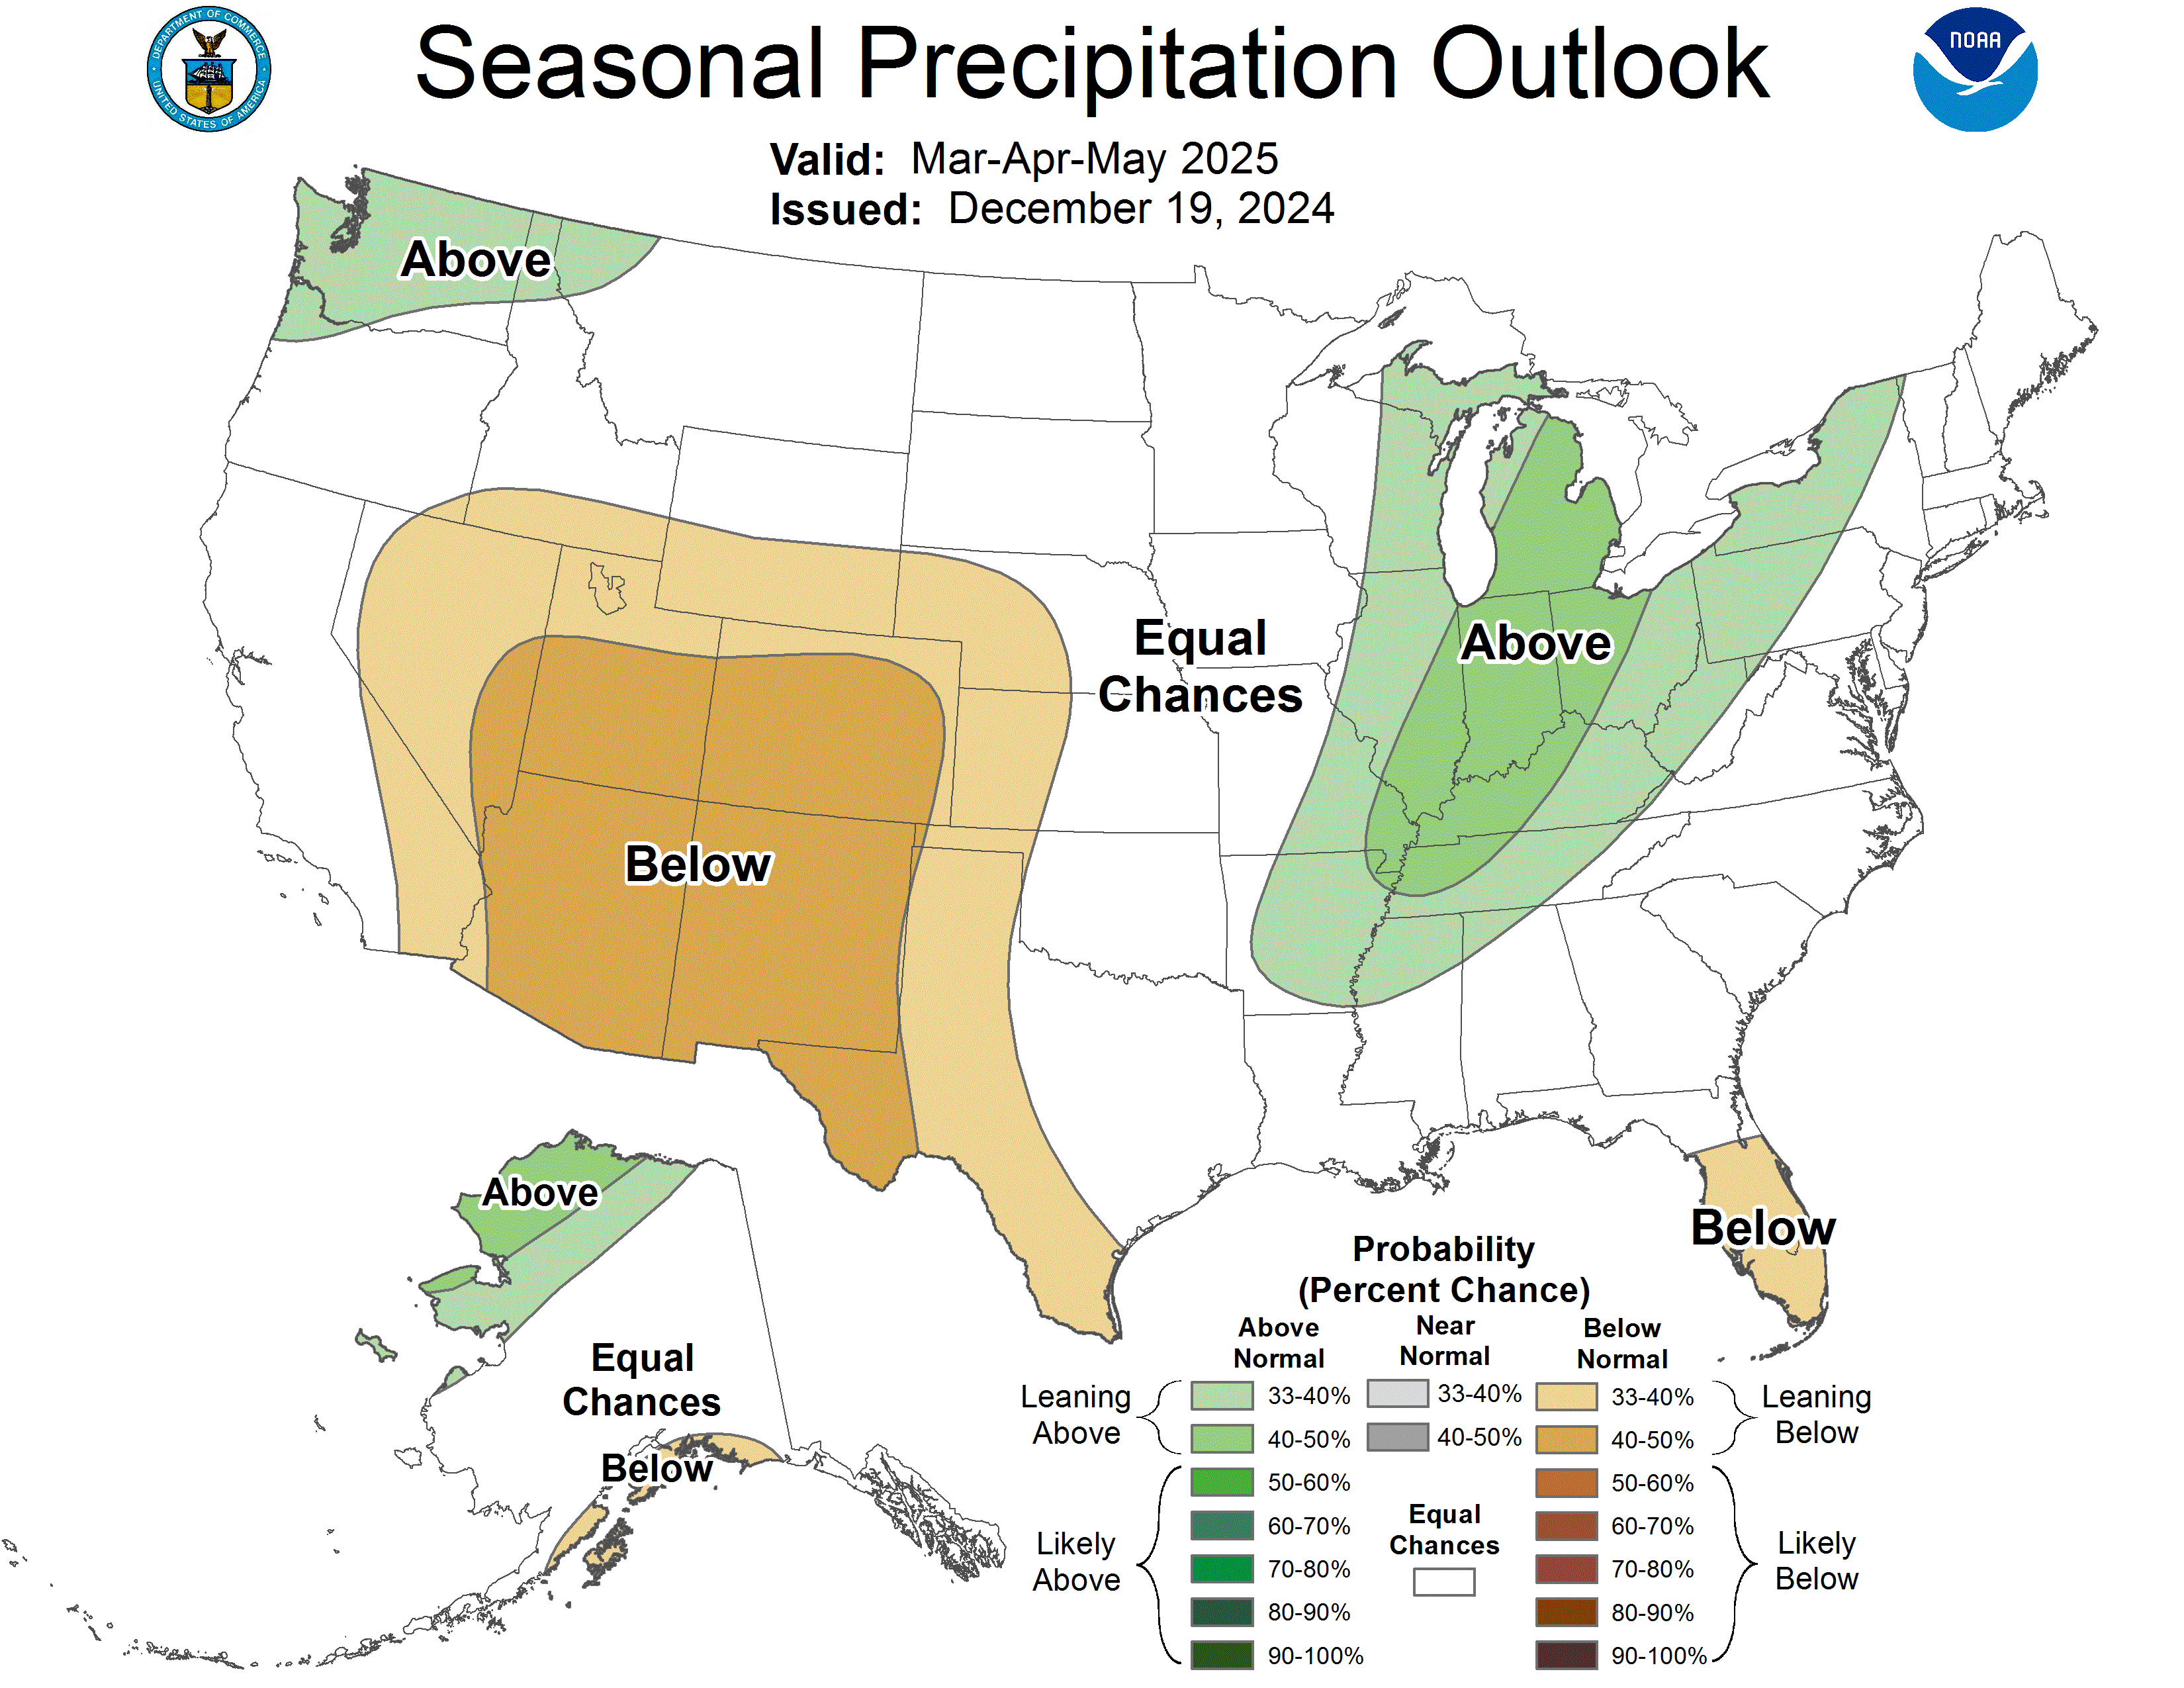
Here are the latest seasonal weather forecasts from NOAA. Take these with a grain of salt. They are almost a month old too!
https://www.cpc.ncep.noaa.gov/products/predictions/90day/
Spring/planting months:
Summer/growing months:
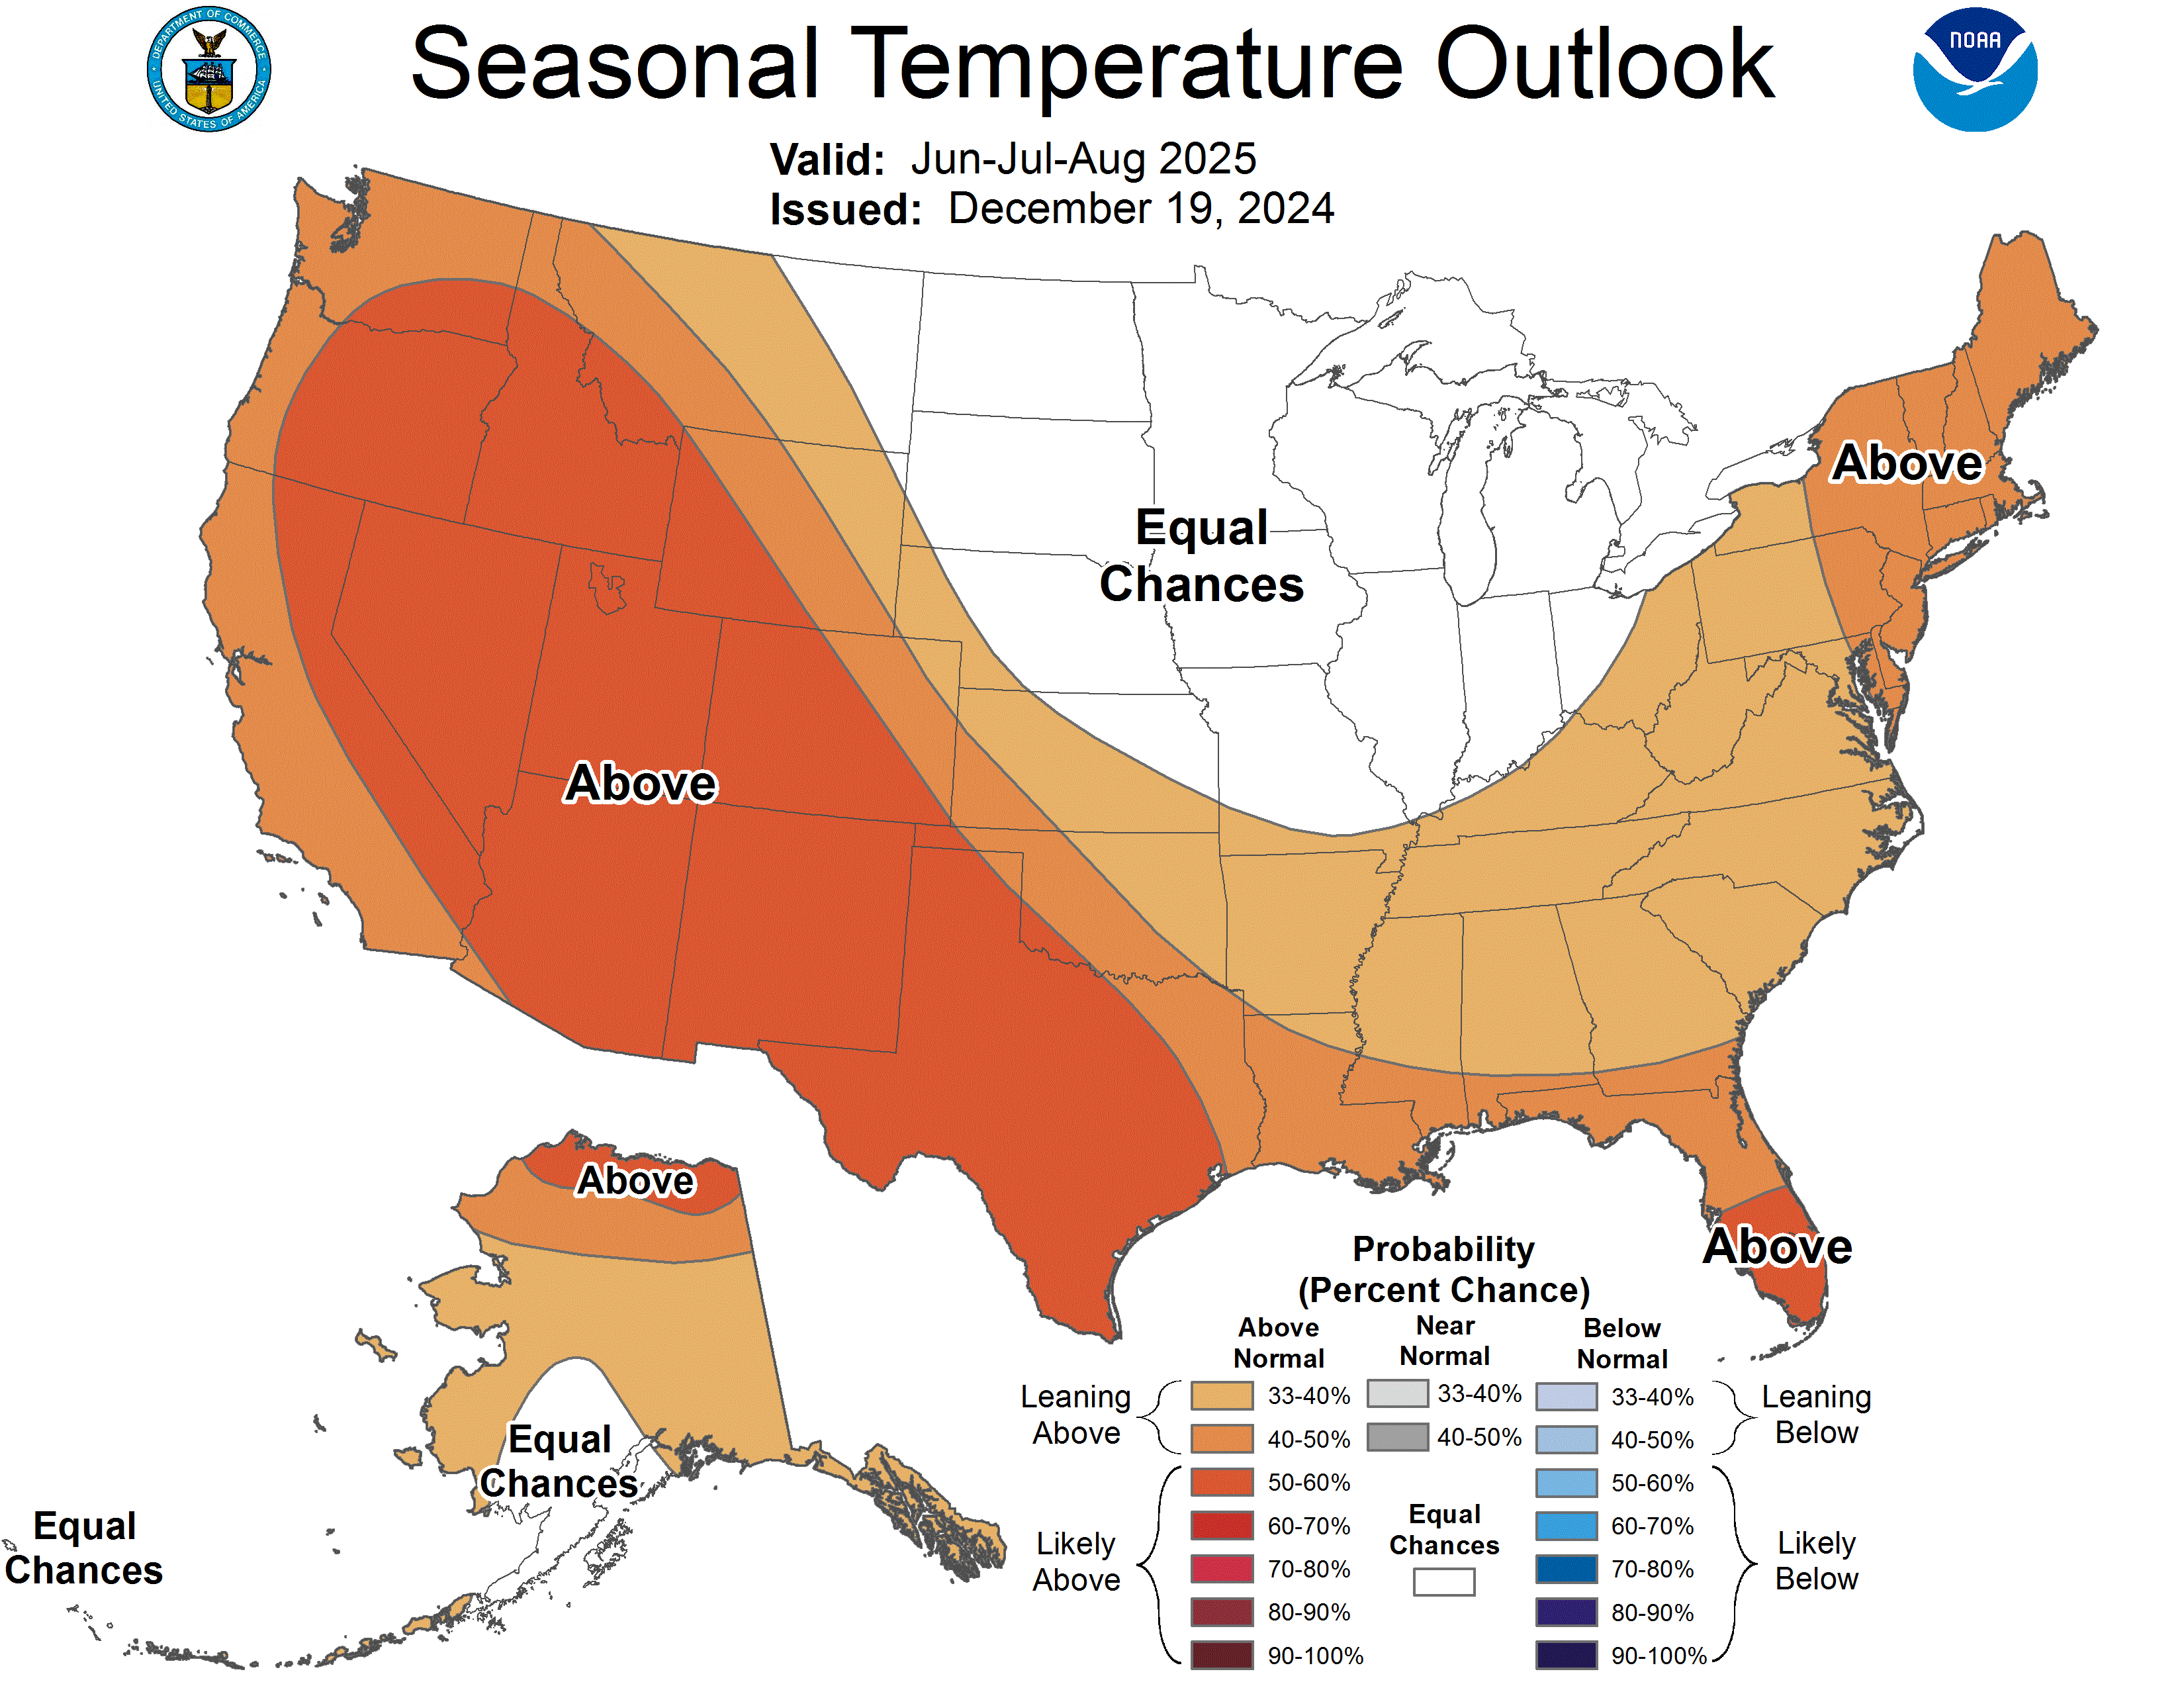
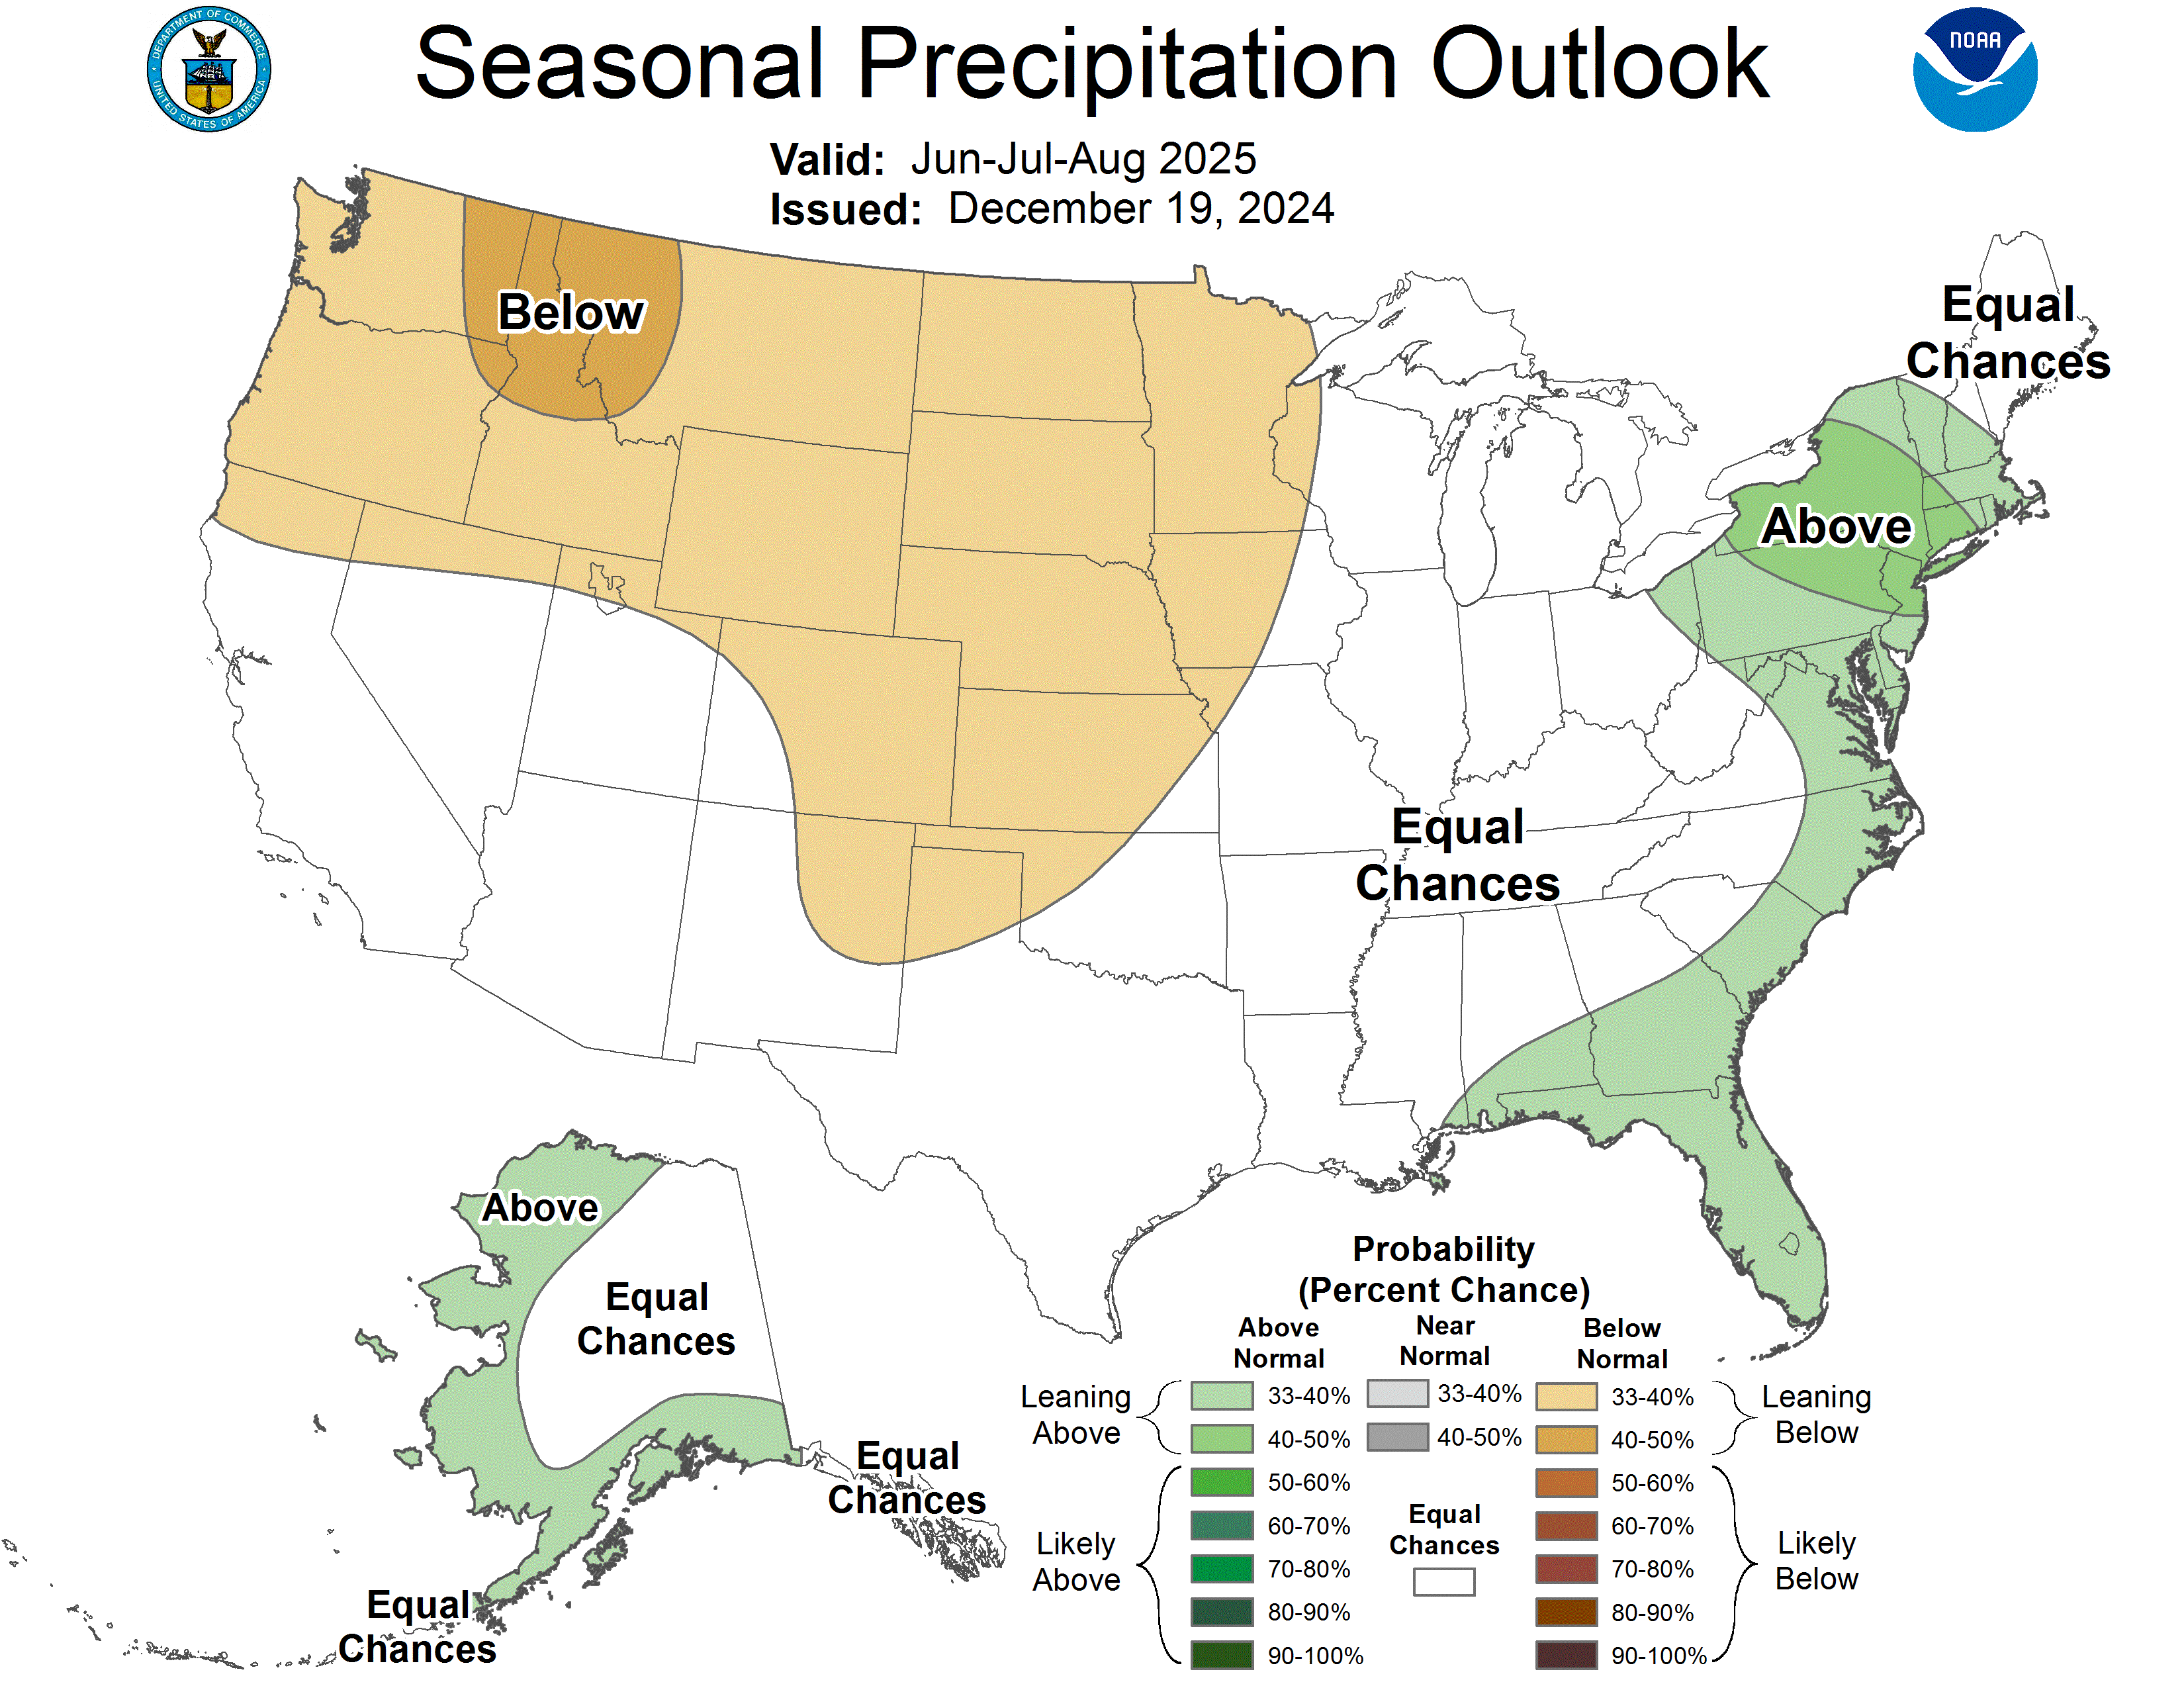 With neither a La Nina or El Nino this Summer, there are no coherent signals to key off of in the longer range forecasts. The below normal rains predicted from the Northwest across the Northern/Central Plains to the western, Upper Midwest is in the lightest shade of brown which means the slightest, enhanced chance for below average rains.
This technically means a 33-40% of below average rains and a 60-67% of either average or above average rains, combining those other 2 categories.
The 2nd, darker layer of brown means a 40-50% of below average and a 50-60% of either average or above average.
When there is a 3rd layer of brown, it means a 50-60% of below average vs the 40-50% of average/above average.
At the 7th layer of brown, we have 90-100% chance of below and only 0-10% chance of average/above average.
++++++++++++
Regardless of all that, we have no idea what the weather this Summer will bring, other than the Southwest having increased odds of more heat, mostly from recent trends.
The increase in CO2 is most effective at warming the coldest places and driest places because the long wave absorption bands of CO2 and H2O compete. In warm/humid places, the absorption bands are almost already saturated from the H2O. In cold/dry places, they are NOT saturated and as a result, CO2 can absorb more long wave radiation in the coldest places.
This is why the Arctic has warmed 3 times as much as the topics, even more than that in the Winter. And deserts have also warmed more than humid places. Although the increase in CO2 is actually greening up the deserts a bit because of the law of photosynthesis.