Every Friday I run a python script that helps spot big changes in COT numbers. These are Large Speculator numbers. I can do Commercial and Small Specs, too, so let me know if you have a preference. I also look for big changes in open interest.
Last week, large speculators swapped from short to long on the Dow. And the sugar numbers are so wild that I double-checked the report. USD and natural gas are below.
symbol: Soybean Oil
previous_net_position: 7650
current_net_position: 24214
position_net_change: 16564
percent_change: 217%
symbol: Sugar
previous_net_position: -507
current_net_position: -51666
position_net_change: -51159
percent_change: -10,091%
symbol: DJIA_Consolidated
previous_net_position: -3329
current_net_position: 3005
position_net_change: 6334
percent_change: 190%
symbol: PESO
previous_net_position: 1668
current_net_position: 3714
position_net_change: 2046
percent_change: 123%
Commercials became short on the USD as of the Jan 3 report. This is pivotal for currency trades.
This is the Commercials net USD position since October:

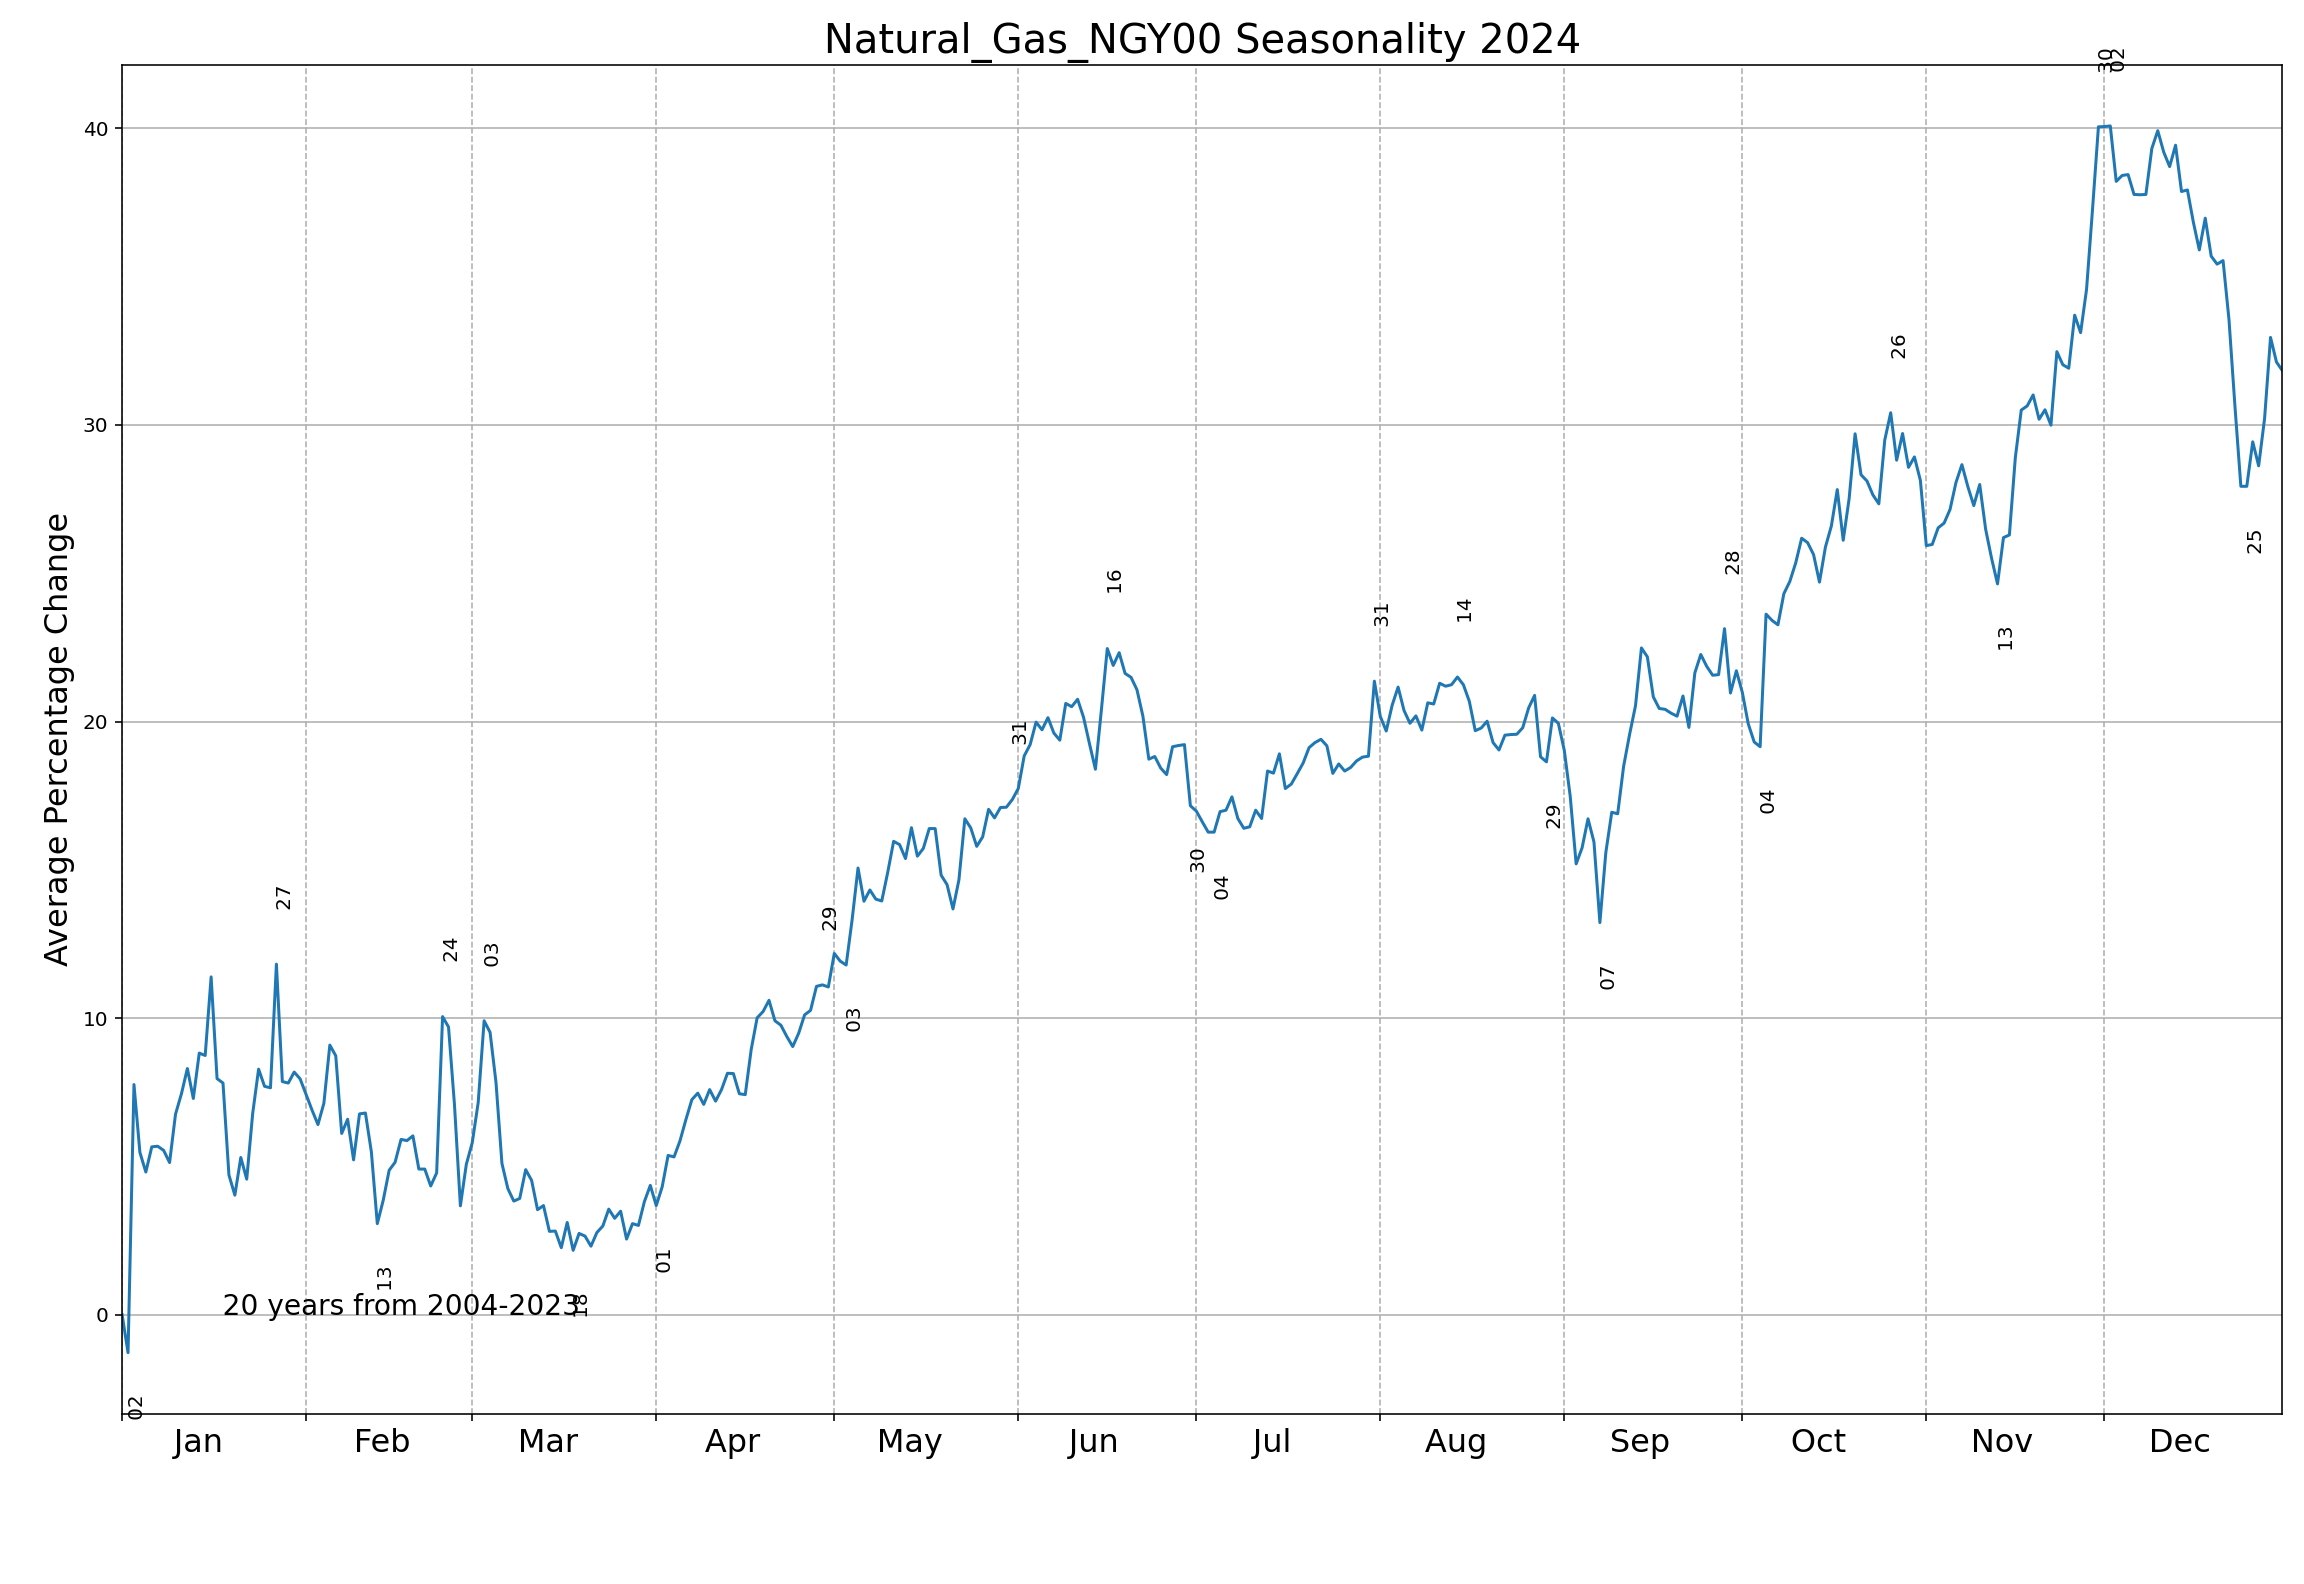
Here is natural gas since it is discussed here quite a bit:
symbol: Natural Gas
previous_net_position: -16693
current_net_position: -18563
position_net_change: -1870
percent_change: -11%
Here is a seasonal natural gas chart I created with Python. The average high and low dates are marked each month. Isn't is beautiful? It took me forever to figure out how to make these. Now I have them for everything. I wonder how much they are just curve fit. To find out, I used them to create a trading system that is being run all this year on a demo account.
For natural gas, it looks like Jan 27 - Feb 13 is typically a bearish time.
My name is Micah. I used to frequent this forum from 2001-2005. I recently started doing heavy market research with python, both on the COT and seasonals. I have some interesting charts and data to share. No one I know in real life would be interested and I want to show them to people who know what they are.
My current trades are short wheat and short USDCHF.
Thanks, altctrimm!
COT data can be useful.
Knowing seasonals can also be very useful.
1. I don't allow charging entities to advertise here. If somebody is using a great product that they pay for and wants to tell us about it, that's great.
2. However, this is what I have found. Advertisers that make most of their money selling what they claim are great products..........almost always don't turn out so great. Why is that? Because they wouldn't need to make a living selling it if they were getting rich using it themselves. I'm not saying that there are not wonderful products out there that are worth every cent. For weather traders, I've shared weather products that I pay for. NOT because they make me money trading but because the massive weather information they provide (to be used for anything) is worth MORE THAN what I pay.
Same thing with most brokers who make a living on commissions NOT using their products, systems and trade ideas but on the number of trades they get their clients to pay them commissions on. They just make their customers BROKE-ER.
3. I don't have time to try out even 1% of the different products out there to see which ones are good/great and which ones are not.
4. When I pass on information here, its most often with a link so that people can get the same information for free and use their own brains to apply it vs paying me or paying somebody else for it. I get that most people would prefer to just have somebody else analyze and interpret the data, even if they have to pay a small fee. If that's you, maybe you are providing a product worth it for some people. Even if that's true, you aren't going to use MarketForum to sell your product.
5. This FREE post of yours has value for readers to understand markets and possible use for trading. If you want to charge people for this data.............I will delete your advertisement and just tell people to go here to get the information for free:
https://www.cftc.gov/MarketReports/CommitmentsofTraders/index.htm
https://www.cftc.gov/MarketReports/CommitmentsofTraders/ReleaseSchedule/index.htm
6. It would make no sense for me to be sharing all my free information/insights about weather/trading that traders can use to make money, as a meteorologist for 4+ decades and trader for 3+ decades........ then allow an outsider to jump in and use my site to make himself money SELLING his products. If that's you, then there are many thousands just like you out there and good luck, my friend.
7. After this chess season is over in April, I could be open to selling ads to keep the small fees that I pay to keep this site active. As it stands, 2 posters volunteered to pay this the past 2 years. In 2023, Larry and cutworm paid most of the fees. In 2024, cutworm paid most of the fee (which was less than $300) to renew our contract. This is not asking anybody for any money because the only reason that I've done that in the past is to raise money for charities. They volunteered and just their act of kindness, is a motivating force that validates what MarketForum offers FOR FREE.
I don't have anything to sell.
That’s wonderful to read, Micah!
Please feel free to share your excellent information and I thank you very much!
I encourage others read it and chime in, which is what I will try to do.
Since you mentioned the sugar market, Micah. If they were shorting with such gusto thru the 21st/early last week when the last CO2 data came out, the price changes last week AFTER THAT on that entire short position was cleaning their clocks!
symbol: Sugar
previous_net_position: -507
current_net_position: -51666
position_net_change: -51159
percent_change: -10,091%
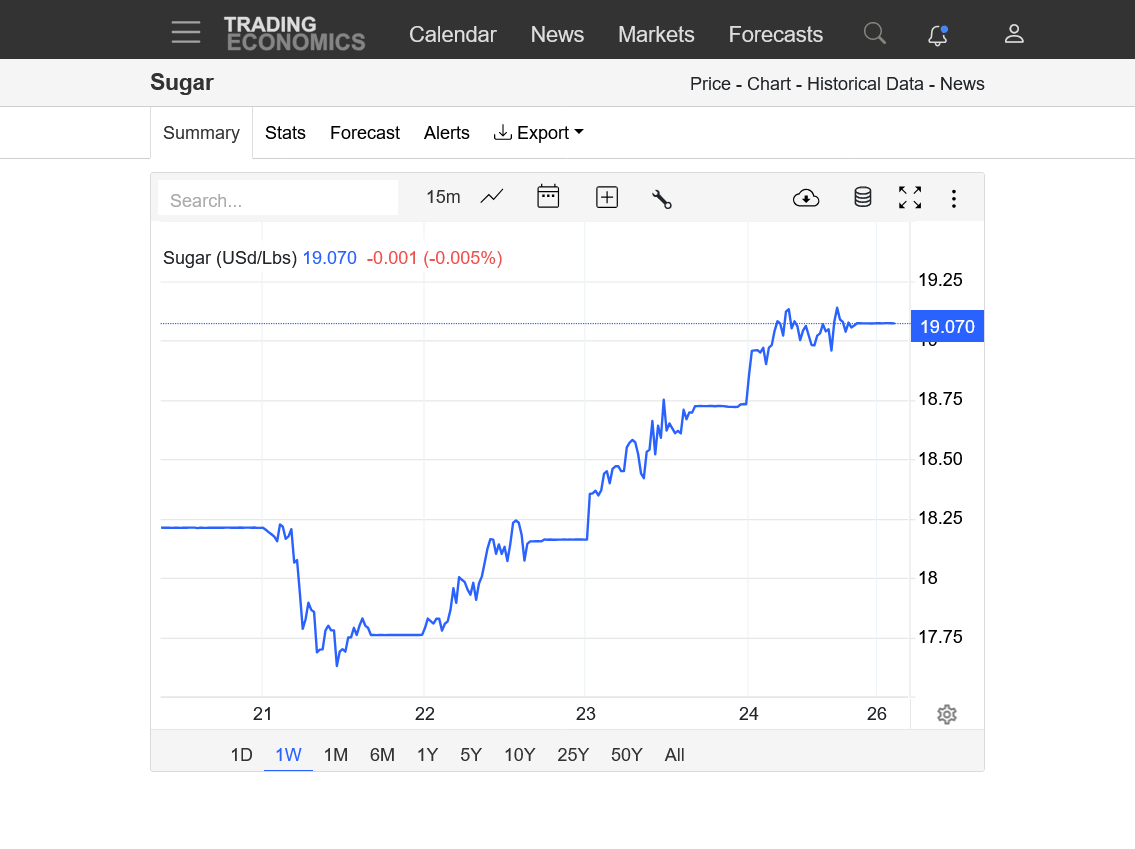
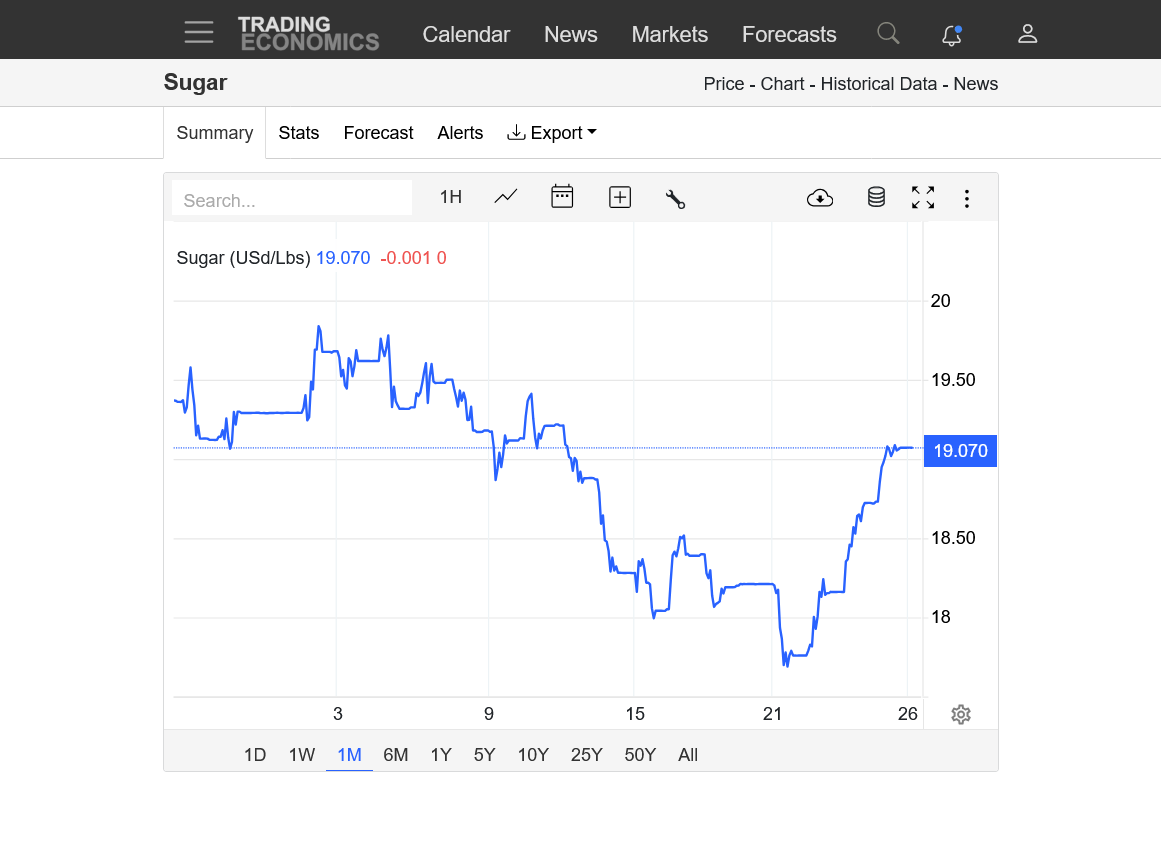
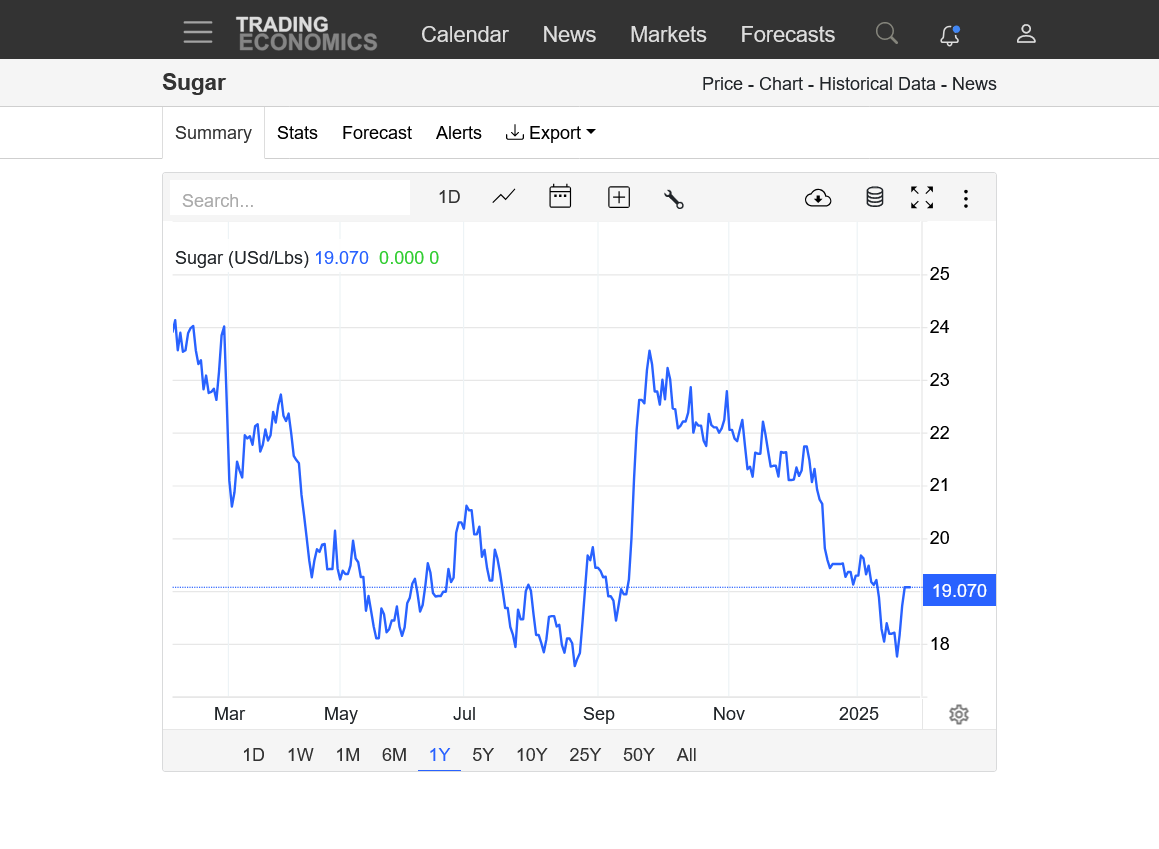
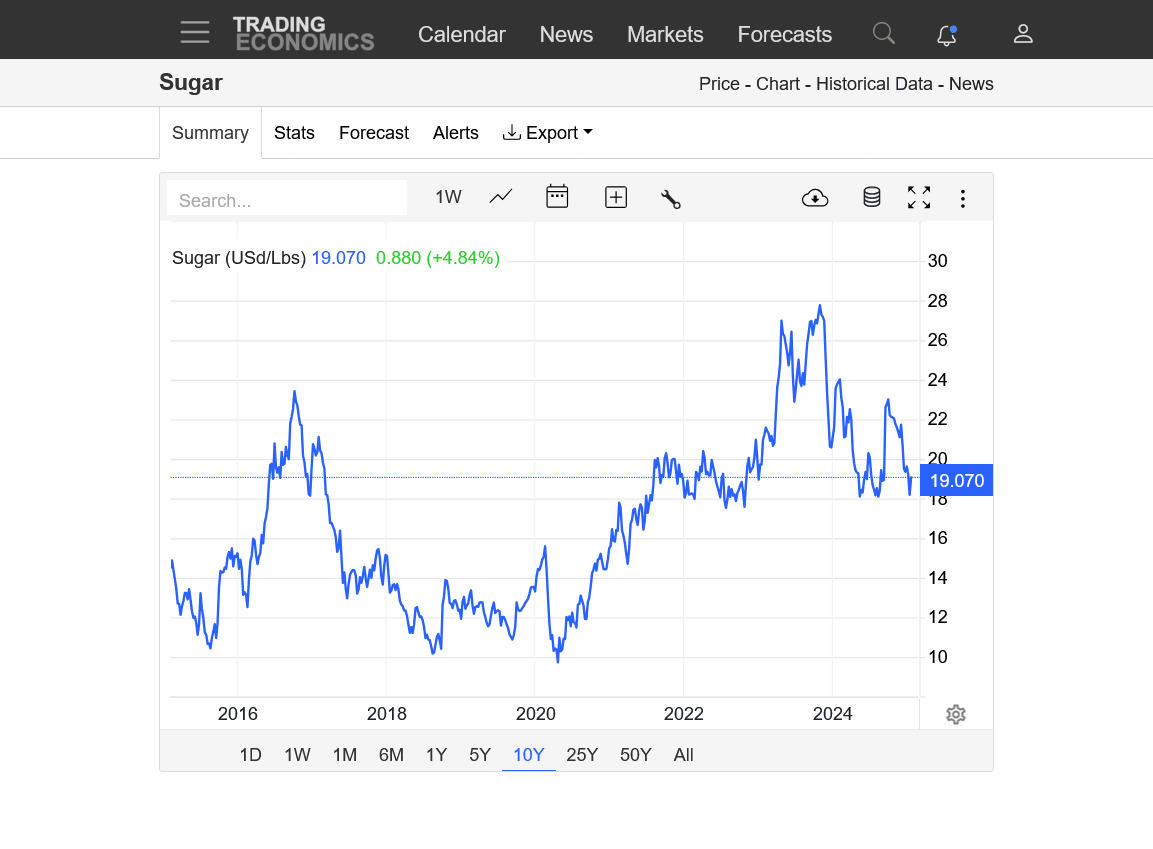
https://tradingeconomics.com/commodity/sugar
0. 1 week-straight up after Mondays low
1. 1 month-January weakness reversed up last Monday after a selling exhaustion
2. 1 year-Last weeks low was a double bottom with the low from August 2024
3. 10 years-Looks more like a triple bottom with the May, the August 2024 lows. 2022 saw several bottoms just below this. Appears to have test MAJOR support. However, we are still in a downtrend after the Oct. 30, 2023 high.
4. 100 years-Look at those incredible highs in 1974-53ish and 1980-42ish. Technically, the is an extremely long term symmetrical triangle with higher lows and lower highs. The steepening uptrend started after the 1985 low around 2c. The steepening down trend after the 1974 all time high around 53c. Too long to use for us to trade off of but at some point, those trend lines will intersect at an apex……or one of the trend lines will be violated.

Excellent work Micah. Very illuminating. Looking forward to your next report. Keep it coming