California fires
Started by metmike - Jan. 10, 2025, 11:49 a.m.
https://www.marketforum.com/forum/topic/109456/
++++++++++++++++++
“This decision was clearly made by someone with no understanding of the system or the impacts that come from knee-jerk political actions.”
Dan Vink, longtime Tulare County water manager
+++++++++++++++
Much more to come on this issue using authentic facts and data!
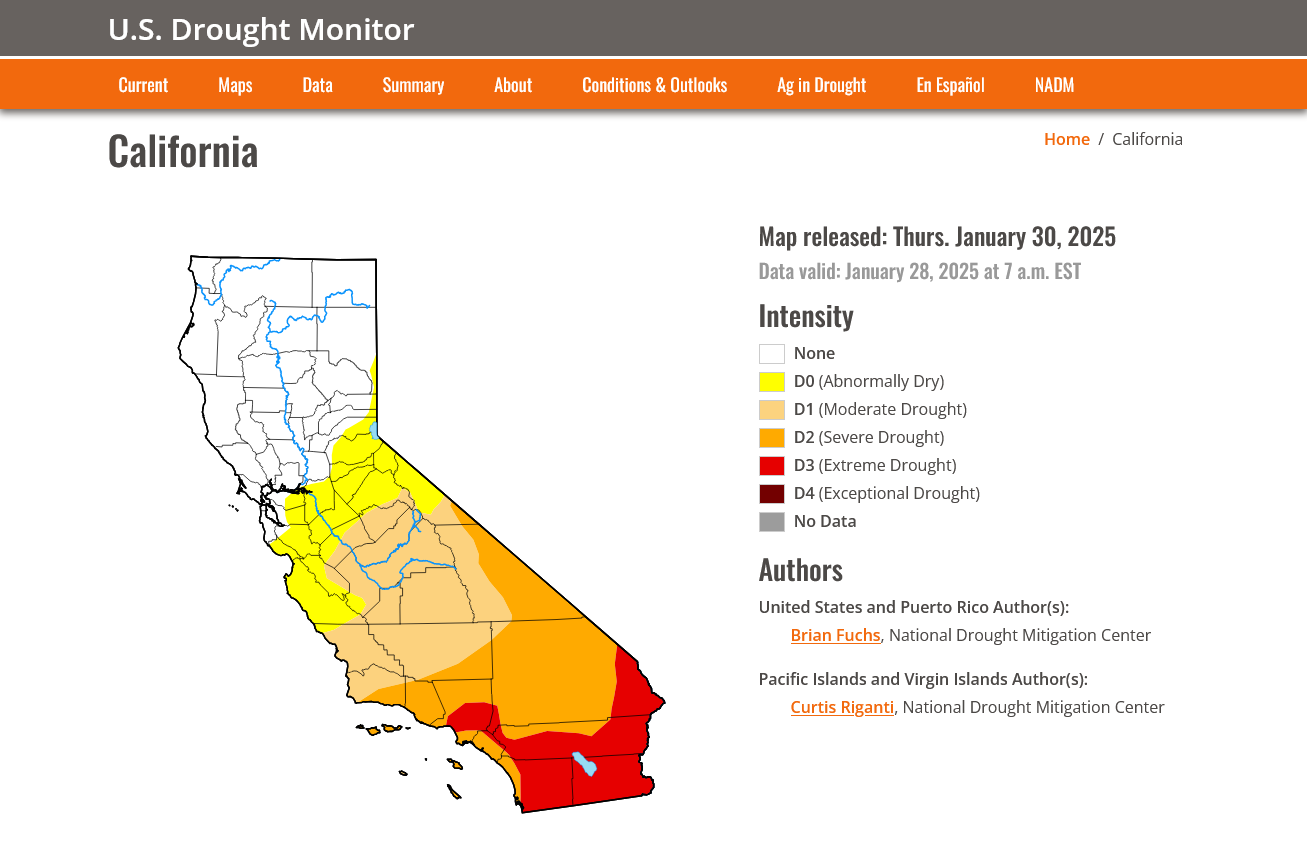
Let's look at the current relevant data from our drought page, which also looks back 5 years to show how drought rapidly develops in California from EXPECTED NATURAL VARIATIONS IN WEATHER PATTERNS, that have always happened in this part of the country. More often than not, this is a direct response to NATURAL El Nino or La Nina conditions in the tropical Pacific.
El Nino Winters frequently feature abundant, robust rainfall events.
La Nina Winters (like this one) frequently feature below average rainfall amounts and a drought that develops because of that lack of rainfall, especially after the wet season ends in the Spring.
https://www.marketforum.com/forum/topic/83844/#83853
NEW LINK:
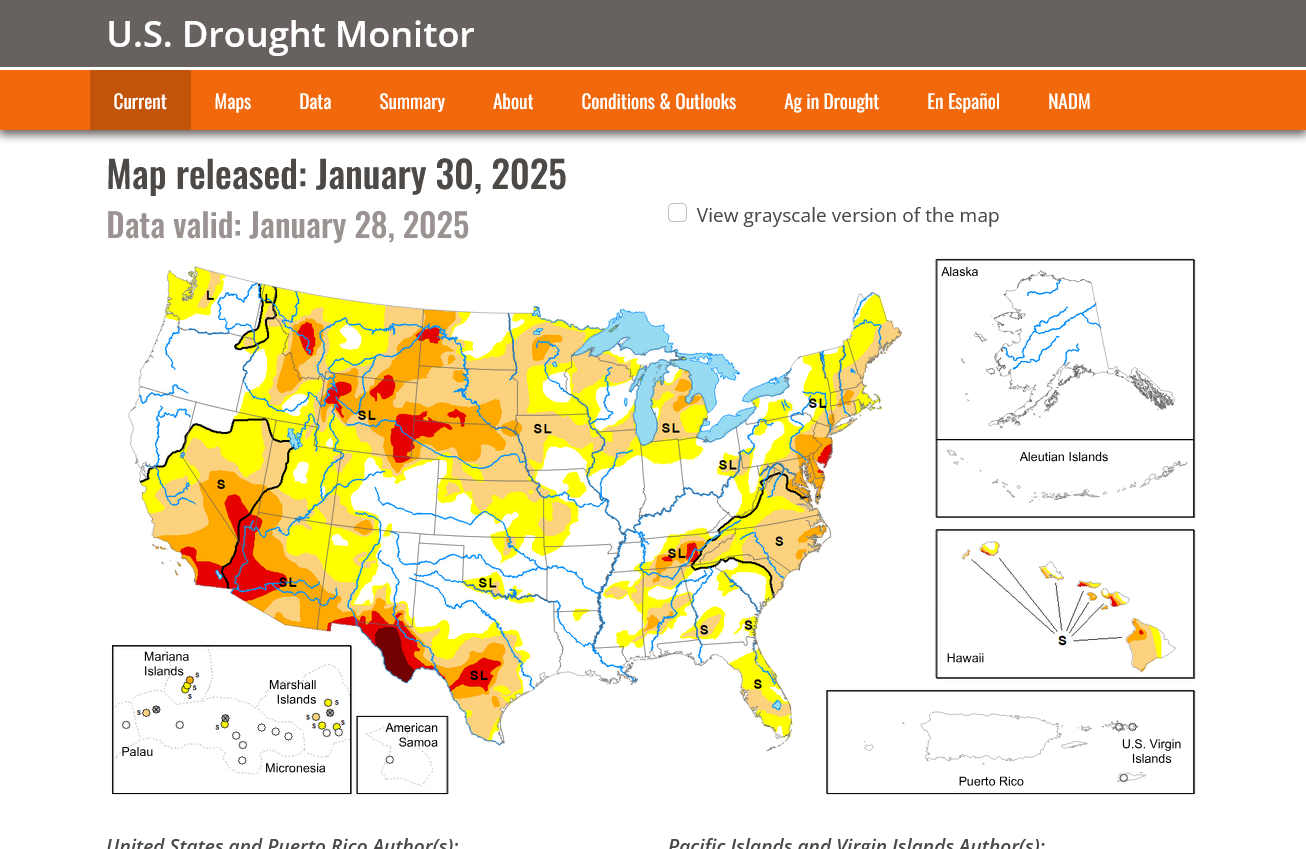
https://www.drought.gov/current-conditions
DROUGHT MONITOR
https://droughtmonitor.unl.edu/
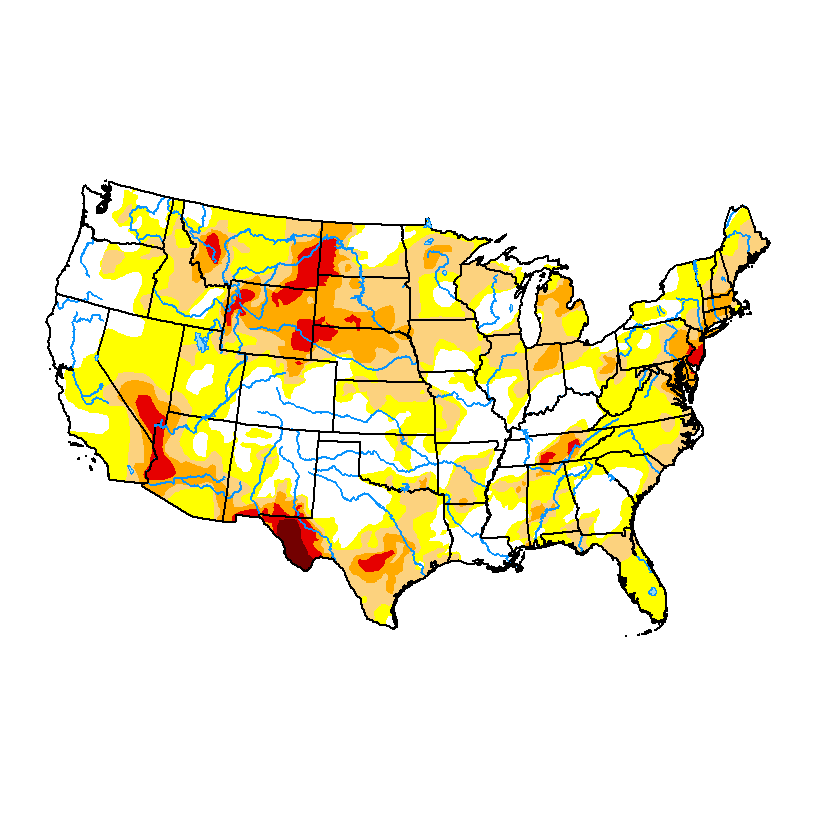
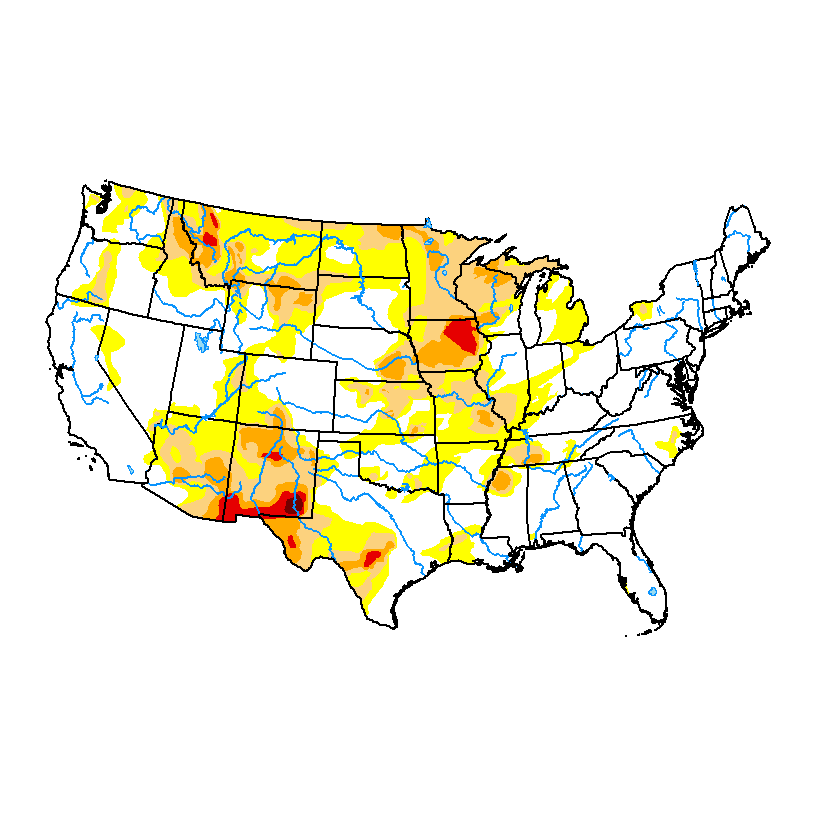
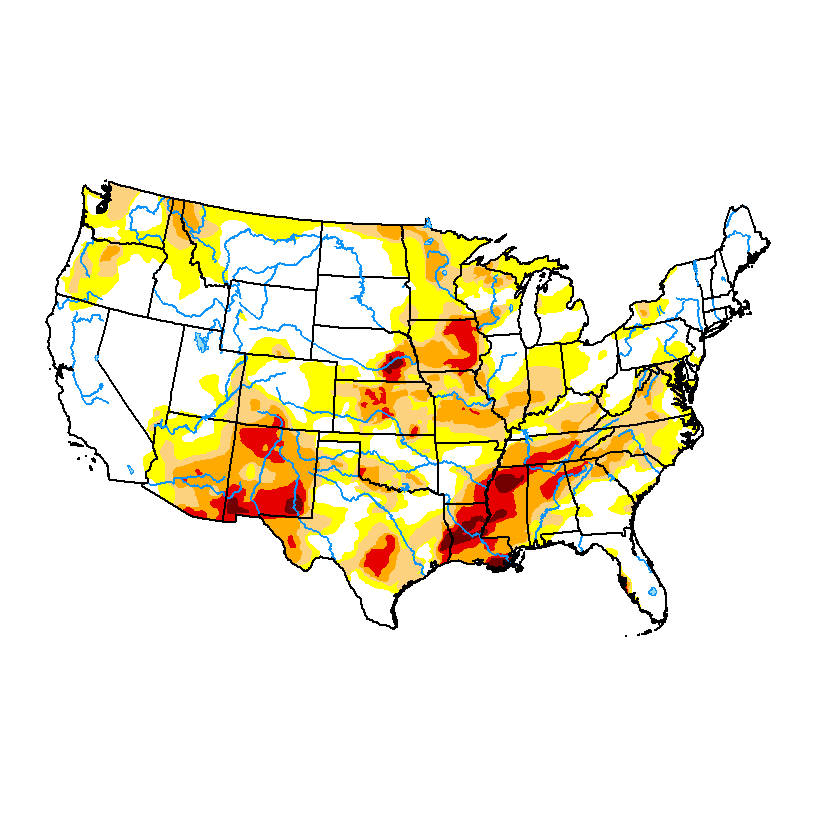
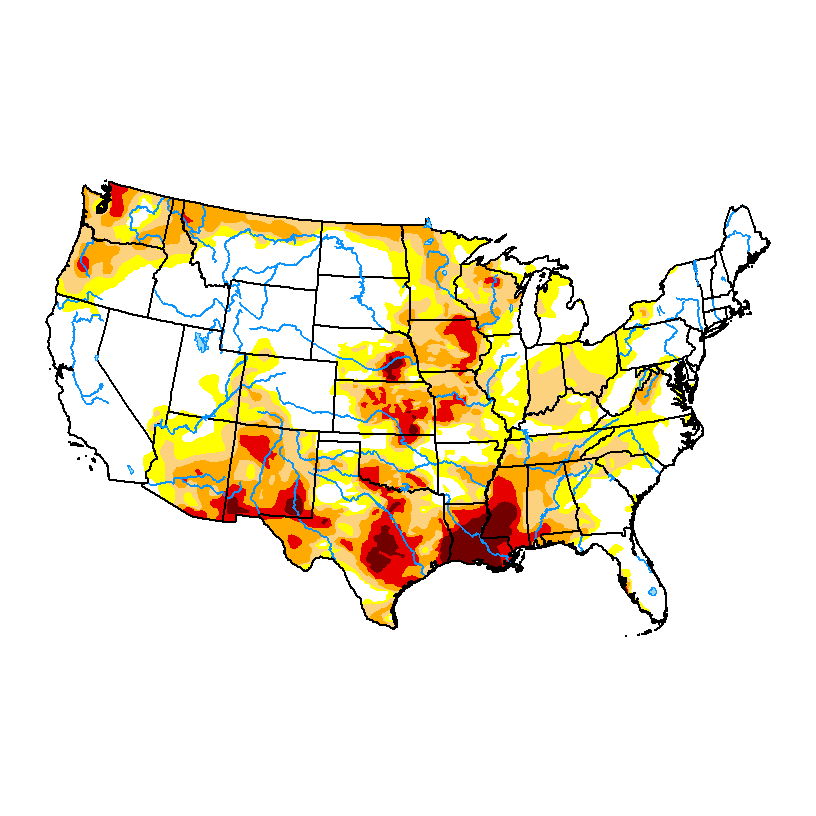
JANUARY 28, 2025 BELOW:
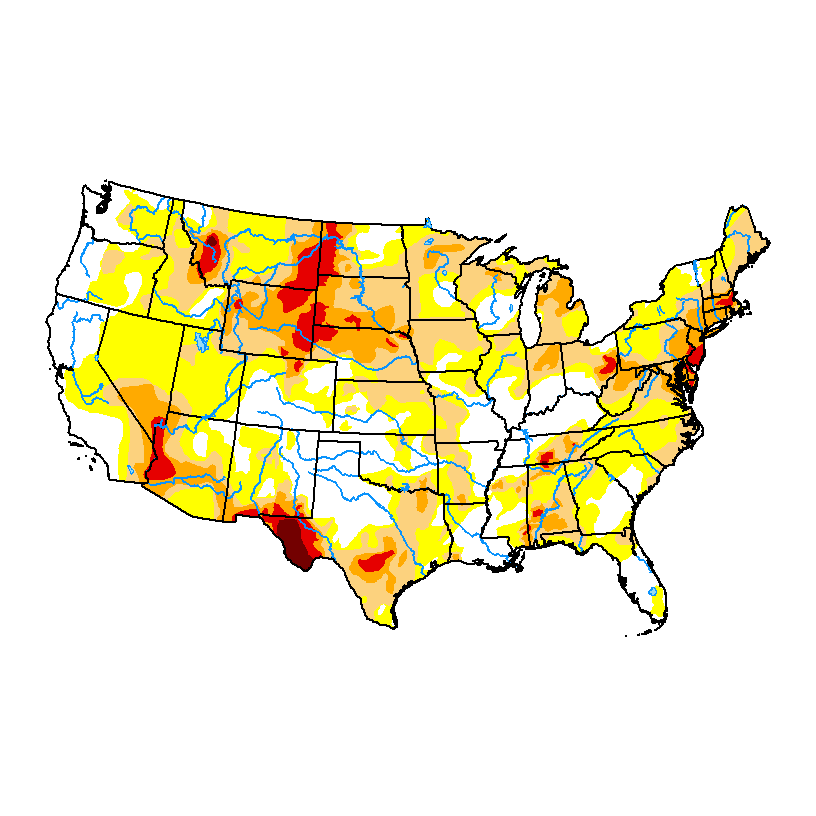
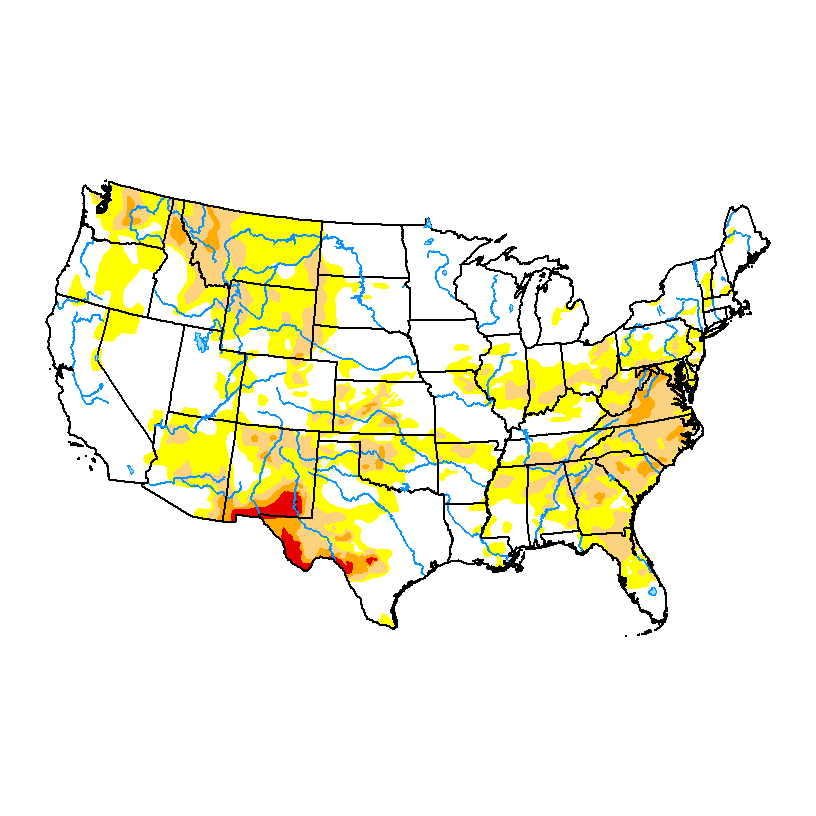
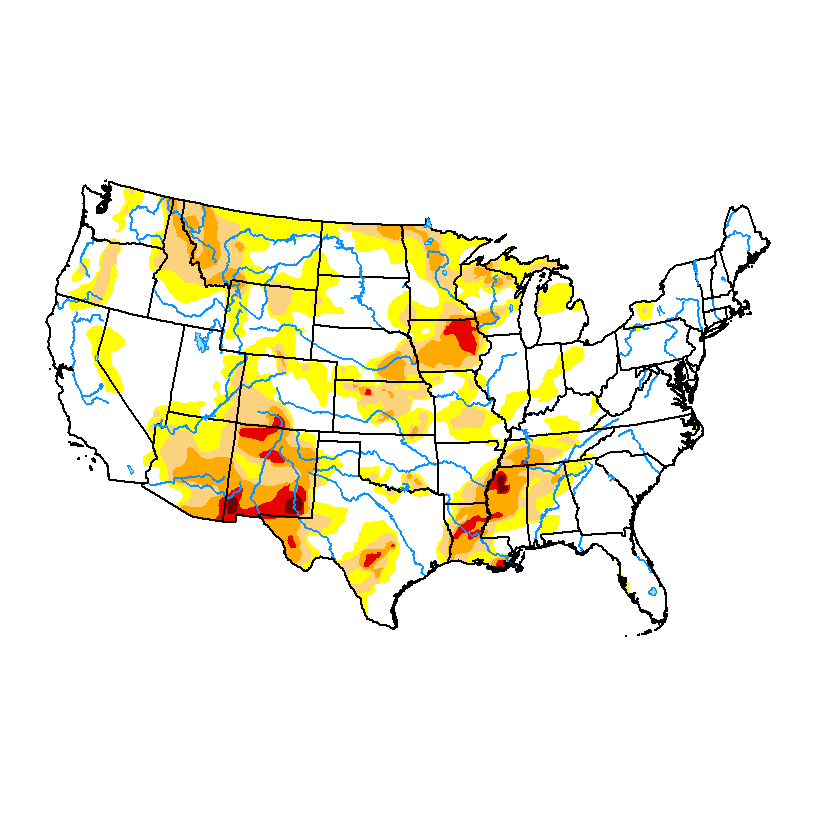
DECEMBER 17, 2024 BELOW:
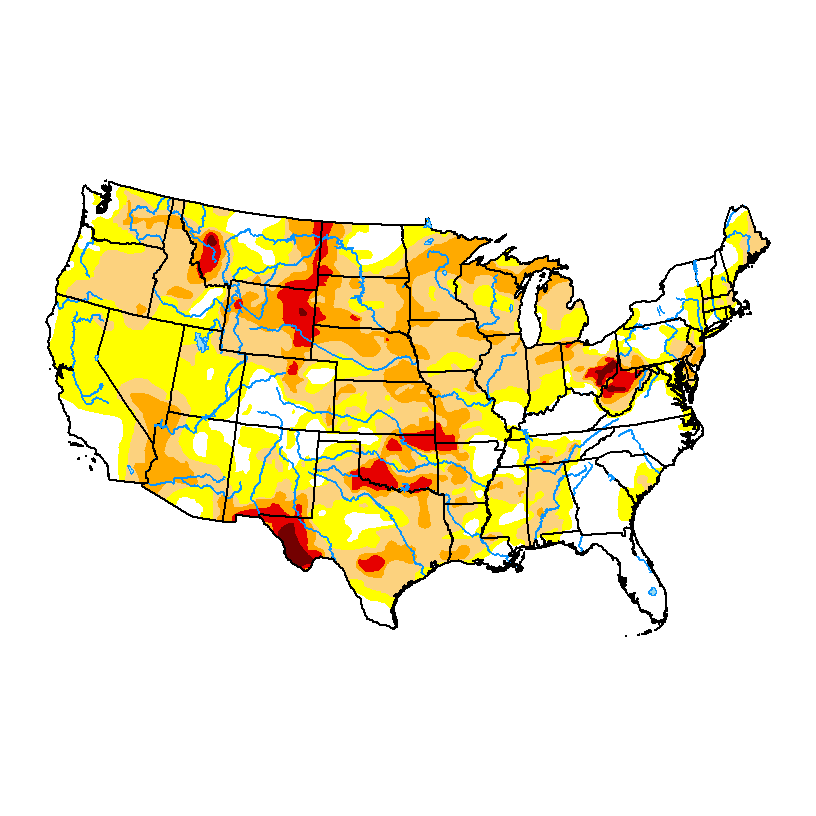
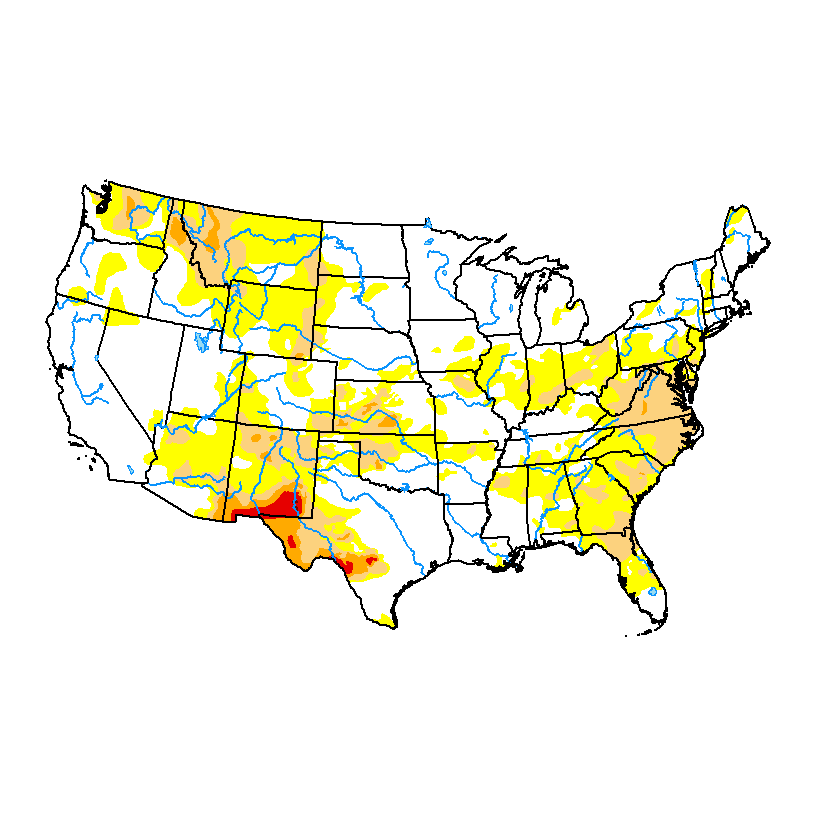
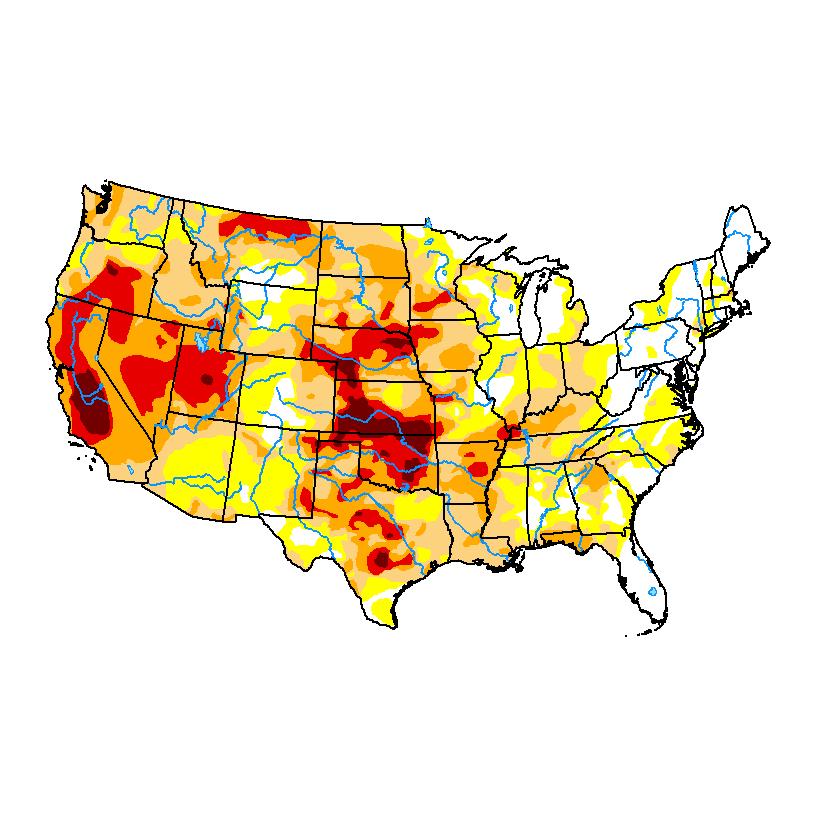
November 26, 2024 below:
Drought reduction caused the Winter Wheat crop to improve 17 points, easily a new record!
https://www.marketforum.com/forum/topic/108473/#108781
November 5 below: Drought reduction in many places from S.Plains to Western Cornbelt!

October 22 below:
Oct 8 below: Drought expanding, Plains/Upper Midwest!!!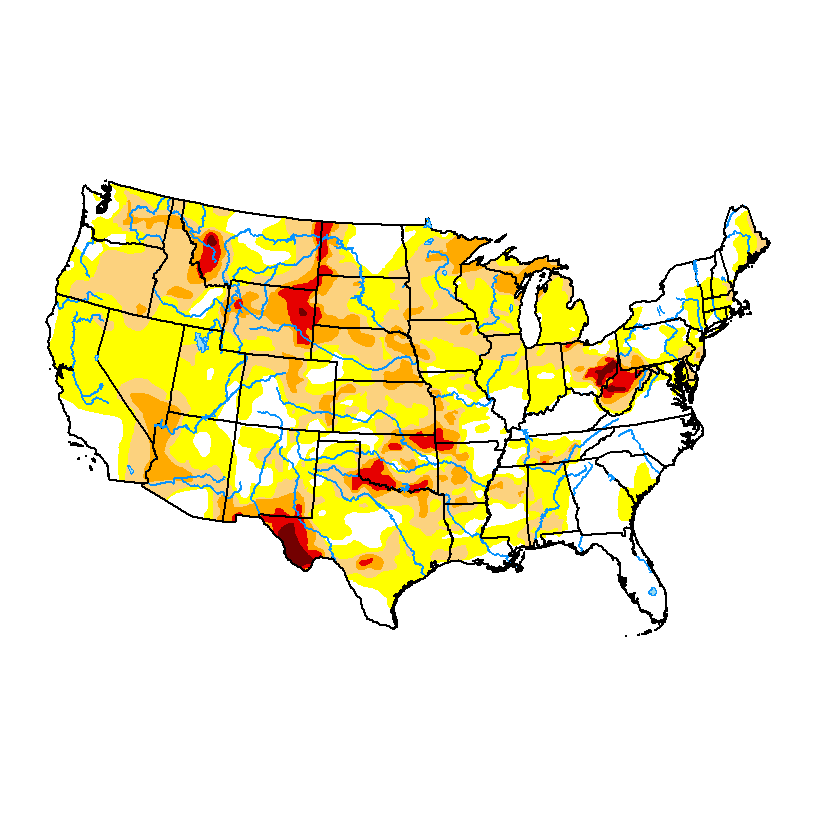 Karen Braun@kannbwx
Dryness has spread in the central USA over the last eight weeks. Some 66% of the Midwest (the most since mid-March) is now abnormally dry versus 13% in mid-July. Not sure that this has a huge impact on crop yields from here, but it is something to monitor.
Last map is from July 3, 2024
AS ON JUNE 26, 2024 below. FLASH DROUGHT! ECB and CCB. But some areas to get relief!
Last week as of June 17, 2024-FLASH DROUGHT DEVELOPING IN THE EASTERN CORNBELT BACK TO THE CENTRAL CORNBELT!!!

2 weeks earlier: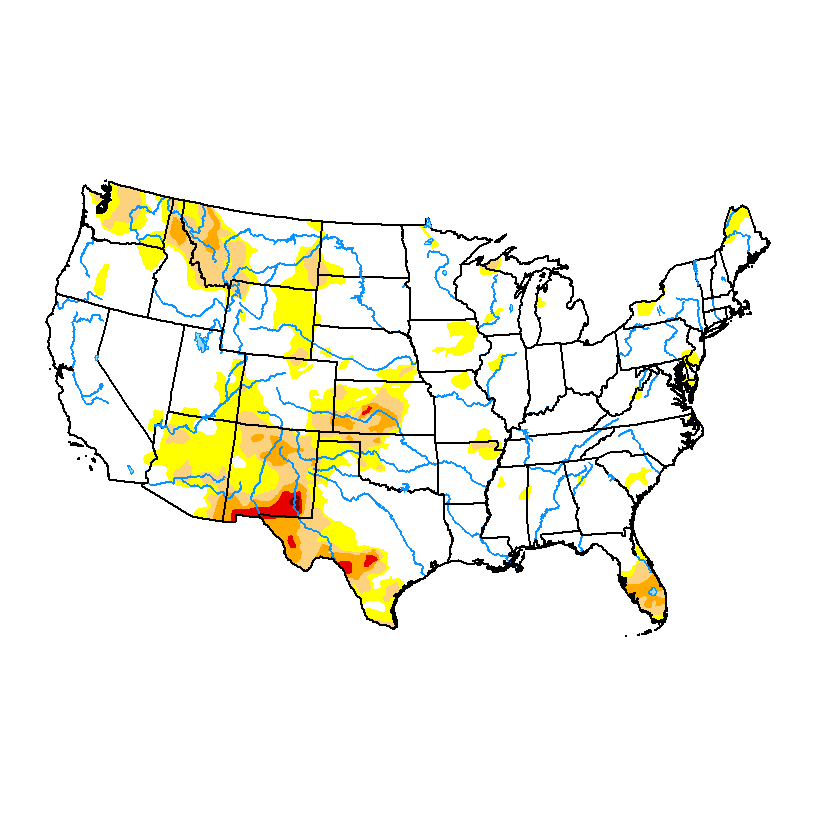
As of March 12, 2024: Drought in IA
January 30, 2024 below
DECEMBER 12, 2023 below
NOVEMBER 14, 2023
October 17, 2023
August, 2023, BELOW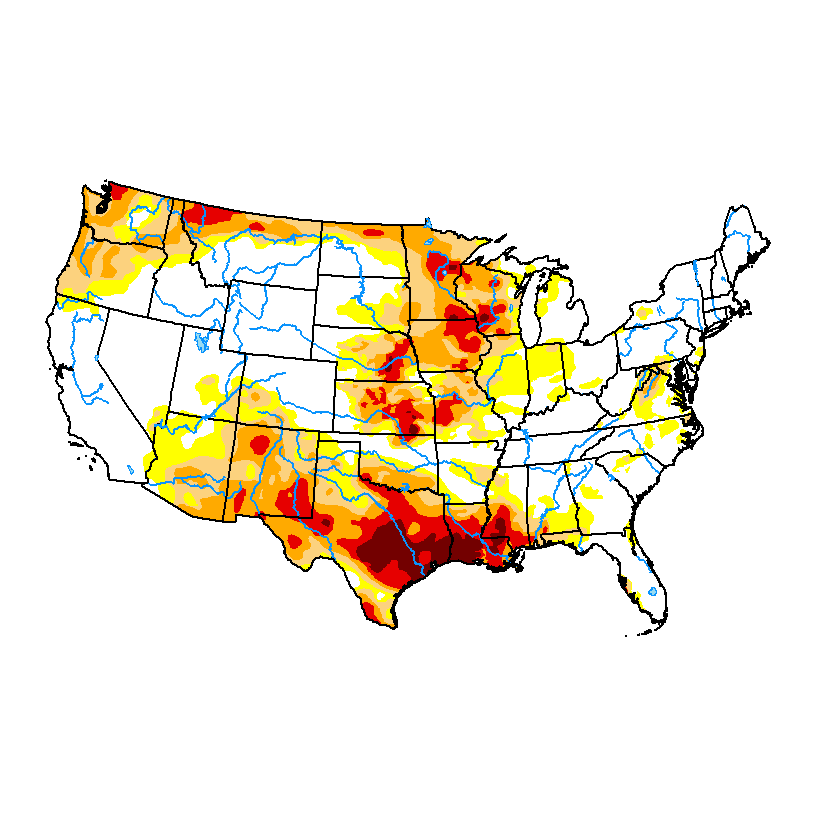
April 18, 2023-1 year ago:

DROUGHT MONITOR NOVEMBER 1, 2022-After a long lived La Nina-BEFORE EL NINO wiped out much of the drought OUT WEST the Winter of 2022/23!
Drought monitor previous years: You can see the natural La Niña, (cold water-in the tropical Pacific)causing the drought! Starting in 2020, then worsening for 2+ years!
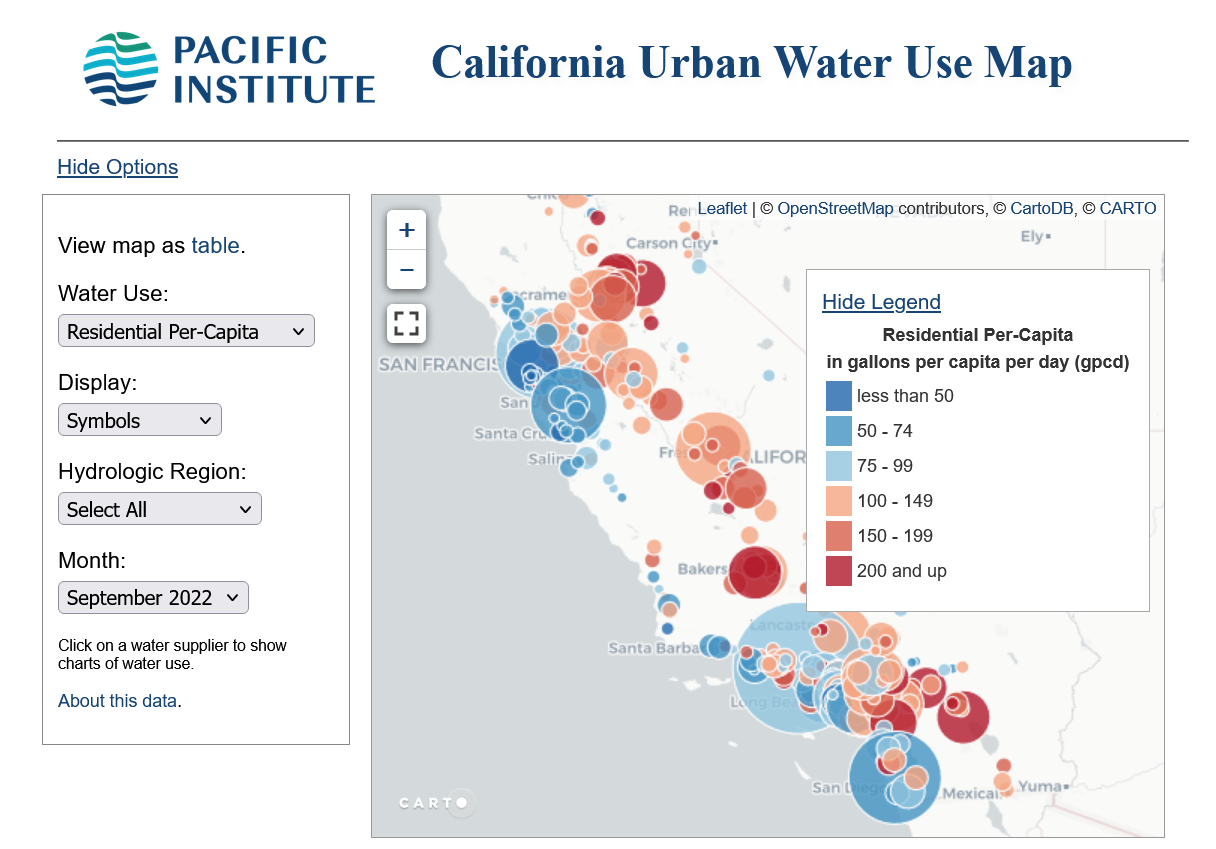
Clearly, Southern California has been dry from the natural variation of weather and La Nina!

https://www.californiadrought.org/drought/current-conditions/
 ++++++++++++++++++++++++++

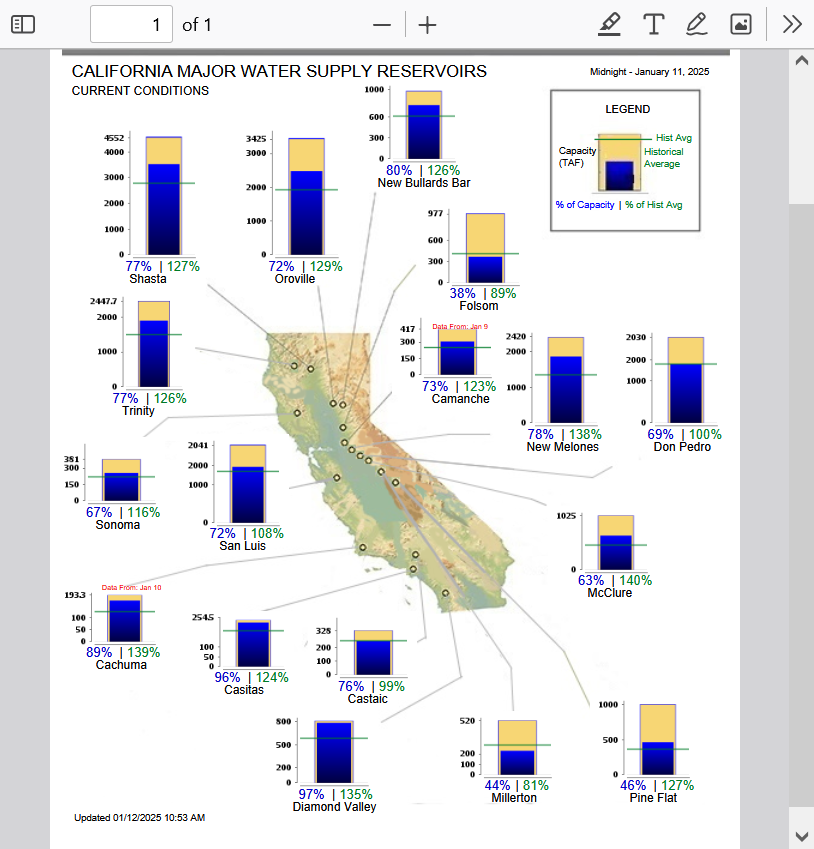
https://water.ca.gov/Current-Conditions
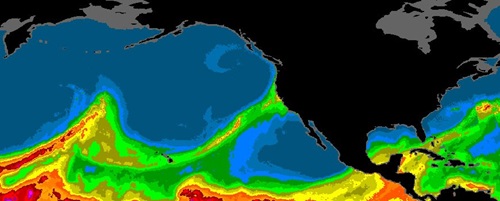
Satellite image of an atmospheric river bringing rain to California and other regions of the United States West Coast. Image courtesy of the Scripps Institution of Oceanography at UC San Diego
+++++++++++++++++++++
https://www.noaa.gov/jetstream/upper-air-charts/constant-pressure-charts-300-mb
++++++++++++++++++++++++
ASSESSING ATMOSPHERIC PRESSURES
AND HEIGHTS
http://www.theweatherprediction.com/habyhints/77/
++++++++++++++++++++++
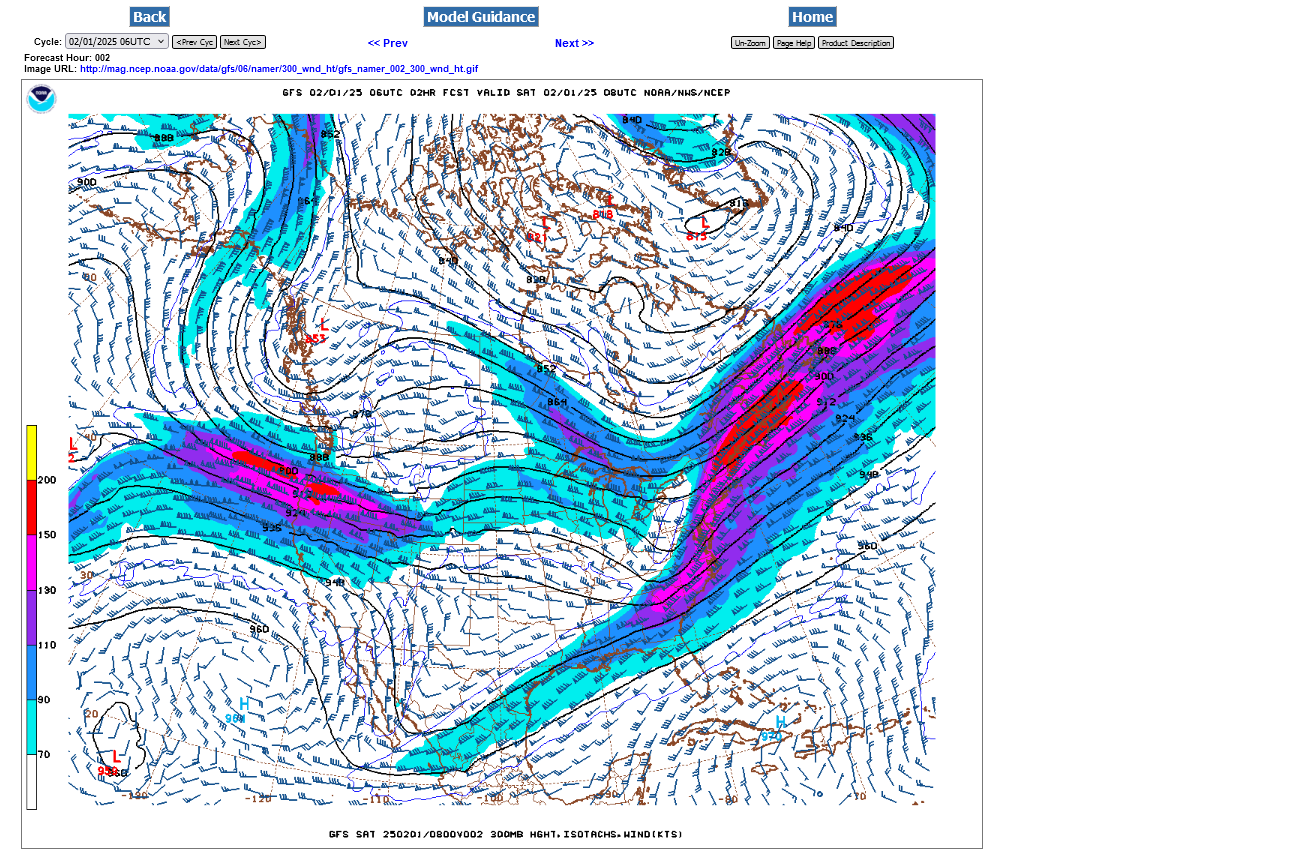
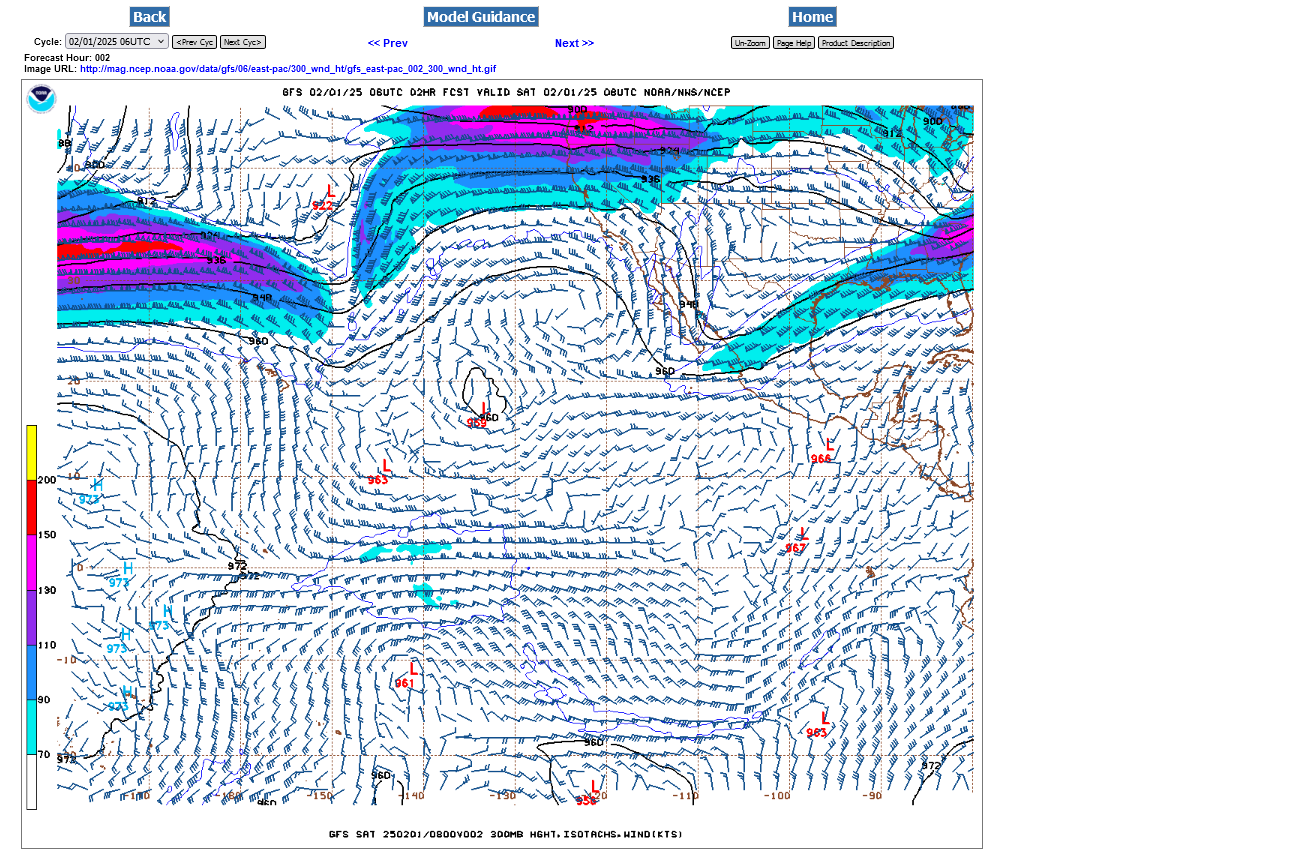
Current jet stream at 300 mb:
The red shade below is 150+ knots which is close to a 200 mph jet streak in the center of the jet stream!!
US
Current weather for California:

This link below provides some great data. After going to the link, hit "Mesoanalysis" then, the center of any box for the area that you want, then go to observation on the far left, then surface observations to get constantly updated surface observations or hit another of the dozens of choices.
 Found a great new link/site that shows us how much precip fell(from 1 hr to 72 hours) for different periods to share with you. https://www.iweathernet.com/total-rainfall-map-24-hours-to-72-hours Data Update Cycle: The 1-hr mosaic is updated every 5 min (approx). All other mosaics are now updated hourly, including the 48h and 72h maps. The site does not allow me to copy the actual images/data here, as we do with all the other links above..........so just go to the link! |
Forecasts(this matters a great deal, with regards to the timing of this water dump-you would NEVER dump it during a heavy rain event, for instance):
The latest 7 day precip forecasts are below.
They are all updated constantly.
However, the top image is a frozen frame of the 7 day precipitation forecast, early on Feb 1, 2025. Hefty amounts coming for the northern half of California this coming week!!!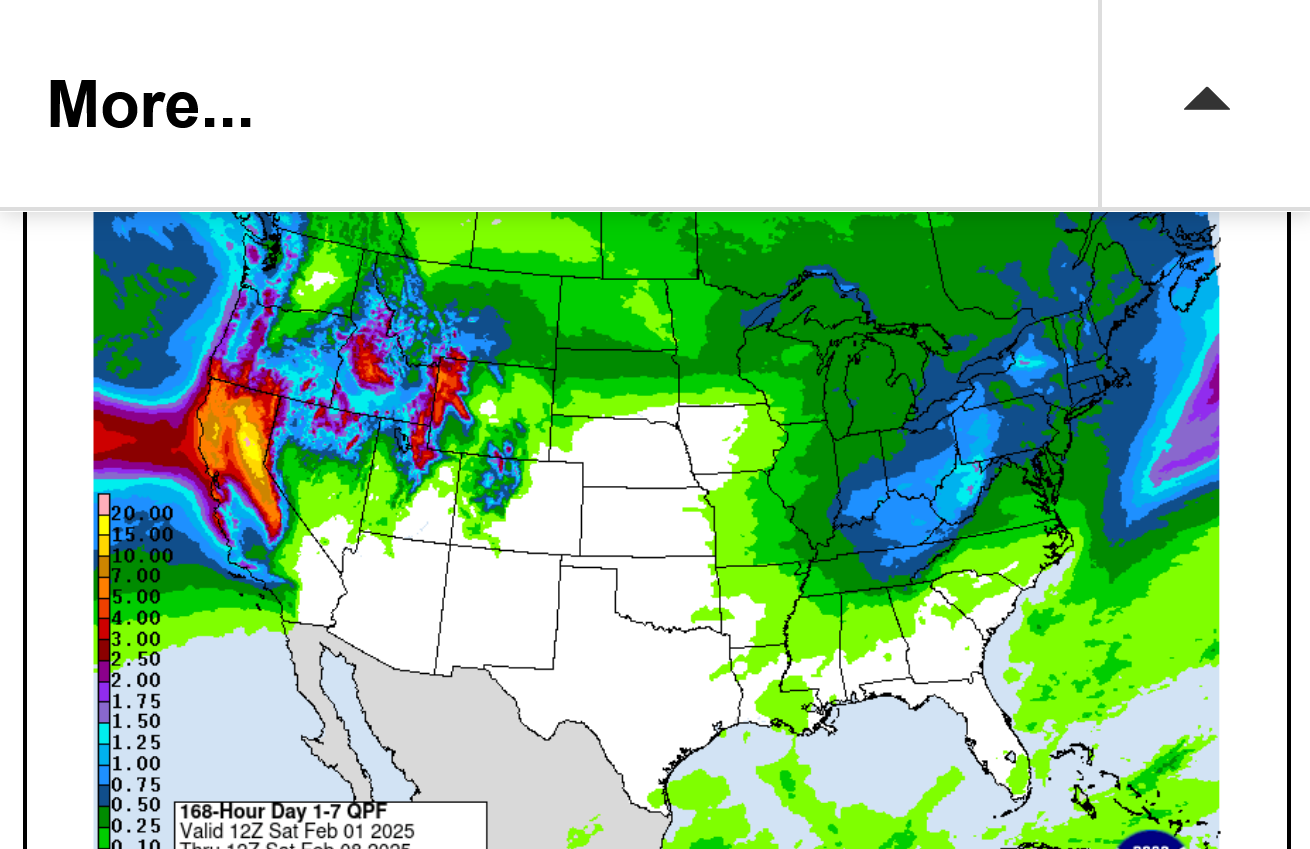
https://www.marketforum.com/forum/topic/83844/#83848
Day 1 below:
http://www.wpc.ncep.noaa.gov/qpf/fill_94qwbg.gif?1526306199054

Day 2 below:
http://www.wpc.ncep.noaa.gov/qpf/fill_98qwbg.gif?1528293750112

Day 3 below:
http://www.wpc.ncep.noaa.gov/qpf/fill_99qwbg.gif?1528293842764

Days 4-5 below:
http://www.wpc.ncep.noaa.gov/qpf/95ep48iwbg_fill.gif?1526306162

Days 6-7 below:
http://www.wpc.ncep.noaa.gov/qpf/97ep48iwbg_fill.gif?1526306162

7 Day Total precipitation below:
http://www.wpc.ncep.noaa.govcdx /qpf/p168i.gif?1530796126

Winter Weather Forecasts
https://www.wpc.ncep.noaa.gov/wwd/winter_wx.shtml
Re: Re: Re: Re: Weather May 2022
By metmike - April 30, 2022, 8:34 p.m.
Excessive rain threat.
https://www.wpc.ncep.noaa.gov/qpf/excess_rain.shtml
Current Day 1 Forecast
Day 1 Threat Area in Text Format
Current Day 2 Forecast |
Day 3 outlook

| Excessive Rainfall Outlook Day 4 Static Image |
|---|
 |
| Excessive Rainfall Outlook Day 5 Static Image |
|---|
 |

