
More to come when back home. This pattern will feature the far southward displaced polar vortex and more frigid air intrusions into the US.
However, in mid February Arctic blasts isually don’t start out as cold in the source region and they moderate a great deal headed south.
That is compared to a month ago.
This guy is really sharp and gives hall of fame tutorials!
Previous threads discussing this:
Major Sudden Strat. Warming: chance increasing in early Jan
Started by WxFollower - Dec. 20, 2023, 9:19 p.m.
https://www.marketforum.com/forum/topic/101402/
++++++++++++++++
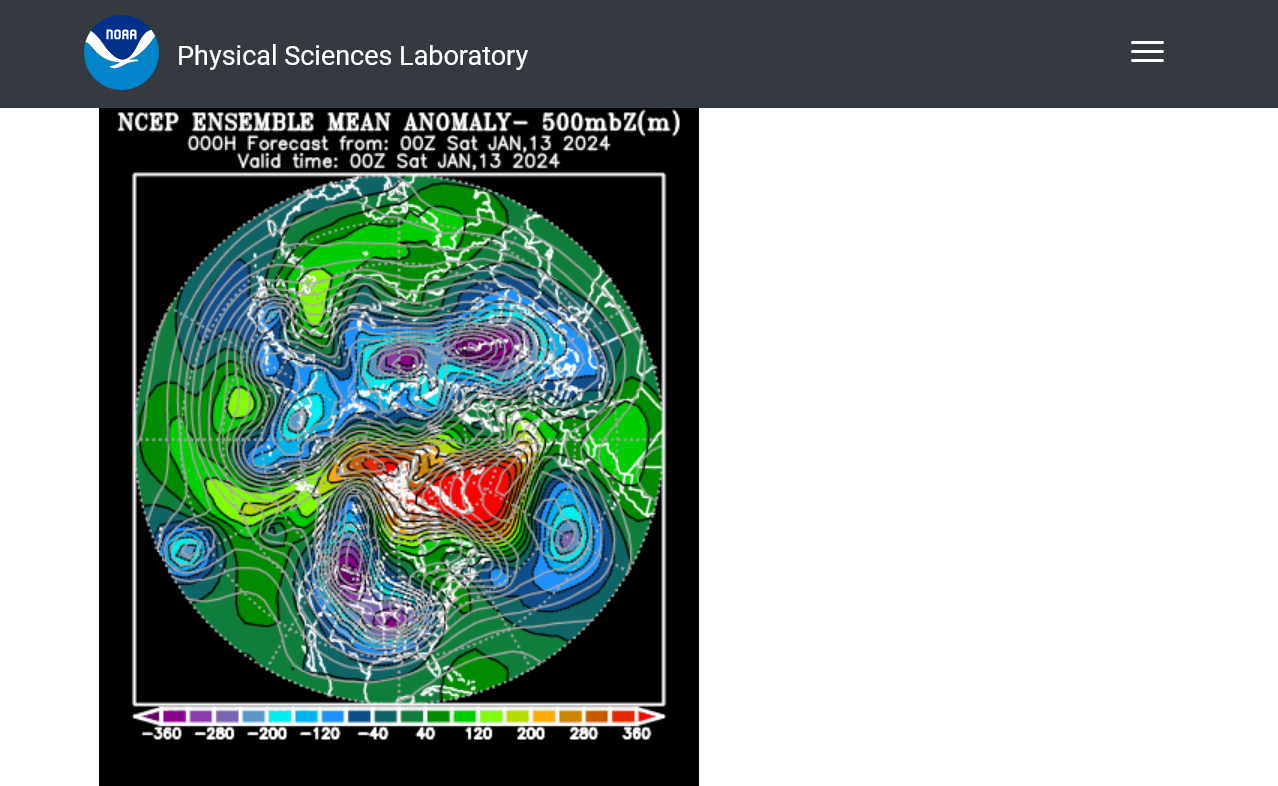
This is what the event above looked like at 500mb on January 13, 2024!
Re: Major Sudden Strat. Warming: chance increasing in early Jan
By metmike - Jan. 17, 2024, 10:30 p.m.
"Below: we should note the couplet this last time in its EXTREME mature stage at 500 mb early this last weekend. With the Polar Vortex waaaay far south and extreme positive anomaly in Canada to Greenland(where the polar vortex usually is).
In Late December, we had no idea that it would look this extreme 2+ weeks later.
So in early a February, when this next event matures, it could look much different than the map above.
Last weekend map below."
++++++++++++++++
2-3-25: Current forecast for 15 days from now(2-18-25). Being this far out, the forecast will change DRASTICALLY as we get closer!!!
https://www.marketforum.com/forum/topic/83844/#83856

This is the current AO. The ensemble average is -2 standard deviations below average but the range is nuts. Several members are close to the bottom of the graph, around -5 standard deviations, a couple of outliers at +4 and the majority 0 and -3 standard deviations from average.

+++++++++++++
http://appinsys.com/globalwarming/ao_nao.htm
AO BELOW
+++++++++
This was the last NWS 8-14 day forecast made 2-3-25:
Get the latest update here:
https://www.marketforum.com/forum/topic/83844/#83852

https://charts.ecmwf.int/products/extended-zonal-mean-zonal-wind?area=nh&base_time=202502030000

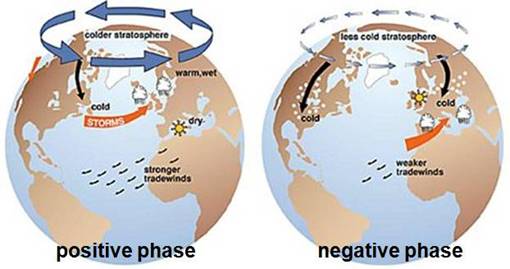
The lower these winds are, the more disrupted the stratospheric polar vortex gets from its high latitude, normal location. Ideally, we would want to see them close to 0 or even negative(going in the opposite of their normal west to east direction. The mean above in dark blue is not all that impressive with this event in mid February.
A large number of individual solutions (skinny blue lines) fro this model show potential for a major disruption in March.!
10 hPa in the stratosphere, is around 100,000 feet above the ground which is where the graph below measures the normally, zonal west to east winds.
https://www.sensorsone.com/altitude-pressure-units-conversion/
The models have become very bullish for a late March SSW
https://charts.ecmwf.int/products/extended-zonal-mean-zonal-wind?area=nh&base_time=202502120000

The current, very southward displaced polar vortex in the troposphere, is NOT associated with a SSW (stratosphere-above ). Is this a bit odd. In fact, the stratospheric winds are above average and headed to extremely strong later this month, the complete opposite of what happens with an SSW event.
What's your take Larry?
++++++++++++
By metmike - Feb. 16, 2025, 6:44 p.m.
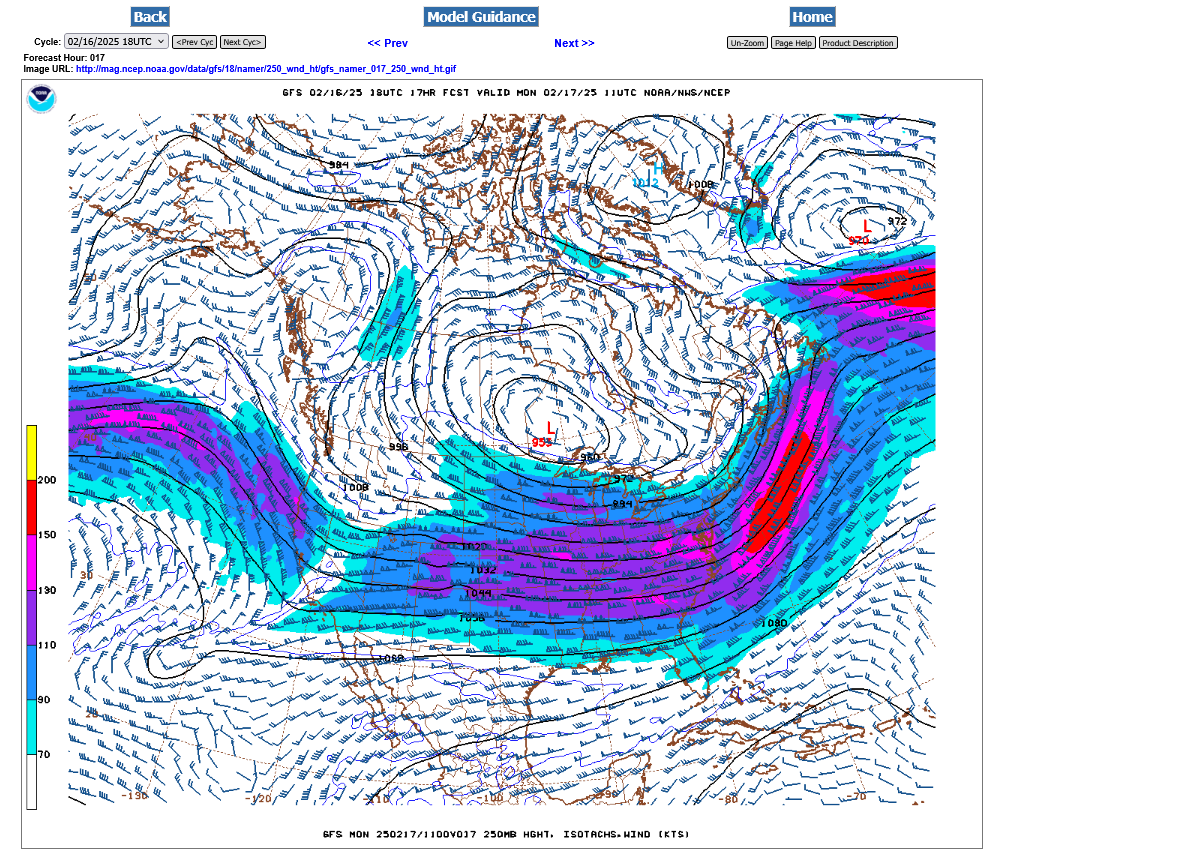
What we're looking at here is a huge piece of the polar vortex, displaced unusually far south IN THE TROPOSPERE.
This is the 250 mb map, which is over 30,000 feet up. This is almost at the level that commercial jets fly at!
Note the very strong jet stream coming out of the Pacific at the same time.
Red = 150 knots+ which is almost 200 mph that Mike the US Coast Guard guy knows about from using knots to navigate the seas.
The northern/Arctic stream is phasing with the Pacific stream and creating the intense lift in the Northeast which is responsible for the deep low pressure system on the previous page.
The 500 mb map (around 17,000 feet) below shows the anomalies:
The polar vortex has split into 3 pieces here, seen with the negative/blue anomalies(not the one in the Pacific) and displaced unusually far south into the middle latitudes.
The extreme positive anomalies, extend from Siberia to Central and Eastern Canada. This is where the Polar Vortex normally resides in Winter.
Hey Mike,
I don’t know why. A lobe of the TPV has had big south shifts several times this winter while the SPV was near record strong levels!
Thanks, Larry!
I know you follow the stratospheric warming events even closer than me.
Obviously, the stratosphere and troposphere are DE-coupled here.
Models still have an impressive SSW event coming up in March. Could be part of the continued bullishness of natural gas, as well as the huge warm up next week looking to be temporary.
mg trading has become crazy.
Delayed to late March/early April...but the winds seasonally plunge lower then anyways!
https://charts.ecmwf.int/products/extended-zonal-mean-zonal-wind?area=nh&base_time=202502230000

Well, we're getting the huge wind reversal in the stratosphere as predicted.
https://charts.ecmwf.int/products/extended-zonal-mean-zonal-wind?area=nh&base_time=202503090000

What's that meant in the troposphere, where our weather is?
Not that much. Maybe there is minimal coupling between the stratosphere and troposphere right now?
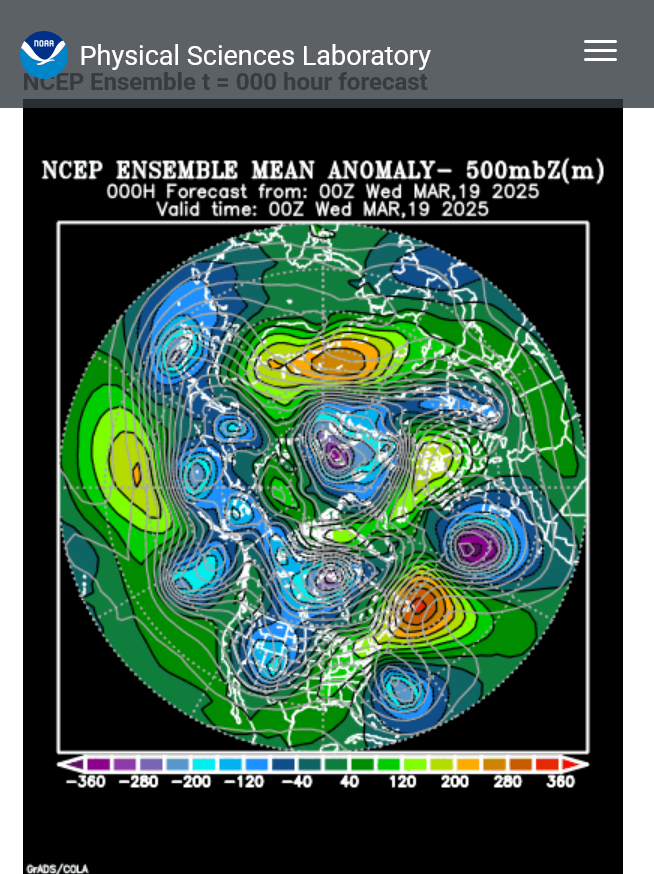
https://www.psl.noaa.gov/map/images/ens/ensmean_nh_alltimes.html
https://www.psl.noaa.gov/map/images/ens/m500z_f072_nhbg.gif

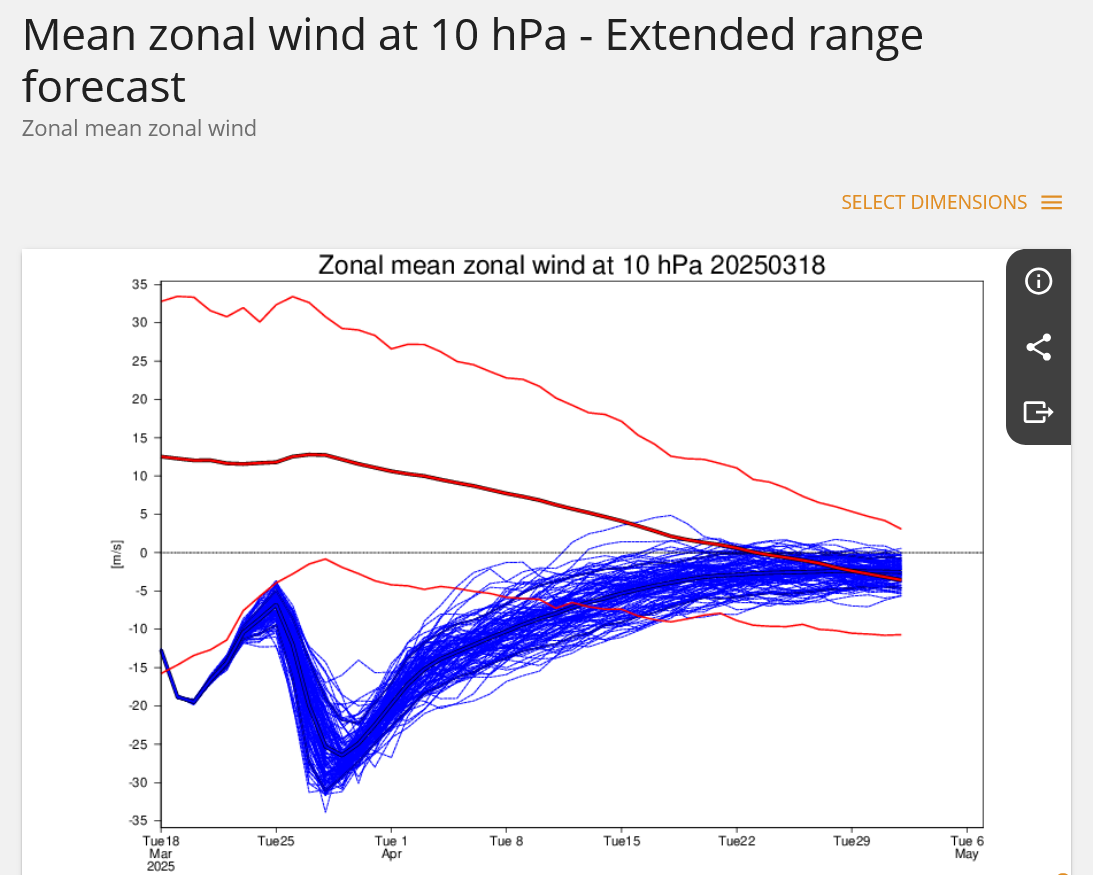
https://charts.ecmwf.int/products/extended-zonal-mean-zonal-wind?area=nh&base_time=202503180000
++++++++++++++++++++
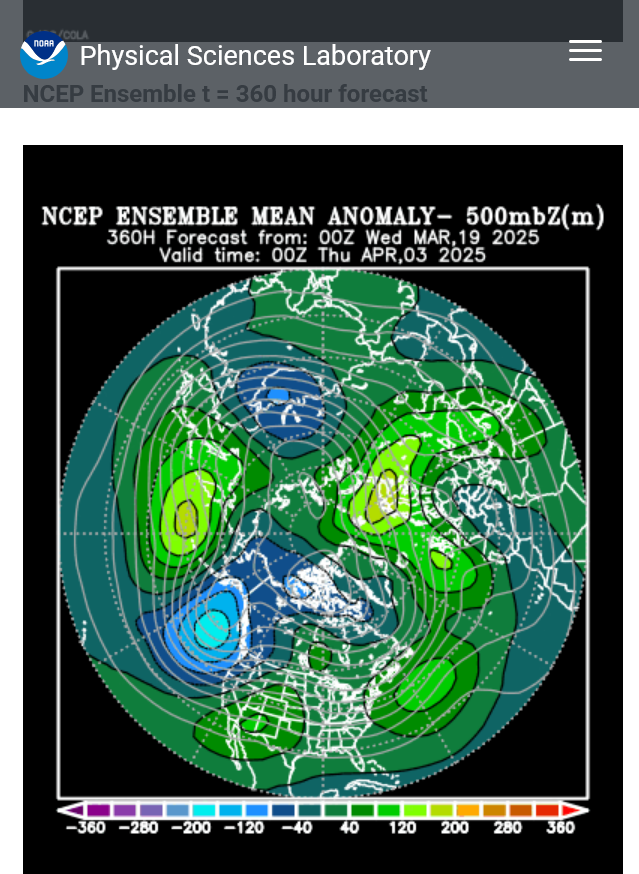
The extreme wind reversal in the stratosphere above(fairly strong/anomalous east to west winds that will spike to what must be in record territory) has very little coupling with the troposphere below it (where our weather is) as seen on the maps below!
1. Current 500 mb
2. 15 day forecast for 500 mb
https://www.psl.noaa.gov/map/images/ens/z500anom_nh_alltimes.html
Hey Mike,
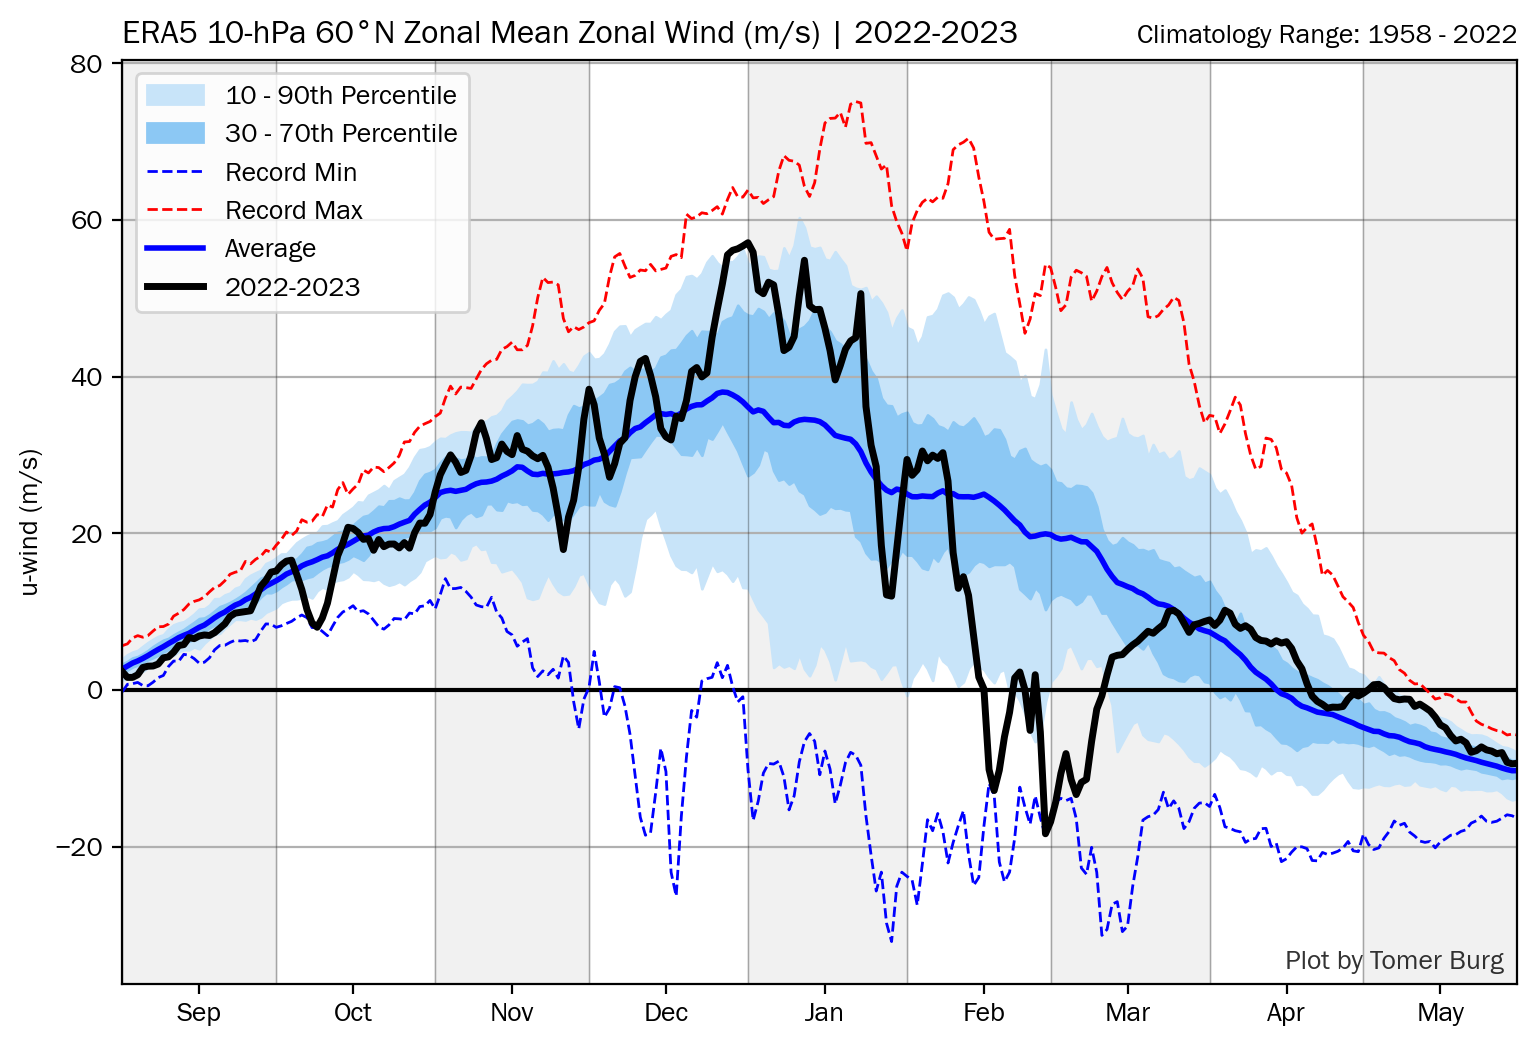
The very impressive~-27 m/s dip in late March would be an easy record for that and surrounding dates. But it actually wouldn’t be a record for March overall. Also, Jan has dipped lower before and Dec had a near -27 on record.
Thanks, Larry!
You're the only person that I know that would have that information!
Do you have a good source for me to use so I know almost as much as you about it?
Thanks!
Mike,
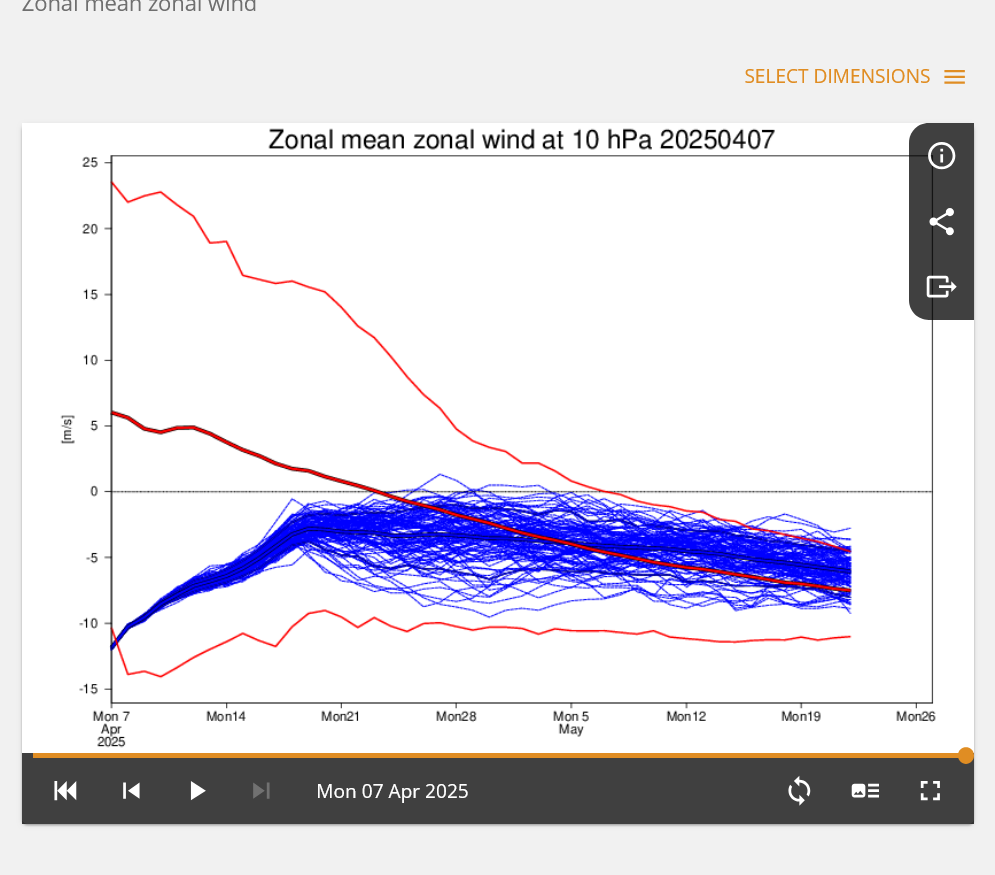
Look at the blue dashed line on this:
Thanks, Larry!
I can see that clearly. And also that we are approaching that record low for March and not far from the all time low in January. Both those could barely be taken out.
On April 1st, we'll be pretty close to the record low for April, even as we rebound quickly during April, close to 0 and average towards the end of the month.
I've not been following the winds in the stratosphere for that long(just the last couple years) and still have much to learn.
Another significant observation is the the difference between the record max and record min peaks in January(and its huge). After that point, the difference rapidly converges because of the record max PLUNGING lower, with the greatest accelerated drop, seasonally starting right now. Between mid March and mid May we drop from 50 to a negative number for the record max.!
In late May into August, the winds are ALWAYS from east to west and very light(a complete reversal of the Winter winds in the stratosphere. Even the record high is below zero(indicating east to west direction). Obviously, 24 hour days and round the clock solar radiation causes this, along with the solar radiation breaking up O2 and causing some of the very unstable atomic oxygen, O to bond with other O2s to form O3 = ozone.
Great appreciation to you for the insightful conversations we have here about it.
+++++++++++++++++++++++++++
Here's a post from over a year ago for others to understand more:
Major Sudden Strat. Warming: chance increasing in early Jan
By metmike - Dec. 23, 2023, 11:02 p.m.
This explains the SSW that happened early this year:
++++++++++++++
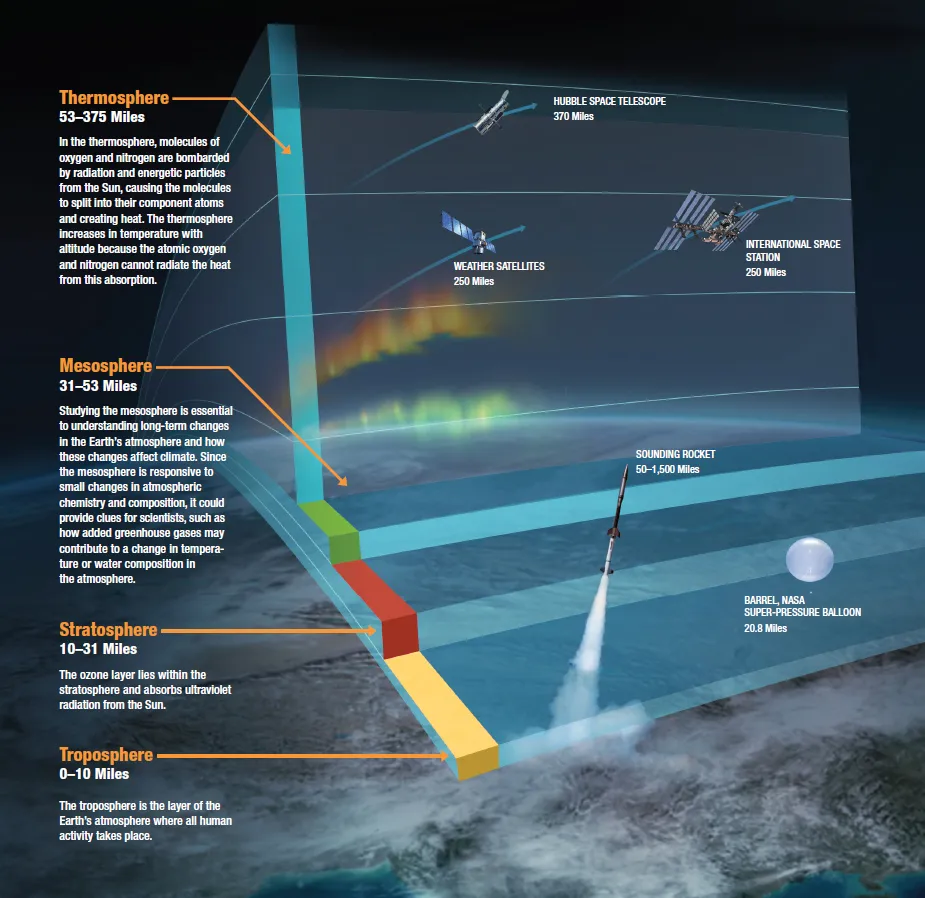
https://www.noaa.gov/jetstream/atmosphere/layers-of-atmosphere

Average temperature profile for the lower layers of the atmosphere above
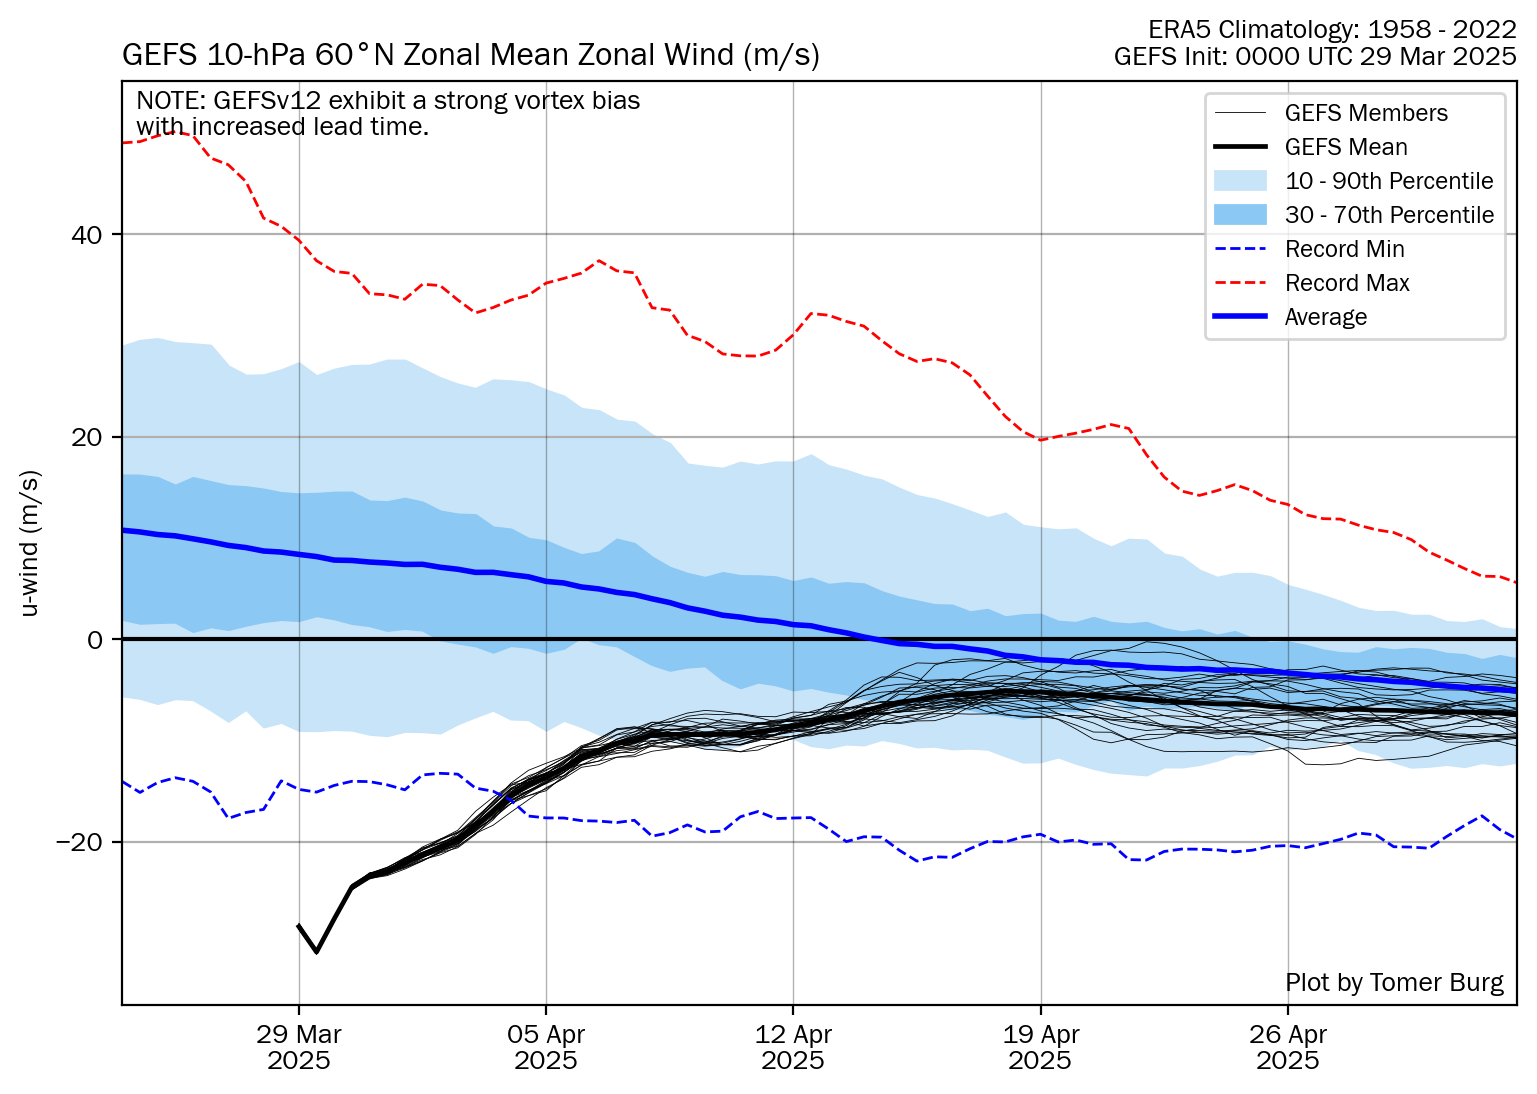
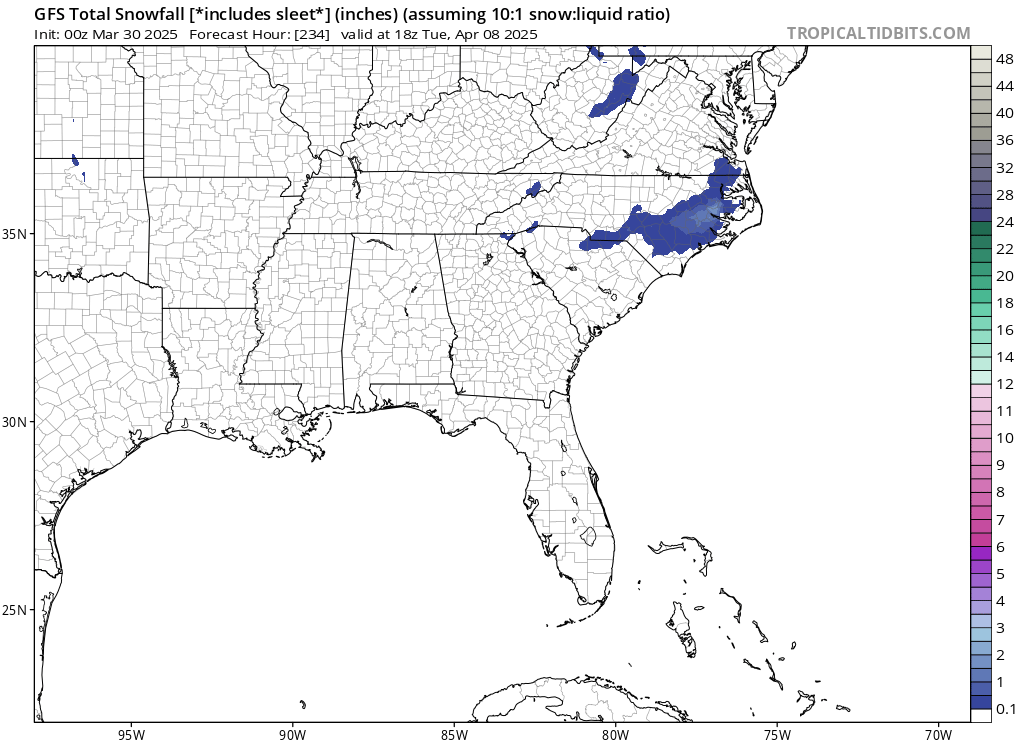
Yesterday, 3/29/25 was the low point of the stratospheric reversal that was predicted so well by the models. Here’s the 0Z 3/29/25 GEFS prog:
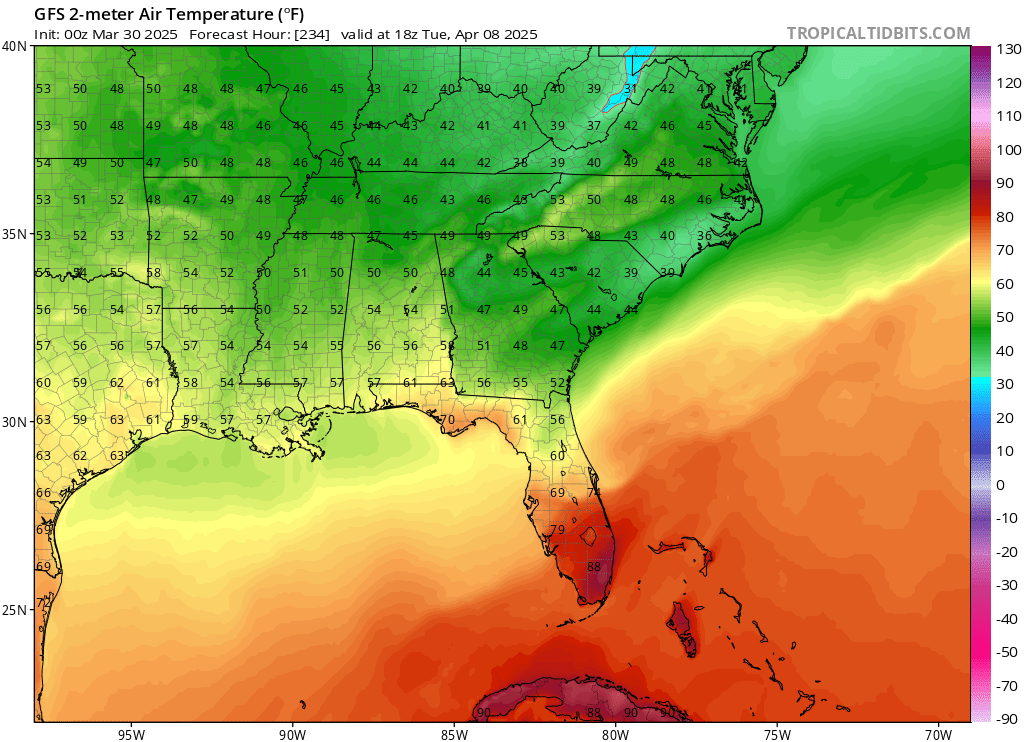
Get a load of the 0Z GFS. Holy cow, I think the GFS had a little …no, a lot…too much to drink!
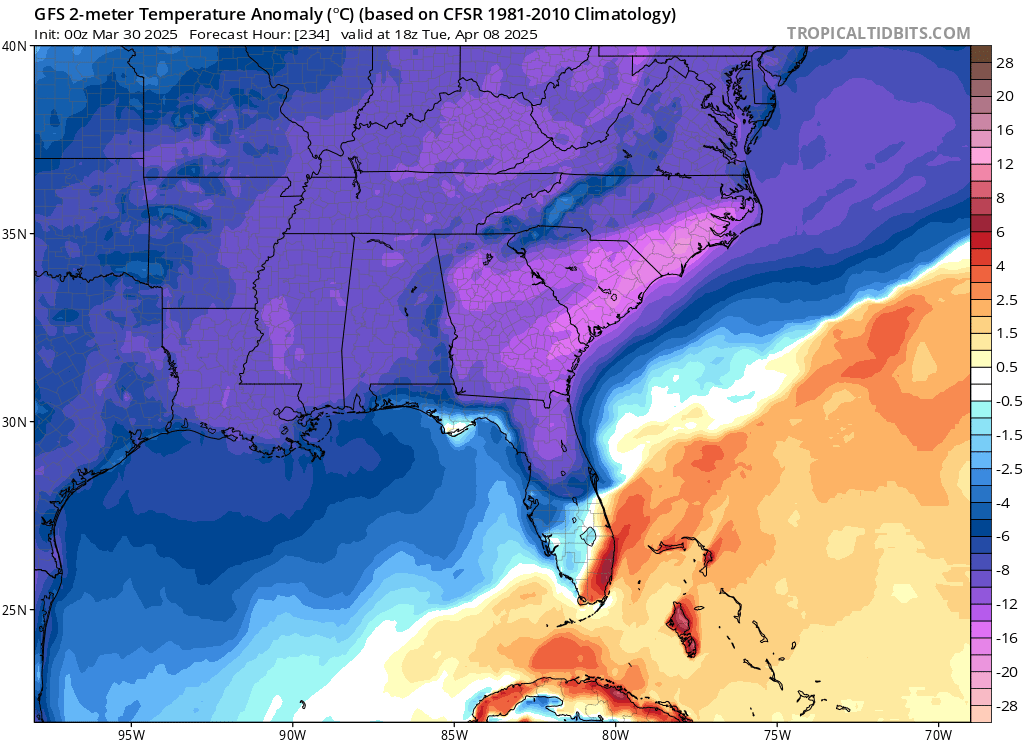
And snow on April 8th, Tue of Masters Week! Is this real? Im taking that with a humongous grain, but would this be because of the current very strong stratospheric reversal?
Wow,Larry!
Looks like an extreme outlier to me!
Ensembles as we would expect don’t have that. I’ll have to look at any members that go with it.
is it from the wind reversal in the stratosphere?
It doesn’t look like the stratosphere and troposphere are vertically phased/coupled but we need to look at the stratosphere leading up to that period And more we maps.
it is possible!
++++++++—
5am: I need to look at more maps but lookd at the Canadian model ensembles at 500 mb from the last 4 solutions and think you probably made a brilliant deduction, Larry. It has an extreme anomalous low, in the far East around this day 10 period but took awhile to catch on.
This likely is a consequence of the stratospheric polar vortex displacement extremely far south and the solutions are just catching on to the impact in the troposphere…….which took several days for them to better dial in to week 2 solutions.
I was actually wondering about this on Friday when natural gas was down in the dumps early in the morning and surged $2,000/contract for no apparent reason with this brief early April cold snap in the East lurking.
The GEFS ensembles, however are not that bullish/extreme with the solution and this is still more than a week from now and very extreme so it’s not certain but you are to be congratulated for recognising this feature and cause.
Ive not looked the the European model and can’t get it on my laptop because I forgot my sign in info.p but will look later on my computer.
Im definitely not saying that 0z outlier run of the operational GFS run will happen but it’s something to follow now to have even more fun!
Im expecting a tornado outbreak on Wednesday p, including our area in the threat area and wouldn’t refer to the challenge of tracking something that may kill people as fun.
It would be much better for this to NOT happen and me have fun doing something else but I do especially enjoy INFORMING PEOPLE so they are aware of what’s coming and can track it and be prepared.
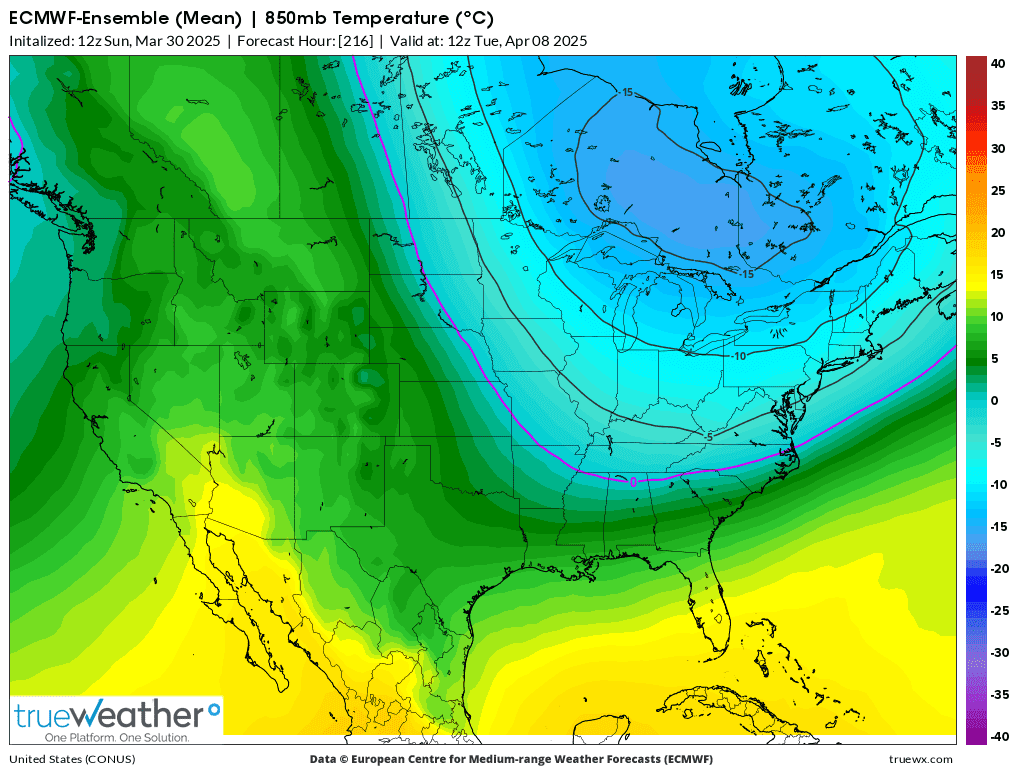
I have some incredibly cold 850 temps for April to show you from the last European model when back in the office.
The 0 deg. C isotherm gets down close to the Gulf Coast!
The 12z run of the European model did not push the cold as far south with as much gusto as last nights 0z run did.
1. NEXT Tuesday morning 4-8-25 Isotherms spaced every 5 Deg. C. 0 Deg to northern AL/GA border.
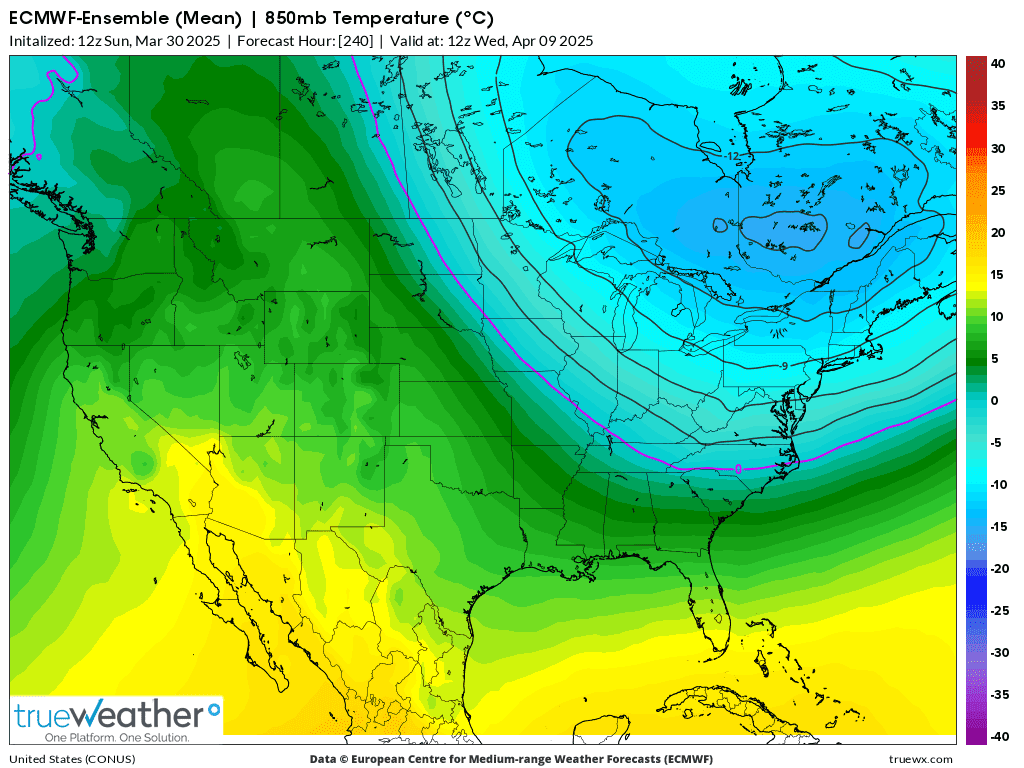
2. Next Wednesday morning 4-9-25 Isotherms spaced every 3 Deg. C which make is look colder but it isn't. 0 Deg. down to northern SC border.
Larry,
I think its a really odd coincidence that we had the extreme stratospheric wind reversal and then this extremely long lived/stalled tropospheric/weather system in the middle of the country.
A stalled weather system like that might only happen once every decade or 2 at the most.
I don't have the data to prove the causation and we didn't have any extreme anomalies in the troposphere that show the clear atmospheric fingerprints but feel there might have been some impact. If not, then its one crazy coincidence.
https://www.marketforum.com/forum/topic/110908/#110911
What do you think?
Maybe the seasonal reversal happened extremely early this year?
++++++++++++++++++++
https://charts.ecmwf.int/products/extended-zonal-mean-zonal-wind?area=nh&base_time=202504070000
Mike said, “A stalled weather system like that might only happen once every decade or 2 at the most.”
——————-
Hey Mike,
I’m not aware of any connection like that although that’s an interesting observation and I suppose it could be connected with some lag.
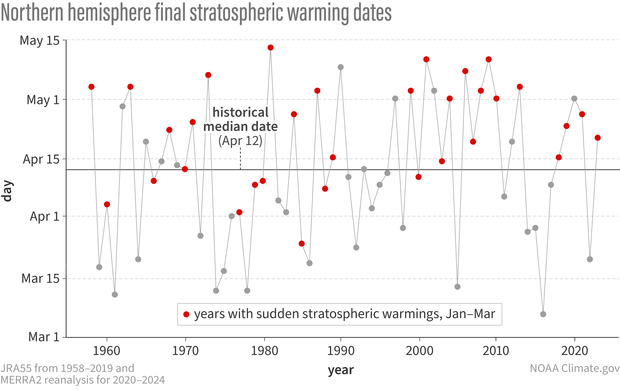
Regarding the very early seasonal reversal, this will go down as not just a very longlasting plain old major SSW (looks like it reversed on March 9th and has stayed reversed since then) but a very early “final warming” (FW) because it doesn’t look like it will reverse back this season. The earliest in the season FW since 1958 was March 5th of 2016. That’s the only one earlier than March 9th.
Thanks, Larry!
I knew you would be able to shed some light on how extreme this stratospheric wind reversal was.
Do you have a link to those records.
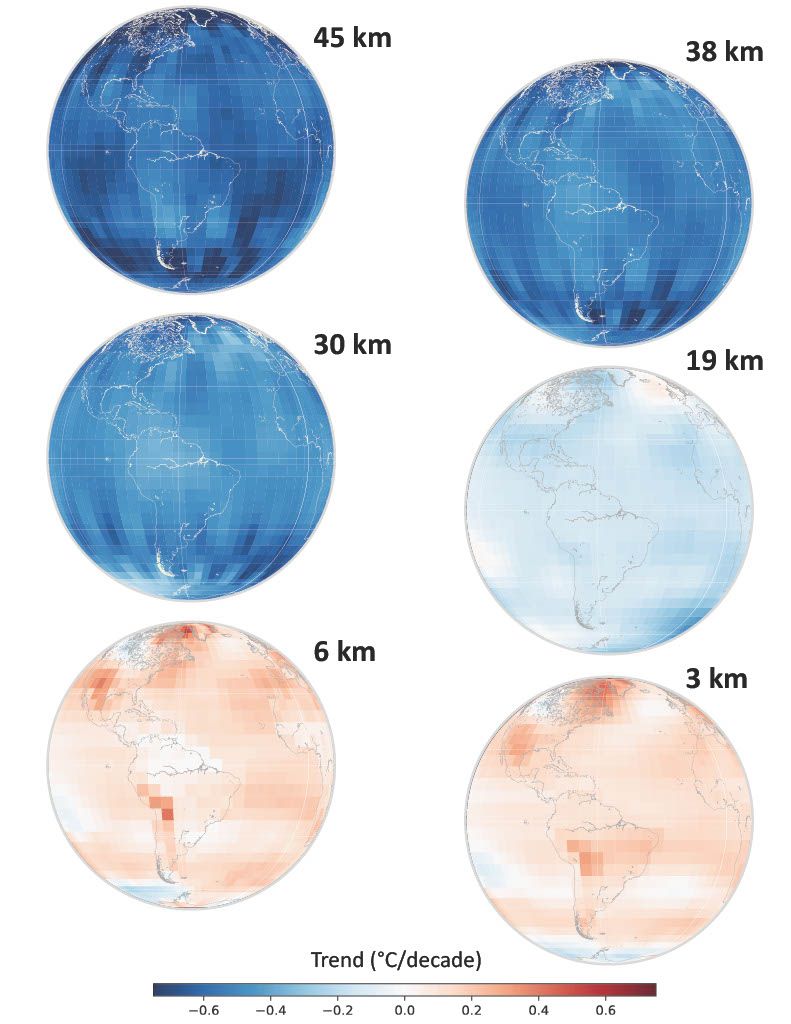
Is there a trend there from global warming/climate change? We've known for awhile that the layers above the Troposphere are cooling because increasing CO2 in the troposphere traps more of the LW radiation and keeps it from escaping to higher levels.
Granted records on this metric only go back to 1958. As I mentioned previously, I've not studied the stratosphere extensively but this is fascinating stuff and I greatly appreciate your contributions to the learning.
https://www.climate.gov/news-features/blogs/polar-vortex/polar-vortex-hitting-brakes
+++++++++++++++++++++++
++++++++++++
https://newsroom.ucla.edu/releases/stratospheric-cooling-vertical-fingerprinting
OK, I did some searching and found that information.
On the graph below, it actually looks like the opposite pattern. A trend of LATER final warming dates from the 1970s until around 2010(during global cooling of the stratosphere) which seems to make sense. Since then, the trend is back to earlier final warming dates with the 2 earliest in the records being in the last 10 years, including this one.
Global warming did not stop or slow down after 2010 so its hard to explain other than random variation and maybe this date is not related to the cooling in the stratosphere.
What do you think, Larry?
https://www.climate.gov/news-features/blogs/polar-vortex/last-hurrah-polar-vortex