It might be a coincidence that Gold's recent strong move to the upside as compared to Trump's ascendancy. At first, when Trump won, gold broke sharply. ($2850 to 2600) But since then it has rallied sharply ($2930 as I write this). Why? Is it inflation expectations? Maybe. But the gold/inflation connection has been off and on for a while. What if, gold is reacting to Trump the disrupter? .....
(side bar) - I fully acknowledge that some of that disrupting is, no doubt, good in the long run. I personally prefer adherence to the rule of law (in the short/medium/long term). But, I'm not blind to our political disfunction.
When the future is uncertain, gold has been a refuge historically. Maybe this is all a coincidence. Maybe not. Maybe gold is cheap at $2900?
Maybe uncertainty should also be bearish the stock market but the disruptions are so pro business so stocks are holding up nicely. But gold is up nearly 50% in the last 16 months.
Wonderful post, joj!
Charts coming up.
Some previous gold posts:
Gold 4 Hour Chart $$$
21 responses |
Started by mikempt - Sept. 29, 2024, 8:40 a.m.
https://www.marketforum.com/forum/topic/107734/
Gold Trading Range
25 responses |
Started by mikempt - Aug. 4, 2024, 8:29 a.m.
What looked like a potential top, turned out to be another bull flag and continuation chart pattern as the parabolic, impossible to sustain move higher continues. Picking tops in markets like this has extreme risks.
https://tradingeconomics.com/commodity/gold
1. 6 months-bull flag with the upside break out to new highs that joj just pointed out!(thanks!!!)
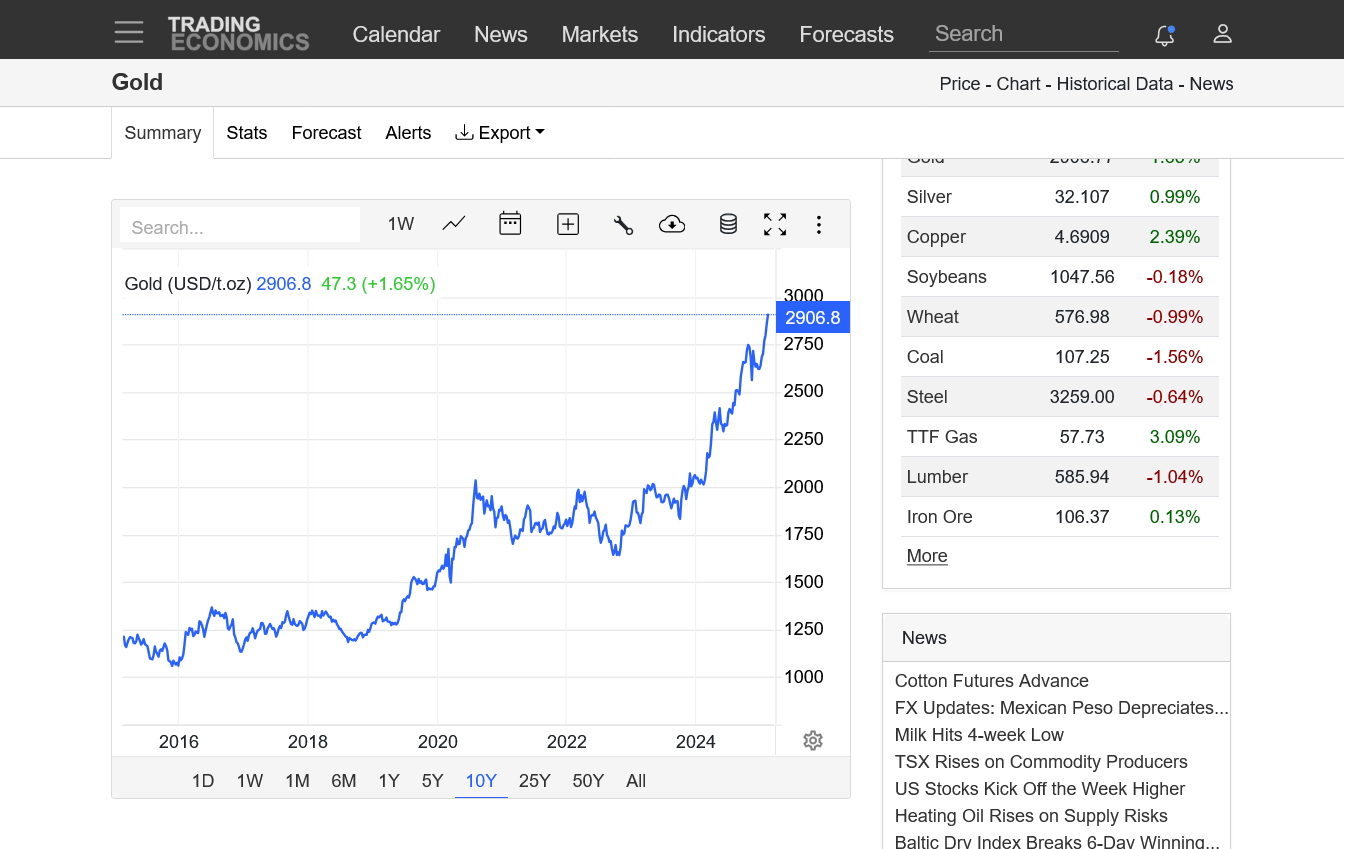
2. 10 years-sideways/bull flag trading between 2020-2023, then a huge upside break out to the upside!
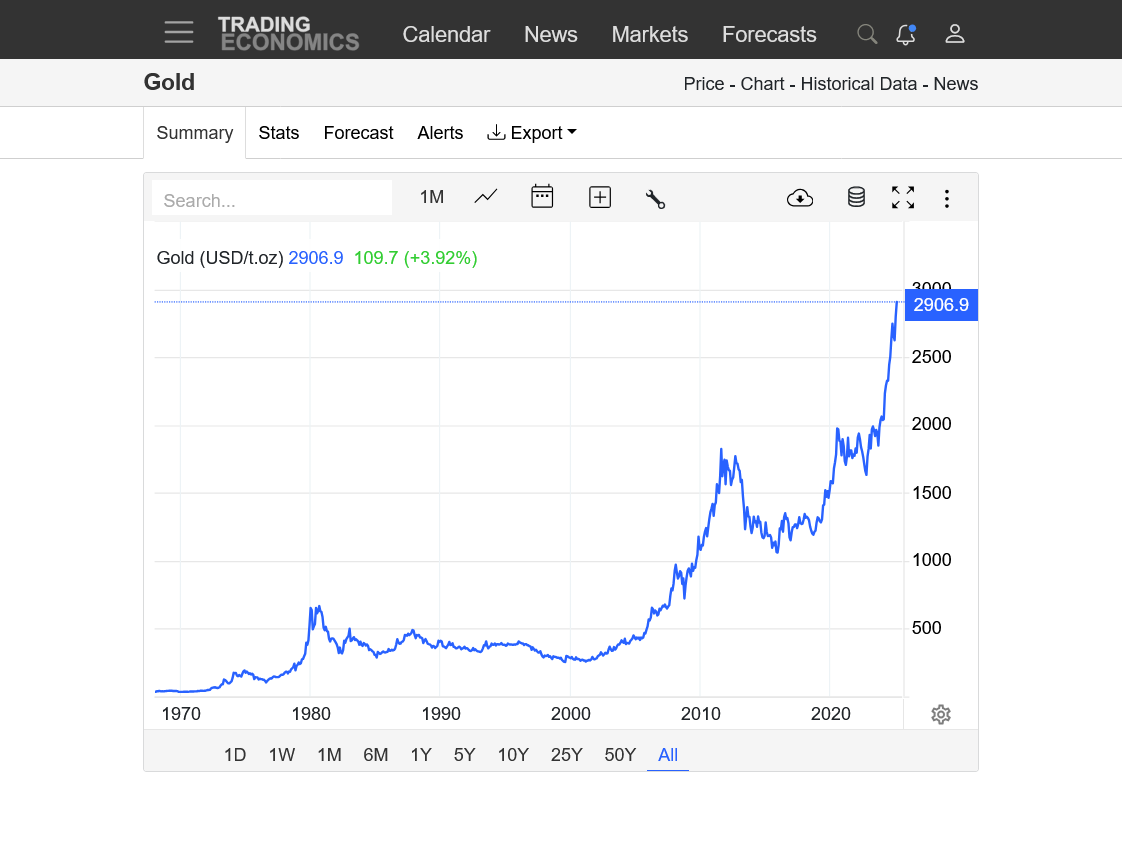
3. ~60 years- parabolic move up. Where it goes, nobody knows!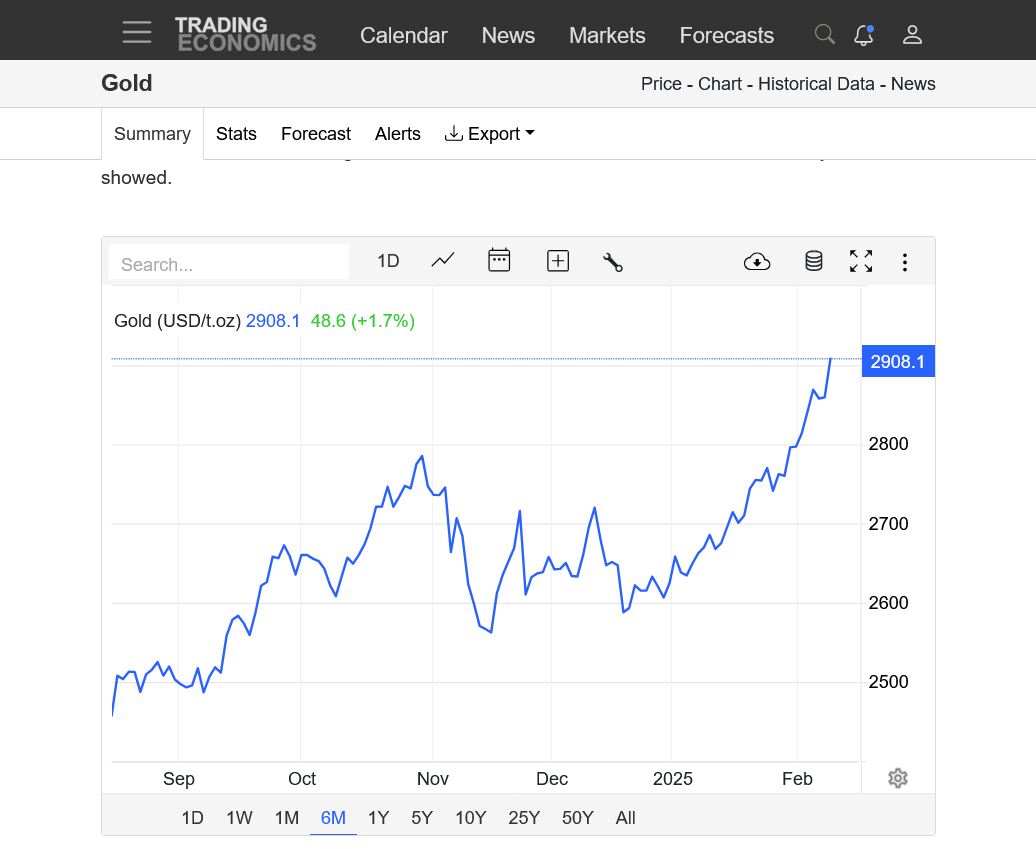
https://kinesis.money/blog/gold/decoding-gold-silver-investment-psychology/
+++++++++++
Some wonderful points in this article. I think it greatly under weights the current psychology and potential biggest reason for gold to be hitting new highs here, that joj points out and I strongly agree with............all H is about to break out because of Trump's agenda and how he's going about imposing it and how infuriating this is for the Ds, that will, with 100% certainty react in powerful ways to fight against it.
This impending battle has led to the ramping up of already stratospheric divisiveness and even more uncertainty which is music to the ears............OF GOLD BULLS!
I think a logarithmic chart is more useful and will appear less parabolic.
Thanks, joj.
I agree that a logarithmic chart could be more useful in a market thats rising exponentially but that actually defines a parabolic move.
https://en.wikipedia.org/wiki/Exponential_function

The type of chart that JOJ refers to has a y axis that for each unit instead of going1,2,3,... It goes 1,10,100,1000...
the Rictor scale is an example https://spacemath.gsfc.nasa.gov/Insight/Insight17.pdf
Why use log scale for stock prices?
Analyzing stocks with significant price movements: Stocks that experience significant price movements are better analyzed using a logarithmic scale. This is because the scale provides a more accurate depiction of percentage changes in the stock's price.
How do you know if a graph is logarithmic?
To echo this, pay close attention to the y-axis as you swap between the two graphs - on the linear graph, the marks along the axis represent numbers a constant distance apart. On the logarithmic graph, the marks represent 100, 1000, 10000, etc.Mar 21, 2020
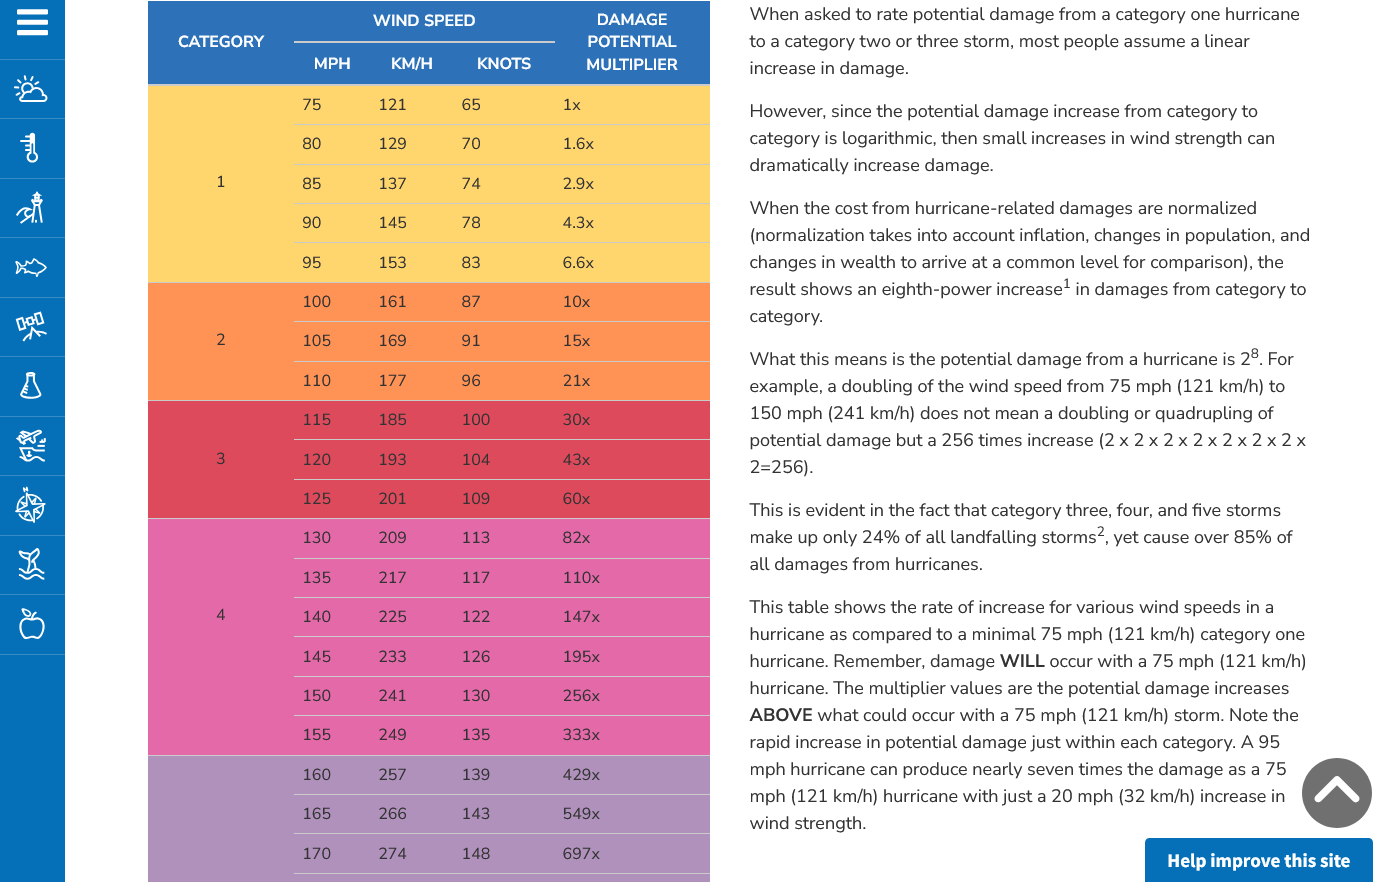
Same thing with wind from hurricanes and tornadoes. Damage goes up exponentially with increasing wind!
When you double the velocity of wind from 75 mph to 150 mph, it can produce 256 times more damage!!!!
(when trading with high leverage in a parabolic/exponentially changing futures/commodities market-it can do XX times more damage to your account balance.....if you're wrong
If you're right
Hurricane Damage Potential
https://www.noaa.gov/jetstream/tc-potential
This site has some good articles!
![]()
https://www.math.net/exponential-growth
Exponential growth
Exponential growth refers to a manner in which a quantity increases when its rate of growth is proportional to itself. For example, a quantity that keeps tripling is an example of a quantity that exhibits exponential growth; since the value is constantly tripling with respect to itself, the rate of increase is also constantly increasing. The growth of bacterial colonies is an example of something in nature that can exhibit exponential growth. Exponential growth can be modeled using the following function:
x(t) = aekt
where x(t) is the value of the function at time, t, a is the initial value, and k is the growth rate.
++++++++++++++++++
Exponent
https://www.netpicks.com/parabolic-stocks/
https://howtotrade.com/chart-patterns/parabolic-pattern/
++++++++
In the real world, not so easy. The only time I traded parabolic moves up is when extreme weather was the entire reason for the move..... and the weather pattern showed big signs of changing to the opposite impact very suddenly.
Which is extremely rare, with extraordinary risk in selling/picking the top of a parabolic move higher.
