It’s time for a new NG thread. It appears to be ~-6% vs the 1:30 Fri close. Mike, is that right?
Model consensus isn’t as cold as it looked on Friday. Good luck to those trading it!
Thanks, Larry!!
Previous thread/posts:
https://www.marketforum.com/forum/topic/109515/
+++++++++++++++++
EIA:
Re: Re: Re: Re: Re: NG 1/12/2025+
By metmike - Feb. 20, 2025, 12:18 p.m.
++++++++++++++++++++
Sunday afternoon to start the new trading week!
By metmike - Feb. 23, 2025, 5:57 p.m.
Gap lower coming on the open!
update 5:10 pm: April volume is already more than double the expiring March contract. Trade that one.
We got the expected gap lower.
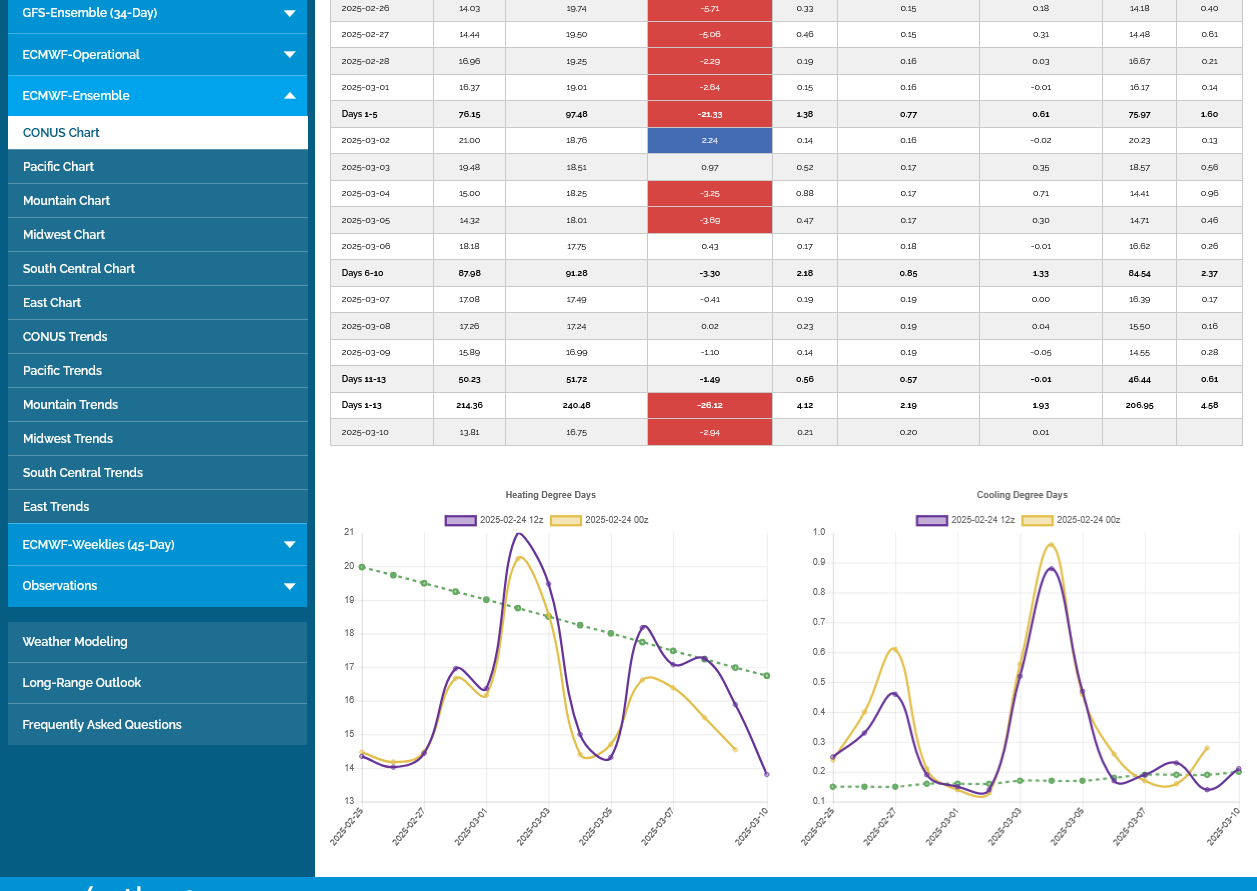
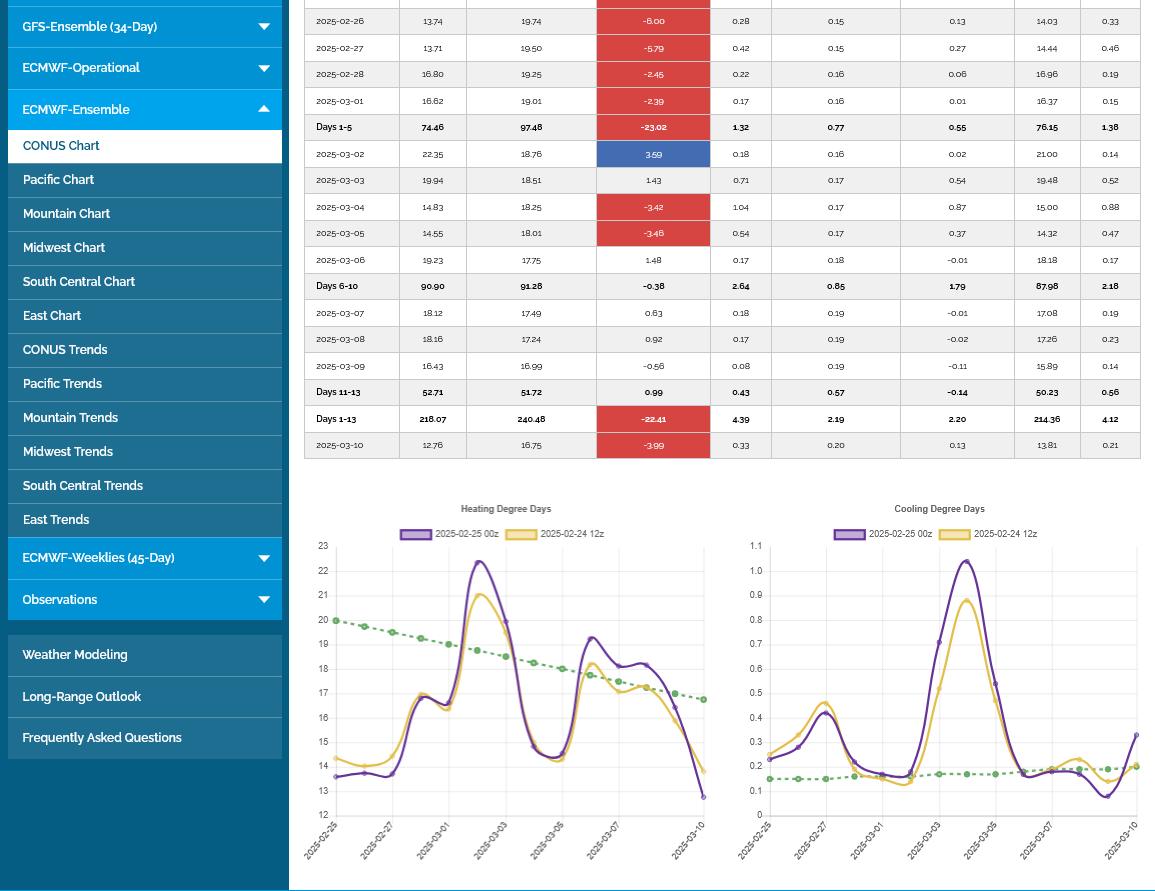
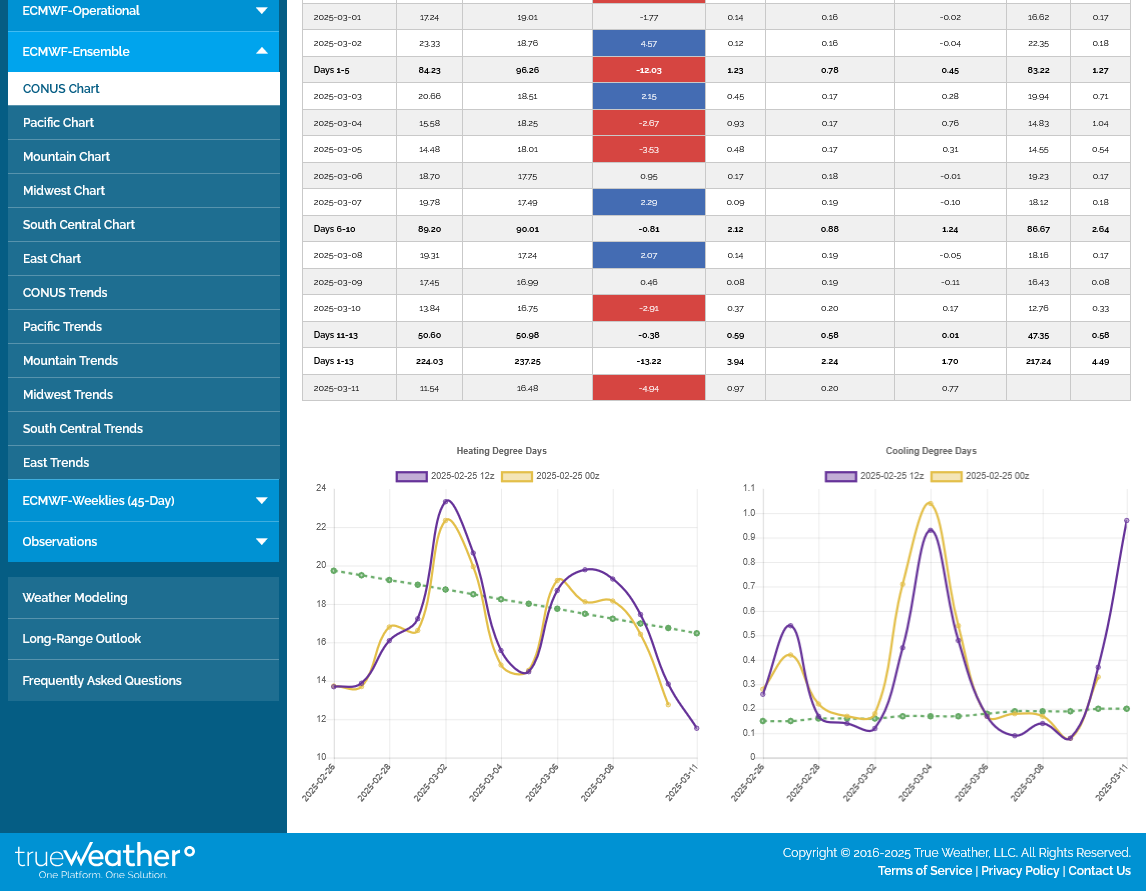
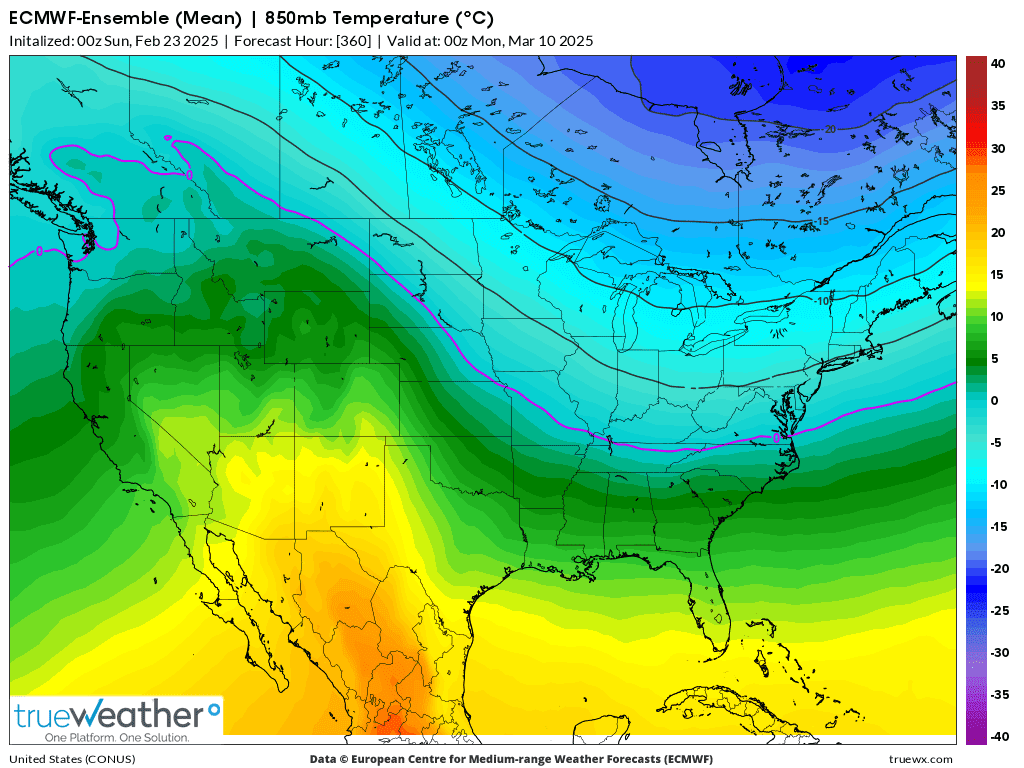
This one looks very much like a significant downside breakaway gap based on where its coming from and how much milder the weather pattern looks towards the end of the 2 week period. Last 12z European Ensemble HDDs in purple/left -4 HDDs.
This is the FRONT month.
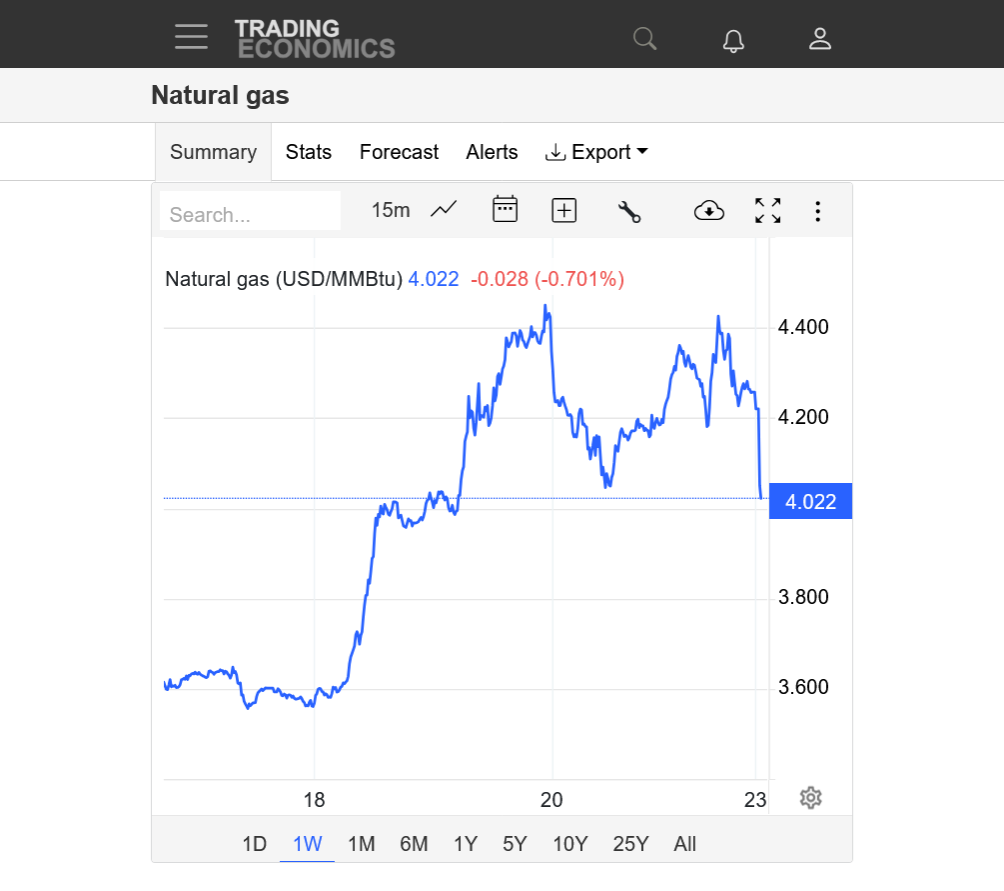
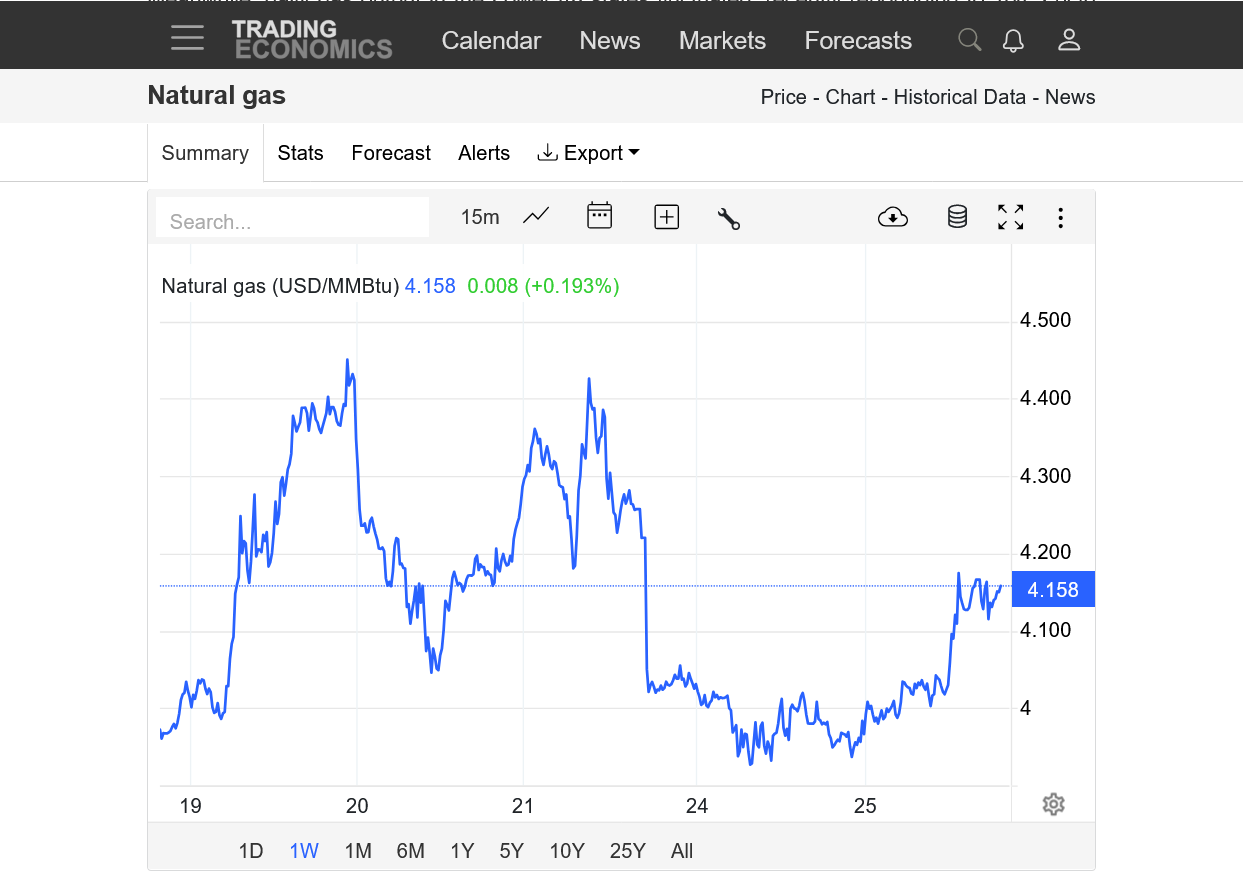
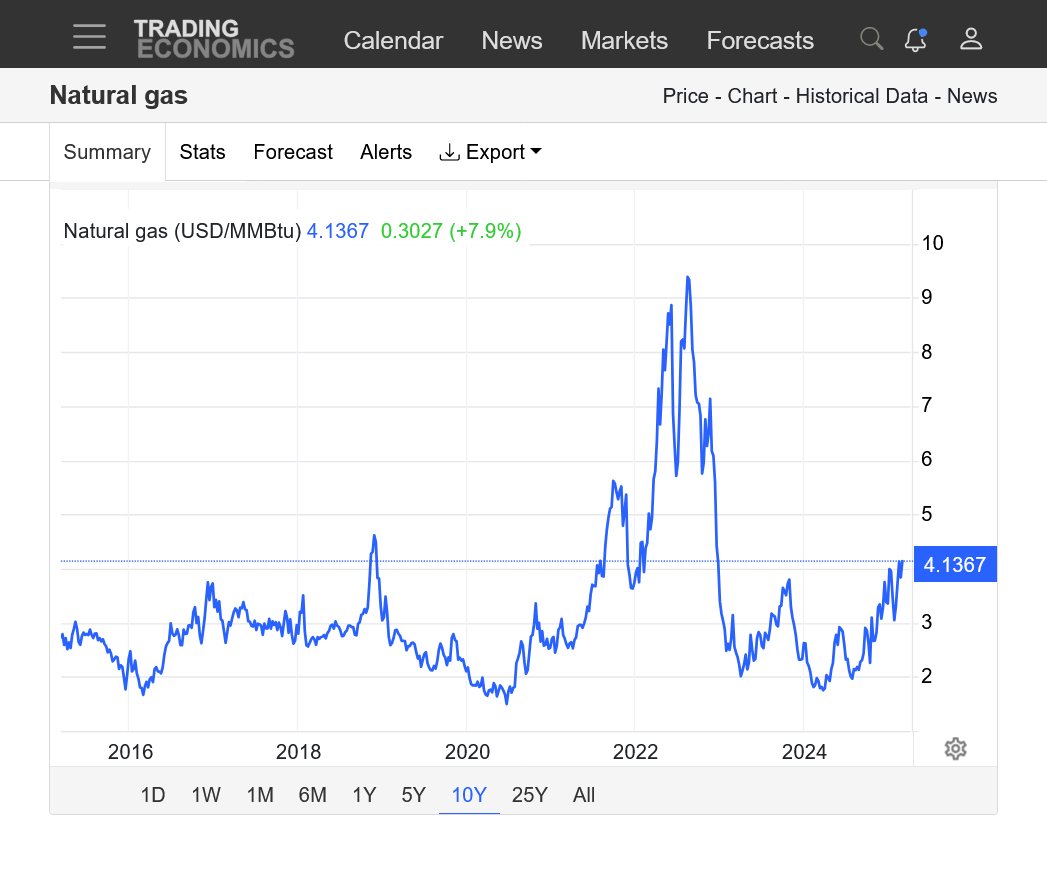
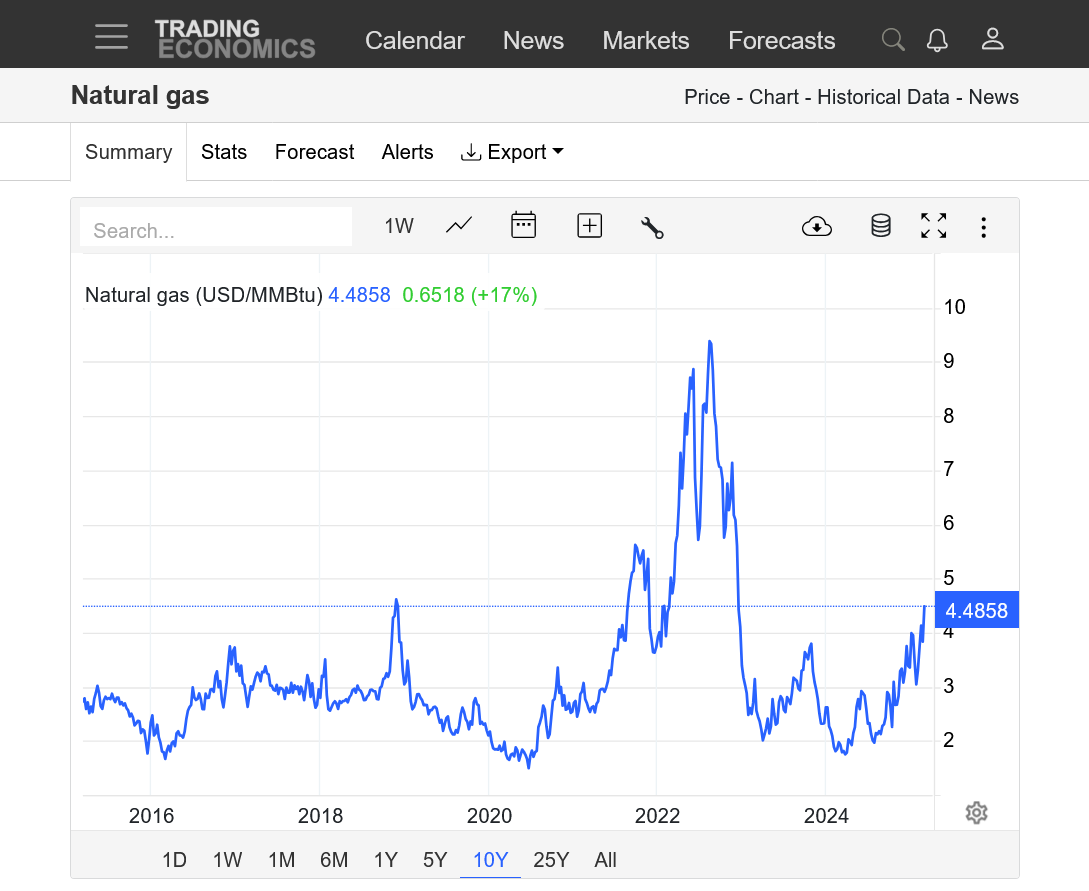
https://tradingeconomics.com/commodity/natural-gas
+++++++++++
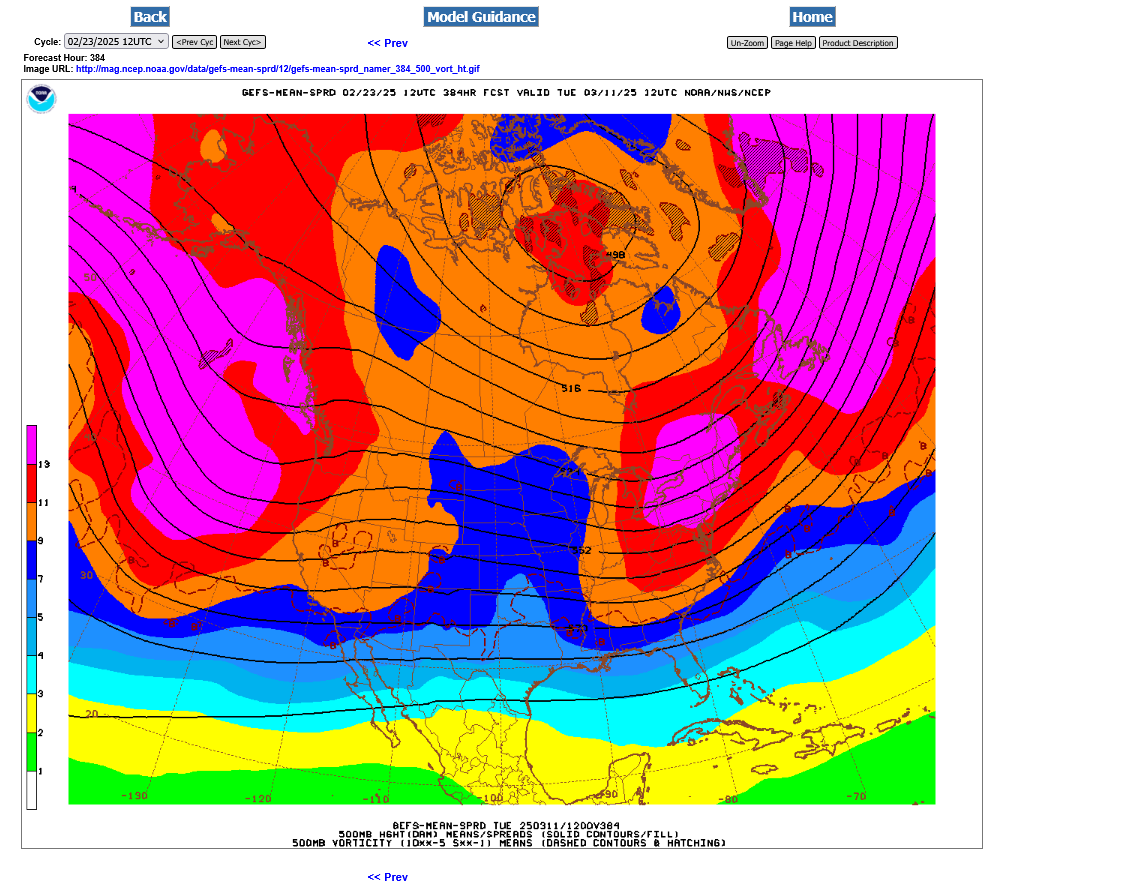
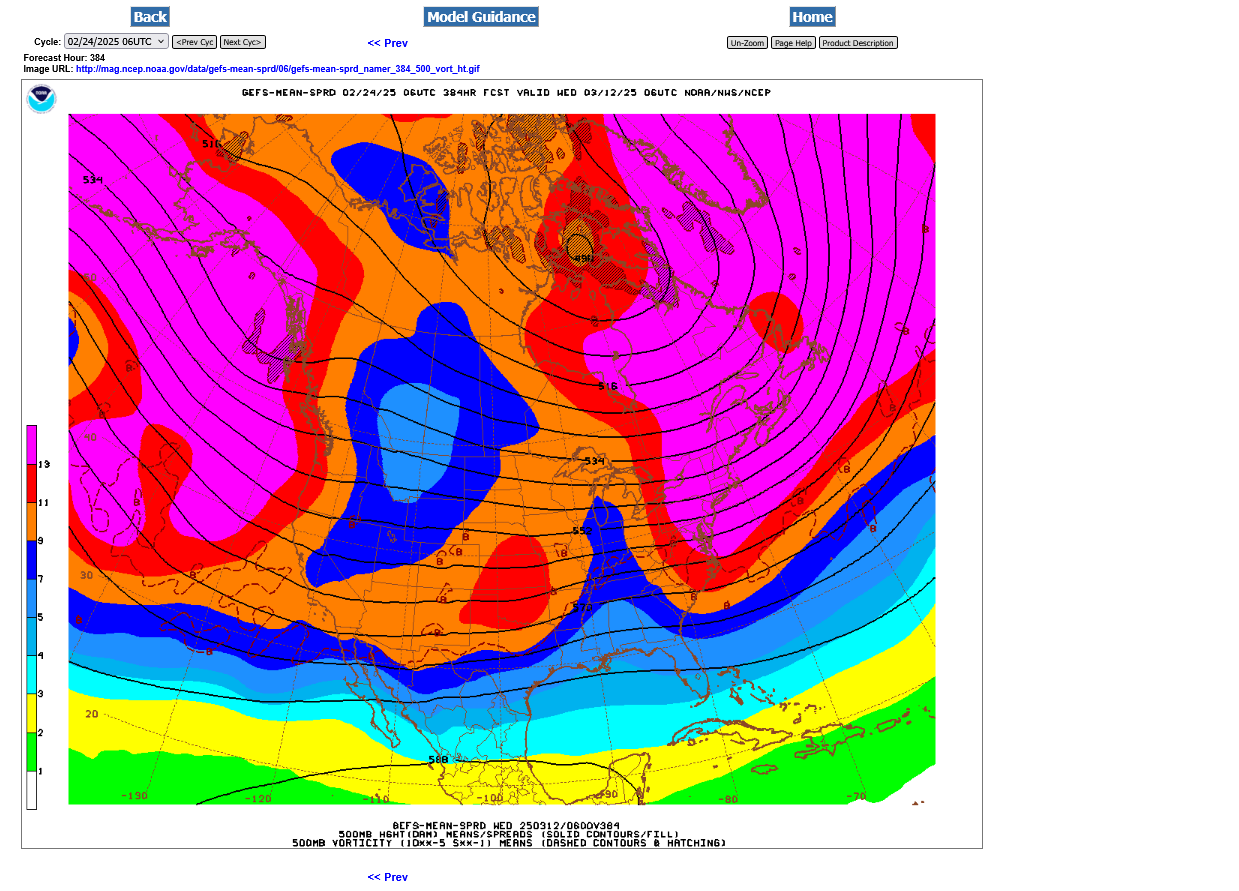
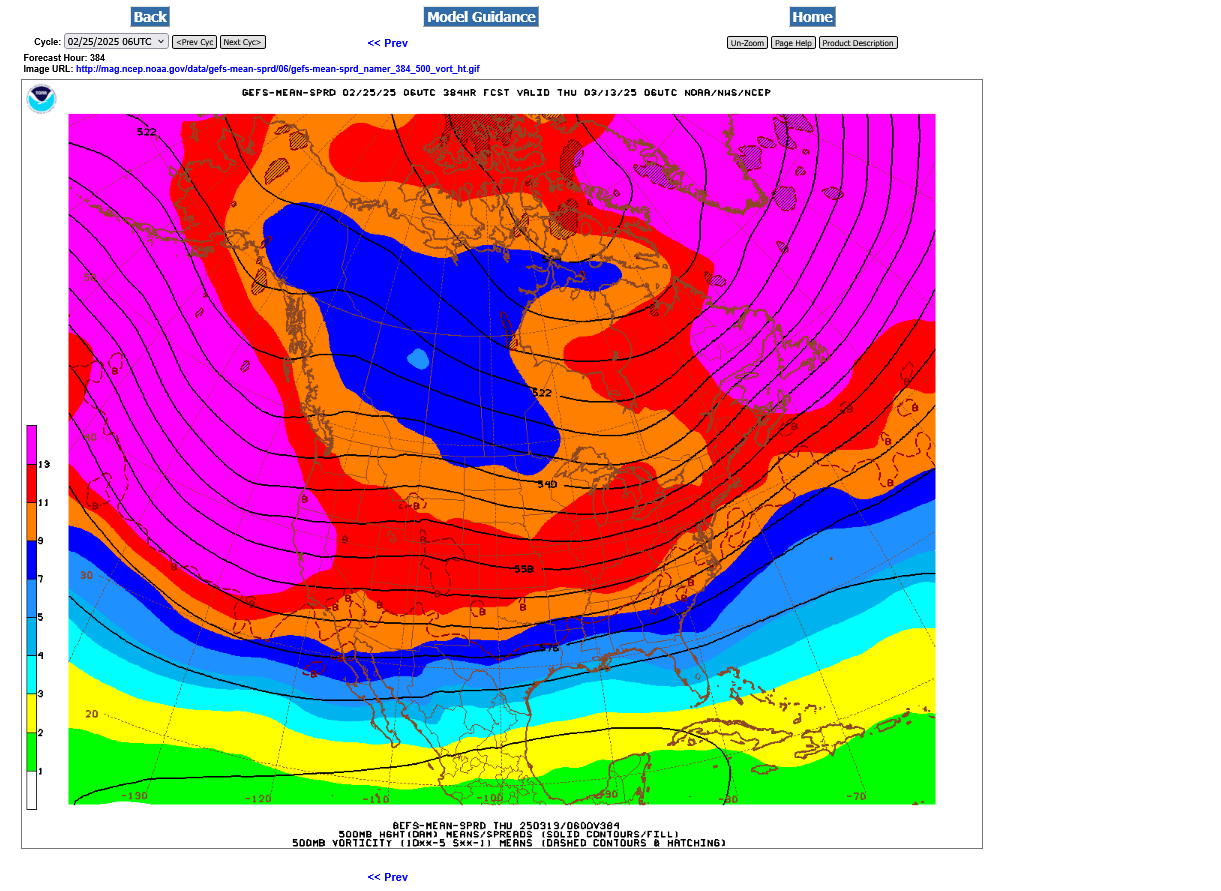
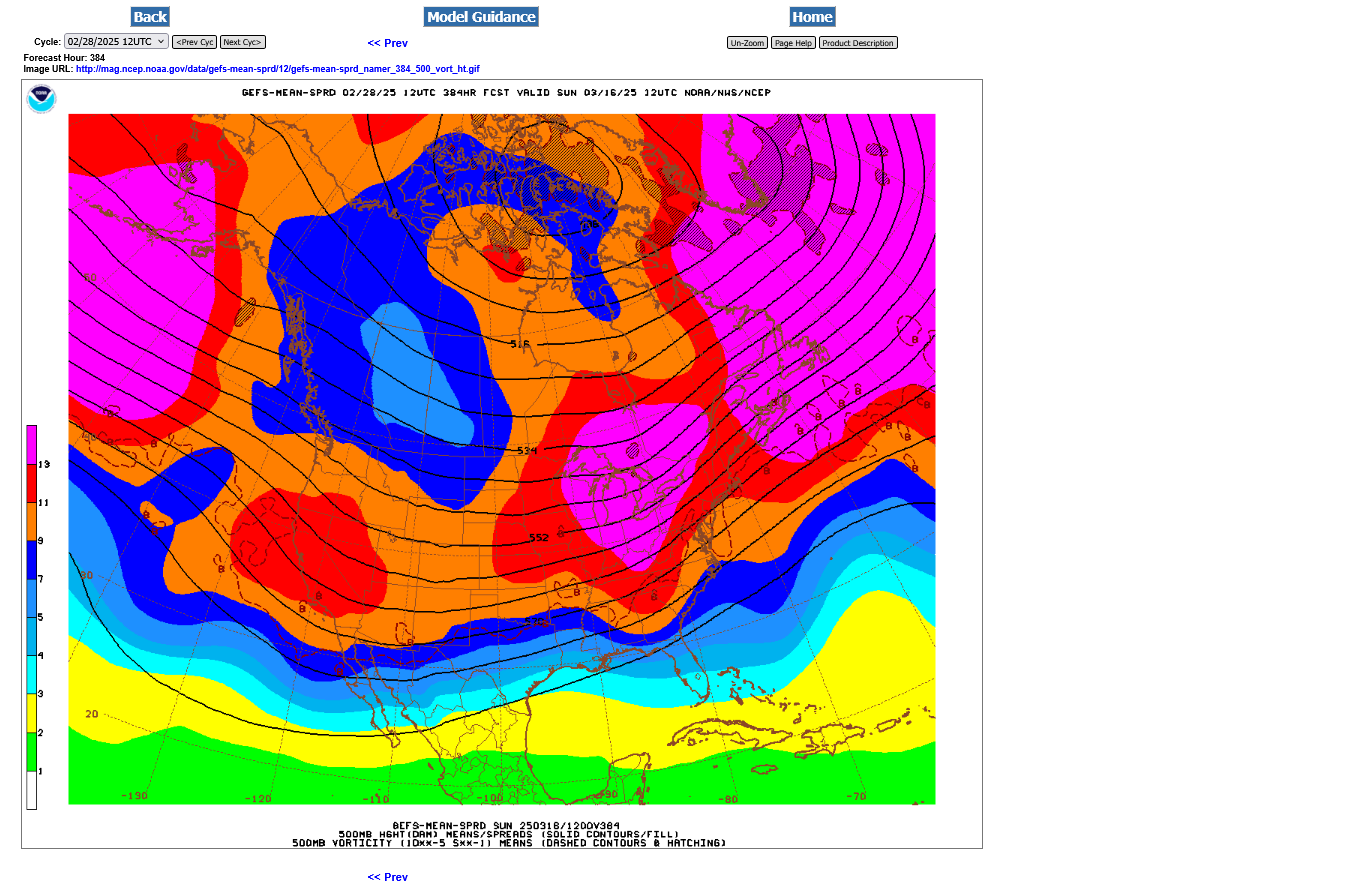
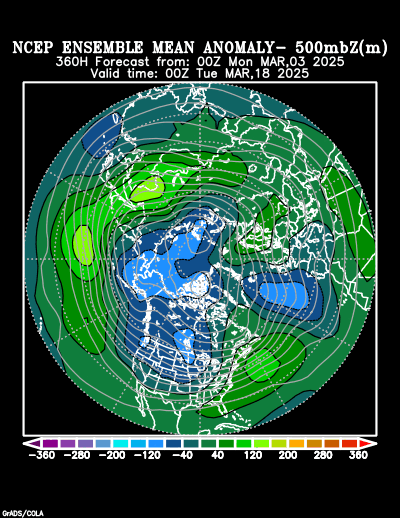
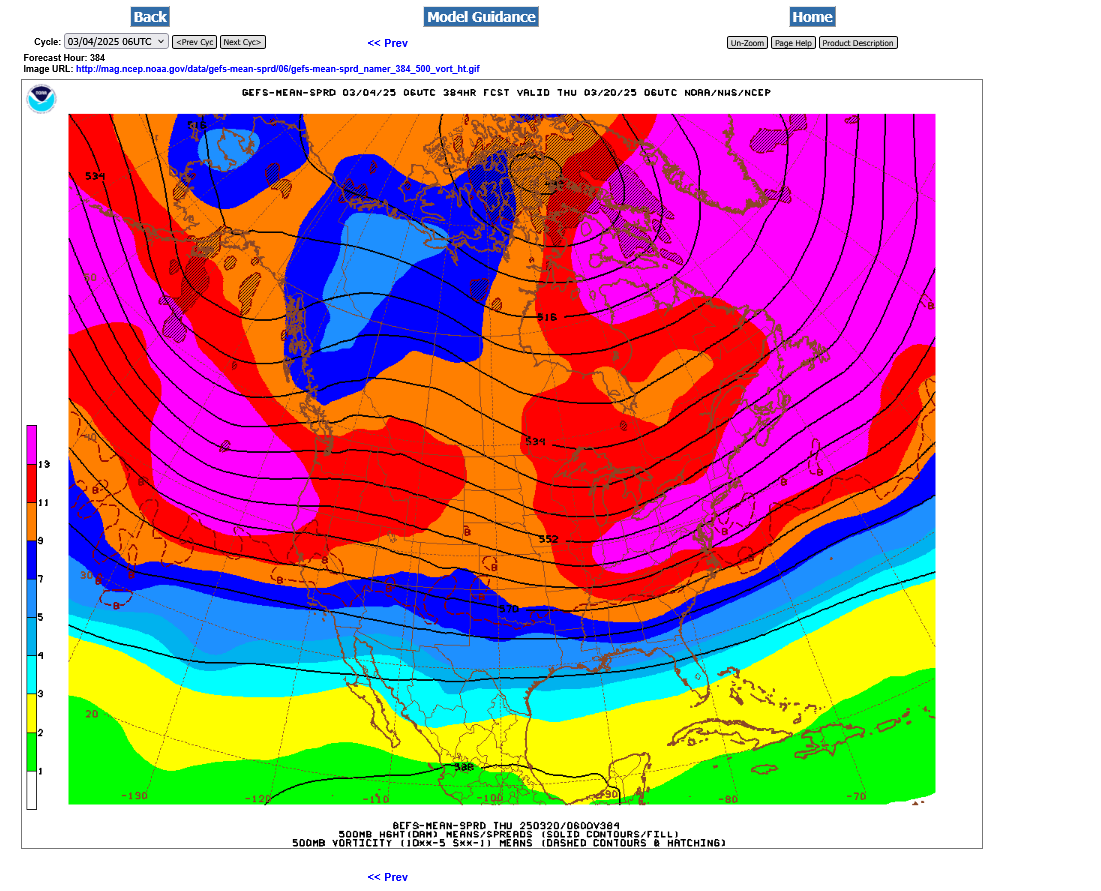
Cross polar flow completely undercut by mild Pacific flow! 12z GEFS below at 384 hours.
EIA weekly storage report on Thursday will show a monster sized drawdown for this time of year:
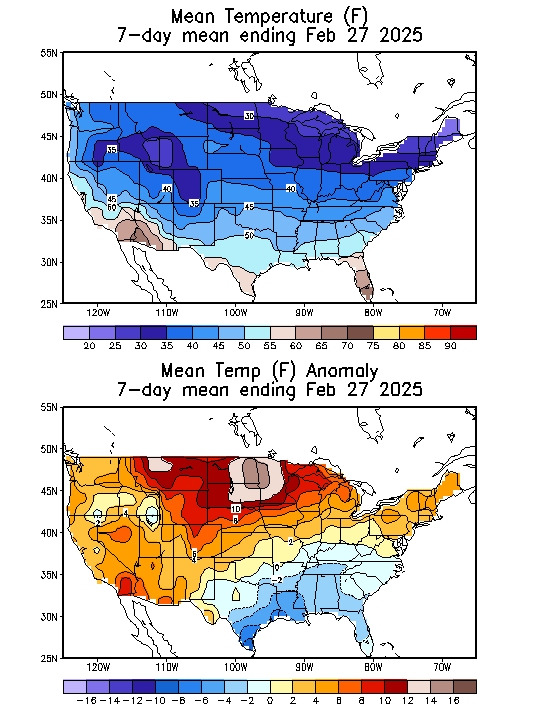
https://www.cpc.ncep.noaa.gov/products/tanal/temp_analyses.php
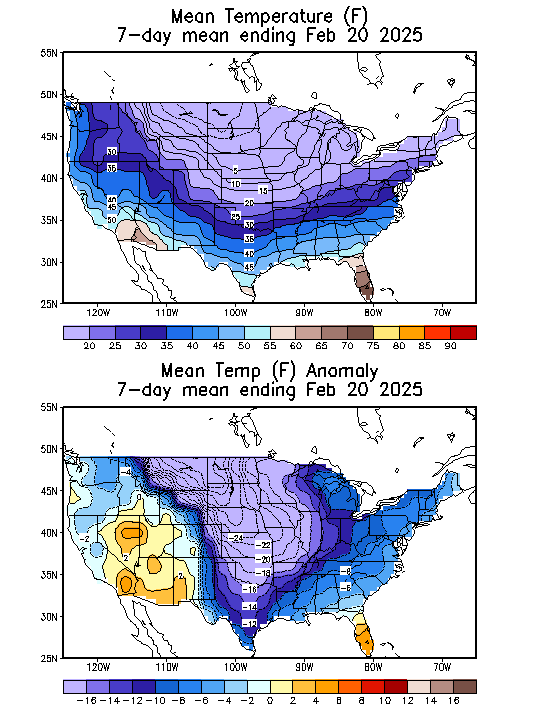
++++++++++++++++++++++++++++
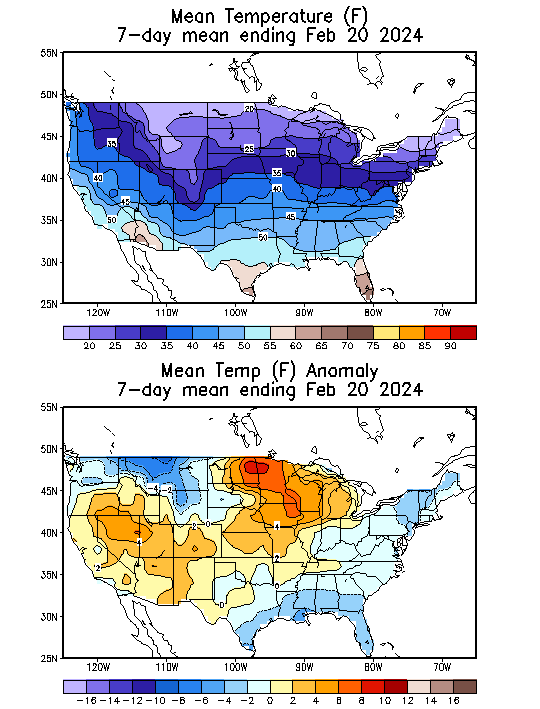
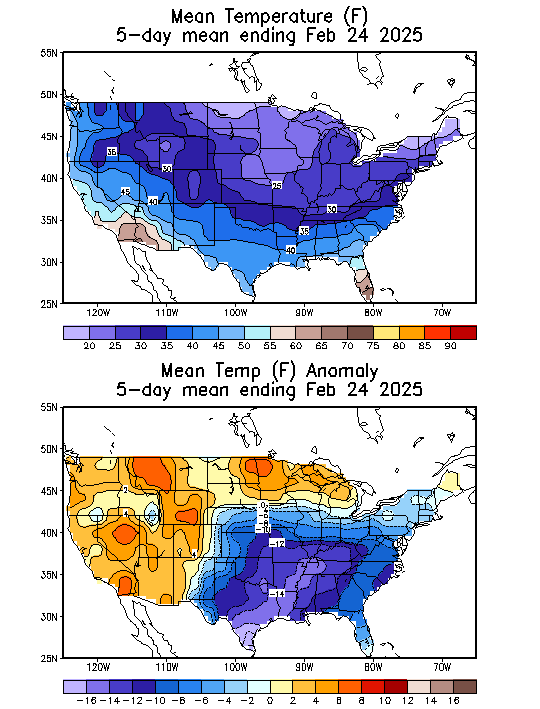
These were the temperatures for the same week, 1 year ago(2024).
EE was -7 HDDs more on this last 0z run. Purple left is that last run. The previous 12z run is in tan.
Very bearish vs Friday because the late week 2 trend was increasing well above average 3 days ago. Now its solidly BELOW average HDDs for the same period.
6z GEFS was very mild with zonal Pacific flow spreading across the country from west to east at 2 weeks.
This is a huge pattern change with the cross polar flow long gone and the polar vortex retreating to a typical spot, above far northern Hudson Bay, Canada.
The 12z European Ensemble in purple/left was almost +8 HDDs so we had a spike above $4 and +$1,200/contract off the lows for the higher volume April contract. I was surprised at that much strength since the pattern change is so MUCH MILDER compared to Friday.
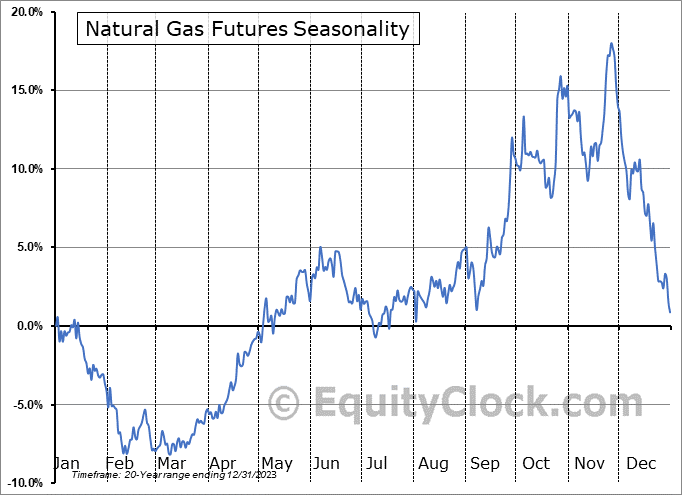
However, seasonals start to turn positive for the back months in late Winter, including April. We are looking at March weather NOT January. So the power of weather is waning. Starting in late March thru early June, its tough to make nat gas go lower, regardless of bearish weather.
https://charts.equityclock.com/natural-gas-futures-ng-seasonal-chart
The estimates for the storage draw this Thursday are massive. This has to easily be a record for this late in Winter.
This will take us closer to the bottom of the 5 year range. ......after being well above the top of the 5 year range when we started the heating season.
March Nymex natural gas futures traded sharply lower on Monday as winter’s loosening grip on the Lower 48 sparked a retreat by bulls.
I agree that would almost definitely be a record high draw for so late in the winter.
Thanks, Larry!

https://www.aogr.com/web-exclusives/us-rig-count/2025
++++++++++++++++++++++++++
https://ycharts.com/indicators/us_gas_rotary_rigs
0z European Ensemble was almost +4 HDDs which is apparently a part of why we're higher. We're even approaching the bottom of the gap lower Sunday Night. I never thought that would happen after seeing this huge pattern change to milder. My assumption was that it would be a downside, breakaway gap lower coming after a long lived move to the upside. This is usually a pretty powerful, high confidence shorting signal for weather trading.
However, we have some bullish items that may be keeping us supported.
1. There's a record huge drawdown on the way for Thursday.
2. The storage situation has gone from near record bearish(above the 5 year range) to start the heating season to what will be very bullish(below the 5 year range).
3. Starting in March, seasonals for nat gas get pretty positive, especially for the back months. Regardless of the weather which is taking a back seat because Winter is almost over.
This was the last 6z GEFS solution at 384 hours for 500 mb. Look at those west to east streamlines spreading mild Pacific origin air across the entire country. The cross polar flow connection has been obliterated. This is bearish weather since it will cut back on heating demand. But its mid March by then. Most of Winter is over. Big weather traders are not interested like they were in December and January. The market starts focusing on refilling storage(which is low) and non weather fundamentals.
Also, the front month, March NG is expiring either today or tomorrow. Wild price spikes down and especially up are not unusual close to expiration.
Hey Mike,
The Mar 2025 contract expires tomorrow (2/26). Normally NG expires two days prior to the last business day of the prior month.
Thanks, Larry!
We're up pretty strong now and this made the gap lower on Sunday Night a gap and crap. However, this is a selling exhaustion signal which is not as significant when we are so close to the highs of a long move up.
It would be more like a 1 day selling exhaustion signal with most of the bearishness being focused on Sunday Night and Monday as the market traded the MUCH milder weather late in week 2..........now its gone on.
The EE had +7 HDDs so that probably was a factor but this is from individual days being colder and not a change in the pattern.
Hey Mike,
If you get a chance, please post the latest GEFS DD graph/chart. TIA
The new GEFS 18z run has started, so I'll post it when that's done. So you have the latest one.
Daylight Savings Time is coming up in less than 2 weeks. Bummer! It means all the models come out 1 hour later relative to the time change. I know for sure that you profoundly understand this!
6:50 pm: Here it is. The last 4 runs have been amazingly consistent, especially considering the pattern change.
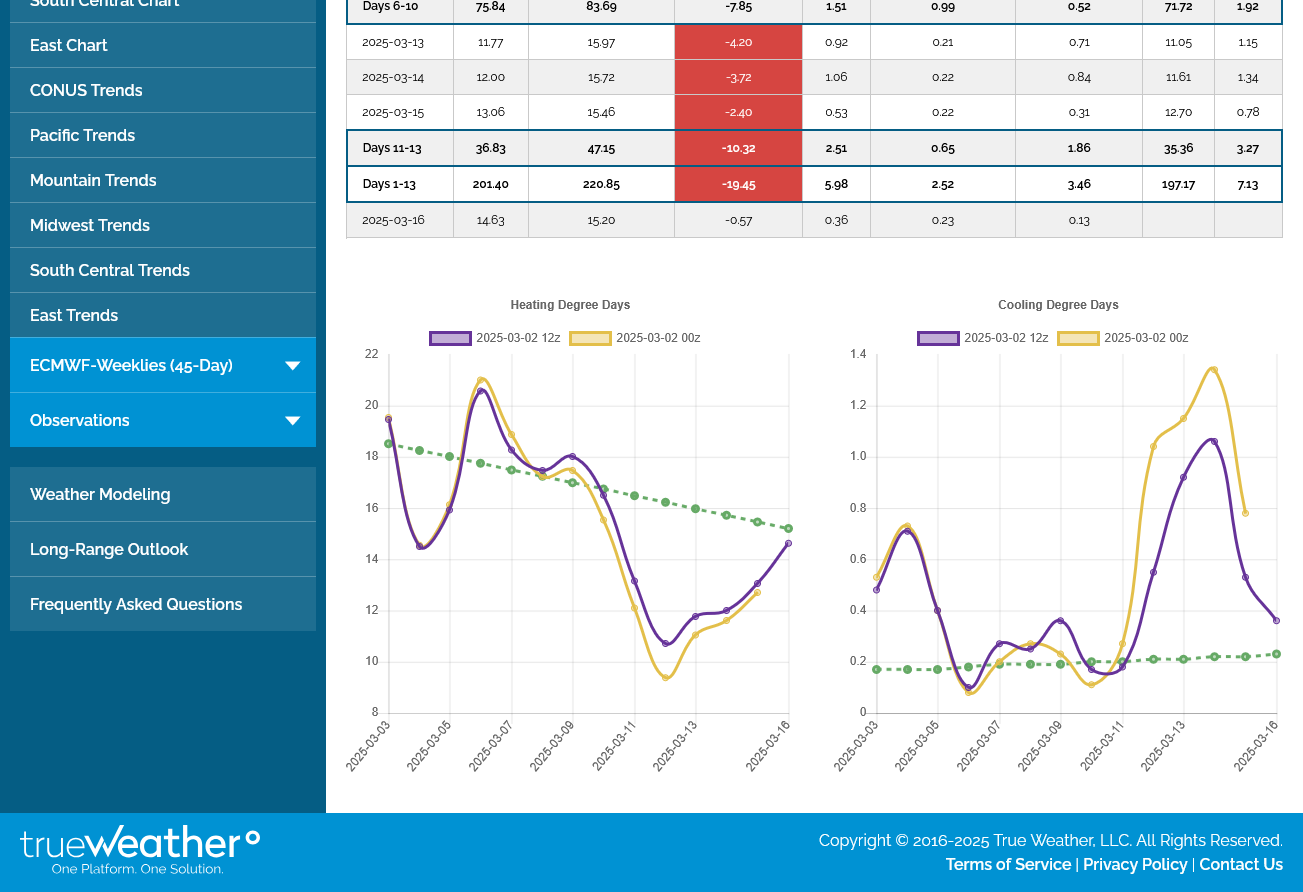
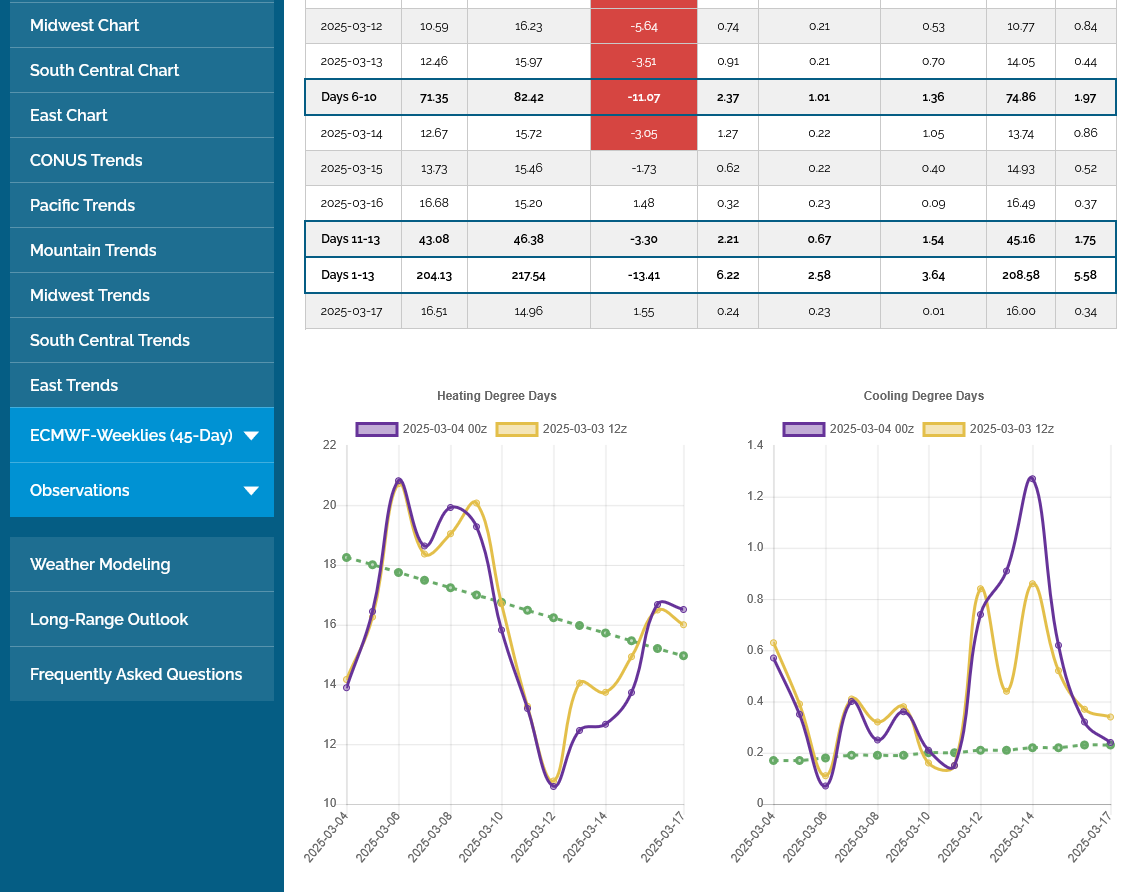
I consider it noteworthy, that at the end of the period for this and the EE, we see the HDD's plunge lower. But then we might ask: How important are HDDs in mid March, especially in a market that may be focused on refilling from below the 5 year average. This monster draw on this next EIA will be followed by another pretty big one for this time of year.
Let me illustrate the profound, milder change in the weather pattern the last several days.
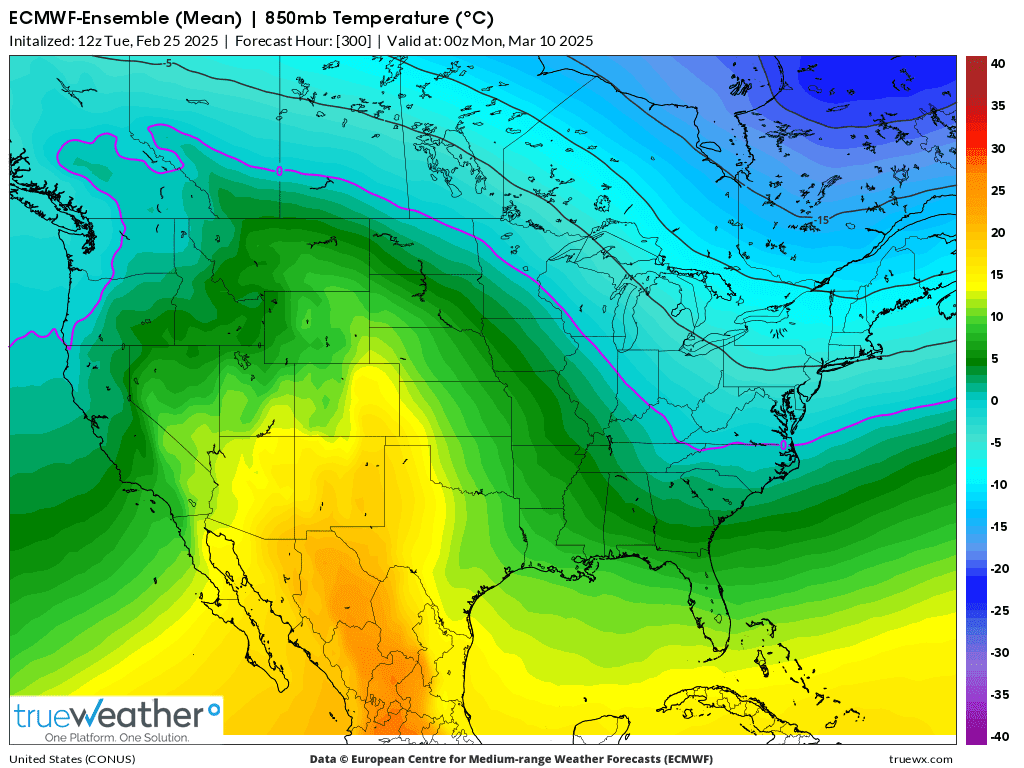
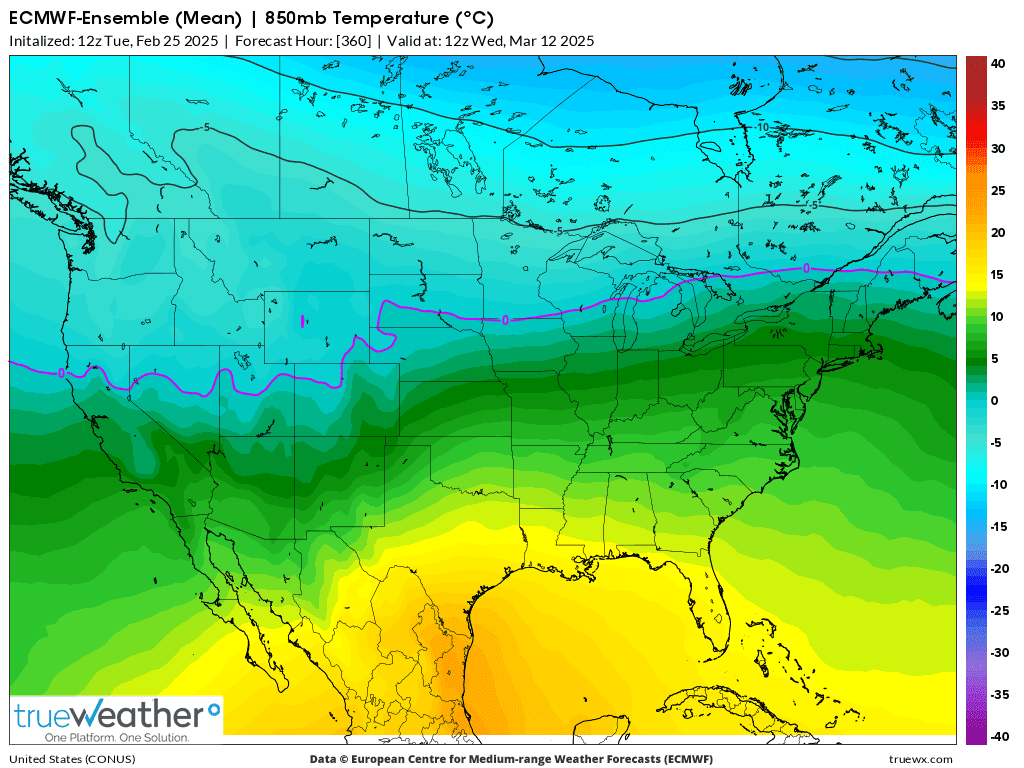
1. European Ensemble model 850 mb temperatures from 0z Saturday Night run. 360 hours-last map-MARCH 10
2. Latest EE 850 mb temps for the same time frame as #1-March 10-much milder
2. Latest EE 850 mb temps from 12z Tuesday at 360 hours-March 12-incredibly milder East and South
Mike,
I dislike DST, largely due to the models coming out an hour later. I support any Trump efforts to try to make it year-round standard time, but I hope he doesn’t push for year-round DST like they had in 1974 and had to reverse due to school children casualties due to darkness in winter when going to school. Congress has to approve any changes.
Agreed, Larry.
Everybody else gets it at the same time but if one has a weather trade on, for instance it means staying up an hour later at night to get the same stuff.
The first 4-5 days of the EIA for March 6th, for the storage data released the week after this one, will look something like this. Nothing as huge as this week but still hefty ng use in some high population centers in the southeastern half of the country.
We were in the single digits on the first couple of mornings here in sw Indiana.
https://www.cpc.ncep.noaa.gov/products/tanal/temp_analyses.php
+++++++++++
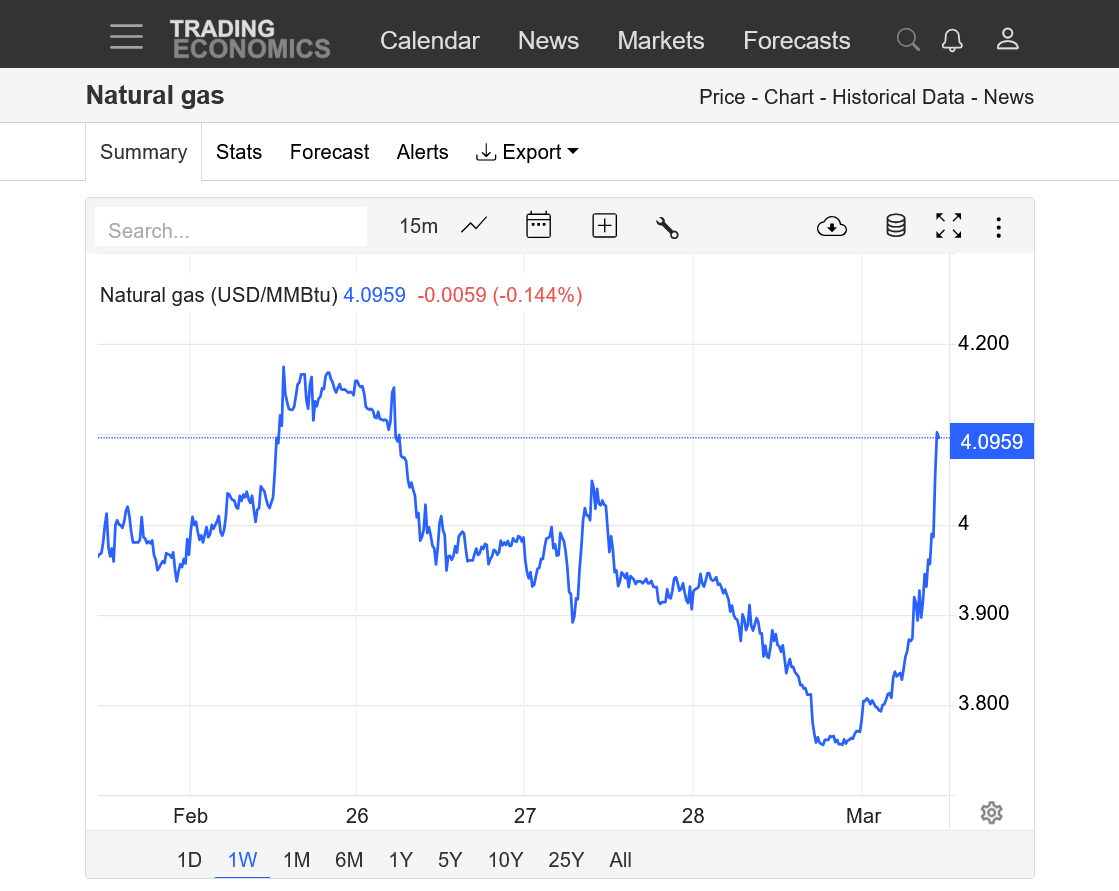
Interesting place here technically.
These charts do not show the gap lower on Sunday Night but that was filled. This is the April NG for current price on a continuation chart. Often, when they go to a new front month it will mess up the chart and look like a gap higher or lower. In this case, they are priced fairly close to each other, with the front month, March actually higher than April which is unusual, based on my memory. The front month higher than the back month is often from a BULLISH near term dynamic. There's only been 30 contracts traded in the expiring March vs 3,607 in the April, so I won't read anything into it other than usually April is quite a bit higher right now vs the March about to expire.
I will guess that after the release of the EIA number on Thursday, we might see prices drop, even if its bullish and causes an initial spike up.
https://tradingeconomics.com/commodity/natural-gas
https://centerpointsecurities.com/contango-and-backwardation/
Thanks, Mike. The GEFS once again has fewer HDDs at the start vs the EE.
Edit: NG -3% Wed AM.
Thanks, Larry!
Now that you pointed that out, I've been noticing the exact same thing too.
The 0z EE was -3 HDDs overnight. The weather pattern change is advertising about the same thing right now as it did on Sunday Night......although there are some changes. Instead of flat, zonal flow, we're developing a trough in the western half to upper tier and ridge in the southeast. This is the opposite of the ridge/west-trough/east couplet which makes it especially cold in the high population centers of the East and South.
I will guess that the expiring March contract is a part of what gave us the surprising spike up yesterday.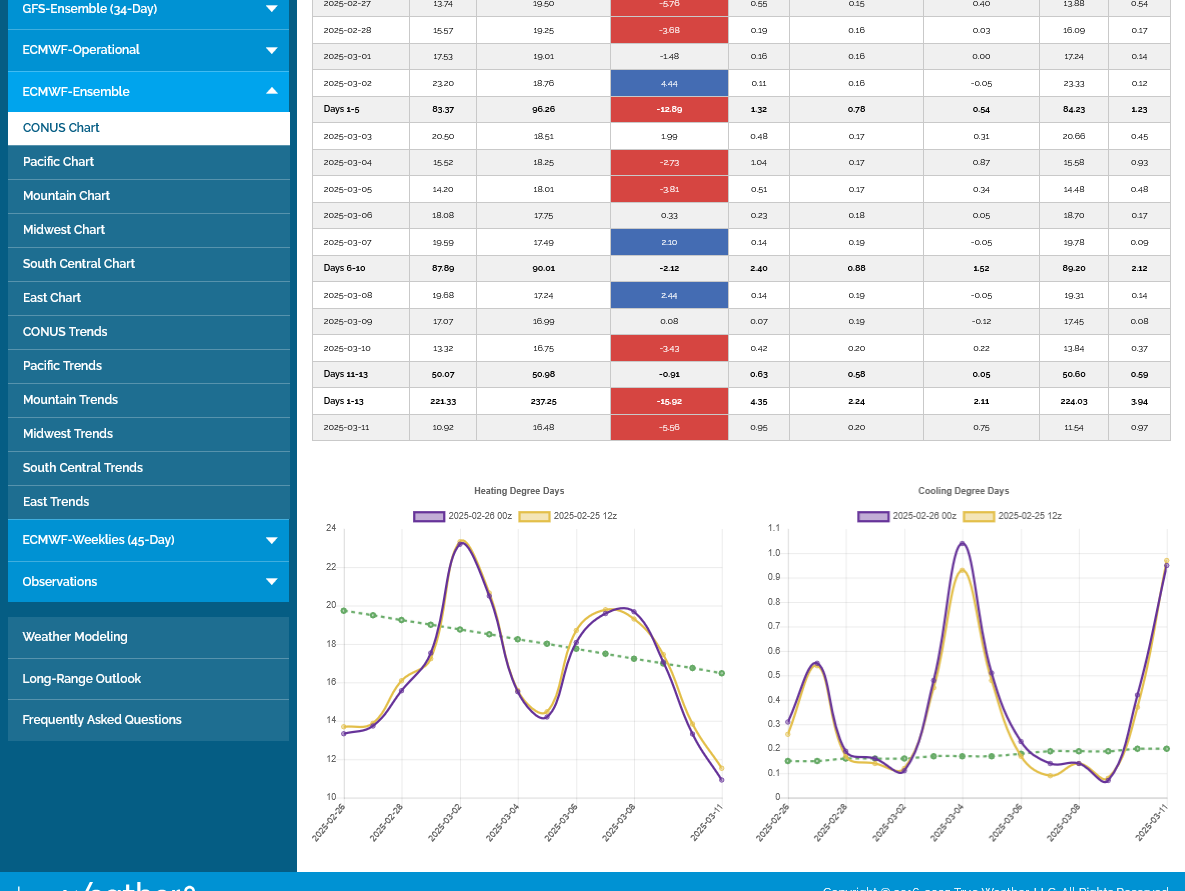
Hey Mike,
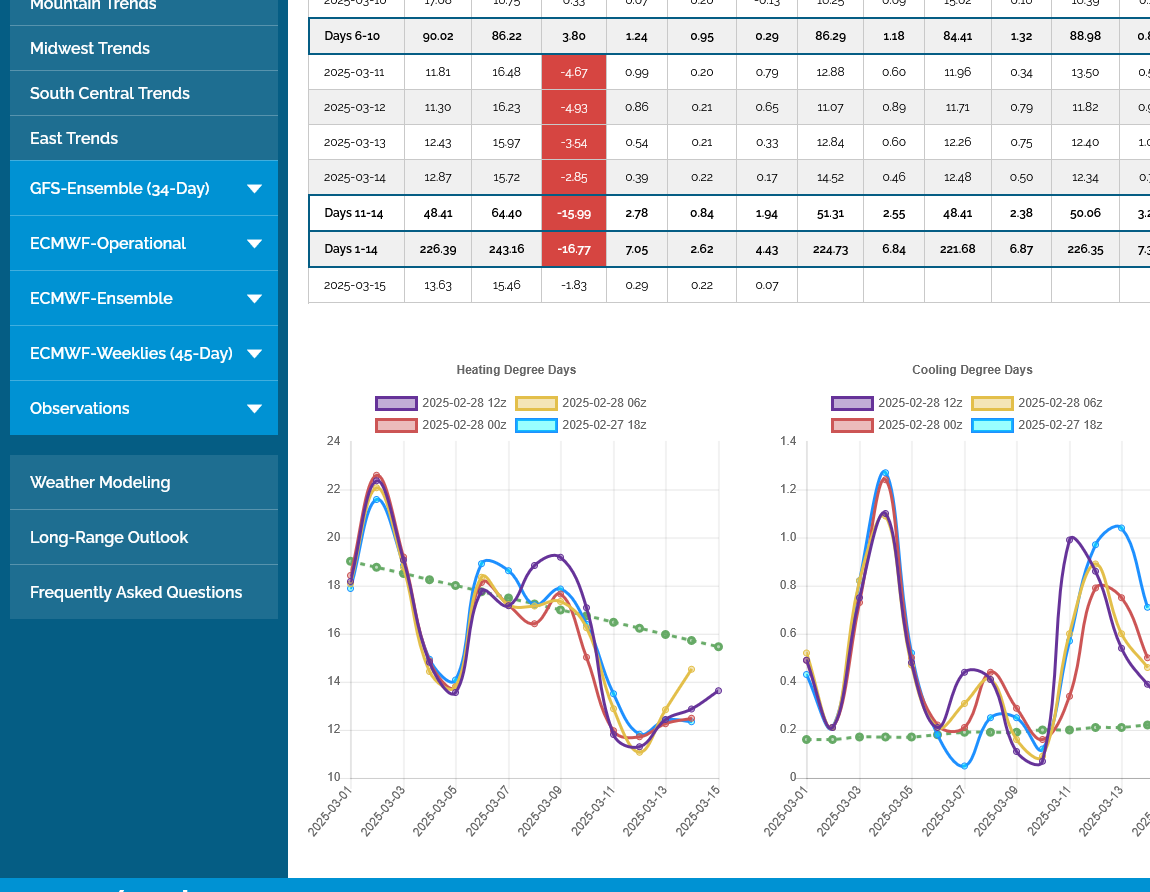
Per my eyeballs, the 0Z EE vs 12Z gained a couple of HDDs 3/2, lost a few HDDs ~3/3-5, gained a couple ~3/6, and lost a good amount 3/8-12. The net should have been a pretty decent loss mainly due to 3/8-12. Mike, what say you?
NG appears to have fallen ~1.5% from this midnight-12:33 AM CST.
Great assessment, Larry!
Ill post the graph when back in my office but the EE was -3 HDDs and that price drop that you mentioned was a very brief spike lower since we’re back higher ahead of the most bullish EIA in the record books for this particular week, late in the heating season.
We have some compelling forces tugging us in opposite directions here so I have no confidence in a price prediction but my slight bias is down because of milder weather in the East and South at the end of the forecast compared to last week but weather trading is waning for natural gas this late in the heating season And the market has known about the weather pattern change for days.
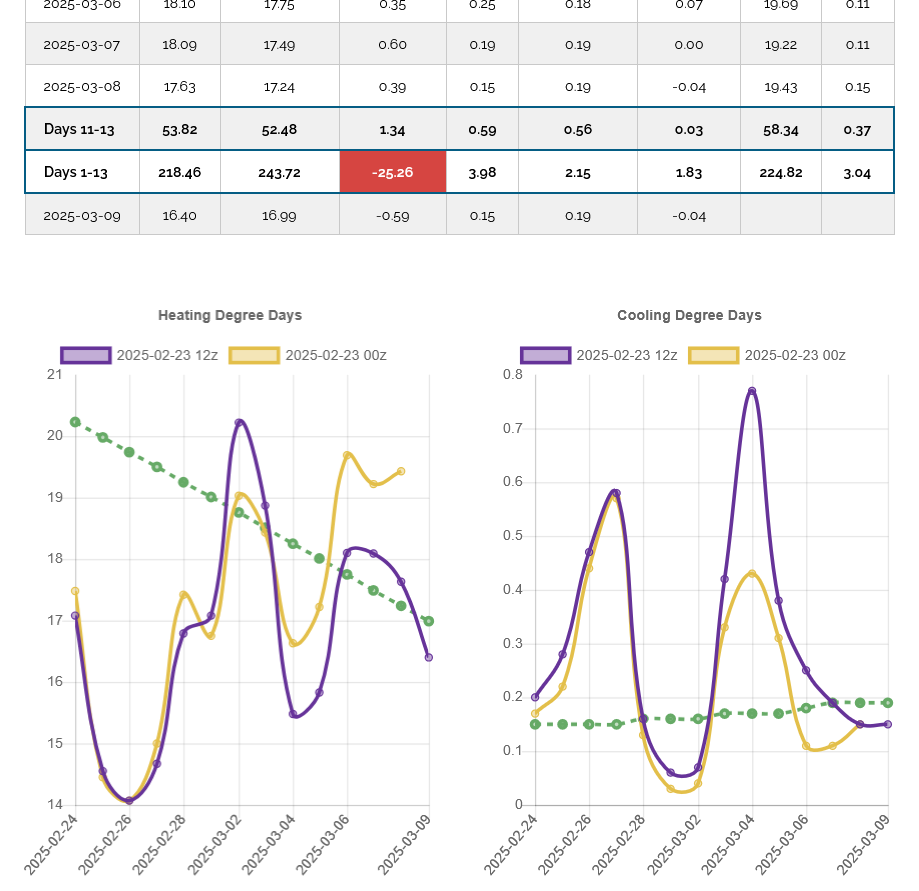
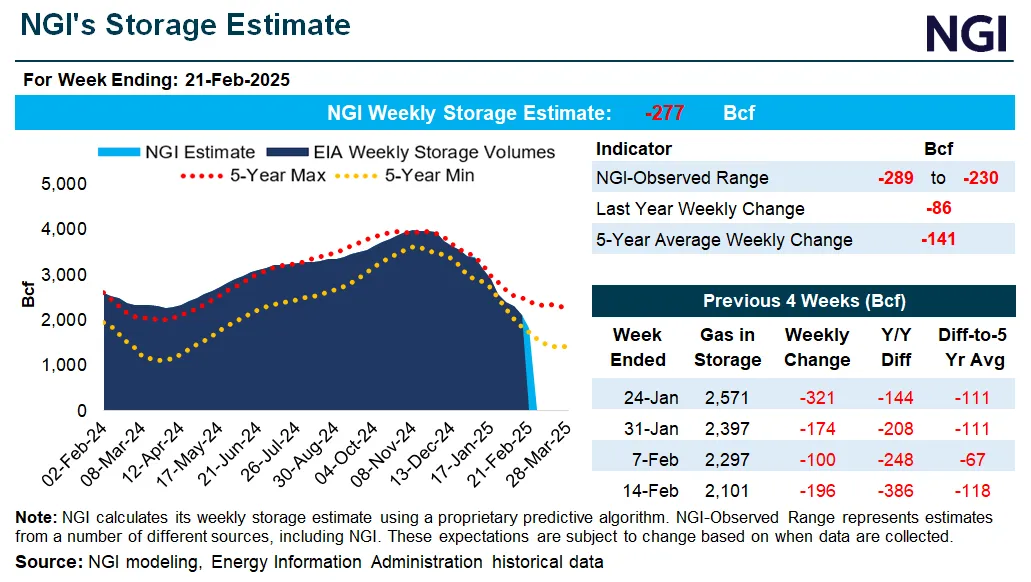
-288 Bcf. At the top of the range of guesses and bullish!
![]()
for week ending February 21, 2025 | Released: February 27, 2025 at 10:30 a.m. | Next R
| Working gas in underground storage, Lower 48 states Summary text CSV JSN | |||||||||||||||||||||||||
|---|---|---|---|---|---|---|---|---|---|---|---|---|---|---|---|---|---|---|---|---|---|---|---|---|---|
| Historical Comparisons | |||||||||||||||||||||||||
| Stocks billion cubic feet (Bcf) | Year ago (02/21/24) | 5-year average (2020-24) | |||||||||||||||||||||||
| Region | 02/21/25 | 02/14/25 | net change | implied flow | Bcf | % change | Bcf | % change | |||||||||||||||||
| East | 362 | 419 | -57 | -57 | 468 | -22.6 | 441 | -17.9 | |||||||||||||||||
| Midwest | 424 | 494 | -70 | -70 | 609 | -30.4 | 537 | -21.0 | |||||||||||||||||
| Mountain | 168 | 182 | -14 | -14 | 170 | -1.2 | 121 | 38.8 | |||||||||||||||||
| Pacific | 198 | 208 | -10 | -10 | 217 | -8.8 | 180 | 10.0 | |||||||||||||||||
| South Central | 688 | 799 | -111 | -111 | 938 | -26.7 | 798 | -13.8 | |||||||||||||||||
| Salt | 159 | 214 | -55 | -55 | 276 | -42.4 | 220 | -27.7 | |||||||||||||||||
| Nonsalt | 528 | 585 | -57 | -57 | 662 | -20.2 | 579 | -8.8 | |||||||||||||||||
| Total | 1,840 | 2,101 | -261 | -261 | 2,401 | -23.4 | 2,078 | -11.5 | |||||||||||||||||
| Totals may not equal sum of components because of independent rounding. | |||||||||||||||||||||||||
Working gas in storage was 1,840 Bcf as of Friday, February 21, 2025, according to EIA estimates. This represents a net decrease of 261 Bcf from the previous week. Stocks were 561 Bcf less than last year at this time and 238 Bcf below the five-year average of 2,078 Bcf. At 1,840 Bcf, total working gas is within the five-year historical range.
For information on sampling error in this report, see Estimated Measures of Sampling Variability table below.

Note: The shaded area indicates the range between the historical minimum and maximum values for the weekly series from 2020 through 2024. The dashed vertical lines indicate current and year-ago weekly periods.
The weather is actually slightly cooler/less bearish but it doesn't matter with a market sending out a strong topping formation signal and plenty of traders willing to sell today.
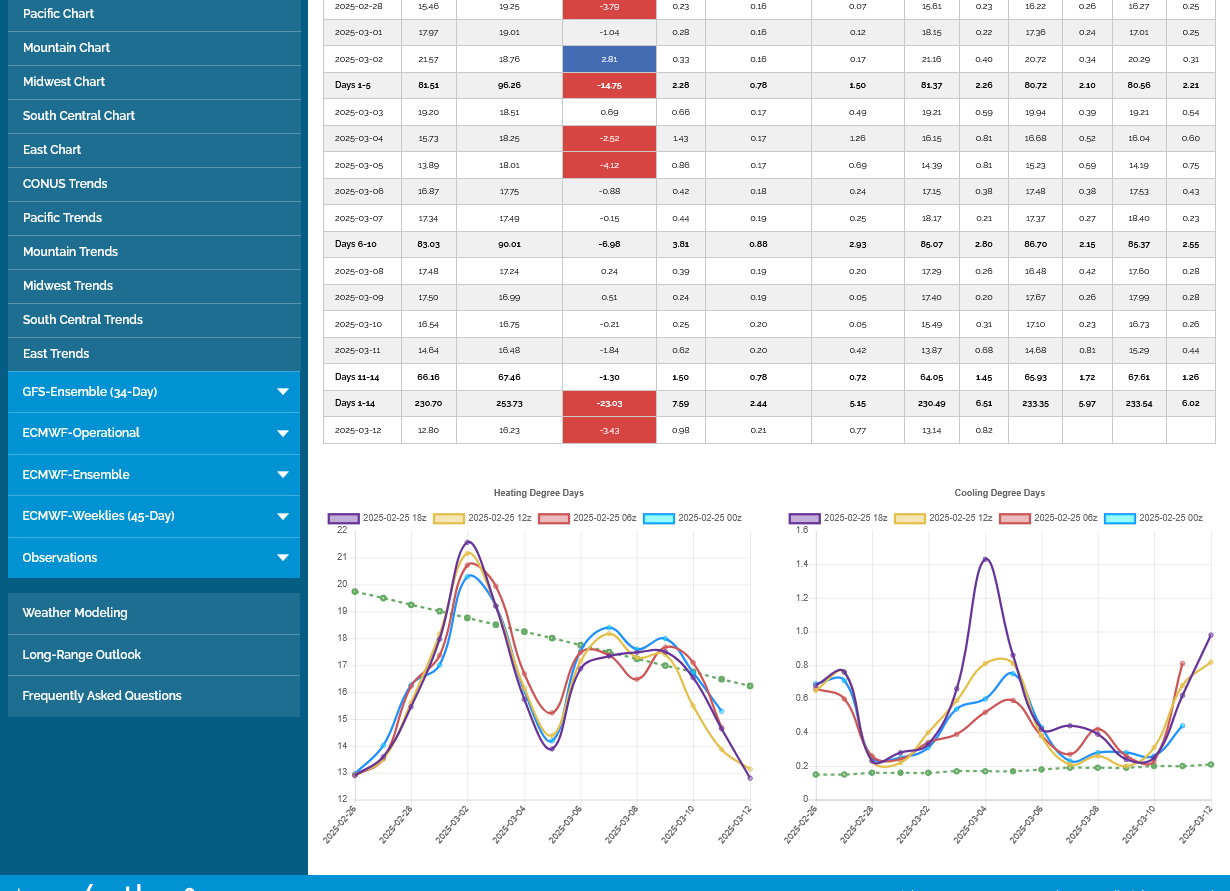
The last 12z GEFS is in purple. HDDs on the left below. The rapidly falling green dashed one shows how fast the end of the heating season is coming. We are below that line the last 5 days of the forecast but possibly morphing up to closer the average at the end with some colder indications. The cold will hit the West, then Midwest first in week 2.
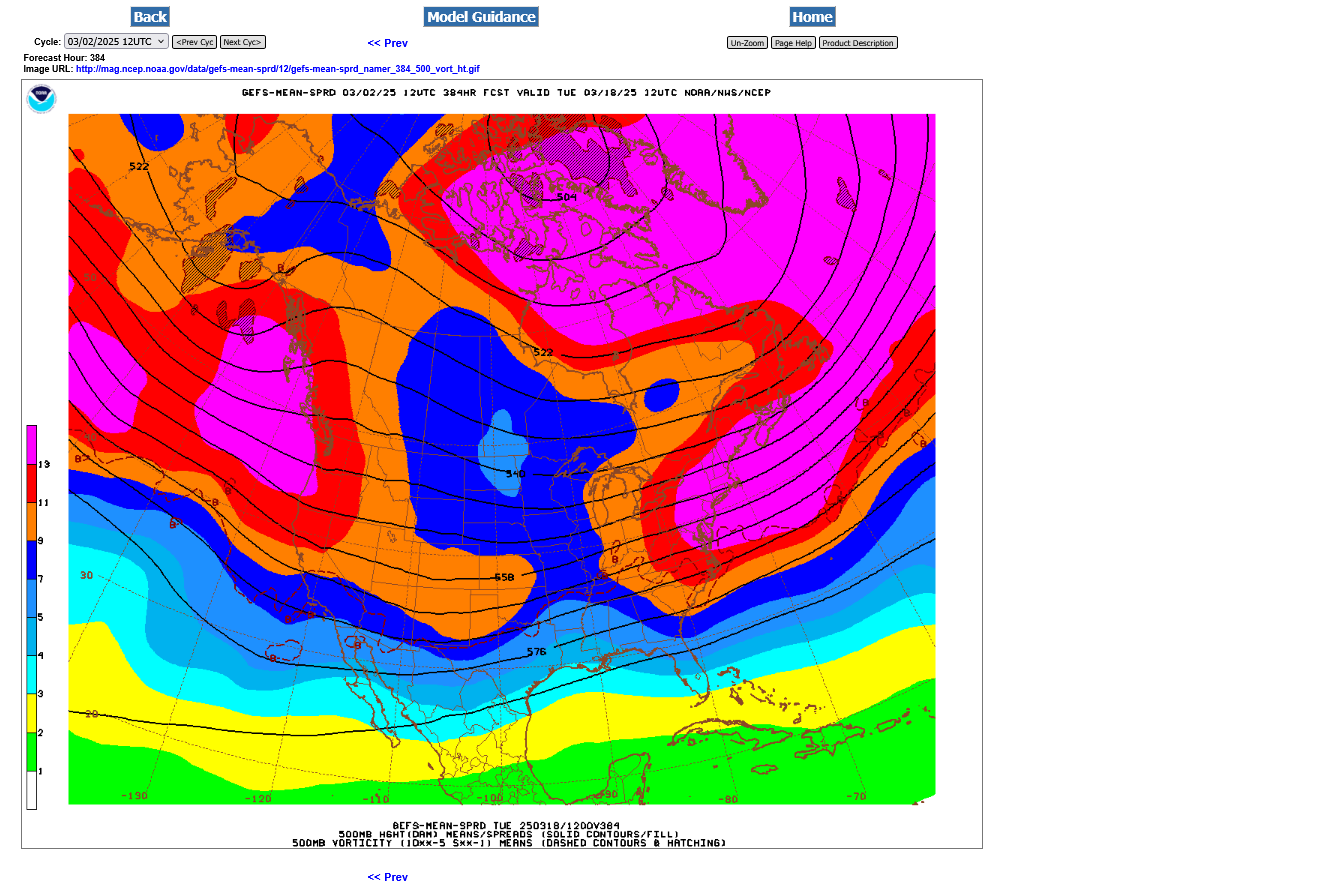
Last GEFS at 384 hours:
Cross polar flow showing up again (which has dominated much of Winter) but mostly undercut by milder Pacific flow.
West to East, mild zonal flow across the country. The last 12z GEFS at 384 hours below:
The last 12z European Ensemble below: HDDS on the left. Last run in purple.
It's a bit colder (less mild) than the GEFS. They both cool things off a bit, close to average at the end of the end of the period after a very mild week 2!
It's March.
The main weather trading season is long gone. Extreme cold could potentially still have impact this late in the year but even then, it's not like cold in December/January when big money likes to speculate on weather.
There is no extreme cold in this forecast.
Probably a bit lower on the open. We closed very near the lows for the day and week, so that would be a gap lower.
We got the small gap lower on Sunday Evening that was FILLED overnight, with the last 0z European Ensemble model coming in with +9 HDDs!
Purple line on the left.
Technically, this is a gap and crap, selling exhaustion formation, (which usually means higher prices).
These were the temps for this Thursday's EIA storage report:
https://www.cpc.ncep.noaa.gov/products/tanal/temp_analyses.php
Good morning Forum
MetMike:
From a traders perspective, the gap and crap suggests a change in trend, correct? Thus one would want to get long, correct?
To me, this current cycle in gas is too short. Gas needs more time to fulfill its time requirement.
So, does one look to sell this gap and crap, or 'rely' upon it as a change in trend?
Nice puzzle so early in the week!!
Thanks, tjc,
I understand exactly what you're saying on the timing. The drop last week was so brief that it made a buying set up seem premature.
However, a very bullish market, with buyers anxious to jump in quickly doesn't give the chance to sellers to bring that timing objective on price charts to fruition.
Seasonals in March turn strongly positive and I've said for 2 decades, don't sell natural gas in March without a dang compelling reason.
Todays move up is extremely impressive!
https://charts.equityclock.com/natural-gas-futures-ng-seasonal-chart
++++++++++
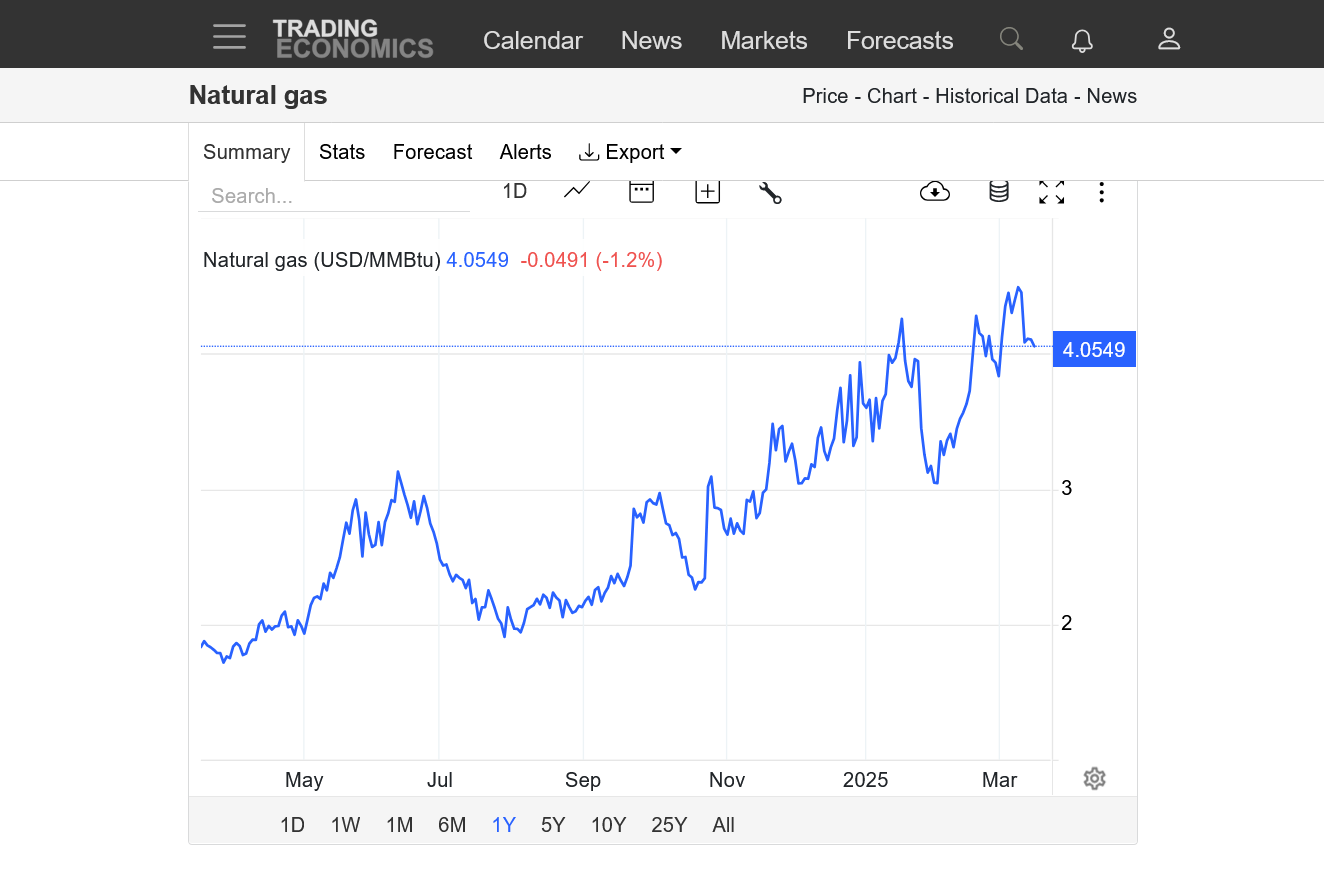
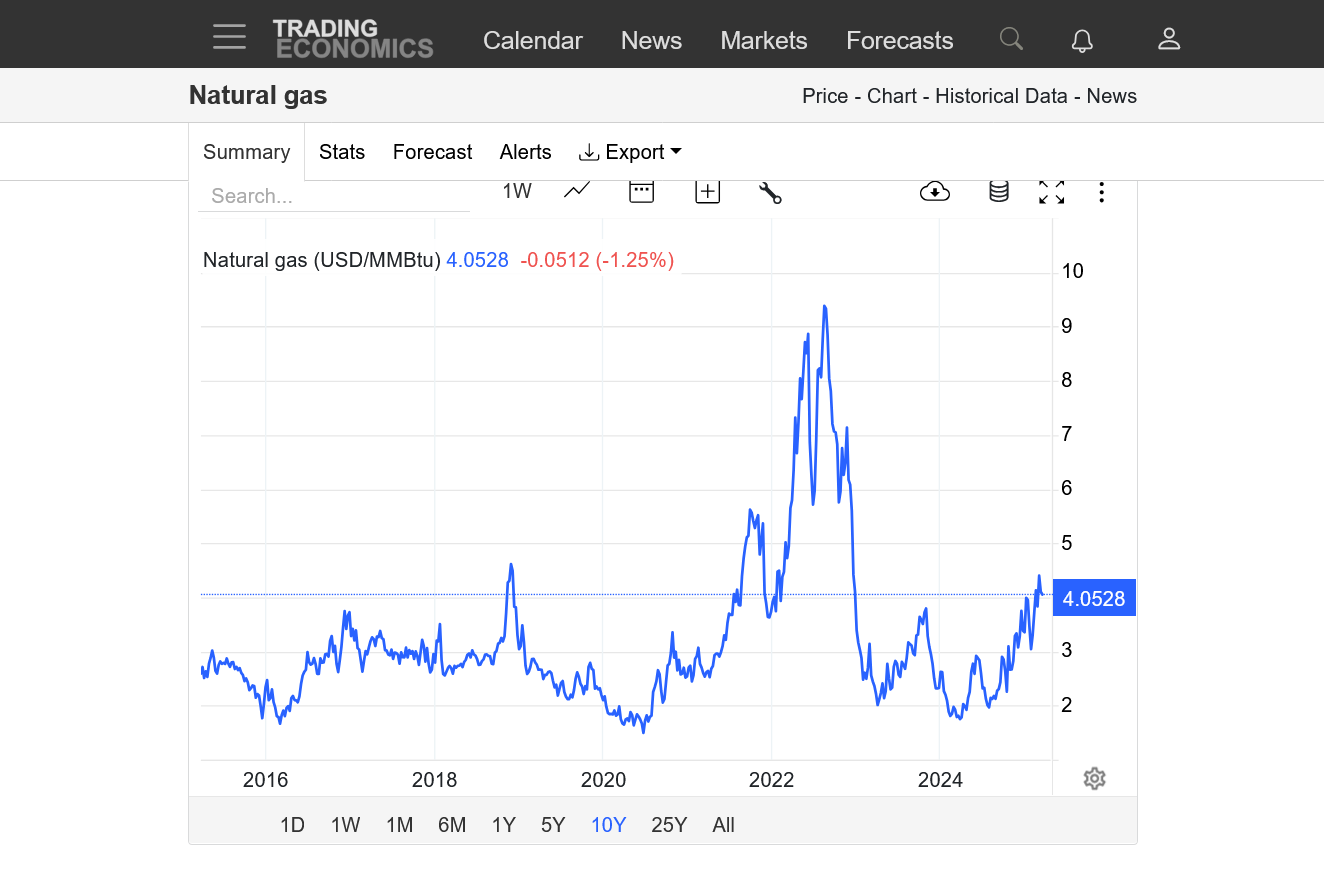
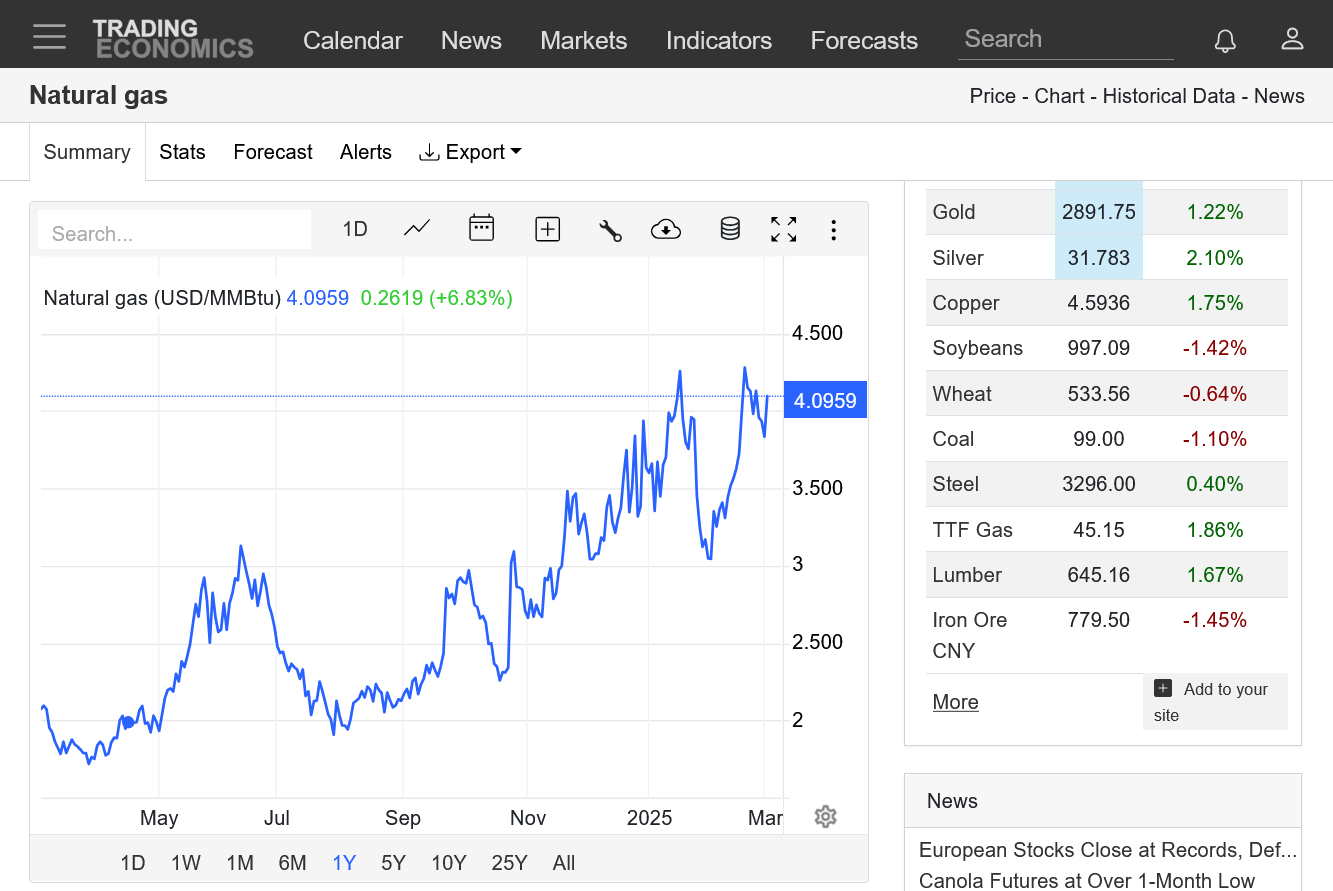
1. 1 week-gap lower last evening(doesn't show) then reversal up early this morning
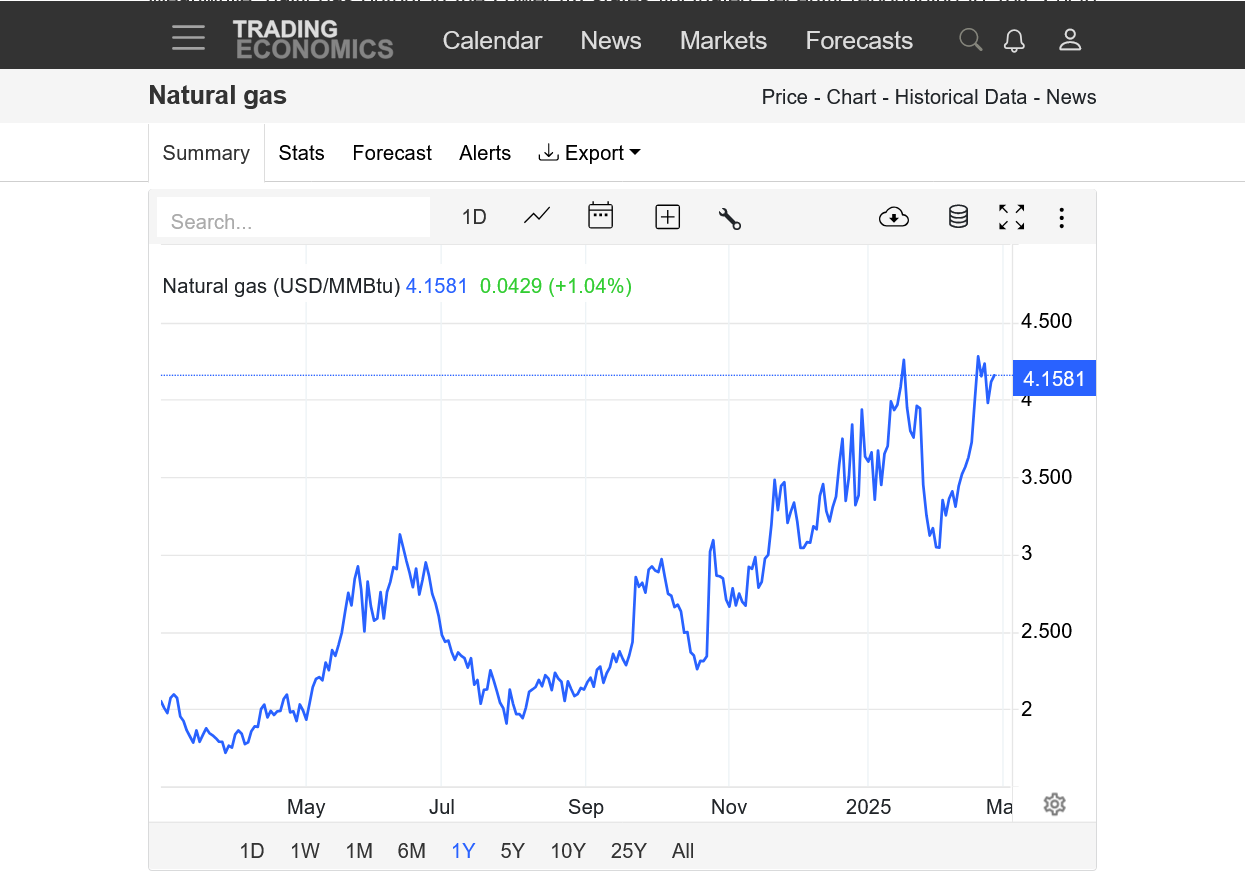
2. 1 year-powerful uptrend from our cold Winter, huge demand and a big drawdown in storage during a time(Winter) when prices normally drop)
3. 10 years- definitive upside break out! Again, from the erosion in storage. The market needs higher prices to provide incentive to increase production in order to refill storage ahead of next years heating season!
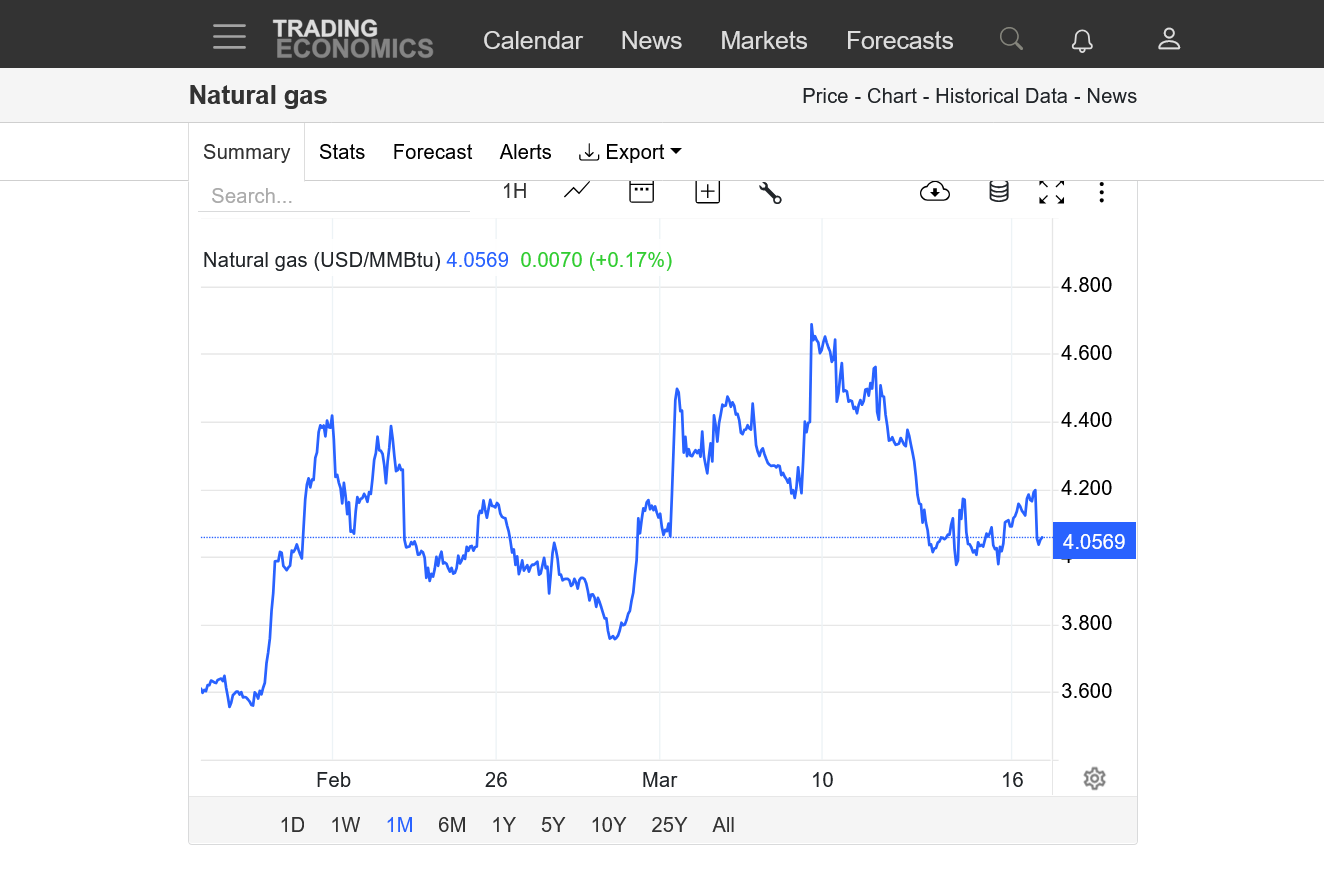
https://tradingeconomics.com/commodity/natural-gas
MetMike
Thank you for reply.
My timing was for next week to get long on at much lower level.
Definitely NOT going to short into HUGE DAILY KEY REVERSAL.
YW!
I hear you!
Extremely impressive reversal up today. One would think we will take out recemt highs
Check out this huge change in the Euro Weeklies at 500 mb over the Arctic/Greenland for Mar 17-23 over just the last 3 days of runs:
3 days ago (Fri 2/28 run) for 3/17-23: solid +AO/+NAO (blue up there):

On that Fri run the lowest mean wind at 60N/10mb (Stratospheric winds (mean) at 60N latitude) was only down to near zero:
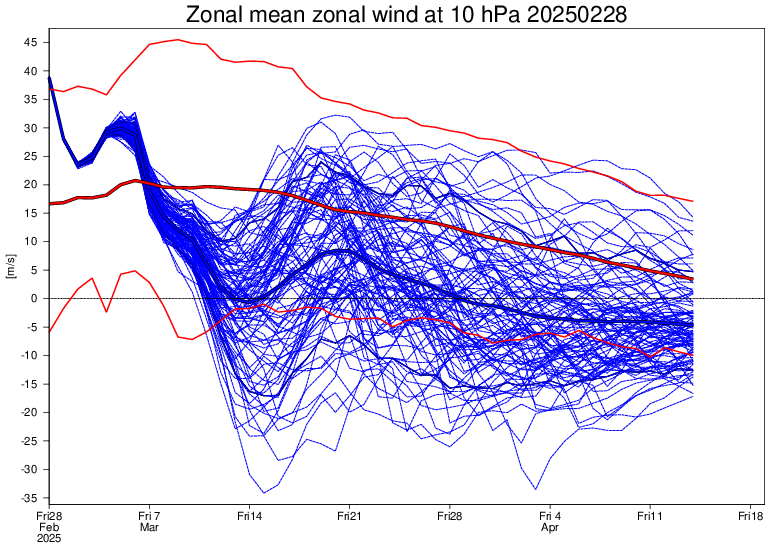
Today’s 500 mb run for 3/17-23: pretty neutral AO/NAO, which is a bullish change from +AO/NAO

Today’s min zonal strat wind is way down to -20:

The stratospheric reversal and increased 500 mb hts over the Arctic are likely related. I believe that today’s huge NG rise is partially related to this change since Friday.
Thanks, Larry!
Great maps and post.
The extended forecasts are still pretty bearish and todays huge reversal up had only a small amount to do with weather during a time frame when the price almost always goes up as heating demand plunges lower(as its forecast to do this March).
https://www.marketforum.com/forum/topic/83844/#83856
When was the last time the market was +3,000/contract during the heating season from extended weather with a forecast like this? How about..........NEVER because it mostly wasn't from the weather forecast. Being less mild/cooler for sure could have added a bit but there isn't even enough time left in the heating season to make that much difference.
https://www.marketforum.com/forum/topic/83844/#83852
++++++++++
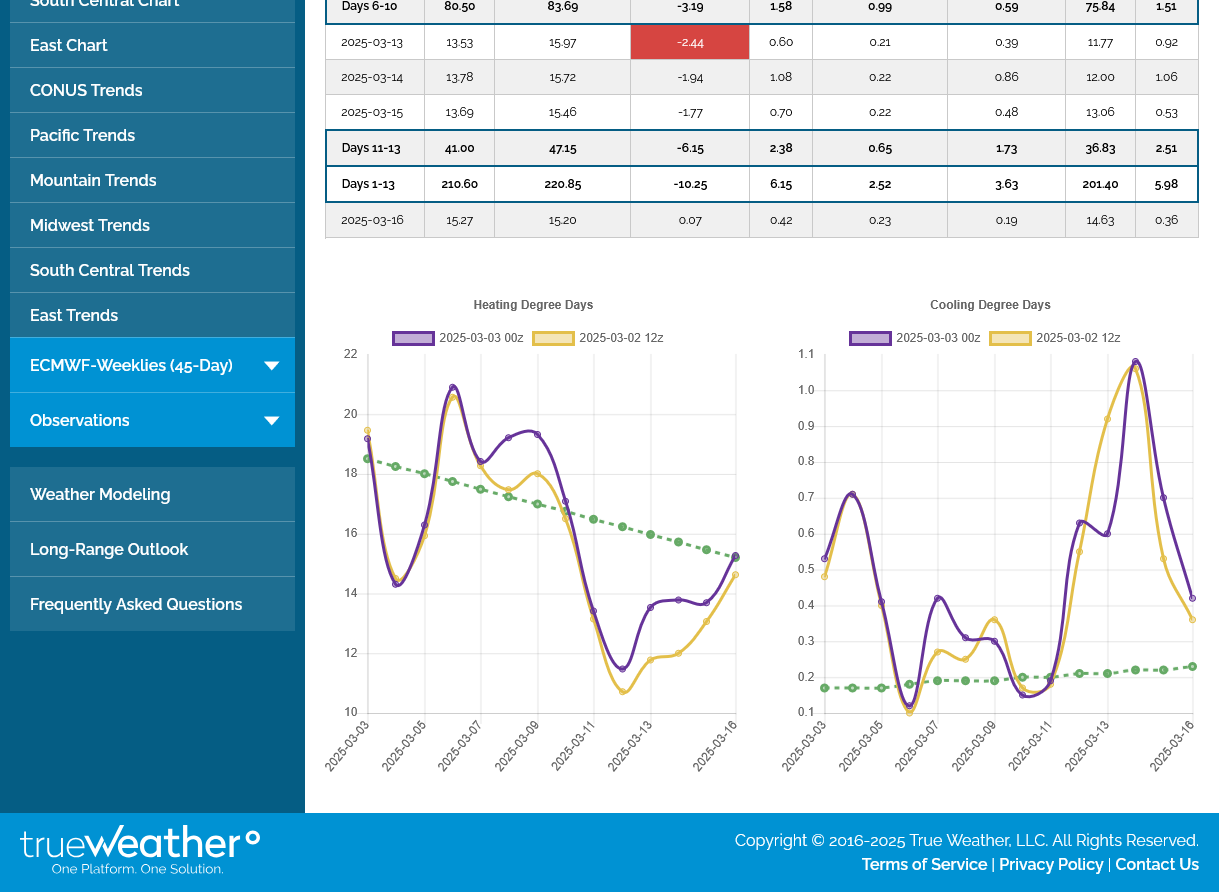
This was the last 12z European model Ensemble. Another +2 HDDs vs the previous run that was +9 HDDs, which brings the purple line to just above the fast falling dashed green line of the graph to the left at the end of the period.
Did the HDDs climbing to average in mid March cause the price to go up $3,000? It probably helped but absent that change, maybe the price would have only gone up $2,000+? Who knows. The big traders using weather are not even interested in speculating on natural gas any more this time of year.
They are VERY interested in being long though BECAUSE ITS MARCH and natural gas almost ALWAYS goes up in March/April/May.
The optimal seasonal trade date to take advantage of this seasonal is right now in the first part of March and hold into May for many seasonal trading systems. Today was a great buy date on many of these seasonal trading system algorithms. The lower the storage is, the earlier the buy date.
Last years mild Winter and record storage DELAYED the seasonal until April.
https://charts.equityclock.com/natural-gas-futures-ng-seasonal-chart
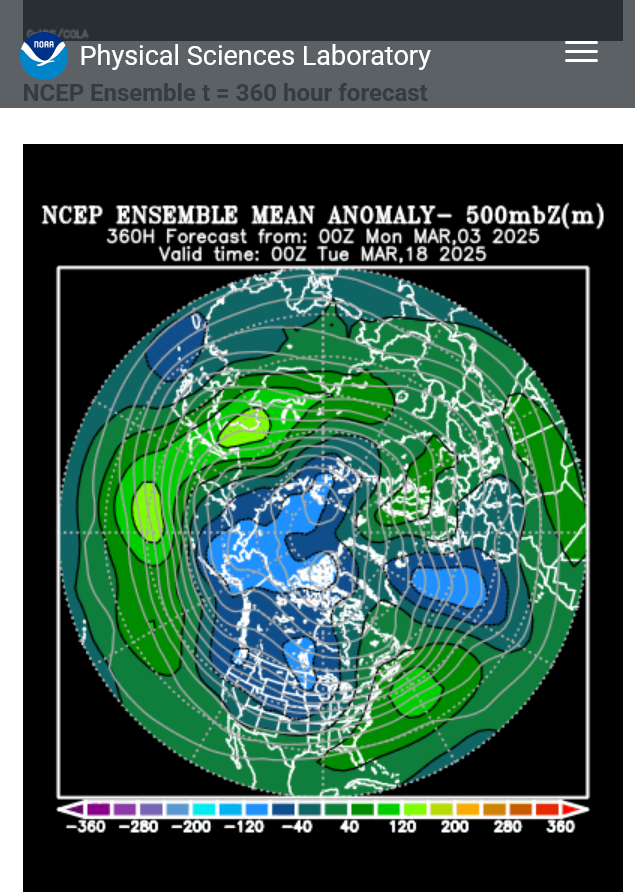
This was also the forecast 500mb heights for the next 2 weeks.
The Stratosphere, with its SSW event and displacement south of the polar vortex is not aligned vertically with the Troposphere.
Just the opposite in the East as an upper level ridge and very mild temps dominate the troposphere. This is the last map, freeze frame, then the latest below that which will will be updated daily.
Maybe the models are not recognizing and forecasting the significance of the wind reversal in the stratosphere yet, down in the troposphere??
Maybe it will get MUCH colder tomorrow?
https://www.marketforum.com/forum/topic/83844/#83852
I went back and tried to pick out the strong seasonal, late Winter lows the past 9 years below.
The optimal seasonal trade date to take advantage of this seasonal is right now in the first part of March and hold into May for many seasonal trading systems. Today was a great buy date on many of these seasonal trading system algorithms. The lower the storage is, the earlier the buy date.
Maybe traders that KNEW they were going to go long, decided to use the cooler forecast to pull the trigger?
Also, when we closed the gap lower early this morning, that by itself was a selling exhaustion signal (gap and crap) as mentioned above which was an Additional technical reinforcing indicator. I think that traders wanting to buy on the bullish market and positive seasonal were seeing buy signals on their screens and all jumped in. The volume today was very impressive for just the April contract. Over 209,000!
https://charts.equityclock.com/natural-gas-futures-ng-seasonal-chart
Here are some seasonal lows below.
Its tough to see on this graph below but this is roughly what I got, probably with some small errors.
1. 2025 = March 3??? =STRONG BULL market=there was no real low this heating season
2. 2024 = March 24 = BEAR market
3. 2023 = April 3= Bear market
4. 2022 = December 20, 2021 EXTREME BULL MARKET
5. 2021 = April 5=BULL market
6. 2020 = failed = June 22 = COVID
7. 2019 = failed = BEAR market
8. 2018 = February 19 = BULL market
9. 2017 = February 20
10. 2016 = March 7
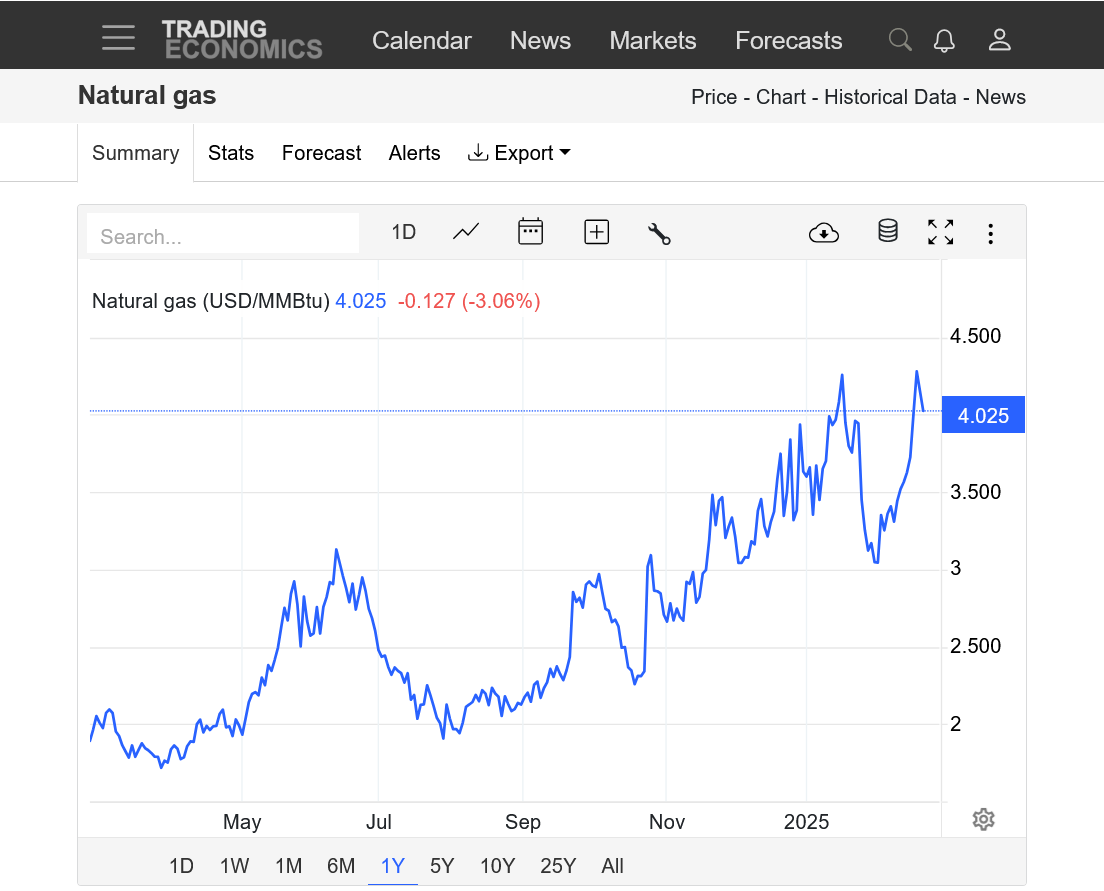
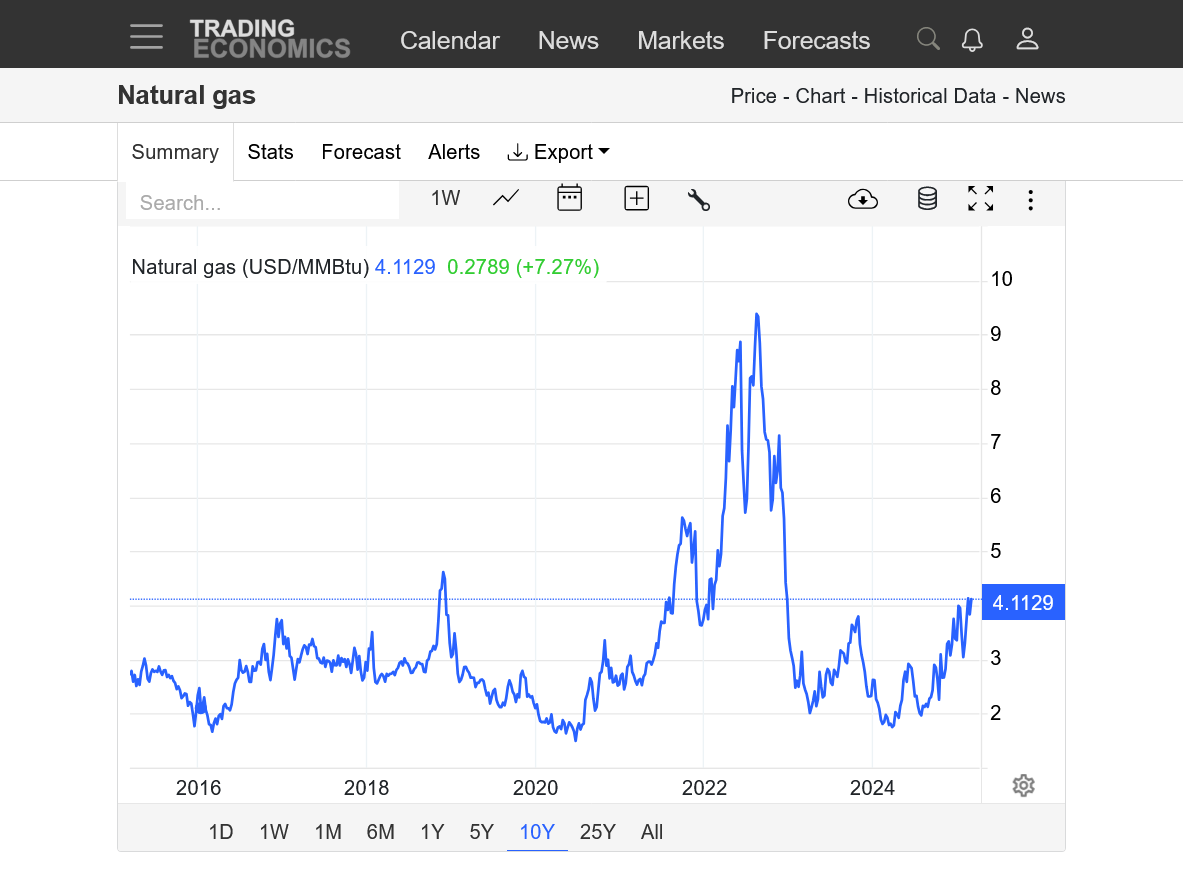
https://tradingeconomics.com/commodity/natural-gas
So during the last 10 years, being long in this time frame thru May made money 8 times.
The OPTIMAL entry dates/exact lows (which are impossible to pick) ranged from late Feb to early April.
The 2 failed years, 2019 and 2020 were VERY bearish years and 2020 was a fluke because of COVID.
Could it have to do Fri’s failed Trump-Zelensky agreement?
Larry,
What would be the connection to that?
Thanks
More instability in Europe without an agreement vs if they had signed one??
I'm still puzzled how there would be a connection to the price of natural gas from that.
If anything, it would reduce ng exports to Europe and be bearish but I don't see that at all.
Added: Sounds more like a blame everything on Trump, no matter what it is explanation which is what the MSM is dialing into their reporting.
Unfortunately, this is only getting worse.
Wild trading overnight with ng down, fairly sharply thru very early morning, then ROARING back.
The 0z European Ensemble was -4 HDDs but again, a forecast for mid March, at the end of Winter of near normal temperatures is NOT a big market moving item for natural gas.
No sign of the polar vortex in our neck of the woods.
0z GEFS last map for 500 mb(384 hours). Zonal, west to east flow. Troposphere polar vortex way up in the high Arctic.
Arctic air is all undercut by the mild Pacific Origin jet steam spreading across the country.
NG ROARING even higher.
+$3,600/contract on top of yesterdays massive gains!!!
From yesterdays low, we're up more than $7,000/contract!!
Volume is even higher than Monday. Now at 224,000+ at just before 11am, make that 226,000!!!!! for just the April contract. WOW! Make that 227,000!!!!!
Huge upside breakout!!!!!
https://tradingeconomics.com/commodity/natural-gas
There must be some profound underlying cause related either to a big drop in production or a big increase in supplies or both.
Mike said:
“There must be some profound underlying cause related either to a big drop in production or a big increase in supplies or both.”
———-
Hey Mike,
Someone on the AmericanWx BB told me he thinks the sharp 2 day rise is due to the new tariffs on NG imported from Canada.
I was confused. So, I asked him this:
“The US imports from Canada 8 bcf/day and this is tariffed 35% (10% extra for energy imports). The US produces ~104 bcf/day. Total is 112. So, Canadian imports represents only 7% of what supplies the US. Are you saying that the 35% Canadian tariffs on a mere 7% of what supplies us have been the main reason the price has risen 15% the last 2 days? TIA”
He gave me a thumbs up to this.
However, I also saw this regarding yesterday’s NG rise:
March 3 (Reuters) - U.S. natural gas futures jumped about 8% on Monday on record flows to liquefied natural gas (LNG) export plants and forecasts for higher demand over the next two weeks than previously expected.
Traders said U.S. gas prices also gained support from reports Germany was not in talks with Russia over a "possible pipeline-based supply of Russian gas" via the partly damaged Nord Stream 2pipeline. That means Germany and the rest of Europe will likely continue to import massive amounts of U.S. LNG.
Great stuff, Larry!
So the higher prices are actually from Joe Biden blowing up Russia's Nordstream pipeline which continues to elevate demand for US natural gas to replace it, especially in Germany.
NORD STREAM ~ RUSSIA ~ ETC,
35 responses |
Started by 12345 - Feb. 8, 2023, 8:26 p.m.
Volume yesterday in just the April front month was 251,000+!
0z EE, purple/left was -7 HDDs overnight(bearish) but NG won't go down because its not up from weather!
HOLY COW!
That was pretty insane. A small gap higher followed by a massive spike to limit up +$5,000/contract in the April!
Now back to mid range and over 10,000 contracts trading in just over 20 minutes.
Looks like the spike was so extreme that this chart couldn't catch it?
I show the high as 4.901. Is that correct?
Looks like we closed part of the daily gap higher as we’re pretty close to the lows of the session but have bounced off the top of the gap.
Have no idea what caused the insane open on sunday evening but its a major gap and crap if/when we completely close the gap.
Weather is no longer a major player for price determination in natural gas.......until we get into the main cooling season. Natural gas is burned to generate electricity used for air conditioning.
Note the blue line on the graph below. We went from ABOVE the 5 year range to start the heating season on November to the BOTTOM of the 5 year range here in March. This was entirely from the COLD Winter in the US high population centers that massively increased the residential demand/use for natural gas to heat home.
A slowing economy WILL reduce industrial demand for natural gas and could be the reason for natural gas to have put in the topping formation this week.
![]()
for week ending March 7, 2025 | Released: March 13, 2025 at 10:30 a.m. | Next Release: March 20, 2025
| Working gas in underground storage, Lower 48 states Summary text CSV JSN | |||||||||||||||||||||||||
|---|---|---|---|---|---|---|---|---|---|---|---|---|---|---|---|---|---|---|---|---|---|---|---|---|---|
| Historical Comparisons | |||||||||||||||||||||||||
| Stocks billion cubic feet (Bcf) | Year ago (03/07/24) | 5-year average (2020-24) | |||||||||||||||||||||||
| Region | 03/07/25 | 02/28/25 | net change | implied flow | Bcf | % change | Bcf | % change | |||||||||||||||||
| East | 307 | 340 | -33 | -33 | 413 | -25.7 | 378 | -18.8 | |||||||||||||||||
| Midwest | 370 | 396 | -26 | -26 | 563 | -34.3 | 476 | -22.3 | |||||||||||||||||
| Mountain | 165 | 166 | -1 | -1 | 167 | -1.2 | 111 | 48.6 | |||||||||||||||||
| Pacific | 196 | 199 | -3 | -3 | 214 | -8.4 | 170 | 15.3 | |||||||||||||||||
| South Central | 660 | 658 | 2 | 2 | 969 | -31.9 | 793 | -16.8 | |||||||||||||||||
| Salt | 161 | 150 | 11 | 11 | 293 | -45.1 | 226 | -28.8 | |||||||||||||||||
| Nonsalt | 499 | 509 | -10 | -10 | 676 | -26.2 | 567 | -12.0 | |||||||||||||||||
| Total | 1,698 | 1,760 | -62 | -62 | 2,326 | -27.0 | 1,928 | -11.9 | |||||||||||||||||
| Totals may not equal sum of components because of independent rounding. | |||||||||||||||||||||||||
Working gas in storage was 1,698 Bcf as of Friday, March 7, 2025, according to EIA estimates. This represents a net decrease of 62 Bcf from the previous week. Stocks were 628 Bcf less than last year at this time and 230 Bcf below the five-year average of 1,928 Bcf. At 1,698 Bcf, total working gas is within the five-year historical range.
For information on sampling error in this report, see Estimated Measures of Sampling Variability table below.
Note: The shaded area indicates the range between the historical minimum and maximum values for the weekly series from 2020 through 2024. The dashed vertical lines indicate current and year-ago weekly periods.
Huge gap and crap. Gap higher Sunday night, that was filled which was a strong buying exhaustion/top formation/signal. As mentioned on the previous page, a recession would greatly cut industrial demand and cause lower prices. The weather in the current price is the result of our COLD Winter that cut into storage, taking it from near record high to well below average. That ALREADY HAPPENED.
Weather WILL become a factor again but not until sustained heat is in the forecast which will gobble up natural gas for residential cooling. It wouldn't be impossible for extreme, long lasting early heat in April to actually do this but May would be a more likely time frame to start it. However, seasonals peak around the time the cooling degree season starts.
https://tradingeconomics.com/commodity/natural-gas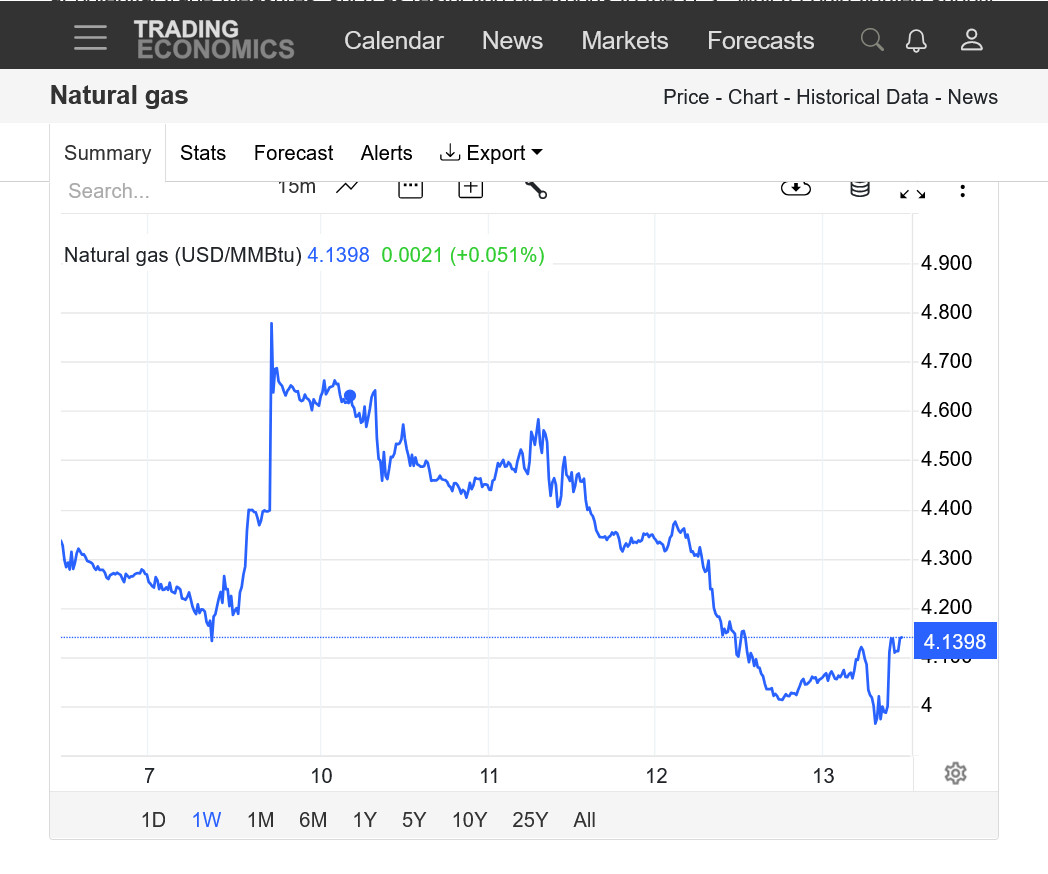

Natural gas futures edged higher in early trading on Monday amid forecasts of scattered cold later this week, but the mini rally quickly fizzled.
++++++++++++++
Weather is NOT a factor here!
1. 1 month-Major short term top! Strong support just under $4.
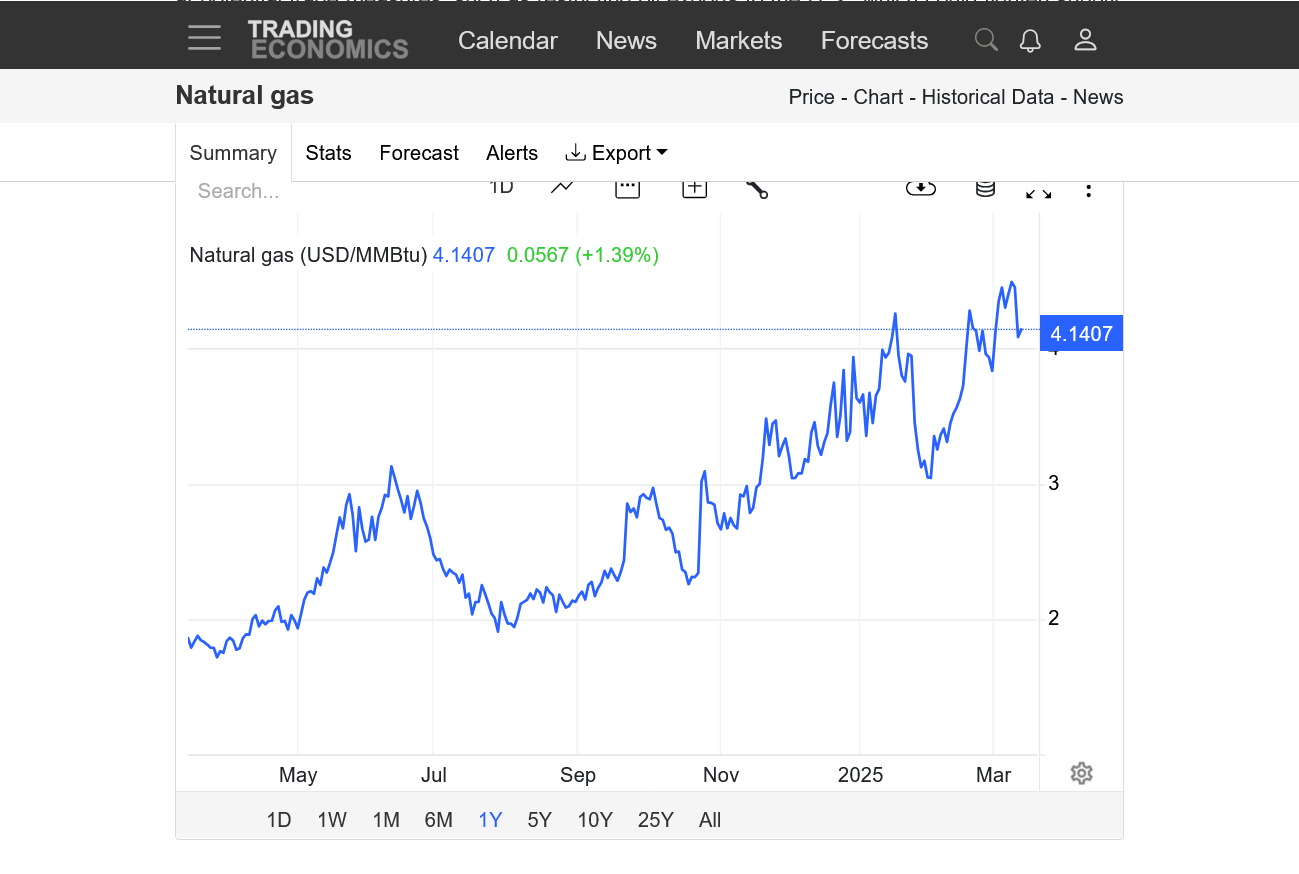
2. 1 year-uptrend still solid and not violated!
3. 10 years-Huge upside break out!
https://tradingeconomics.com/commodity/natural-gas