Previous thread:
NG 2/23/25+
49 responses |
Started by WxFollower - Feb. 23, 2025, 11:35 p.m.
EIA report, first injection of the season, earlier than average by a bit. The seasonal bottom is usually when we reached the dashed vertical line on the graph below. From eyeballing the chart, that looks to be in a week or so and the bottom is usually different each year, so not a big deal.
Weather and residential demand for heating/cooling via burning natural gas for electricity is NOT a major factor for price determination here. It's too late in the heating season(absent widespread, long lasting much below average temps) and MUCH too early in the cooling season.
A recession WILL cut back on industrial demand, however. There are other important factors too (exports and production).
![]()
for week ending March 14, 2025 | Released: March 20, 2025 at 10:30 a.m. | Next Release: March 27, 2025
| Working gas in underground storage, Lower 48 states Summary text CSV JSN | |||||||||||||||||||||||||
|---|---|---|---|---|---|---|---|---|---|---|---|---|---|---|---|---|---|---|---|---|---|---|---|---|---|
| Historical Comparisons | |||||||||||||||||||||||||
| Stocks billion cubic feet (Bcf) | Year ago (03/14/24) | 5-year average (2020-24) | |||||||||||||||||||||||
| Region | 03/14/25 | 03/07/25 | net change | implied flow | Bcf | % change | Bcf | % change | |||||||||||||||||
| East | 295 | 307 | -12 | -12 | 407 | -27.5 | 358 | -17.6 | |||||||||||||||||
| Midwest | 366 | 370 | -4 | -4 | 552 | -33.7 | 457 | -19.9 | |||||||||||||||||
| Mountain | 165 | 165 | 0 | 0 | 166 | -0.6 | 109 | 51.4 | |||||||||||||||||
| Pacific | 193 | 196 | -3 | -3 | 216 | -10.6 | 168 | 14.9 | |||||||||||||||||
| South Central | 688 | 660 | 28 | 28 | 990 | -30.5 | 804 | -14.4 | |||||||||||||||||
| Salt | 181 | 161 | 20 | 20 | 299 | -39.5 | 234 | -22.6 | |||||||||||||||||
| Nonsalt | 508 | 499 | 9 | 9 | 692 | -26.6 | 571 | -11.0 | |||||||||||||||||
| Total | 1,707 | 1,698 | 9 | 9 | 2,331 | -26.8 | 1,897 | -10.0 | |||||||||||||||||
| Totals may not equal sum of components because of independent rounding. | |||||||||||||||||||||||||
Working gas in storage was 1,707 Bcf as of Friday, March 14, 2025, according to EIA estimates. This represents a net increase of 9 Bcf from the previous week. Stocks were 624 Bcf less than last year at this time and 190 Bcf below the five-year average of 1,897 Bcf. At 1,707 Bcf, total working gas is within the five-year historical range.
For information on sampling error in this report, see Estimated Measures of Sampling Variability table below.

Note: The shaded area indicates the range between the historical minimum and maximum values for the weekly series from 2020 through 2024. The dashed vertical lines indicate current and year-ago weekly periods.
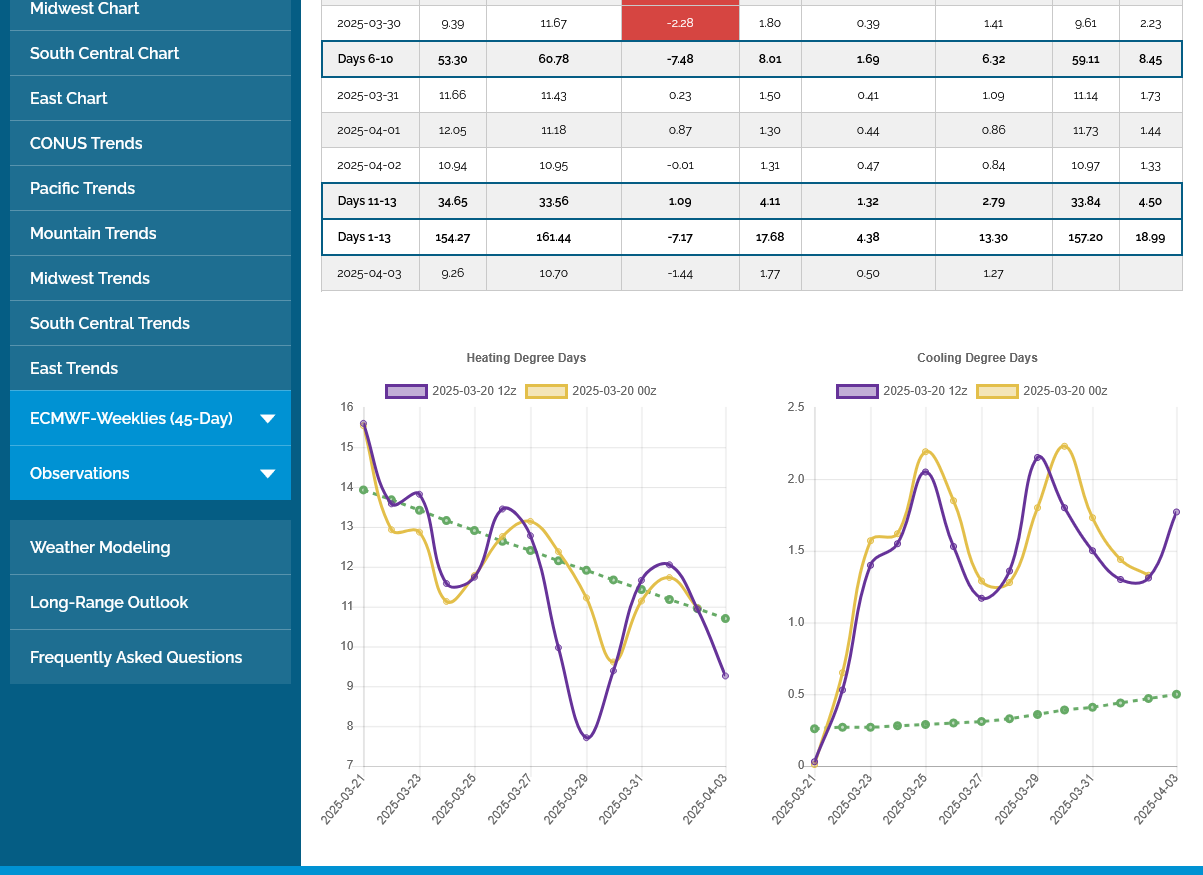
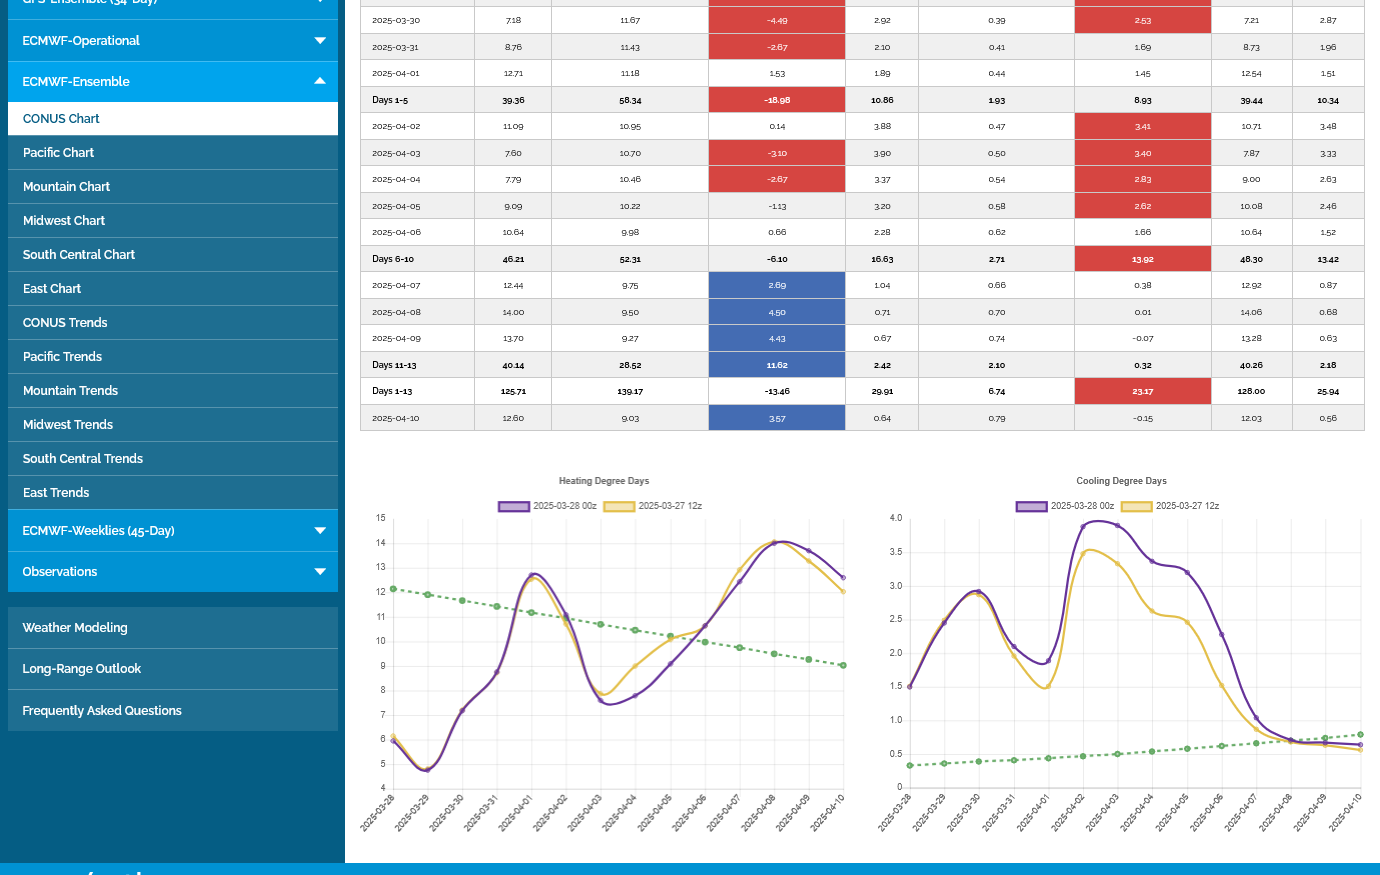
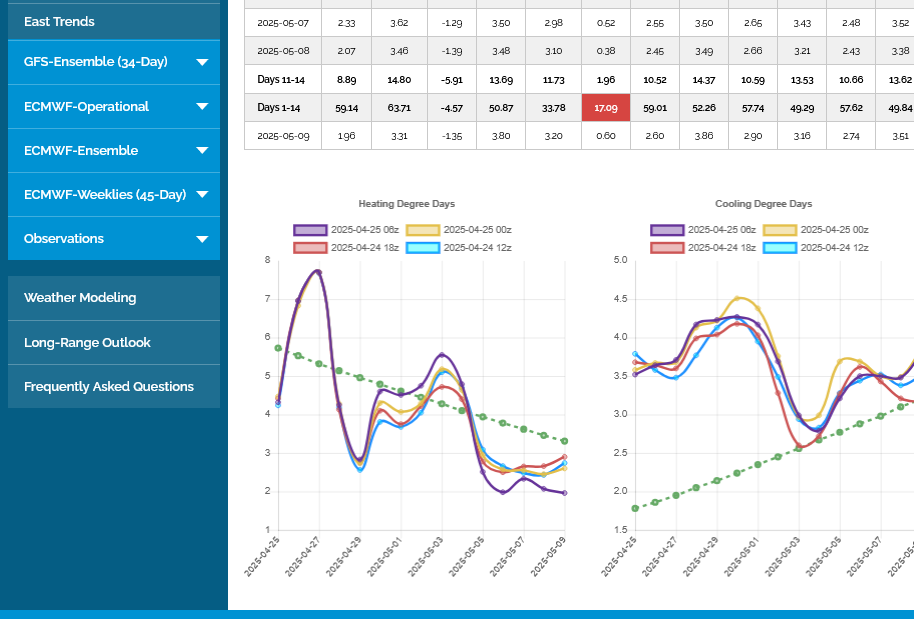
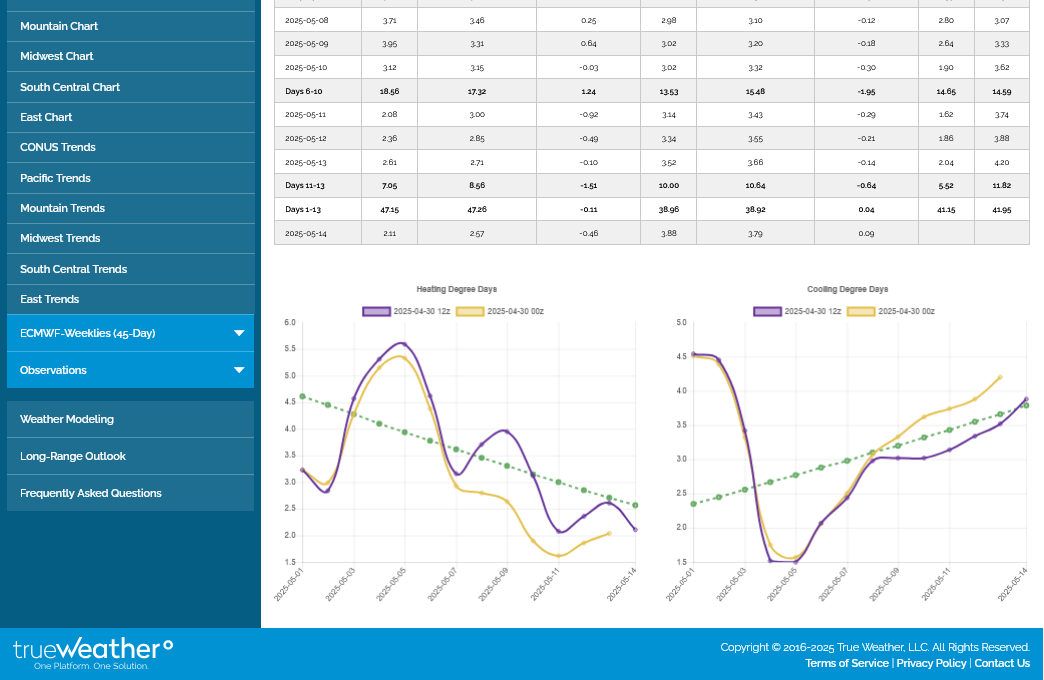
This was the last 12z European Ensemble model for HDDs in purple. -3 HDDs vs the previous 0z run. -7 HDDs vs average. Weather in not having much impact on natural gas prices here at the tail end of the heating season. We can see the average HDD dashed green line, rapidly falling from left to right on the graph below.
It won't be until May (typically) until CDDs become the main trading item.
Some early season heat in the South the next couple of weeks!
https://www.marketforum.com/forum/topic/83844/#83852
1. US Heating/Cooling degree days from the last 2 European ensemble model runs. (purple is the most recent 12z run-right is CDDs. Left is HDDs)
2. Same graph for just the SouthCentral region. Note the elevated CDDs. Is this bullish in late March? NO WAY! Note the very suppressed HDDs on the first graph that TAKES AWAY more total DDs than are added by the extra CDDs. In a month, that will flip to a bit bullish. In June/July/August, this same forecast would be pretty bullish.
I think this forecast also lost a bunch of HDDs over the weekend from less Upper Midwest and Northeast cold. At this time of year, however temperatures don't matter much to ng trading.
Lower on the open. I have no idea how natural gas will trade this week.
Another bearish report/injection of +37 Bcf. Note the blue line on the graph below has made the seasonal bottom a couple of weeks early and is now CLOSING the gap with the 5 year average line.
Seasonals(historical tendency) are strongly up here but there is a lot of downward pressure added up from:
1. Mild weather
2. Expected drop in Industrial demand from the Trump recession
3. Increase in supply
![]()
for week ending March 21, 2025 | Released: March 27, 2025 at 10:30 a.m. | Next Release: April 3, 2025
| Working gas in underground storage, Lower 48 states Summary text CSV JSN | |||||||||||||||||||||||||
|---|---|---|---|---|---|---|---|---|---|---|---|---|---|---|---|---|---|---|---|---|---|---|---|---|---|
| Historical Comparisons | |||||||||||||||||||||||||
| Stocks billion cubic feet (Bcf) | Year ago (03/21/24) | 5-year average (2020-24) | |||||||||||||||||||||||
| Region | 03/21/25 | 03/14/25 | net change | implied flow | Bcf | % change | Bcf | % change | |||||||||||||||||
| East | 298 | 295 | 3 | 3 | 390 | -23.6 | 342 | -12.9 | |||||||||||||||||
| Midwest | 367 | 366 | 1 | 1 | 531 | -30.9 | 438 | -16.2 | |||||||||||||||||
| Mountain | 163 | 165 | -2 | -2 | 166 | -1.8 | 108 | 50.9 | |||||||||||||||||
| Pacific | 192 | 193 | -1 | -1 | 222 | -13.5 | 168 | 14.3 | |||||||||||||||||
| South Central | 725 | 688 | 37 | 37 | 991 | -26.8 | 810 | -10.5 | |||||||||||||||||
| Salt | 202 | 181 | 21 | 21 | 295 | -31.5 | 239 | -15.5 | |||||||||||||||||
| Nonsalt | 523 | 508 | 15 | 15 | 697 | -25.0 | 571 | -8.4 | |||||||||||||||||
| Total | 1,744 | 1,707 | 37 | 37 | 2,301 | -24.2 | 1,866 | -6.5 | |||||||||||||||||
| Totals may not equal sum of components because of independent rounding. | |||||||||||||||||||||||||
Working gas in storage was 1,744 Bcf as of Friday, March 21, 2025, according to EIA estimates. This represents a net increase of 37 Bcf from the previous week. Stocks were 557 Bcf less than last year at this time and 122 Bcf below the five-year average of 1,866 Bcf. At 1,744 Bcf, total working gas is within the five-year historical range.
For information on sampling error in this report, see Estimated Measures of Sampling Variability table below.
Note: The shaded area indicates the range between the historical minimum and maximum values for the weekly series from 2020 through 2024. The dashed vertical lines indicate current and year-ago weekly periods
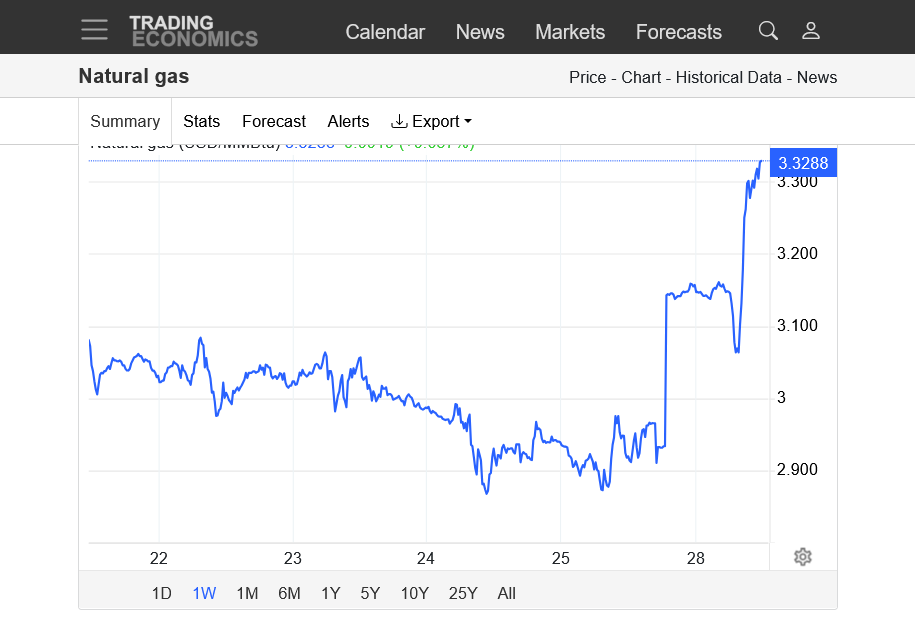
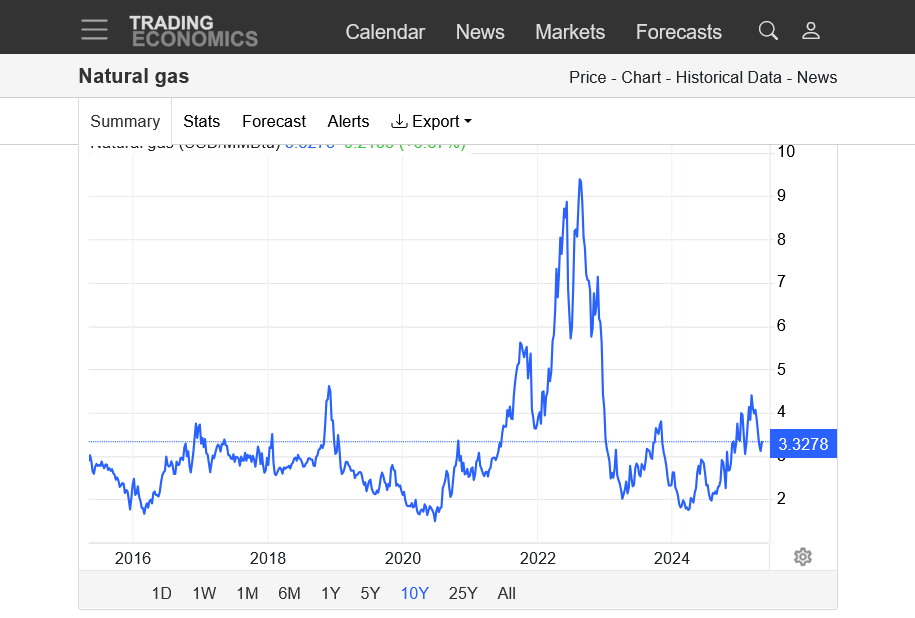
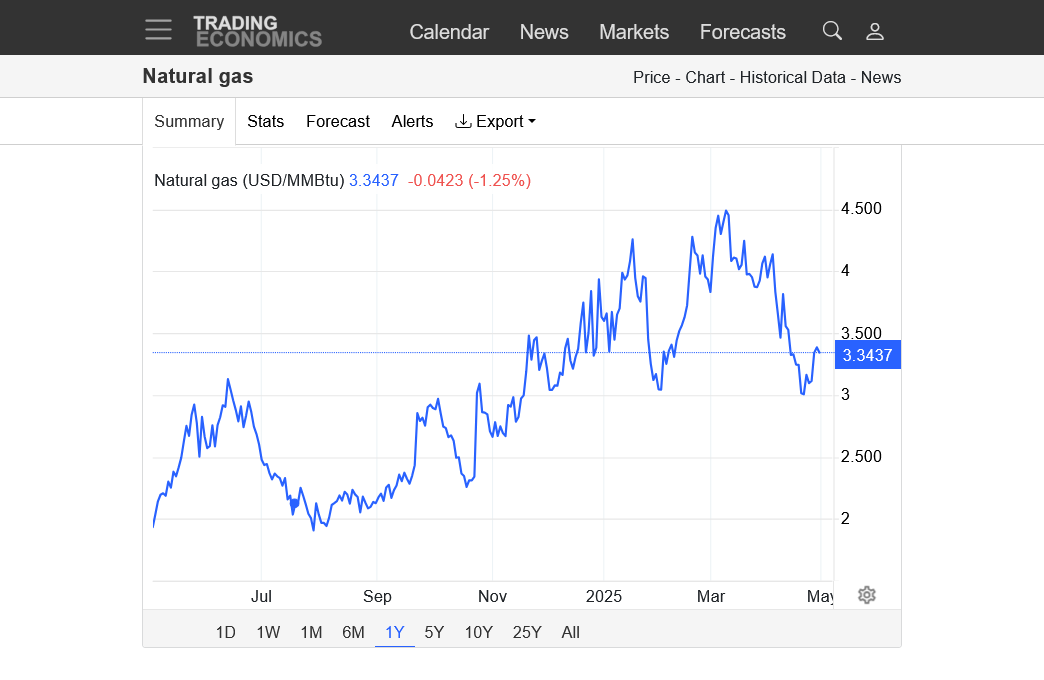
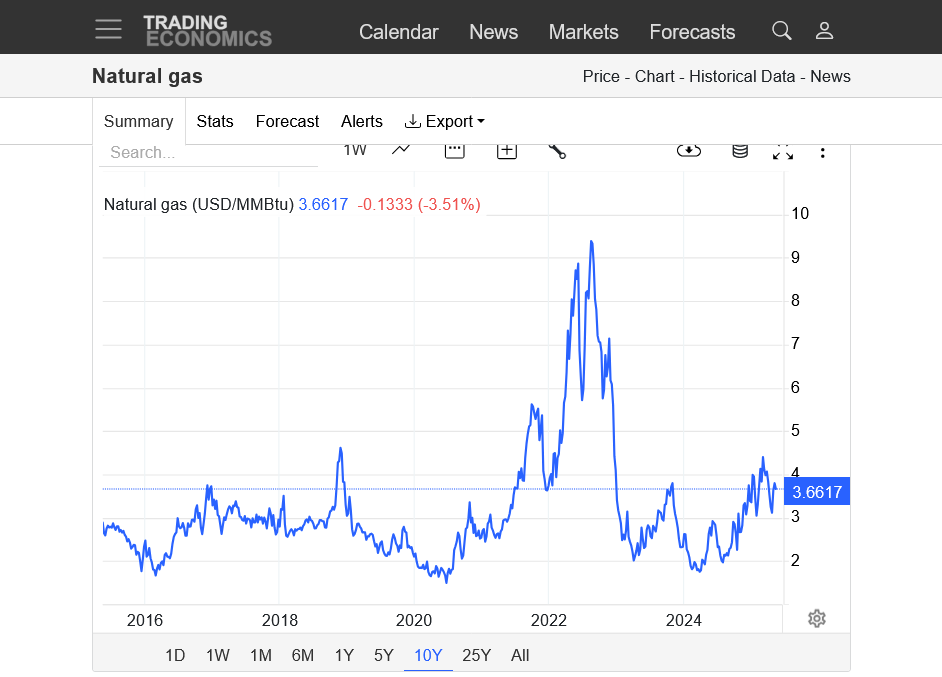
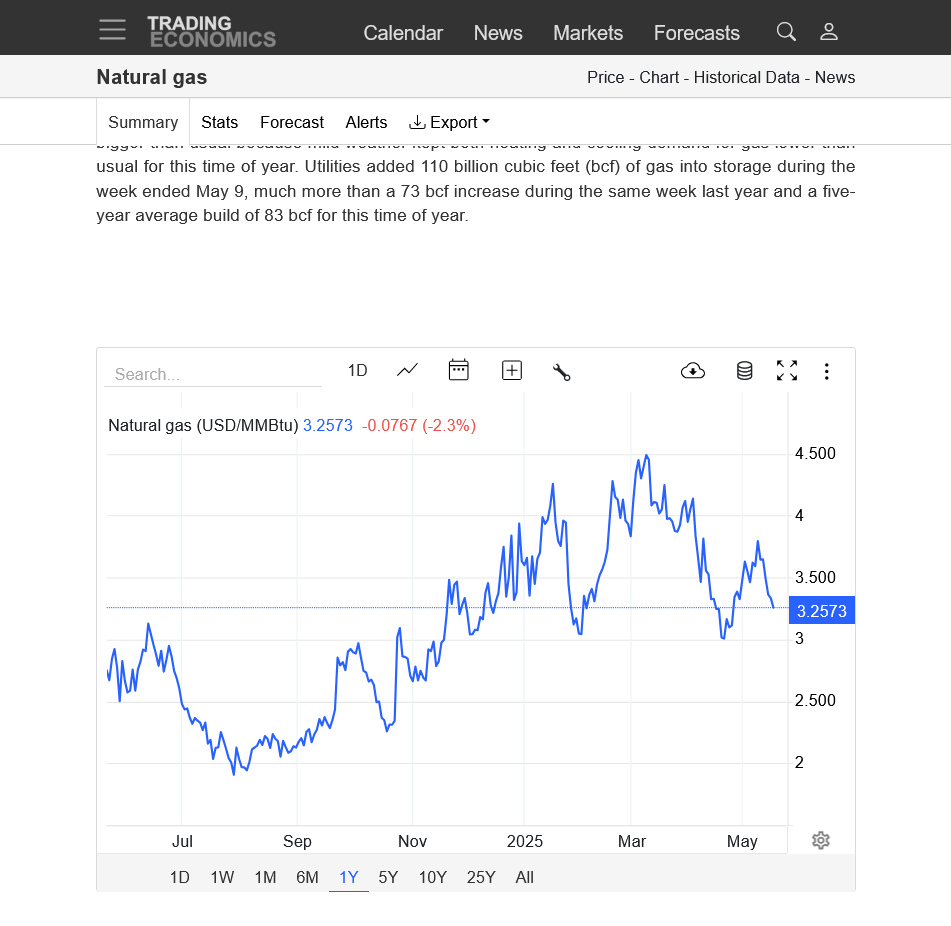
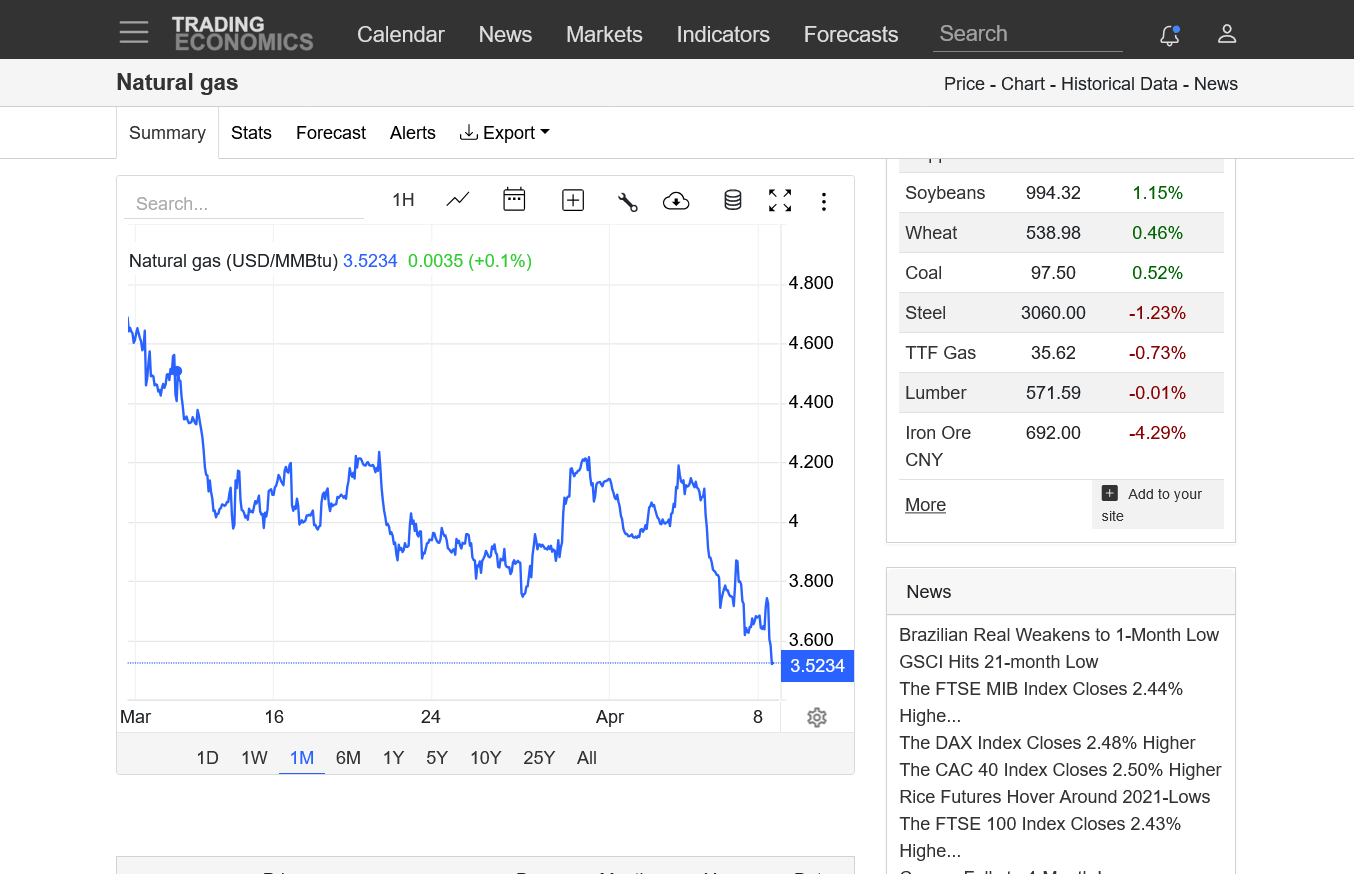
May Natural gas in its first full day as the front month.
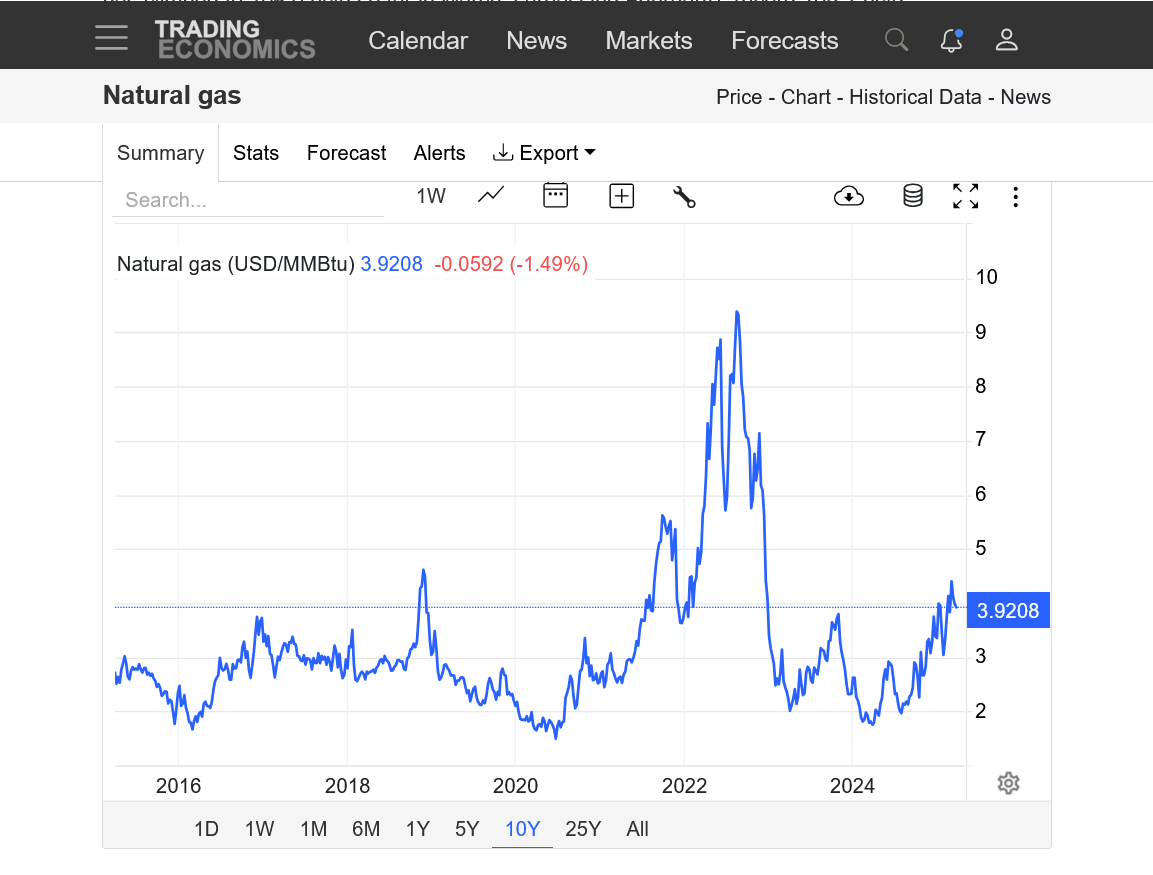
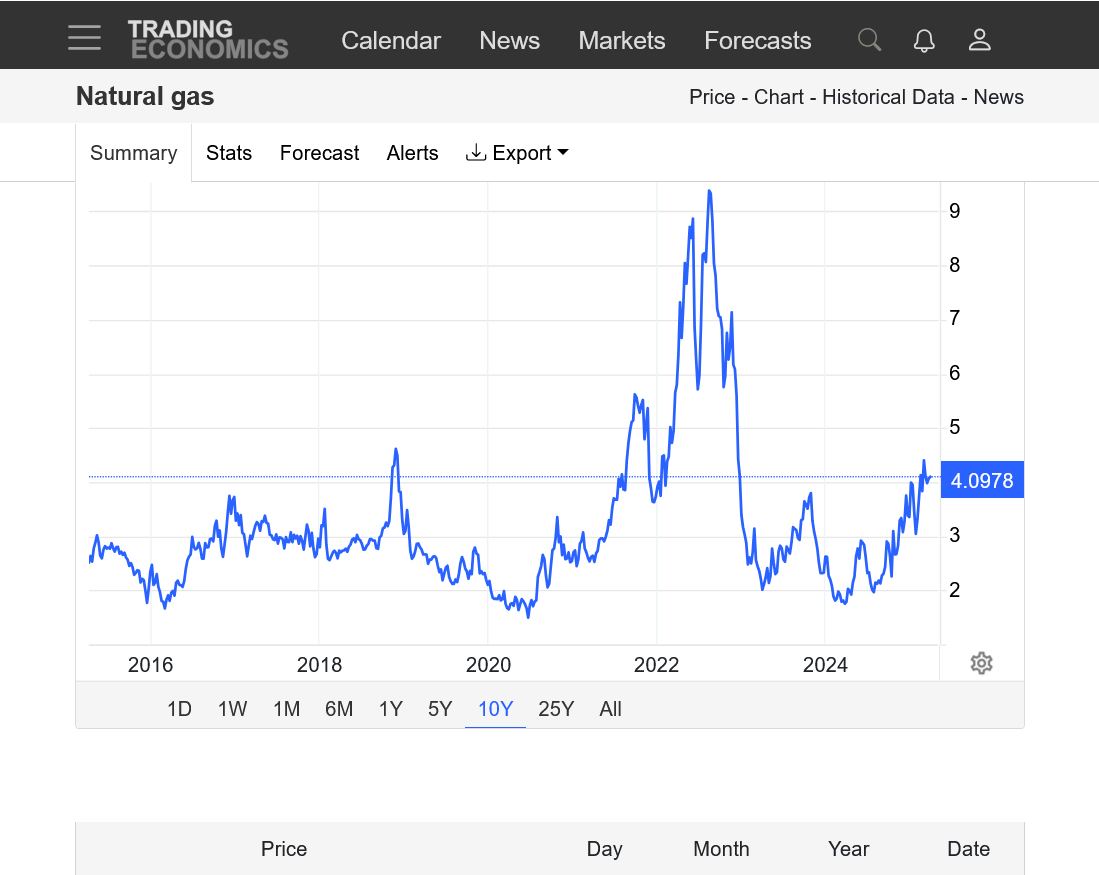
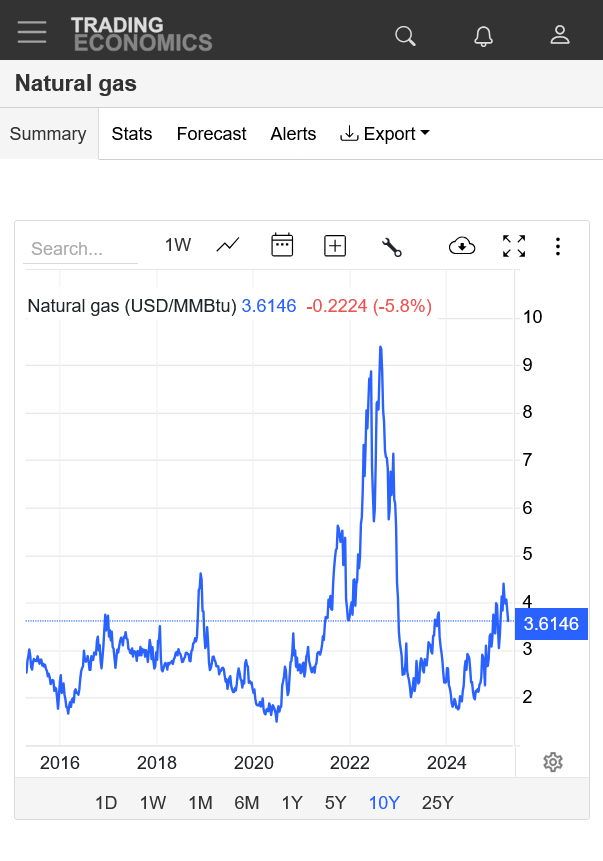
1. 10 years
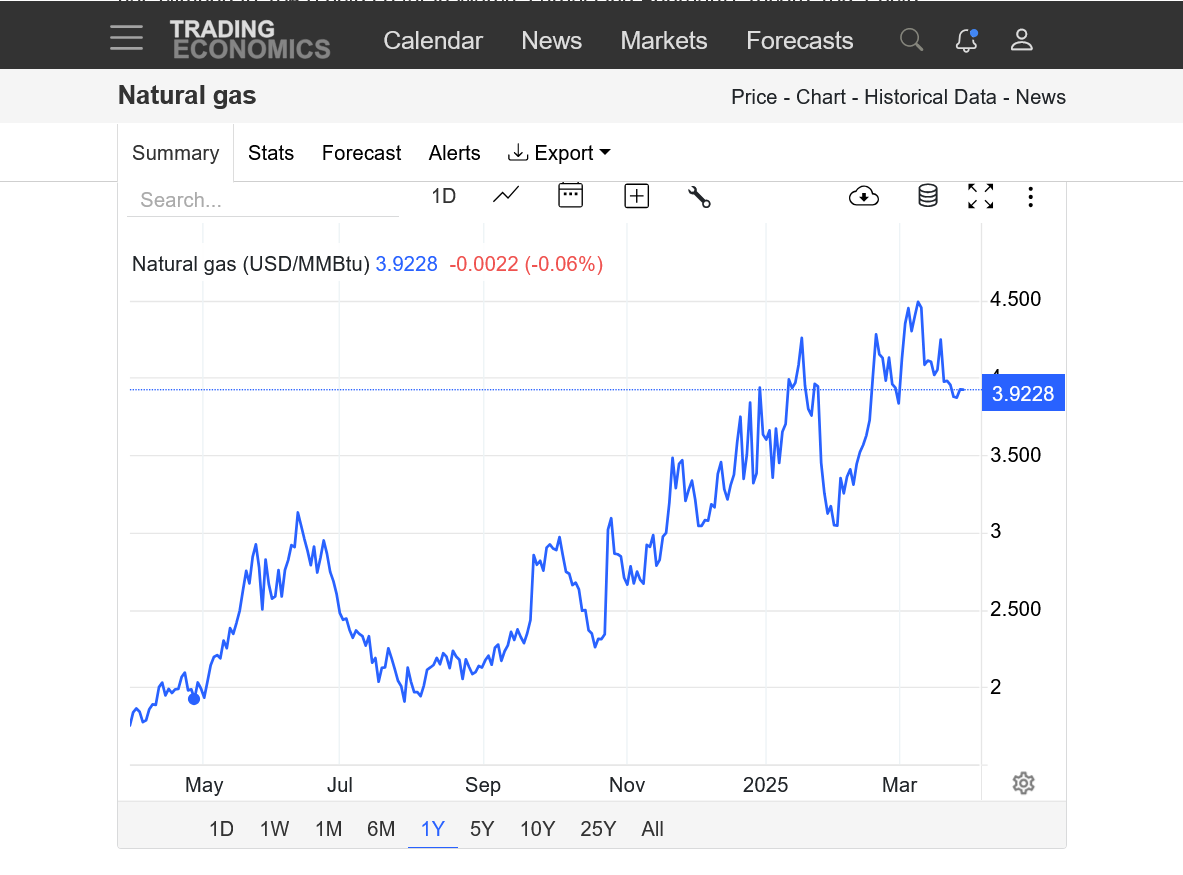
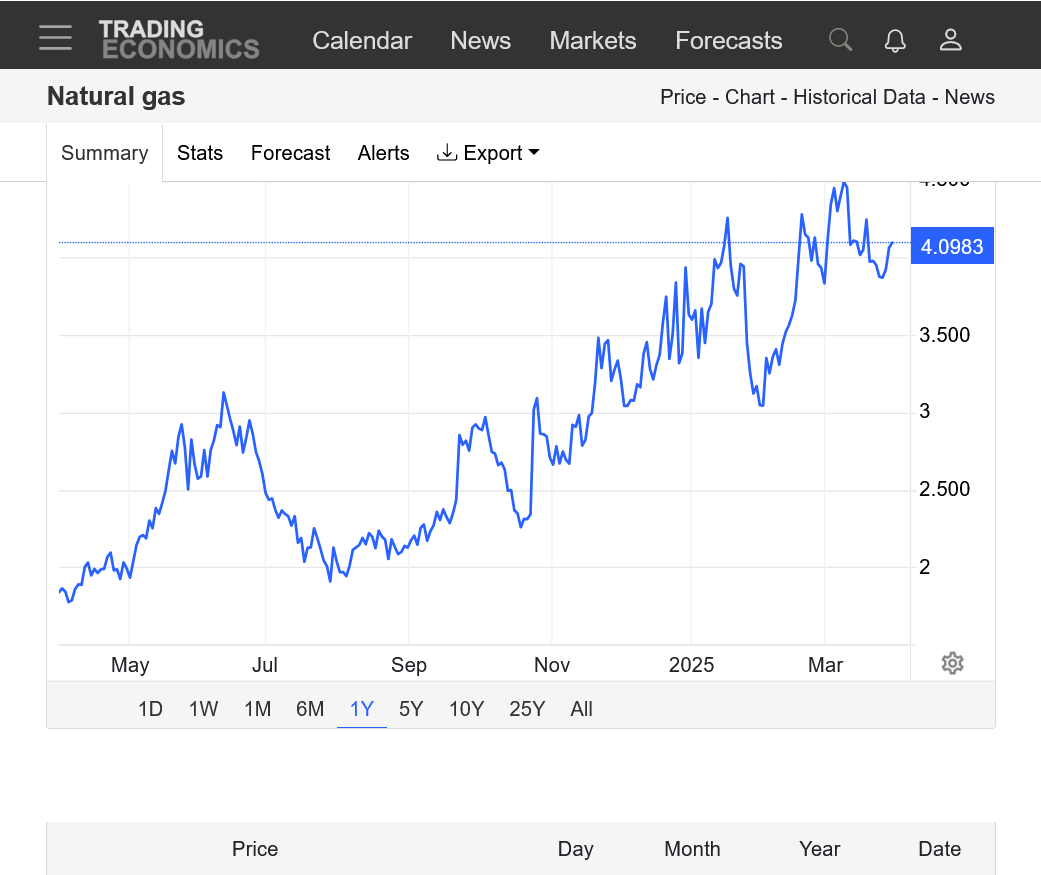
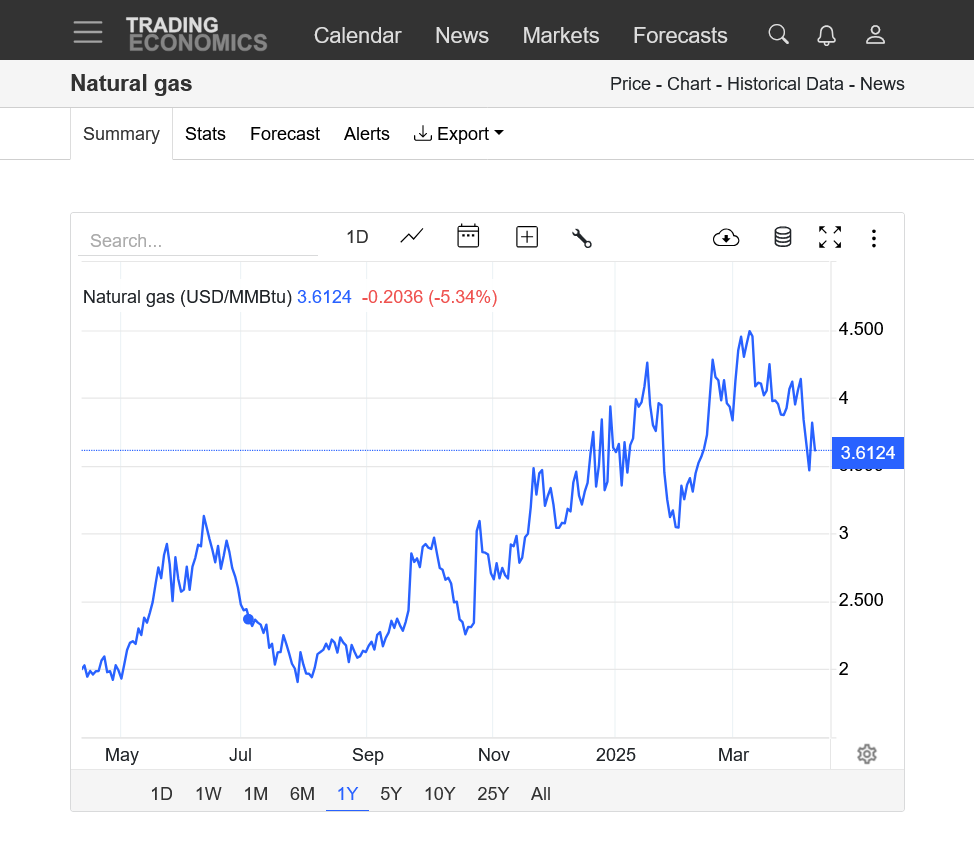
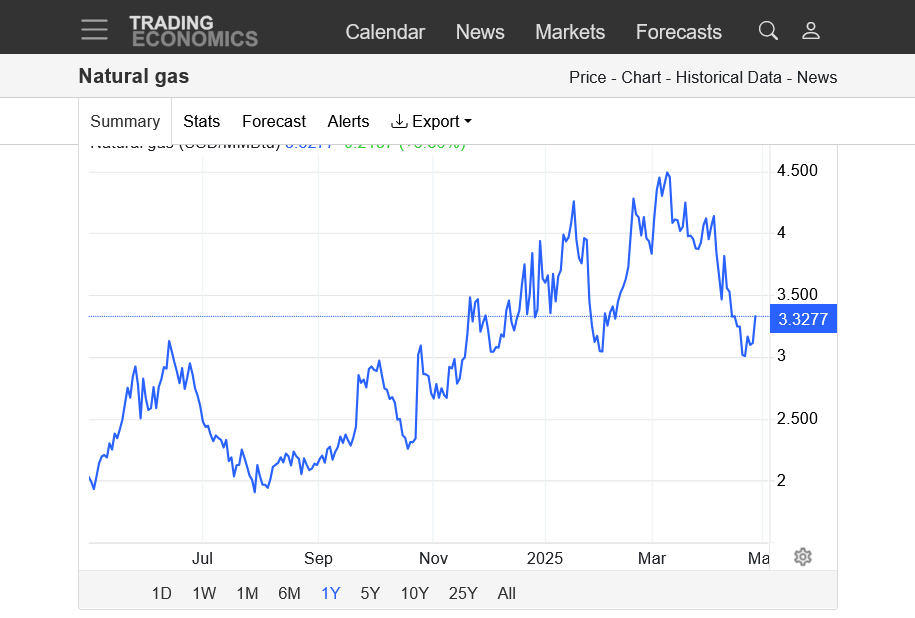
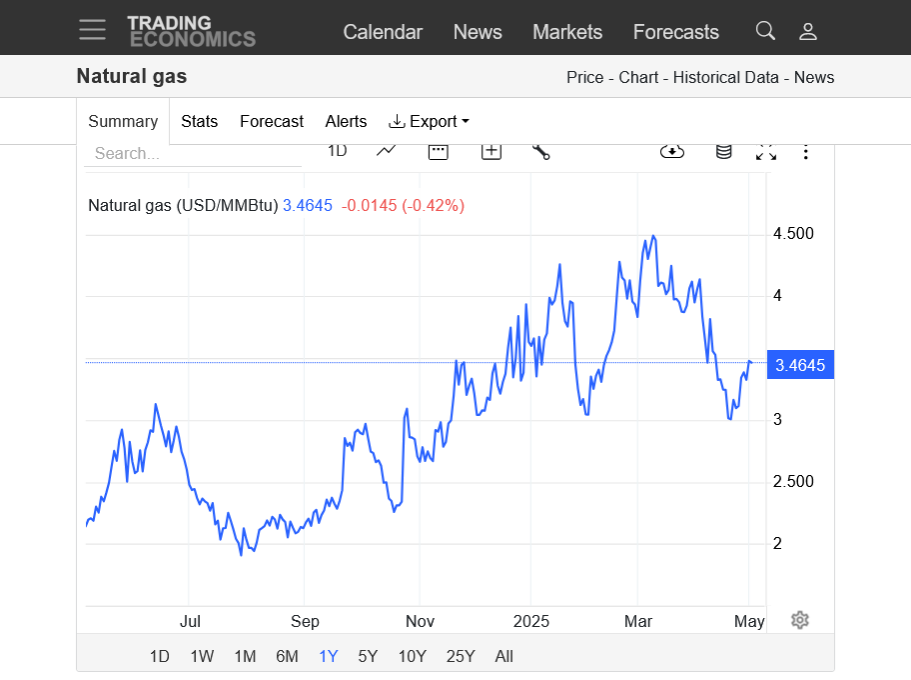
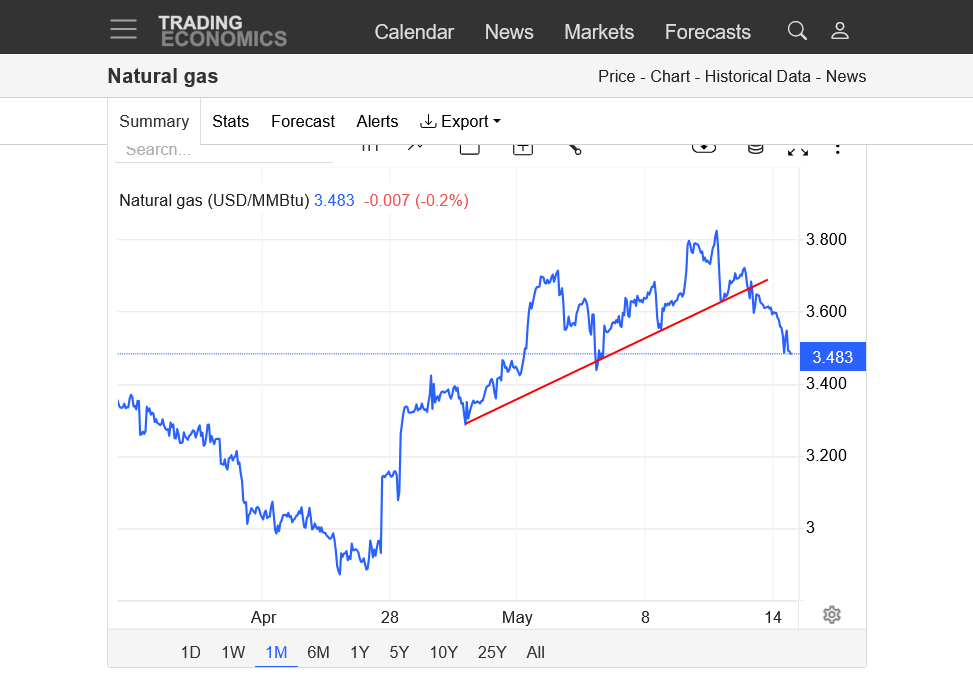
2. 1 year
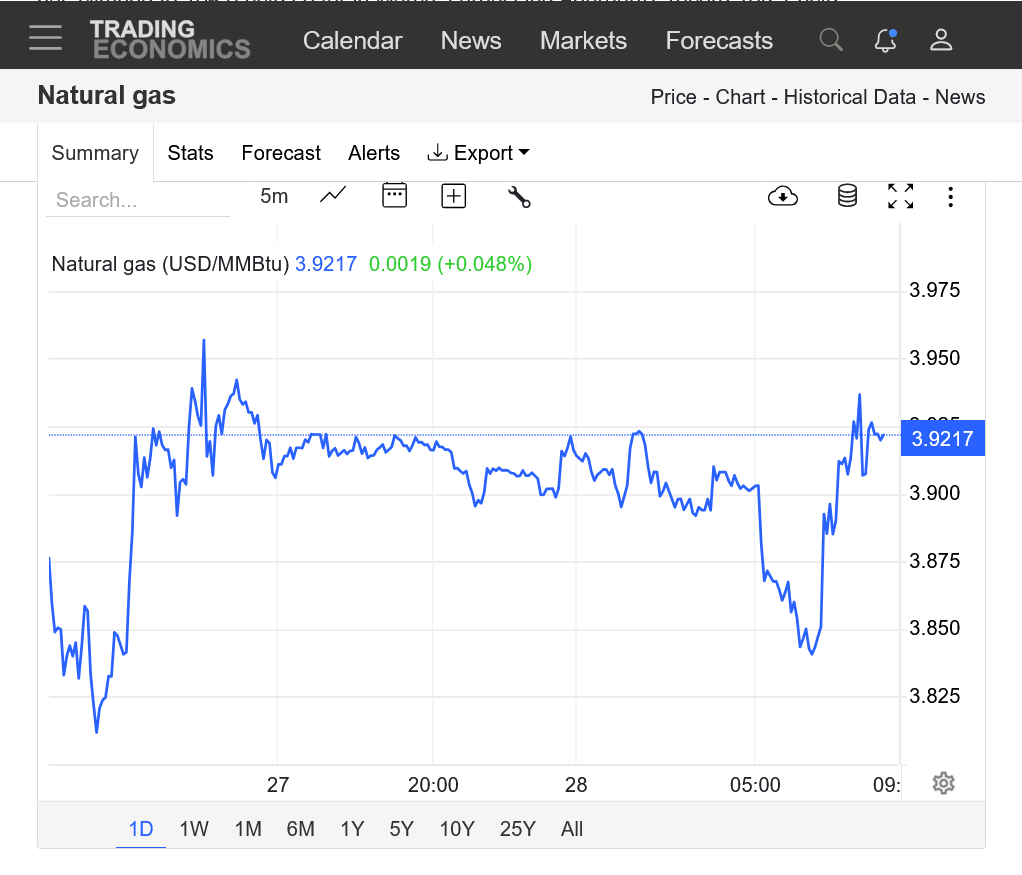
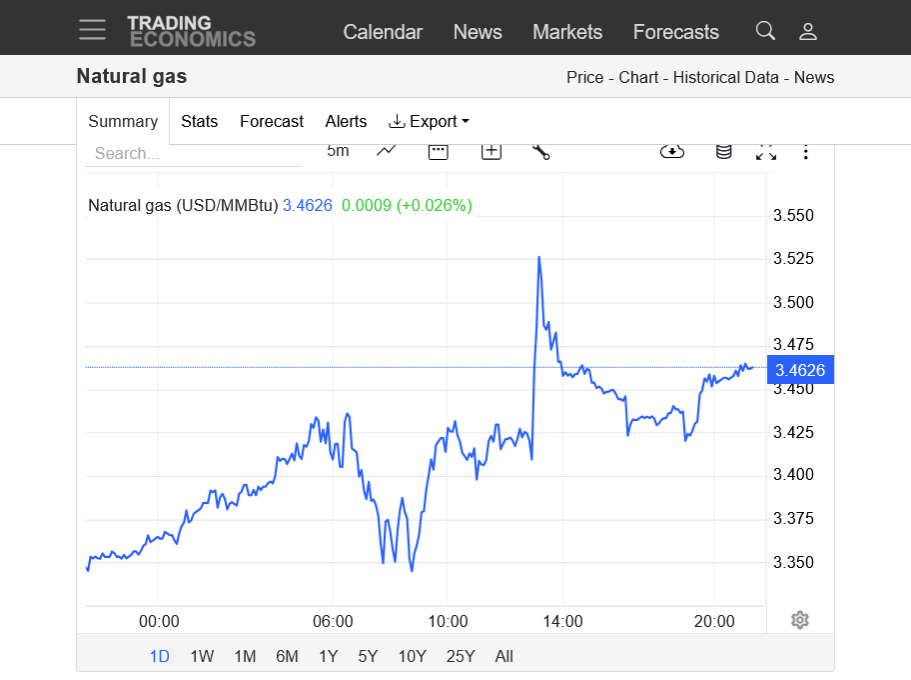
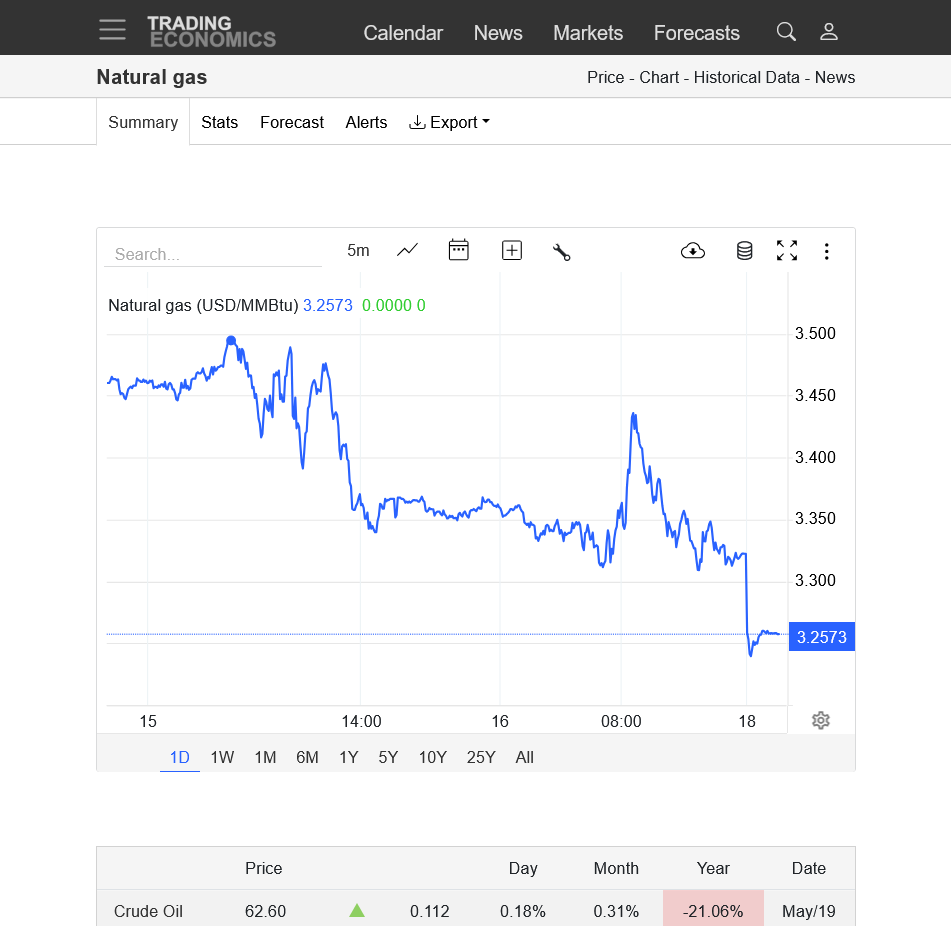
3. 1 day
https://tradingeconomics.com/commodity/natural-gas
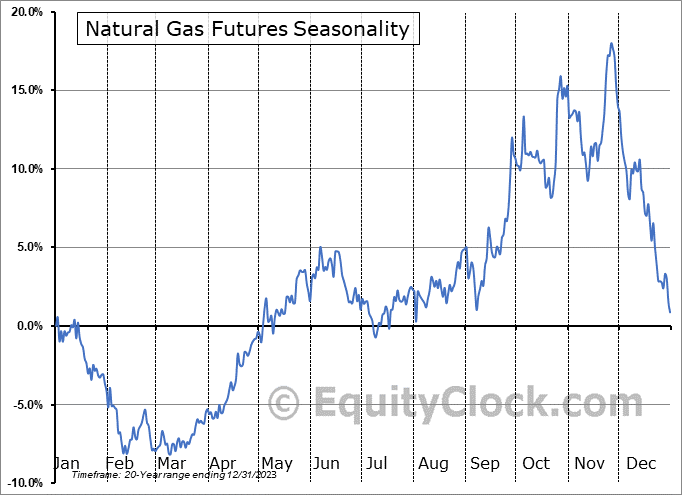
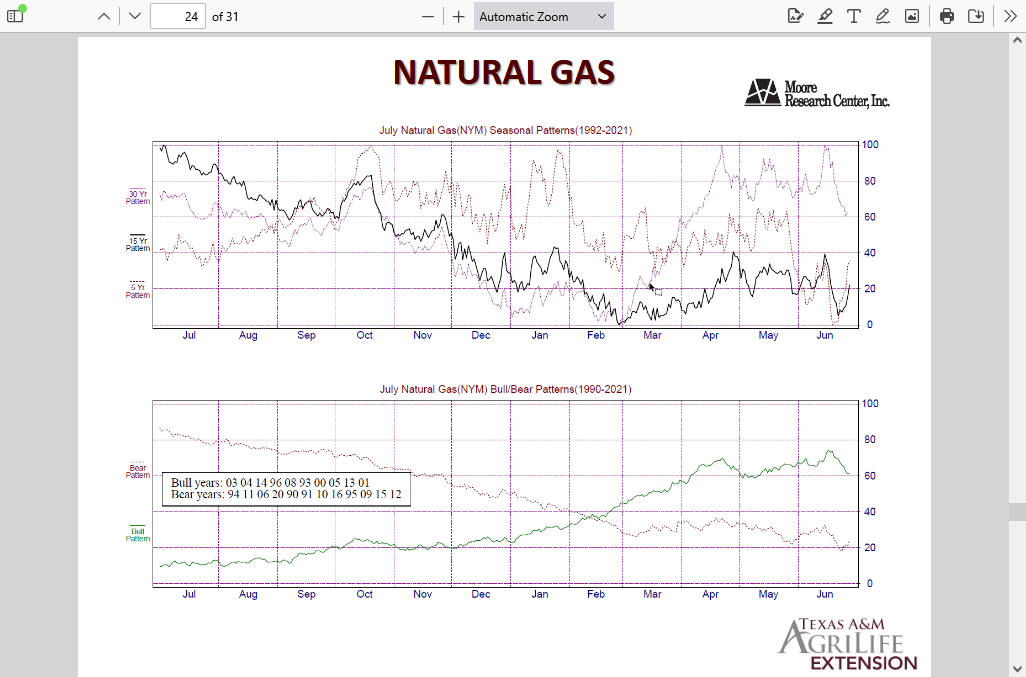
Seasonals in March turn strongly positive and that typically lasts thru May but each year is different.
In 2020, for instance because of COVID the exact opposite happened and we crashed lower.
That's what weakening industrial demand can do to natural gas prices, so a Trump caused recession is BEARISH natural gas prices.
The weather right now is no longer a major factor at the end of the heating season and before the main cooling season starts
Added: (a cold shot increasing in strength in week 2 may have given us support Friday morning).
https://charts.equityclock.com/natural-gas-futures-ng-seasonal-chart
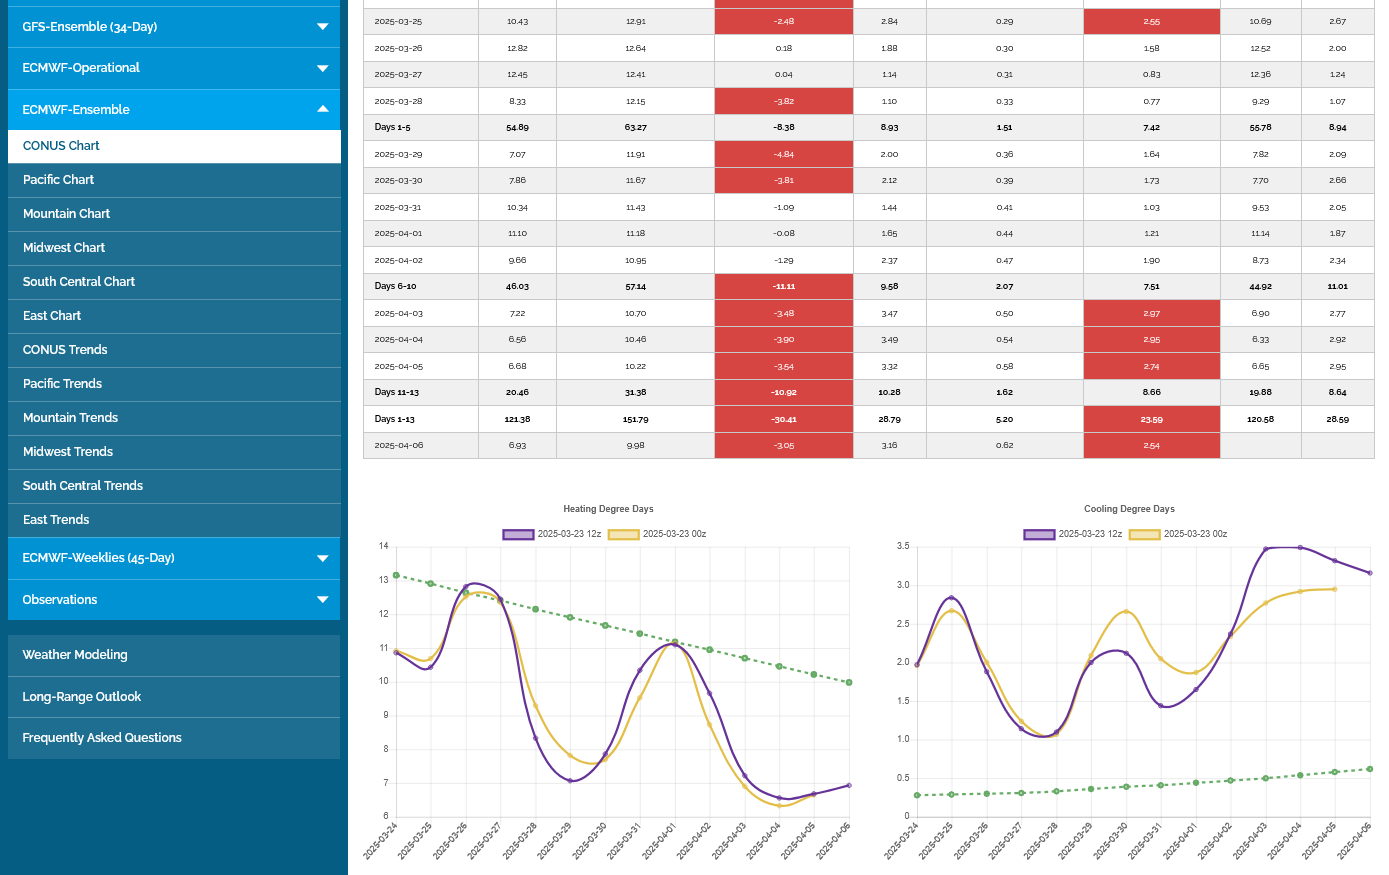
1. Rapidly falling AVERAGE HDDs on the left in dashed green. We go from mostly mild to pretty chilly late in week 2 on this latest European model in purple that was -2 HDDs vs the previous run in tan.
2. Well above average CDDs on the right but they are still MUCH less than HDDs in early April and not bullish until around a month from now with the same pattern. For instance, the highest CDD(peak) on the chart of the right is still LOWER(bottom) than the lowest CDD on the left.
That's because the scales below are much different and deceptive.
The top of the scale on the left is 15 DDs. The top of the scale on the right is 4 HDDs. So the left side should be magnified by almost a factor of 4 compared to how it looks on the graph in order to establish equivalency.
There are a total of almost 30 CDDs on the right WELL above average.
However, on the left even though HDDS are BELOW average they are 126 HDDs, 4 times more than the CDDs.
We gapped higher on the open this evening, likely because of this: Thanks, Larry!!!
Re: Sudden Stratospheric Warming 2-3-25
By WxFollower - March 30, 2025, 1:48 a.m.
Re: Re: Sudden Stratospheric Warming 2-3-2
By metmike - March 30, 2025, 2:12 a.m.
Re: Re: Re: Sudden Stratospheric Warming 2-3-2
By metmike - March 30, 2025, 11:05 a.m.
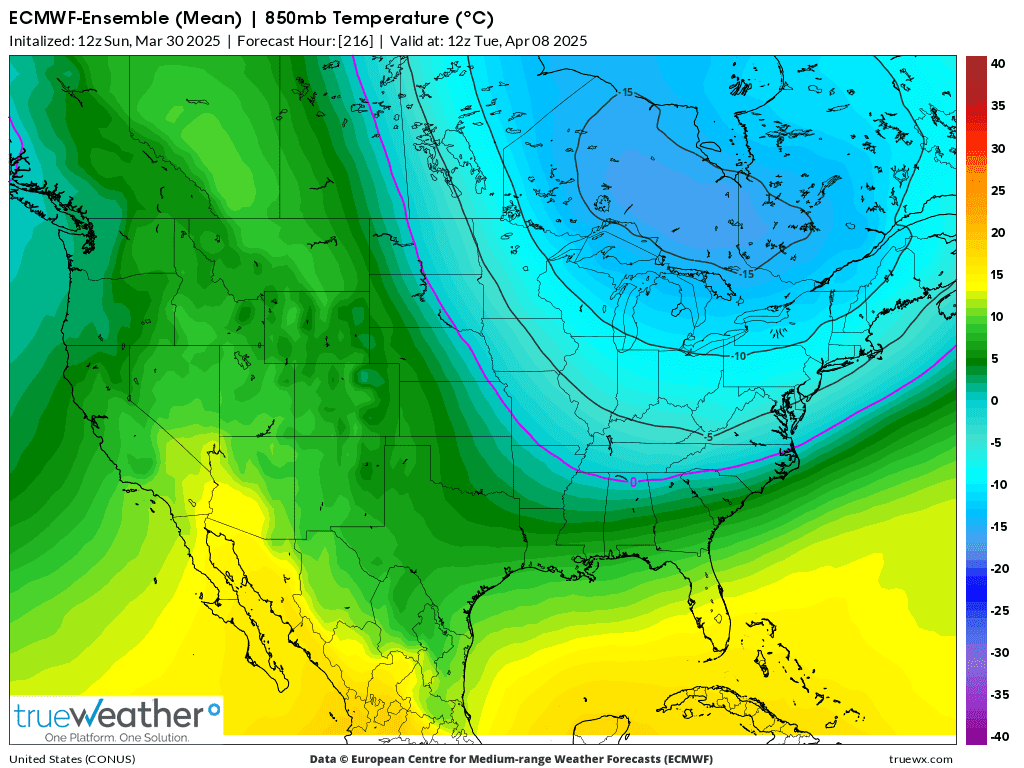
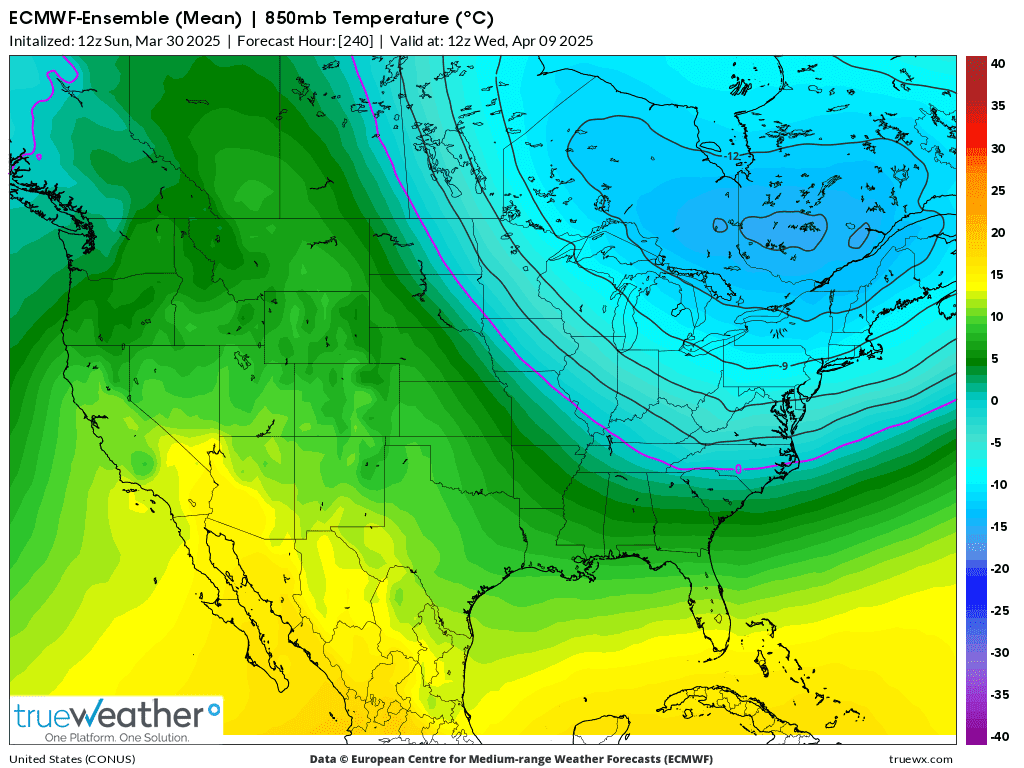
The 12z run of the European model did not push the cold as far south with as much gusto as last nights 0z run did.
1. NEXT Tuesday morning 4-8-25 Isotherms spaced every 5 Deg. C. 0 Deg to northern AL/GA border.
2. Next Wednesday morning 4-9-25 Isotherms spaced every 3 Deg. C which make is look colder but it isn't. 0 Deg. down to northern SC border.
NG has held the gap higher, from the Sunday night open which is looking just like a classic, upside break out from a bull flag chart formation.
i was thinking last week that cold in April would not matter but a few days of it apparently is serving as the excuse for bulls to aggressively mark up the price since early Friday….
even though the extra demand from the end of season,brief cold snap is not goimg to make much difference in storage supplies long term.
After a spike higher, ng went down to make new lows but has held the gap. On this upcoming cold. It's basically 4 days worth of unusual APRIL brand of cold. It means almost nothing for the big picture for storage, maybe just a psychologically bullish factor that results in a big oversold bounce at a time of year when ng almost always goes up.
The last 0z European ensemble model HDDs on the left/purple was -3 HDDs but the market still made new highs many hours after that. We can see the rapidly falling, seasonal/average greenline for HDDs.
The scale on the left is 4 TIMES in magnitude the scale on the right for CDDs is. They look the same visually but HDDs are still, on average around 6 times more impactful with DDs than CDDs at this time of year.
Degree days
https://www.eia.gov/energyexplained/units-and-calculators/degree-days.php
Degree days are measures of how cold or warm a location is. A degree day compares the mean (the average of the high and low) outdoor temperatures recorded for a location to a standard temperature, usually 65° Fahrenheit (F) in the United States. The more extreme the outside temperature, the higher the number of degree days. A high number of degree days generally results in higher energy use for space heating or cooling.
.png)
_eKMtJg6.png)
People study degree-day patterns to assess the climate and to assess the heating and cooling needs for different regions of the country.
What are population-weighted degree days?
Degree days can be weighted according to the population of a region to estimate energy consumption. The U.S. Energy Information Administration (EIA) uses population-weighted degree days to model and forecast energy consumption for the United States and for U.S. census divisions.
We closed the gap higher and the technical formation becomes a gap and crap buying exhaustion signature on the price charts.
I would not place too much significance in it here with so many mixed signals going on, other than it represents a FAILURE for the bulls because there was NO FOLLOW THRU and strong resistance at 4.2 below held like a brick wall.
Despite this, natural gas is still holding its 8 month uptrend.
Also, gap and crap signals are best used, powerful signatures at major tops and bottoms NOT what we just experienced.
NG almost always goes up in April but a recession, always cuts industrial demand.
There's other changes with regards to the Trump administration that could impact prices.
Increase exports = positive for prices.
Increase production = negative for prices.
BTW, Biden was already maximizing NG production but just pretending to be against this fossil fuel for political reasons.
Trump may be able to open up more land for drilling and so on.
+++++++++++++++
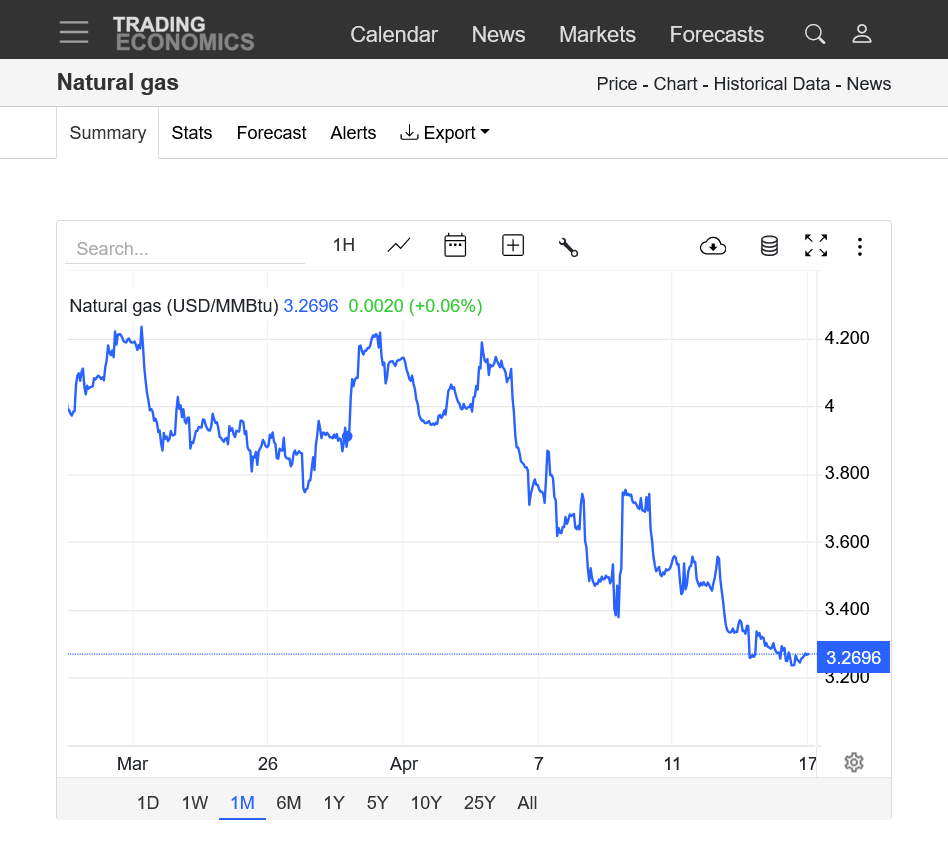
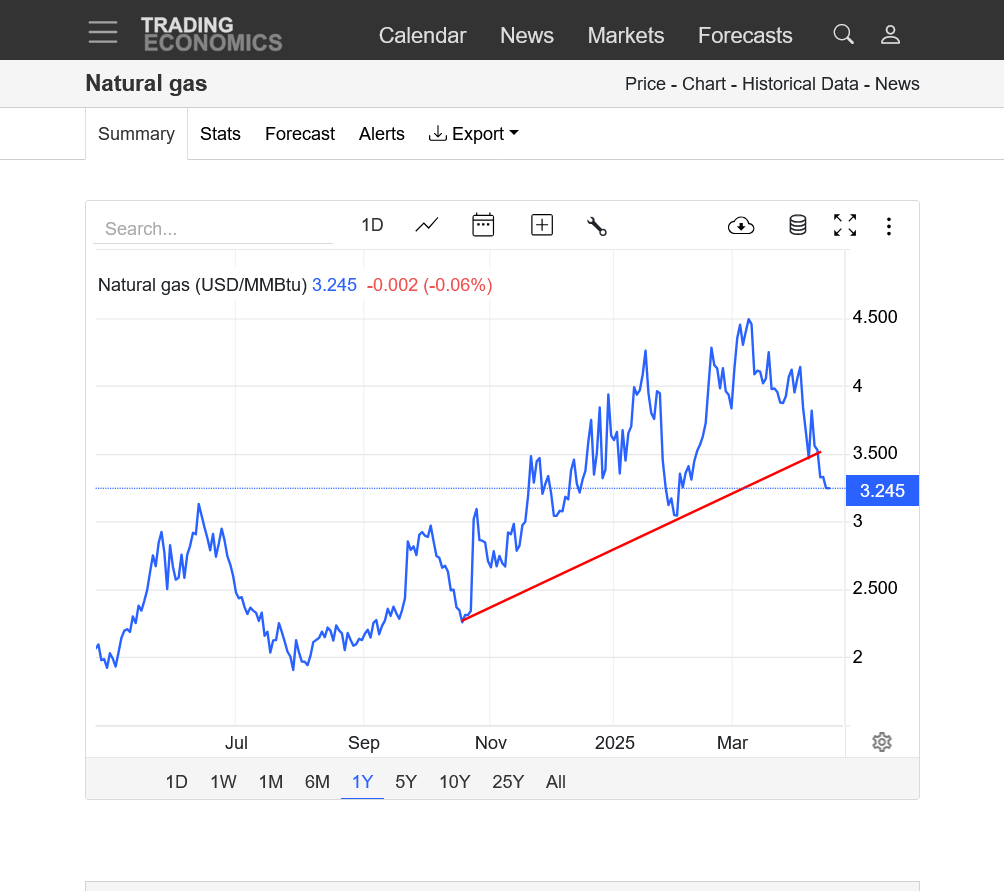
https://tradingeconomics.com/commodity/natural-gas
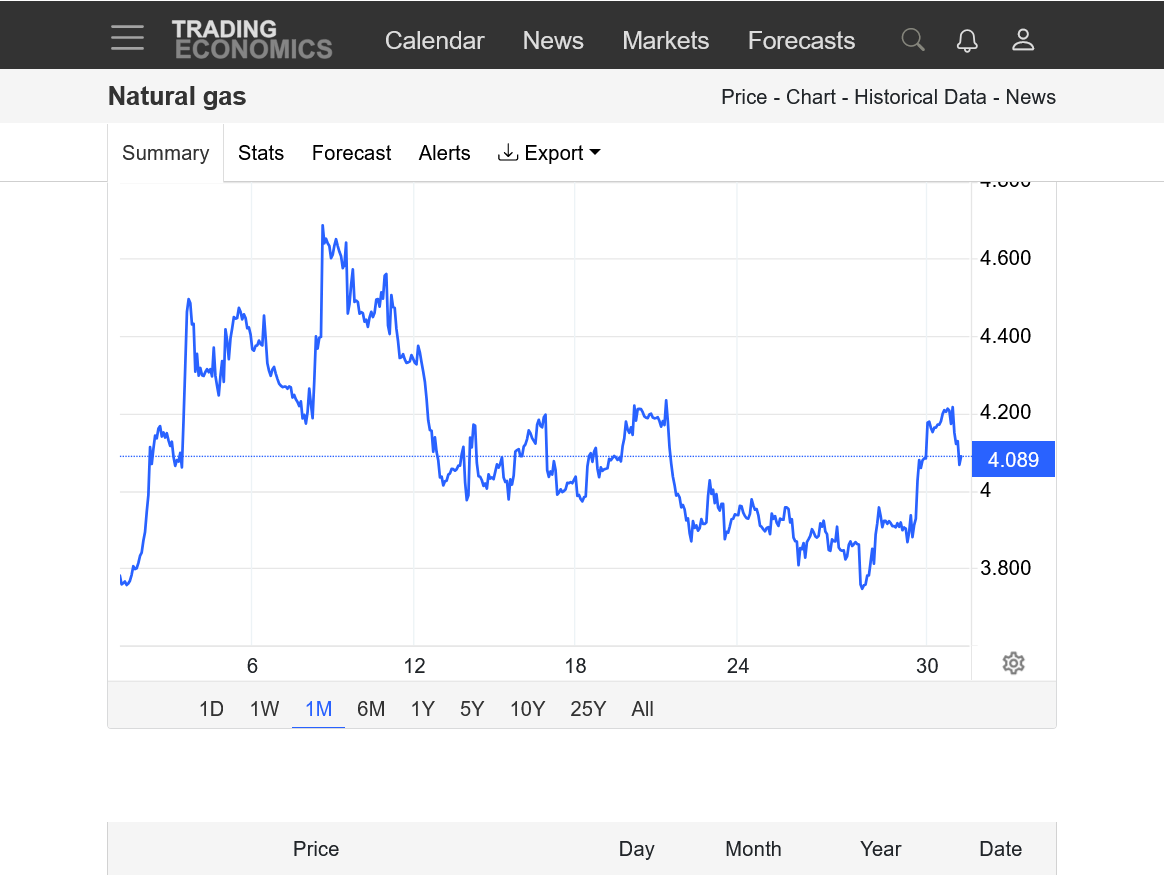
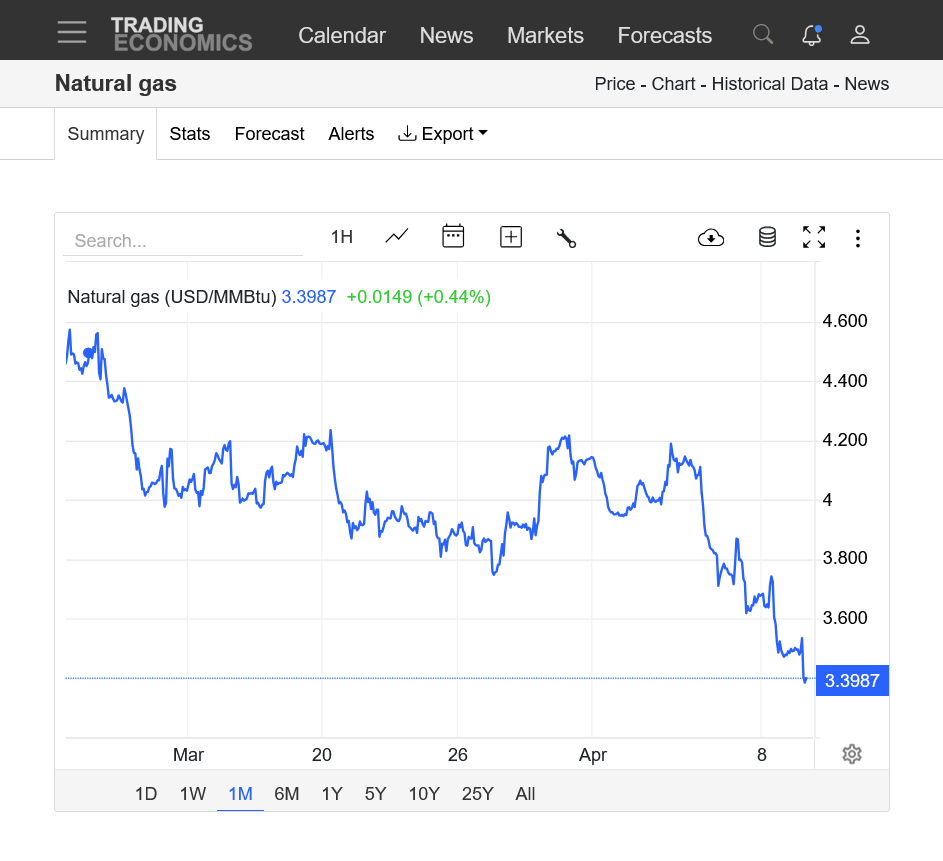
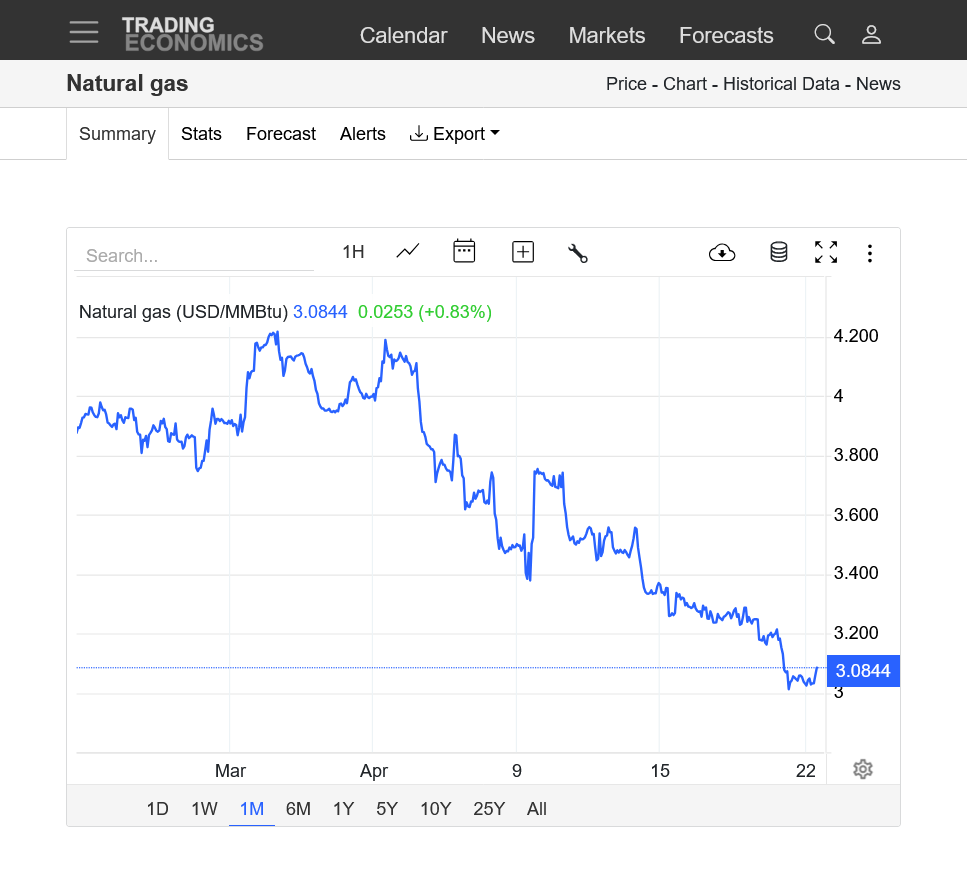
1. 1 month-major top March 9. Potential bottom, below 3.8, last Friday morning. 4.2 resistance held today,
2. 1 year-uptrend since the April 1, 2024 low, then July 29, 2024 low-COLD WINTER took us from record amounts in storage to below the bottom of the 5 year range in storage towards the end of Winter.
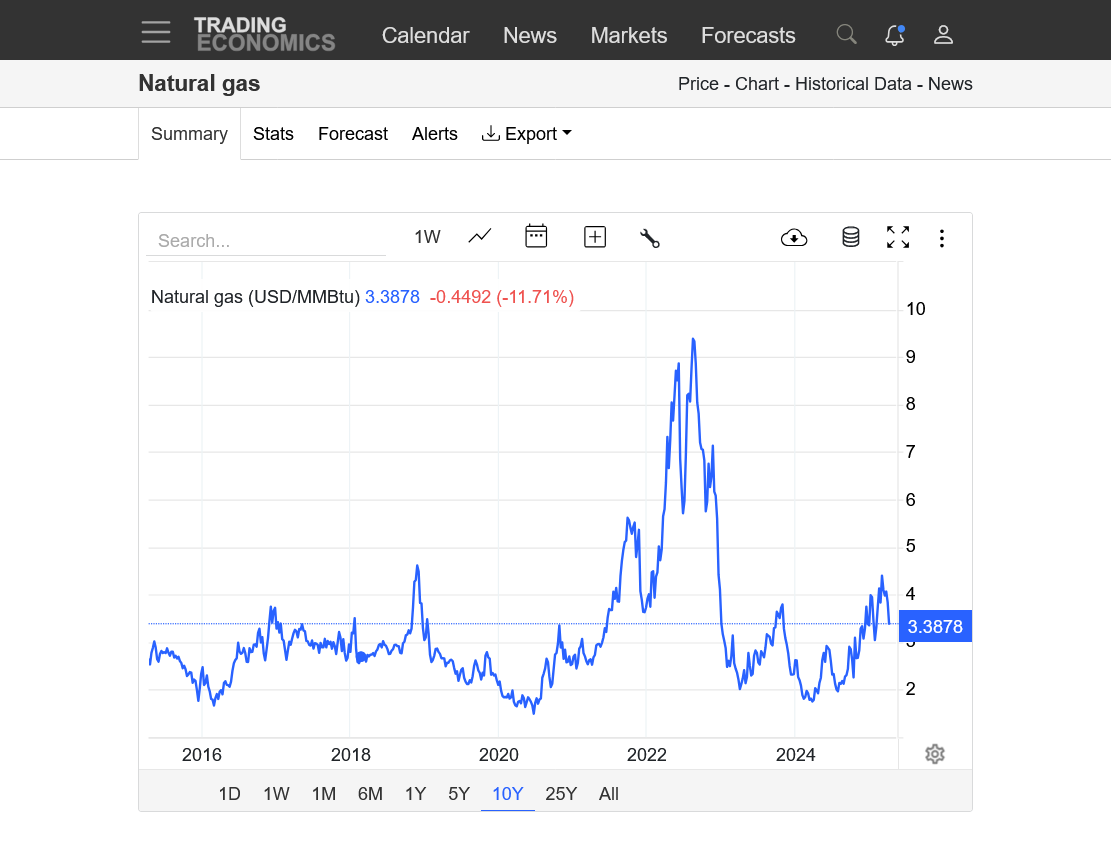
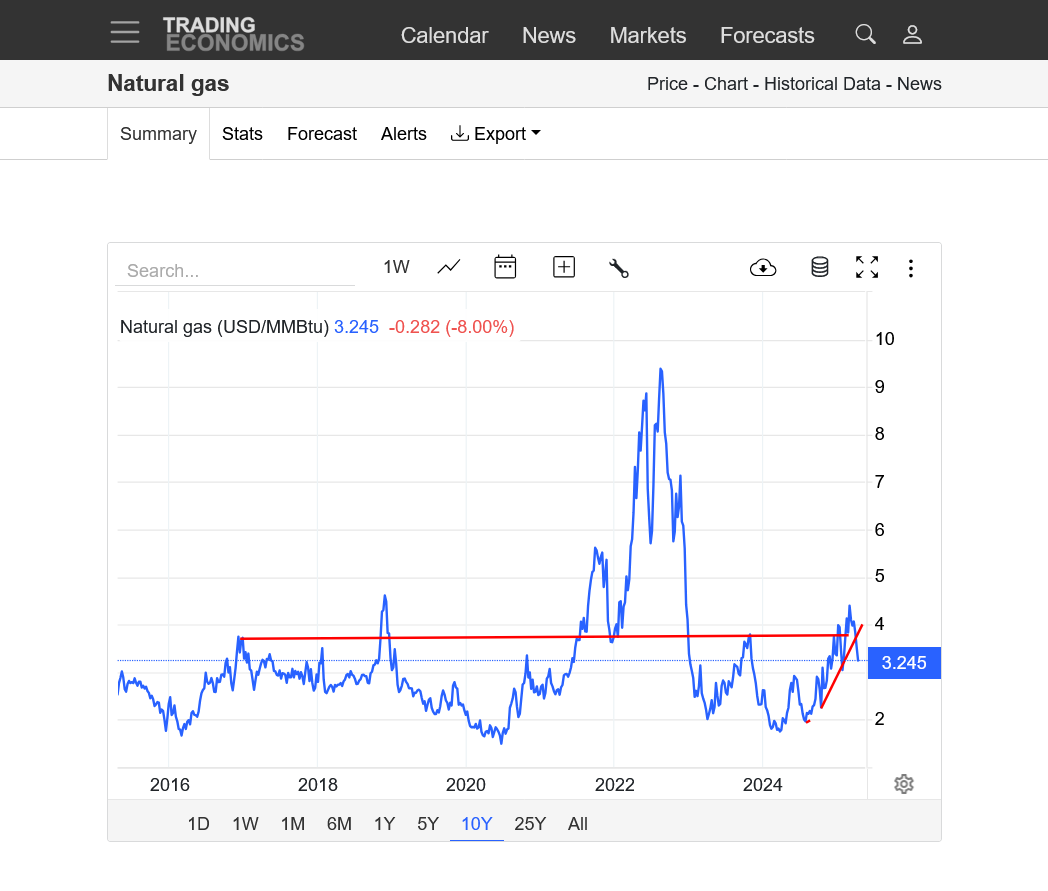
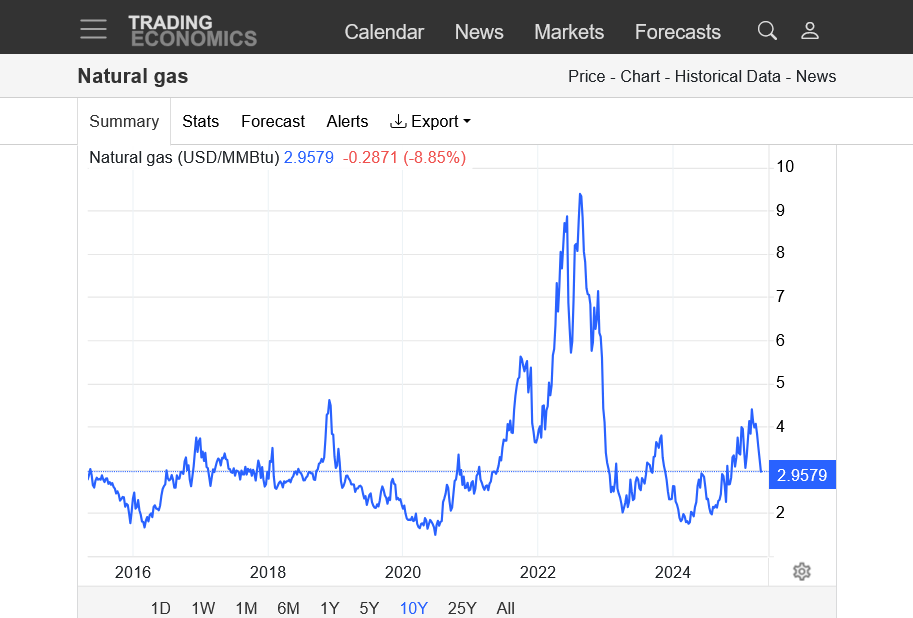
3. 10 years-uptrend-breaking out to the upside. BEFORE THAT: MAJOR top in August 2022 with LOW amounts in storage, THEN to record production, record injections Fall of 2023 and mild Winters, especially 2023/24!
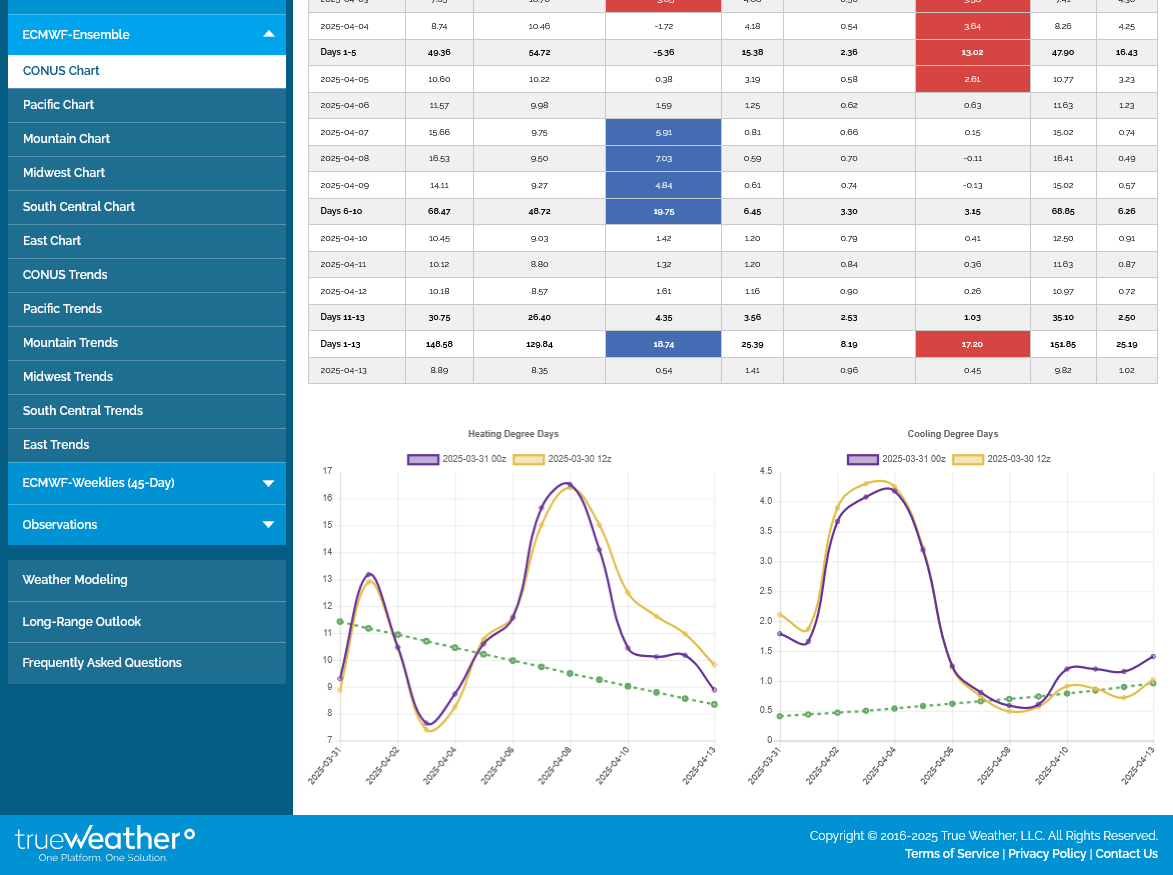
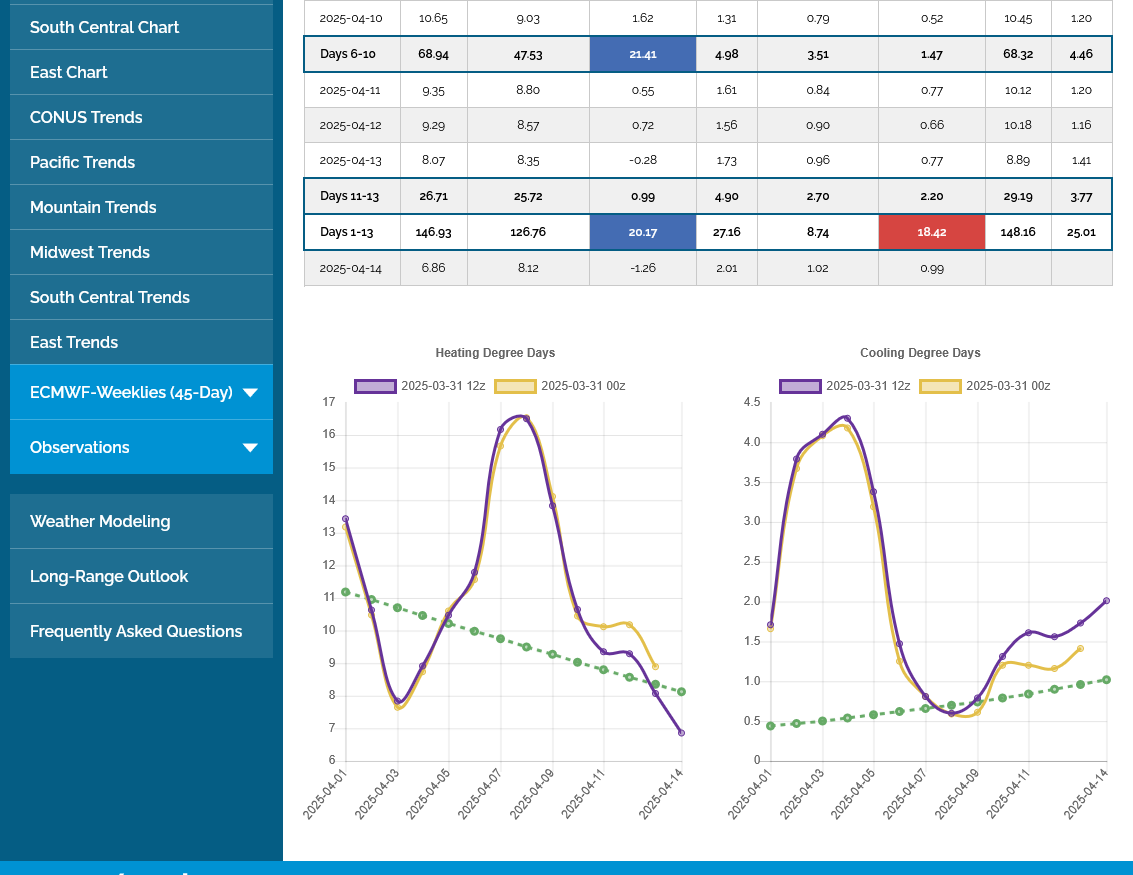
Last 12z EE. There's that 5 day early April cold snap. -1 HDDs vs the previous 0z run.
Total HDDs are + 20 HDDs vs average which isn't even 1 days worth in January. Interestingly, CDDs on the right were +18.4 CDDs above average, so if we add them together, +38.4 DD's is a bit more impressive.
We're getting unusual chilly weather AND unusually very warm weather in the same period, which not coincidentally is the same reason that we have having severe weather outbreaks this week!
Been busy following our extreme weather!
Natural gas is taking it on the chin during a time frame when it usually goes up. Likely in response to the expected Trump recession which will cut industrial demand for natural gas to generate electricity.
https://tradingeconomics.com/commodity/natural-gas
NG behaved similarly with COVID late winter to early spring. It ignored some bullish wx and mainly dropped.
Yes, I remember that Larry.
It made its low in June 2020, when the seasonal low usually happens around the March time frame give or take a few weeks.
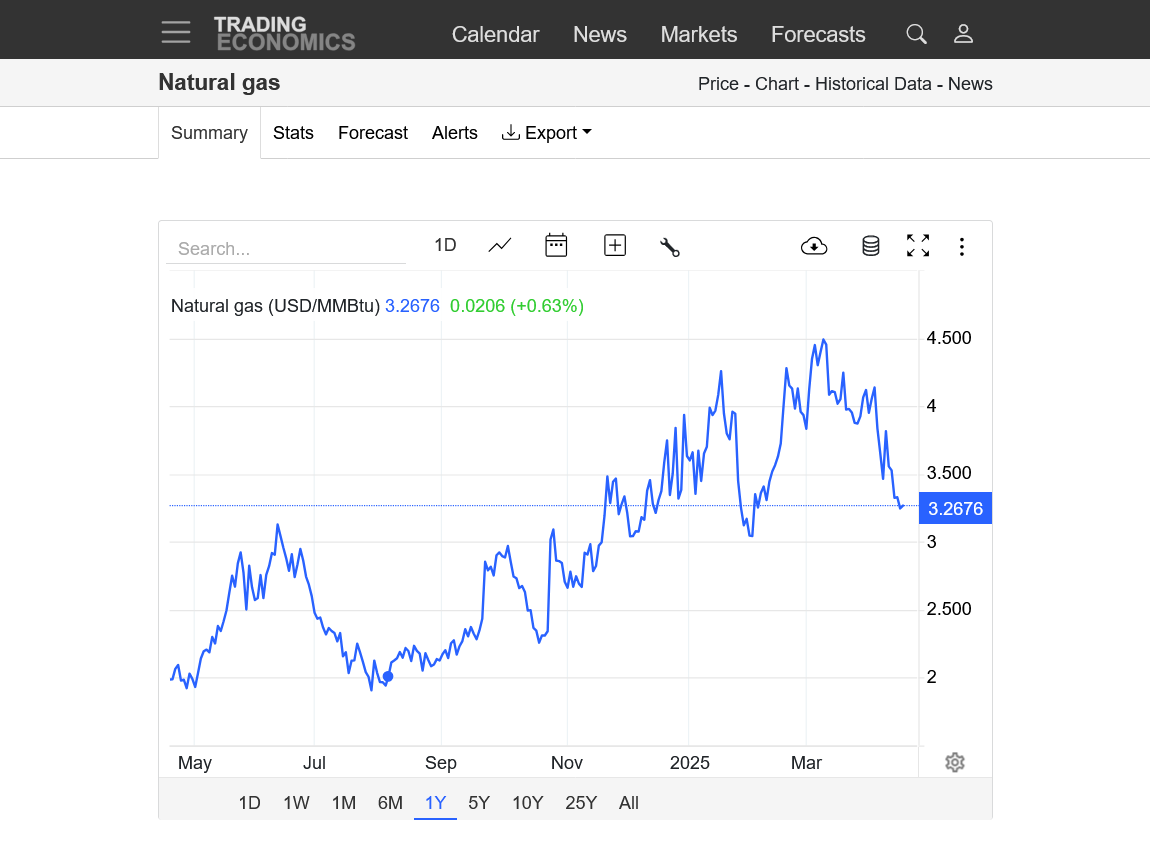
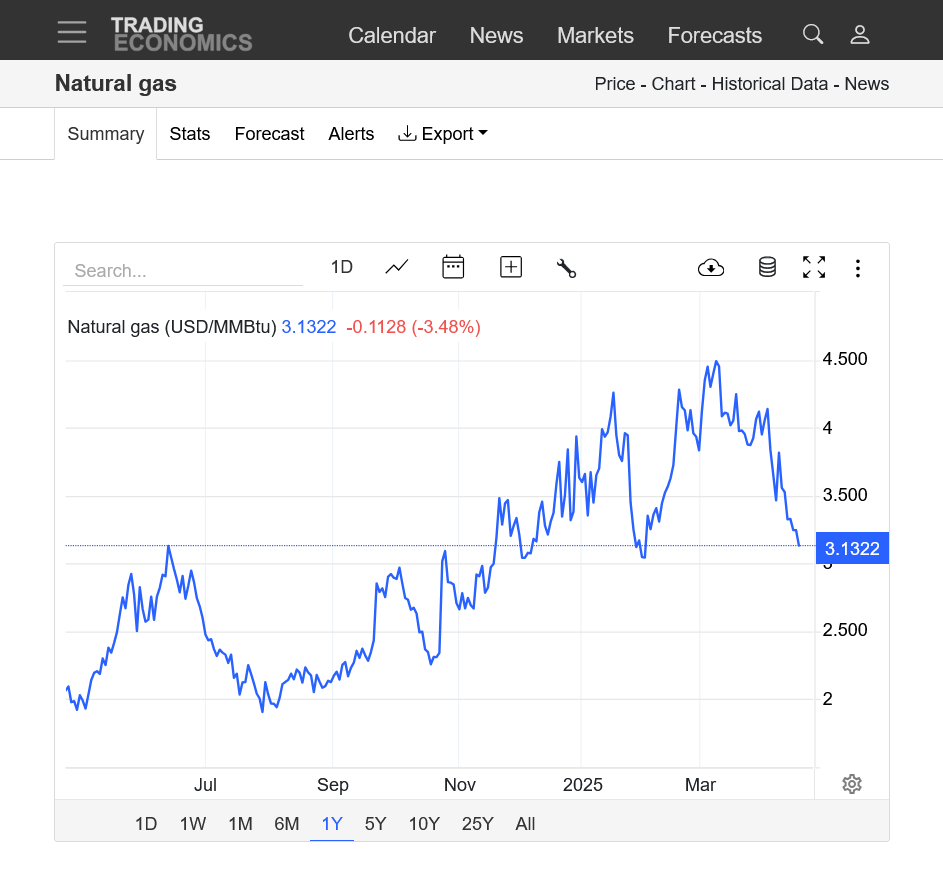
https://tradingeconomics.com/commodity/natural-gas
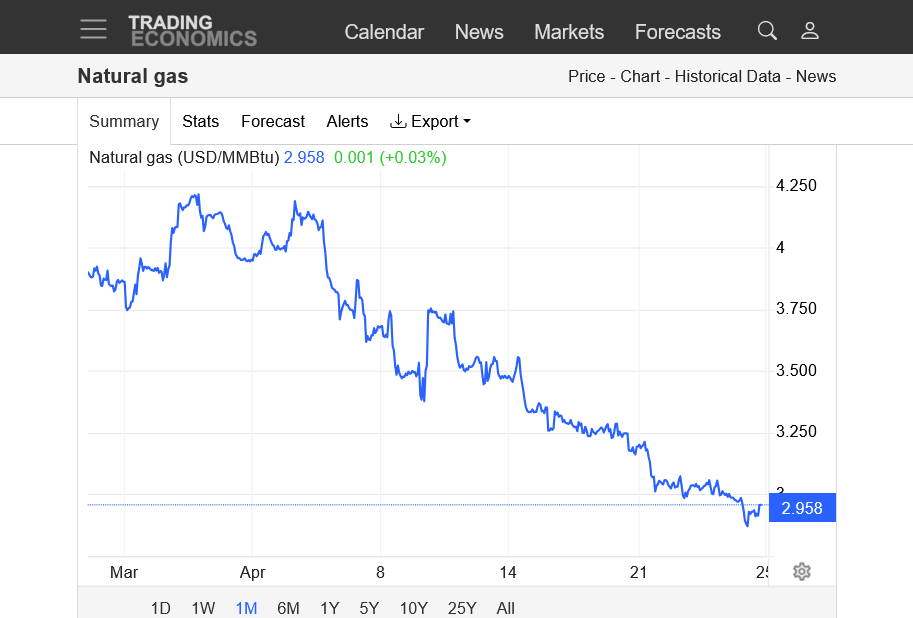
1. 1 month-major short term downtrend at a time of year when prices normally go up.
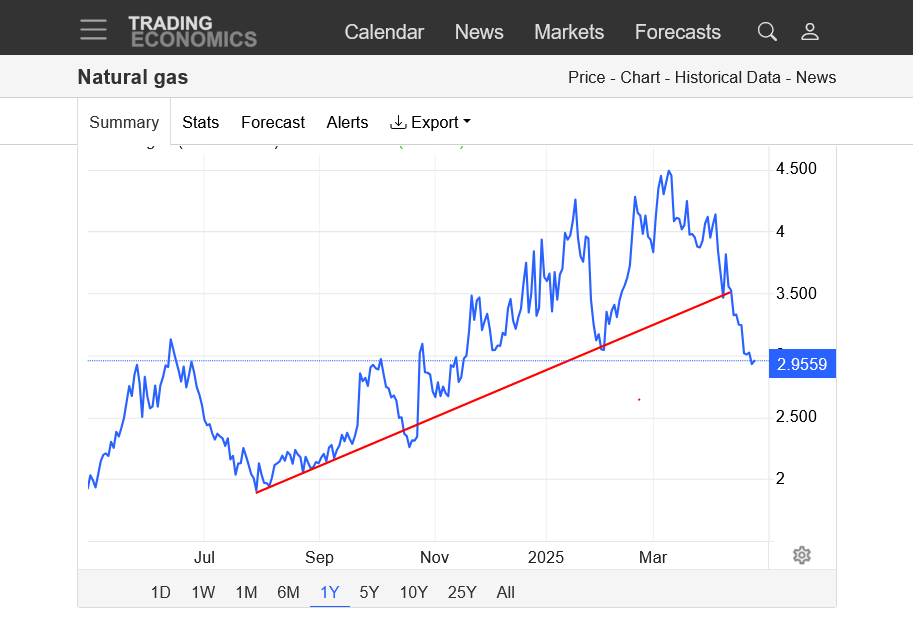
2. 1 year-breaking the uptrend line
3. 10 years-negating the upside break out technical formation, triggered from the COLD Winter, which caused widespread, very strong and persistent demand for heating in the high population areas. This resulted in a storage draw down that took storage from near record highs down to below the 5 year range.
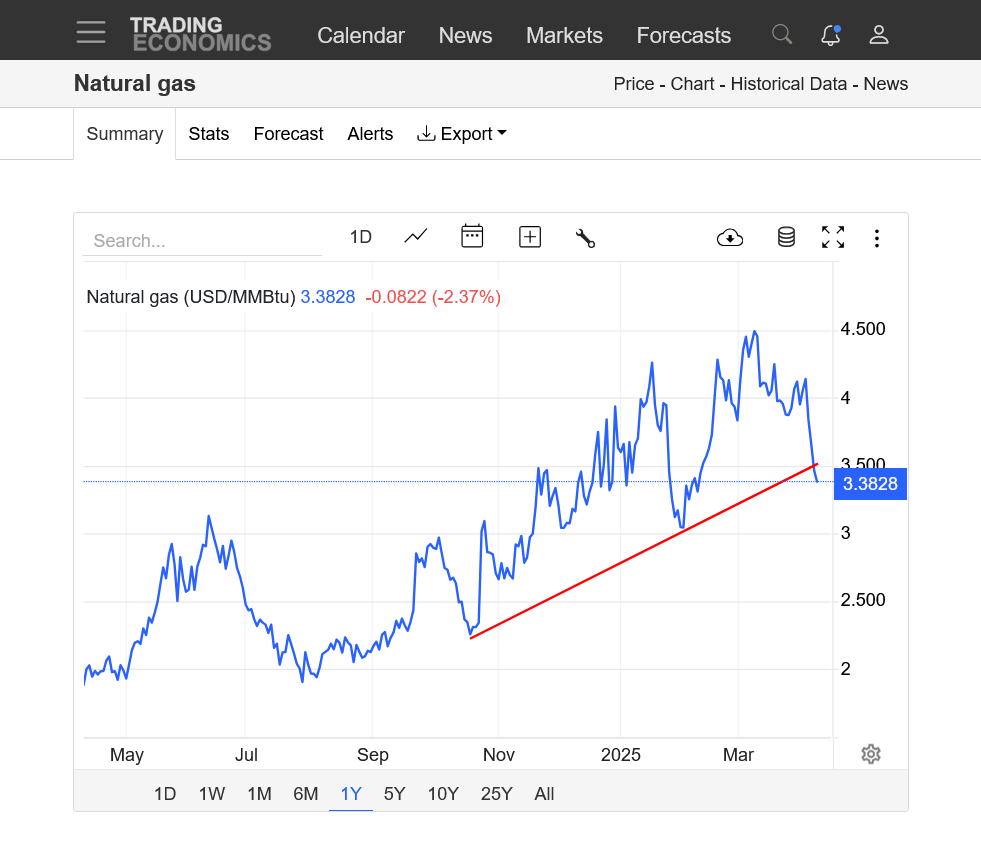
Note the blue line on the graph. The bottom in storage came early(bearish) and we've closed the gap between a storage deficit and the 5 year average line(bearish). Despite very bullish seasonals. The market has also been dialing in an expected drop in industrial demand from the likely Trump recession.
![]()
for week ending April 4, 2025 | Released: April 10, 2025 at 10:30 a.m. | Next Release: April 17, 2025
| Working gas in underground storage, Lower 48 states Summary text CSV JSN | |||||||||||||||||||||||||
|---|---|---|---|---|---|---|---|---|---|---|---|---|---|---|---|---|---|---|---|---|---|---|---|---|---|
| Historical Comparisons | |||||||||||||||||||||||||
| Stocks billion cubic feet (Bcf) | Year ago (04/04/24) | 5-year average (2020-24) | |||||||||||||||||||||||
| Region | 04/04/25 | 03/28/25 | net change | implied flow | Bcf | % change | Bcf | % change | |||||||||||||||||
| East | 296 | 284 | 12 | 12 | 362 | -18.2 | 326 | -9.2 | |||||||||||||||||
| Midwest | 373 | 364 | 9 | 9 | 512 | -27.1 | 422 | -11.6 | |||||||||||||||||
| Mountain | 165 | 165 | 0 | 0 | 165 | 0.0 | 109 | 51.4 | |||||||||||||||||
| Pacific | 206 | 202 | 4 | 4 | 229 | -10.0 | 174 | 18.4 | |||||||||||||||||
| South Central | 789 | 758 | 31 | 31 | 1,011 | -22.0 | 838 | -5.8 | |||||||||||||||||
| Salt | 233 | 218 | 15 | 15 | 298 | -21.8 | 249 | -6.4 | |||||||||||||||||
| Nonsalt | 557 | 540 | 17 | 17 | 712 | -21.8 | 589 | -5.4 | |||||||||||||||||
| Total | 1,830 | 1,773 | 57 | 57 | 2,280 | -19.7 | 1,870 | -2.1 | |||||||||||||||||
| Totals may not equal sum of components because of independent rounding. | |||||||||||||||||||||||||
Working gas in storage was 1,830 Bcf as of Friday, April 4, 2025, according to EIA estimates. This represents a net increase of 57 Bcf from the previous week. Stocks were 450 Bcf less than last year at this time and 40 Bcf below the five-year average of 1,870 Bcf. At 1,830 Bcf, total working gas is within the five-year historical range.
For information on sampling error in this report, see Estimated Measures of Sampling Variability table below.
Note: The shaded area indicates the range between the historical minimum and maximum values for the weekly series from 2020 through 2024. The dashed vertical lines indicate current and year-ago weekly periods.
++++++++++++
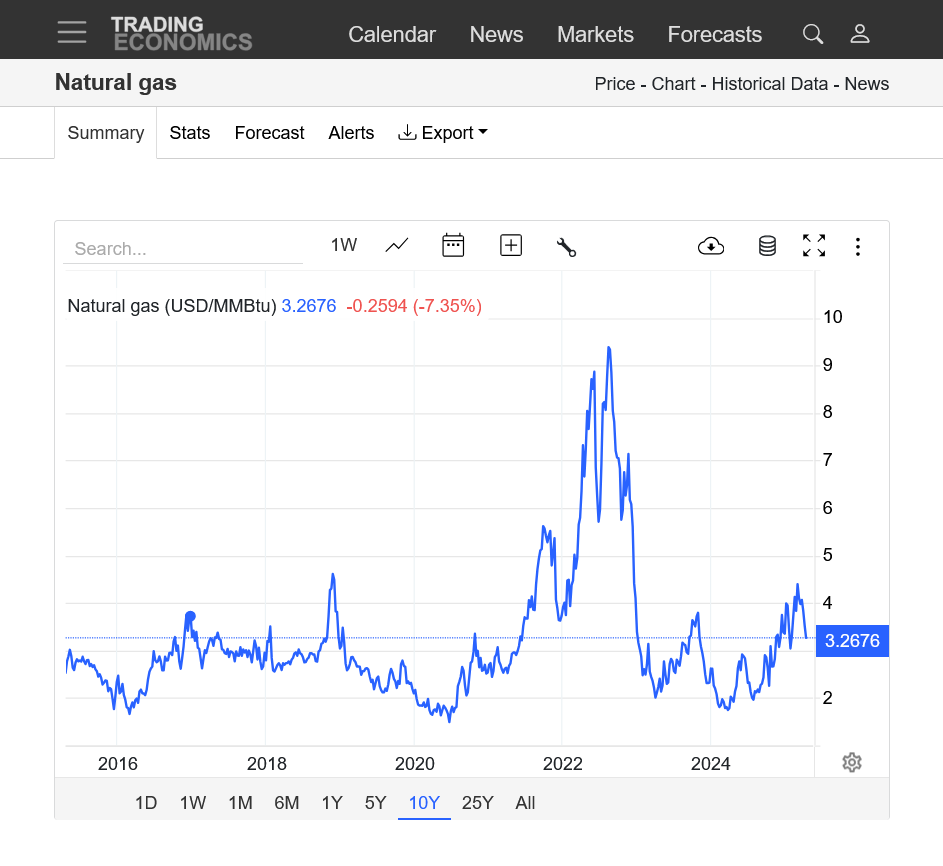
https://tradingeconomics.com/commodity/natural-gas
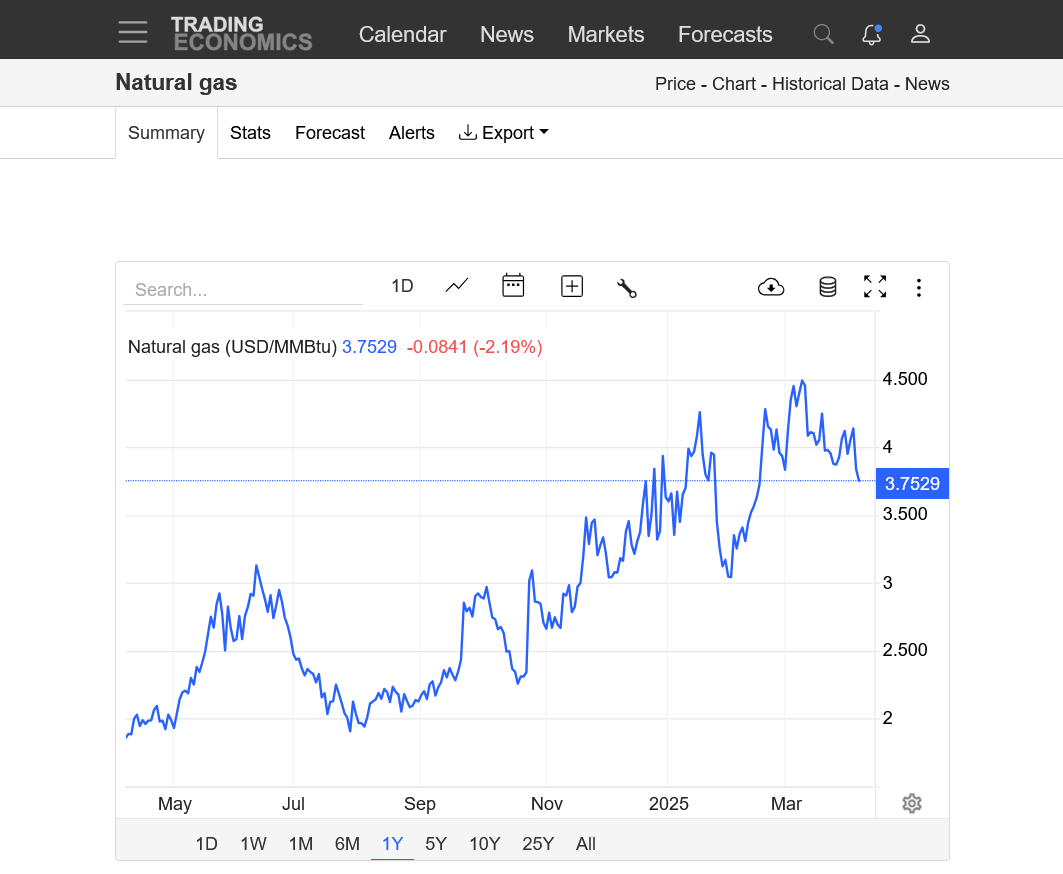
1. 1 month
2. 1 year
3. 10 years
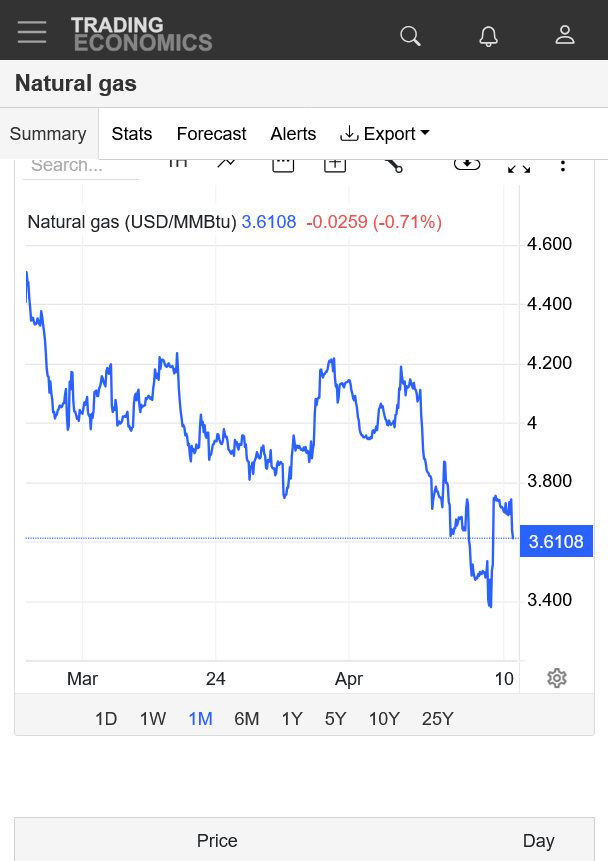
NG is a bit lower again. Weather demand for electricity generated by burning natural gas to heat and cool homes in late April is usually not enough to be a price driver.
NG spike up early Monday, not sure why, maybe just from being oversold? but quickly succumbed to heavy selling down to new lows for the move.
We’re only a bit above that right now.
NG almost always goes up in April but not this year.
Anticipated Trump recession and building storage are mega bearish.
Natural gas futures tumbled lower on Wednesday as market participants wrestled with the rapidly evolving details of global trade disputes that could stall the U.S. economy and sap energy demand.
https://www.naturalgasintel.com/
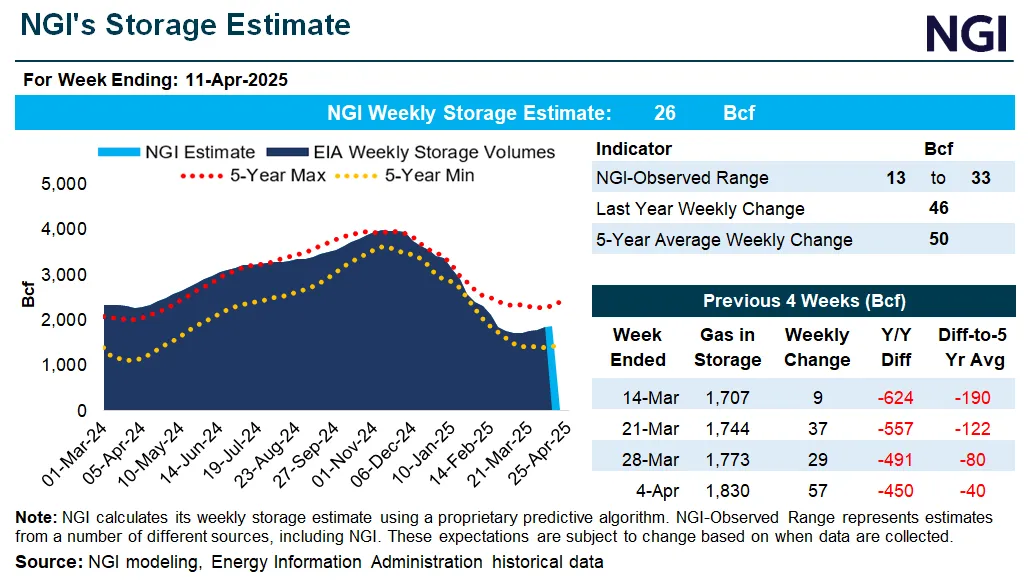
We can see above that NG has been closing the storage gap of 2025 vs last year and the 5 year average.
+++++++++++++
Temperatures last week for the EIA storage report on Thursday at 9:30am. Chilly Midwest/Northeast to TX.
Warm West and Southeast.
https://www.cpc.ncep.noaa.gov/products/tanal/temp_analyses.php
1. 1 month-very contra seasonal.
2. 1 year-broken the uptrend caused by the cold Winter and huge storage drawdown
3. 10 years-Clear top is in
https://tradingeconomics.com/commodity/natural-gas
https://charts.equityclock.com/natural-gas-futures-ng-seasonal-chart
The EIA was a bit bullish vs expectations which resulted in a knee jerk, spike up for a short while but we have come back down from the bearish reality that includes a likely Trump recession from the tariffs.
Note the current storage number below in blue has eroded most of the deficit compared to the 5 year average.
Stocks are still -480 Bcf compared to last year at the end of Winter. The difference is mainly from last year having the mildest Winter ever(a good thing) and this year having a colder than average Winter.
![]()
for week ending April 11, 2025 | Released: April 17, 2025 at 10:30 a.m. | Next Release: April 24, 2025
| Working gas in underground storage, Lower 48 states Summary text CSV JSN | |||||||||||||||||||||||||
|---|---|---|---|---|---|---|---|---|---|---|---|---|---|---|---|---|---|---|---|---|---|---|---|---|---|
| Historical Comparisons | |||||||||||||||||||||||||
| Stocks billion cubic feet (Bcf) | Year ago (04/11/24) | 5-year average (2020-24) | |||||||||||||||||||||||
| Region | 04/11/25 | 04/04/25 | net change | implied flow | Bcf | % change | Bcf | % change | |||||||||||||||||
| East | 290 | 296 | -6 | -6 | 377 | -23.1 | 336 | -13.7 | |||||||||||||||||
| Midwest | 373 | 373 | 0 | 0 | 526 | -29.1 | 433 | -13.9 | |||||||||||||||||
| Mountain | 166 | 165 | 1 | 1 | 167 | -0.6 | 110 | 50.9 | |||||||||||||||||
| Pacific | 213 | 206 | 7 | 7 | 230 | -7.4 | 178 | 19.7 | |||||||||||||||||
| South Central | 804 | 789 | 15 | 15 | 1,027 | -21.7 | 863 | -6.8 | |||||||||||||||||
| Salt | 242 | 233 | 9 | 9 | 300 | -19.3 | 259 | -6.6 | |||||||||||||||||
| Nonsalt | 562 | 557 | 5 | 5 | 727 | -22.7 | 604 | -7.0 | |||||||||||||||||
| Total | 1,846 | 1,830 | 16 | 16 | 2,326 | -20.6 | 1,920 | -3.9 | |||||||||||||||||
| Totals may not equal sum of components because of independent rounding. | |||||||||||||||||||||||||
Working gas in storage was 1,846 Bcf as of Friday, April 11, 2025, according to EIA estimates. This represents a net increase of 16 Bcf from the previous week. Stocks were 480 Bcf less than last year at this time and 74 Bcf below the five-year average of 1,920 Bcf. At 1,846 Bcf, total working gas is within the five-year historical range.
For information on sampling error in this report, see Estimated Measures of Sampling Variability table below.
Note: The shaded area indicates the range between the historical minimum and maximum values for the weekly series from 2020 through 2024. The dashed vertical lines indicate current and year-ago weekly periods.
1. 1 month-strong down trend but the ranges are tightening up. Increasing storage and bearish weather! Prices have dropped $10,000/contract in this short period.........at a time of year when prices almost always to up!!!
2. 1 year. Uptrend from the cold Winter and resulting huge draw down in storage has been decisively broken.
3. 10 years: Fake break out above major resistance just below $4. The surge up from the cold Winter ended when the cold ended. Fundamentals have turned bearish.
https://tradingeconomics.com/commodity/natural-gas
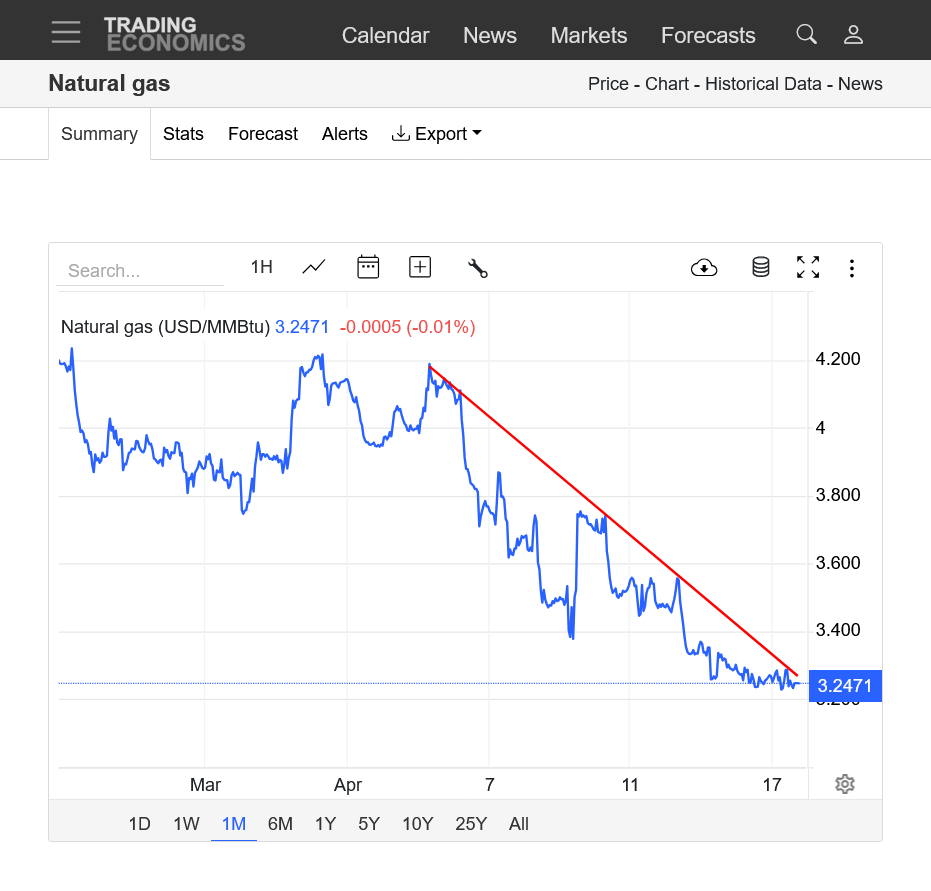
Natural gas continues to crash at a time of year when it almost always goes up. Acting like a Trump recession will cause reduced industrial demand is on the way.
The chart below suggests that this could be major support but this free fall is going to be hard to stop. There is some major heat (for early Spring) on the way but it's probably too early in the cooling season.
https://tradingeconomics.com/commodity/natural-gas
+++++++++++++++
Some early season heat but only as much to balance the lack of late season cold!
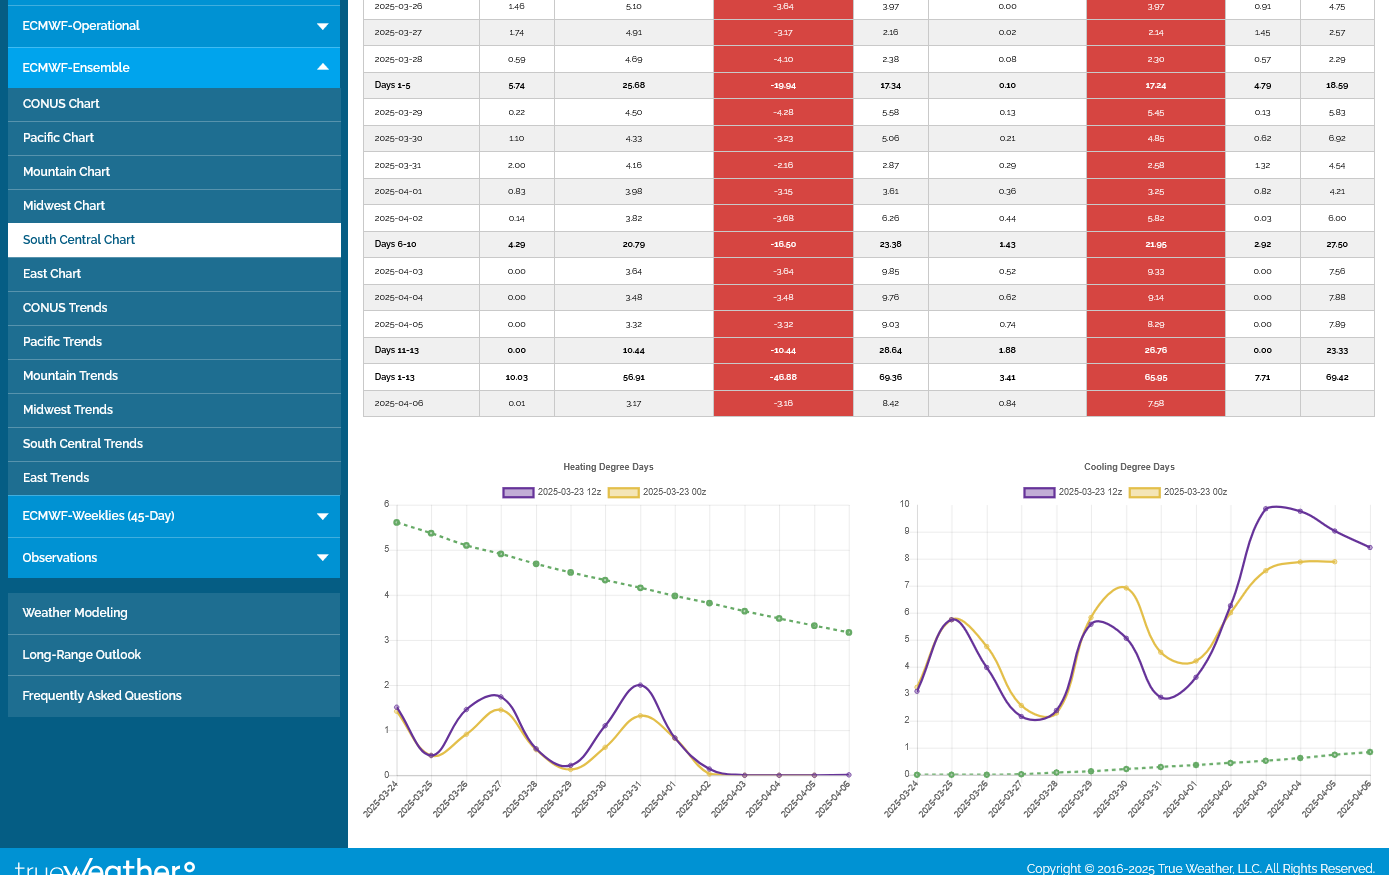
This was the last 0z European model, HDDs on the left, last run in purple (they were -4 HDDs)
CDDs on the right, they were also down must -1 CDDs. HDDs on HDDs are still seasonally higher than CDDs until early May. A bit unusual for BOTH to be down on the same run but it means less cold in the northern US and simultaneously, slightly less heat in the southern US.
$3 is psychological support for natural gas, which has crashed over $10,000/contract since the start of this month.
https://tradingeconomics.com/commodity/natural-gas
Mike et al,
NG finally fell below $3 briefly before rising back above that psychological level. Then it again dropped below $3 ~24 hours ago and has since stayed below $3. Last price: $2.921.
Low of day: ~$2.86 just after quite a bearish EIA was released. Actual was +88 with guess range having been +53 to +80. Storage pushed up to being only 44 below the 5 year avg:
Thanks very much, Larry!
We went from almost record high storage going into this last heating season, then a cold Winter and huge draw downs, taking storage to the bottom of the 5 year range then, an early bottom in storage and massive gains vs the average storage, including this one!
We can see that with the blue line on the graph below.
for week ending April 18, 2025 | Released: April 24, 2025 at 10:30 a.m. | Next Release: May 1, 2025
| Working gas in underground storage, Lower 48 states Summary text CSV JSN | |||||||||||||||||||||||||
|---|---|---|---|---|---|---|---|---|---|---|---|---|---|---|---|---|---|---|---|---|---|---|---|---|---|
| Historical Comparisons | |||||||||||||||||||||||||
| Stocks billion cubic feet (Bcf) | Year ago (04/18/24) | 5-year average (2020-24) | |||||||||||||||||||||||
| Region | 04/18/25 | 04/11/25 | net change | implied flow | Bcf | % change | Bcf | % change | |||||||||||||||||
| East | 295 | 290 | 5 | 5 | 404 | -27.0 | 349 | -15.5 | |||||||||||||||||
| Midwest | 396 | 373 | 23 | 23 | 548 | -27.7 | 446 | -11.2 | |||||||||||||||||
| Mountain | 171 | 166 | 5 | 5 | 172 | -0.6 | 113 | 51.3 | |||||||||||||||||
| Pacific | 221 | 213 | 8 | 8 | 234 | -5.6 | 183 | 20.8 | |||||||||||||||||
| South Central | 851 | 804 | 47 | 47 | 1,053 | -19.2 | 887 | -4.1 | |||||||||||||||||
| Salt | 266 | 242 | 24 | 24 | 308 | -13.6 | 269 | -1.1 | |||||||||||||||||
| Nonsalt | 585 | 562 | 23 | 23 | 746 | -21.6 | 618 | -5.3 | |||||||||||||||||
| Total | 1,934 | 1,846 | 88 | 88 | 2,412 | -19.8 | 1,978 | -2.2 | |||||||||||||||||
| Totals may not equal sum of components because of independent rounding. | |||||||||||||||||||||||||
Working gas in storage was 1,934 Bcf as of Friday, April 18, 2025, according to EIA estimates. This represents a net increase of 88 Bcf from the previous week. Stocks were 478 Bcf less than last year at this time and 44 Bcf below the five-year average of 1,978 Bcf. At 1,934 Bcf, total working gas is within the five-year historical range.
For information on sampling error in this report, see Estimated Measures of Sampling Variability table below.
Note: The shaded area indicates the range between the historical minimum and maximum values for the weekly series from 2020 through 2024. The dashed vertical lines indicate current and year-ago weekly periods.
1. 1 month. Dropping $12,000/contract at a time when prices almost always goes up.
2. 1 year-uptrend broken
3. 10 years
https://tradingeconomics.com/commodity/natural-gas
The May contract will be expiring early next week, so we will be looking at the June contract soon which already has the most volume.
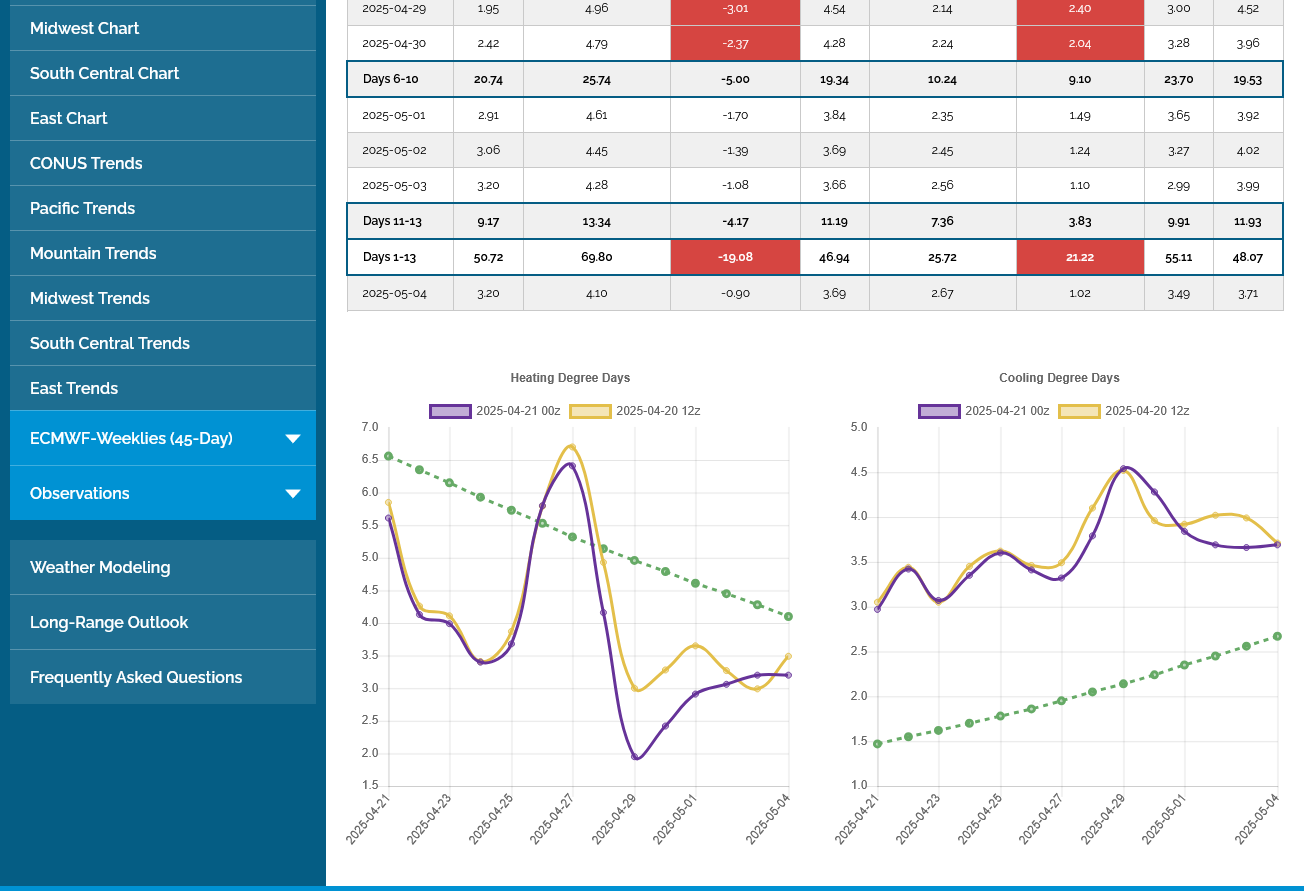
The HDDs on the left are falling fast and CDDs on the right rising fast. You can see that they reach the same value at the very end of the period, which is May 9th.
HDDs are around -4 DDs BELOW average but CDDs are +17 DDs ABOVE average. It's a low period of use overall but the weather is a tad bullish because of this.
In January, its possible to be +13 HDDs for just one day, so this is not a big deal.
7 day temps for this Thursdays EIA storage report. Very warm Eastern 40%.
https://www.cpc.ncep.noaa.gov/products/tanal/temp_analyses.php
This is a flawed assessment from earlier. June NG is +2,000/contract+ just before noon. The front month, May expires today. NG can be pretty volatile and unpredictable ahead of expiration.
+++++++++++++++
1. 1 week: We gapped higher on the open last night(June contract), barely filled the gap with a spike down at 7:30am, then continued higher.
2. 1 year: Double bottom with January 31, 2025 low in addition with ROCK SOLID SUPPORT at $3 holding. Temporary???
3. 10 years. The Summer weather demand(natural gas burned to generate electricity for AC cooling) will play a role in where we go the next several months.
https://tradingeconomics.com/commodity/natural-gas
Sure looks like at least a temporary low at rock solid support of $3! However, a major trump recession will cut industrial demand and could negate that. This could end up just being a bear flag because the trend has turned down sharply.
https://tradingeconomics.com/commodity/natural-gas
+++++
Rapidly rising CDDs pass up rapidly falling HDDs seasonally on May 10th.
We have some heat in the forecast.......but it's in places that usually have lingering HDDs. The CDD areas in the south during early May will NOT be that hot.
Huge injection with a 3 hour delayed report. The market must have been expecting something even MORE huge.
The fast growing storage on the graph below with the blue line just passed up the 5 year average for the first time since early this year, when the cold Winter quickly eroded storage down towards the lower part of the 5 year RANGE.
![]()
for week ending April 25, 2025 | Released: May 1, 2025 at 2:00 p.m. | Next Release: May 8, 2025
| Working gas in underground storage, Lower 48 states Summary text CSV JSN | |||||||||||||||||||||||||
|---|---|---|---|---|---|---|---|---|---|---|---|---|---|---|---|---|---|---|---|---|---|---|---|---|---|
| Historical Comparisons | |||||||||||||||||||||||||
| Stocks billion cubic feet (Bcf) | Year ago (04/25/24) | 5-year average (2020-24) | |||||||||||||||||||||||
| Region | 04/25/25 | 04/18/25 | net change | implied flow | Bcf | % change | Bcf | % change | |||||||||||||||||
| East | 331 | 295 | 36 | 36 | 423 | -21.7 | 360 | -8.1 | |||||||||||||||||
| Midwest | 425 | 396 | 29 | 29 | 562 | -24.4 | 459 | -7.4 | |||||||||||||||||
| Mountain | 174 | 171 | 3 | 3 | 181 | -3.9 | 118 | 47.5 | |||||||||||||||||
| Pacific | 226 | 221 | 5 | 5 | 239 | -5.4 | 189 | 19.6 | |||||||||||||||||
| South Central | 885 | 851 | 34 | 34 | 1,071 | -17.4 | 910 | -2.7 | |||||||||||||||||
| Salt | 281 | 266 | 15 | 15 | 313 | -10.2 | 278 | 1.1 | |||||||||||||||||
| Nonsalt | 605 | 585 | 20 | 20 | 758 | -20.2 | 632 | -4.3 | |||||||||||||||||
| Total | 2,041 | 1,934 | 107 | 107 | 2,476 | -17.6 | 2,036 | 0.2 | |||||||||||||||||
| Totals may not equal sum of components because of independent rounding. | |||||||||||||||||||||||||
Working gas in storage was 2,041 Bcf as of Friday, April 25, 2025, according to EIA estimates. This represents a net increase of 107 Bcf from the previous week. Stocks were 435 Bcf less than last year at this time and 5 Bcf above the five-year average of 2,036 Bcf. At 2,041 Bcf, total working gas is within the five-year historical range.
For information on sampling error in this report, see Estimated Measures of Sampling Variability table below.
Note: The shaded area indicates the range between the historical minimum and maximum values for the weekly series from 2020 through 2024. The dashed vertical lines indicate current and year-ago weekly periods.
++++++++++++++++++++
https://tradingeconomics.com/commodity/natural-gas
1. 1 day: Spike up from the EIA report on this daily chart. The market retested the pre-report level and that held for now.
2. 1 Year" Double bottom formation with January 31st low. Rock solid support of $3. However, the trend shifted to down and fundamentals are pretty bearish, so this might just be a bear flag? Or positive seasonals may help the bulls.
Mike said: “Huge injection with a 3 hour delayed report. The market must have been expecting something even MORE huge.”
———————
Hey Mike,
The range of guesses was +93 to +120 per NGI. So, the actual of +107 was near the midpoint/seemingly neutral. I’m betting a lot of this was buying on the news due to other factors being net bullish. Also, with the release being so late/close to the day session “close” of 1:30PM CDT, the dynamics for the speculative funds were different from the norm. That’s my take fwiw.
Thanks, Larry
I saw that range for expectations but am basing it purely on the markets reaction.
A spike up of over $1,000/contract in seconds exactly after the release of the EIA number with no other new news.
Then selling off back to the pre report level over the next couple of hours.
Market reaction is often a much better indicator than what guessing services tell us the market expection is.
they can poll as many people as they want before but it will always be a very minuscule number compared to the many thousands of traders…aka “the market” or what Richard Wyckoff referred to as “the composite man” which is putting their money where their mouth is.
As they say, “the market is always right” at least for any point in time for determining the price of things based on what price they agree on.
Changes in price for natural gas happen for a dozen different reasons and apply to different time frames.
One of the most unique amongst them is the knee jerk price reaction immediately after a weekly EIA report.
Like you astutely noted, the big delay in the EIA report to near the close likely impacted some day trading algorithms for big traders that have different trading strategies early in the session compared to near the close.
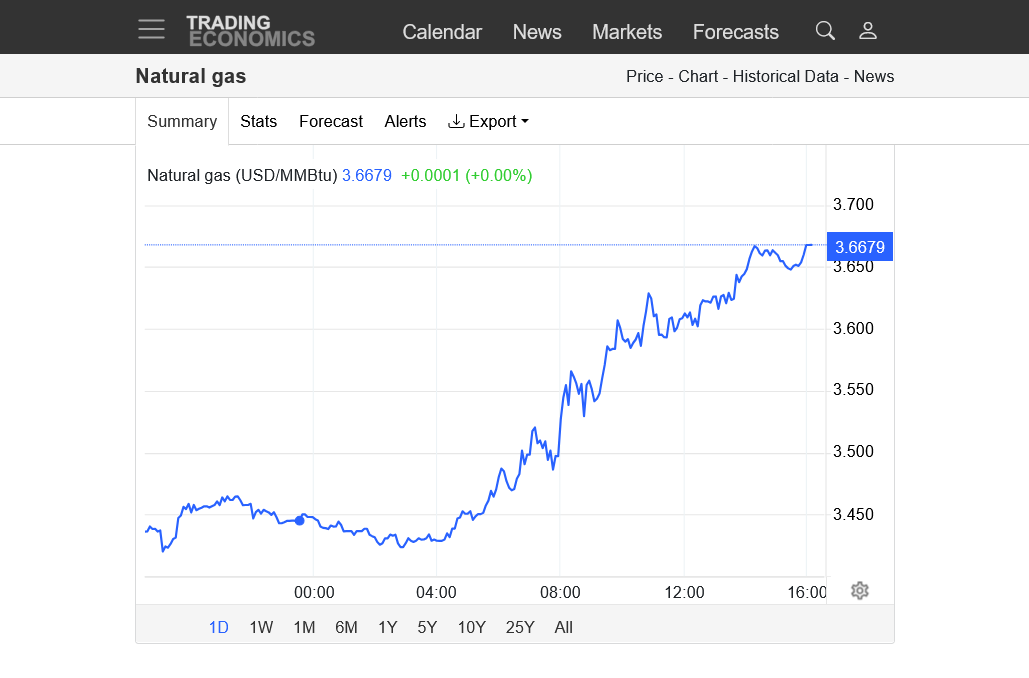
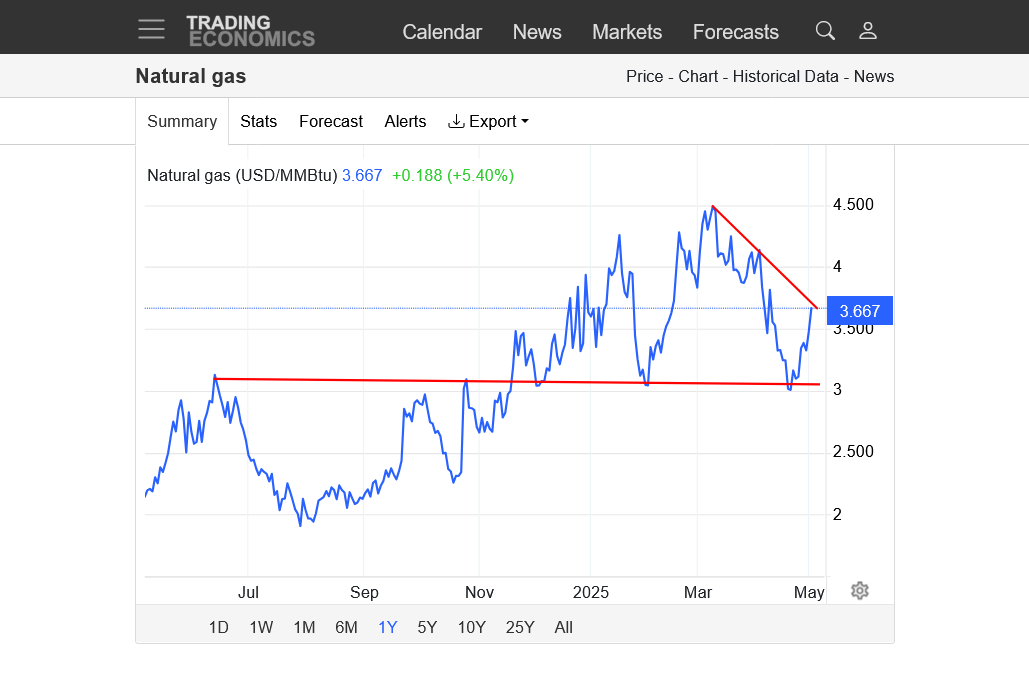
https://tradingeconomics.com/commodity/natural-gas
1. 1 day: another huge day up
2. 1 year: Held mega support at $3, now testing the downtrend from the March 10th high to the April 3 high resistance spike highs.
HDDS on the left. CDDS on the right.
Looks like seasonally, CDDS pass up HDDS around May 9th. During week 2 of this forecast CDDS pass up HDDS, probably for this season and until this October.
Temps from,last week for this Thursday's EIA. Warm South.
https://www.cpc.ncep.noaa.gov/products/tanal/temp_analyses.php
The market is -$1,000/contract since this number came out just over an hour ago.
The blue line on the graph below, which is the current supply is just ABOVE the 5 year average but still -412 Bcf vs last year.
The cold Winter caused a huge drawdown in storage, starting near record highs to start the season, down to the bottom of the 5 year range to end the heating season.
Very mild weather in March/April caused the storage bottom to happen 2+ weeks early and the injection season to begin 2+ weeks early.
![]()
for week ending May 2, 2025 | Released: May 8, 2025 at 10:30 a.m. | Next Release: May 15, 2025
| Working gas in underground storage, Lower 48 states Summary text CSV JSN | |||||||||||||||||||||||||
|---|---|---|---|---|---|---|---|---|---|---|---|---|---|---|---|---|---|---|---|---|---|---|---|---|---|
| Historical Comparisons | |||||||||||||||||||||||||
| Stocks billion cubic feet (Bcf) | Year ago (05/02/24) | 5-year average (2020-24) | |||||||||||||||||||||||
| Region | 05/02/25 | 04/25/25 | net change | implied flow | Bcf | % change | Bcf | % change | |||||||||||||||||
| East | 362 | 331 | 31 | 31 | 450 | -19.6 | 379 | -4.5 | |||||||||||||||||
| Midwest | 454 | 425 | 29 | 29 | 586 | -22.5 | 478 | -5.0 | |||||||||||||||||
| Mountain | 180 | 174 | 6 | 6 | 190 | -5.3 | 124 | 45.2 | |||||||||||||||||
| Pacific | 232 | 226 | 6 | 6 | 245 | -5.3 | 198 | 17.2 | |||||||||||||||||
| South Central | 917 | 885 | 32 | 32 | 1,085 | -15.5 | 937 | -2.1 | |||||||||||||||||
| Salt | 293 | 281 | 12 | 12 | 314 | -6.7 | 286 | 2.4 | |||||||||||||||||
| Nonsalt | 624 | 605 | 19 | 19 | 771 | -19.1 | 650 | -4.0 | |||||||||||||||||
| Total | 2,145 | 2,041 | 104 | 104 | 2,557 | -16.1 | 2,115 | 1.4 | |||||||||||||||||
| Totals may not equal sum of components because of independent rounding. | |||||||||||||||||||||||||
Working gas in storage was 2,145 Bcf as of Friday, May 2, 2025, according to EIA estimates. This represents a net increase of 104 Bcf from the previous week. Stocks were 412 Bcf less than last year at this time and 30 Bcf above the five-year average of 2,115 Bcf. At 2,145 Bcf, total working gas is within the five-year historical range.
For information on sampling error in this report, see Estimated Measures of Sampling Variability table below.
Note: The shaded area indicates the range between the historical minimum and maximum values for the weekly series from 2020 through 2024. The dashed vertical lines indicate current and year-ago weekly periods.
Hey Mike,
Per NGI, guesses were +96 to +107 with median of +101 vs actual of +104. Bloomberg median was +100.
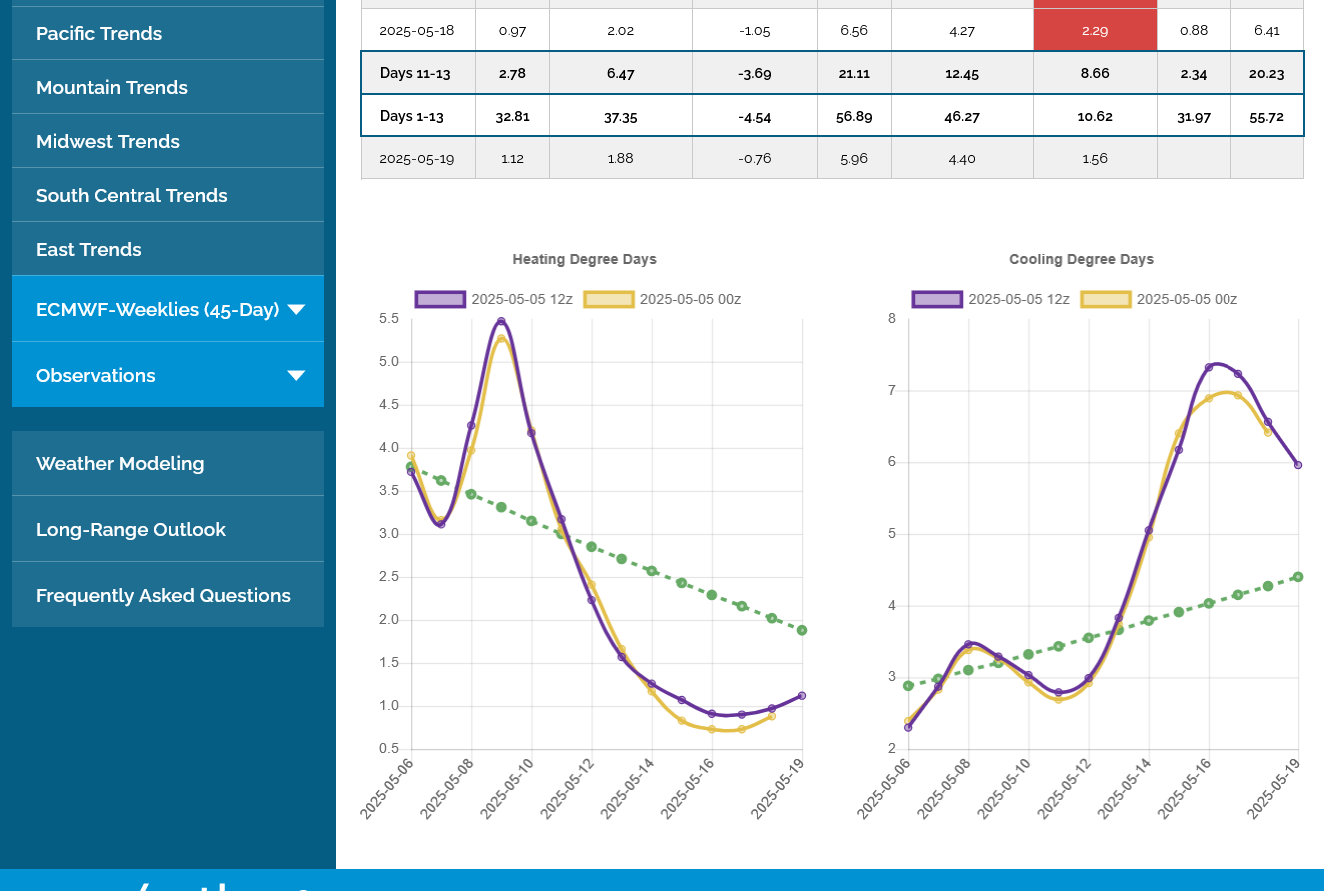
Is the upcoming heat, cranking up the CDDs on the right(below) bullish NG so early in the cooling season?
Yes!
CDDs are +21.87 above average for the 2 week period. Not a huge number compared to a mid Summer heat wave or anything close to a mid Winter Arctic blast but bullish when combined with seasonals and the markets bottoming formation on the charts last
We've had an upside break out above the downtrend line from the charts above.
7 day temps for this next EIA. Warm in places that usually have lingering HDDs, cool in places that often have early CDDs........should be another robust injection!
https://www.cpc.ncep.noaa.gov/products/tanal/temp_analyses.php
HDDs don't matter anymore.
CDDs spike higher for several days and remain a bit elevated late in the period.
https://tradingeconomics.com/commodity/natural-gas
1. 1 day-how do you trade a chart like this, especially using weather?
Answer: You can't!!! Look at all the wild gyrations up and down the last day. Was this a major short term top? Spike to new high then sharply lower close -$1,500/contract
2. 1 month-short term top and reversal lower today. I think the huge rally this month has partly been from HOT Summer 2025 forecast updates late last month/earlier this month.
3. 1 year
4. 10 years
Natural gas continues lower after Mondays reversal lower:
1. 1 month below
https://tradingeconomics.com/commodity/natural-gas
HUGE injection! +110 Bcf. Quick spike lower of $1,000/contract. Bounced around $600 but still lower for the day.
We're now +57 Bcf above the 5 year average after dropping near the bottom of the 5 year range because of the cold Winter.(after starting the Winter/heating season with near record ng in storage).
Storage bottomed over 2 weeks early from a mild end to Winter and early start to the injection season.
![]()
for week ending May 9, 2025 | Released: May 15, 2025 at 10:30 a.m. | Next Release: May 22, 2025
| Working gas in underground storage, Lower 48 states Summary text CSV JSN | |||||||||||||||||||||||||
|---|---|---|---|---|---|---|---|---|---|---|---|---|---|---|---|---|---|---|---|---|---|---|---|---|---|
| Historical Comparisons | |||||||||||||||||||||||||
| Stocks billion cubic feet (Bcf) | Year ago (05/09/24) | 5-year average (2020-24) | |||||||||||||||||||||||
| Region | 05/09/25 | 05/02/25 | net change | implied flow | Bcf | % change | Bcf | % change | |||||||||||||||||
| East | 396 | 362 | 34 | 34 | 478 | -17.2 | 402 | -1.5 | |||||||||||||||||
| Midwest | 480 | 454 | 26 | 26 | 610 | -21.3 | 498 | -3.6 | |||||||||||||||||
| Mountain | 185 | 180 | 5 | 5 | 195 | -5.1 | 131 | 41.2 | |||||||||||||||||
| Pacific | 237 | 232 | 5 | 5 | 251 | -5.6 | 208 | 13.9 | |||||||||||||||||
| South Central | 957 | 917 | 40 | 40 | 1,096 | -12.7 | 960 | -0.3 | |||||||||||||||||
| Salt | 308 | 293 | 15 | 15 | 313 | -1.6 | 292 | 5.5 | |||||||||||||||||
| Nonsalt | 648 | 624 | 24 | 24 | 782 | -17.1 | 668 | -3.0 | |||||||||||||||||
| Total | 2,255 | 2,145 | 110 | 110 | 2,630 | -14.3 | 2,198 | 2.6 | |||||||||||||||||
| Totals may not equal sum of components because of independent rounding. | |||||||||||||||||||||||||
Working gas in storage was 2,255 Bcf as of Friday, May 9, 2025, according to EIA estimates. This represents a net increase of 110 Bcf from the previous week. Stocks were 375 Bcf less than last year at this time and 57 Bcf above the five-year average of 2,198 Bcf. At 2,255 Bcf, total working gas is within the five-year historical range.
For information on sampling error in this report, see Estimated Measures of Sampling Variability table below.
Note: The shaded area indicates the range between the historical minimum and maximum values for the weekly series from 2020 through 2024. The dashed vertical lines indicate current and year-ago weekly periods.
+++++++++++++++++
Natural gas seasonals typically peak around this time of year into June.
Summer temps/heat will play a big role for determining prices in June onward.
https://agecoext.tamu.edu/wp-content/uploads/2023/02/Welch-Seasonality.pdf
NG gapped lower on the open on much cooler temps forecast for June!
https://tradingeconomics.com/commodity/natural-gas
1. 1 day-including Friday-whoops
2. 1 month
3. 1 year
Time to worry about 1930s type drought?
By metmike - May 18, 2025, 9:24 p.m.
mcfarm,
You are 100% on the money and understand this well!
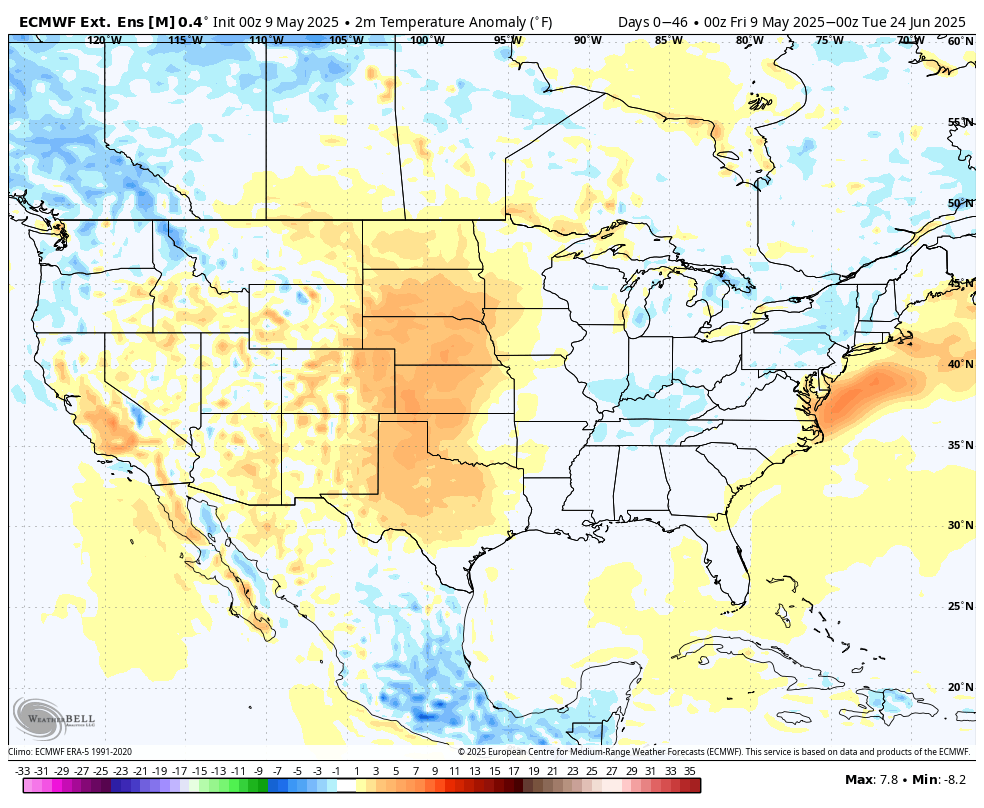
The last long range European model, thru July 3rd has cooled off even more and added more rains in the Midwest:
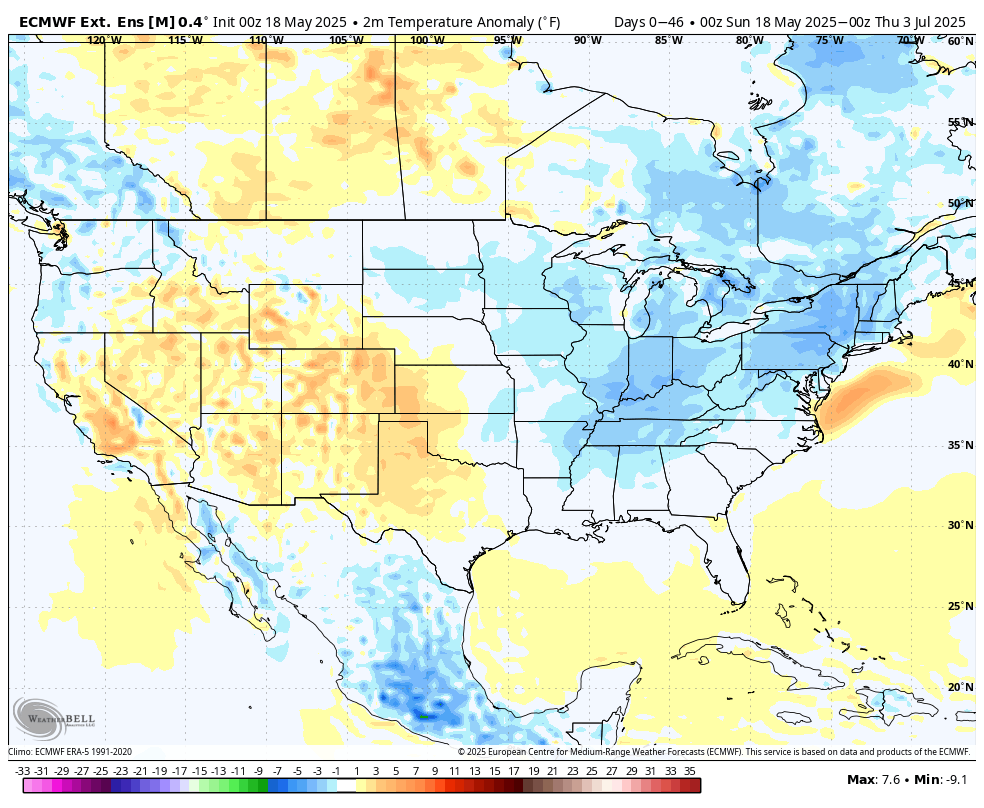
This was the same forecast just 9 days ago:
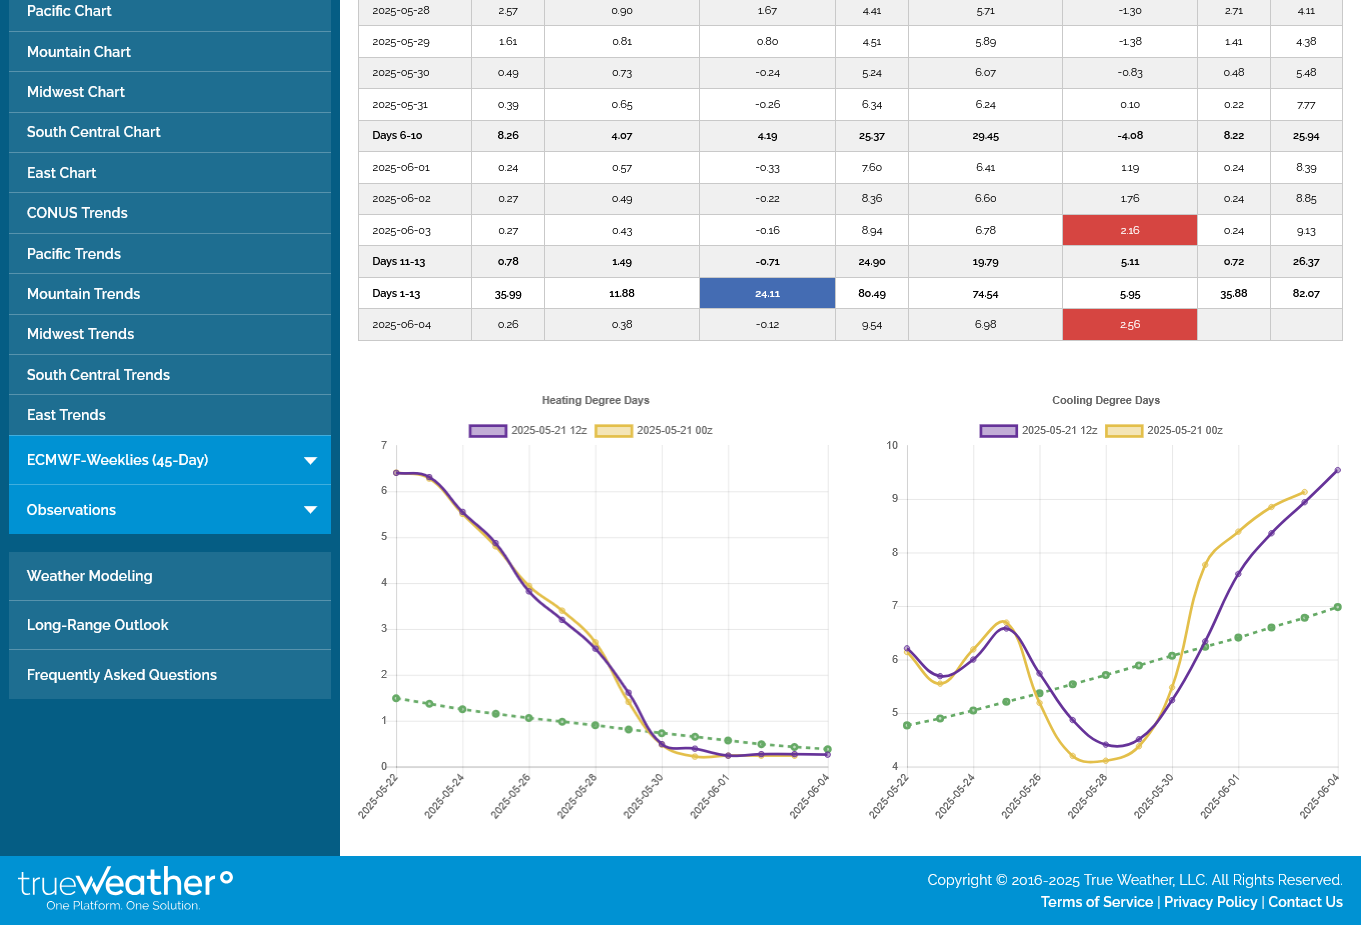
Heating up in week 2. CDDs on the right getting well above average later in the period.
HDDs on the left are actually unseasonably high but its late May and week of this cool weather generates as much HDDs as a day of Frigid weather in January.
This was the last 12z European Ensemble model.
+++++++++++
EIA storage report is out on Thursday at 9:30 am. Temps were VERY warm in the Northern Plains/Upper Midwest last week. That probably caused some CDDs at a time of year when they are near 0 that far north but it also reduced the HDDs in that area to near 0. A very robust injection is expected.
https://www.cpc.ncep.noaa.gov/products/tanal/temp_analyses.php
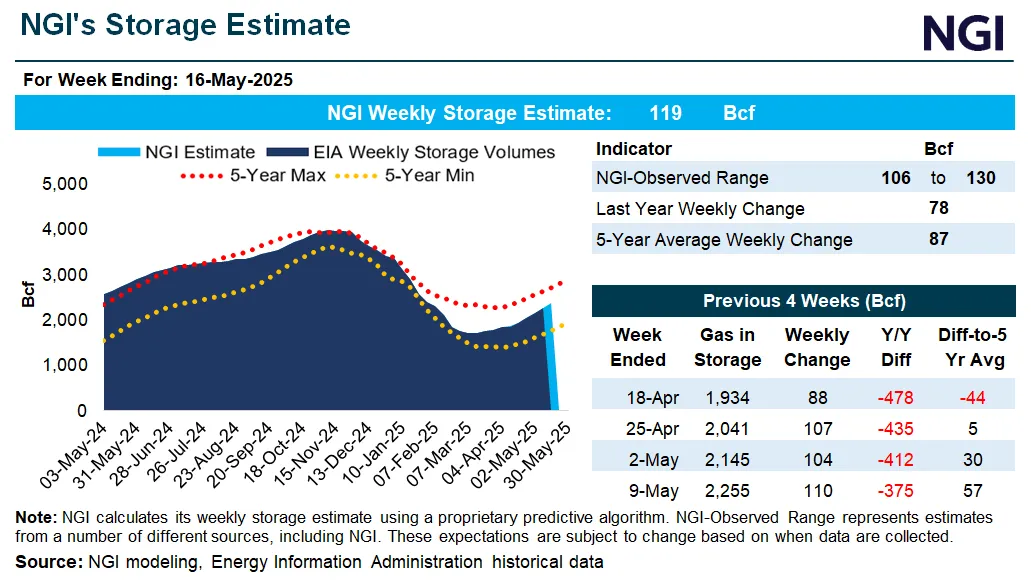
As expected, another HUGE injection of +120 Bcf! Note the blue line/current storage on the graph below is going higher at a faster rate than the 5 year average and has now been ABOVE it for several weeks and by an increasing amount each week.
Price seasonals for NG are strongly up in April/May but each year is different. In 2025, the NG market is being crushed by increasing supplies in storage. This is a good thing for consumers! But bad for the trading bulls!
![]()
for week ending May 16, 2025 | Released: May 22, 2025 at 10:30 a.m. | Next Release: May 29, 2025
Working gas in underground storage, Lower 48 states Summary text
CSV
JSN Historical ComparisonsStocks
billion cubic feet (Bcf) Year ago
(05/16/24)5-year average
(2020-24) Region05/16/2505/09/25net changeimplied flow
Bcf% change Bcf% changeEast432 396 36 36 507 -14.8 426 1.4 Midwest512 480 32 32 632 -19.0 521 -1.7 Mountain192 185 7 7 201 -4.5 137 40.1 Pacific244 237 7 7 258 -5.4 217 12.4 South Central996 957 39 39 1,110 -10.3 983 1.3 Salt321 308 13 13 318 0.9 298 7.7 Nonsalt674 648 26 26 792 -14.9 685 -1.6 Total2,375 2,255 120 120 2,708 -12.3 2,285 3.9 Totals may not equal sum of components because of independent rounding.
Working gas in storage was 2,375 Bcf as of Friday, May 16, 2025, according to EIA estimates. This represents a net increase of 120 Bcf from the previous week. Stocks were 333 Bcf less than last year at this time and 90 Bcf above the five-year average of 2,285 Bcf. At 2,375 Bcf, total working gas is within the five-year historical range.
For information on sampling error in this report, see Estimated Measures of Sampling Variability table below.
Note: The shaded area indicates the range between the historical minimum and maximum values for the weekly series from 2020 through 2024. The dashed vertical lines indicate current and year-ago weekly periods.
++++++++++++++++
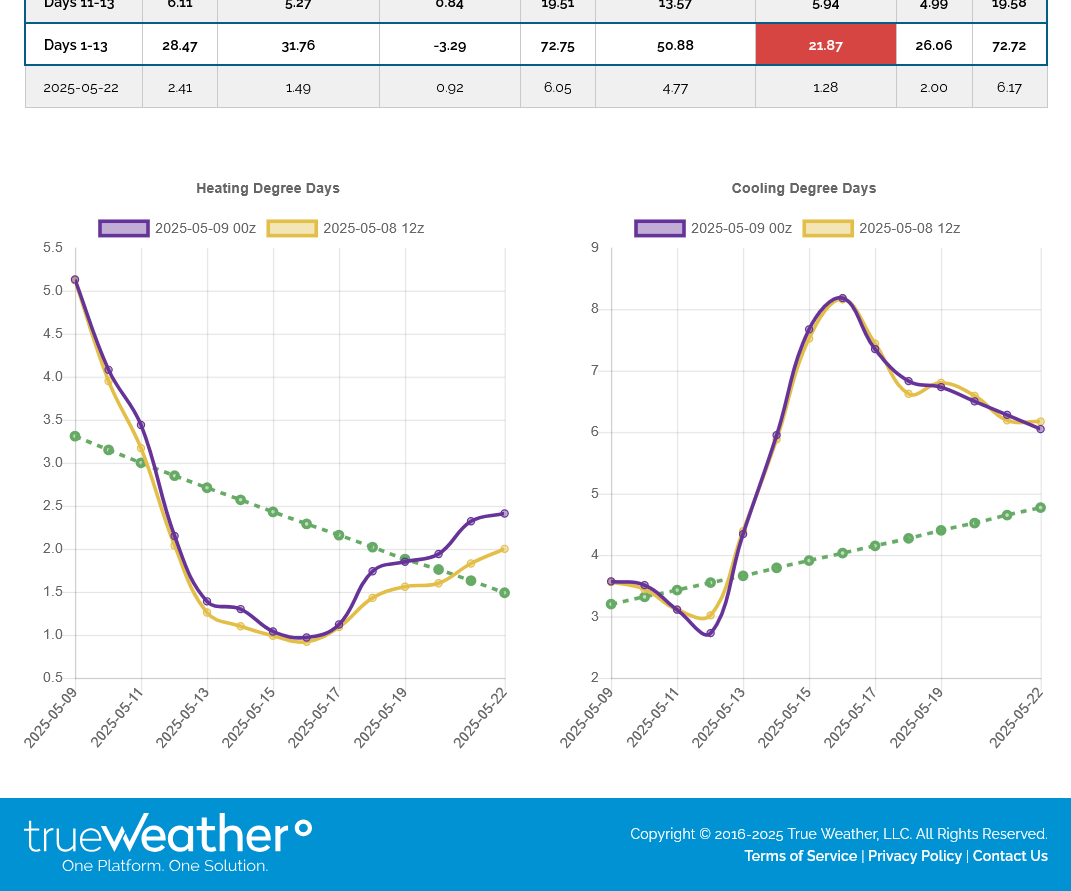
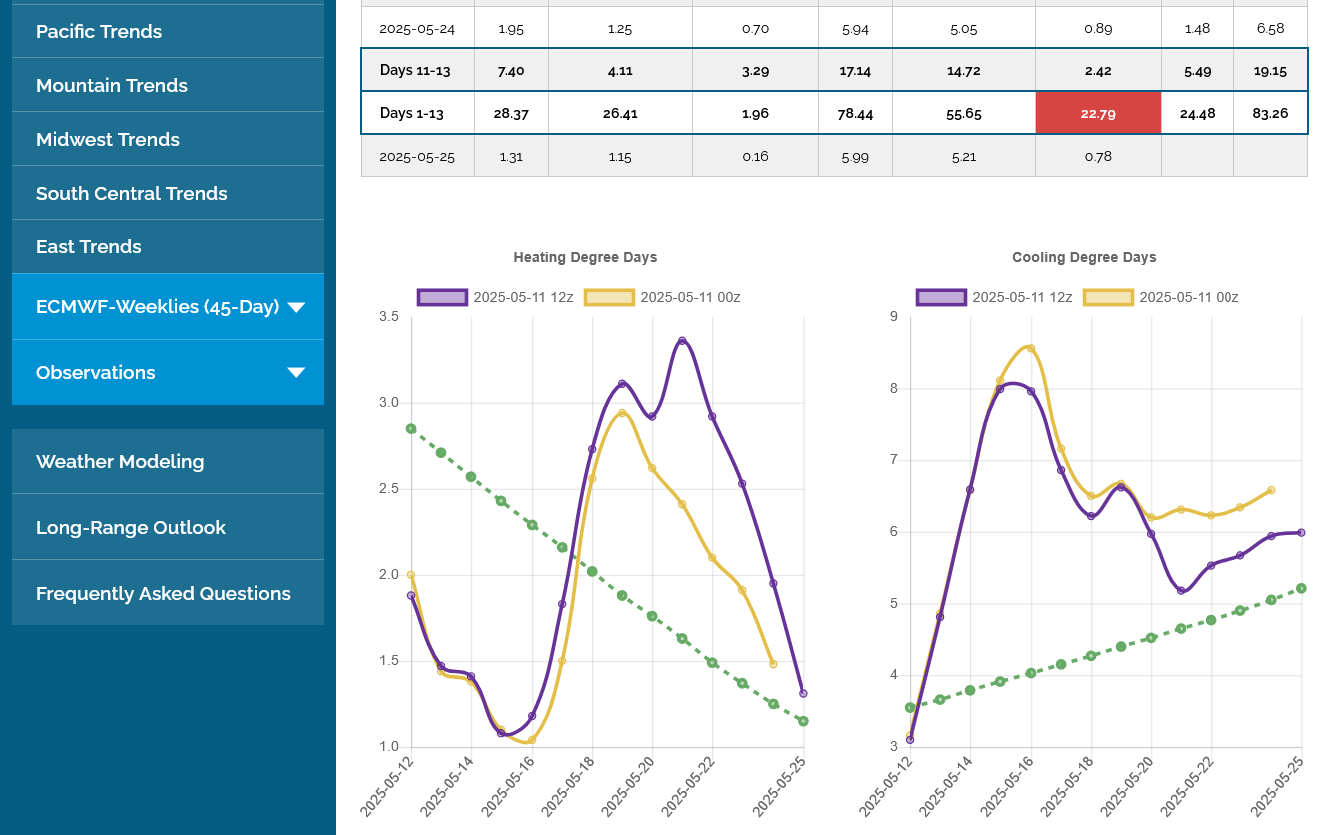
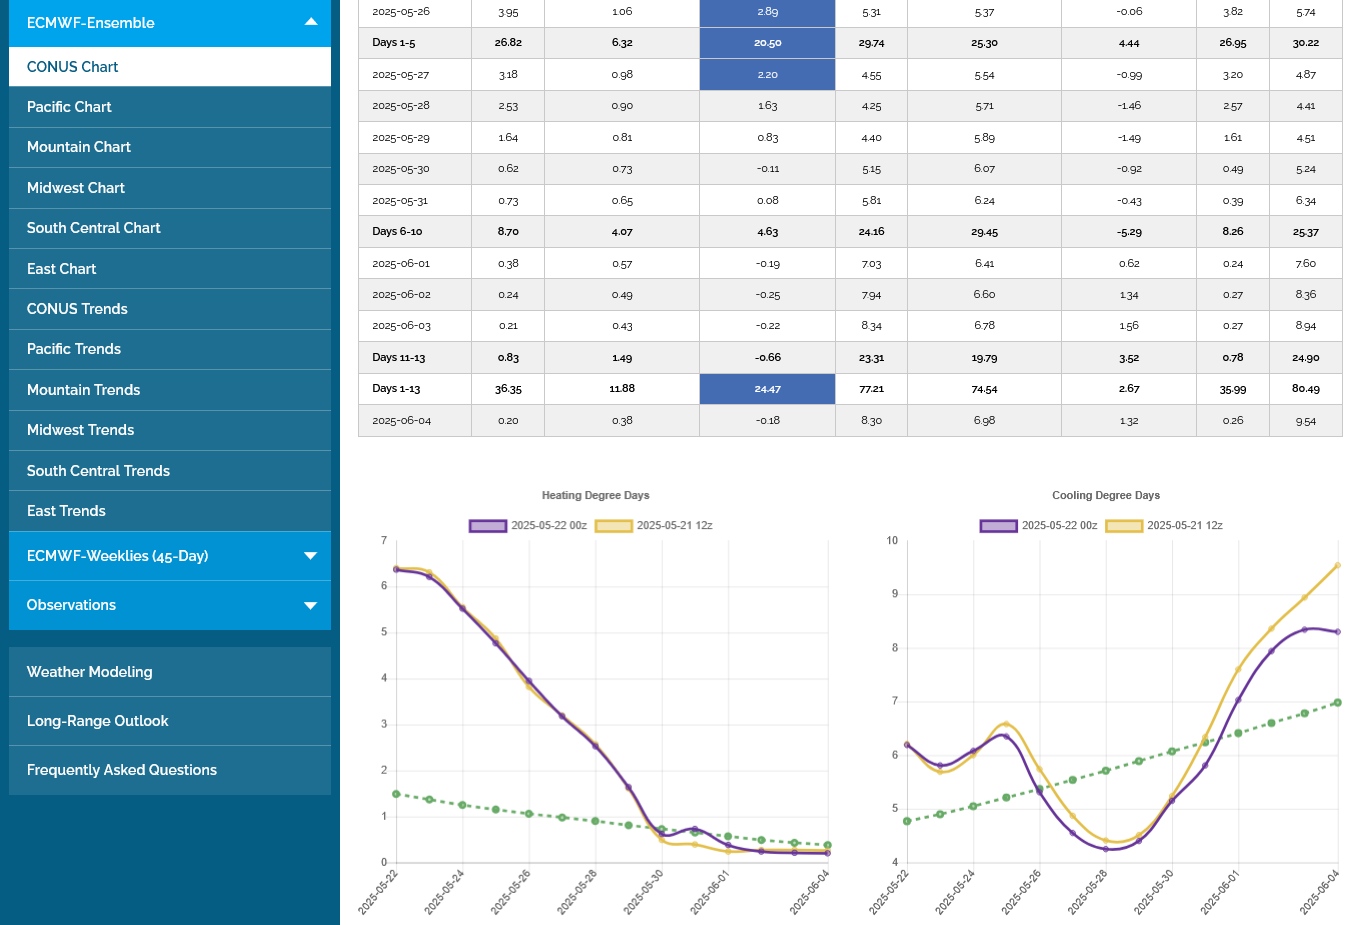
The last 0z European Ensemble(purple line on the right) was -6 CDDs(bearish). It's now the time of year when the seasonally increasing CDDs(dashed green line) are getting high enough for the market to trade it!!!
The price has been under pressure the last week+ as cooler and cooler temps in the forecast keep hitting weather traders computer screens..... including the one for June.
+++++++++++++
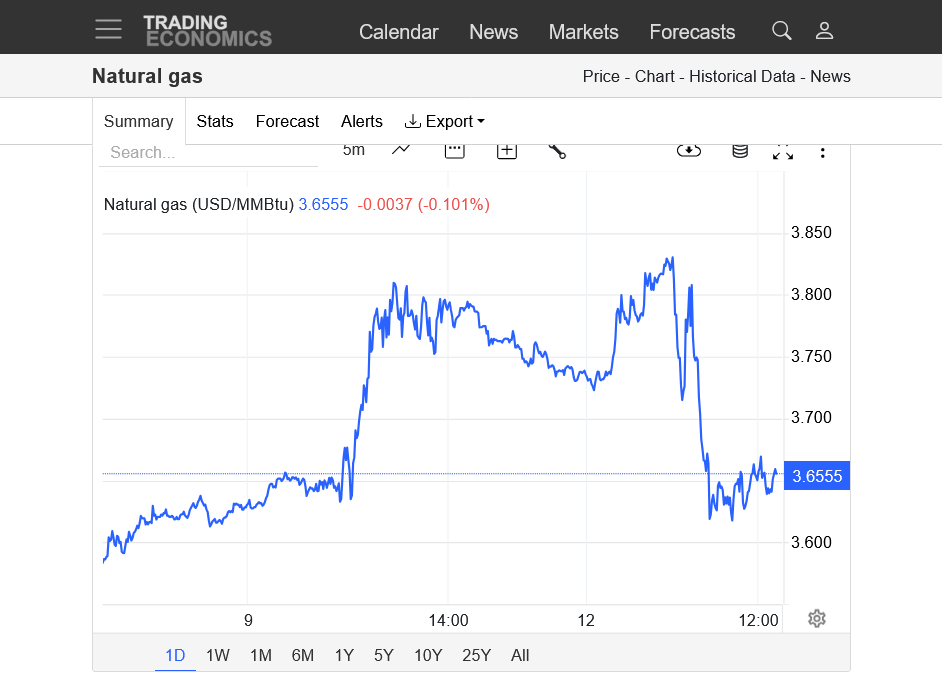
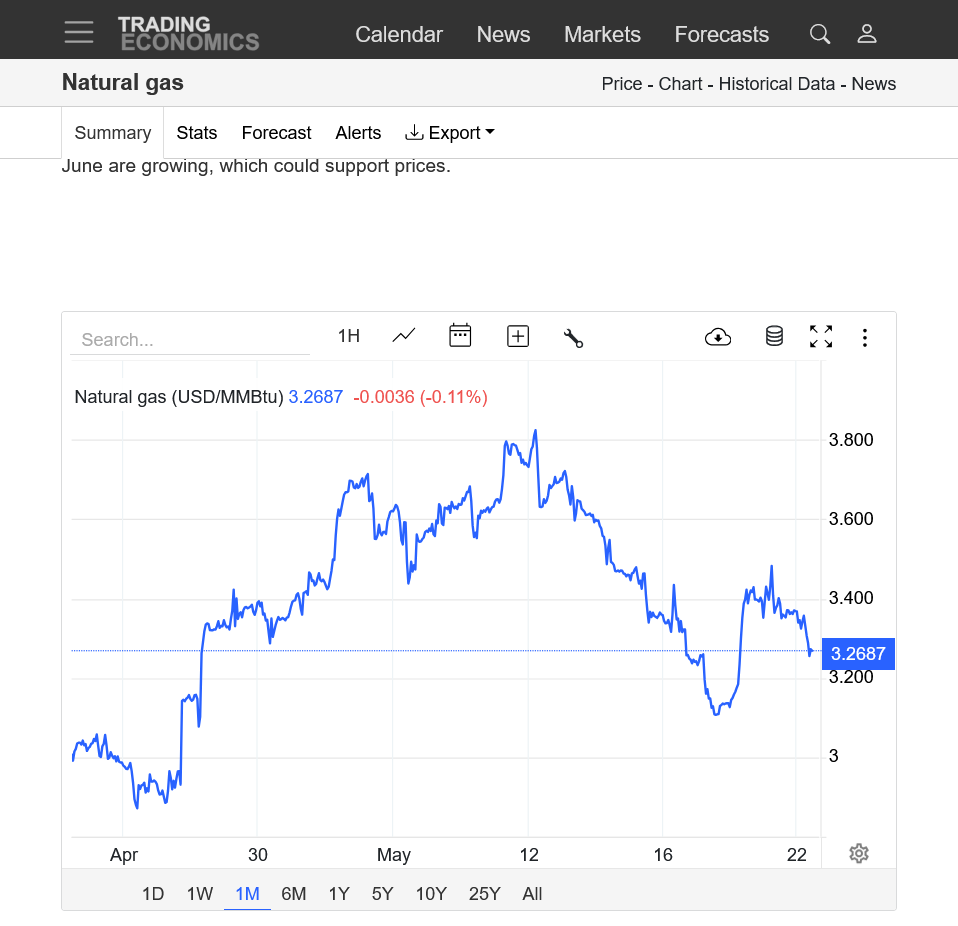
https://tradingeconomics.com/commodity/natural-gas
1. The last month below. Added heat in the forecast late April/early May. Much cooler mid/late last week and this week.
New NG thread: https://www.marketforum.com/forum/topic/112055/