as of 10:15 A.M EST we are fighting a battle between support of 5534 and resistance of 5577. Which way will we breakout today/
ES as I see it
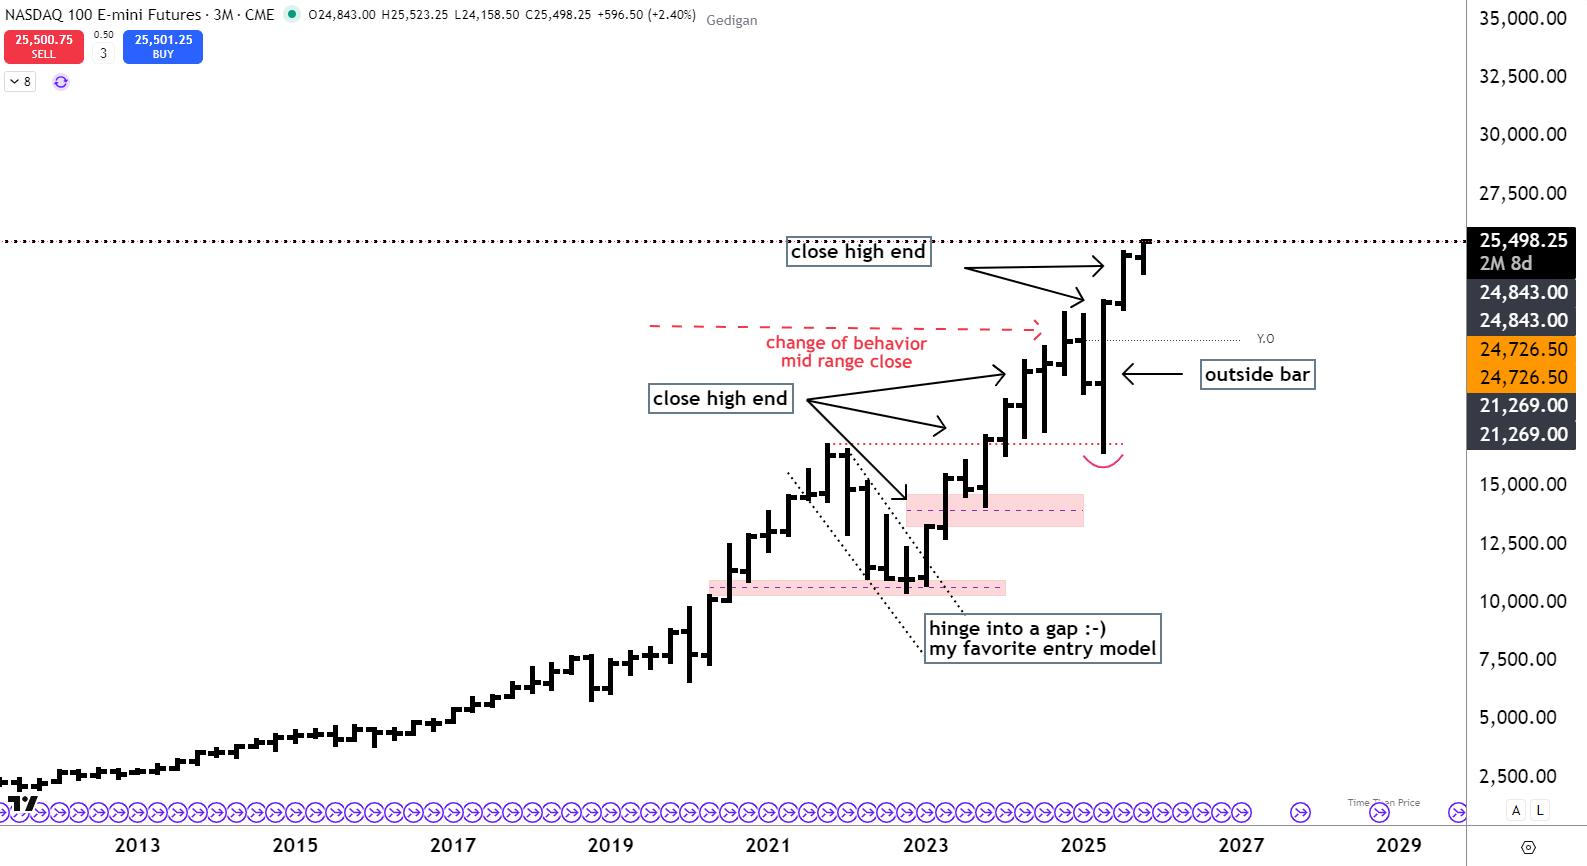
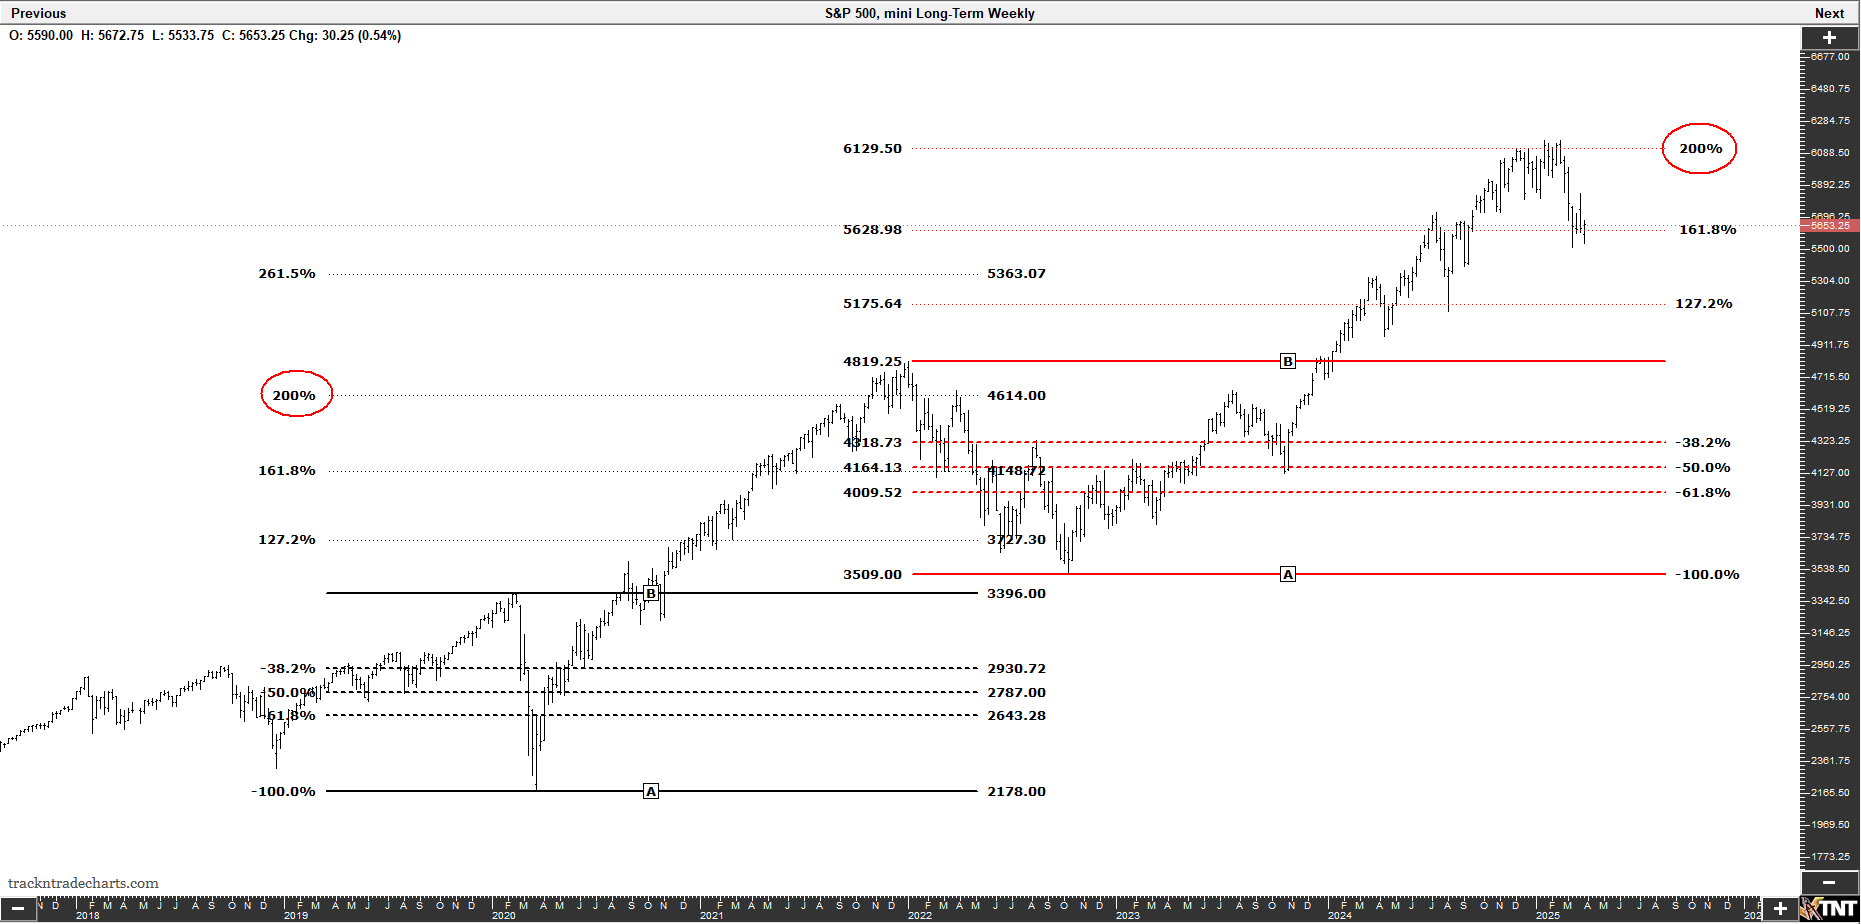
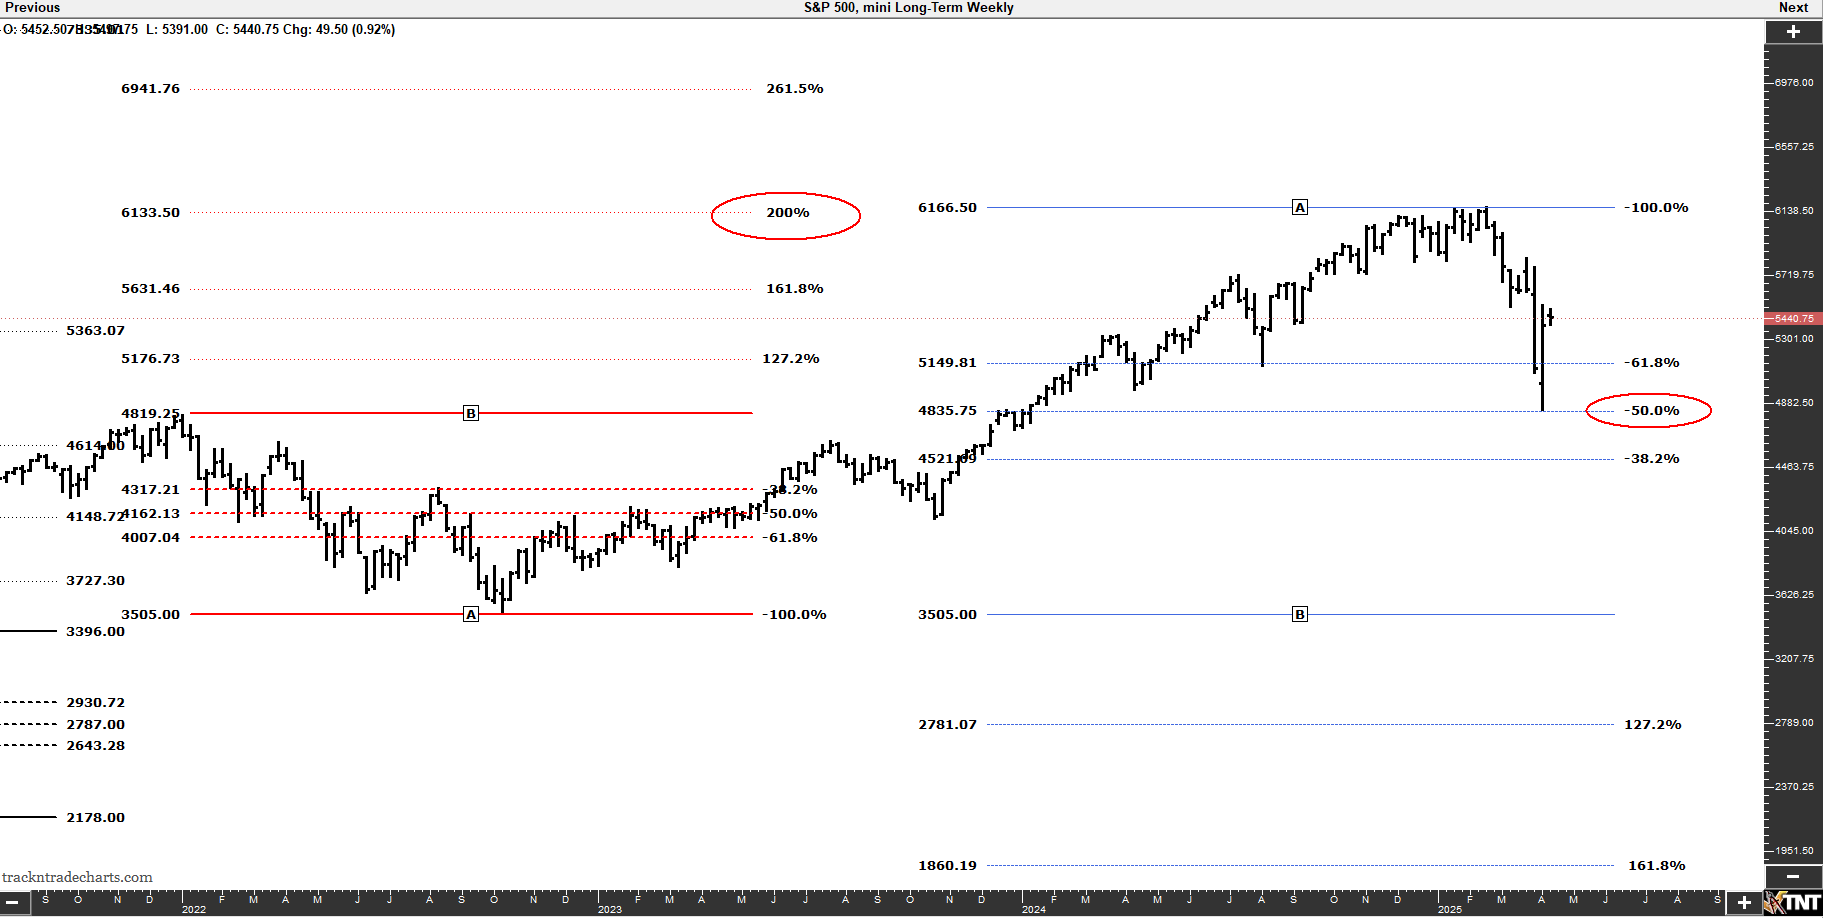
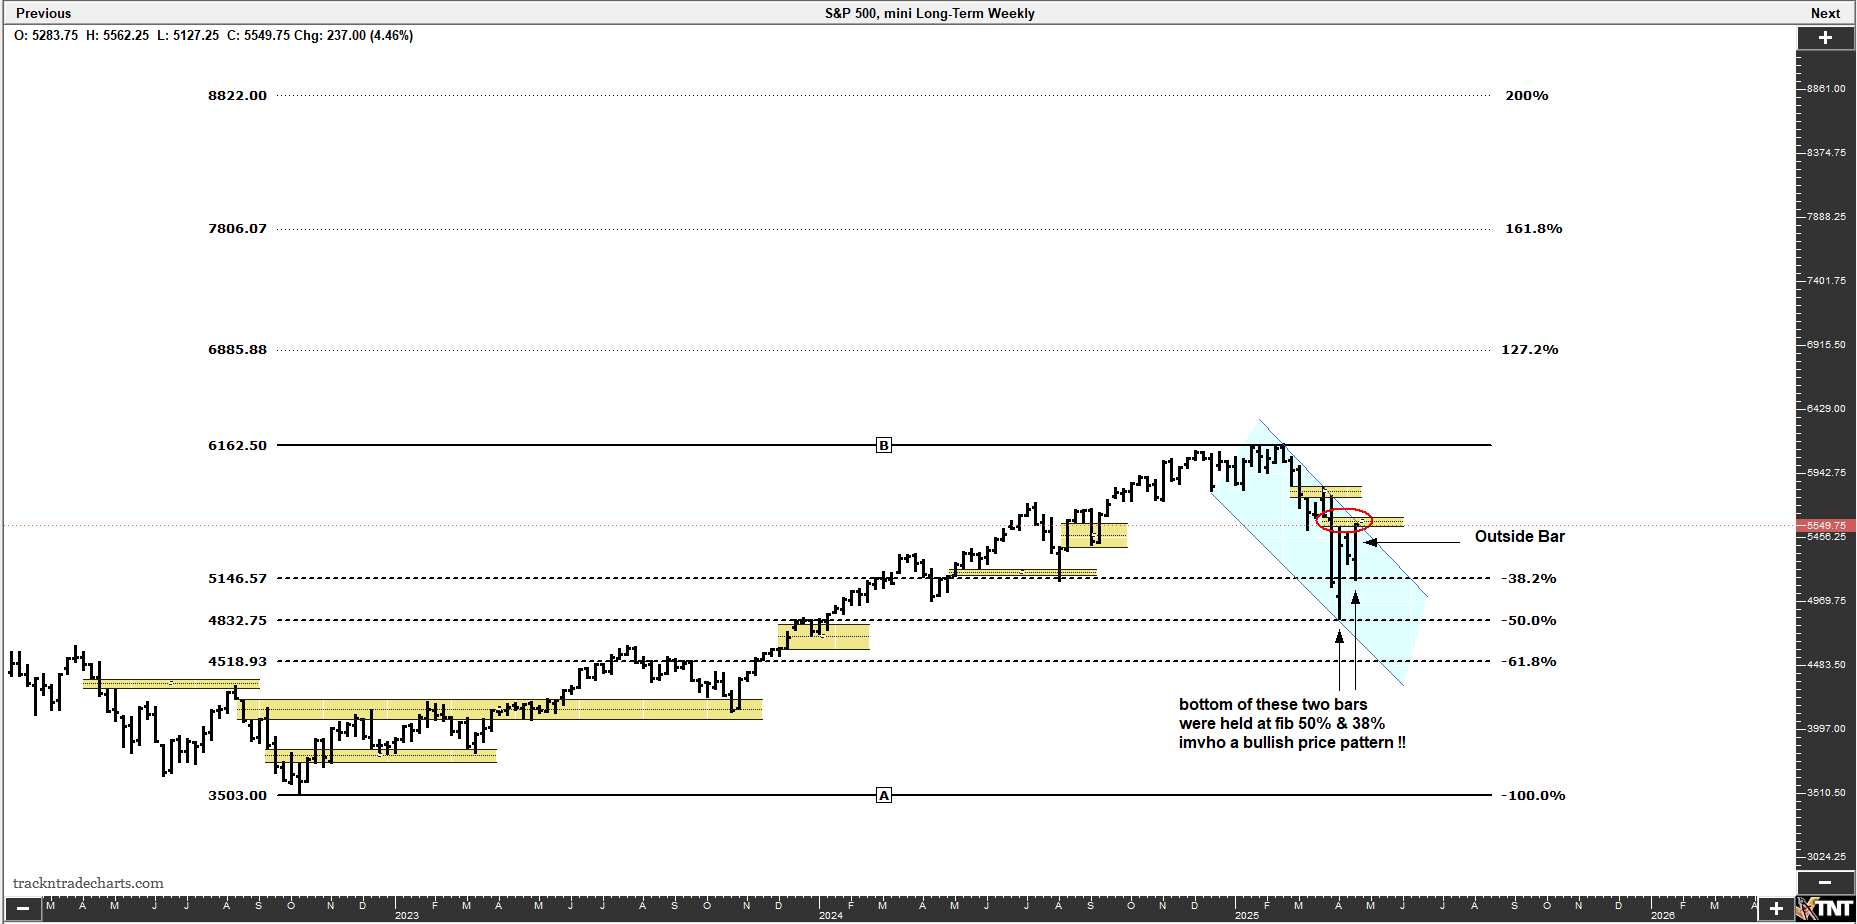
Weekly history is repeating itself. A correction at a Fib. extension 200%
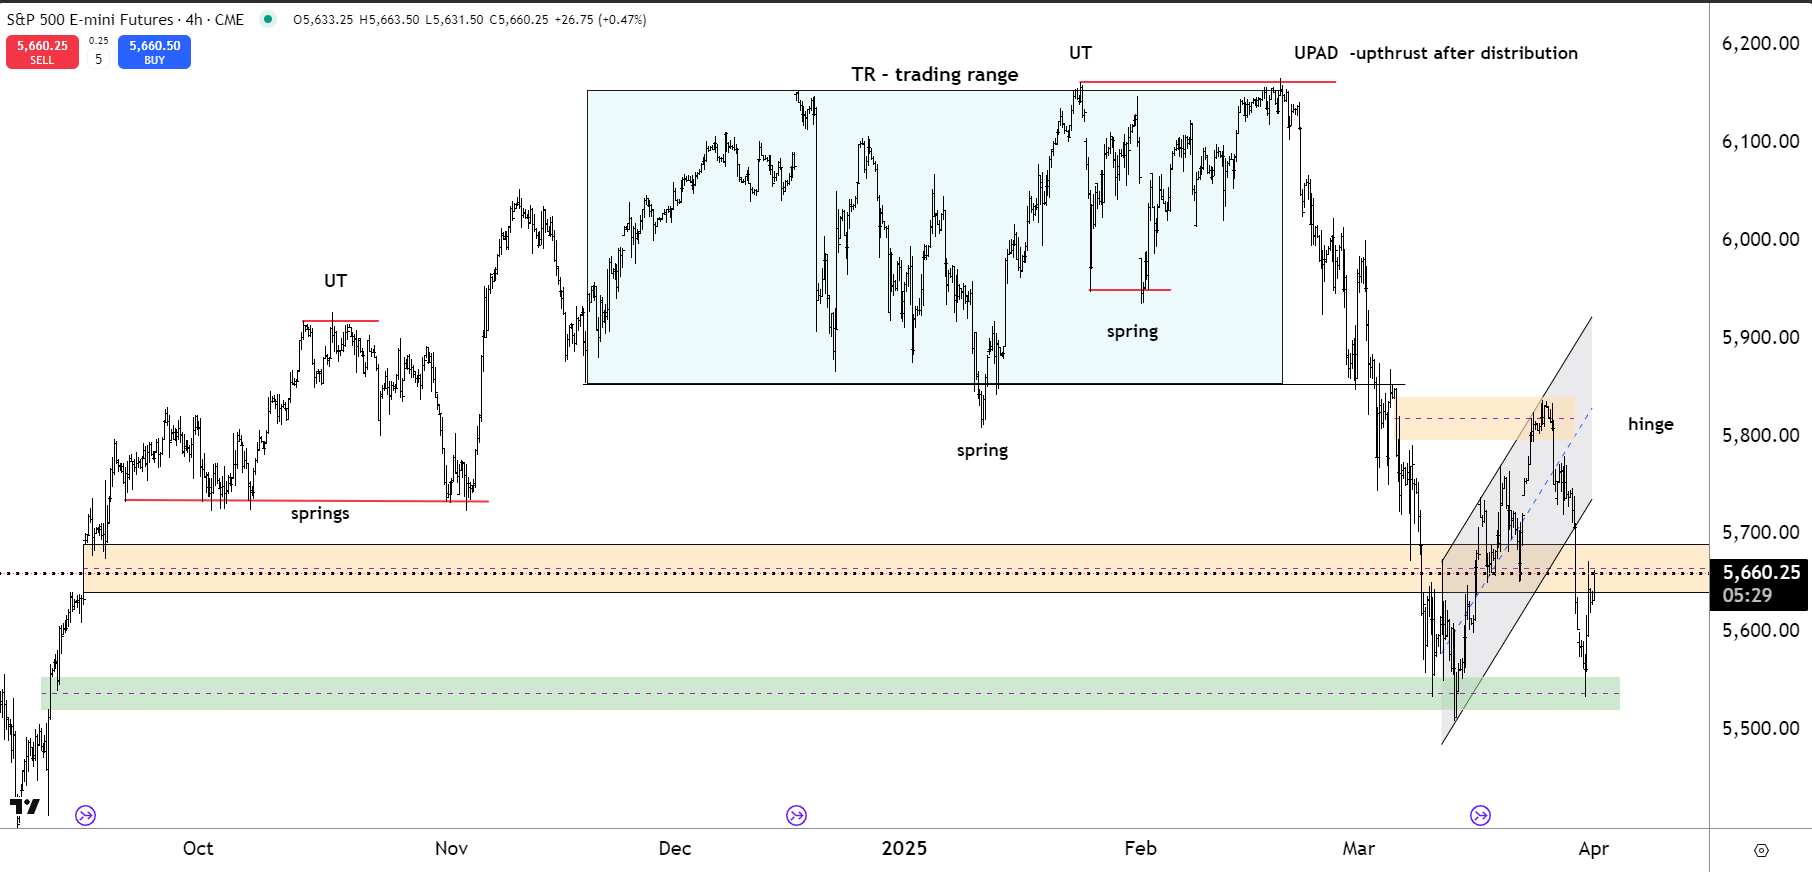
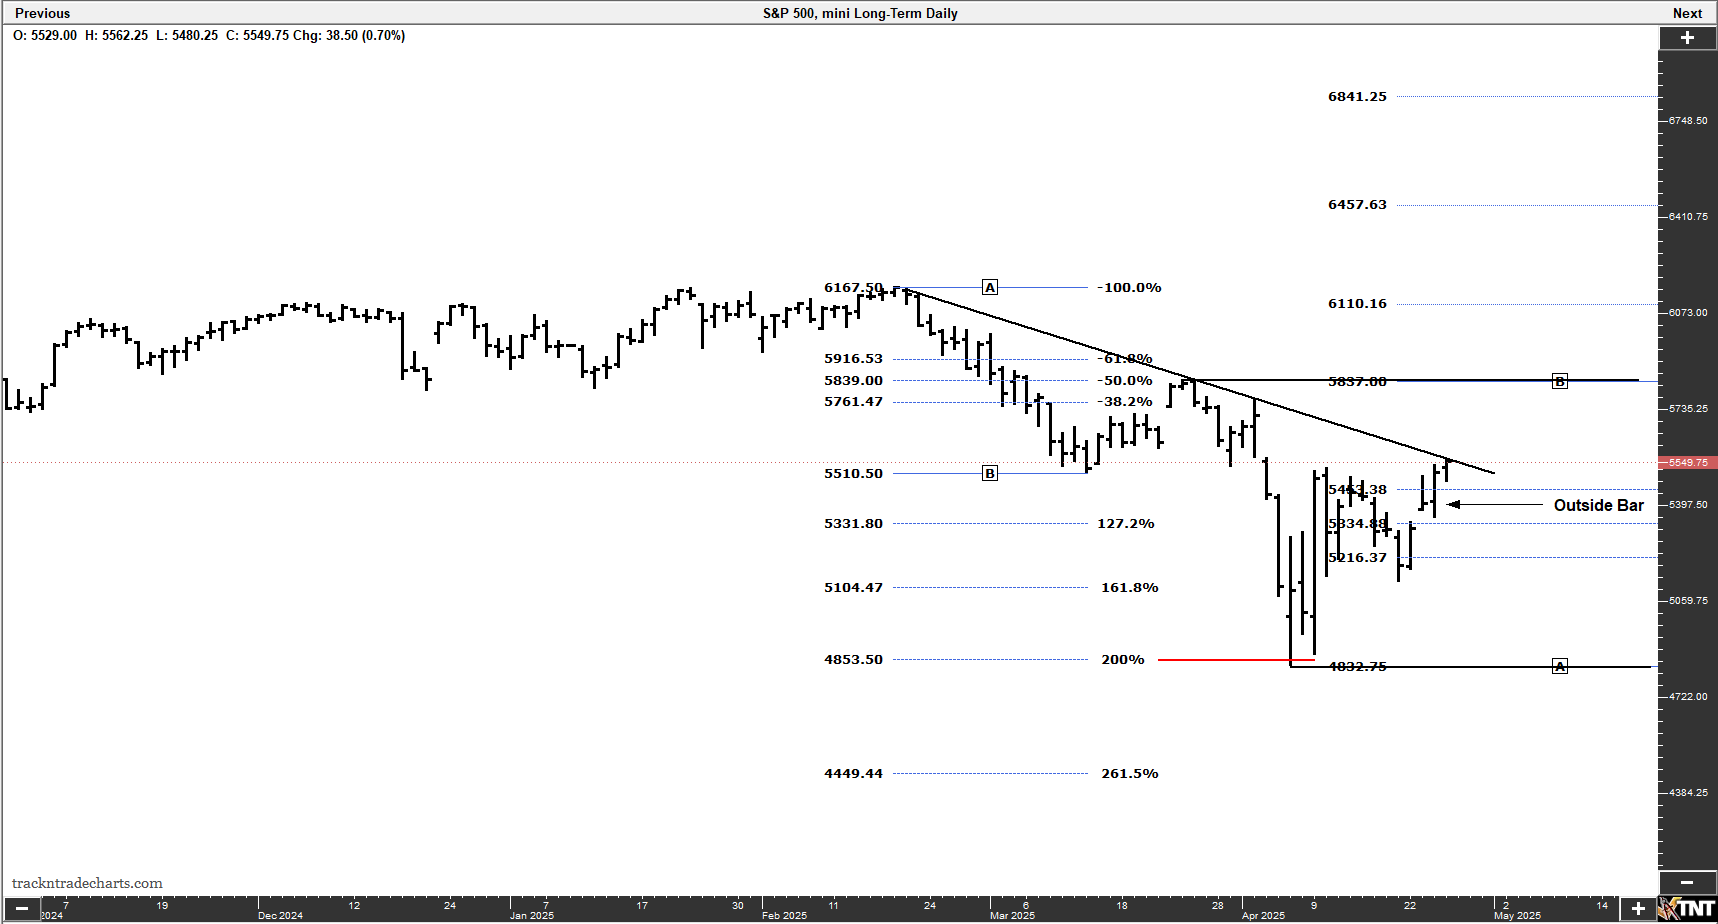
A tad closer look using a 4hr chart and Wyckoff logic (as I understand it).
Simply reading price action, drawing lines & predicting the future...
Amos taught me to always ask... "What's our current level of knowledge" (LOK). Lets begin..
1. Weekly, November 19th price went into a range. Dec. 16th formed its high.
2. We identified a spring on Jan. 13th. & price began to rise.
3. Jan. 24th gave us an UT - I was anticipating a move below the 13th spring
WHY? Weekly we are at the Fib. 200% ext. I'm looking for a change of trend at this area.
4. Jan 31 was a re-test of the UT (typical Wyckoff logic) only to form a spring on Feb. 2
5. Puzzled I ask? We have a spring after an UT Bullish behavior - WHY are were going back up to test the UT? OR make new highs? Amos had a saying... IDKNMT (i don't know, need more time) so we wait for more information.
6. Feb. 17th I thought we were forming a springboard, for a move above the UT. Only for the market to give us another UT. This UT was clearly terminal (UTAD), as evident by the reaction after leaving the potential springboard formation.
7. Were NOW fully in a sell program!!!!
8. The markdown was immediate and swift. No looking back. Weak longs are trapped and need to cover, further
accelerating the UTAD reaction. Cementing David Weis, the greatest Wyckoff trader I've had the pleasure of meeting.
who said over & over, buy all springs - sell all UT's. I regress sorry.... Miss ya David RIP
9. The Mar. 13th low gave us a bearish hinge, with a Friday break.
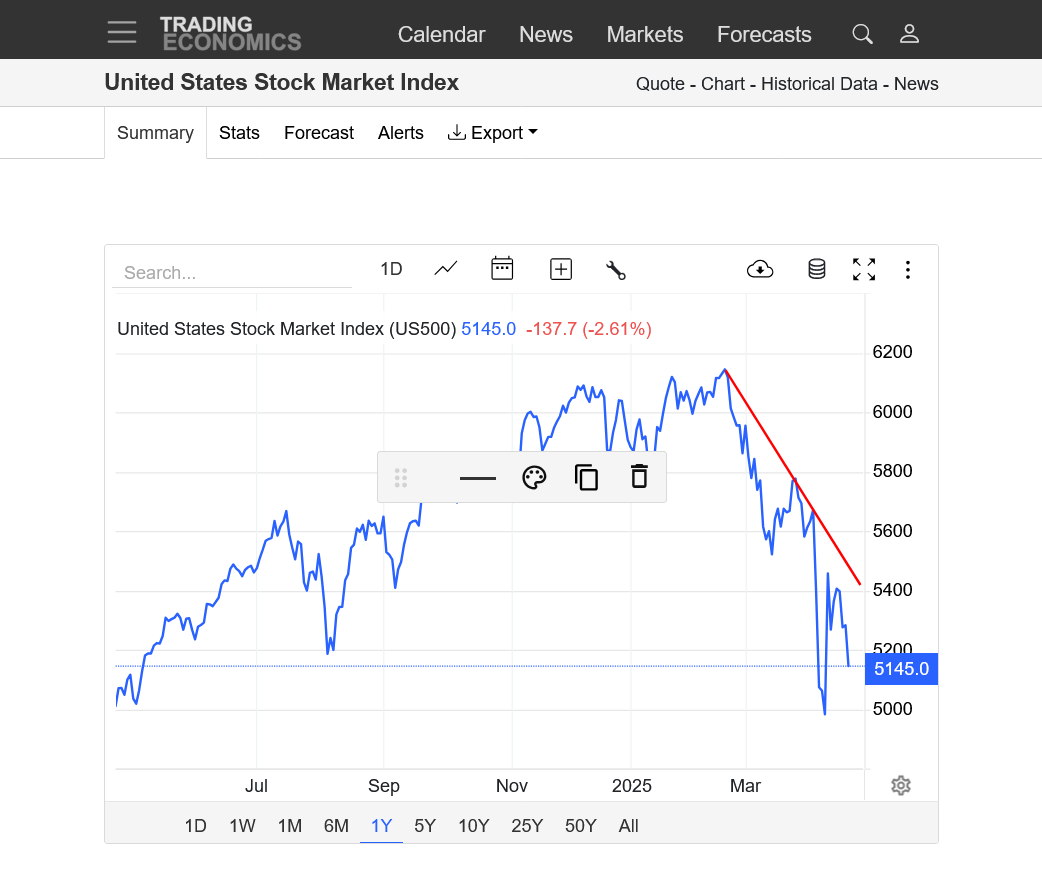
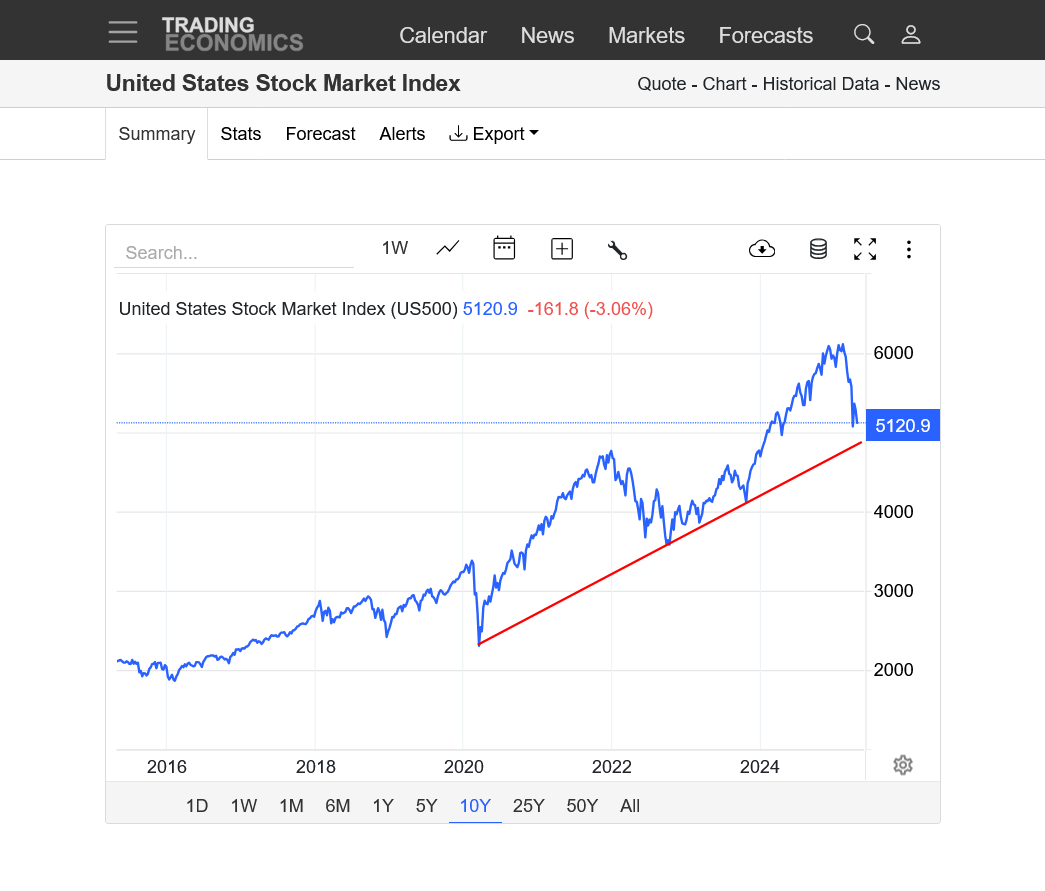
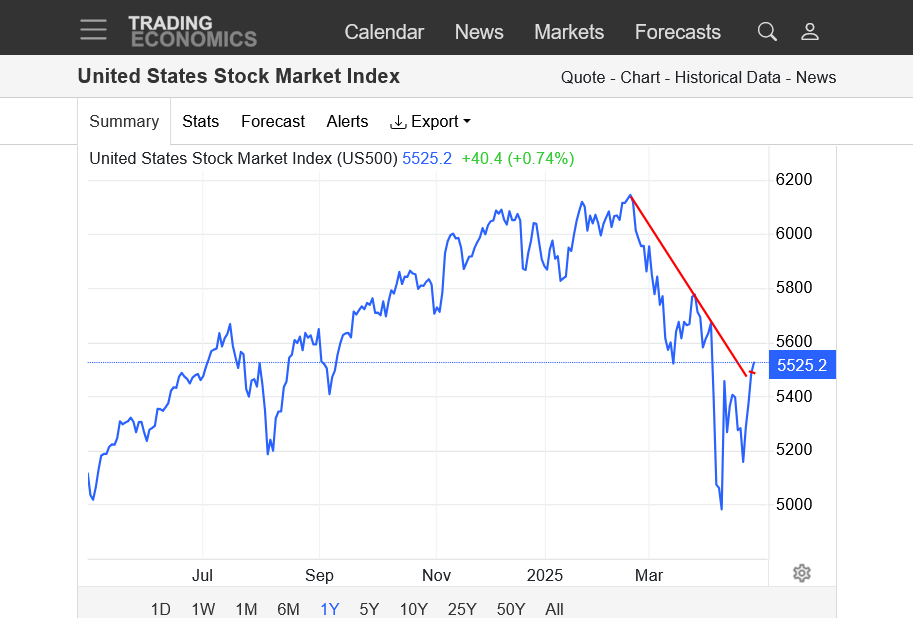
Are we in a sell program similar to 2008? If so, and history repeats itself, we can anticipate a 50% retrace of the last weekly low/high.
As it should be, we all have different eyes. Trade what you see and understand!
Best of trades to everyone!
Thanks, gedigan!!!
I almost missed this thoughtful, detailed analysis. Great stuff!
Trend lines don't mean as much in a volatile, emotional market trading news/dialing in the severity of the upcoming Trump recession.
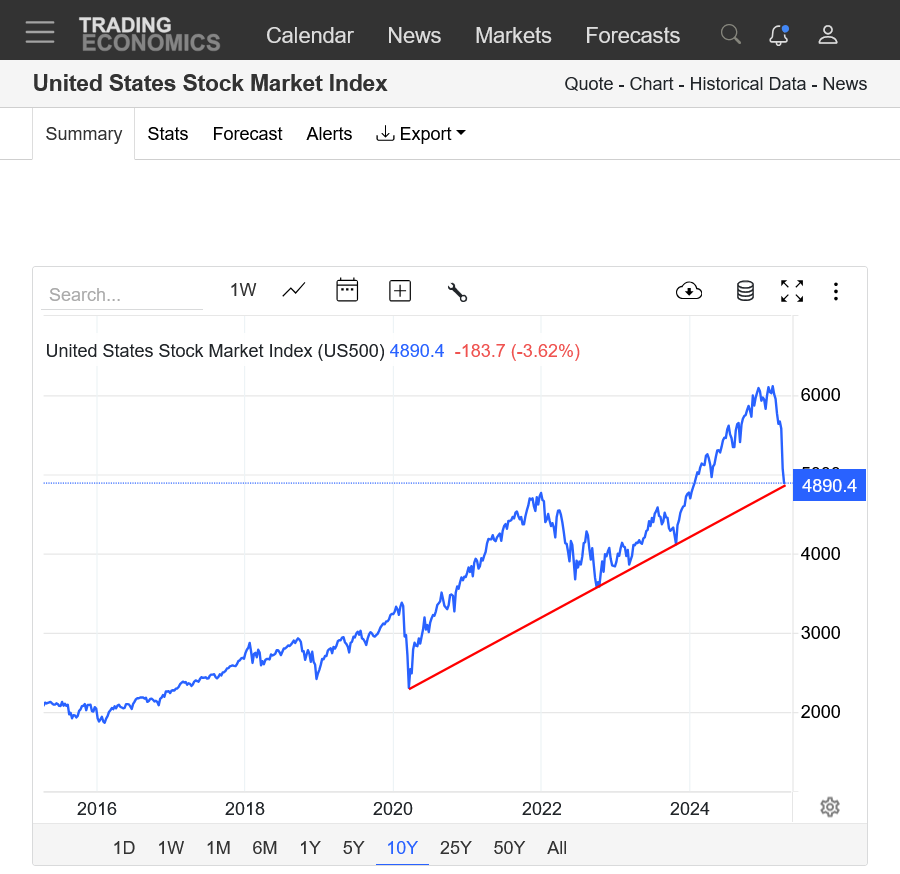
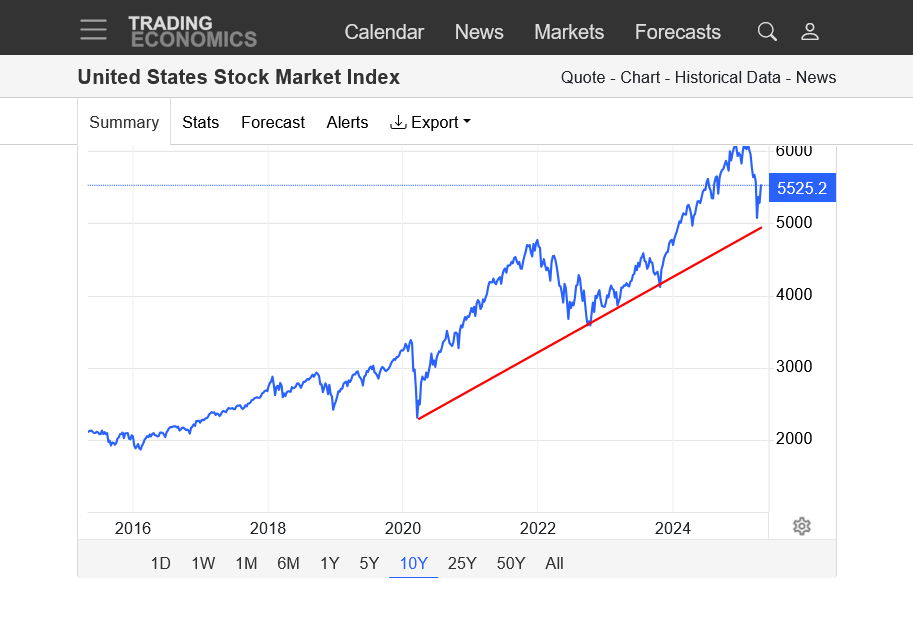
https://tradingeconomics.com/united-states/stock-market
1. 10 year
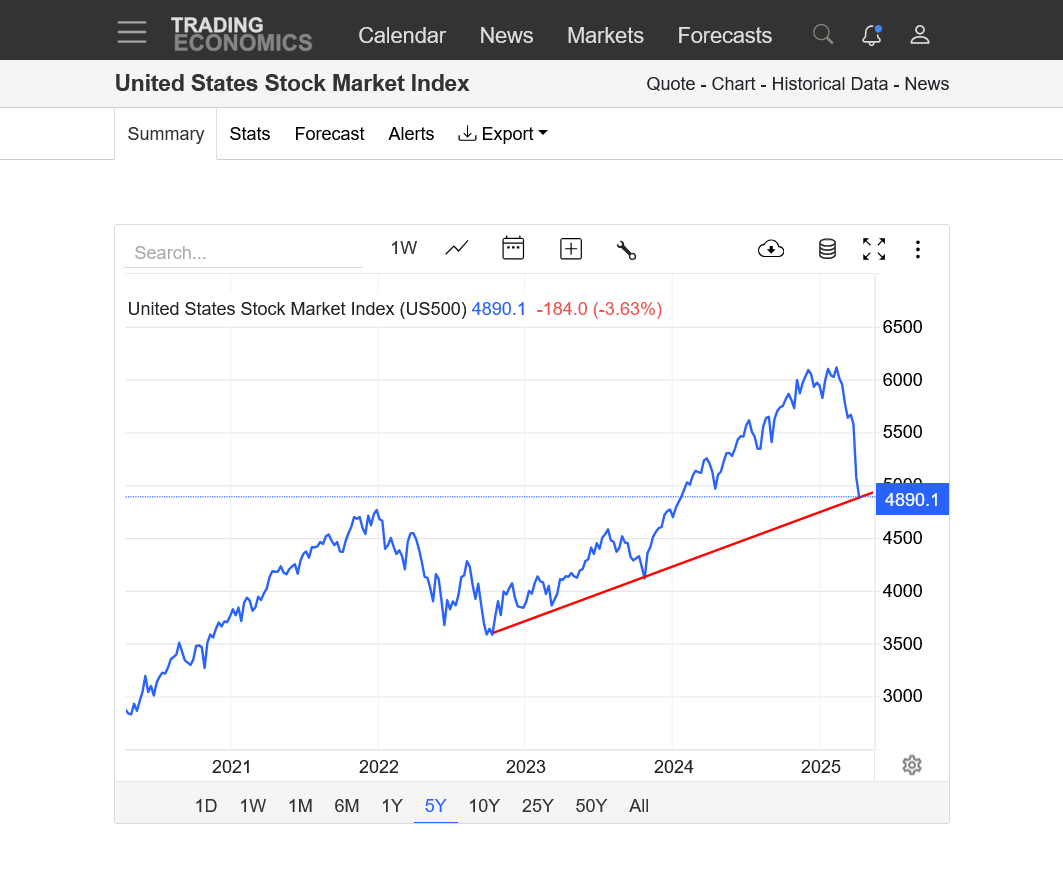
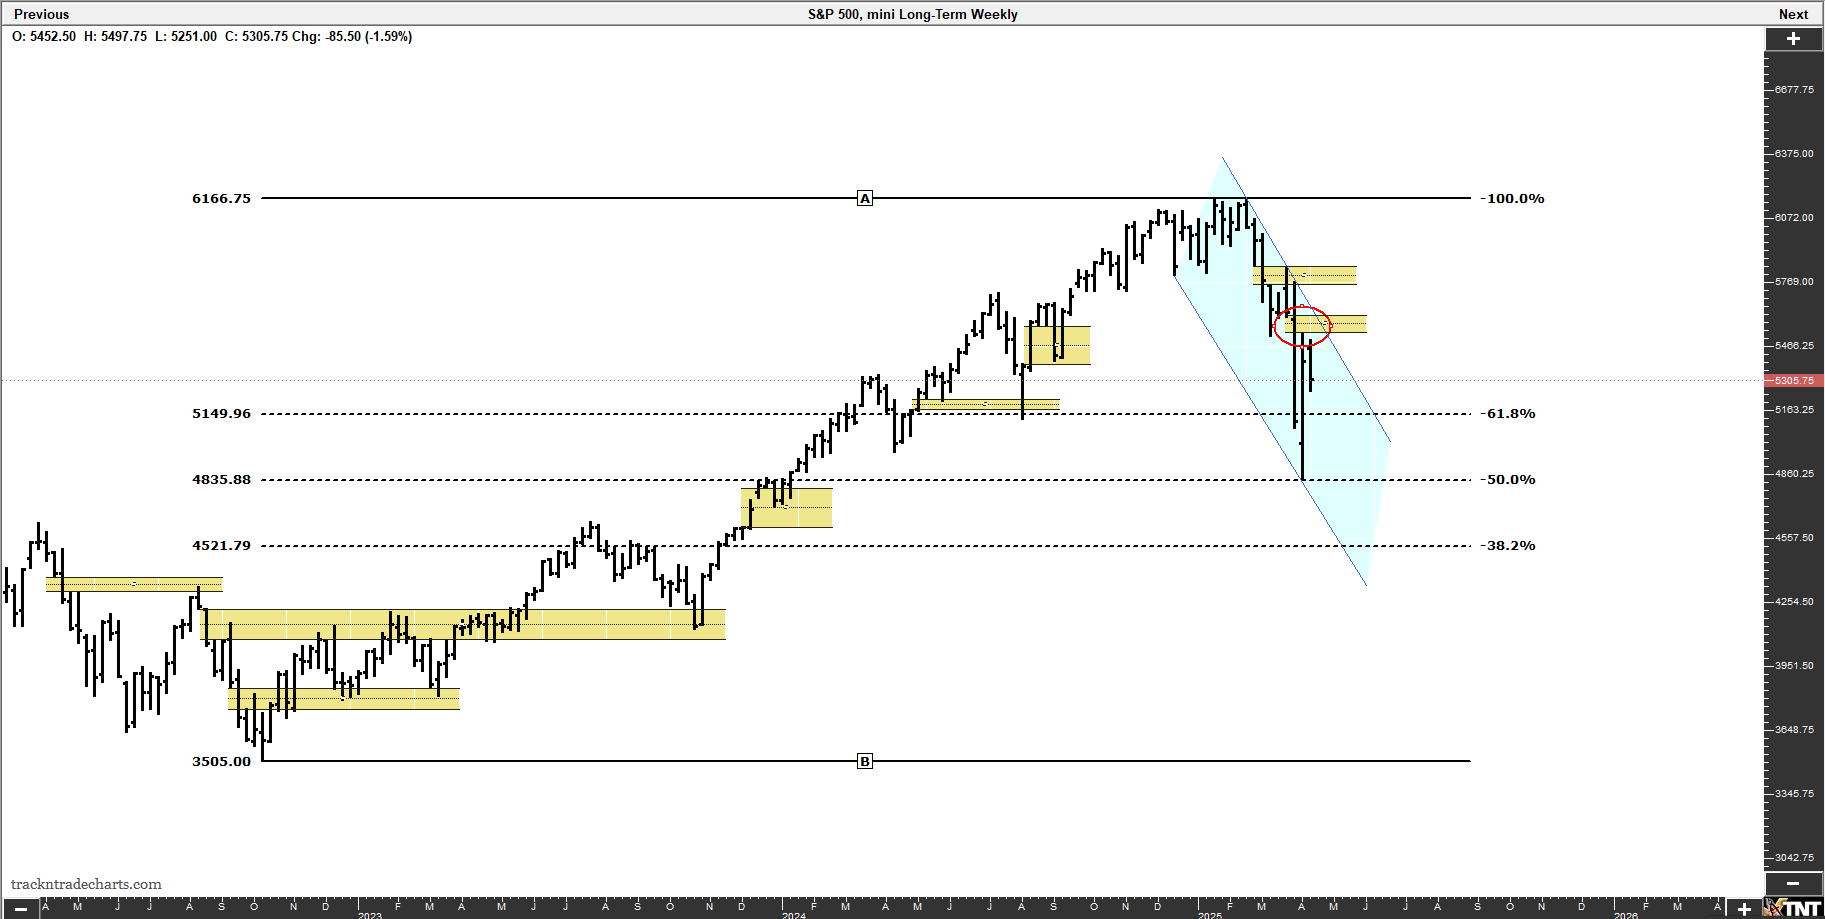
2. 5 year
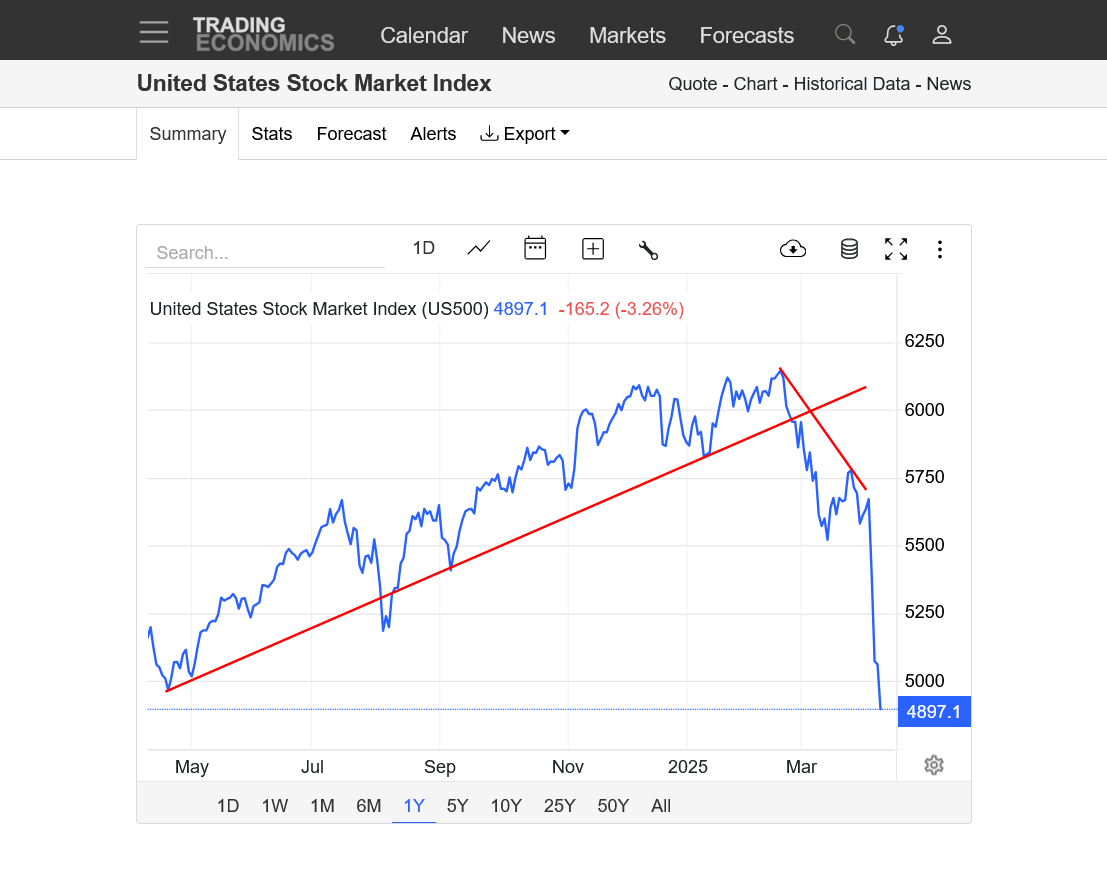
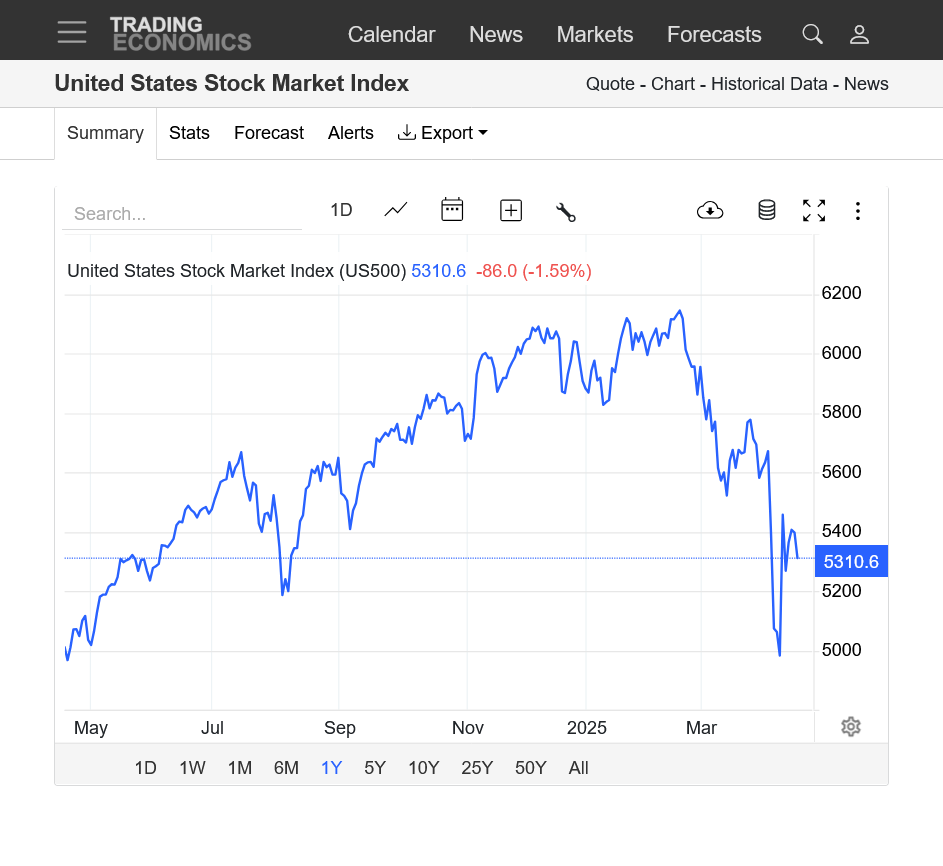
3. 1 year
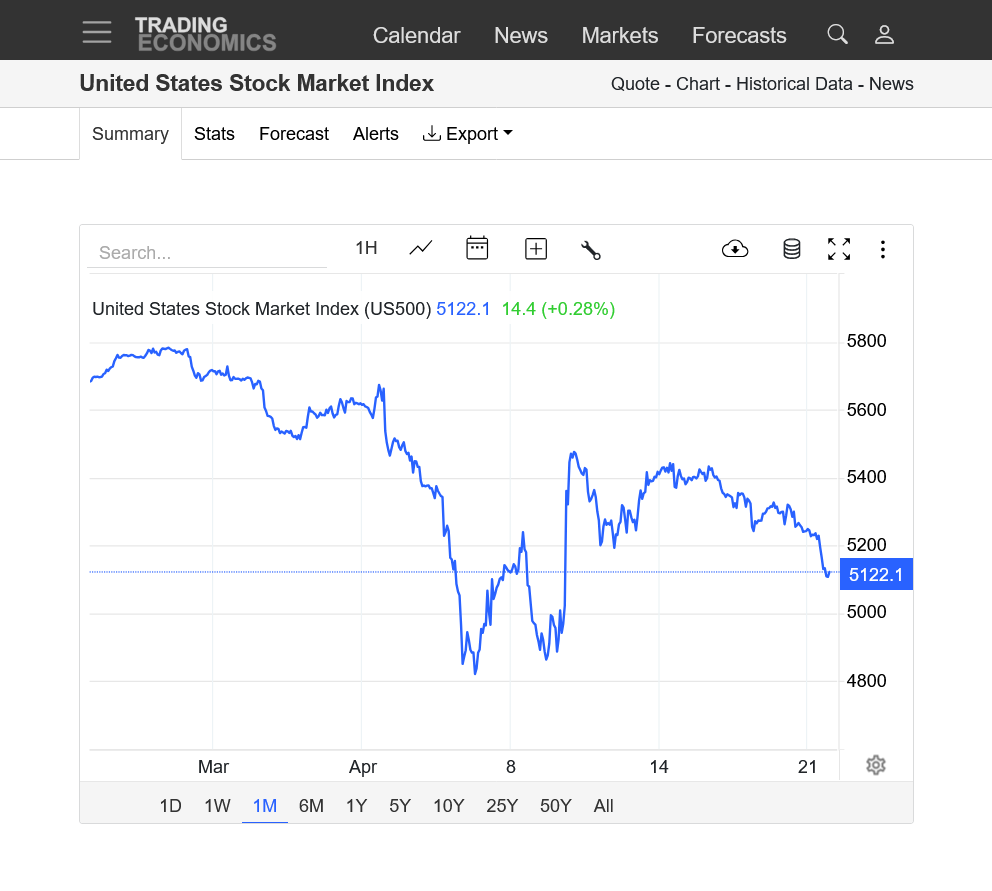
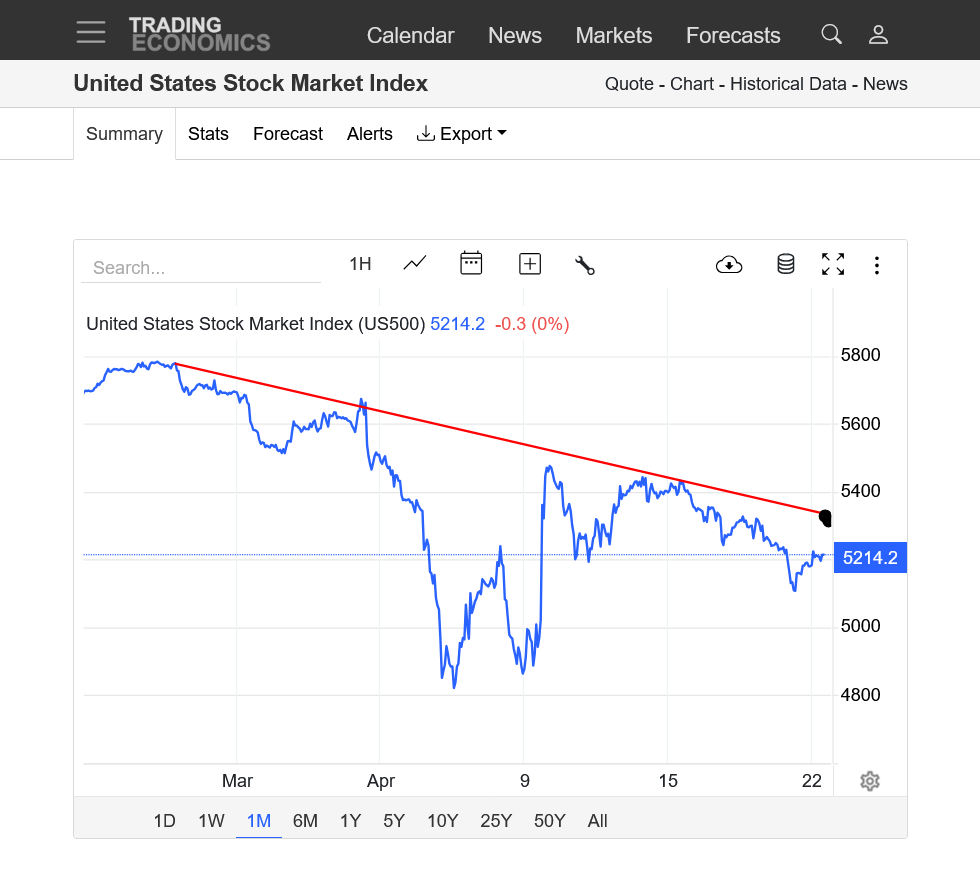
4. 1 month
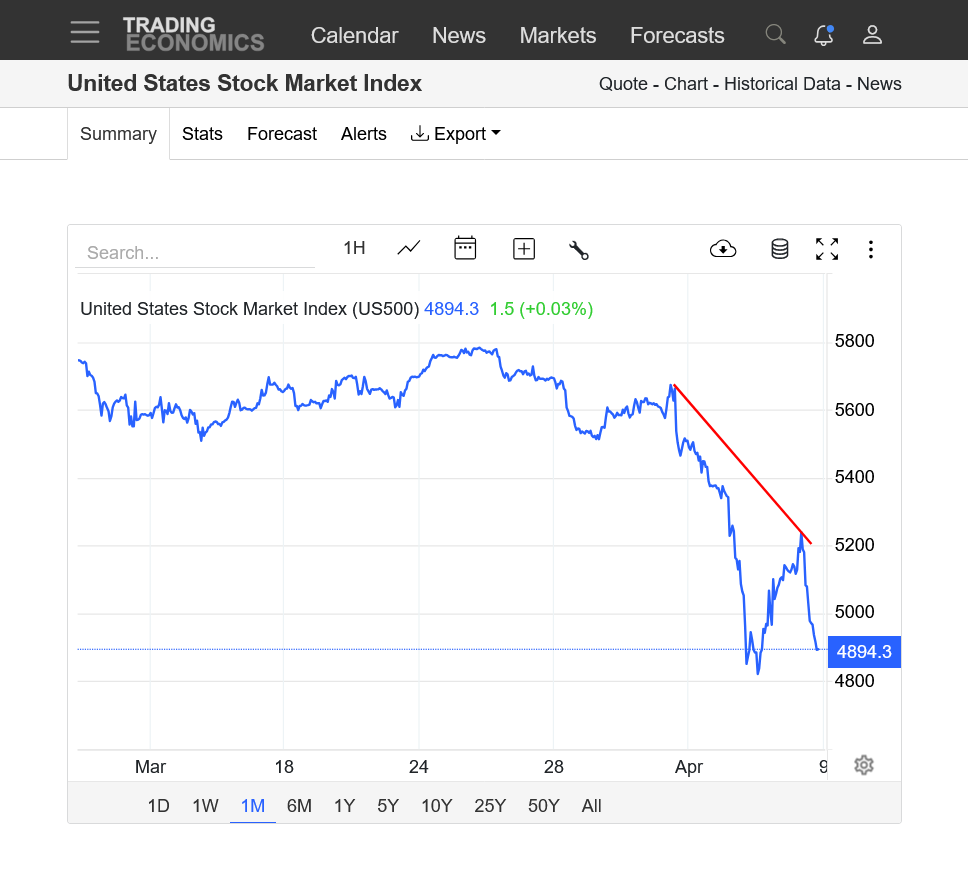
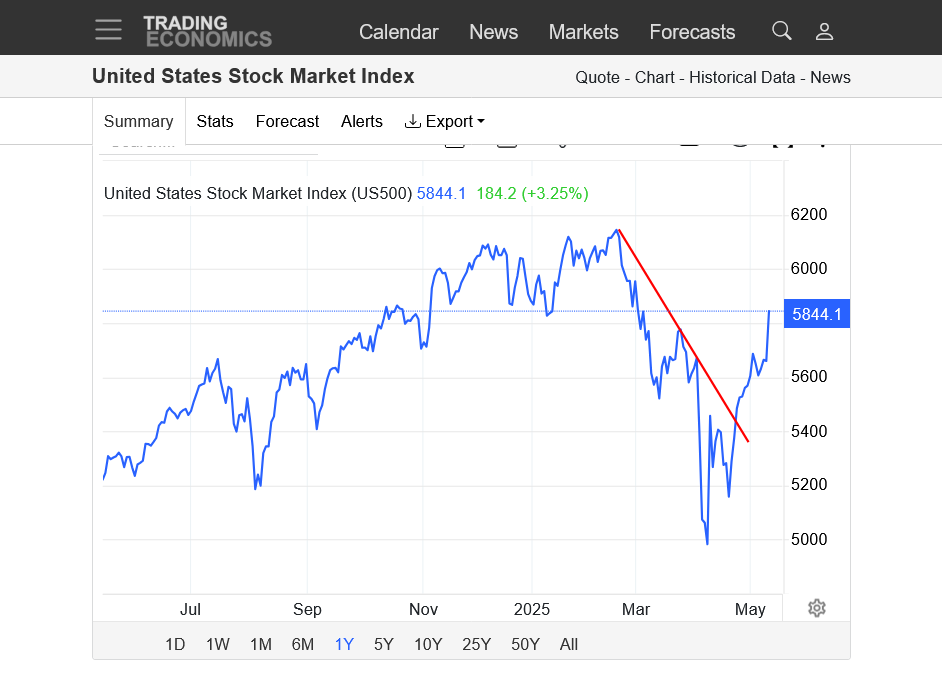
As anticipated, ES retraced 50% of the last weekly low/high range. My eye now will be on the monthly close. Will it resemble the March 2020 bar?
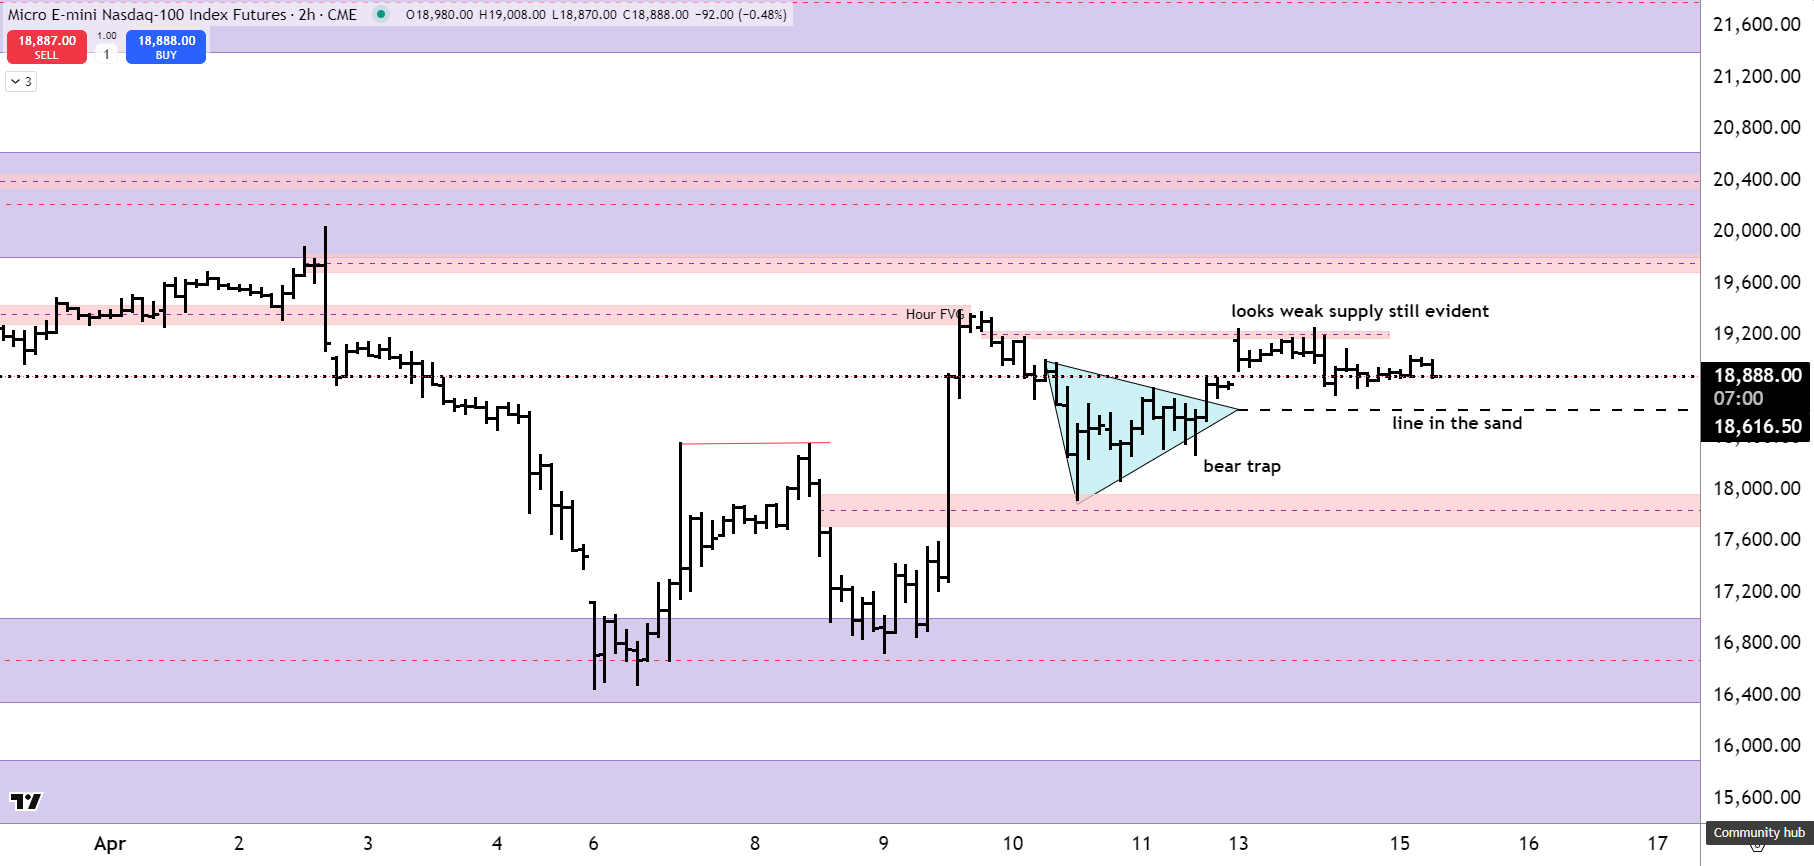
I mostly trade NQ, simply believe it's more honest than ES.
NQ looks weak this morning.
Thanks, gedigan!
We're in an interesting place for sure.
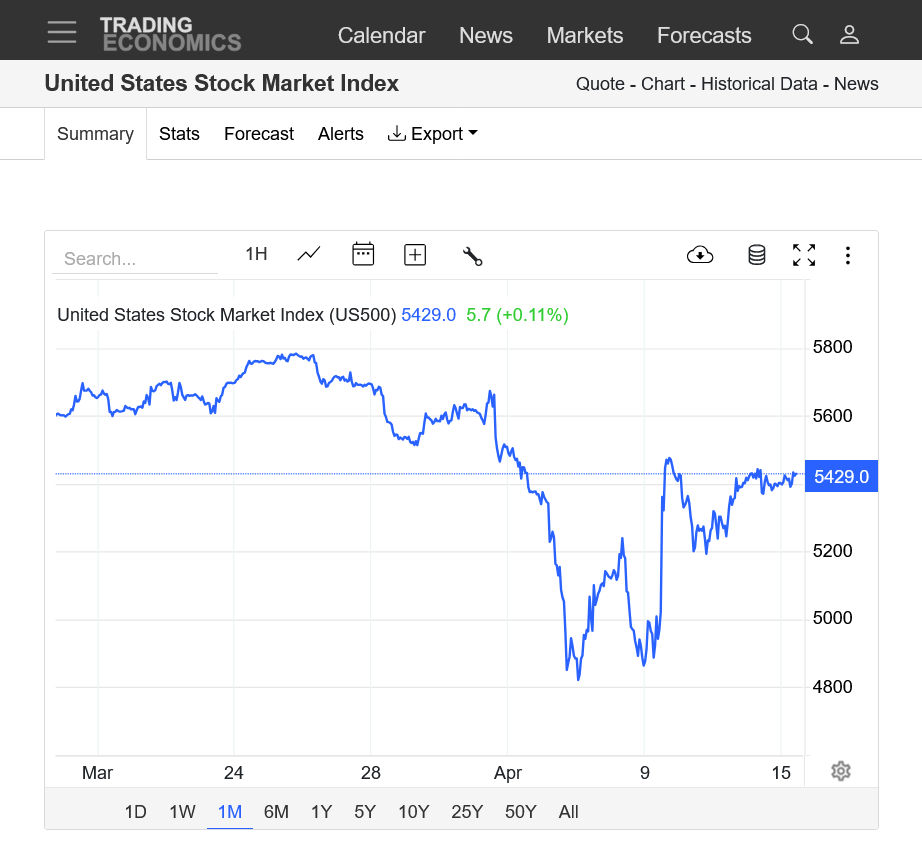
Will the markets break out to the upside or will this selling resistance continue to hold?
Usually when the market hammers away at resistance/support this long, it eventually breaks out because sellers only sell when the price is this high and all the sell orders are eventually exhausted.
This is also an ascending triangle pattern that favors an upside break out. This is a market trading on news though and that can't be predicted. Whatever Trump does next will determine price direction.
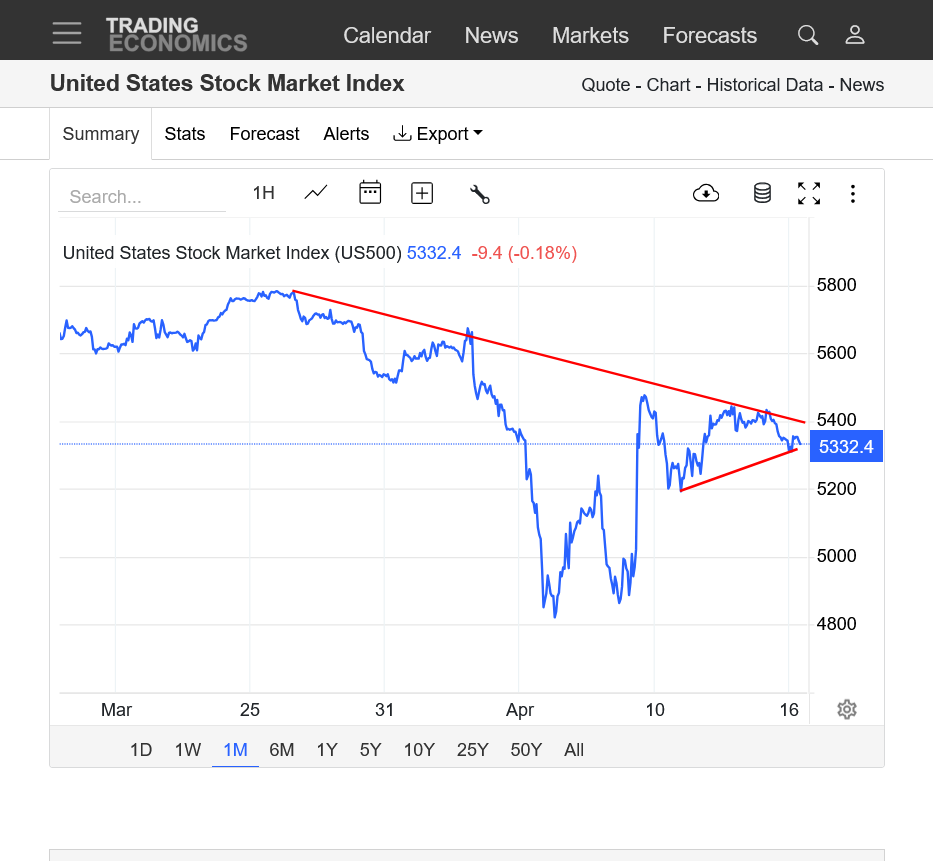
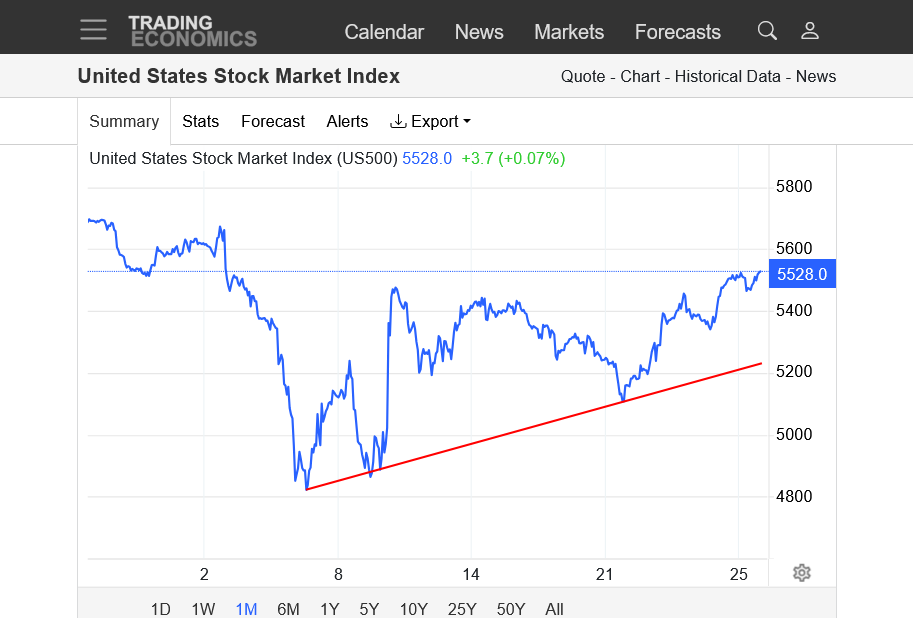
1. 1 month-ascending triangle
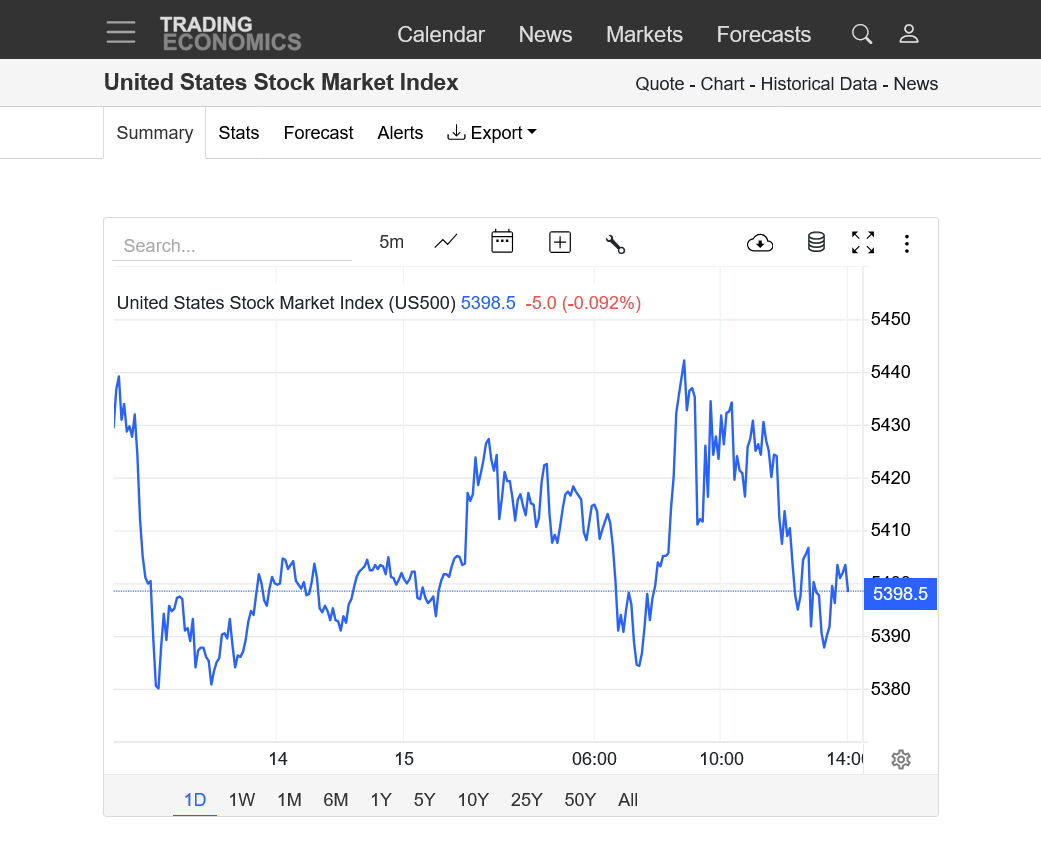
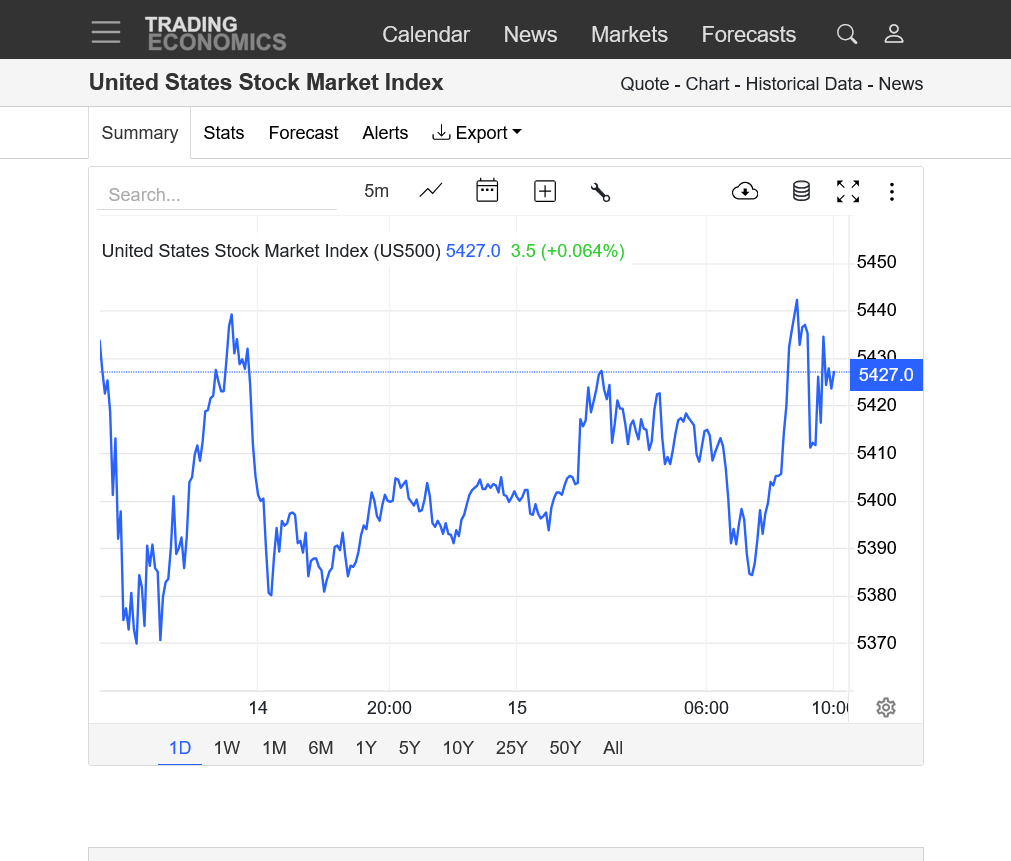
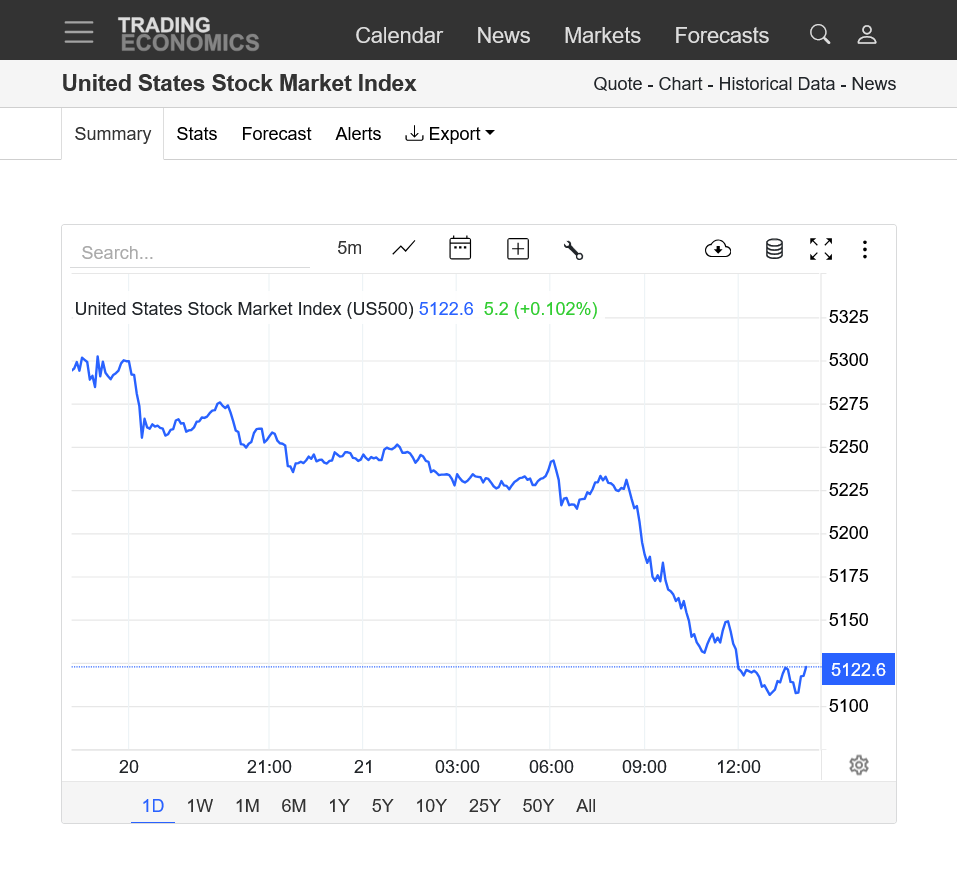
2. 1 day
https://tradingeconomics.com/united-states/stock-market
https://forexschoolonline.com/pennant-triangle-wedge-and-flag-chart-patterns/
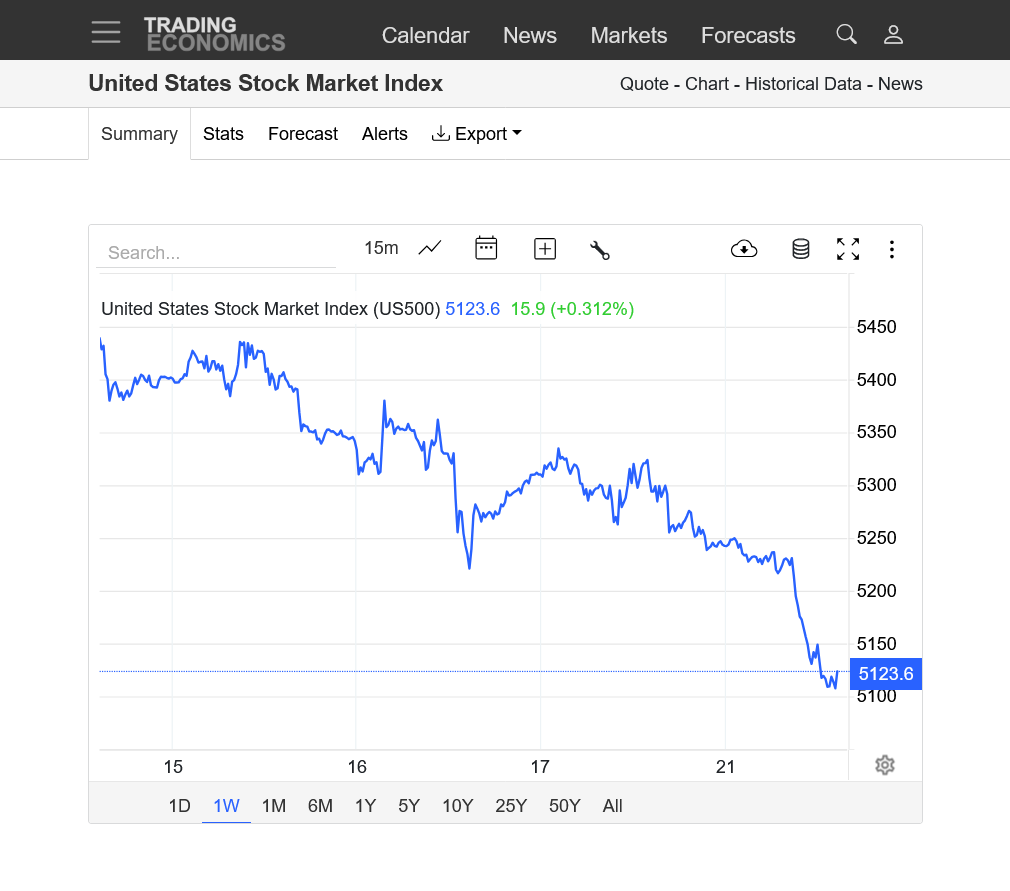
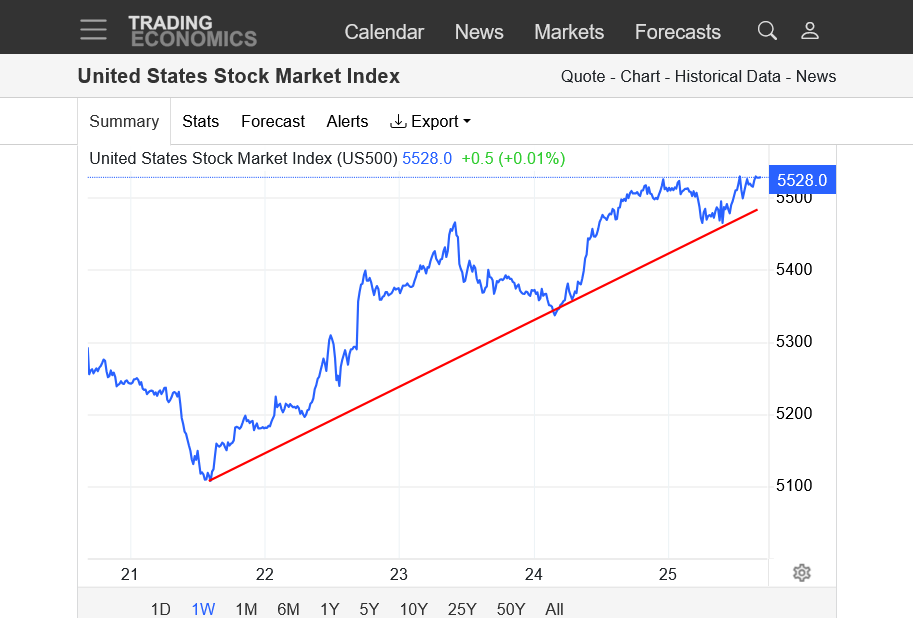
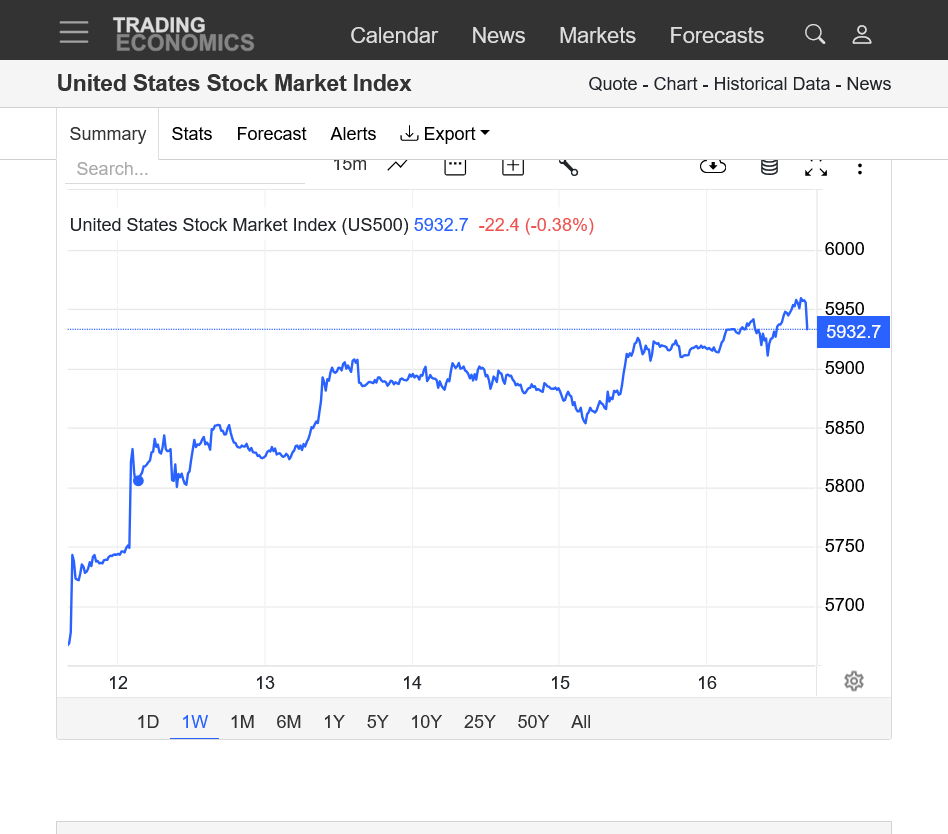
Heres the chart for the past week. Higher lows and solid resistance at the top of the ascending triangle.
Buyers/bulls are not waiting for lower prices but instead are buying at higher and higher set backs. Now we have a show down at the apex of the triangle. Often the place for a break out that favors the bulls because of the greater incentive for them to buy at higher prices the past week.
https://tradingeconomics.com/united-states/stock-market
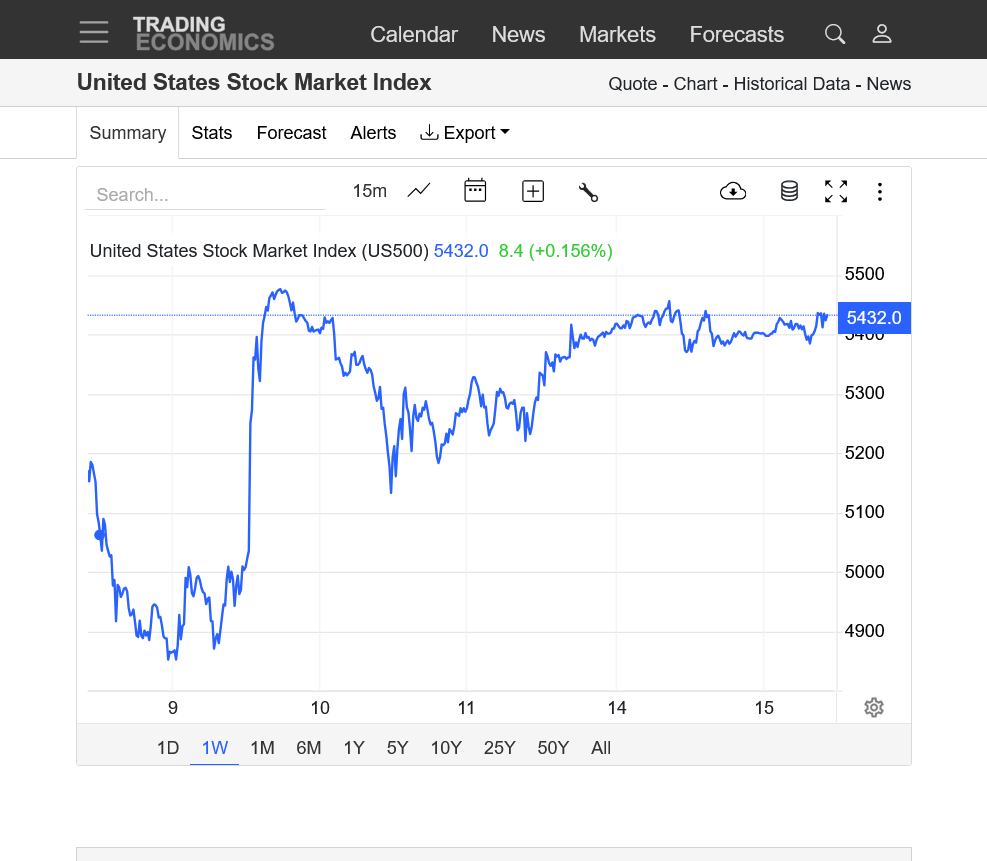
Another interesting item with this chart is how the range(from high to low) continues to tighten into an extremely narrow coiling pattern.
This actually is a LOWER volatility signal and also a market that is very uncertain, with bulls and bears not wanting to buy/sell outside the narrowing ranges.
I did just notice too that there have been slightly LOWER highs since April 9th, so the bears are also jumping in to short with this coiling pattern when the price gets close to the highs.
++++++++++++
It may just be a function of the buying drying up as we get close to the highs and the selling drying up at LOWER prices too.
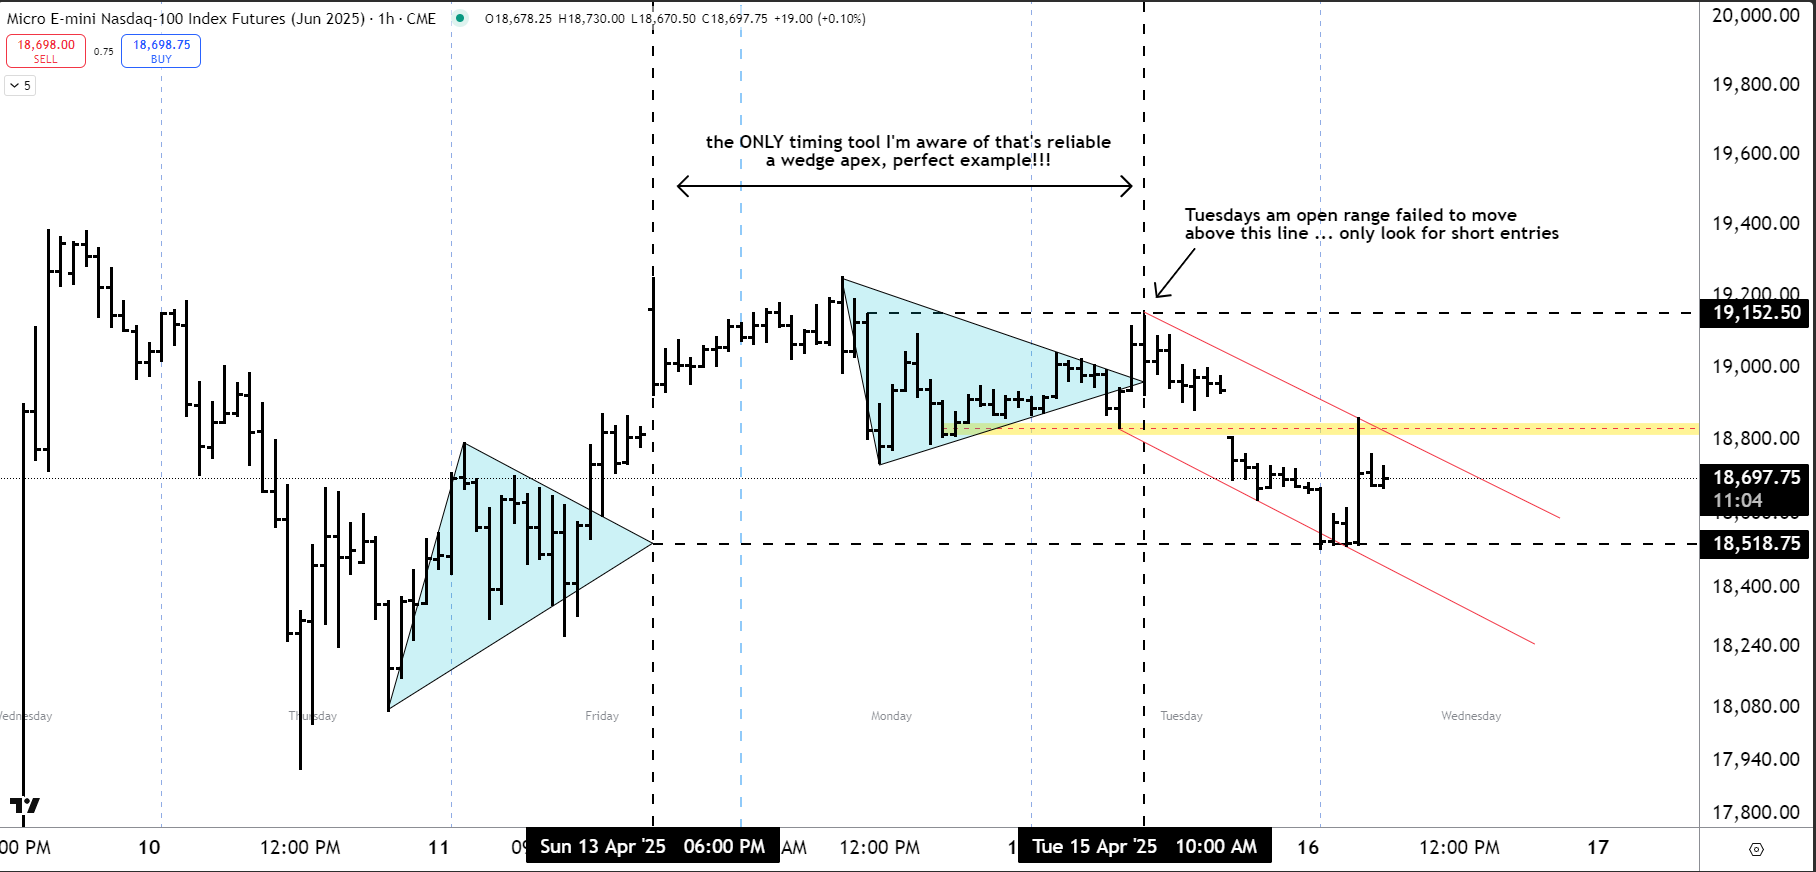
I'm looking for another leg down
cleaned up chart a tad simply to show how I use a wedge formation as a timing tool
Nice Eye cutworm !
Nice chart, Gedigan!
The market is leaning towards your prediction, cutworm!
As long as the trade war continues with China, it will be tough for the stock market to break out to the upside.
However, when Trump finally caves in, there will be an enormous spike higher.
China Hit With Up to 245% U.S. Tariffs in Escalating Trade Rift
https://finance.yahoo.com/news/china-hit-245-u-tariffs-130036849.html?fr=yhssrp_catchall
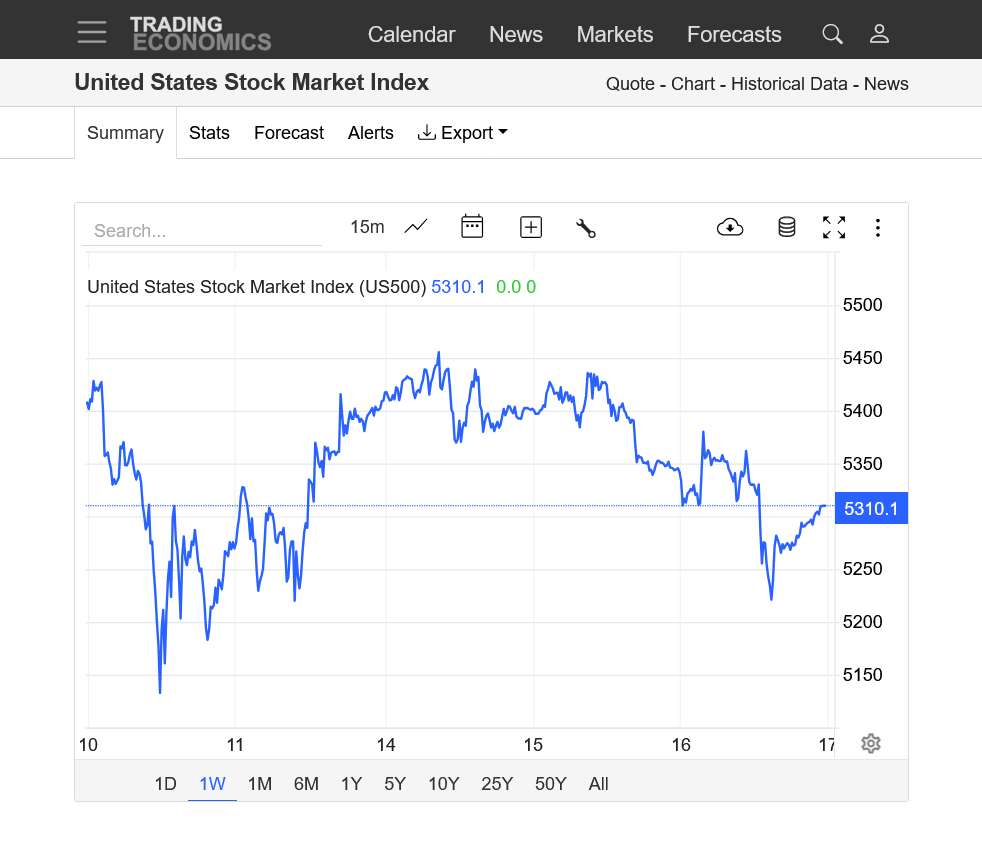
1. 1 week chart.
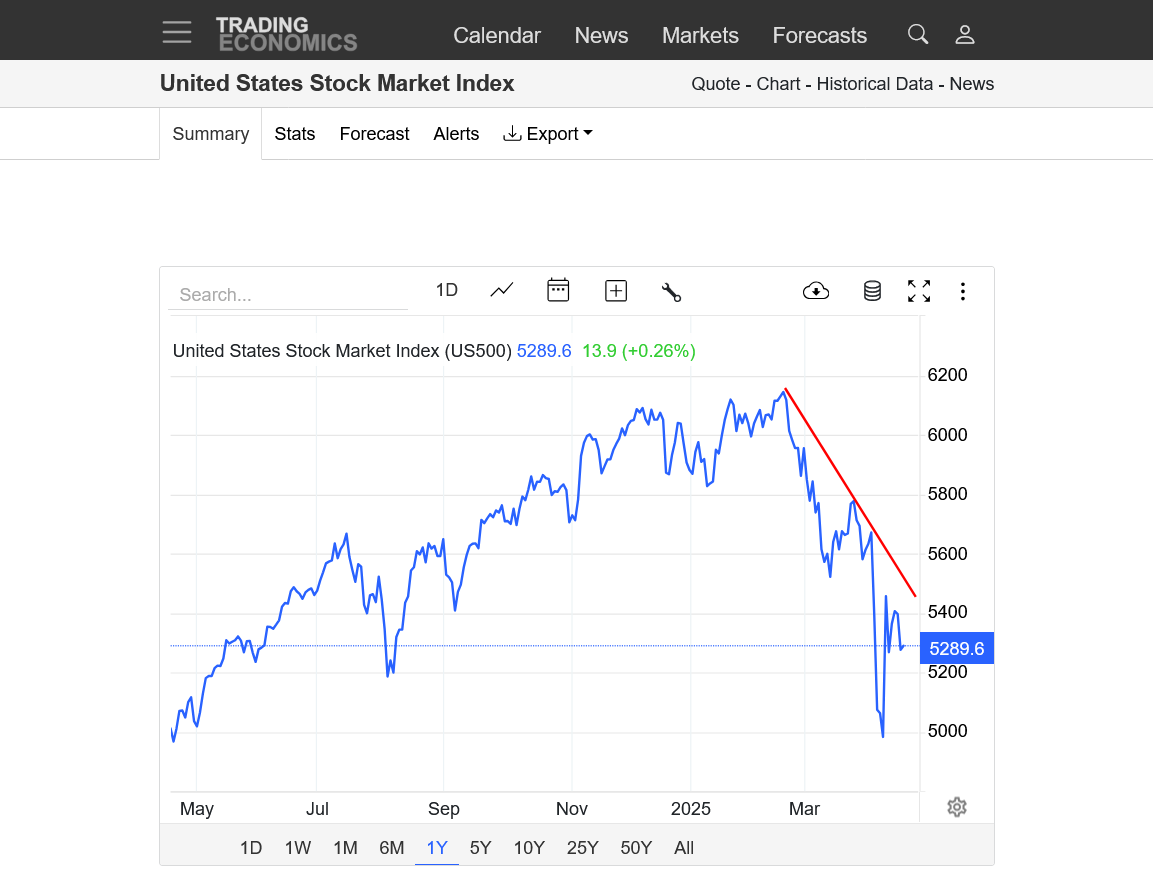
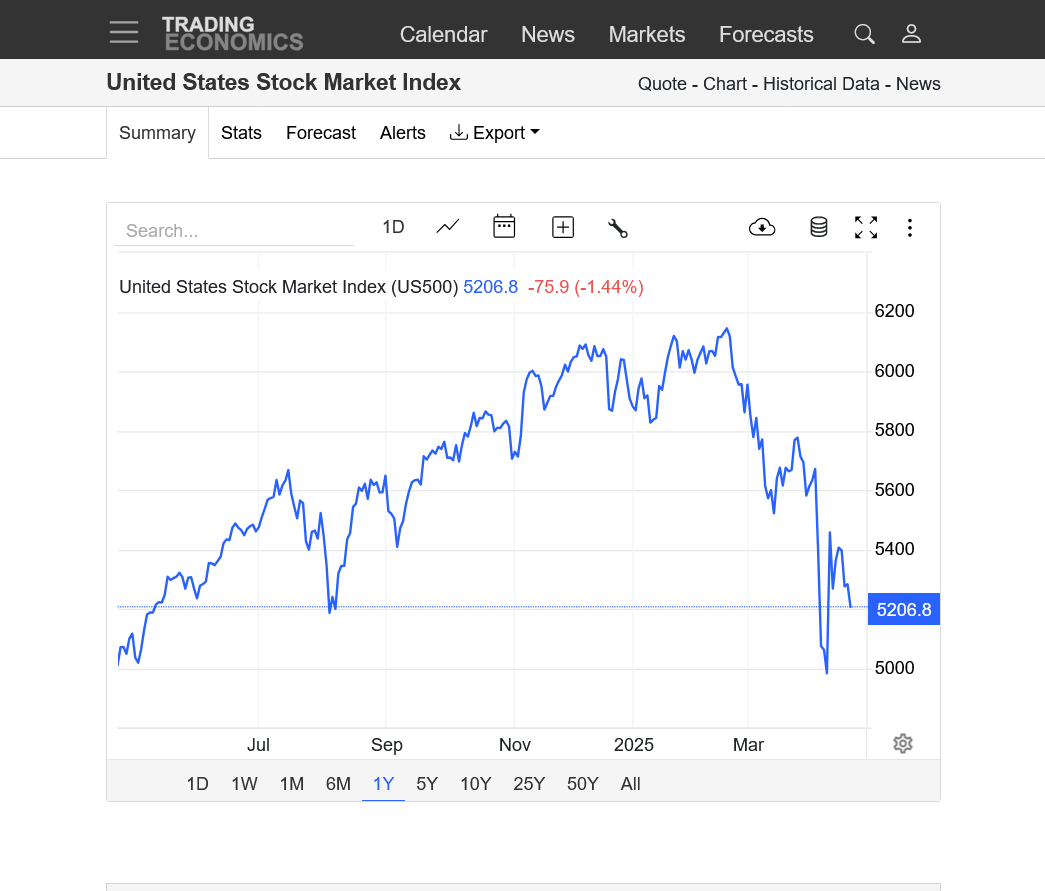
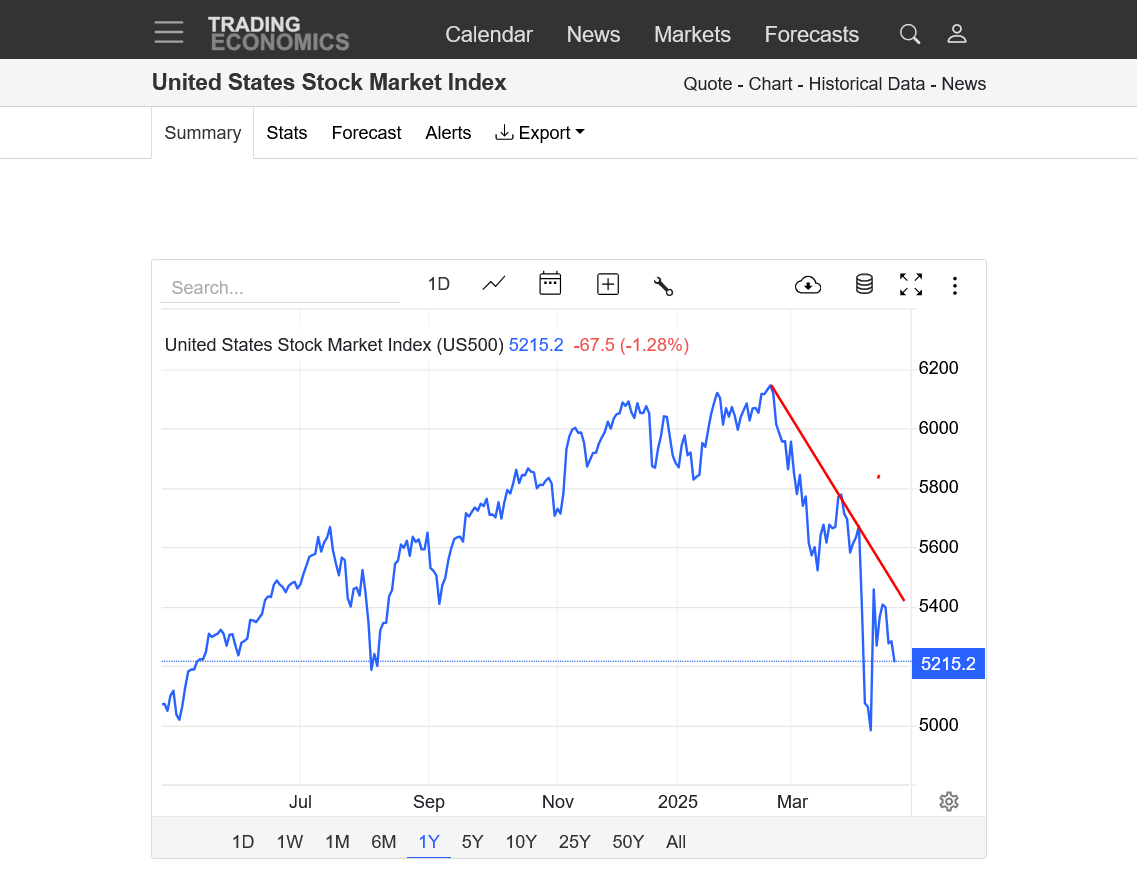
2. 1 year
Looks pretty bearish. Will we challenge or take out the lows? Tariff news has potential to move the markets the most!
https://tradingeconomics.com/united-states/stock-market
Good question Mike.
Believe it or not, markets are efficient and will balance an unbalance price sooner or later.
Hope I said that so ya can understand what I'm trying to show ya.
If one sided, it's unbalanced and will be corrected to offer a balanced price delivery.
The question I have. Will price move to balance the "last" unbalance area annotated
on the chart? I've annotated several examples knowing many don't see the forest for the trees.
At the moment price looks like a bearish channel. Where we go from here? I need more time,
but believe price needs to move back to top of the channel to maintain efficient price delivery.
gedigan,
I totally get your point on the unbalanced market thing.
If there are many more selling orders than buying orders, for instance, the market is unbalanced and the only way to balance it is to drop to a lower price where there are enough buyers(incentivized to buy from the lower price) to satiate the greater number of sellers.
The markets will always gravitate to the price levels that have a balanced number of buyers and sellers. When buyers or sellers are exhausted at a certain price, the market proceeds to the next price to uncover MORE of the sellers or buyers that it needs to be balanced.
This results in the price spikes you noted so well on your chart when one side dries up or the other side becomes more aggressive.
Agree to on the down channel being carved out now on the price charts.
1. 1 week
2. 1 month
3. 1 year
https://tradingeconomics.com/united-states/stock-market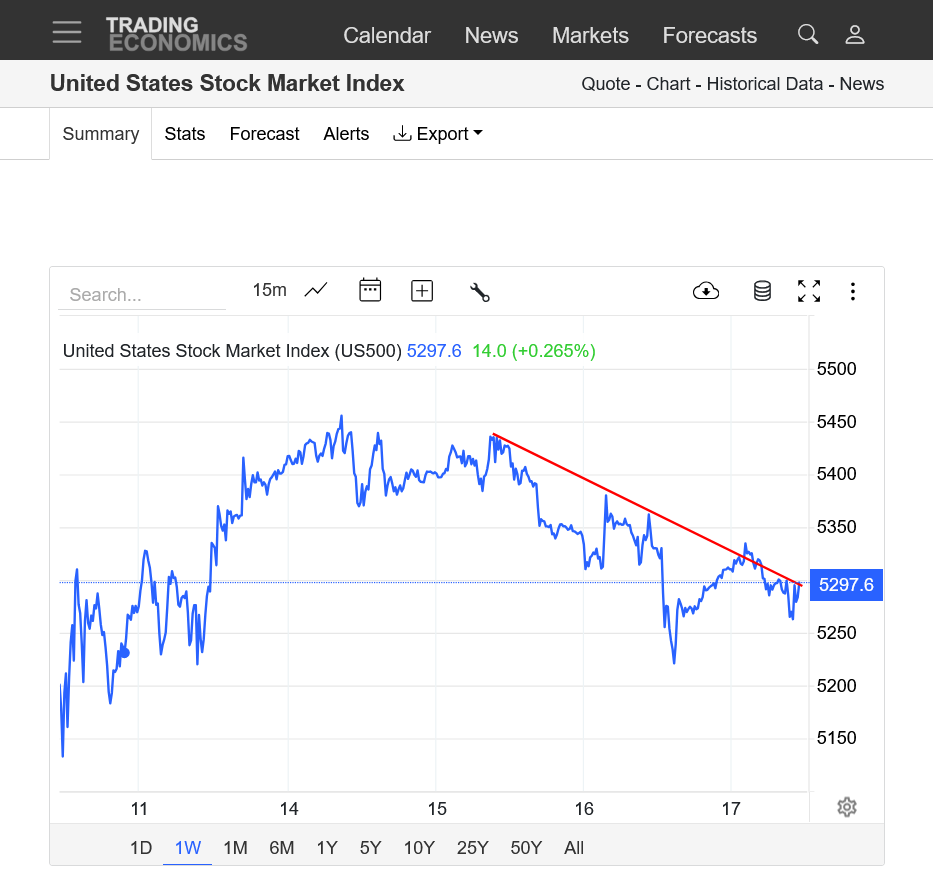
This reminds me alot of what RS (i think) used to post about. Didn't he talk about trade bulk or something like that? I always thought it seemed like valuable information to trade but to be honest I wasn't really smart enough to completely understand it :(
Buck1400 said: “This reminds me alot of what RS (i think) used to post about.”
—————-
Hey Buck,
When I saw “RS” in your post, it sounded like familiar initials though I’m not sure it is someone from here. But if from here, it could be someone who posted regularly about natural gas. Who does RS stand for?
Larry,
this was from the old forum and I wasn’t the moderator to see his real name but he went by rs.
we can guess that stood for his initials.
i don’t remember the markets he traded but don’t believe NG was one of them.
As I remember RS was always bullish oil by buying out of the money calls.
Yea I remember the guy who was always big bullish oil, but I don't think that is who I am thinking of.
I might have the name messed up.
The guy I'm thinking of always had long detailed posts showing trade volume at each strike price and trying to initiate trades based on that, I think, but its been a long while.
buck,
I am thinking the exact same thing as you about rs!
I thought that Jim was the big oil trader.
I just looked back in my NG EIA/AGA weekly inventory guessing records. I found no rs.
It was interesting to look back. These were the most frequent guessers (in addition to MetMike and myself) at MarketForum and the predecessor, INO (guesses back to 2001):
Rkelley guessed many years (2004-2017)!
gasman (active NG poster way back)
gasWOman (play on gasman lol)
Rocket (active long time back)
ShipDog
Florian Schoepp
SAJ (Stu) (well known options shorter I think)
Jim M (still active)
ETM (many guesses)
jt (many guesses)
sk
Pat (guessed pretty frequently)
Karol
Reynolds
BOBA
dave (in KC?)
Drew “Beaners” (just a few guesses)
Thanks, Larry!
Too bad that everything with the old forum is gone forever.
I remember what great fun it was to guess/estimate what the EIA weekly storage number was going to be!!!
That was an awesome contest/contribution of yours!
Thanks, Mike, for the nice words. It was both fun and useful to me back when I was actively trading NG.
Do you remember many of those on that list?
Rkelley was about the only one guessing for awhile outside of us.
I assume you remember Drew “Beaners”.
Do you remember gasman from ~20 years back? He posted lots about NG in addition to the weekly EIAs.
Do you remember SAJ (Stu), the options shorter?
I remember all of them, Larry.
Except for Karol.
All this talk of the old timers reminded me of the ebook one of the old posters put together. "Stop Struggling and Start Making Money" by Jonah Ford. Don't remember what his forum name was. I Prolly should reread it.
Eta just took a look at it and copyright dare is 2010. Wow time flies.
His handle here was "stimpy"
local and him were good friends outside the forum. He had some sort of disease and might have died young.
stimpy was extremely sharp but thru no fault of his own, or mine cost me, almost my entire account by recommending his broker, PFG Best after MF Global, my broker went bankrupt on October 31, 2011. A day that I remember like most people remember 9-11-2001!
1 like
By metmike - April 6, 2025, 7:46 p.m.
Greenman and local were 2 of the sharpest dudes I've ever known.
You might remember stimpy. He's was very sharp too and also was the one that suggested I open the new account at PFG Best. They did actually have the best service but part of it was the owner was using all the clients segregated account money for services and for him to have a lavish live style.
He was giving the FTC and others a post office box address to him for all their audits and he would make up numbers, then send them back. Incredible fraud by him and incompetence by the FTC/CFTC. Stimpy felt pretty bad when they went bankrupt.
Corzine bankrupted MFG 8 months earlier because he had a massive over leveraged bond position on and kept getting margin calls. To make them, he raided the segregated futures accounts like mine.
It was discovered when MFG was trying to sell the firm and the buyer was scrutinizing all the numbers but they didn't add up.
Supposedly the CFTC and FTC have strict rules and regulations in place now, thanks to these 2 bankruptcies.
Too bad they didn't do that BEFORE then.
https://www.marketforum.com/forum/topic/110975/#110981
+++++
local picked his handle because that’s what he did for a number of years........its what they called the floor traders in The Pit!
He spent several years as a floor/pit trader at the CBOT. I think he traded bonds.
If you’ve ever seen a video of the old days on the floor from decades ago, you can imagine the special kind of person that was able to do this.
For awhile, I think after he left the floor, he did a newsletter thing that focused on technical formations
http://www.tradingpitblog.com/2014/05/video-of-last-day-in-old-cbot-bond-room.html
Above is a great 14 minute clip of candid footage on the last day of the old CBOT bond room which closed in 1997 and was subsequently turned into the MidAm trading floor, but is currently occupied by the offices of Peak6. Clearly it was some seriously tight quarters at the old bond room before moving to the far more spacious new bond room!
It looks like "local" is still in the business with his trading company being Core futures.
Actually, I remember that now as he started this company 20 years ago. Good for him!
https://www.moneyshow.com/expert/cd7c14430fc84ef0ac61d457d3aff1b3/
https://www.bizapedia.com/in/core-futures-inc.html
Continued weak trading but much lower volatility with stocks drifting lower and lots of uncertainty.
https://tradingeconomics.com/united-states/stock-market
Another bad day for the stock market. However, it is still above this months lows and still holding above the long term trend line but we are approaching those levels.
Ordinarily, violating them has tremendous, additional downside potential but this time, the biggest determinant is what comes out of President Trump's mouth.
He's watching the stock market for sure and likely very concerned. He may decide that its going to get worse unless he takes immediate action on his tariffs scam.
In that case, the White House may start issuing news about how Trump and China are working things out. Or that Trump's tariffs worked (with some crazy rationale) and we are reverting back to free trade. This would be done to stop the market from additional collapses. I'm just speculating on the BEST CASE SCENARIO in my opinion and that Trump's people will overwhelmingly tell him that things are not going as planned.
If Trump triples down, despite most markets really strong negative reaction, telling him he is on the wrong path..........then anything is possible.
1. 1 day-DOWN
2. 1 week-Strong DOWN trend
3. 1 month-still holding early month lows-in a DOWN trend
4. 1 year-DOWN channel that accelerated after the April 2, 2025 tariff announcement.
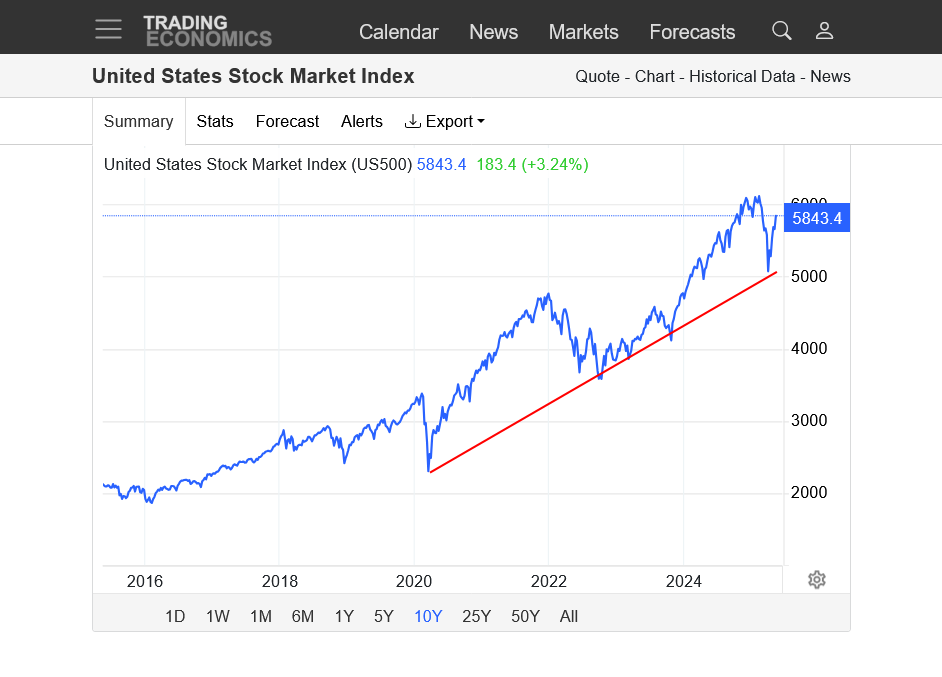
5. 10 years-still holding the long term UP trend
https://tradingeconomics.com/united-states/stock-market
Can we break the bearish channel that gedigan mentioned last week?
If/when Trump makes an announcement about a deal with China will do it! News still dominates this market and many others.
Fixed the link:
https://tradingeconomics.com/united-states/stock-market
To maintain efficient price delivery on a weekly basis, my last post I thought we would move back to the top of the channel. Friday's close confirmed my thought process. Below a daily chart and the logic behind the above comment.
Using the Feb. 19th high to Mar. 13 low price retraced 50% of the range,
then proceeded to mark down to the fib 200% extension.
From the Apr. 7th low to Mar. 25th high price is attempting a change of trend.
A move above Monday's high would confirm a trend change.
What's intriguing about a weekly timeframe (to me), a potential move to 8822...
Thanks a ton, gedigan!
Wonderful analysis as usual. I'm no stock market guru but many readers/posters here are interested in this topic and I greatly enjoy the analysis.
To me, at this time the news has been more important than usual, especially related to Trumps tariffs. Technical analysis is helpful but a statement of action by Trump can suddenly make an entire, well thought out interpretation from 5 minutes earlier completely wrong.
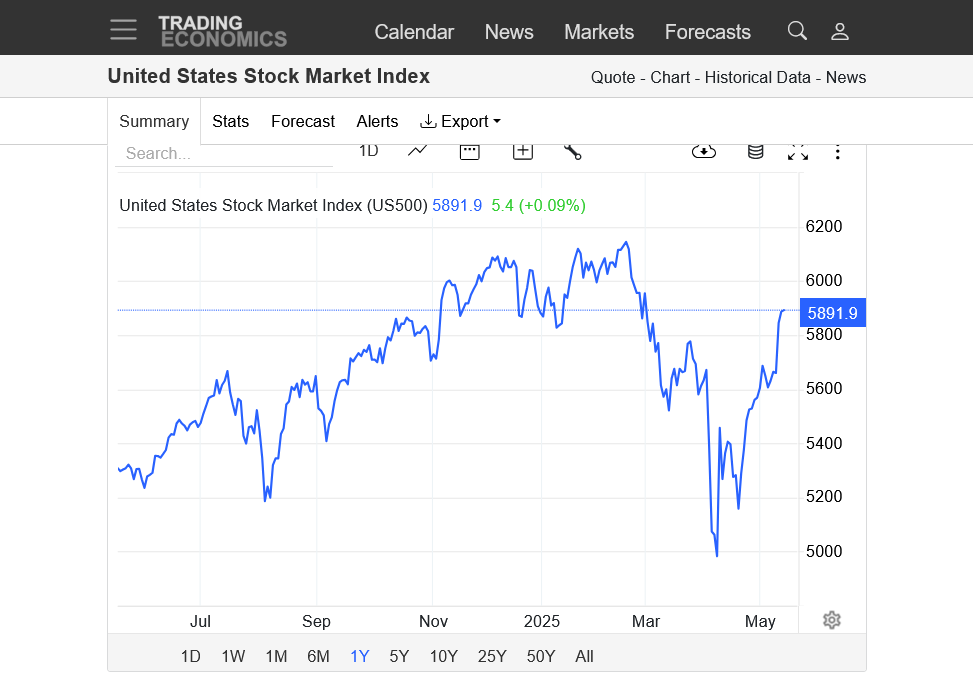
The market had a huge, bullish week.
1. 10 years-held the long term uptrend
2. 1 year-breaking out of the top of the down/bearish channel
3. 1 month-new uptrend
4. 1 week-big week up
https://tradingeconomics.com/united-states/stock-market
The daily bar I'm watching is April 2nd ("liberation" day).
Trump might soften his tone to boost bullish sentiment, but he's not going to completely call off the trade war. (ego)
I would be inclined to sell against those levels. If we clear April 2nd highs, then I'm wrong.
That is right on the money, joj!
However, Trump is very unpredictable as you know.
Trump's ego is #1 as you say and he's using pathological thinking in applying this absurd tariff nonsense. I will guess that the stock market recovering is likely to keep his tariffs in place longer.
If it goes back to crashing from the tariffs, that's when he's most likely to back off more.
The sad reality of this fact is that we are likely NOT going to get the smartest global economic policy from Trump AND the best economic conditions simultaneously.
If the economy holds up, Trump has incentive to maintain most of his damaging tariffs.
If the economy tanks, Trump is incentivized to cut back on the damage his tariffs are causing to the economy.
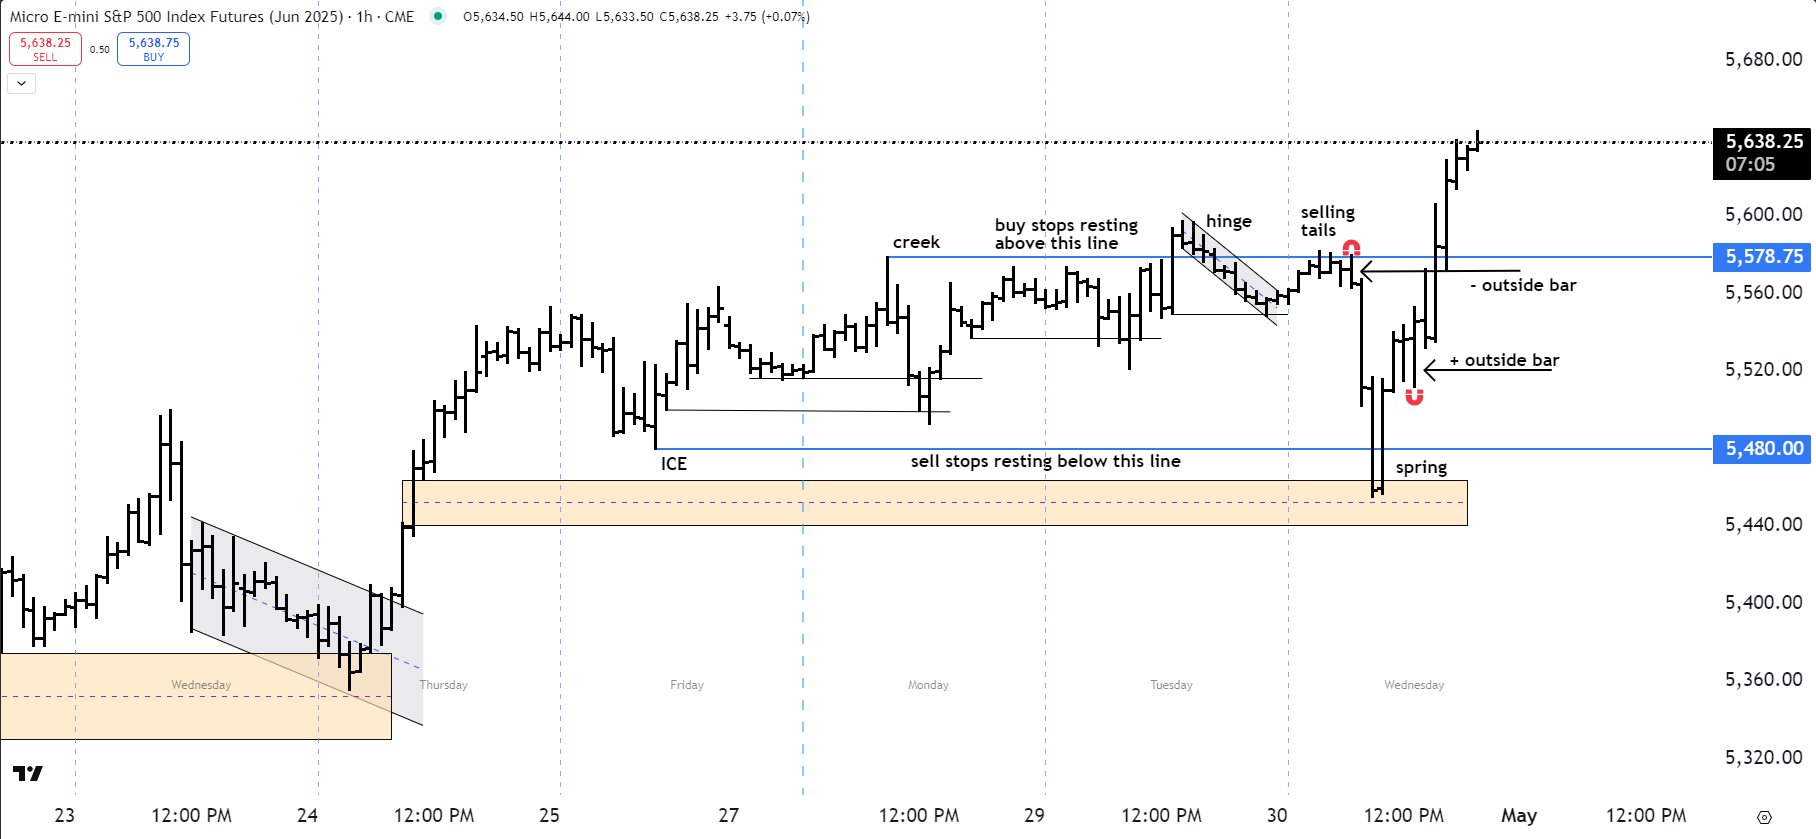
My last post I mentioned a close above Monday's high was necessary. Todays chart explains the how we accomplished a move above that high.
"The market always tells you what to do. It tells you: Get in. Get out. Move your stop. Close out. Stay neutral. Wait for a better chance. All these things the market is continually impressing upon you, and you must get into the frame of mind where you are in reality taking your orders from the action of the market itself--- from the tape" ... Richard D. Wyckoff
Please remember:
Before there's a significant price move of any real magnitude or importance,
generally, there's going to be a stop hunt that takes place right before that
price delivery occurs. Perfect example below.
Be kind - Always.
If the weekly chart is correct, today we moved out of the channel for a test of Feb. highs.
fayq,
I've been looking at price charts for over 3 decades and that last chart has the most impressive images to present the ideas EVER!
Dow futures are -250. The major indices are mainly -0.60-0.65%.
Thanks, Larry!
Previous thread:
jobs report april
Started by cutworm - May 2, 2025, 9:17 a.m.
S$P mini breaking above the march highs. Breaking out of an inverted head and shoulders.
NASDAQ up over 700 points!!!! same chart pattern.
China deal.
Thanks, cutworm!
https://tradingeconomics.com/united-states/stock-market
1. 1 year-upside break out from the bearish/down channel in late April.
https://www.marketforum.com/forum/topic/110810/#111493
2. 10 years-held long term trend line

I would mention where the stock market and bean market are at as compared to Liberation day but do not want to give TDS'erS the vapors. Seriously thought after all the talk isn't the economy pretty much 2 competing guesses and there are no true fortune tellers
Stock market continues up. Can we make new highs?
Remember, the stock market is speculative money from massively rich investors who are not exactly tied to principles of valuation similar to what most commodities are.
The prices are based on whatever speculators will pay for it. In a bubble, stock prices can greatly exceed the actual value of the assets being traded.
If a company has increased its profits by 15% but it's stock price goes up 150% because speculators with millions of dollars throw their money at it, does that mean the company is worth 150% more?
I dunno. Depends on your take.
The point is that people throwing their money at the stock market are inflating the value of everything well beyond what it would be worth in every other realm.......except the stock market.
The buildings aren't worth 150% more. The sales aren't worth 150% more. The profits aren't worth 150% more but the stock is because of speculators that assign that value of 150% more based on an extreme bullish bias to use their money to buy stocks.
If big investment money needs a place to go and other big investment money has the same mentality it becomes a self fulfilling prophesy.
The stock market keeps going up because everything THINKS the stock market will keep going up.
https://tradingeconomics.com/united-states/stock-market
1. 1 year below
the opposite is true in a down market.
Thanks, cutworm,
When was the last down market that took the value of stocks below their actual value?
Stocks are worth 3 times the value that they were 10 years ago?
No way!
This last spike down correction barely tested the long term trend line which is MUCH HIGHER than the increase of the true value of the actual companies in the stock market during that time.
Nearly 90% of Fund Managers Say U.S. Stocks Are Overvalued, Most Since 2001
https://finance.yahoo.com/news/nearly-90-fund-managers-u-152509879.html?guccounter=1&guce_referrer=aHR0cHM6Ly93d3cuZ29vZ2xlLmNvbS8&guce_referrer_sig=AQAAAJzhtVVW4owphsIDRFNd_SToteeJ-PB7cLiTJVxFHJEEaG7tEITui5AiKrmB7EOLJdrxhZCgcRfxMKcosnJ8mf4thbThMvQE-wZKzNScJbY9IAbqhRqTeVcChC2rh40CBCL8xyok71bi2Zog1H_DX82Uu2BbsGyiKfErTBO3eBaj
https://www.investopedia.com/articles/fundamental-analysis/09/elements-stock-value.asp
Moody's downgrade for US announced just before the 4pm close caused a small spike lower in the last hour:
https://tradingeconomics.com/united-states/stock-market
NQ quarterly chart
How many pay attention to this timeframe?
Kinda cuts out lower time frame noise
New highs this am