I saw an interesting chart of gold adjusted for inflation (I don't know how to post charts)
When gold touched $3500 / oz this week it equalled the 1980 high (inflation adjusted).
In retrospect the market backed off $200 indicating some resistance there. The high made in 1980 was made on speculative frothiness due to 13% inflation. This gold bull market isn't based on an inflation scare in my view (currently at 2-3 percent). Also, it doesn't seem frothy currently. I've only seen one gold bull on CNBC and he was recommending gold mining stocks, which have greatly underperformed the metal.
Central banks are reportedly buying gold. Perhaps the status of the US dollar as the worlds reserve currency is in question now?
I have no strong opinion as to direction short term but 5-10% of ones assets allocated to gold seems prudent as a sort of financial disaster insurance policy. Land or Real estate might work just as well but gold coins are fairly liquid and can be easily transported.
Previous threads:
Gold ---- next---!!
13 responses |
Started by fayq - April 8, 2025, 11:46 a.m.
https://www.marketforum.com/forum/topic/111021/
Gold $3000
https://www.marketforum.com/forum/topic/110441/
12 responses |
Started by joj - March 14, 2025, 5:49 a.m.
Thanks, joj!
Gold and Trump Trade???
Started by joj - Feb. 10, 2025, 8:17 a.m.
https://www.marketforum.com/forum/topic/109907/
Gold 4 Hour Chart $$$
21 responses |
Started by mikempt - Sept. 29, 2024, 8:40 a.m.
https://www.marketforum.com/forum/topic/107734/
Gold Trading Range
25 responses |
Started by mikempt - Aug. 4, 2024, 8:29 a.m.
https://www.marketforum.com/forum/topic/106400/
GOLD dance!!!
45 responses |
Started by fays - June 6, 2024, 7:09 a.m.
https://www.marketforum.com/forum/topic/104645/
Gold
37 responses |
Started by cutworm - Nov. 29, 2023, 8:14 p.m. https://www.marketforum.com/forum/topic/100943/
I'm still trying to get it all together after the injury and catching up but doing WAY better than expected and appreciating some really basic things much more than before.
Thanks again, joj for starting a new VERY insightful thread on a popular topic here.
Was this finally THE top? Double top with 1980 dialing in inflation? Everybody predicting a top recently was wrong and blown out.
Mike had a great idea, shorting gold trade when some short term indicators flipped down, with the way overloaded longs vulnerable to a sharp spike lower(even if there was an issue with me on the timing/posting, it was actually smart trade recognized by a seasoned trader with great observation skills).
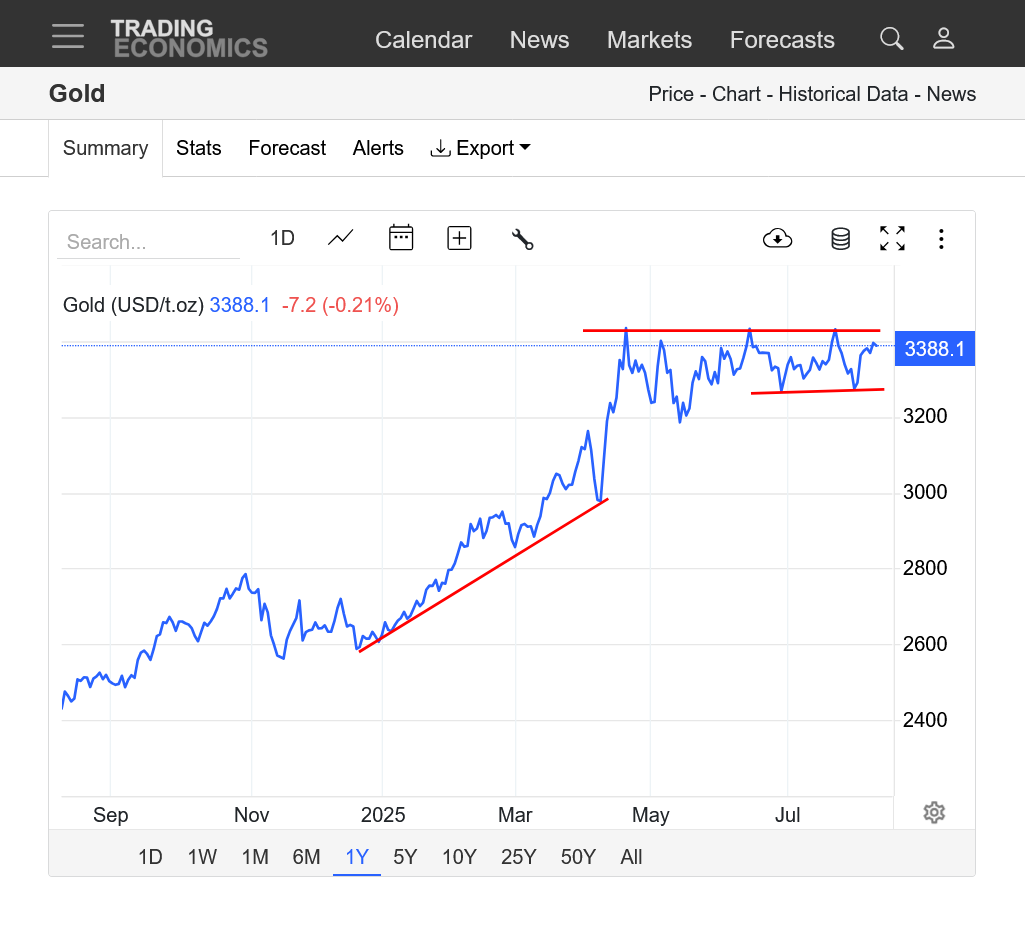
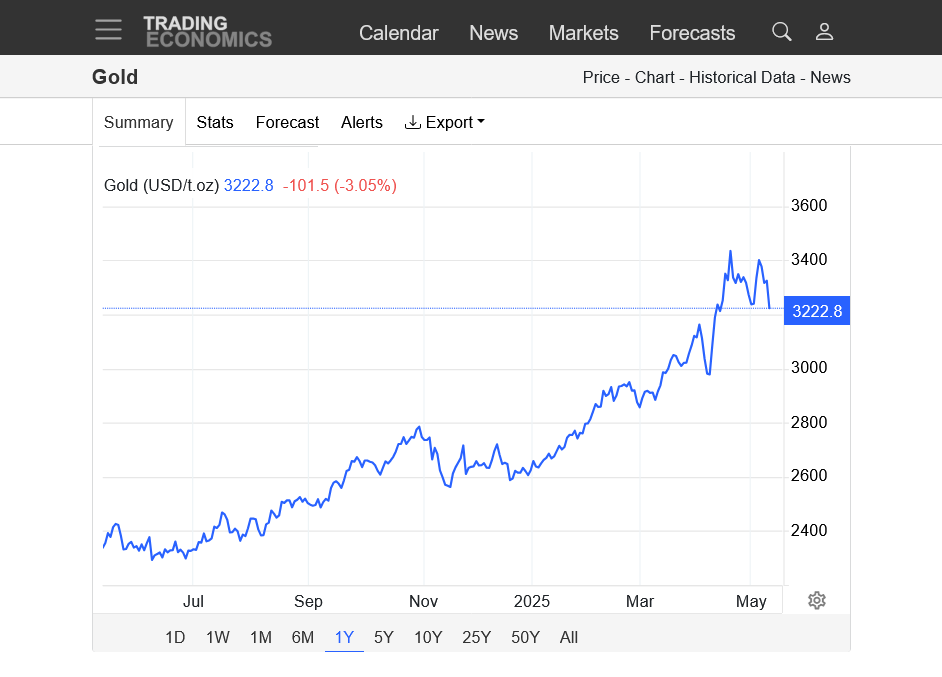
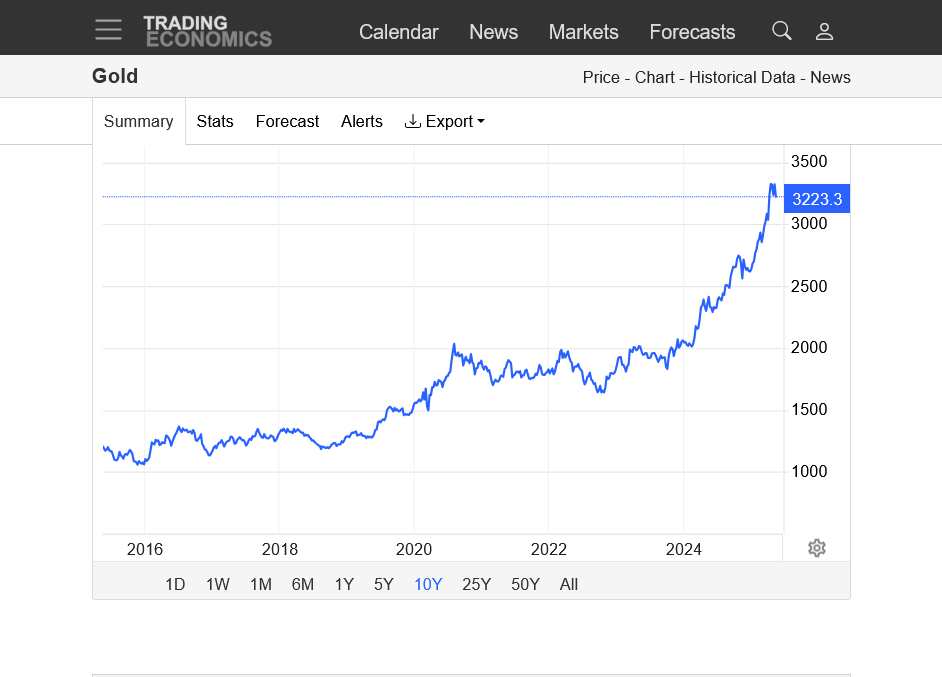
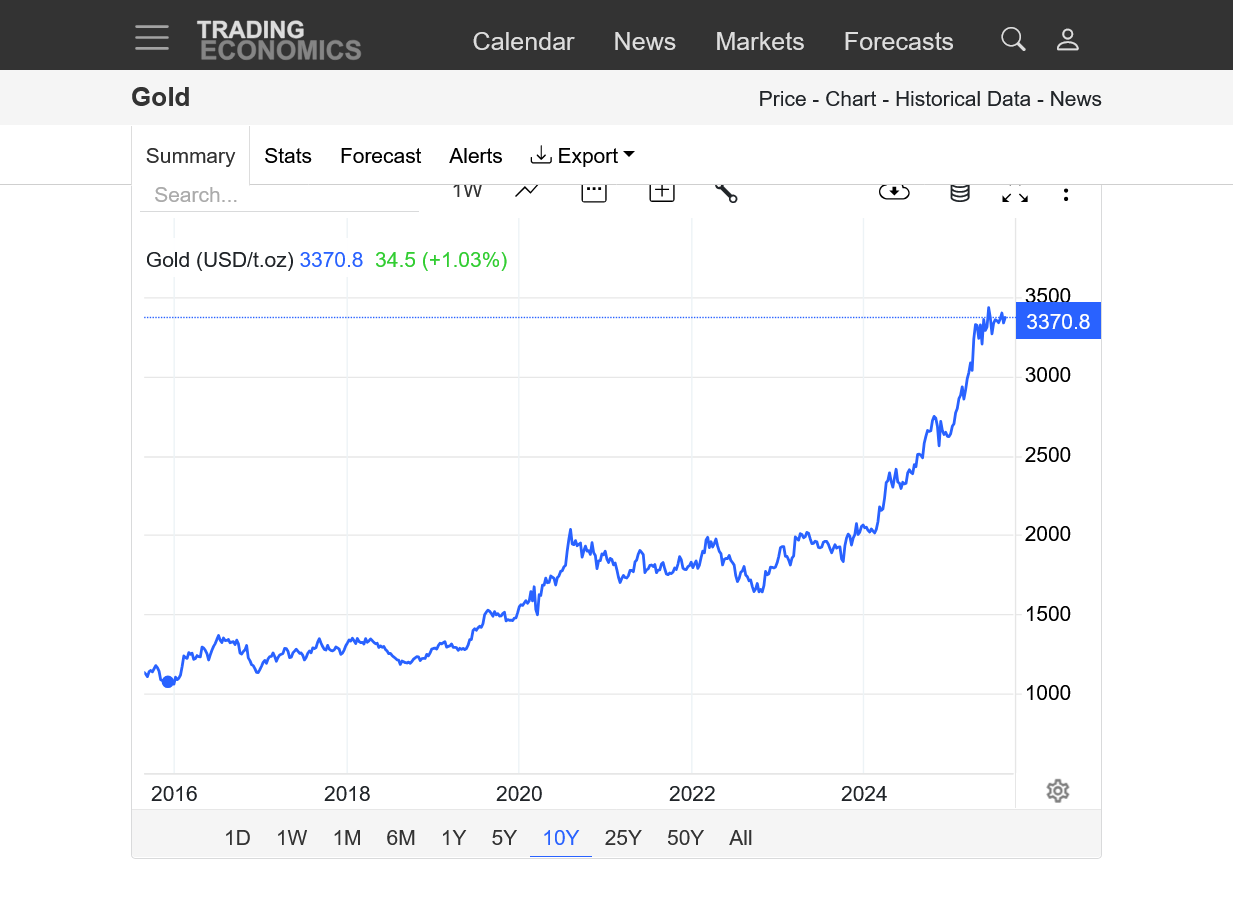
https://tradingeconomics.com/commodity/gold
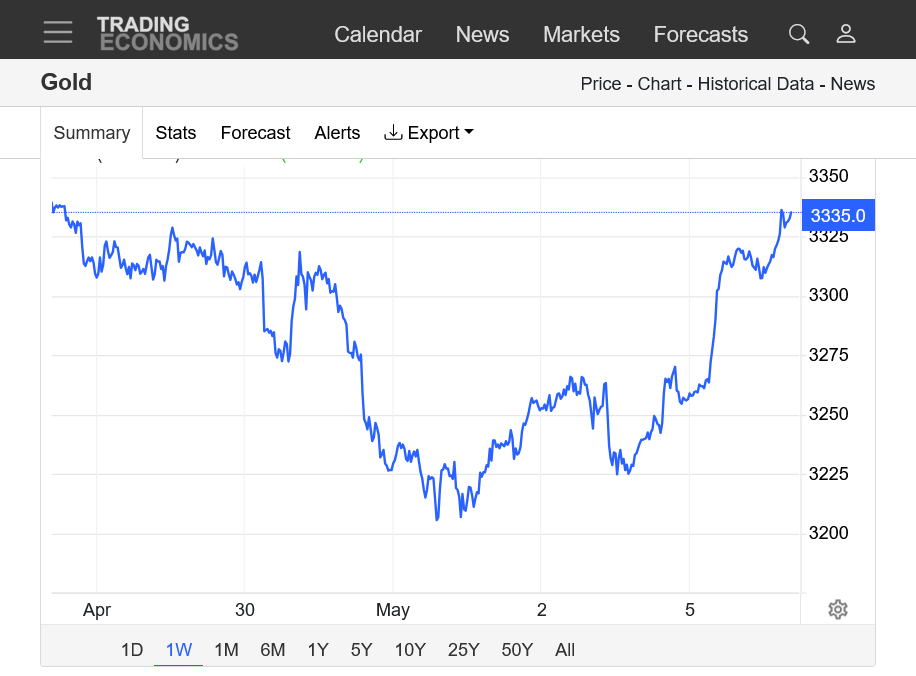
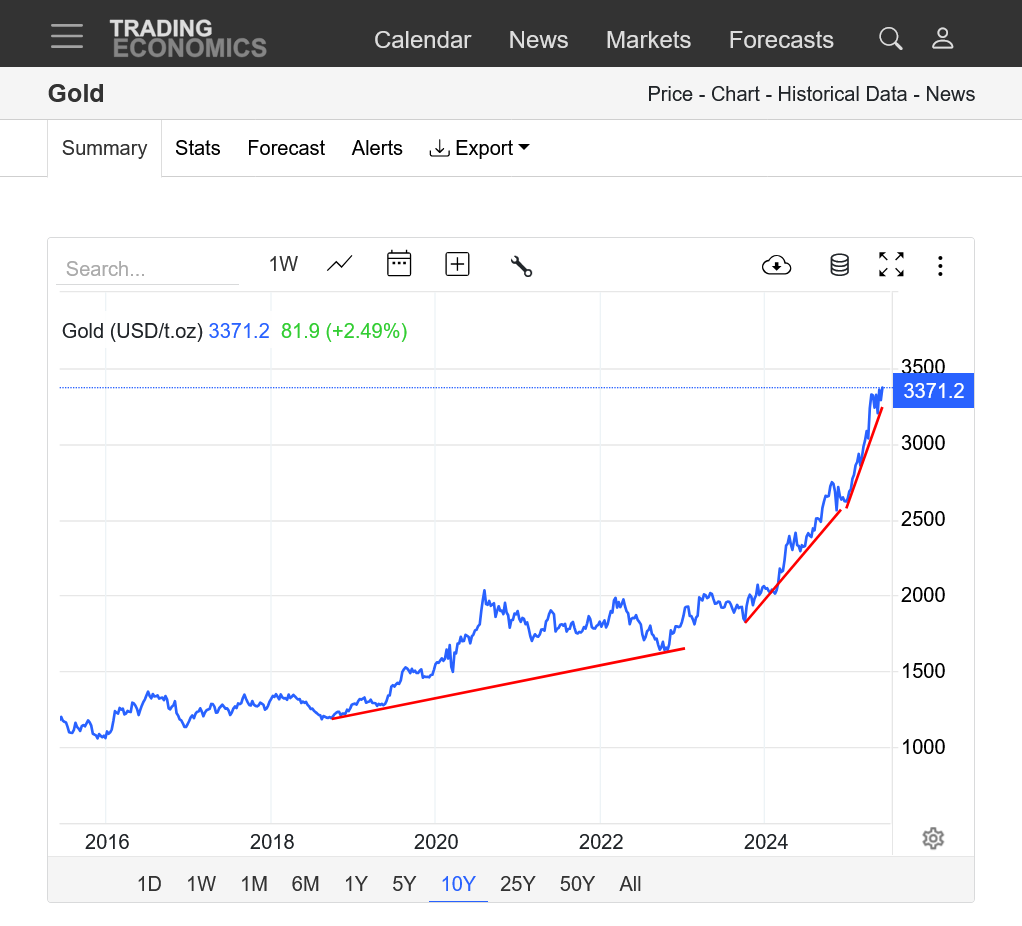
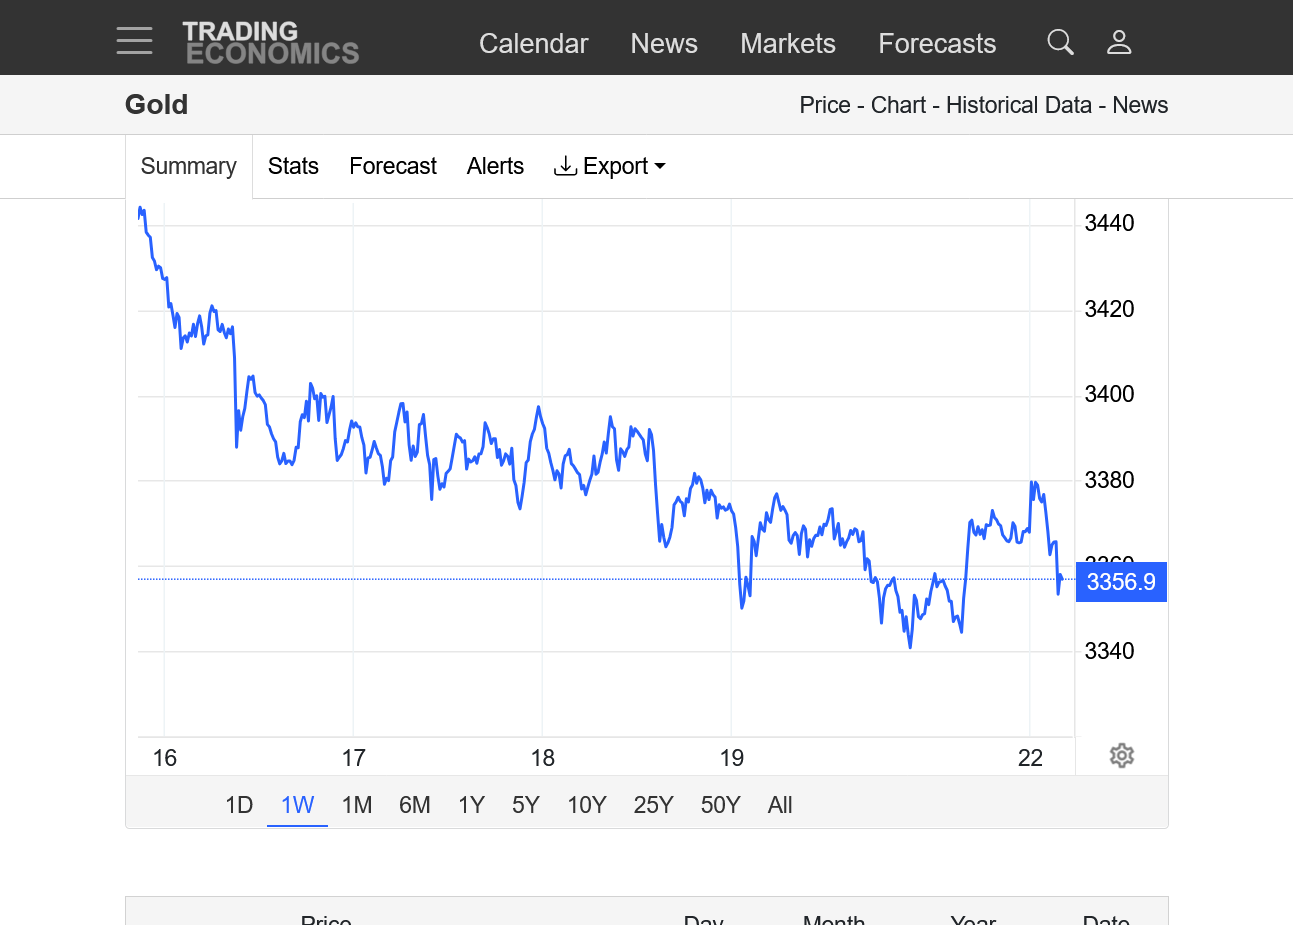
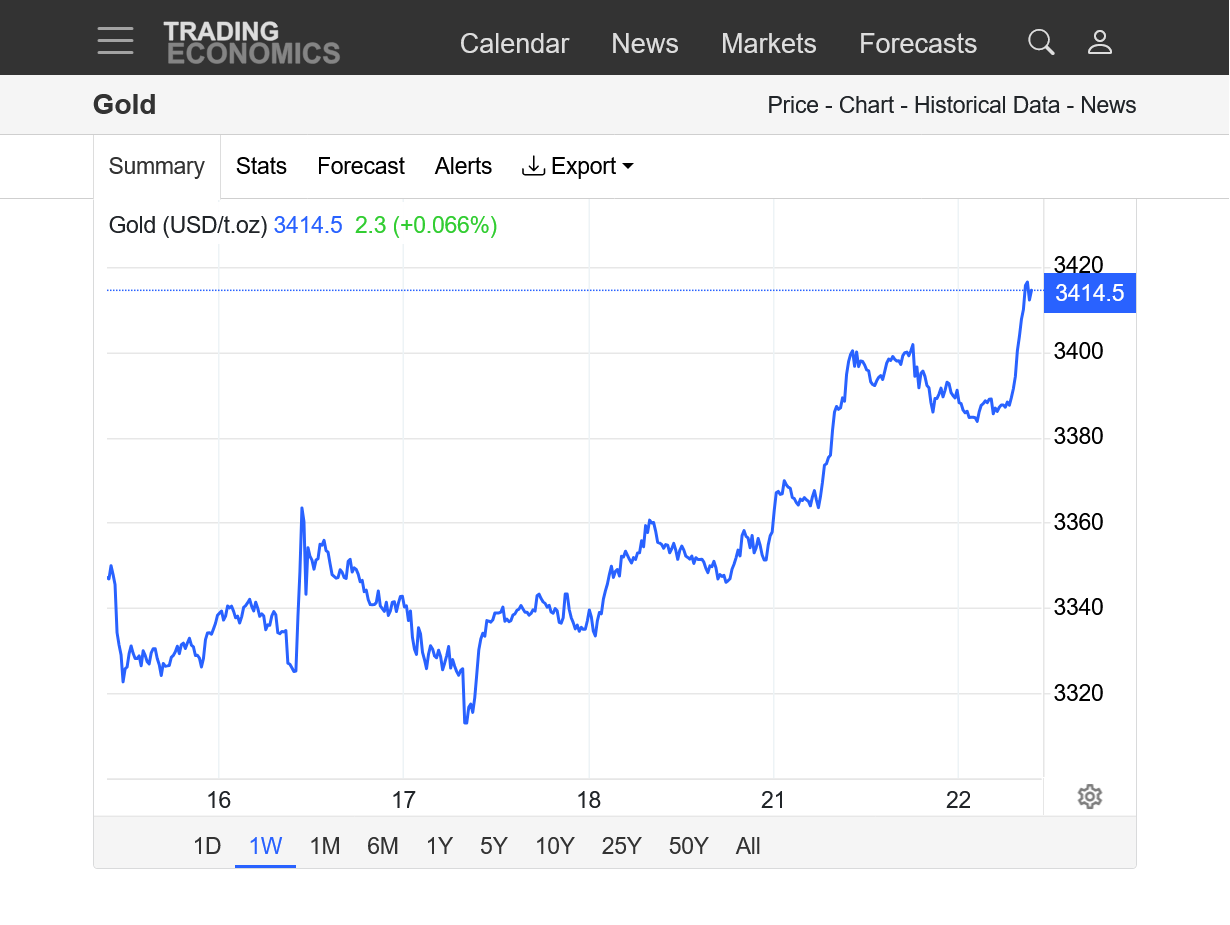
1. 1 week MAJOR reversal down earlier this week. Spike to all time highs at psychological resistance of 3500, followed by a lower close that day. Reversals don't look more impressive than this one and it certainly caught the attention of the buy at any price trade mentality fueling the parabolic move higher. With the buying temporarily exhausted and the new mentality of profit taking and new shorts who were picking the top because of this powerful, technical topping formation. Regardless, the price actually stabilized the last 2 days and is NOT in a free fall yet.
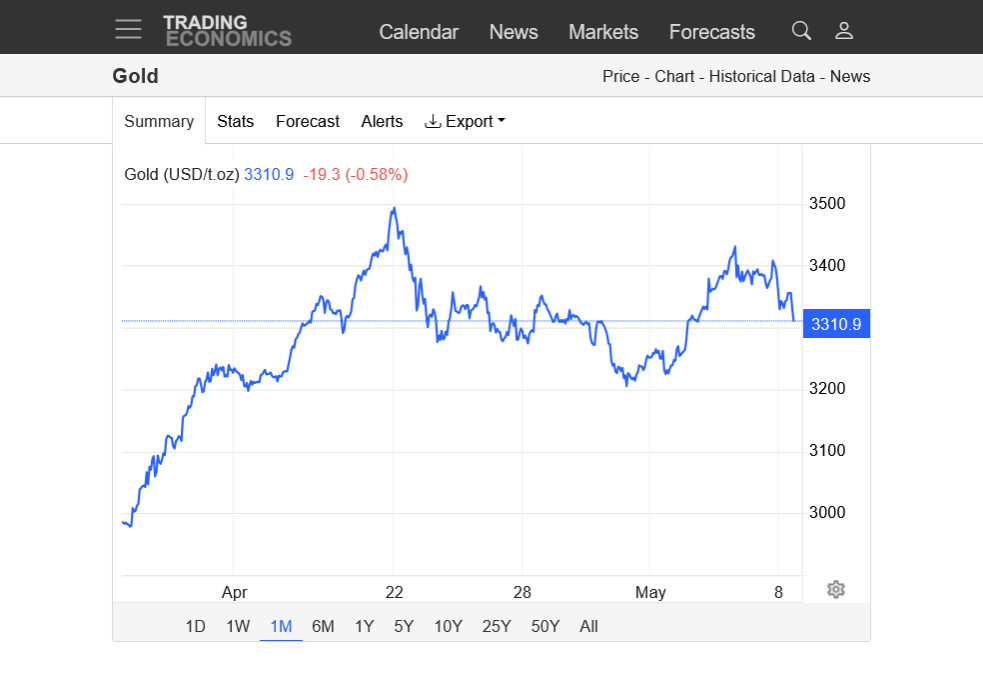
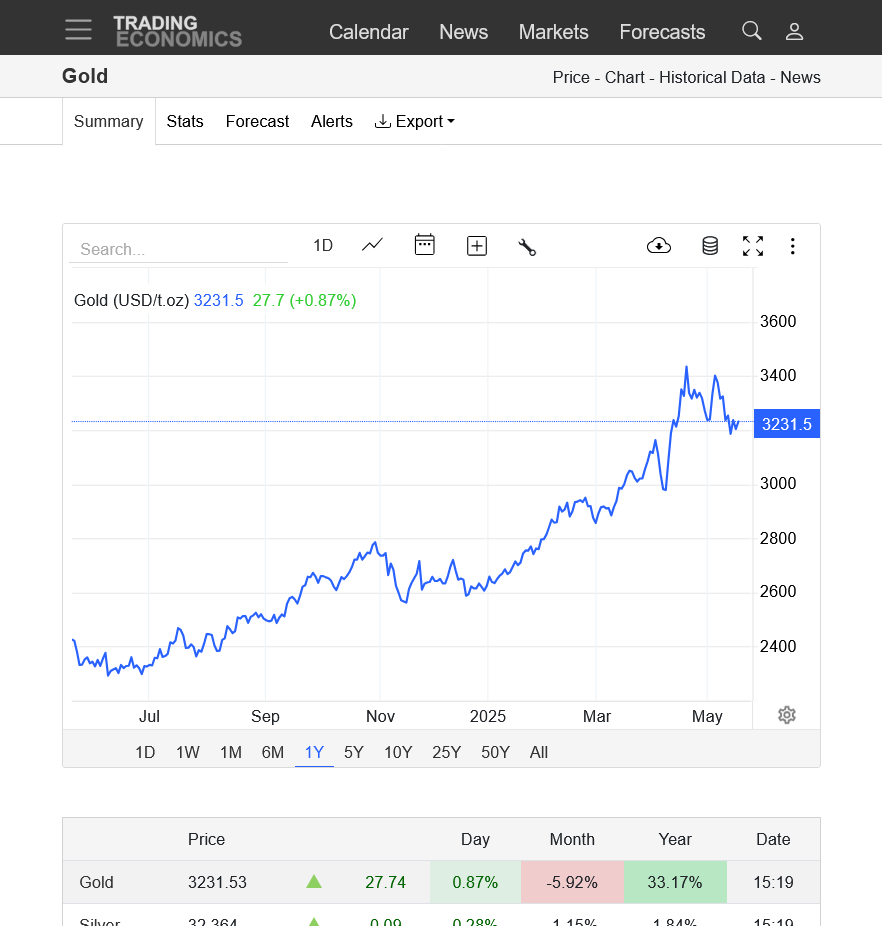
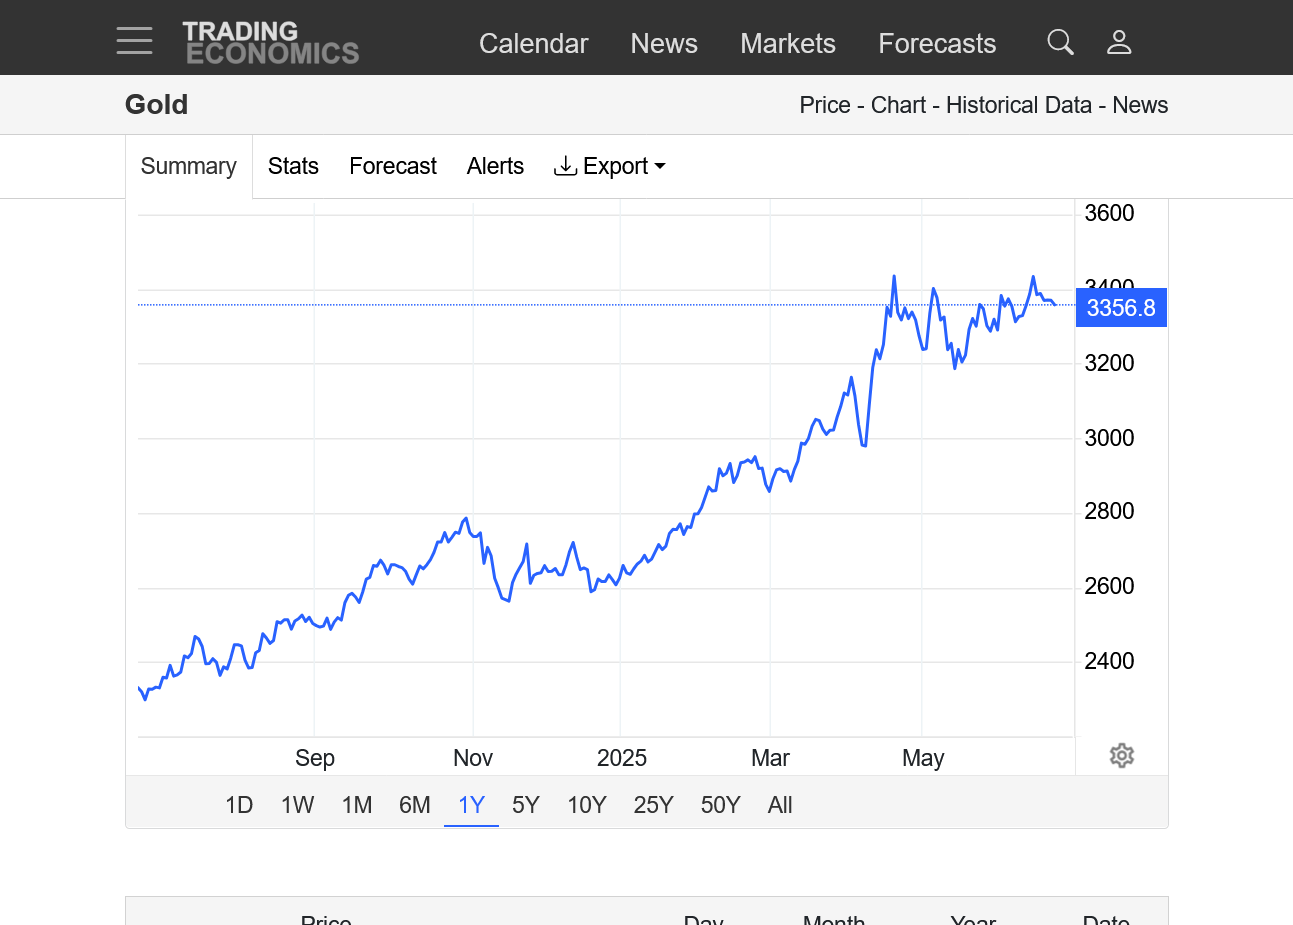
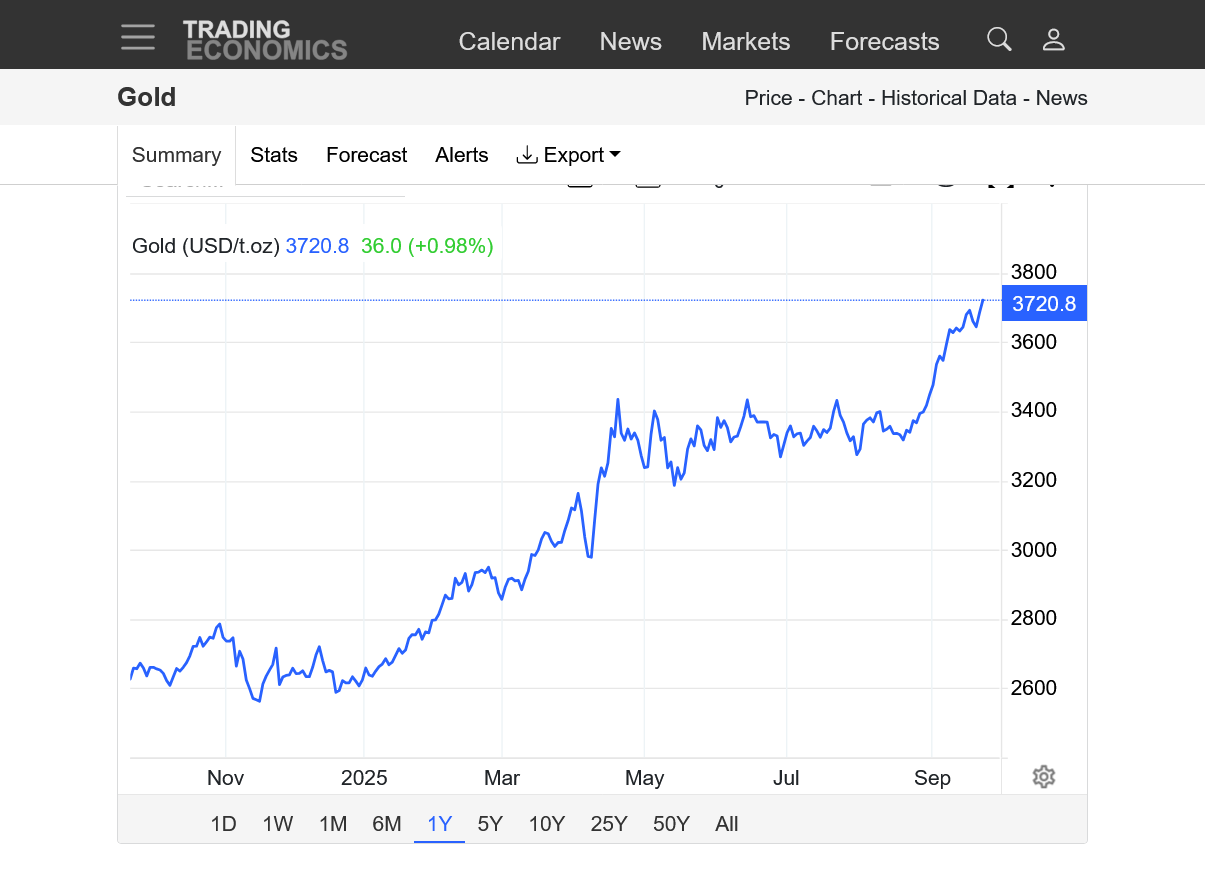
2. 1 year-This weeks reversal down and lower price the next day is just a tiny blip
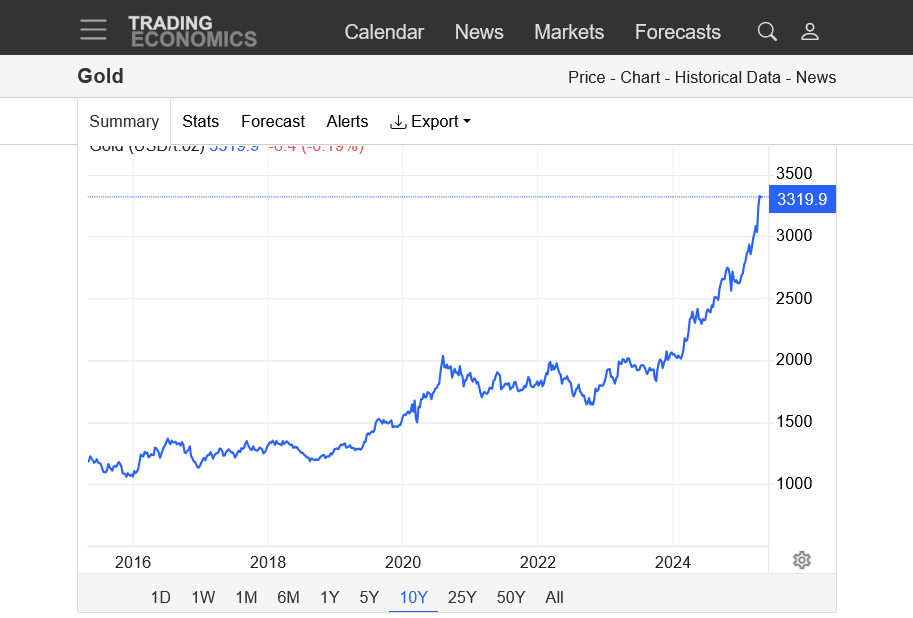
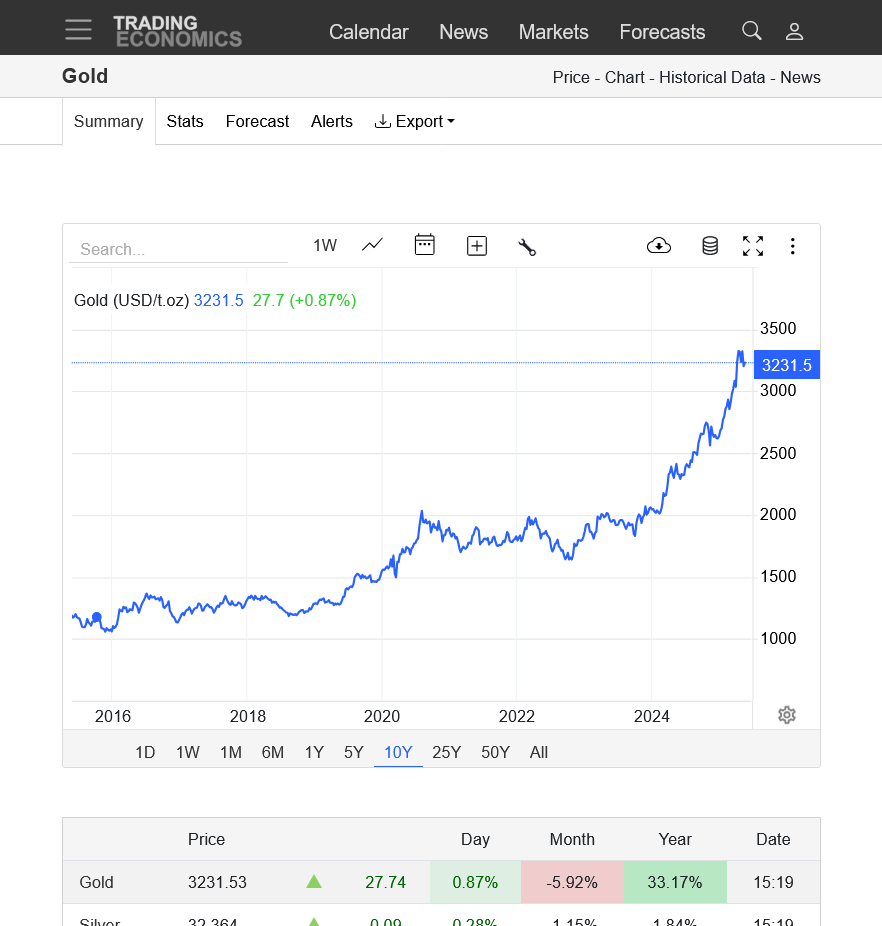
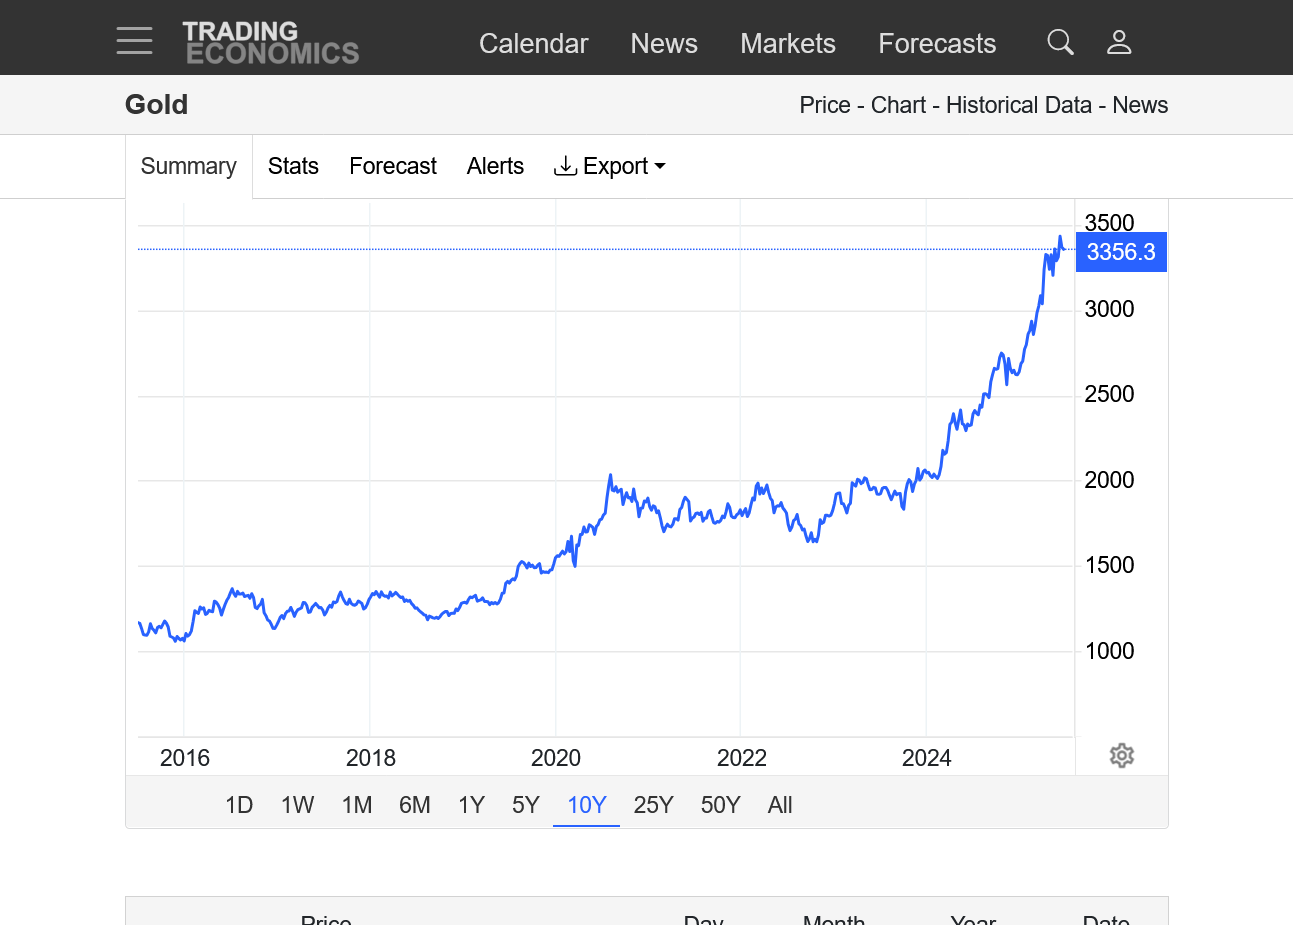
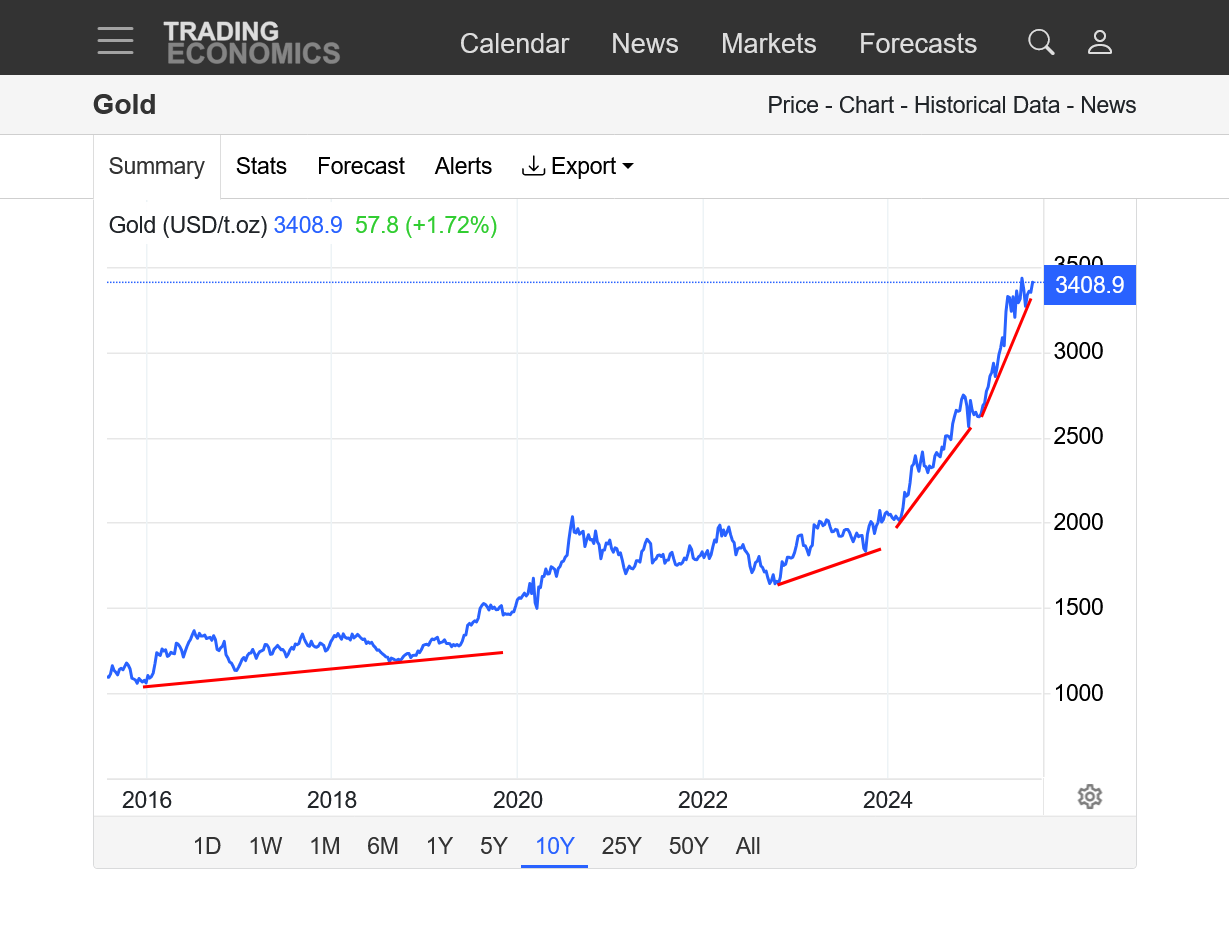
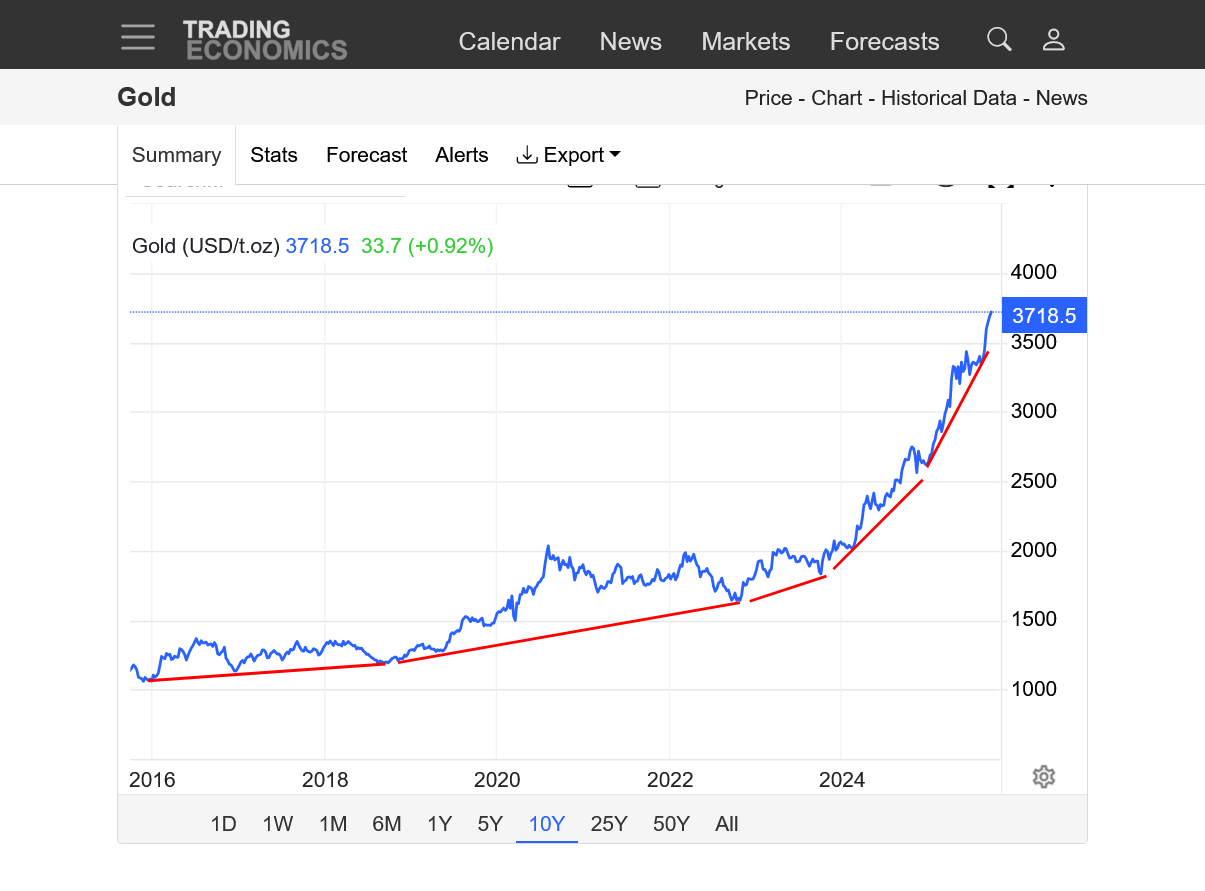
3. 10 years. This week's reversal lower day doesn't even show up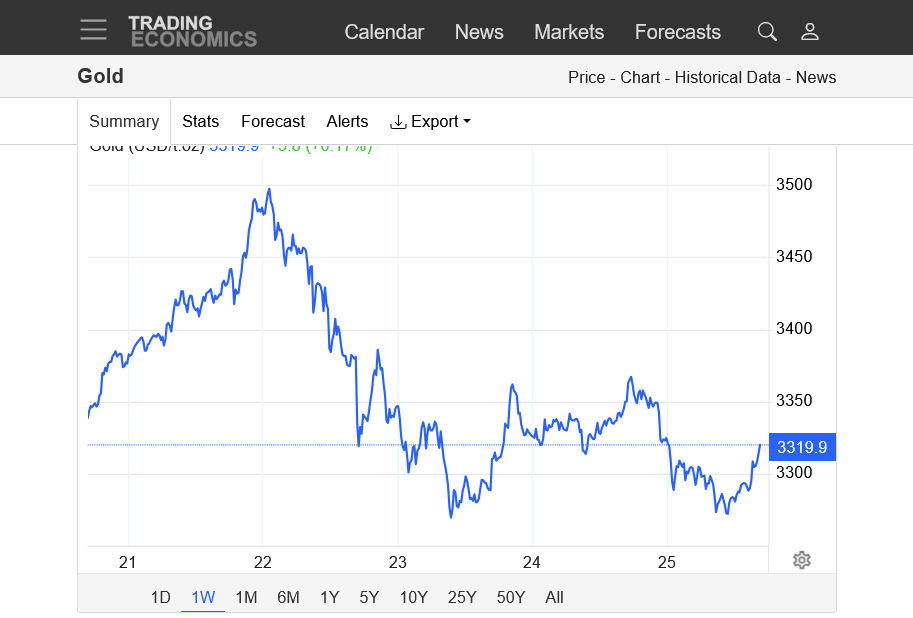
https://tradingeconomics.com/commodity/gold
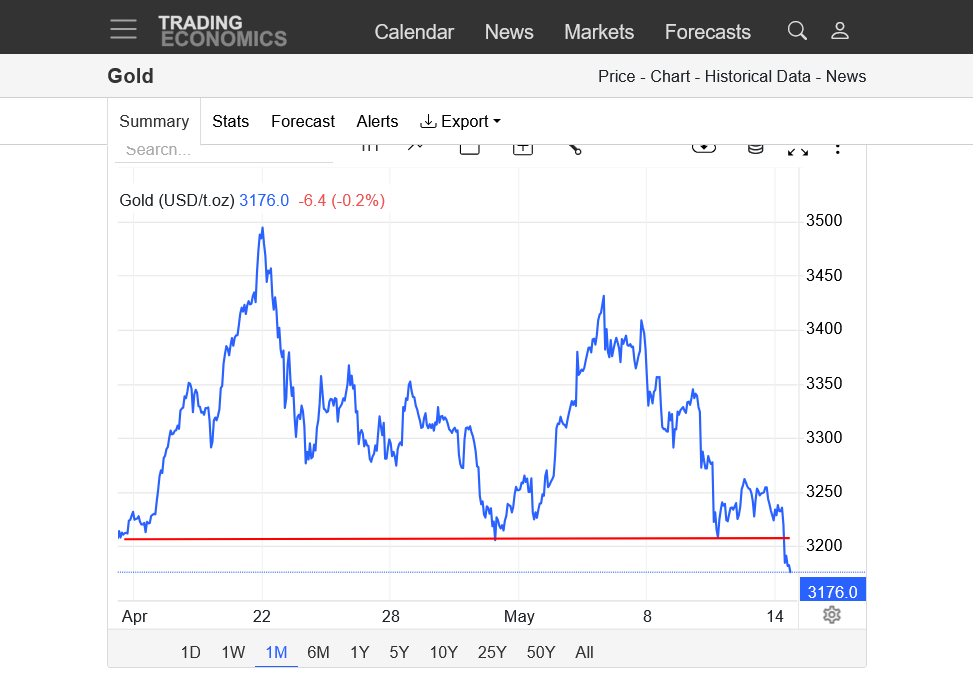
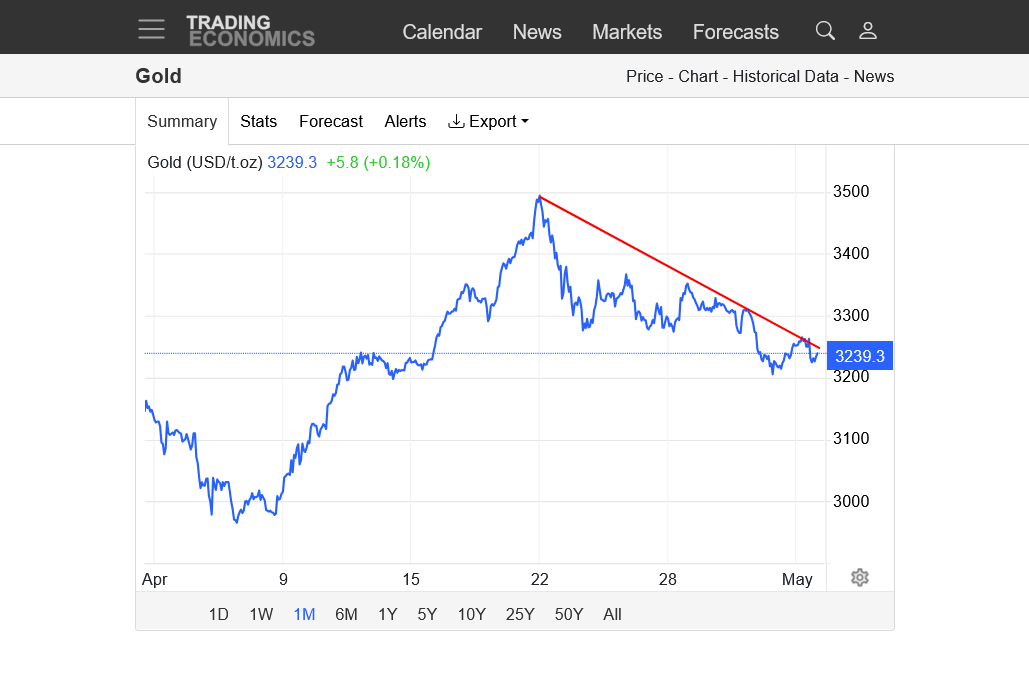
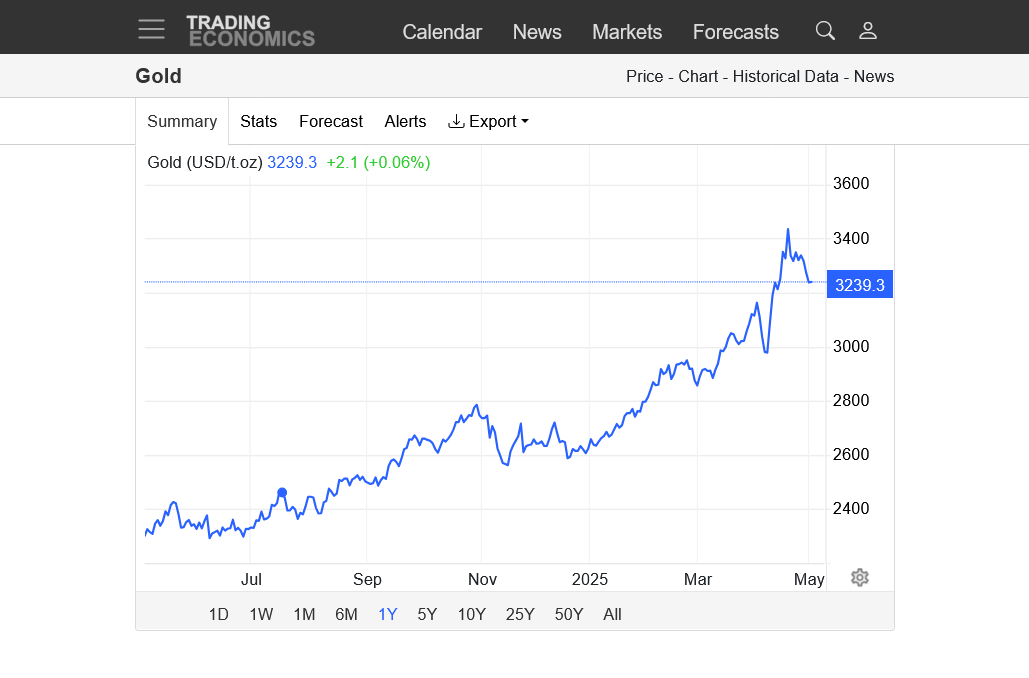
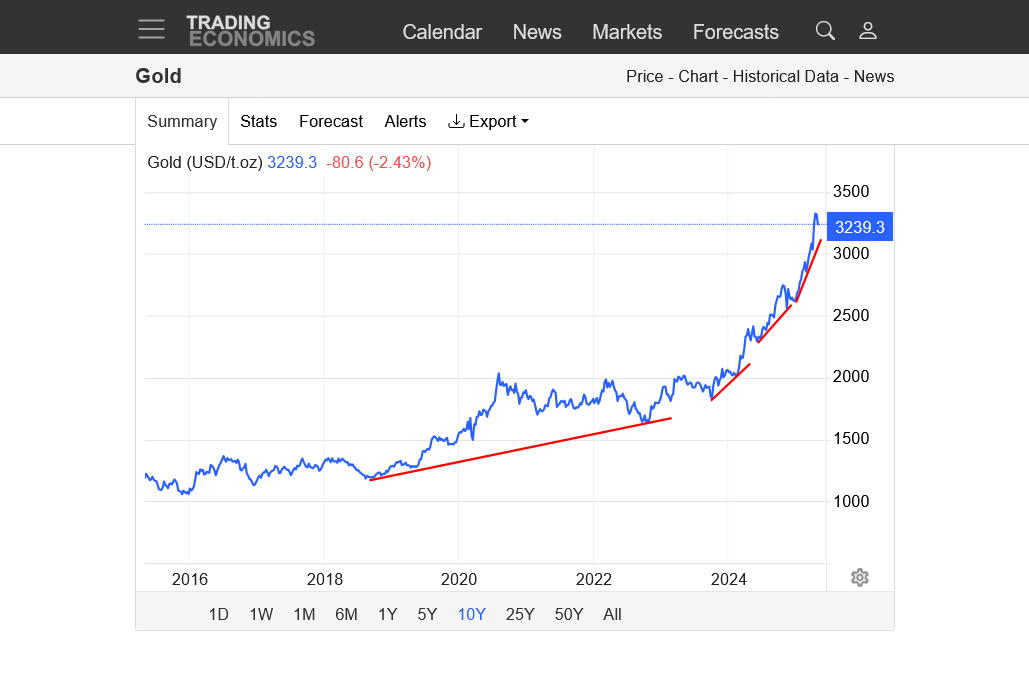
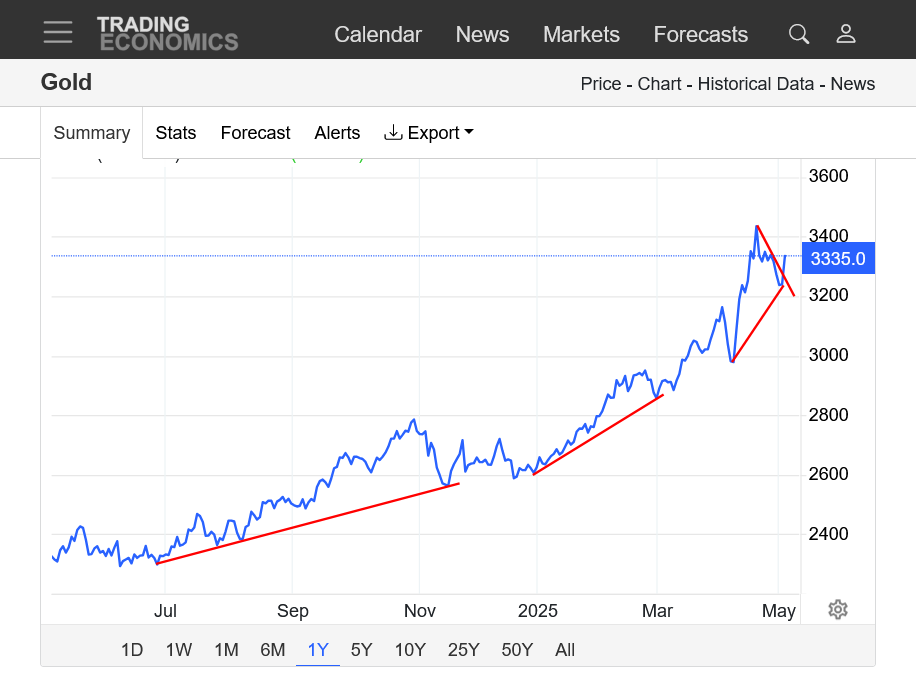
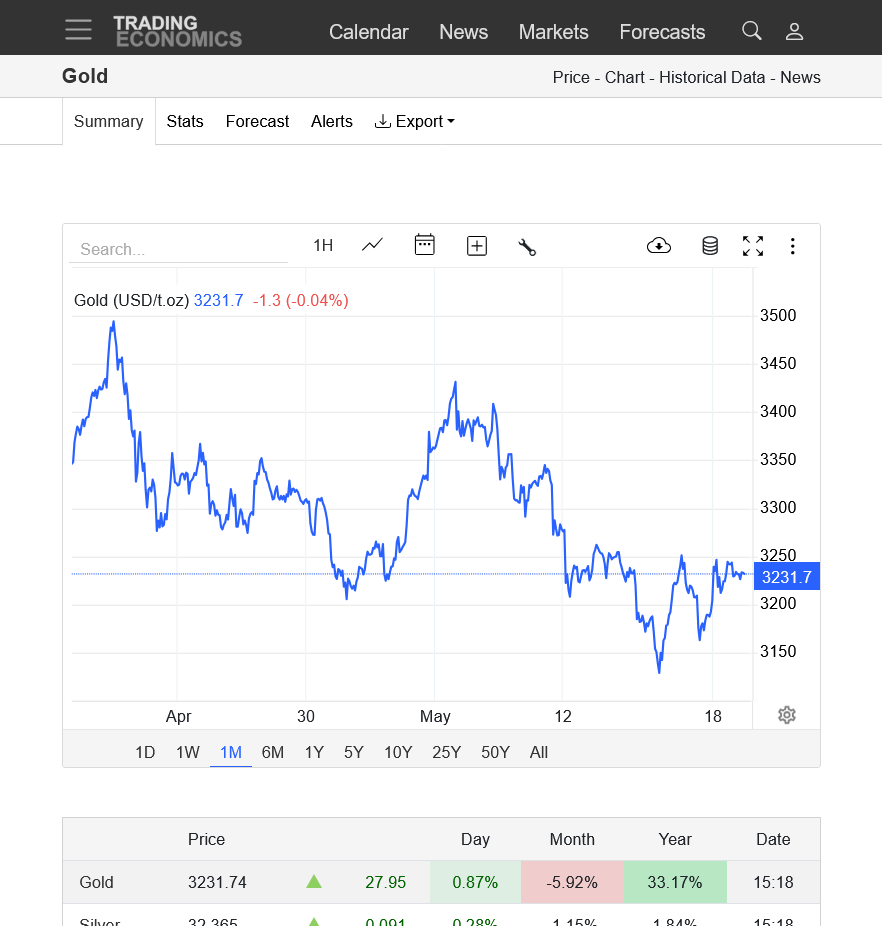
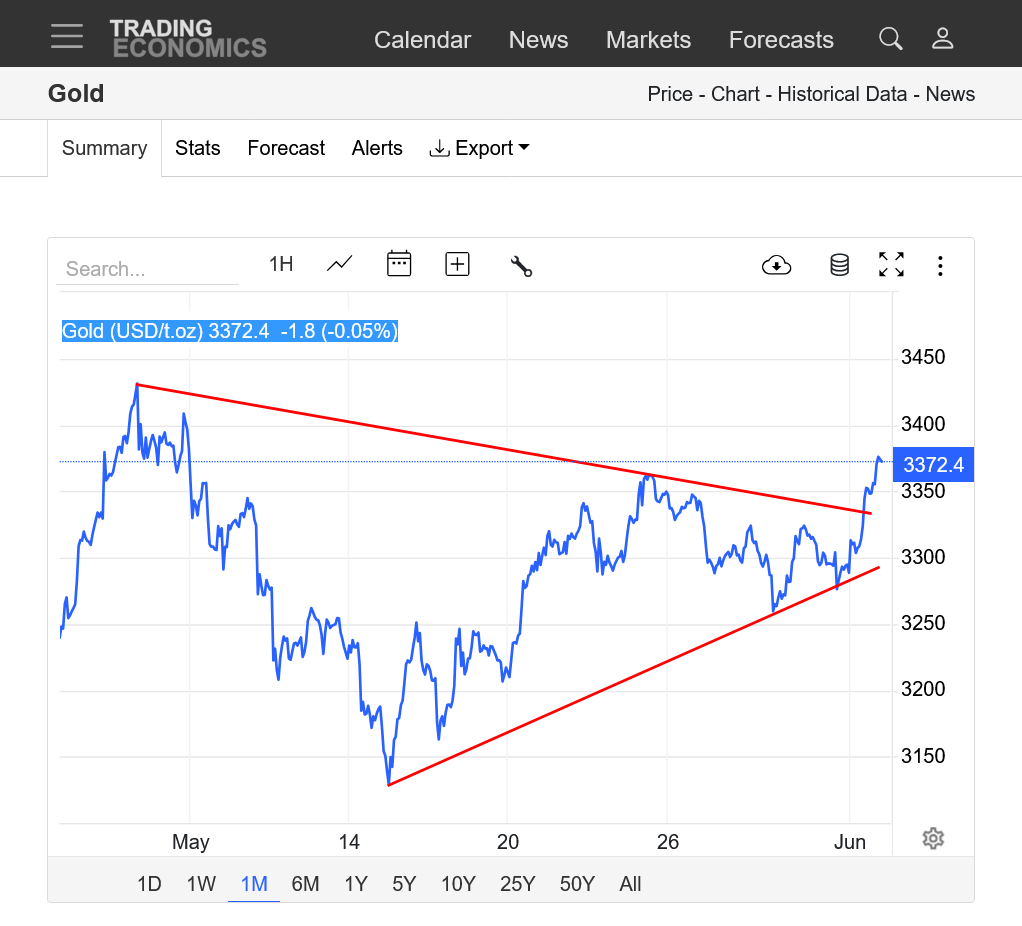
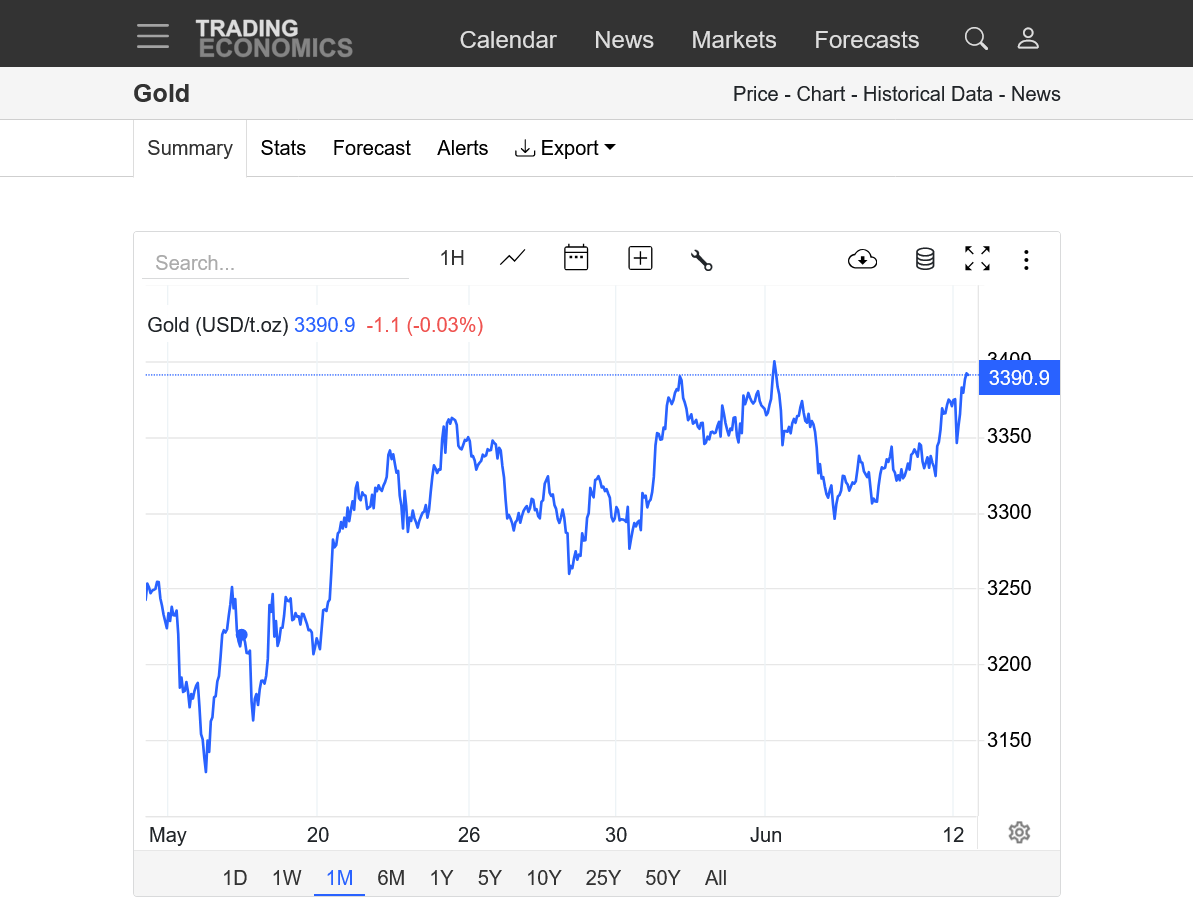
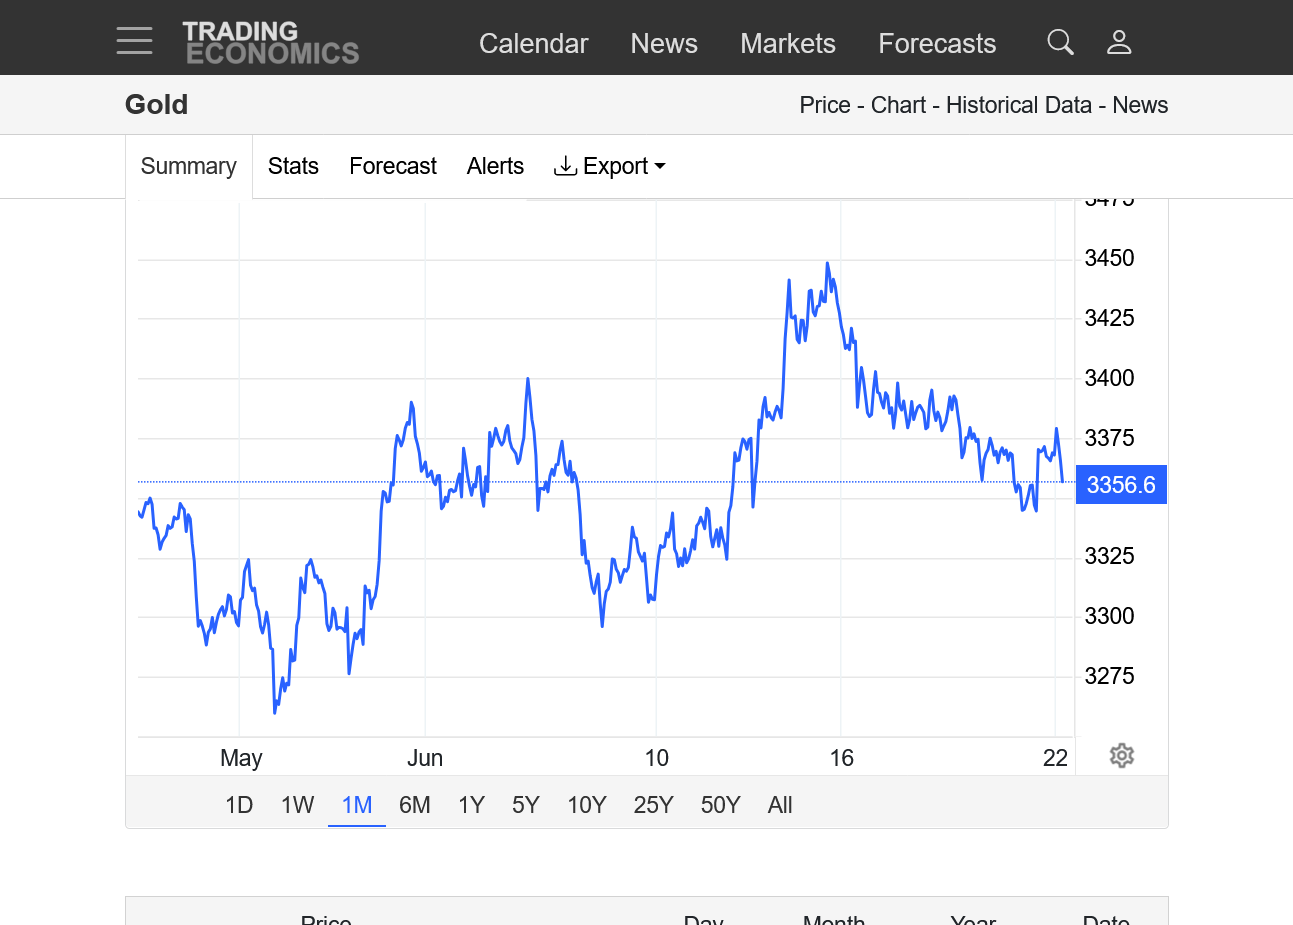
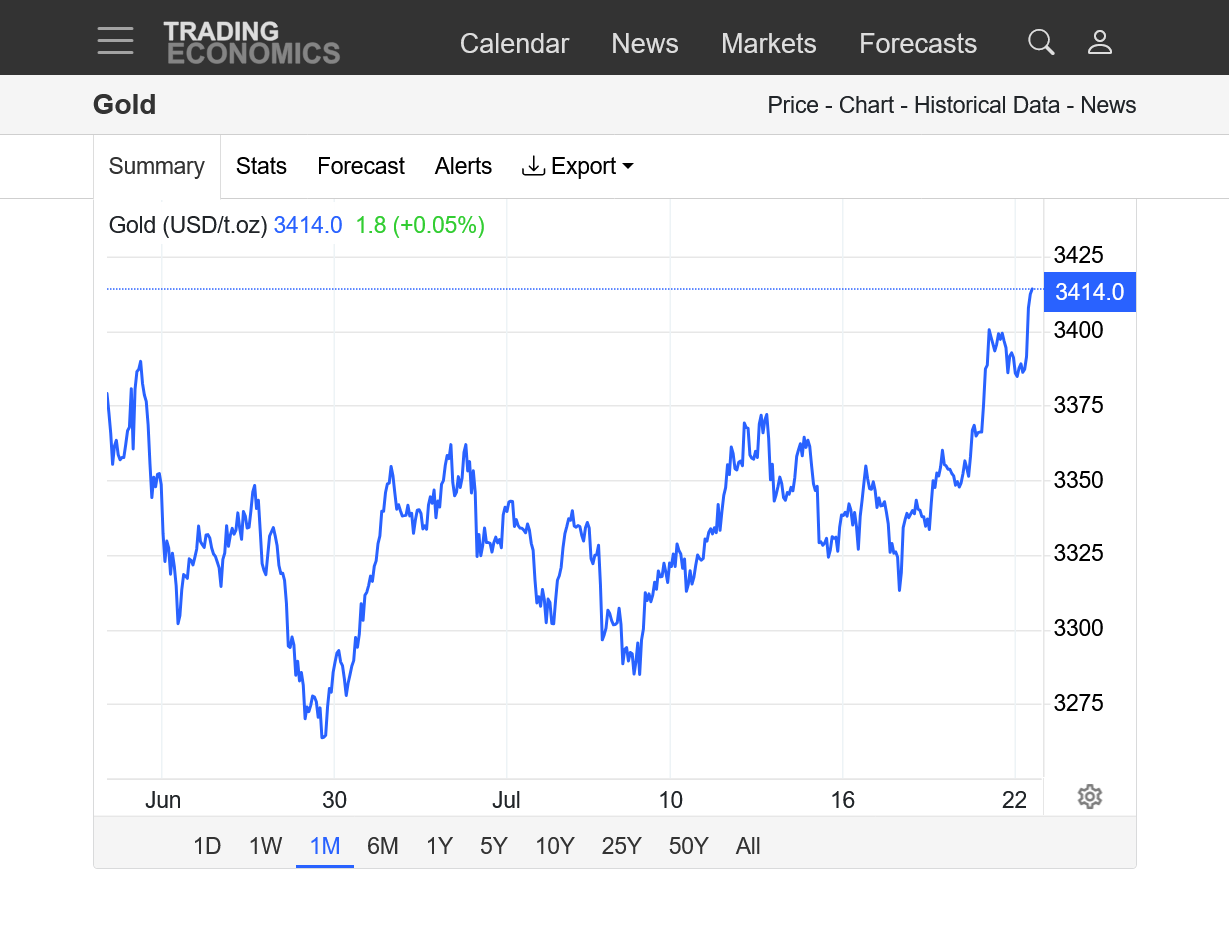
1. 1 month-Major top and reversal lower on April 22nd-new bearish downtrend channel.
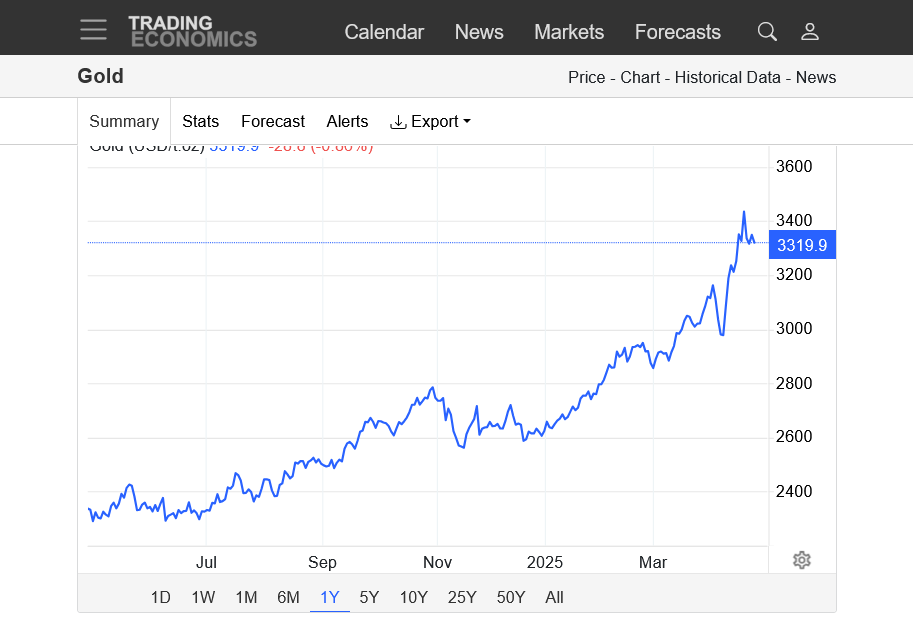
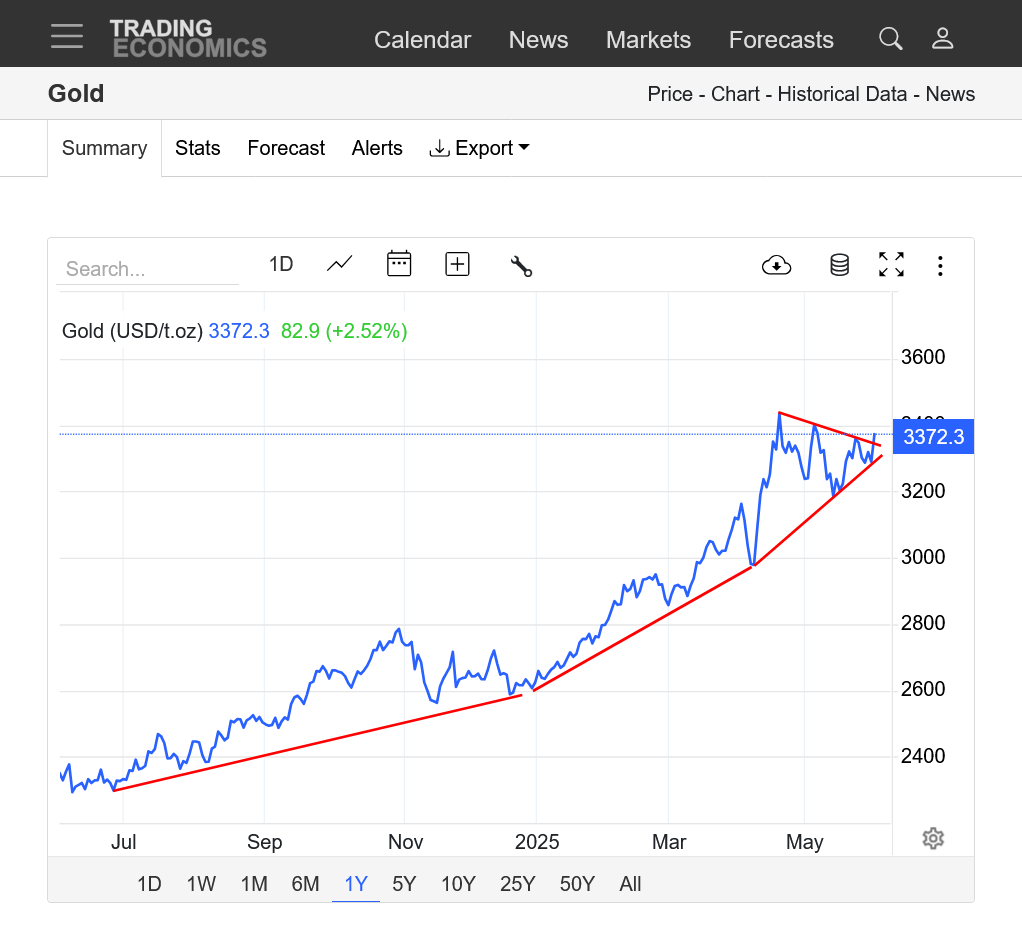
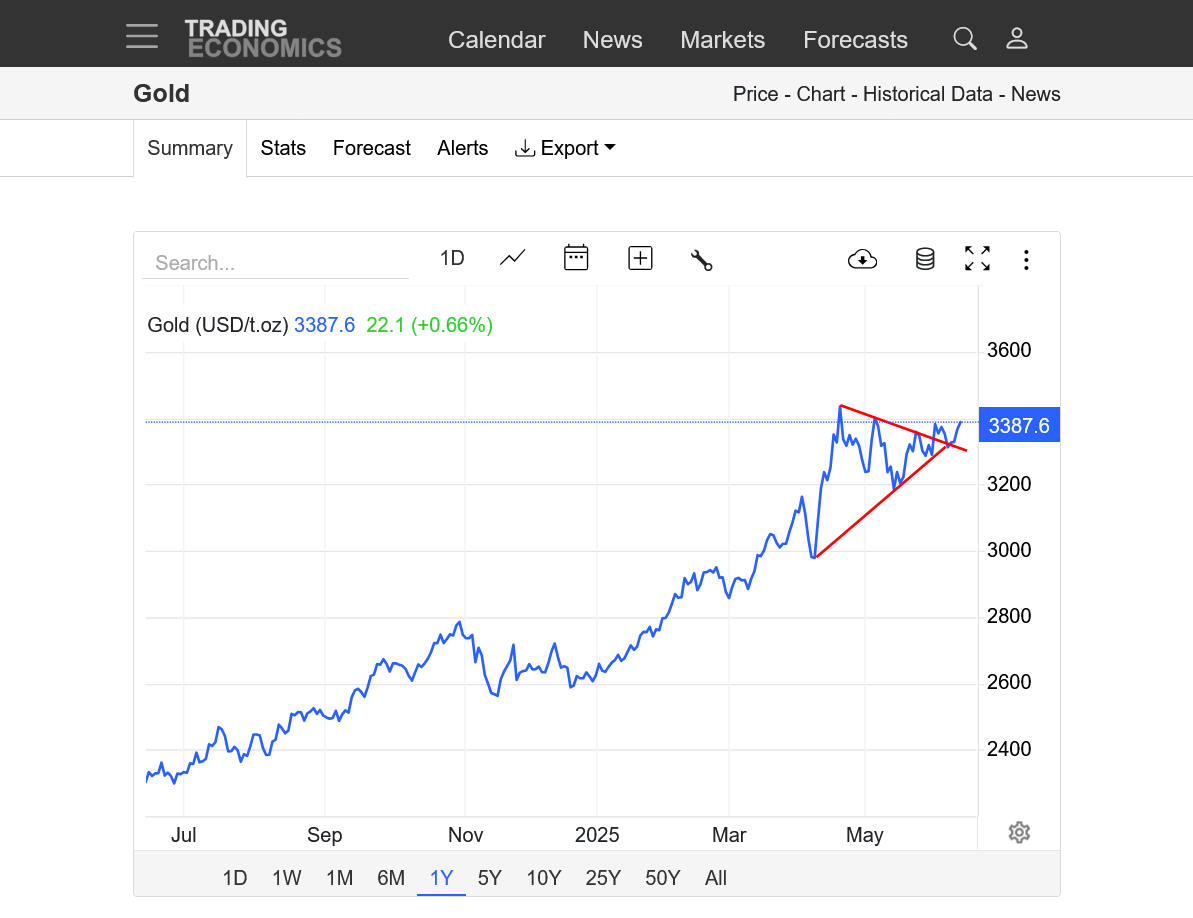
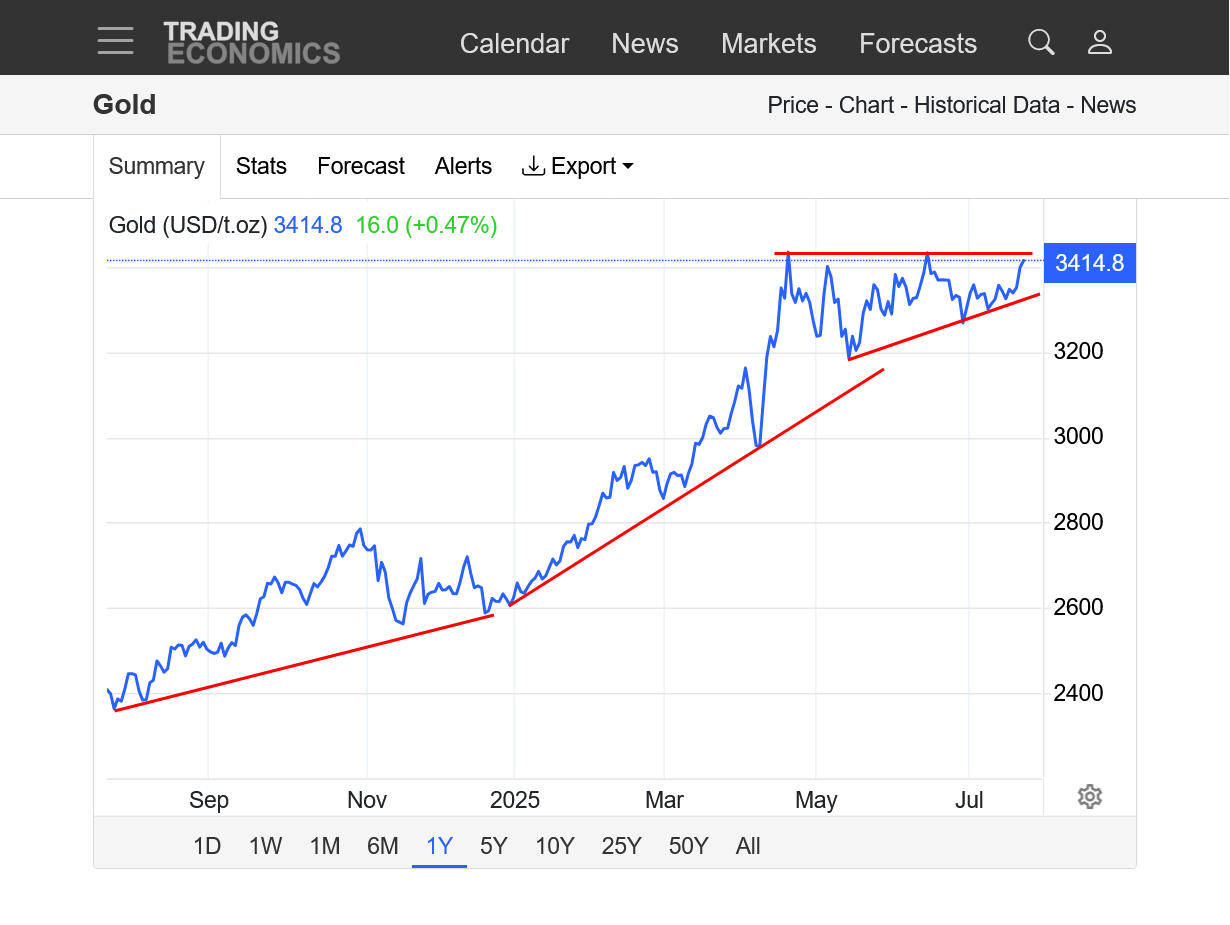
2. 1 year-uptrend still solidly intact
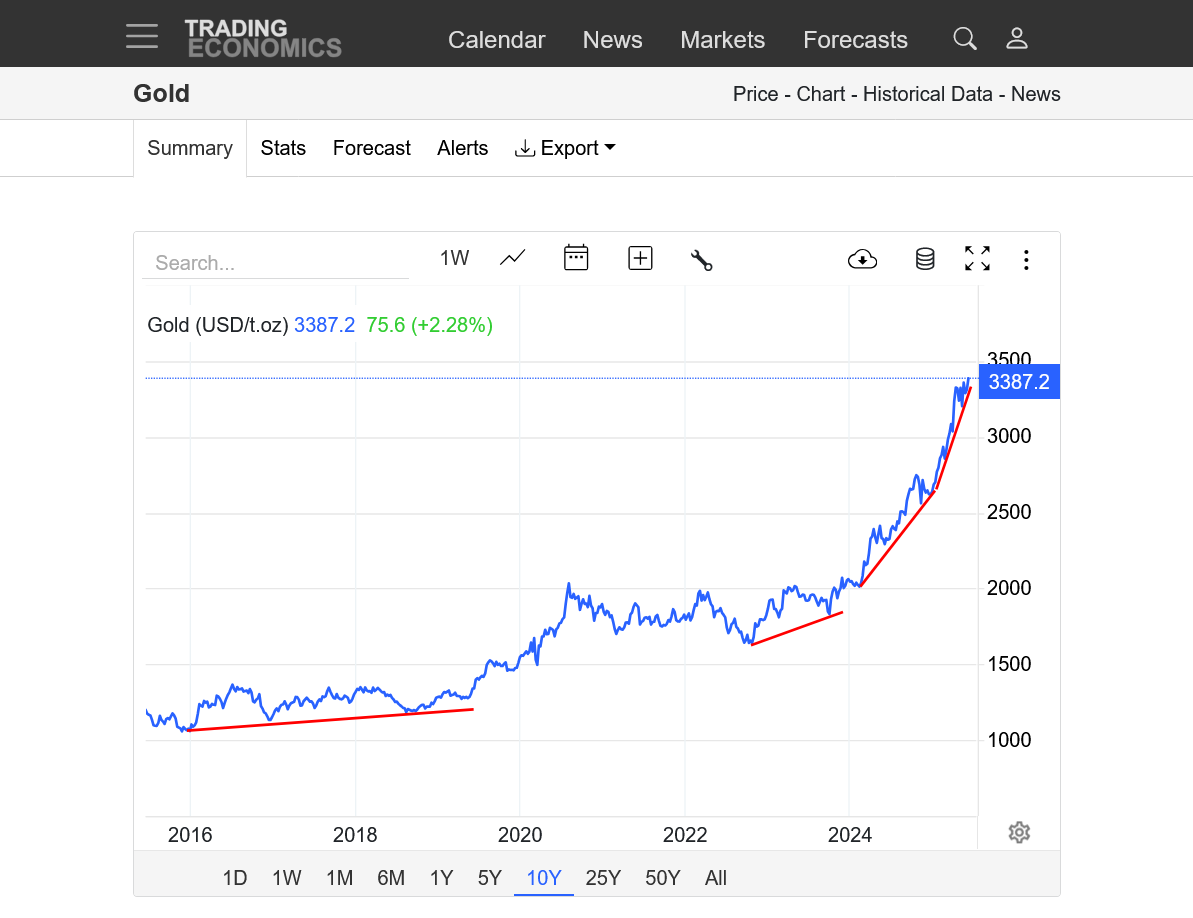
3. 10 years-steepening, increasing sloped uptrend, parabolic move still intact
So I don't have strong conviction in gold right here, but if ya made me pick to buy or sell gold, I'm buying. Short term, last Thursday gold broke out to the downside, followed by a pause day on Friday. Anyone bearish gold and taking that sell signal is sucking gas right now with Gold up $75/oz. Longer term, gold is a small market and even just a slight adjustment in the buying of gold by central banks internationally, can have a large effect on gold prices.
Trump = Chaos = gold to the moon Alice!!
Good call so far, joj!
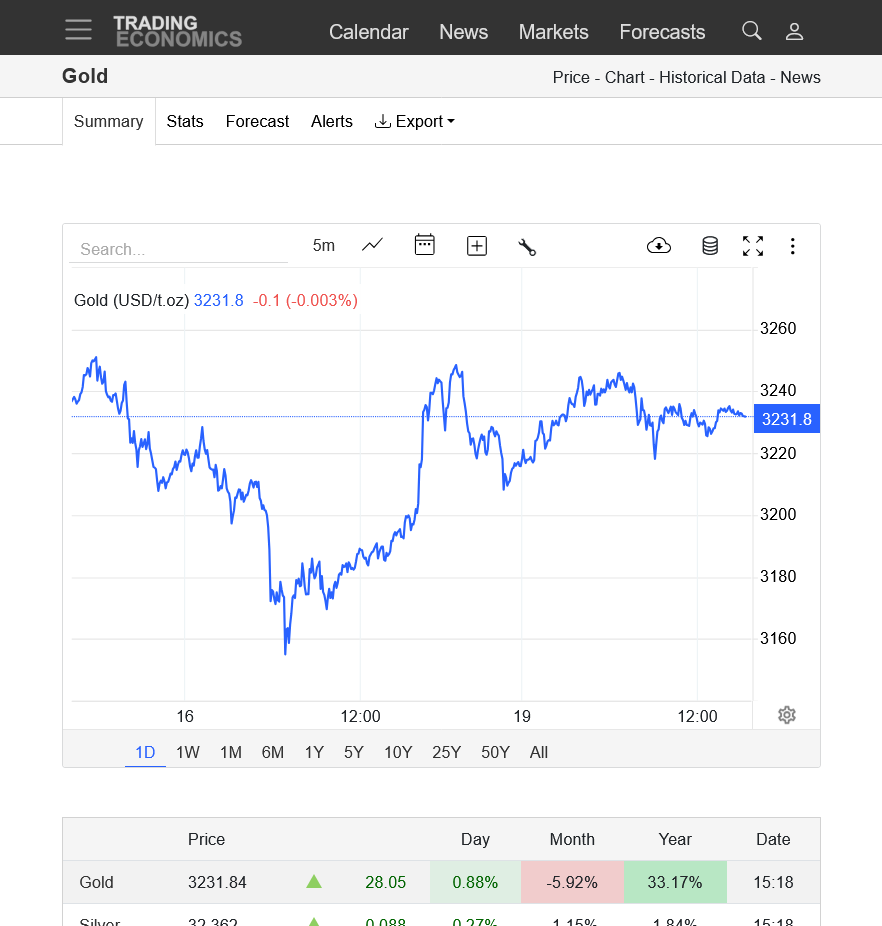
https://tradingeconomics.com/commodity/gold
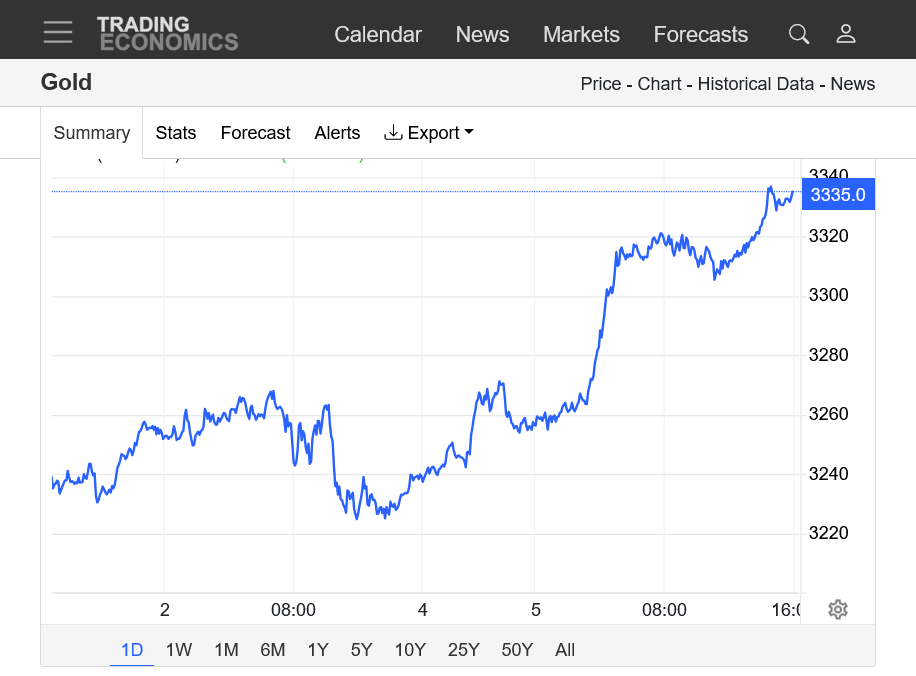
1. 1 day: HUGE move up +100
2. 1 week: Reversed all the losses from late last week. Like joj mentioned, anybody shorting then is under water now.
3. 1 year: Broke the brief/short term down/bearish channel after the reversal top in April. Parabolic move higher is still solidly intact. Steepening uptrend line has not been violated.
Great call yesterday, joj!
https://tradingeconomics.com/commodity/gold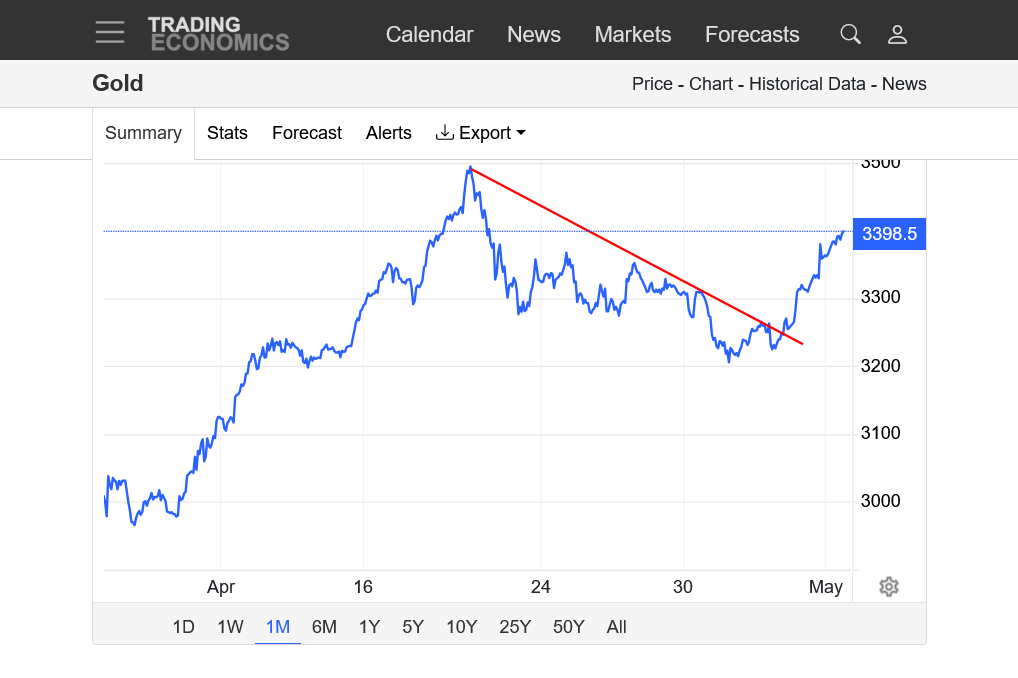
Trading post of the week 5-6-25-joj
Started by metmike - May 6, 2025, 12:14 p.m.
Gold getting hammered. Looks like your call was spot on Mike.
Thanks, joj!
Gold could be on the verge of a major downside break out here. Orrrr MAJOR short term support will hold.
https://tradingeconomics.com/commodity/gold
1. 1 month-Major double top-downside break out? At major short term support
2. 1 year-potential double top-downside break out? Bear flag/pennant? Support can still hold right here.
3. 10 years-Still just a small blip on the long term charts
Gold put in a solid day. Possible low and long term bull flag?
Or working on a bear flag after THE high earlier this year?
Either outcome is possible from here.
https://tradingeconomics.com/commodity/gold
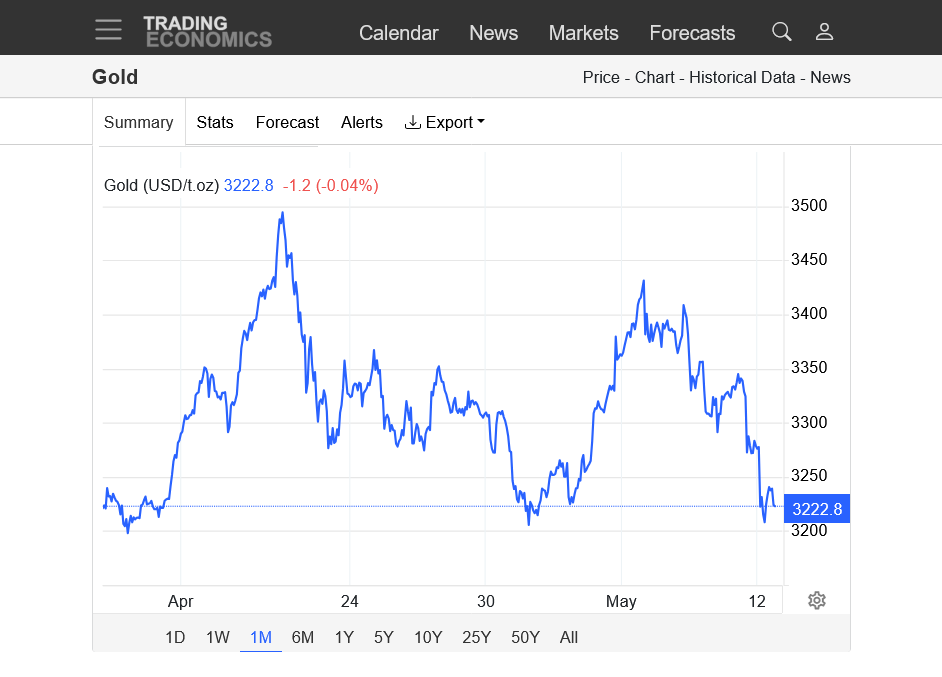
1. 1 day-spike low, possible short term bottom?
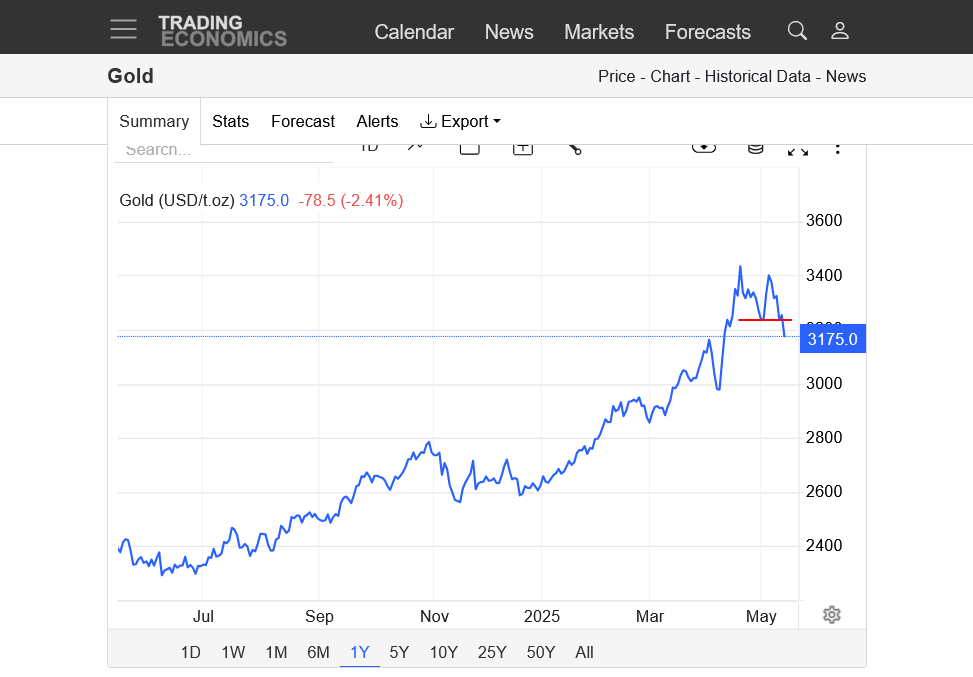
2. 1 month-solid down trend.
3. 1 year-strong longer term uptrend not violated. However, we failed to test the previous record highs on the last big rally. But this could just be a big BULL flag OR it could be a smaller BEAR flag formation after the highs with a down channel/bearish signature at the moment.
4. 10 years-parabolic/exponential move up still intact
5. Technical price charts, like this one often have 2 completely opposite possible projections that can't be known until we break 1 way or the other. Factors that are currently unknown will likely determine which way that we go.
I used to believe that Trump would fire Powell. Unlawful yes, but that’s how he rolls. Now , I think he leaves Powell in there as both a punching bag for not lowering interest rates and as someone to blame if the economy goes south.
I believe that when Powell’s term ends in 2026, Trump will replace him with a stooge loyalist who will lower interest rates and devalue the US$. (More vodka in the punch bowl)
Gold may be overvalued but I think it goes higher eventually.
You are probably right, joj.
Well before that, we will be hit with increasingly negative impacts from Trump's fairy tale tariff schemes.
The reckoning is coming up. Either Trump backs off more and faces reality or negative economic hardships are imposed for both sides, especially US consumers who will pay higher prices.....with much less in benefits(the government capturing the tariffs)
Here we go again?
As long as Trump is president there will be constant chaos, really dumb, often impulsive and sometimes corrupt behavior and decisions. That's good for gold prices.
https://tradingeconomics.com/commodity/gold
1. 1 month. Gold breaking out of a bull flag??
2. 1 year. Gold breaking out of a bull flag?
3. 10 years. Still a parabolic move higher with a steeping slope of the uptrend.
Gold poised to take out the old highs?
https://tradingeconomics.com/commodity/gold
1. 1 month
2. 1 year-breaking out from bull flag.
3. 10 years. Parabolic/exponential move higher.
Are the highs in? Gold opened higher tonight but couldn't hold the gains on the bullish Iran news
https://tradingeconomics.com/commodity/gold
1. 1 week-Downtrend. Higher open tonight but now lower
2. 1 month-Highs on June 16 session(open June 15 evening) just below 3450
3. 1 year-Major topping formation or an ascending bullish triangle?
4. 10 years-Parabolic/exponential uptrend continues (steepening curve)
Gold is back higher for the session and the bulls are anything but dead.
Gold acts like its headed to new highs. As long as Trump is president, there will be chaos that drives speculation for buying gold. His tariffs are very inflationary too.The trend remains strongly up.
https://tradingeconomics.com/commodity/gold
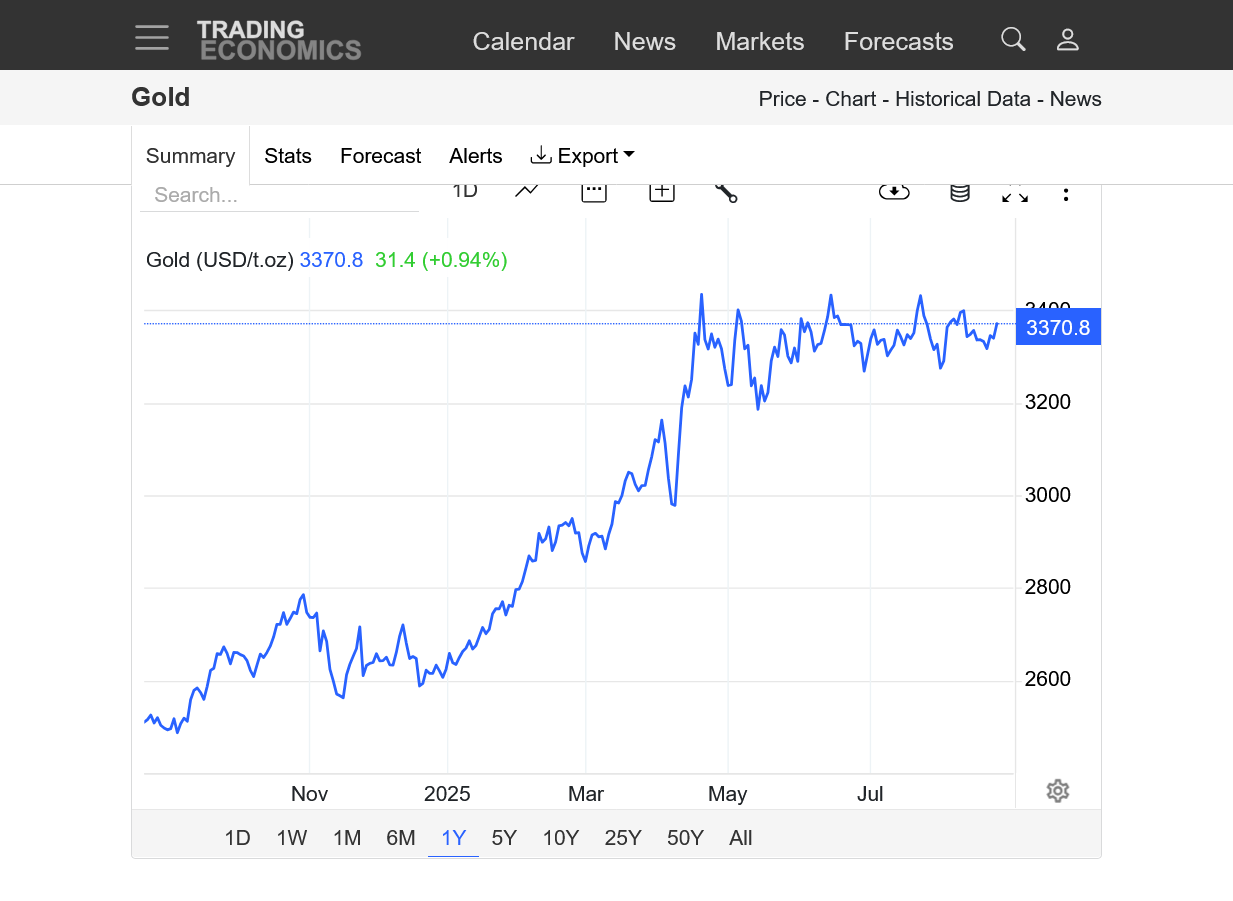
1. 10 years. Parabolic move up(exponential) with a steepening slope to the uptrend channel.
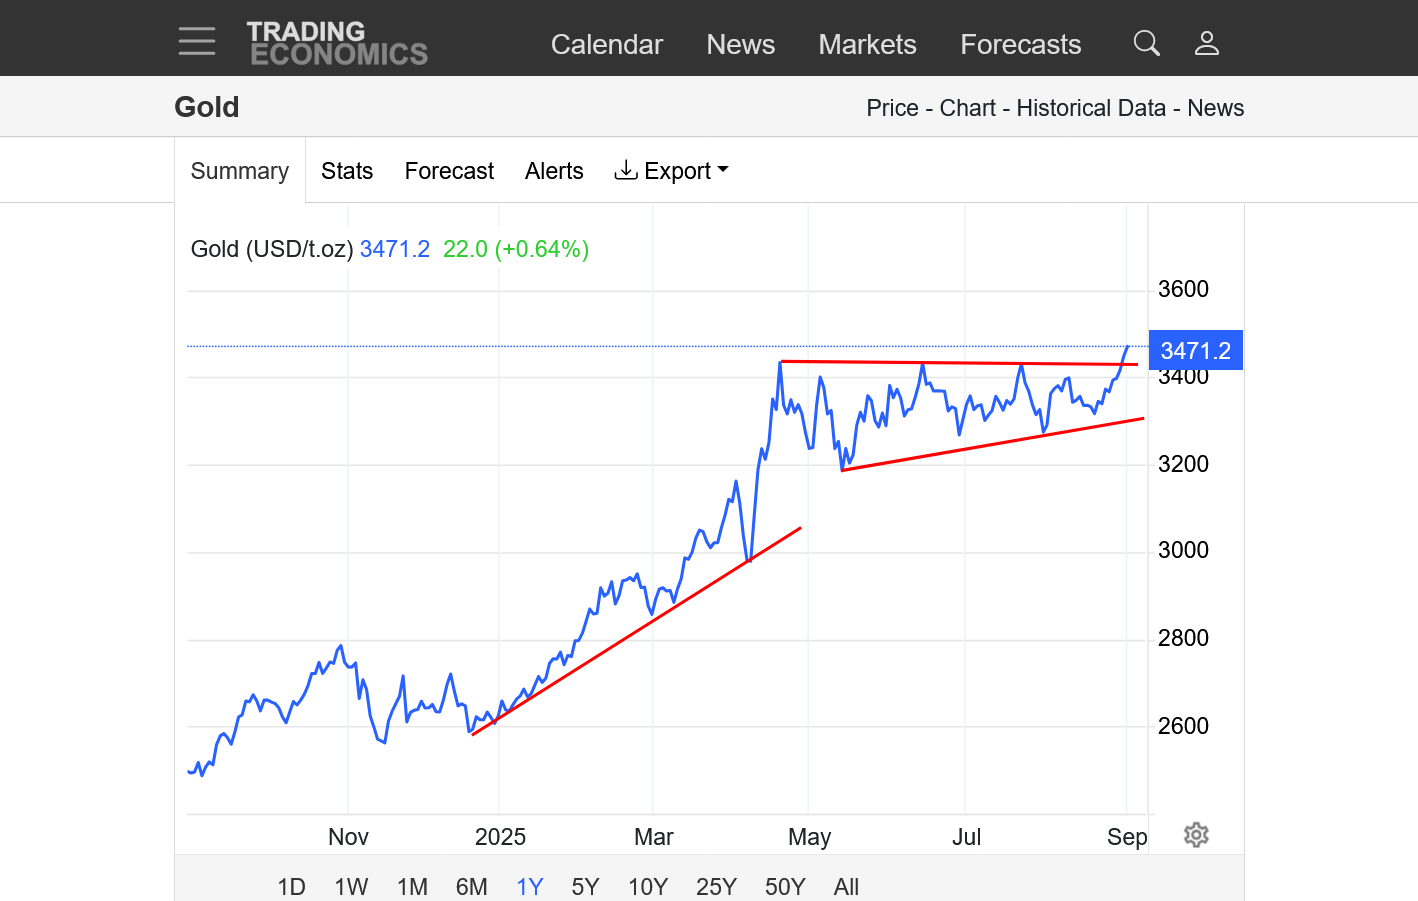
2. 1 year. About to break out to new highs? Bumping in to some strong resistance at previous highs. Ascending triangle(flag) formation.
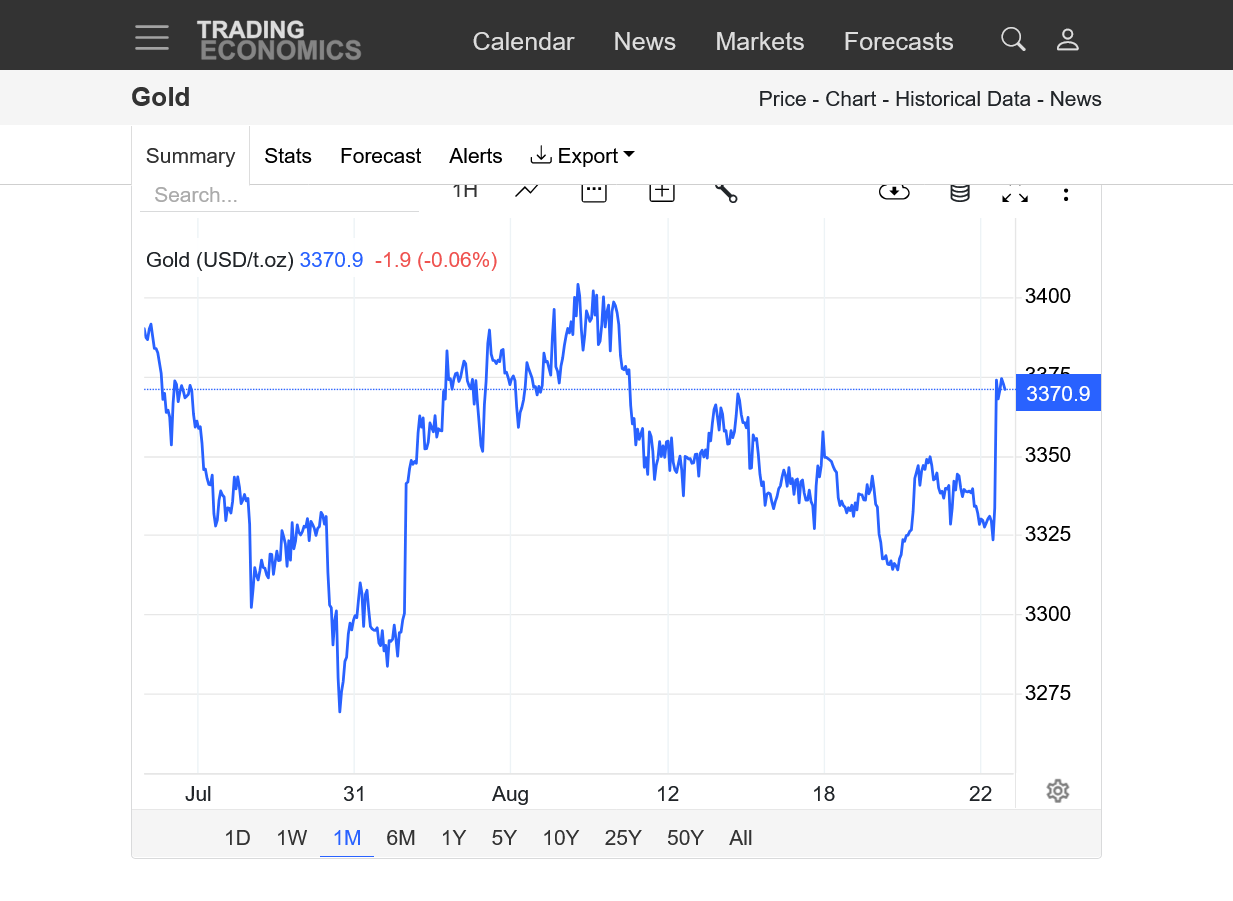
3. 1 month-new monthly highs
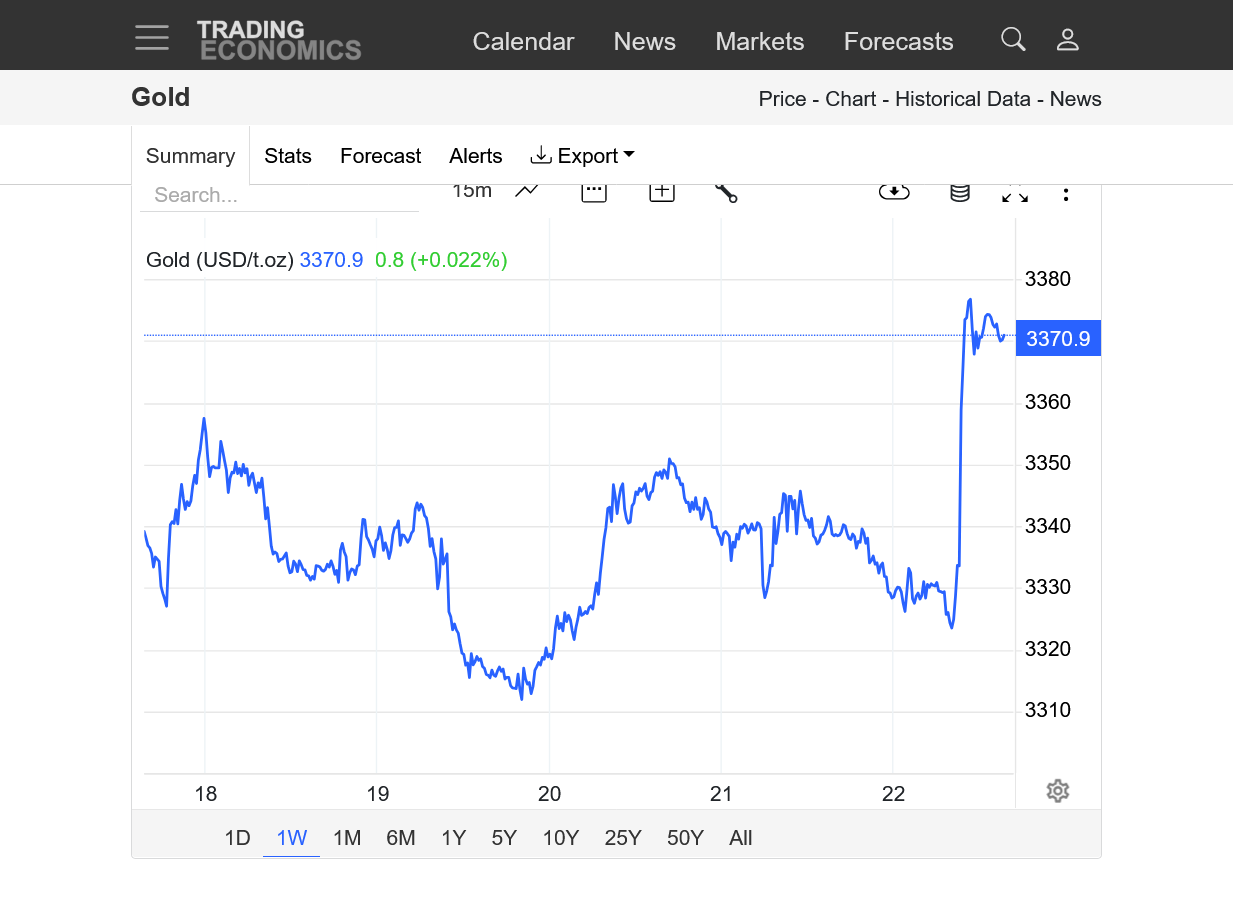
4. 1 week-STRONG move up
Triple top or still an ascending triangle???? An ascending triangle is a continuation up pattern. Triple top is a reversal down pattern.
Only the future will tell us. 1 year below.
https://tradingeconomics.com/commodity/gold
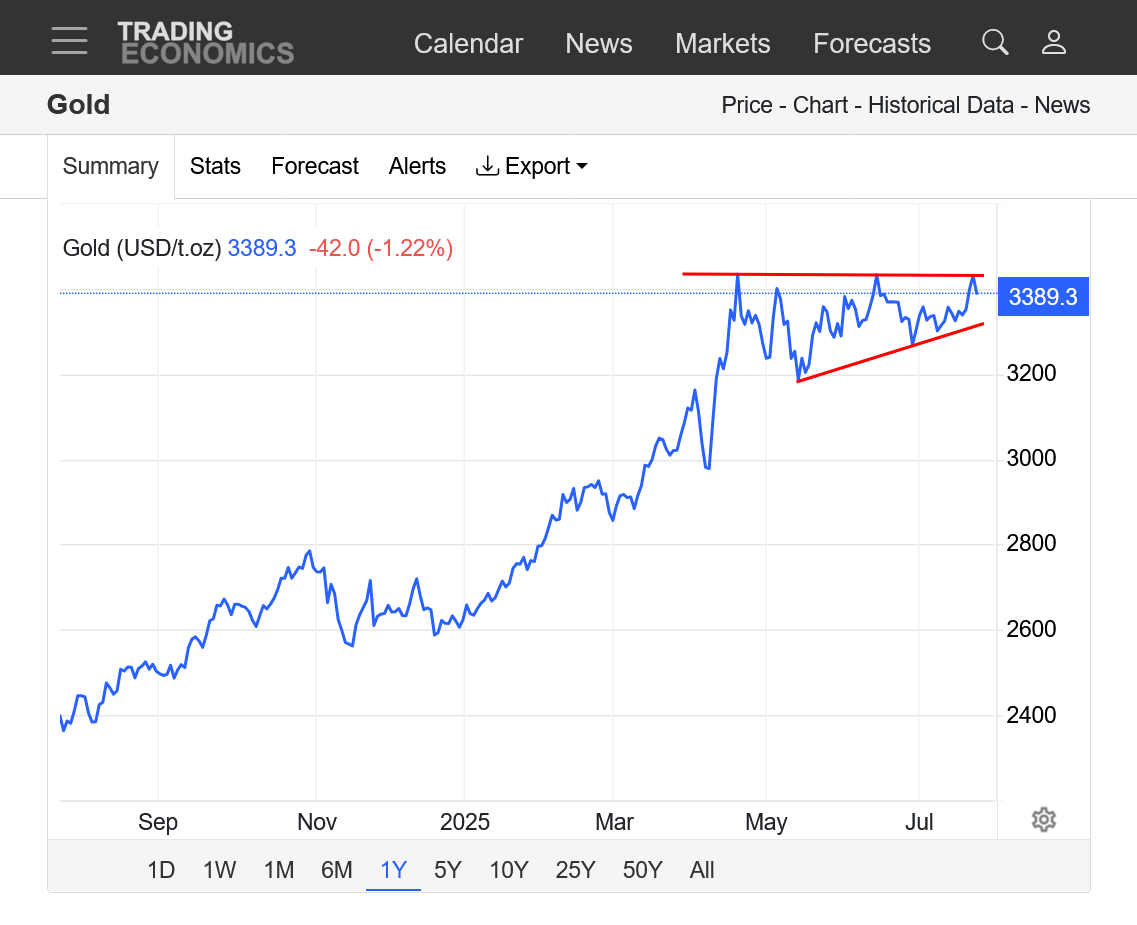
Gold is COILING just below record highs, with the threat of an upside break out to new highs.
Odds favor an upside breakout to new life of contracts highs. There's a chance of a triple top but considering the higher lows leading up to this the past year(the trend is your friend-buyers stepping in to buy at higher and higher prices with each pullback) odds favor the upside.
News may determine which way we break. Probably there are tons of stops, especially buy stops above the all time highs.
Gold is,spiking higher on positive interest rate cut news from Powell that suggests stimulating the economy which is more inflationary. Still not high enough to break out to the upside with fresh all time highs.
2:30pm CDT:
1. 1 week-spike up from Fed news of lowering interest rates next month
2. 1 month-still below record highs
3. 1 year-still in the tightening range(coil) and symmetical triangle type formation with lower highs and higher lows.
4. 10 years-Extreme uptrend with steepening, parabolic/exponentially increasing slope. Chart formation is a potential bull flag that gets confirmed with a close to new all time highs.
https://tradingeconomics.com/commodity/gold
Gold is breaking out to the upside, above the bull flag, ascending triangle/wedge pattern. New all time highs!!
https://tradingeconomics.com/commodity/gold
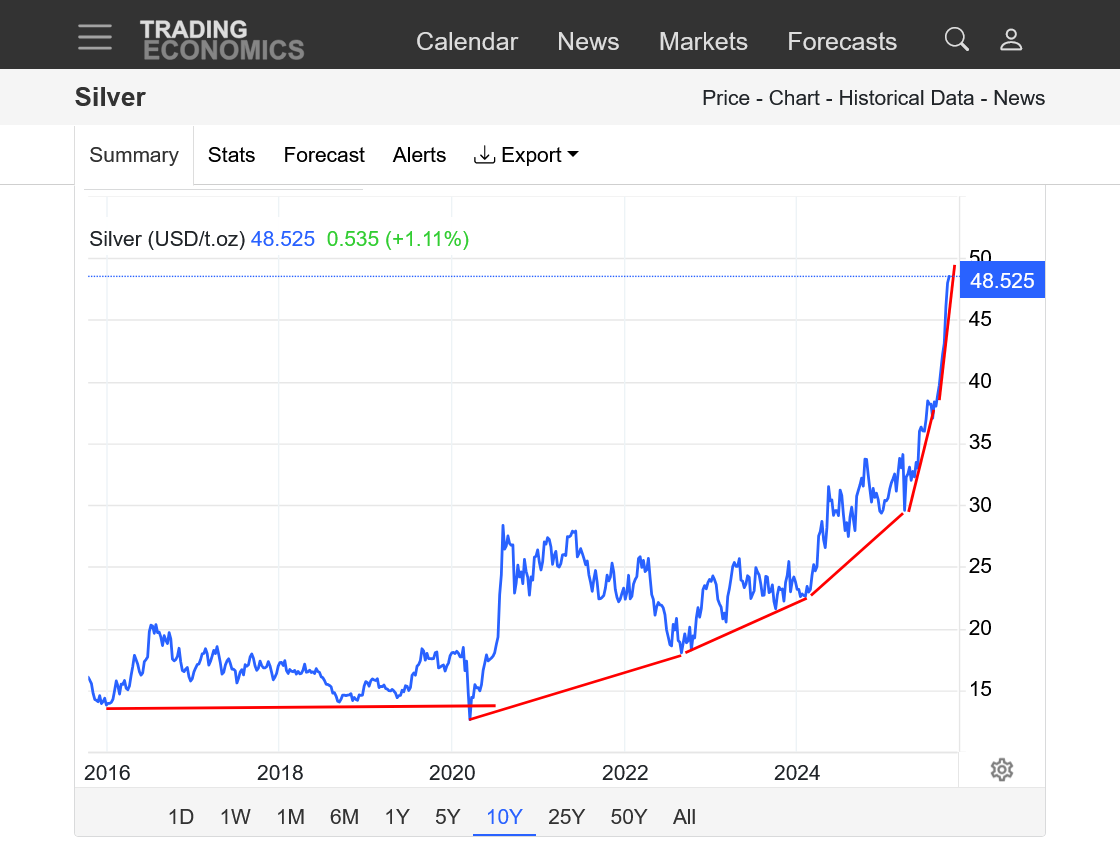
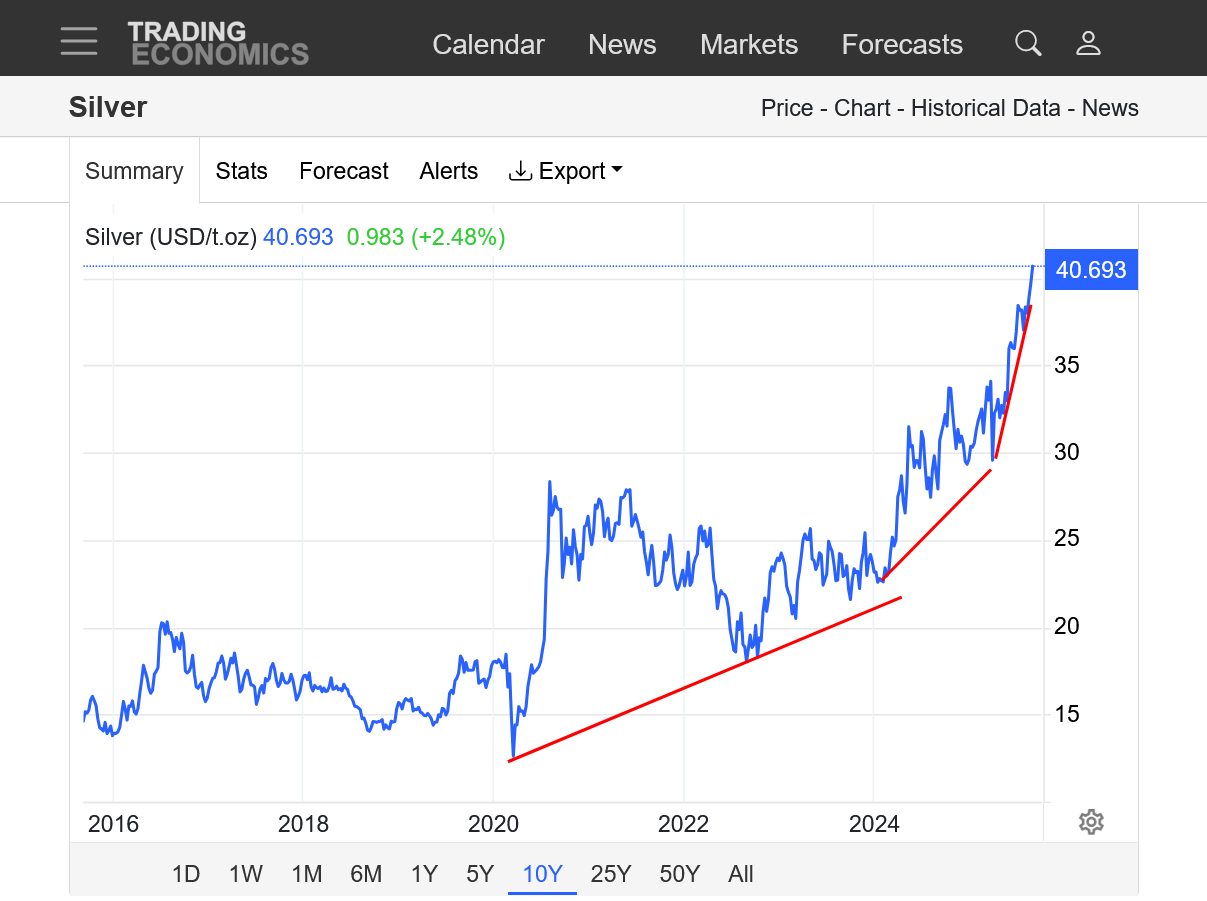
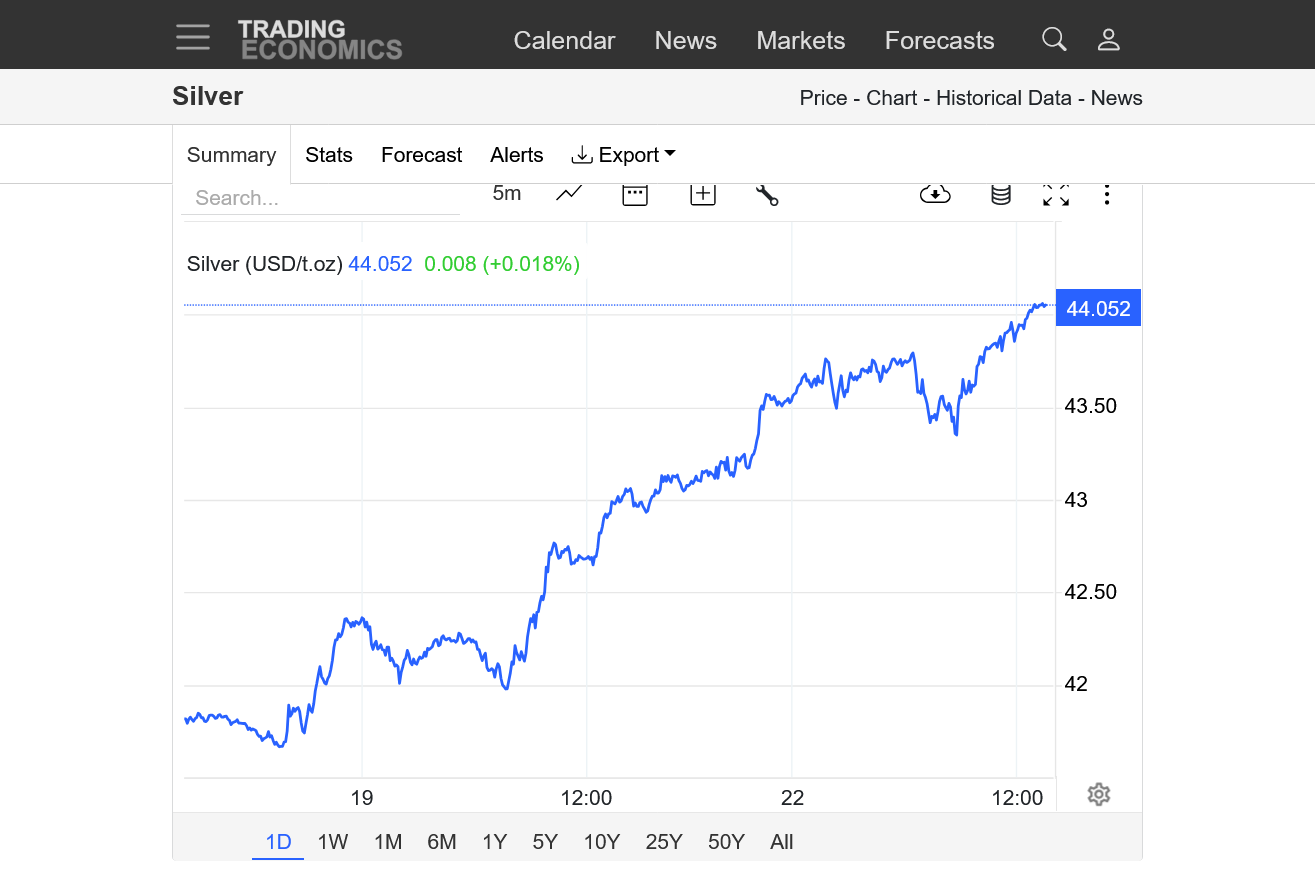
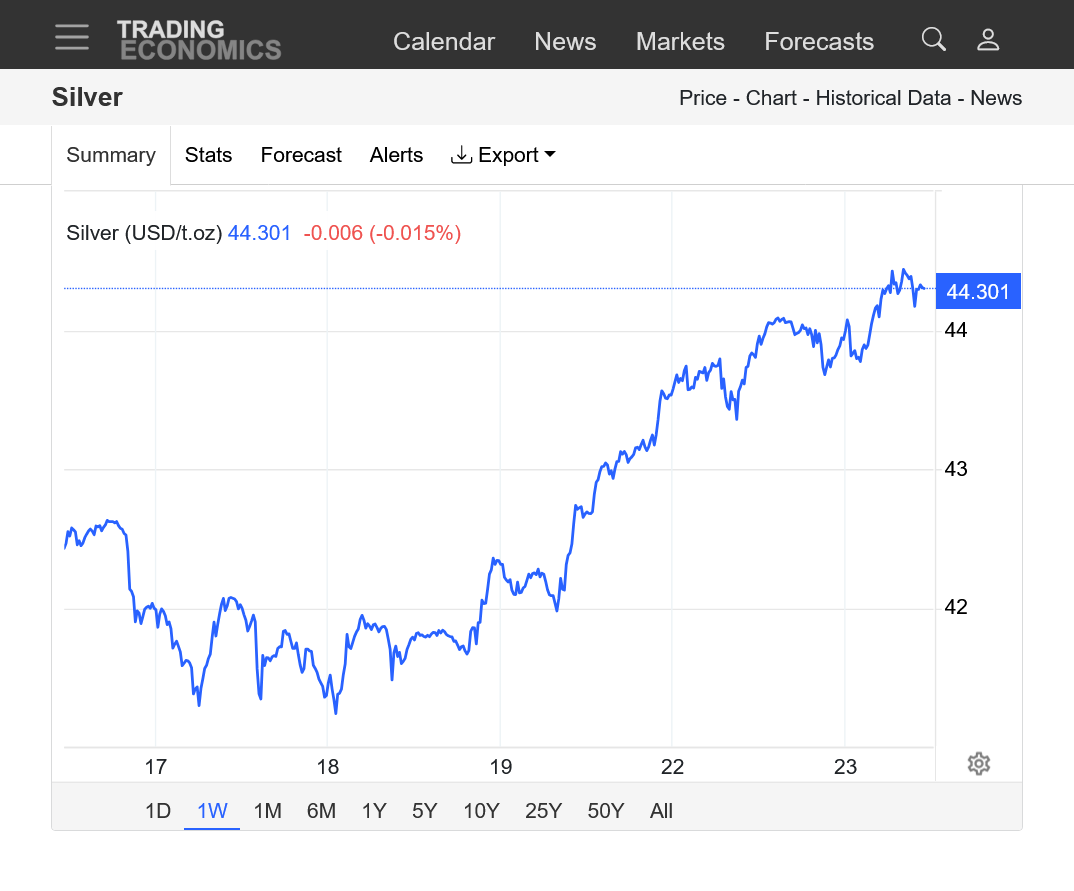
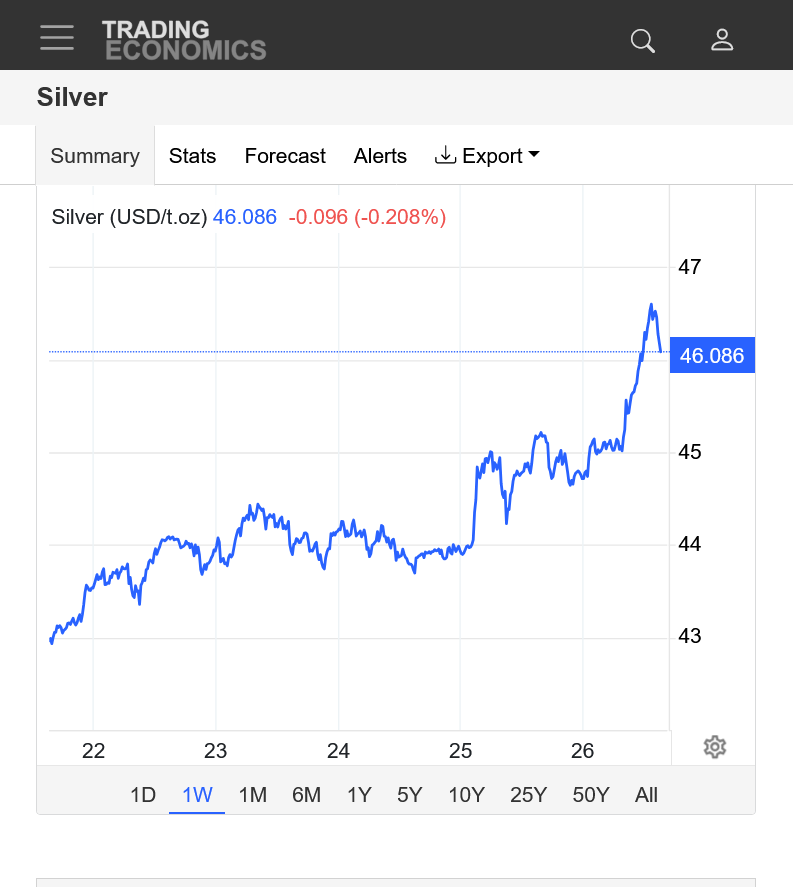
Silver has been outperforming gold recently. Highest price since 2011!
This is a 10 year chart. This source won't let us go back more than 10 years for free.
https://tradingeconomics.com/commodity/silver
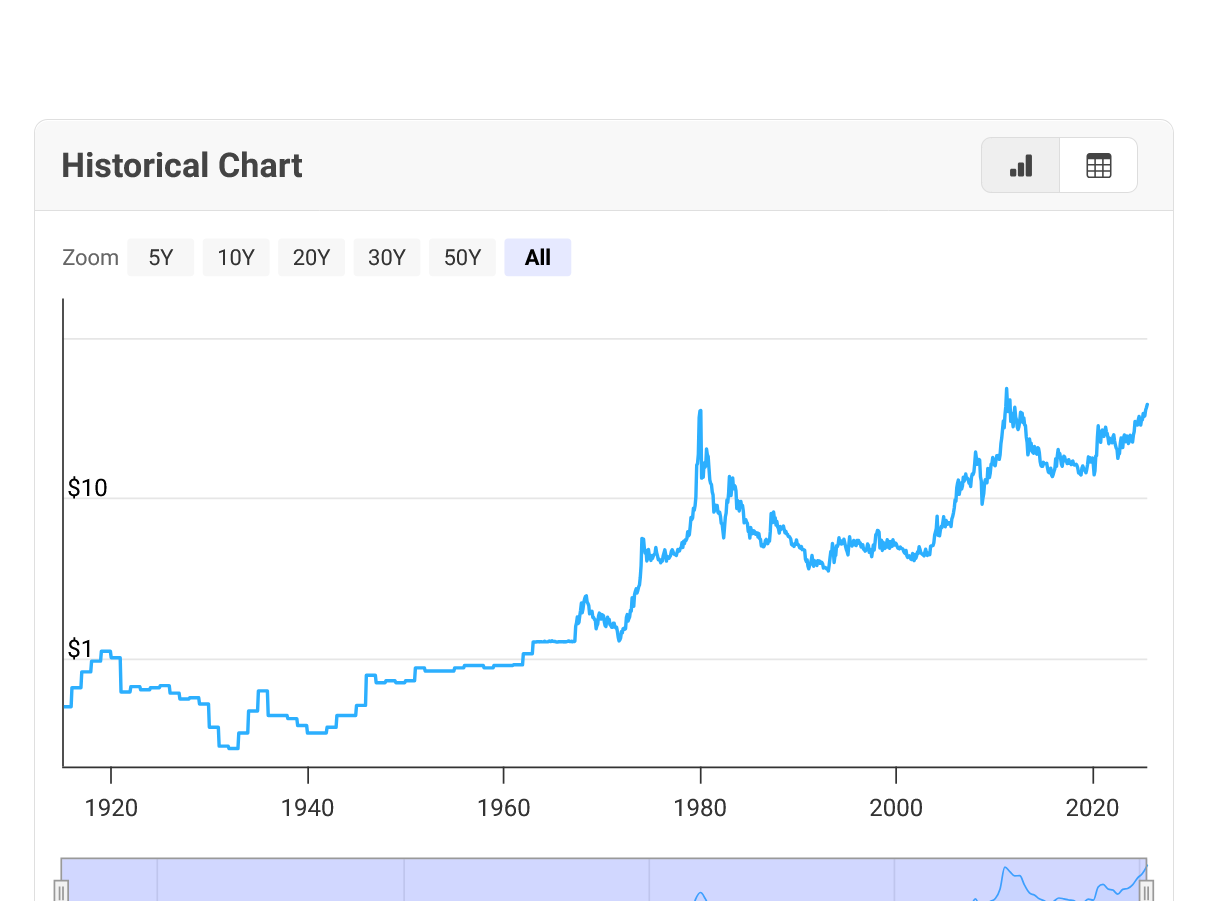
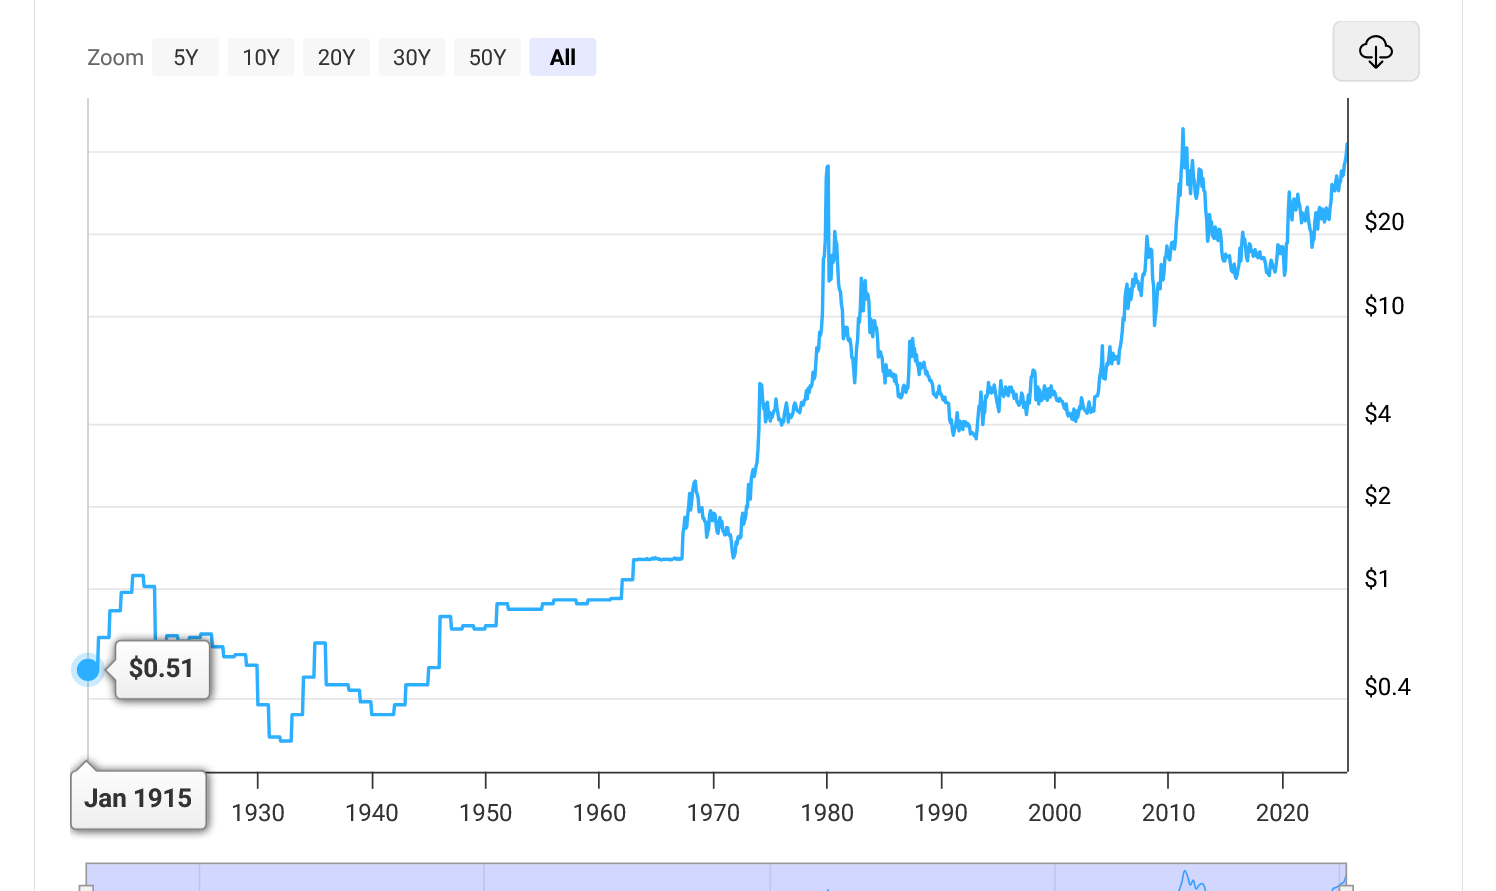
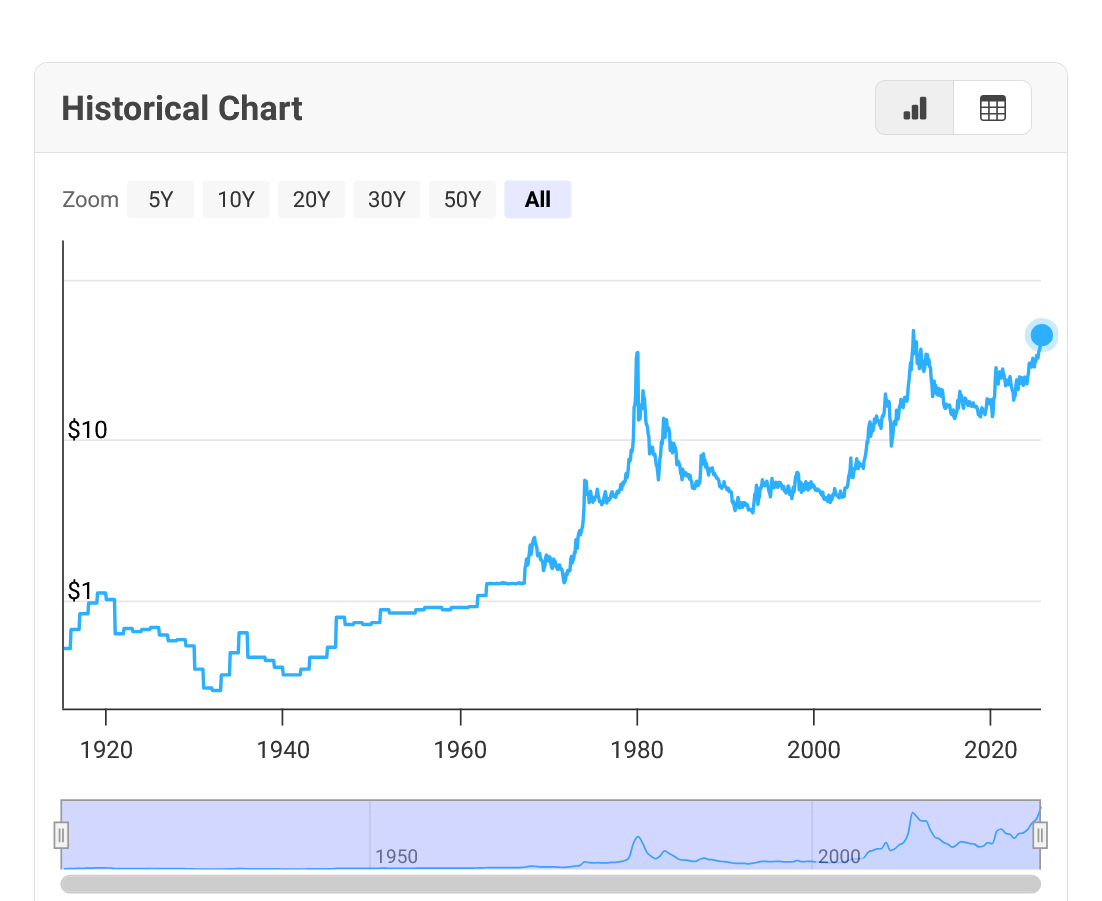
Here's a look back 100+ years for silver.
This is the 2nd highest price in history. Higher than 1980 but not as high as 2011, when we got to something like $49.
As joj has mentioned here before(he follows gold and other markets closely) when adjusted for inflation, this price is not nearly as impressive COMPARED TO those previous highs.
https://www.macrotrends.net/1470/historical-silver-prices-100-year-chart
What I find note worthy is that gold is breaking out of a 4 month sideways range to a new all-time high, and so little mention from the pundits.
I did notice silver outperforming gold (finally). Back in the day, that used to mean inflation rather than flight to safety. May or may not still be the case.
Thanks, joj!
I wonder if some of this crazy stuff, that has bombarded us so many times for so long recently is just the new normal.
Also, Trump is at the top of so many news stories, some being scandals that he may be stealing the impact away from just another boring new high in gold
1. Epstein
2. Tariffs
3. National Guard
4. Firing people
5. War in Ukraine
6. War in Gaza/Middle East
7. RFK Jr. Scandal
There's probably more but that's off the top of my head. It's certainly stealing away more of my time than it should
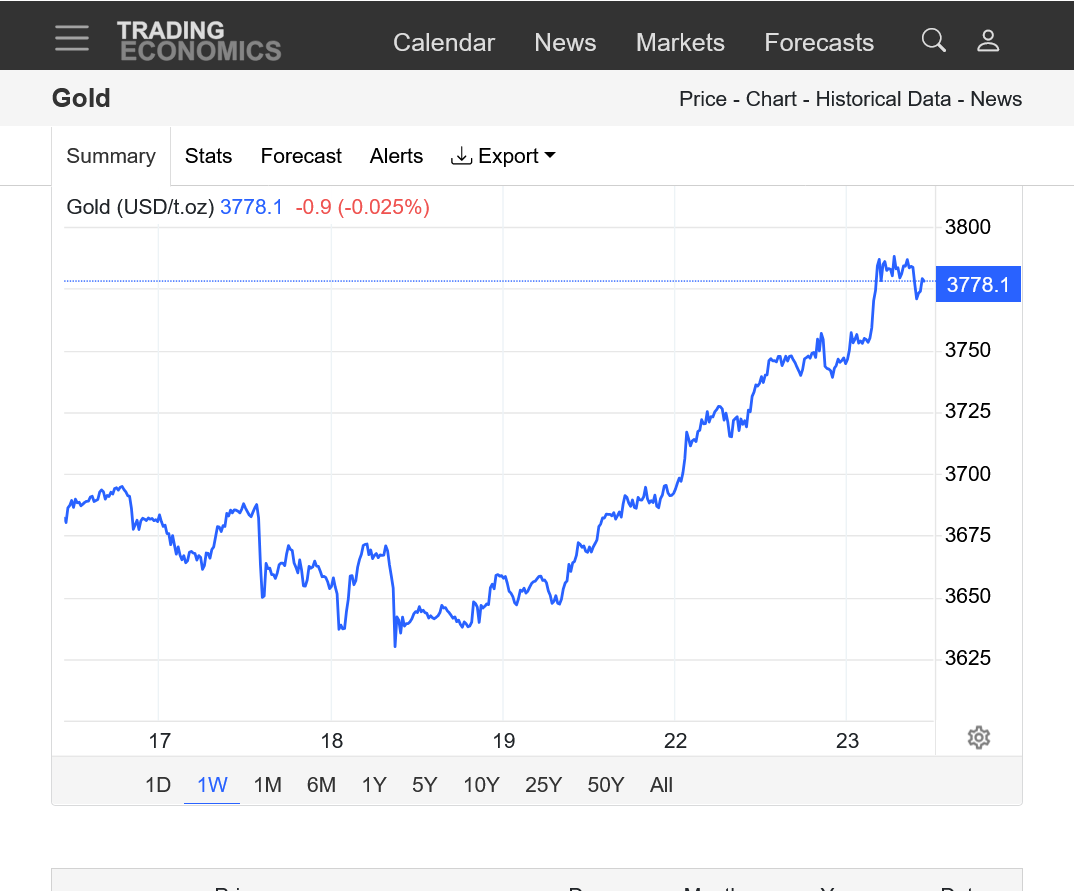
Gold has been on tear the past week!!! Having a small correction today.
https://tradingeconomics.com/commodity/gold
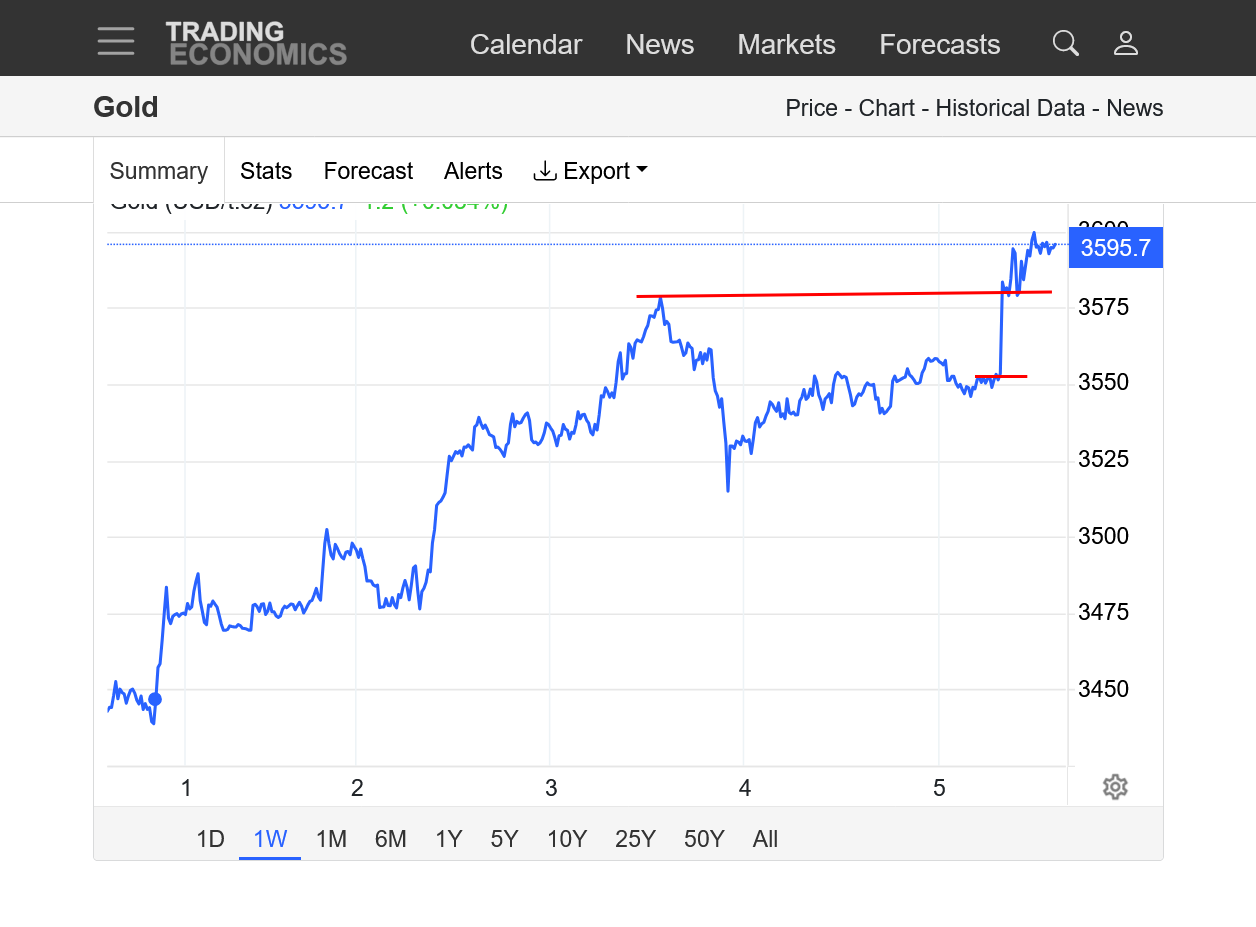
1. 1 week. Huge move up. Slight correction down today.
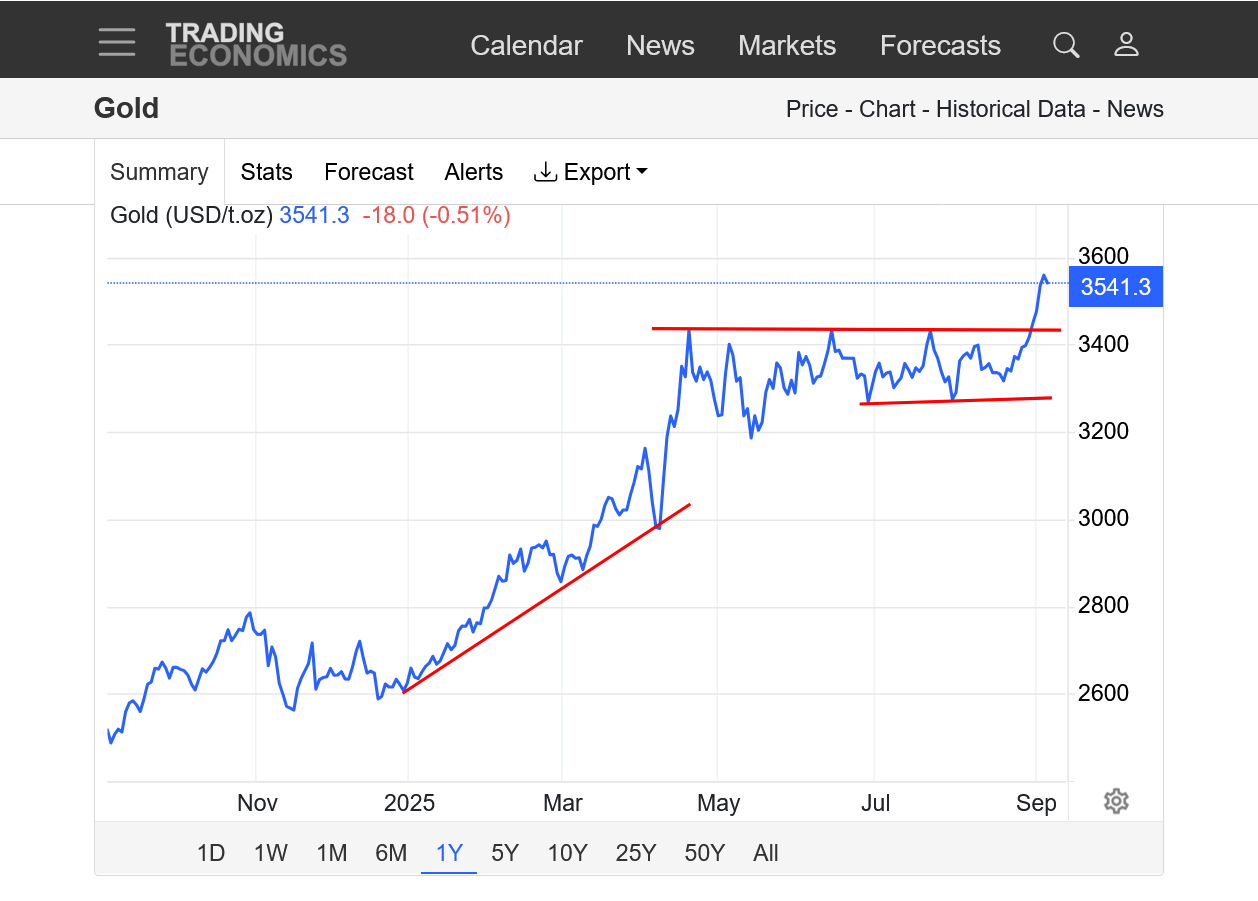
2. 1 year: Uptrend continues. Recent sideways/bull flag was a continuation pattern. Recent upside break out above previous highs/resistance with plenty of follow thru buying this week telling us that investors/speculators are still willing to buy the heck out of gold, even at these extremely lofty price levels.
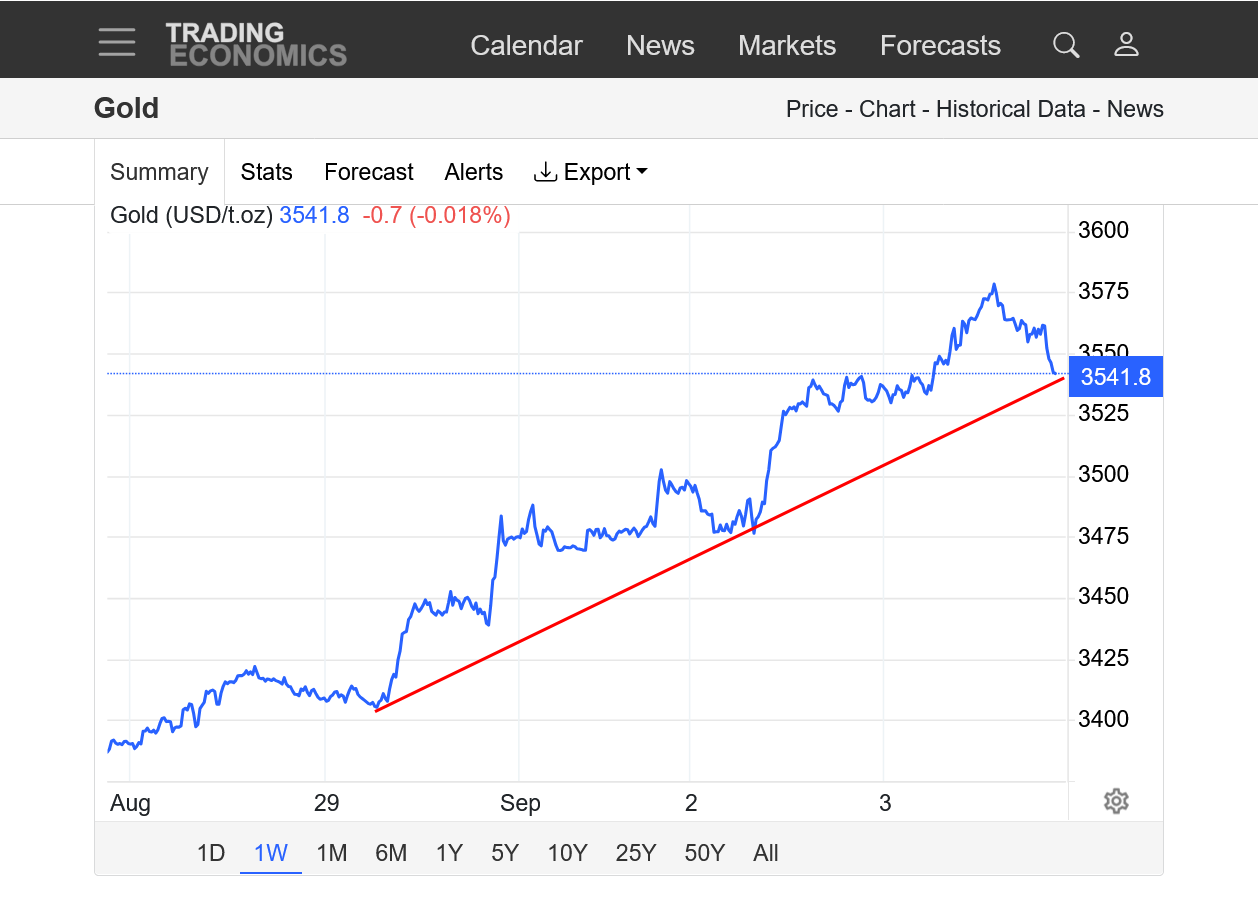
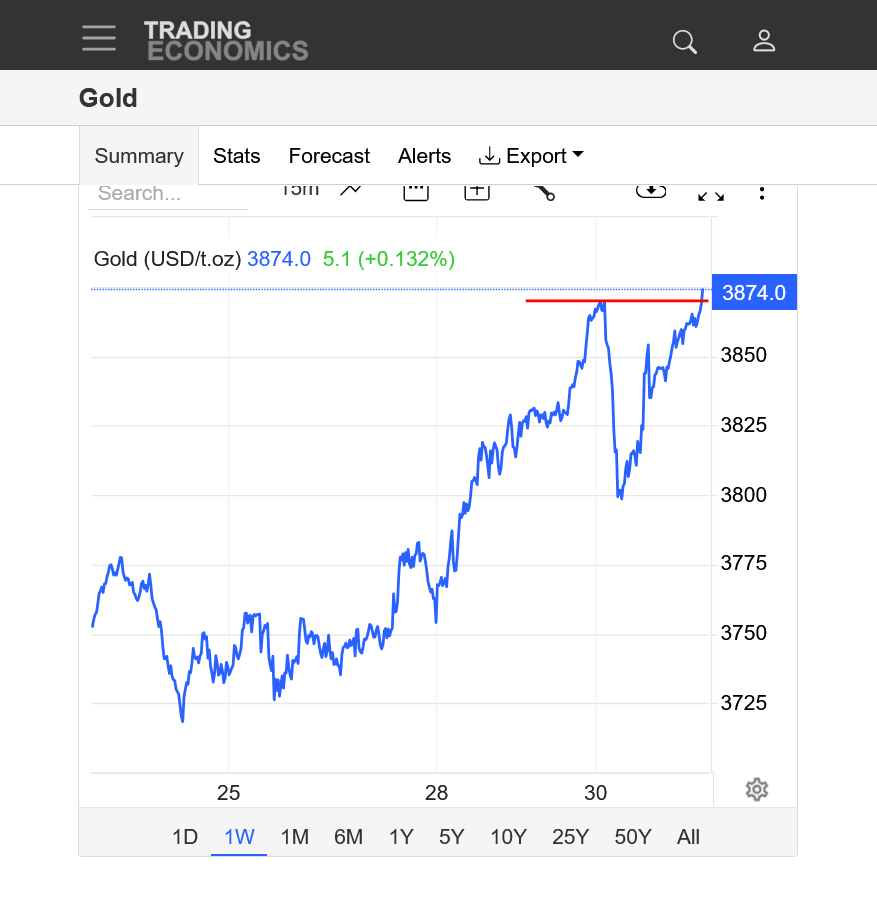
New record highs today. Note the spike higher when the weak job numbers came out(short red line), which took us above the previous highs (long red line) in a flash. This was all news!!
Weak jobs/economy = Fed lowering interest rates more likely =increased risk for inflation=more uncertainty for future of economy = more gold buying as a safe haven.
As long as Trump is president with his chaotic, ruinous economic policies and over reaching abuse of power used to hurt the economy(domestic and global), gold bulls have an insurance policy on their long positions.
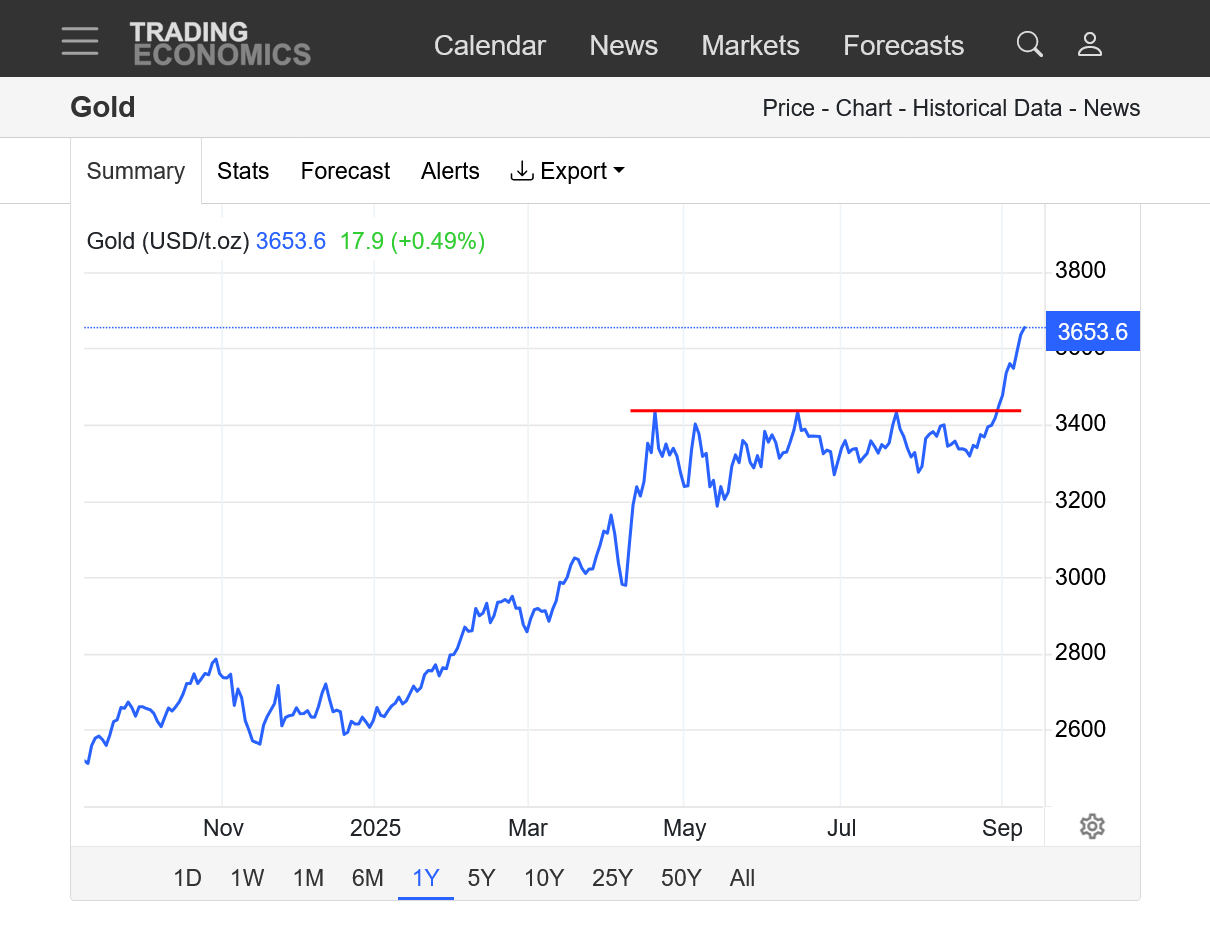
Building/adding to the huge upside break out!
Plenty of aggressive buying left even after being +39% this year!
https://tradingeconomics.com/commodity/gold
The news also continues to be bullish for silver. Still below the highs of 2011.
https://tradingeconomics.com/commodity/silver
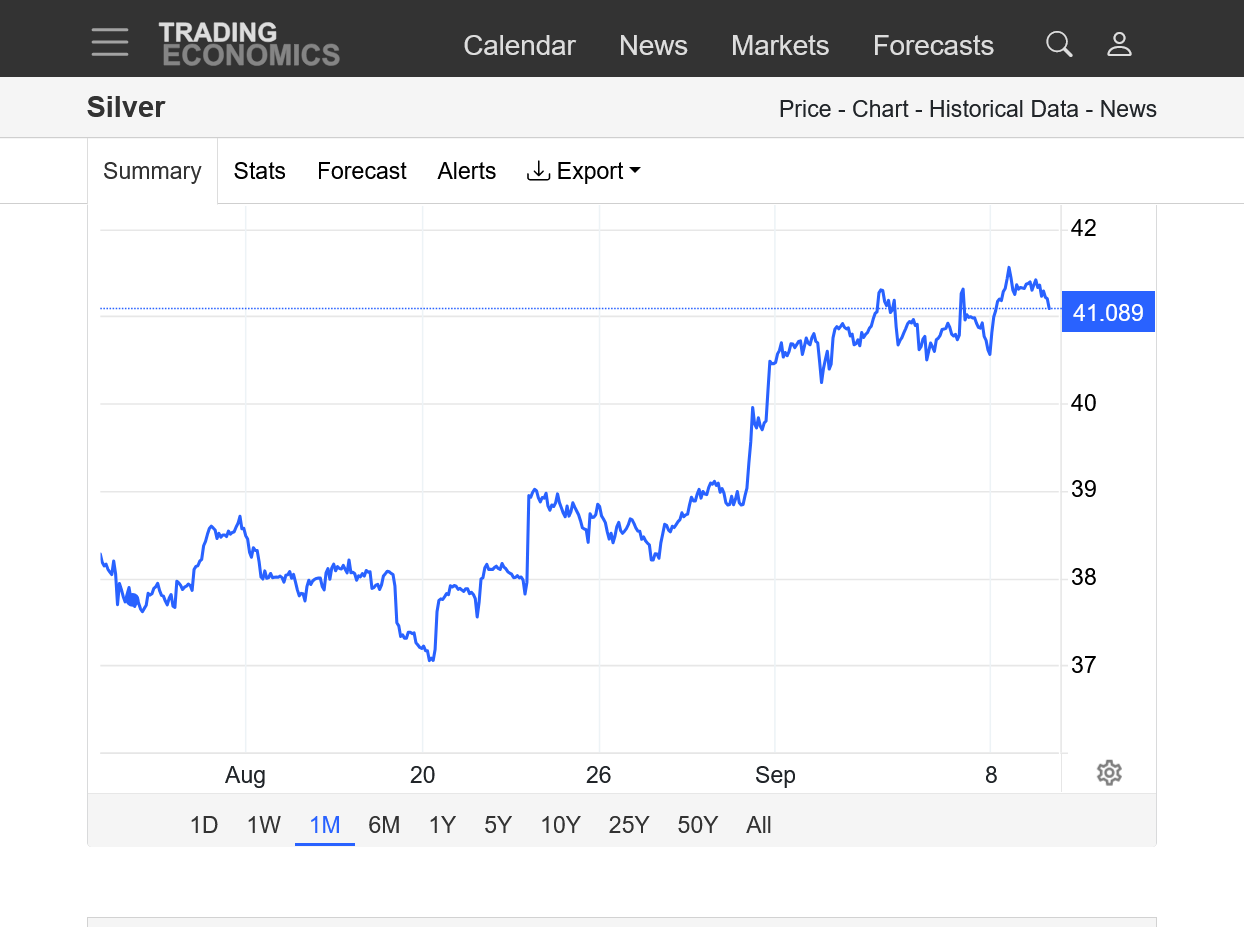
1. 1 month
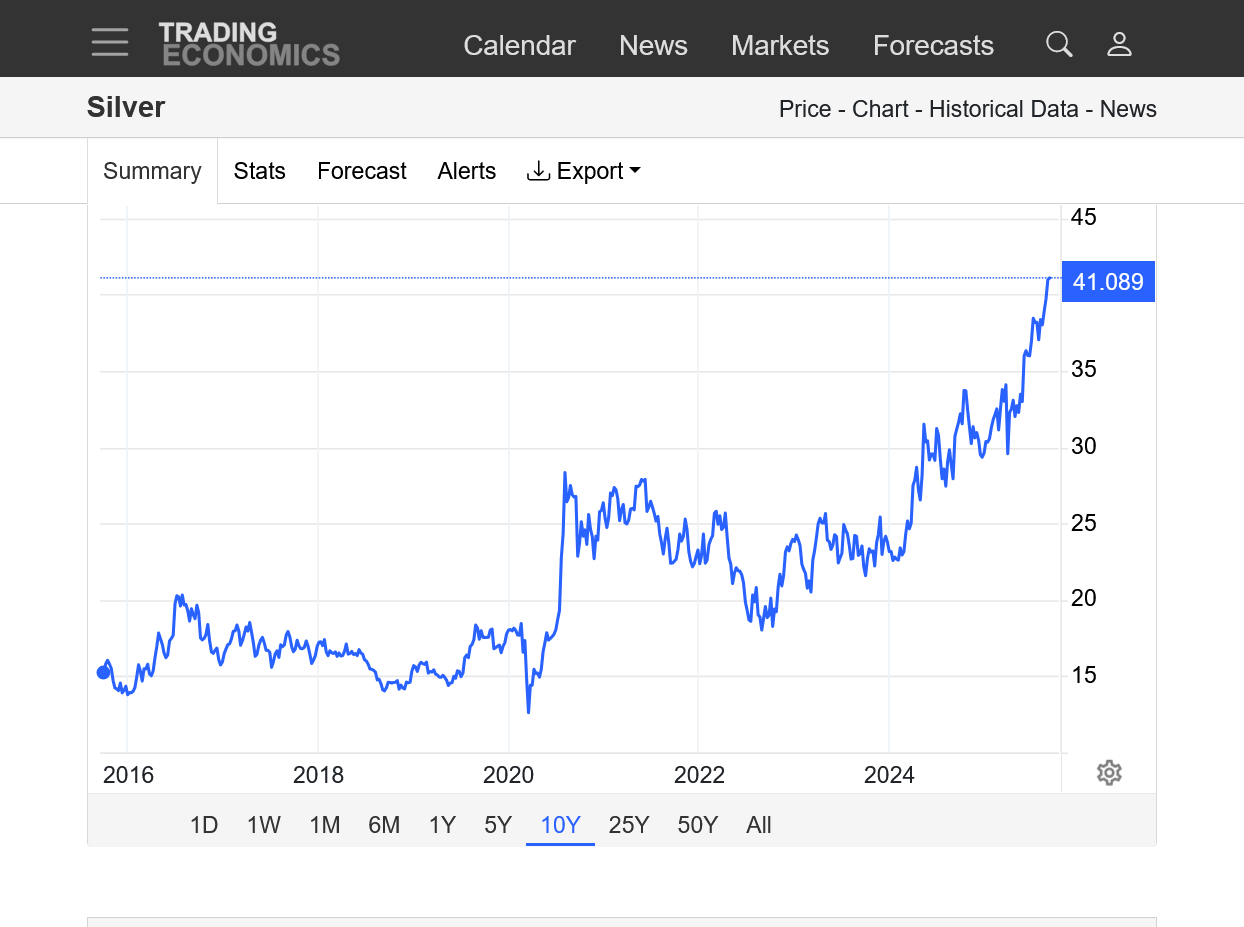
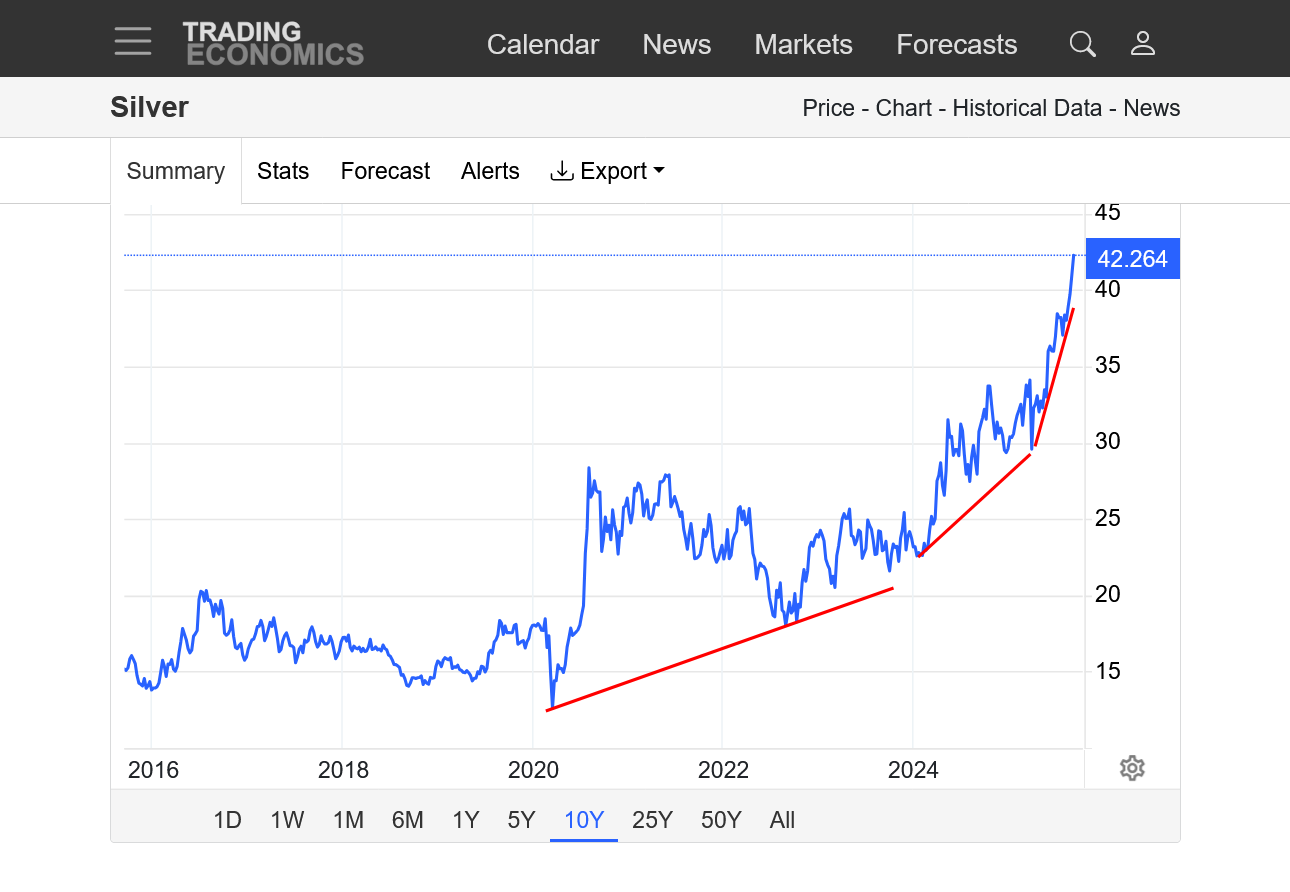
2. 10 years
i can see a pitchfork pattern developing.
start at the lows of 4-7 and 5-15 the centerline is rising at about 6.04814/ day and corresponds with today's price. JMHO
Thanks, cutworm!
No sign of weakness!
Silver is soaring to new highs!
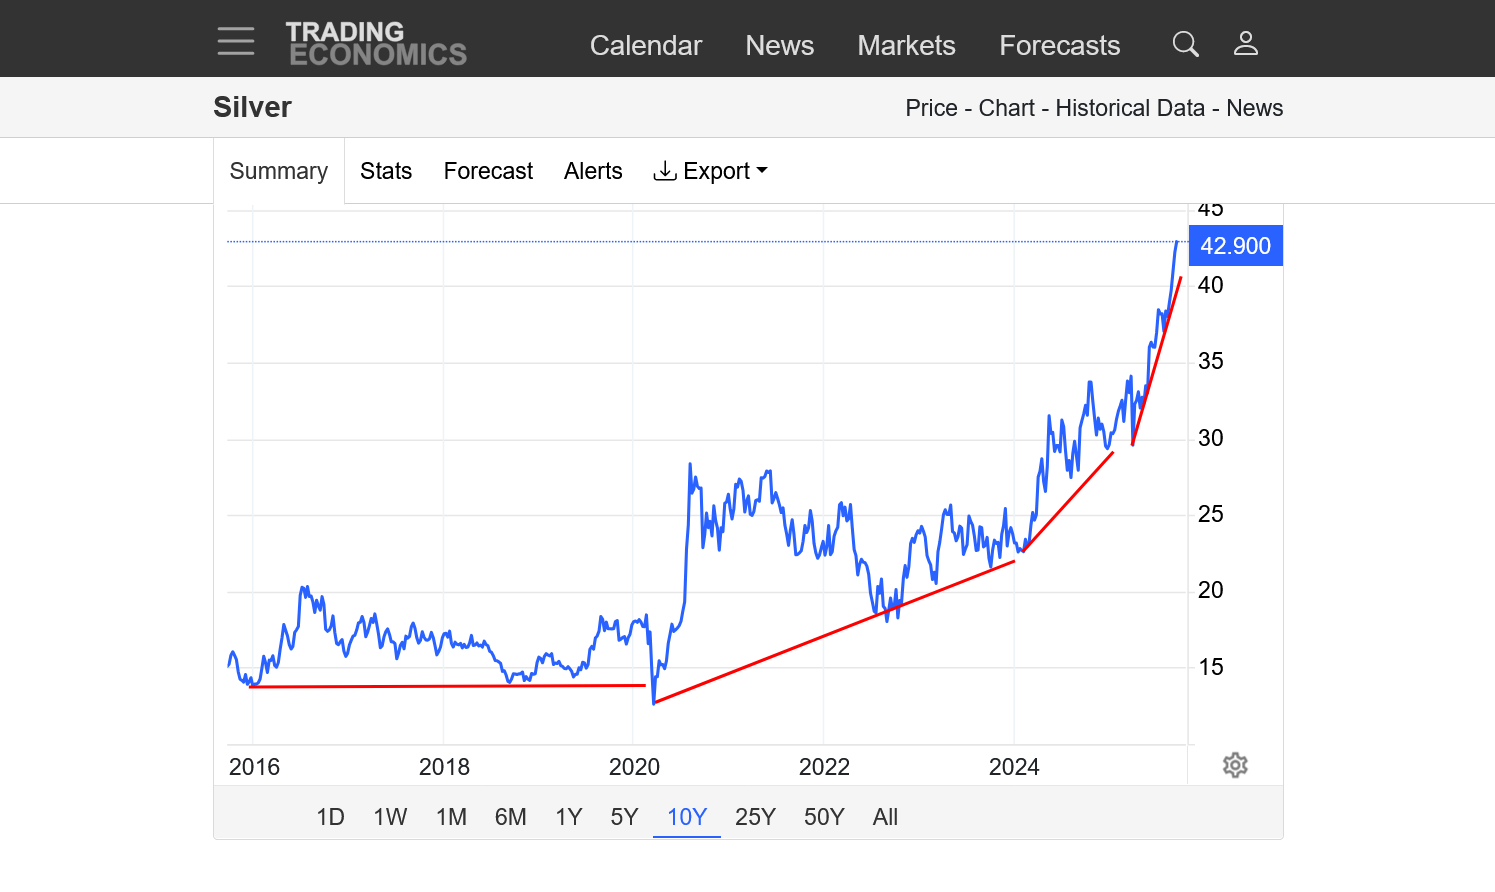
1. 10 year: Parabolic/exponential curve. Greatly steepening uptrend/up channel. This is the classic, spike topping pattern but the highs are impossible to know. They could be 45, or 50 or 100! Very often, at the top we have panic buying at the market orders(under water shorts crying uncle/or forced margin calls or even end users that need to have some coverage). This can put in the most extreme bar at the top. This is usually followed by some sort of extreme reversal down bar from exhausting the panic buying and nobody left to buy. It doesn't always act like that but that the classical top.
This can also follow news. Buy the rumor, sell the fact action. For instance, when the Fed cuts interest rates next week, all those that bought ahead of this silver bullish news(rate cuts=inflationary and economy stimulating) could take profits/sell because the bullish news was completely dialed in on the run up. Bulls often need to be fed.
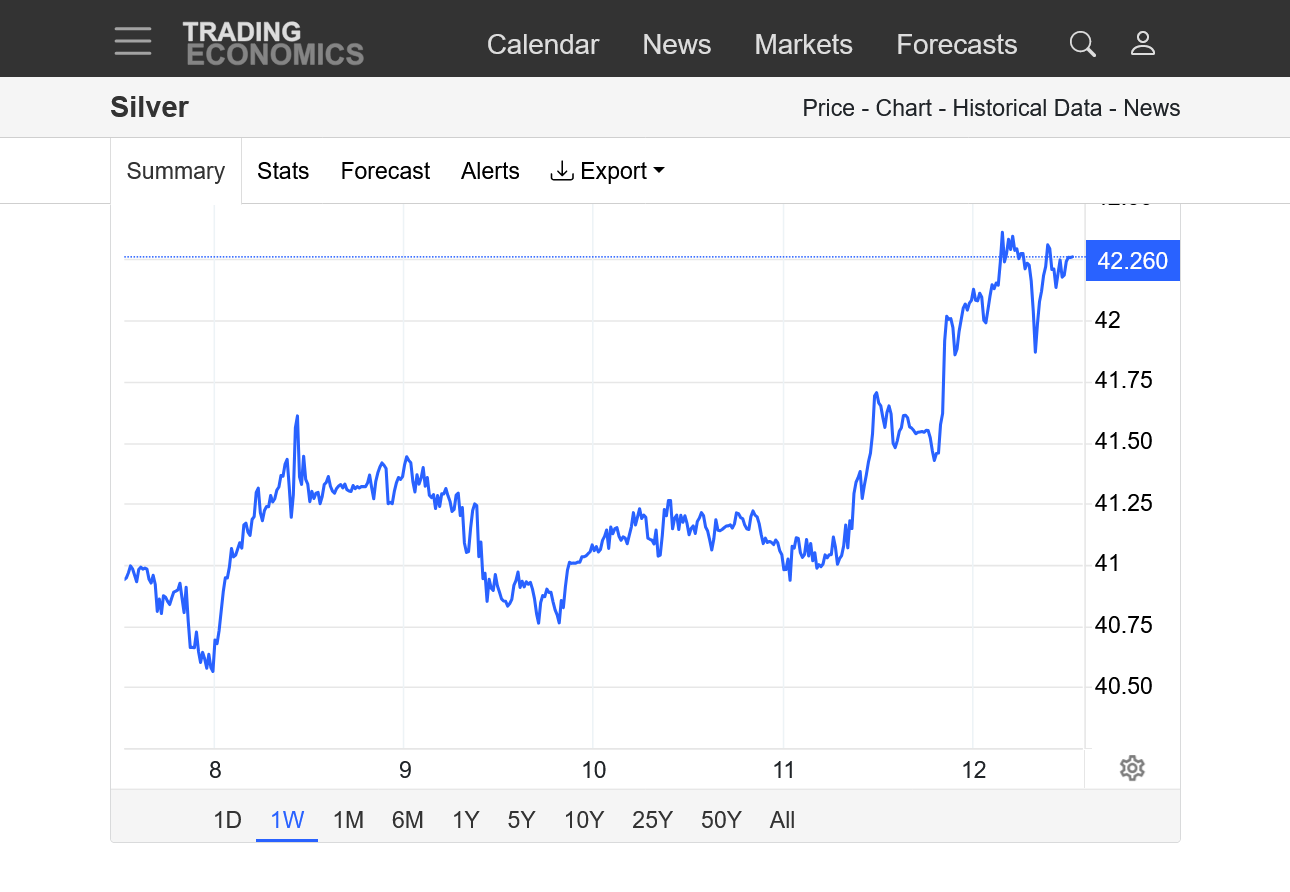
2. 1 week; Strong buying/new highs, no sign of a top
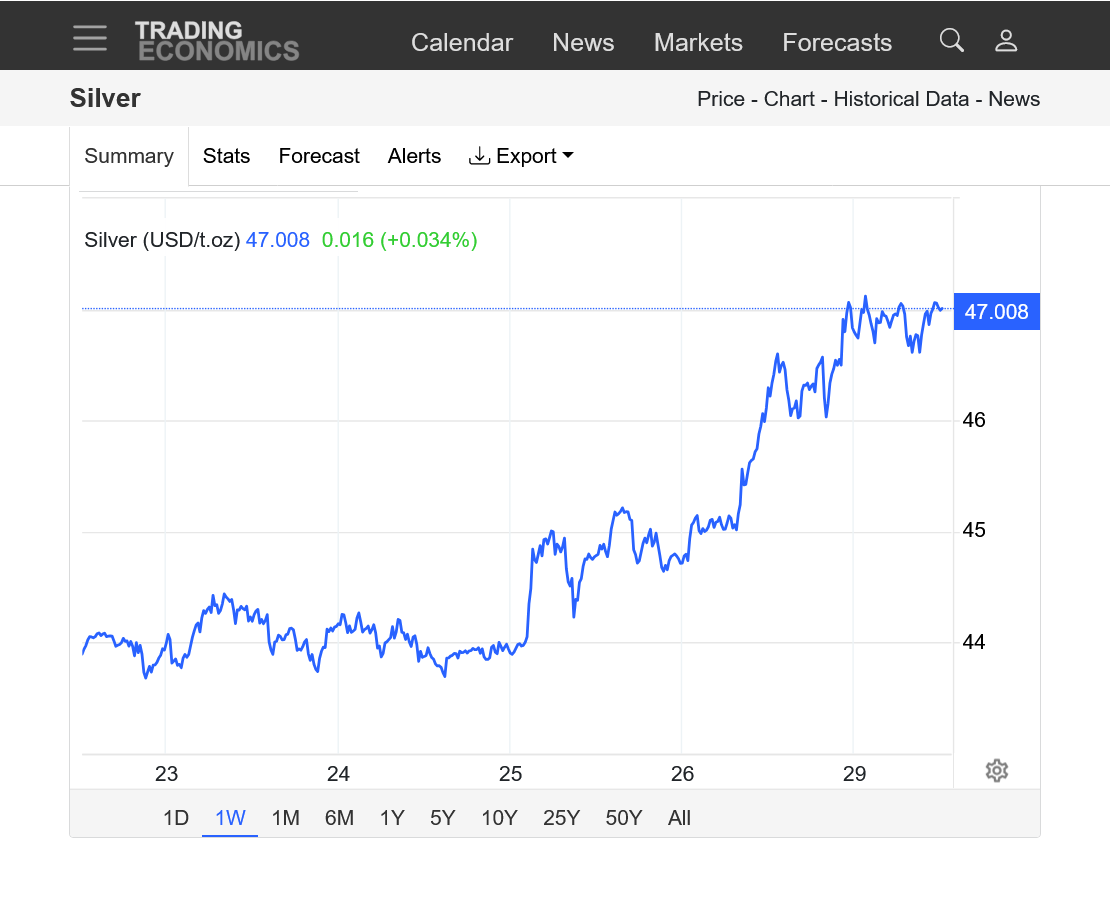
https://tradingeconomics.com/commodity/silver
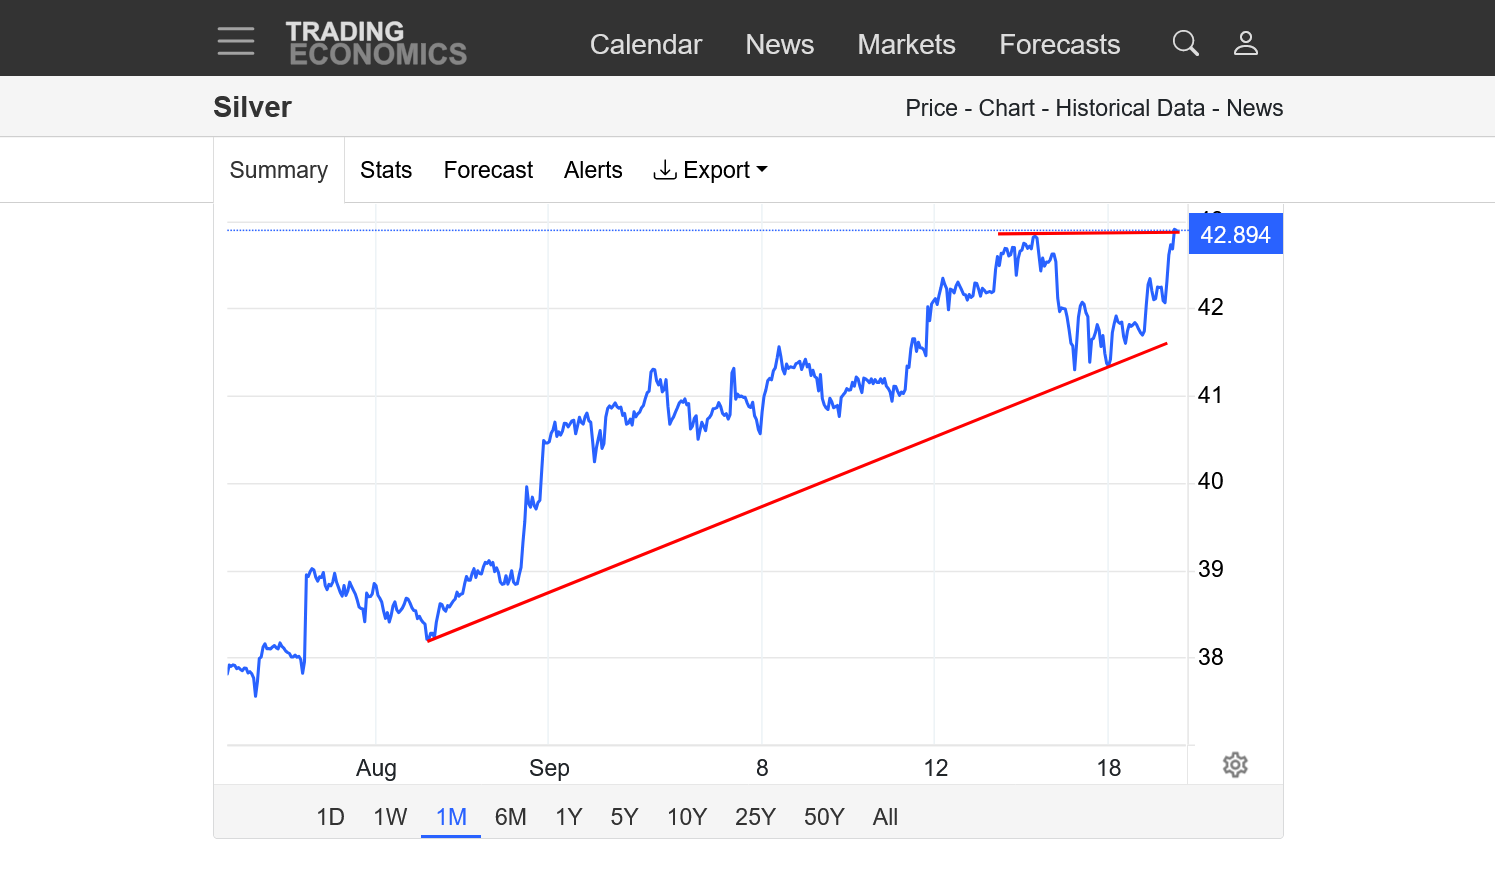
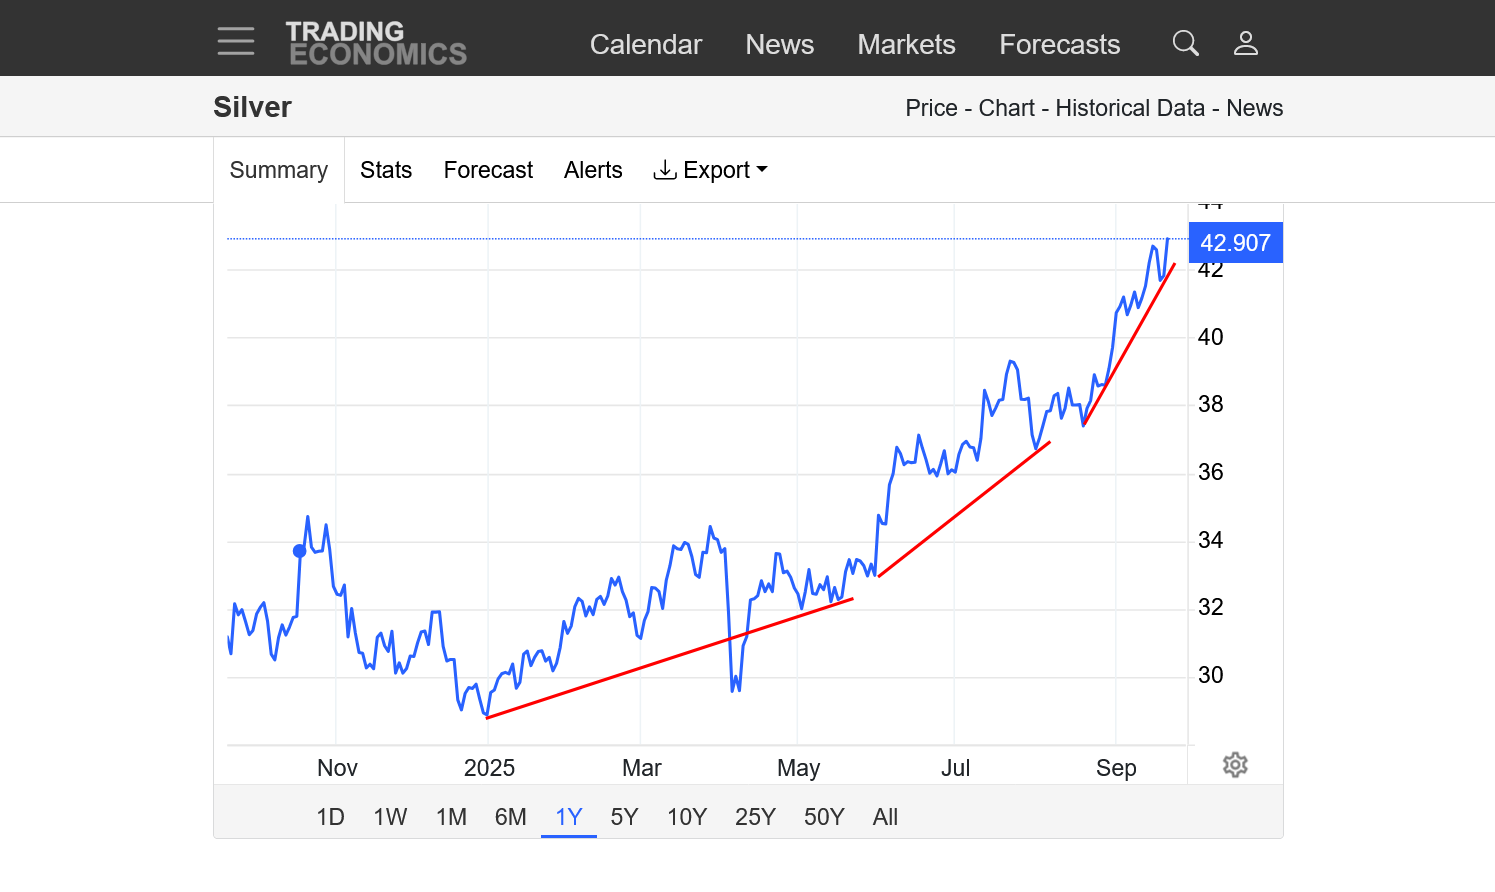
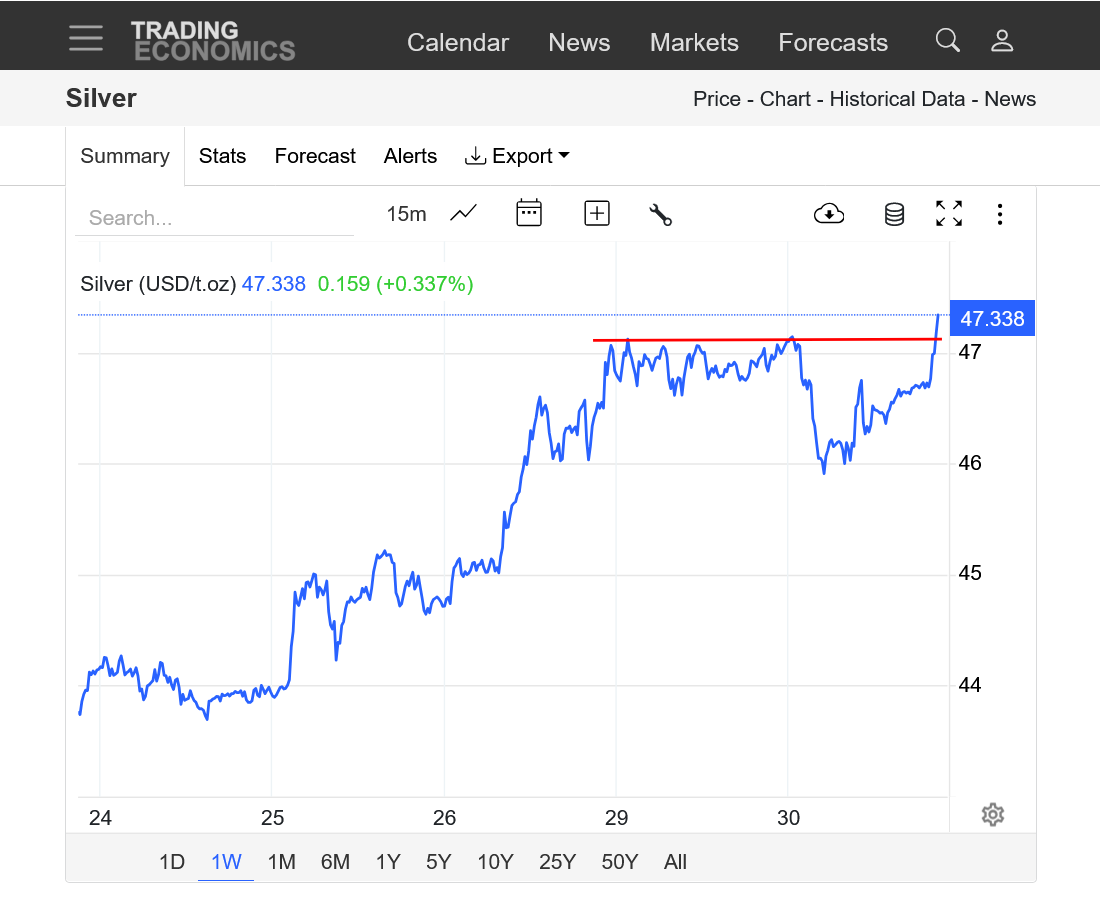
https://tradingeconomics.com/commodity/silver
1. 1 month: New upside break out to highest price since 2011. 2nd highest in history.
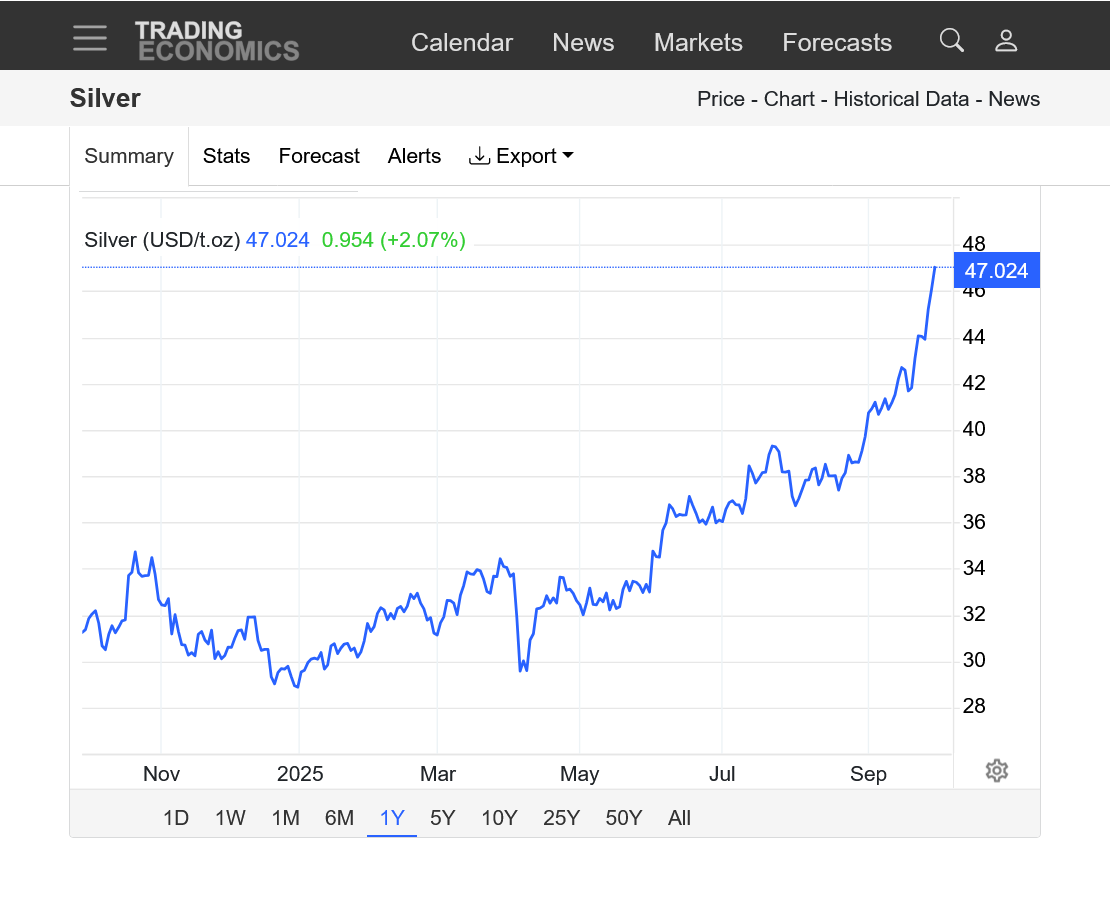
2. 1 year: Upside break out. Parabolic move up. Exponentially increasing price with an increasing slope higher.
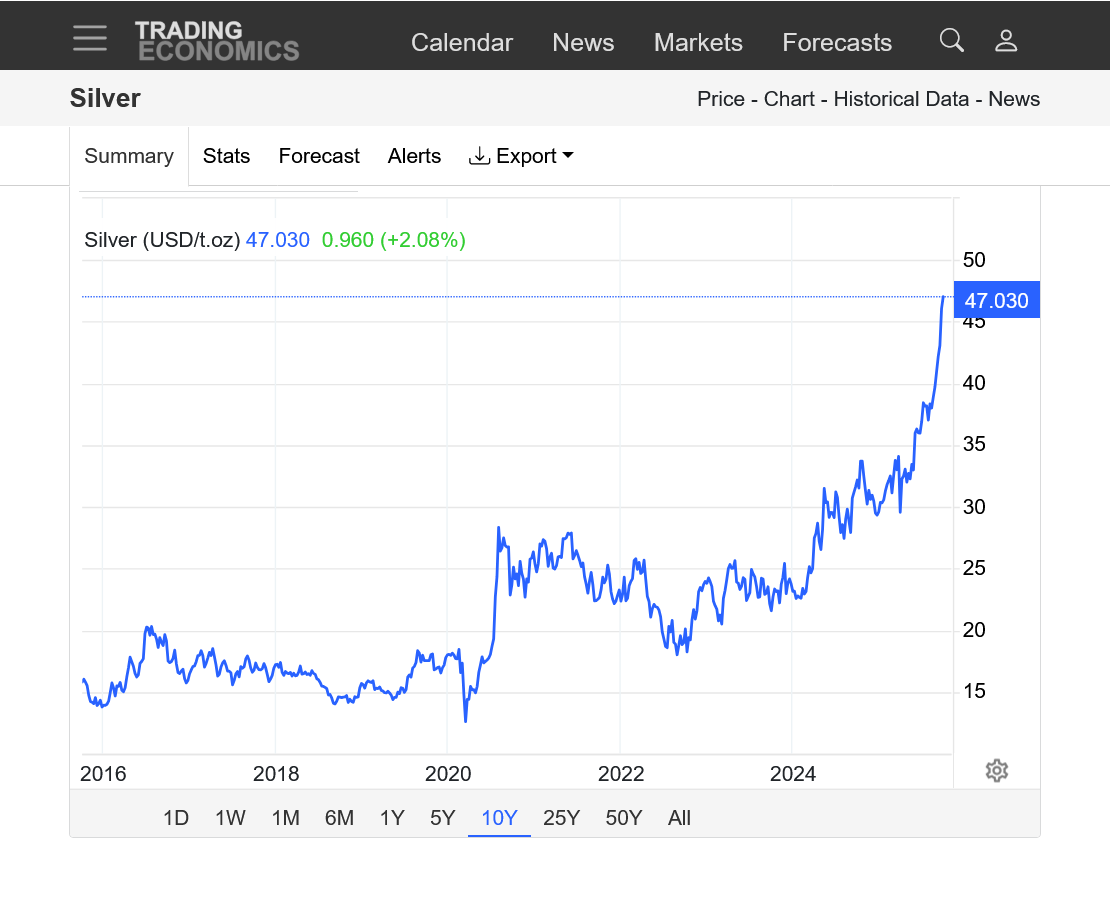
3. 10 years: Parabolic move up. Exponentially increasing price with an increasing slope higher. A market like this cannot continue indefinitely. However, it's impossible to pick a top, which could be next week, next year or even after that. Volatility increases at tops. This includes panic buying (from shorts under water/margin calls or commercials/end users needing to cover needs). Often, this will cause an enormous buying exhaustion spike higher, then all the buyers that wanted out to buy run out and the market reverses/collapses lower in order to find new buyers at much lower prices.
Here's a look back 100+ years for silver.
This is the 2nd highest price in history. Higher than 1980 but not as high as 2011, when we got to something like $49.
As joj has mentioned here before(he follows gold and other markets closely) when adjusted for inflation, this price is not nearly as impressive COMPARED TO those previous highs.
https://www.macrotrends.net/1470/historical-silver-prices-100-year-chart
Gold is surging to new all time record highs again today!!
https://tradingeconomics.com/commodity/gold
1. 1 year
2,. 10 years: Exponential, parabolic move higher. Increasingly steep slope of the uptrend. Unsustainable long term but with no end in sight until we exhaust the extreme mentality of the market, which usually happens with an enormous spike up(from panic buying) and reversal down on the same day. Trying to pick a top before that happens has cost traders massive equity in the trading world.
Silver has a similar analysis as gold. WOW today!
https://tradingeconomics.com/commodity/silver
1 day chart below!
I did a little digging and learned that Central banks are indeed buying more gold in nominal terms. Meaning, buying about the same number of tons of gold but since the price of gold has nearly doubled in recent years, it represents a larger financial allocation to gold reserves relative to dollar reserves.
This makes plausible the notion that Trump's economic policies are scary to central bankers. Make America isolated again.
So does that mean more currency floating around? more world inflation???
now 3860 next some correction and we might see such moves --BIG moves and structure is shifting now -- silver moving too in Same direction and oil could be NExt --Food ----Grains!!
Great comments!
joj, what you stated makes total sense.
1 week charts below:
https://tradingeconomics.com/commodity/gold
++++++++++++++++++
https://tradingeconomics.com/commodity/silver
+++++++++++=
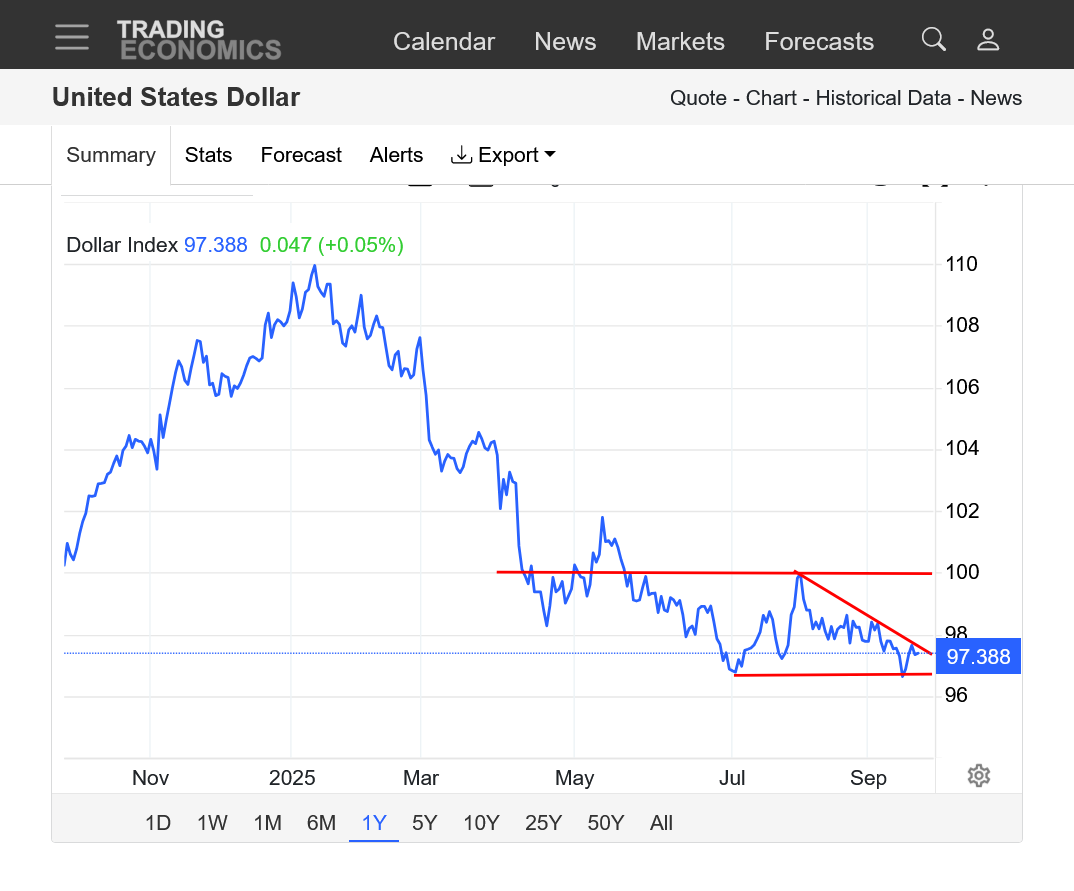
US dollar: Corrected analysis at 10:50 am
1. 10 years: Sharp downtrend. Downside break out below key $1 support. October 2022 high! January 6, 2025 lower high, then a sharp downtrend!
2. 1 year: Downside break out below $1. Current formation is a descending wedge in a bear market. A continuation pattern! A break out below the July 2, 2025 low and slightly lower September 16, 2025 low would confirm that. Note the sharp downtrend, after the January 6, 2025 high, ahead of the Trump inauguration.
https://tradingeconomics.com/united-states/currency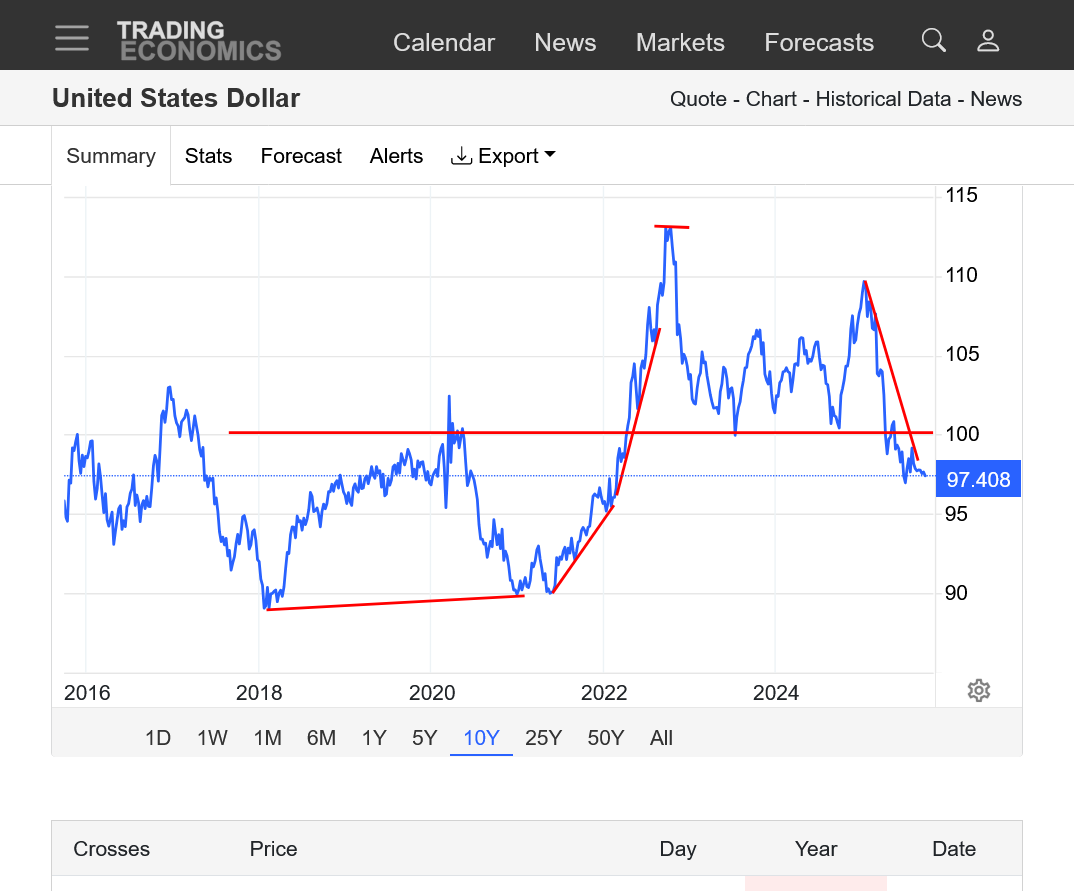
fayq,
Yes, excellent assessment!. one would think that the DX dropping more would put upward pressure on other commodities as you noted…..higher inflation.
It will take MORE dollars to buy the same stuff when the value of the dollar is lower!
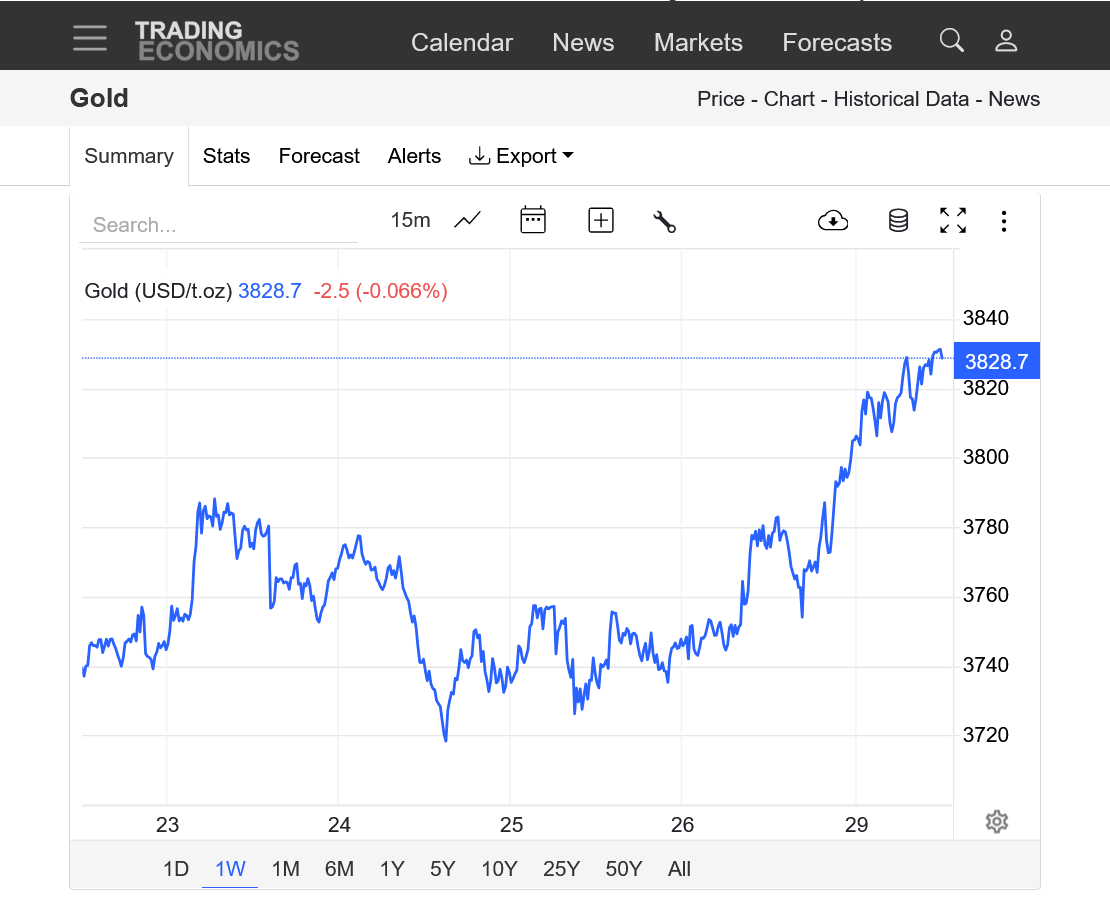
Gold closes near the highs of the week, which are the all time highs.
https://tradingeconomics.com/commodity/gold
++++++++++++++++++++++
Silver on the other hand continued its amazing surge up this week as it rapidly approaches all time highs from 2011:
https://tradingeconomics.com/commodity/silver
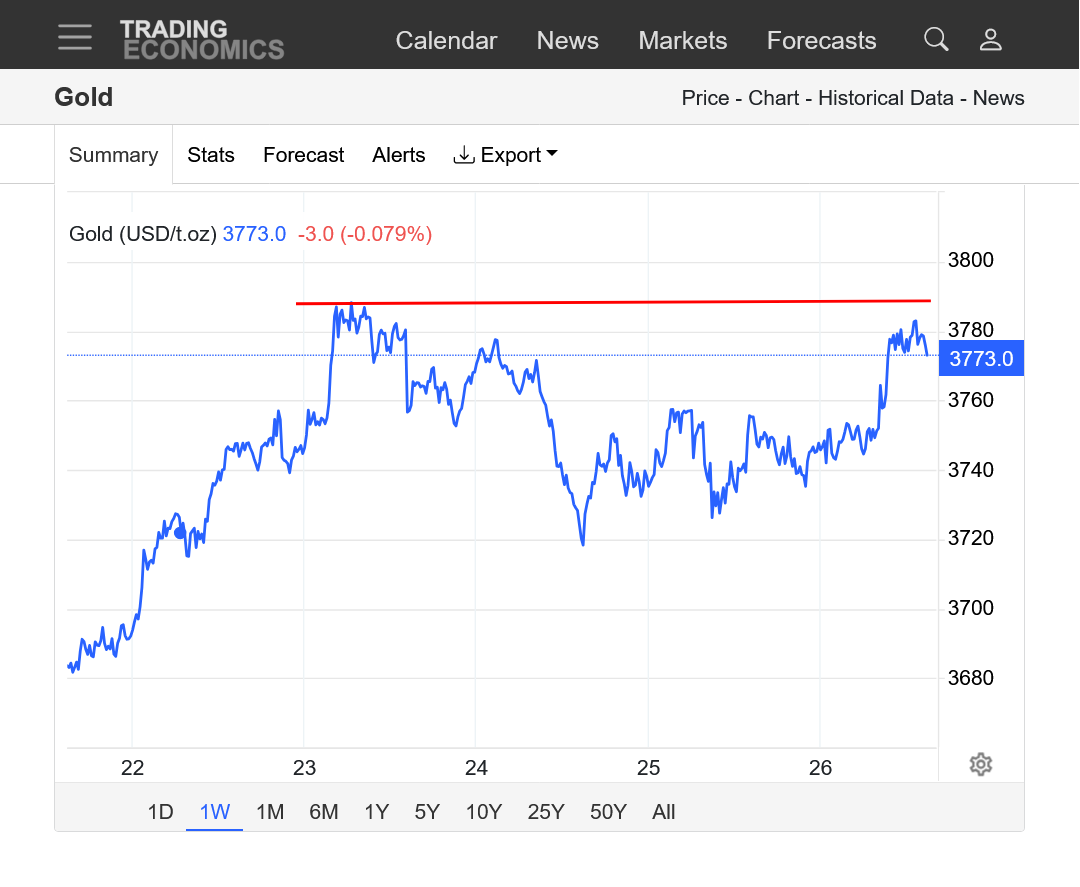
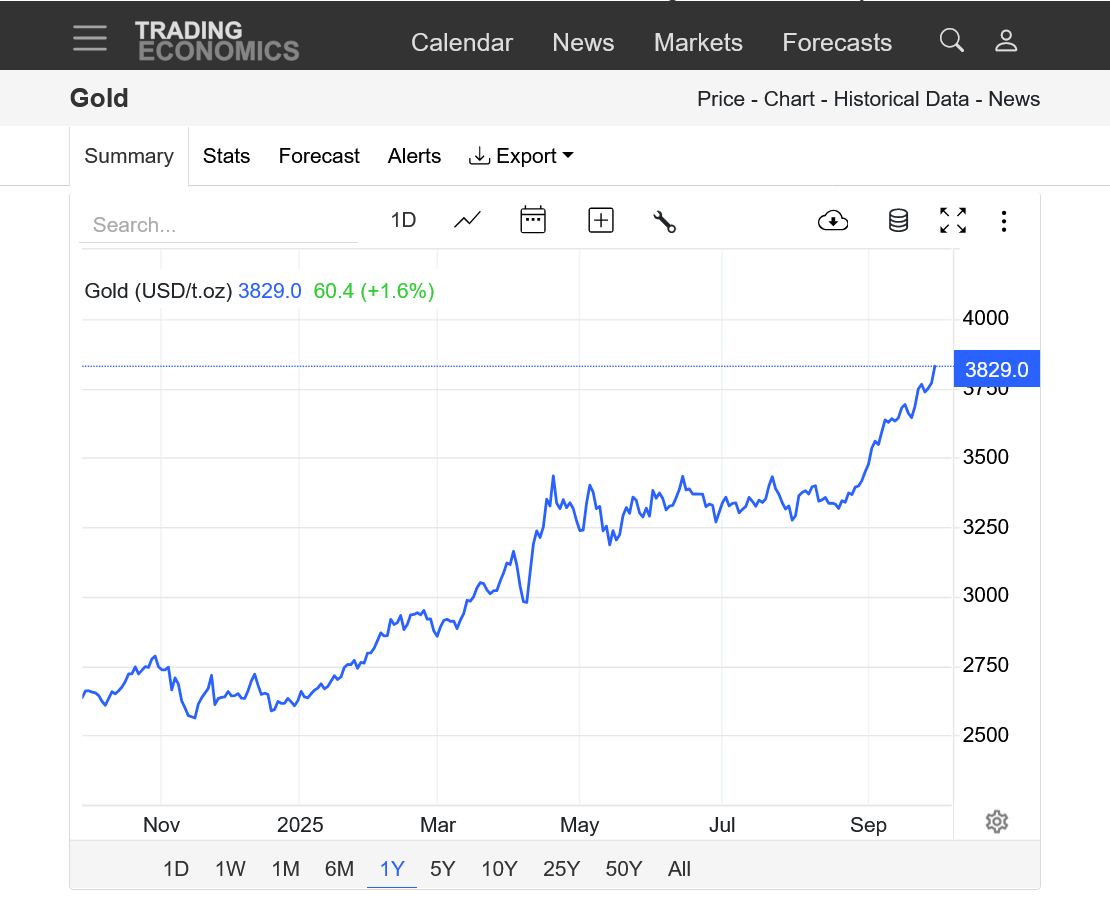
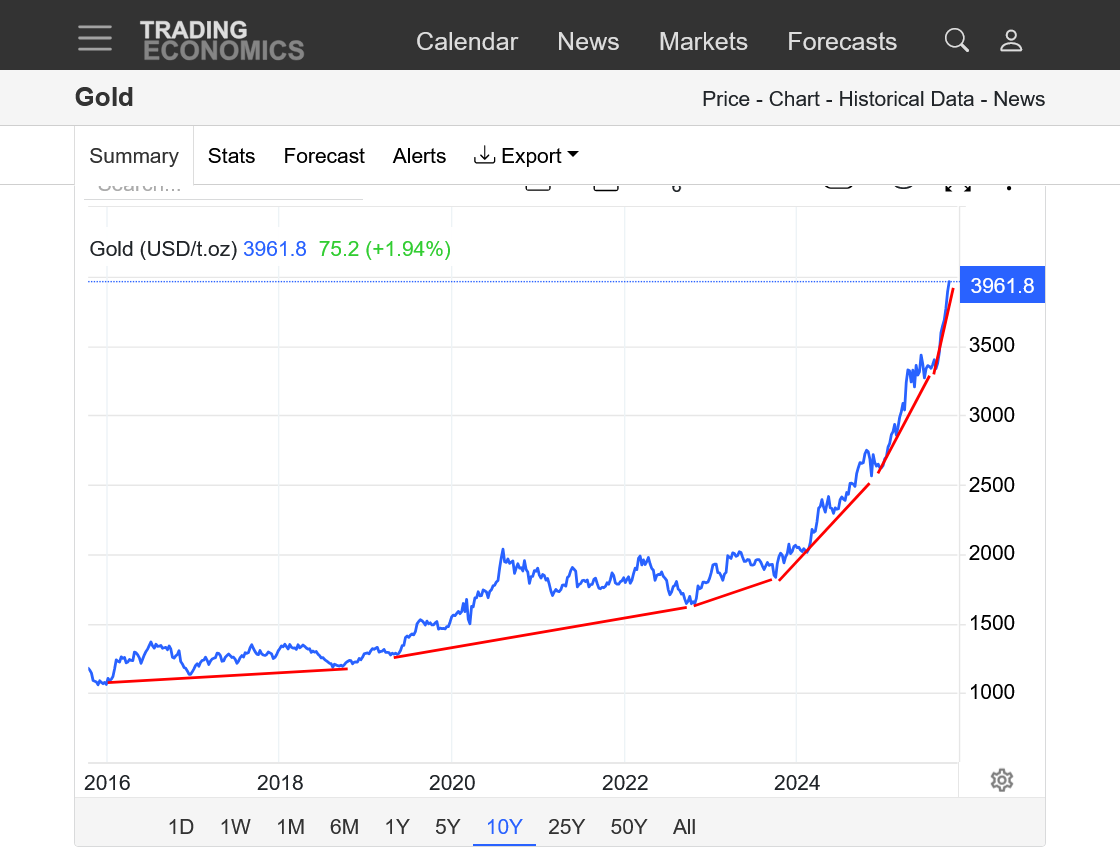
Gold smashing more record highs!
More rate cuts + higher inflation +possible government shutdown + Donald Trump as the most powerful man in the world creating chaos and destabilizing markets.
https://tradingeconomics.com/commodity/gold
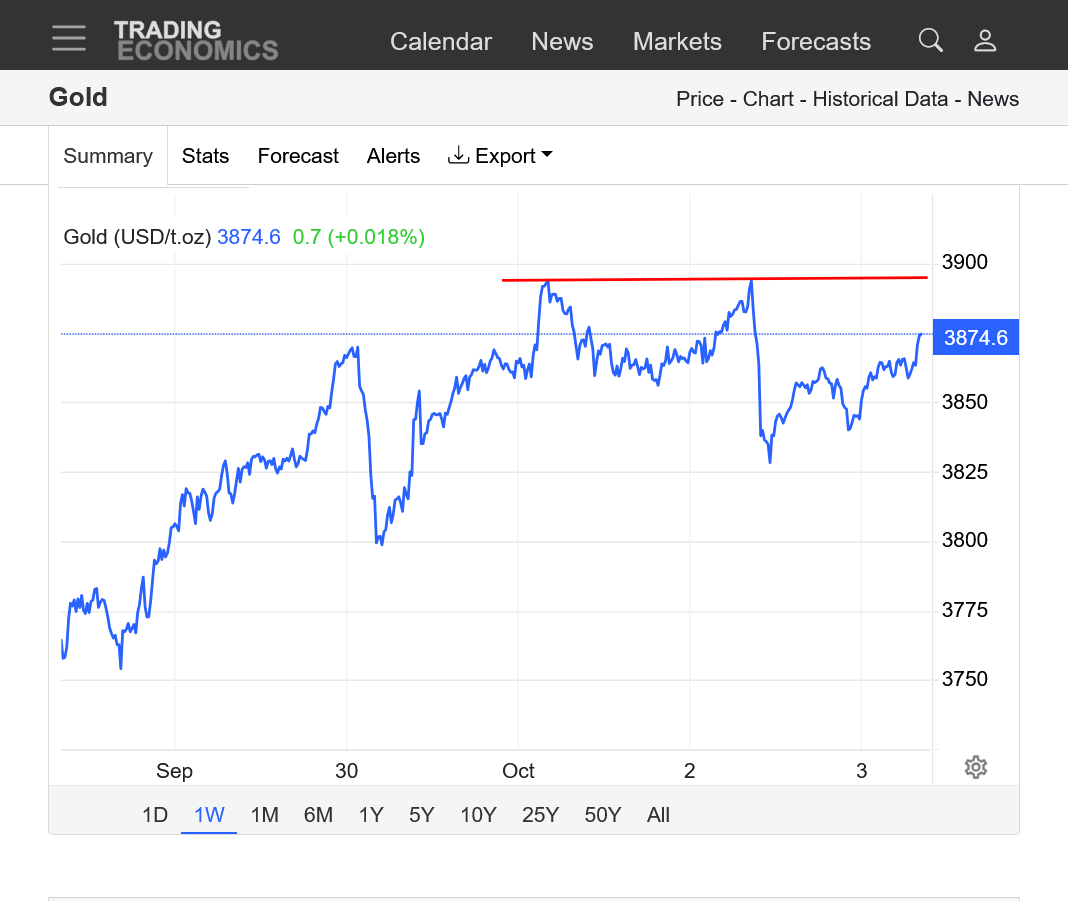
1. 1 week
2. 1 year
3. 10 years
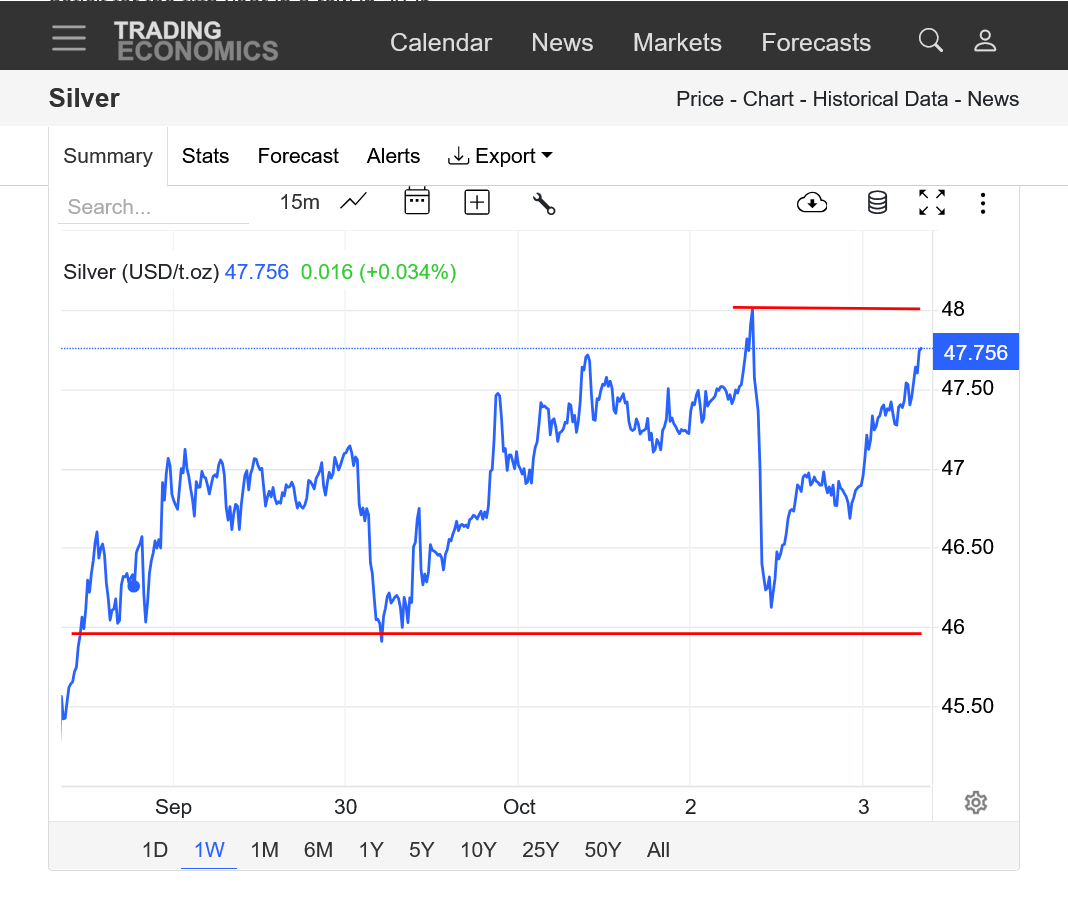
Silver is rapidly approaching all time highs from 2011.
Same factors as above +this is the 5th straight year for silver to have increasing demand that has not corresponded to an increase in supply to keep up.
https://tradingeconomics.com/commodity/silver
1. 1 week
2. 1 year
3. 10 years
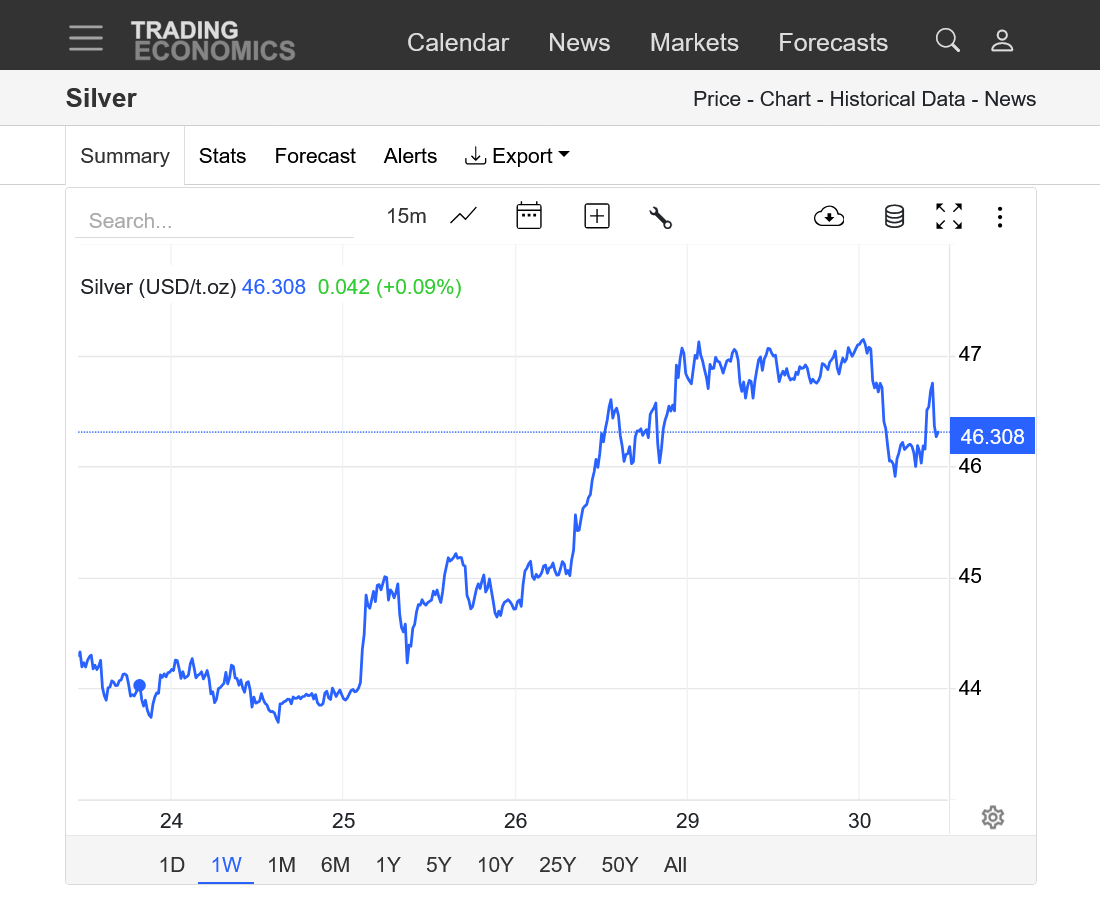
Potential short term buying exhaustion and reversal down today in silver. I'm NOT predicting a top, just following and analyzing the charts.
We can't keep surging up like this EVERY day.
https://tradingeconomics.com/commodity/silver
+++++++++
It looks like the price this week was/is awful close to the record highs in 2011, which would likely provide some strong resistance! The charts I normally use here, cost money to go beyond 10 years.
https://www.macrotrends.net/1470/historical-silver-prices-100-year-chart
That pullback didn't last long. NEW HIGHS for the move this evening. Looking like silver will blow thru the 2011 all time highs.
https://tradingeconomics.com/commodity/silver
Gold making fresh all time highs this evening. WOW!!!!
https://tradingeconomics.com/commodity/gold
WOW!!! This is the type of profound reversal down that will be almost impossible to come back from if we close decidedly below the red line! But anything seems possible in the markets recently!
https://tradingeconomics.com/commodity/silver
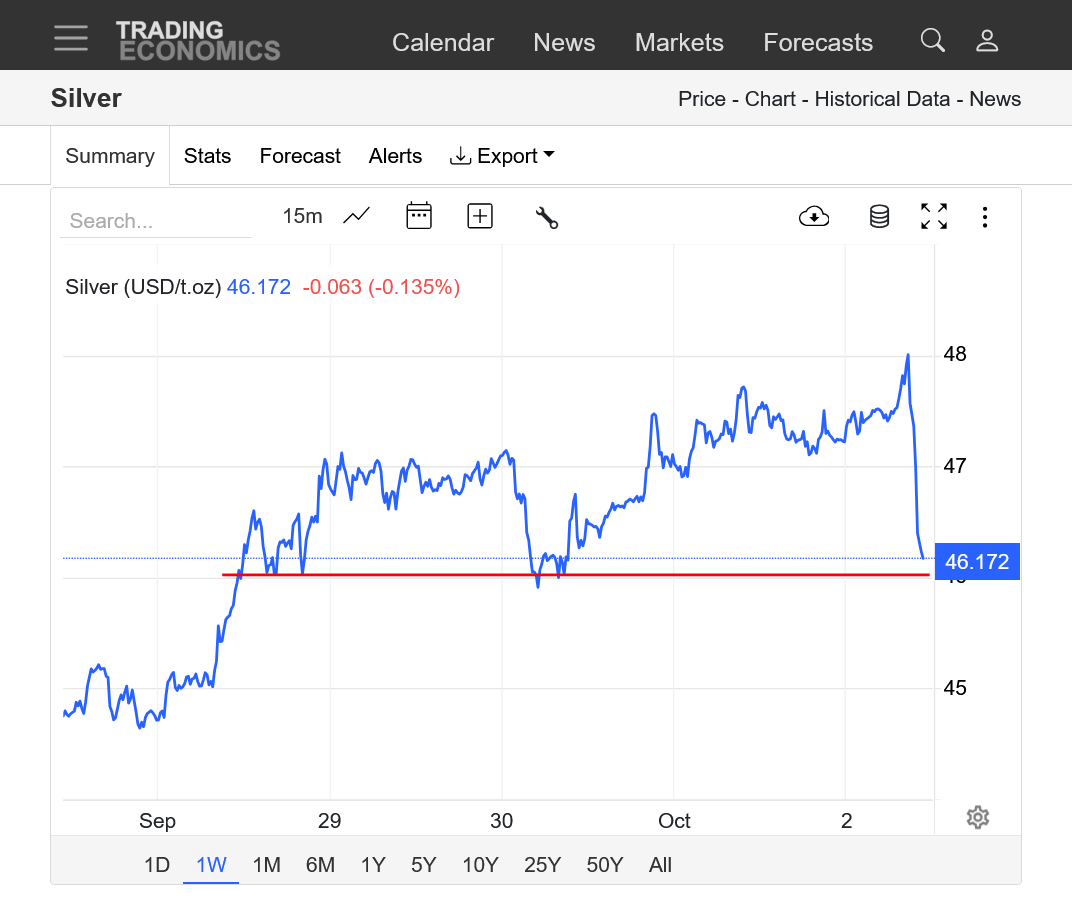
We reversed up with fresh buying kicking in again just ABOVE the key support identified yesterday by the red line.
Even higher highs look likely now but in this extremely volatile, often news impacted environment anything is possible............which actually is what happens when prices of anything are at historic highs.
Supplies are not meeting increasing demand. The saying you've heard before "The cure for high prices..............IS HIGH PRICES" means that these higher prices will do 2 things.
1. Provide financial incentive for producers to find/mine more silver to INCREASE SUPPLY.
2. Disincentivize users of silver to buy because the cost is excessive to DECREASE DEMAND.
In theory, these 2 factors eventually balance the demand/supply dynamics but some markets are less elastic than others and take time to resolve, even extreme imbalances. I am not real familiar with the silver market but record highs are incentive to learn more!
+++++++++++++++++++
Gold poised to break thru the highs on the chart below based just on past behavior and disregarding any short term potential double top formation from the red line.
https://tradingeconomics.com/commodity/gold
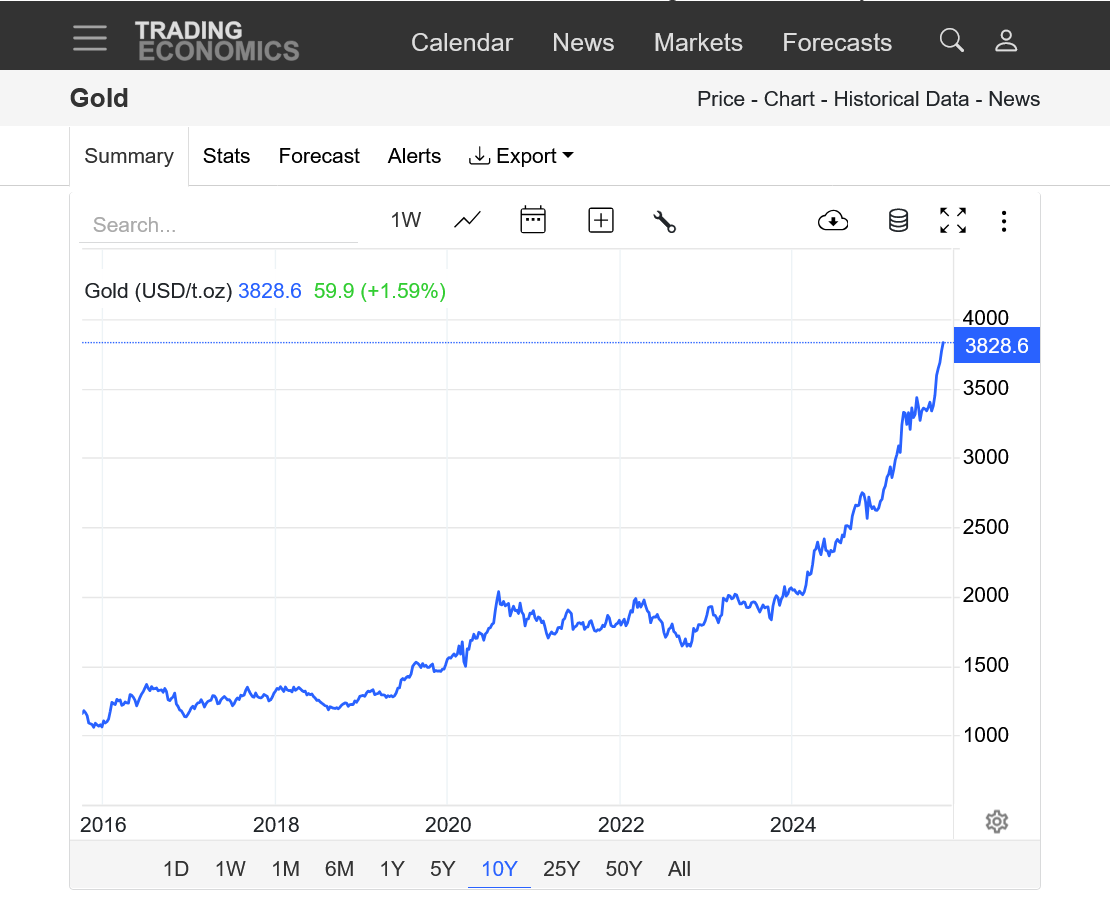
Incredible parabolic/exponential move up! Steepening uptrend slope. 3-4 times higher price compared to a decade ago.
https://tradingeconomics.com/commodity/gold
+++++
Same thing with silver! WOW!
https://tradingeconomics.com/commodity/silver