
Previous thread:
USDA May 12, 2025
62 responses |
Started by metmike - May 12, 2025, 11:48 a.m.
https://www.marketforum.com/forum/topic/111784/
+++++++++++++++++
Today's latest grains weather:
By metmike - June 11, 2025, 8:19 a.m.
++++++++++++++++++++++
Re: Re: Re: Re: USDA May 12, 2025
By metmike - June 11, 2025, 2:33 p.m.
All the weather :
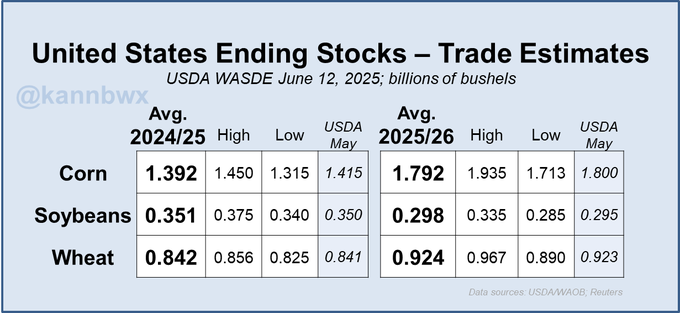
Analysts think old-crop U.S. #corn ending stocks could dip below 1.4 bbu on Thursday, though #soybeans & #wheat are pegged mostly steady. Trade is likely looking for a boost to old-crop corn exports due to the brisk sales and export paces.
++++++++++++++++++
The trade is not anticipating bullish numbers for global new-crop ending stocks on Thursday. A slight trim in U.S. #corn stocks could be offset by a bigger Brazilian crop.
++++++++++++++++
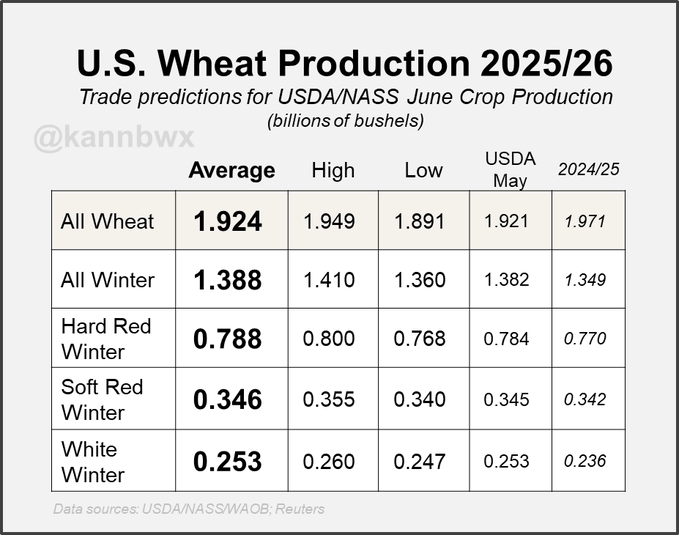
Will the recent rise in U.S. winter #wheat ratings boost the crop size? Average trade estimates don't really seem to think so. Last month, the 2025/26 wheat crop came in at the top end of trade expectations.
US #ethanol production last week hit an all-time high for any week of 1.12 million barrels per day. Implied usage over the last four weeks also hit record highs, driving ethanol stocks to a 23-week low.
Matt is in today:
June 11, 2025: Drought Checkboxes | Bermuda High | Southeast Ridge | Active Stormy Pattern
https://www.youtube.com/watch?v=dU15yrQAUc0
https://www.youtube.com/watch?v=_7Enkhef-o8
++++++++++++++
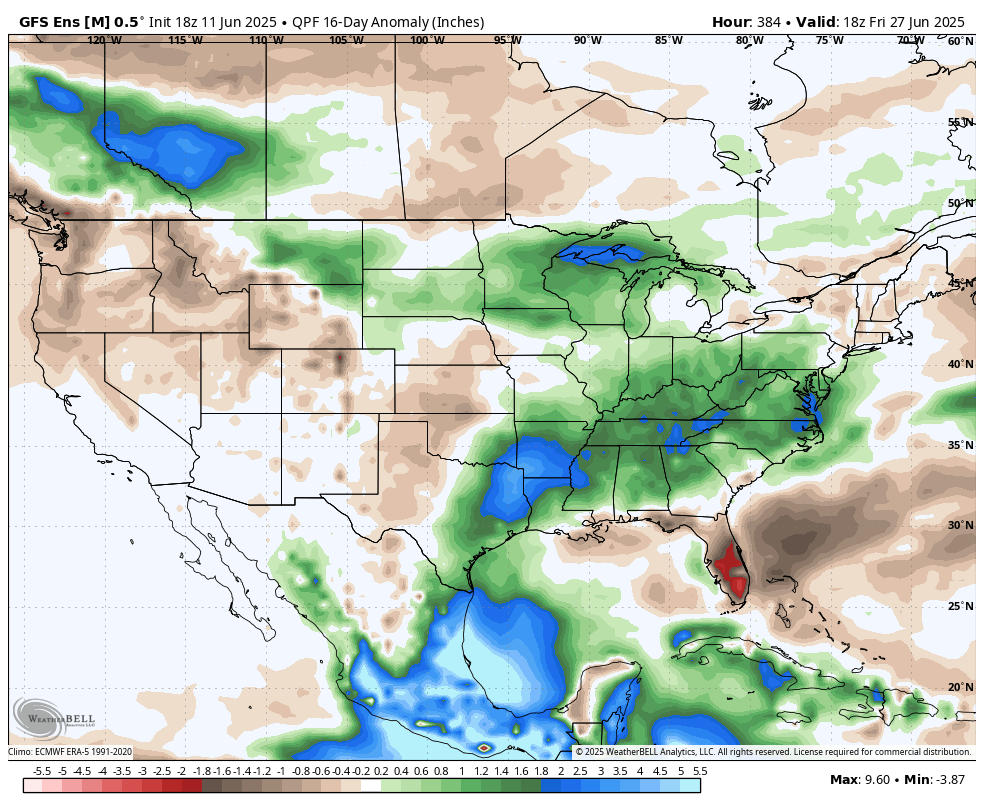
Just out 18z GEFS precip the next 384 hours. Still bearish.
Total 2 week rains from the just out 6z GEFS. Bright blue is 2"+ which is everywhere. First shade of purple is 3+ inches. 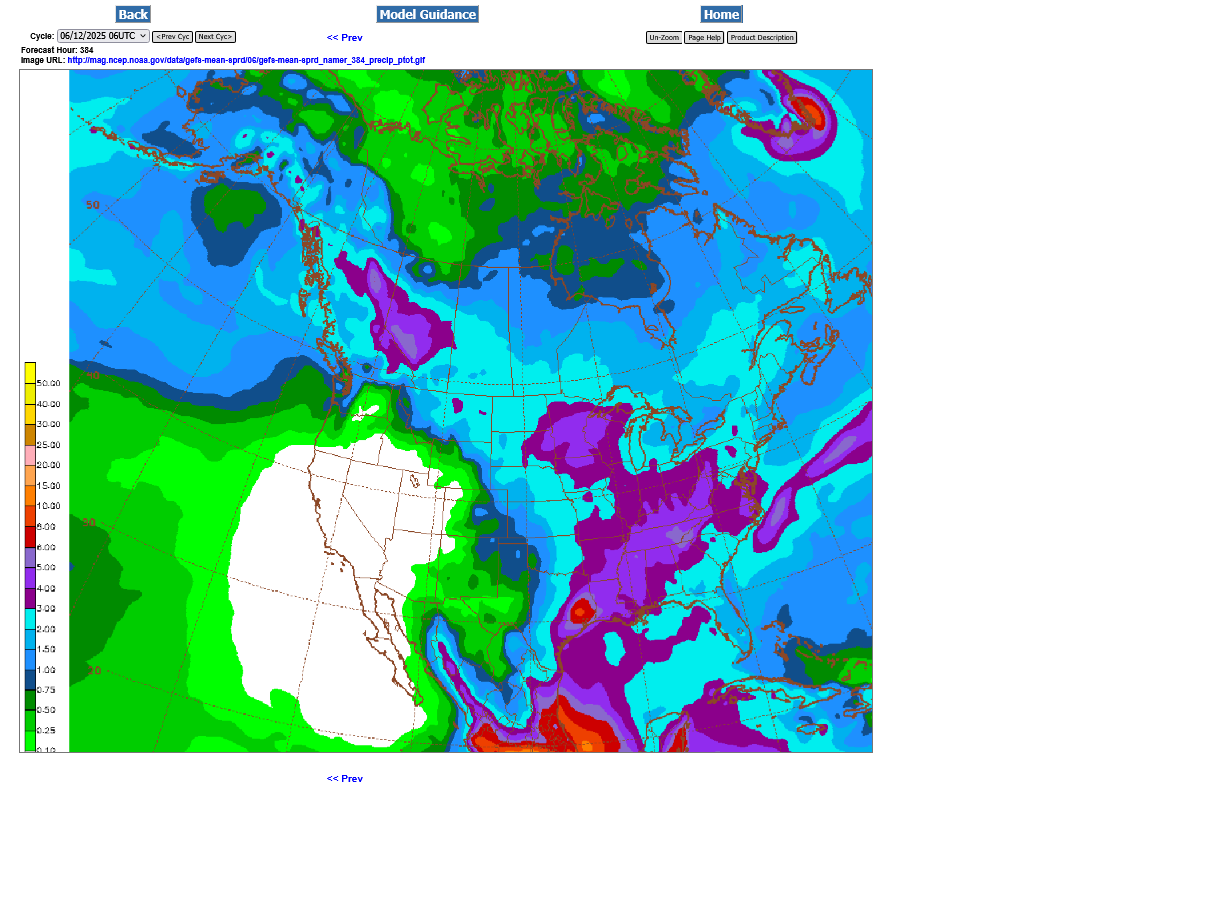
Compared to average below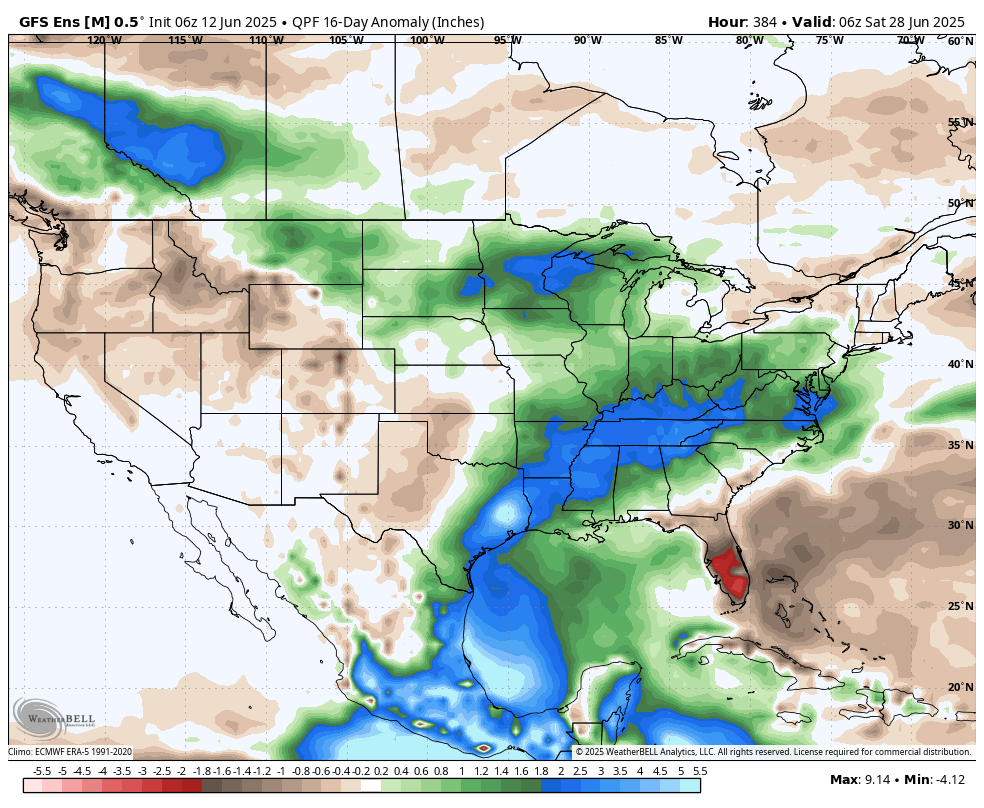
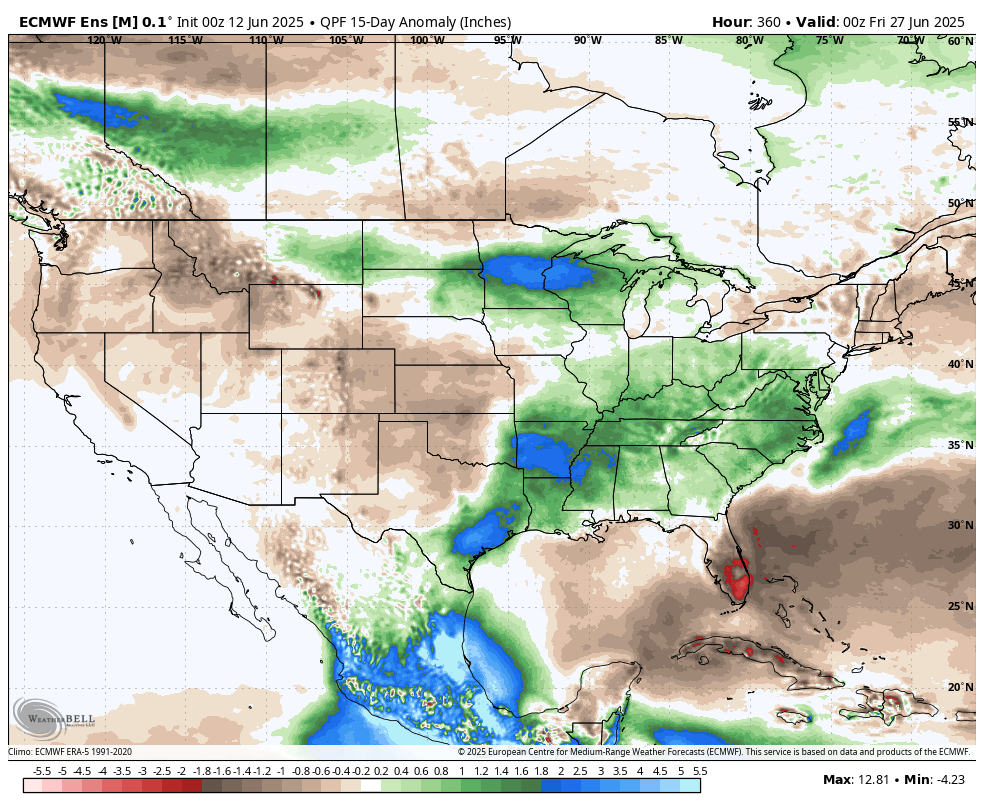
Last 0z European model vs average below: Much drier but still not dry.
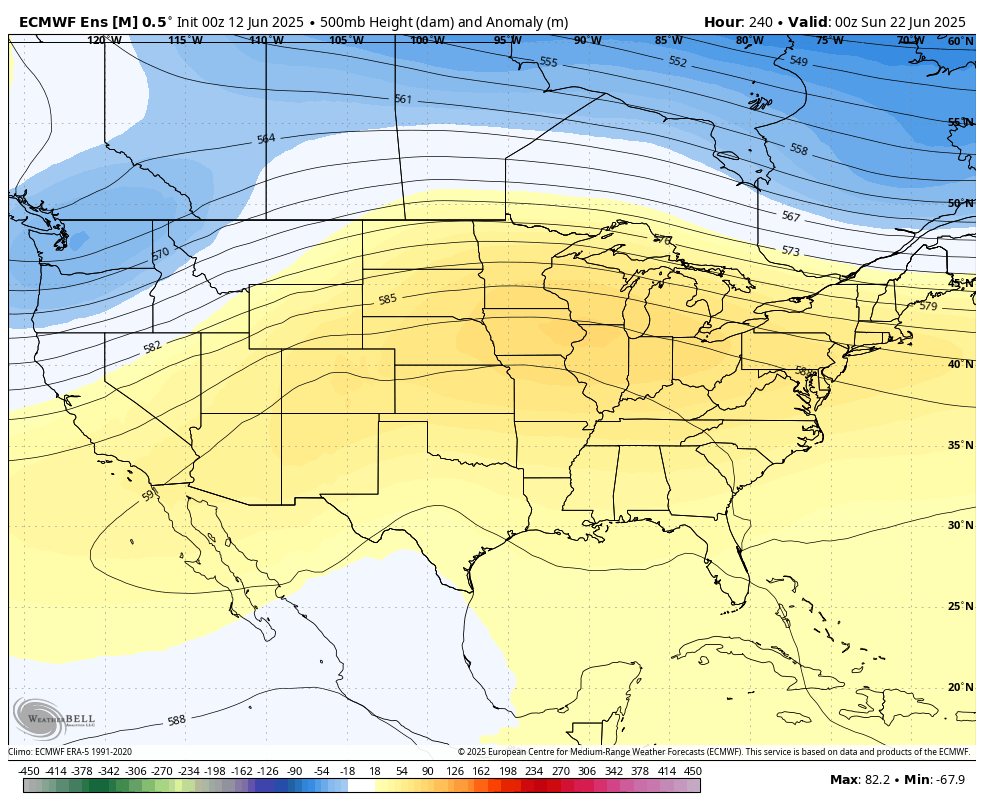
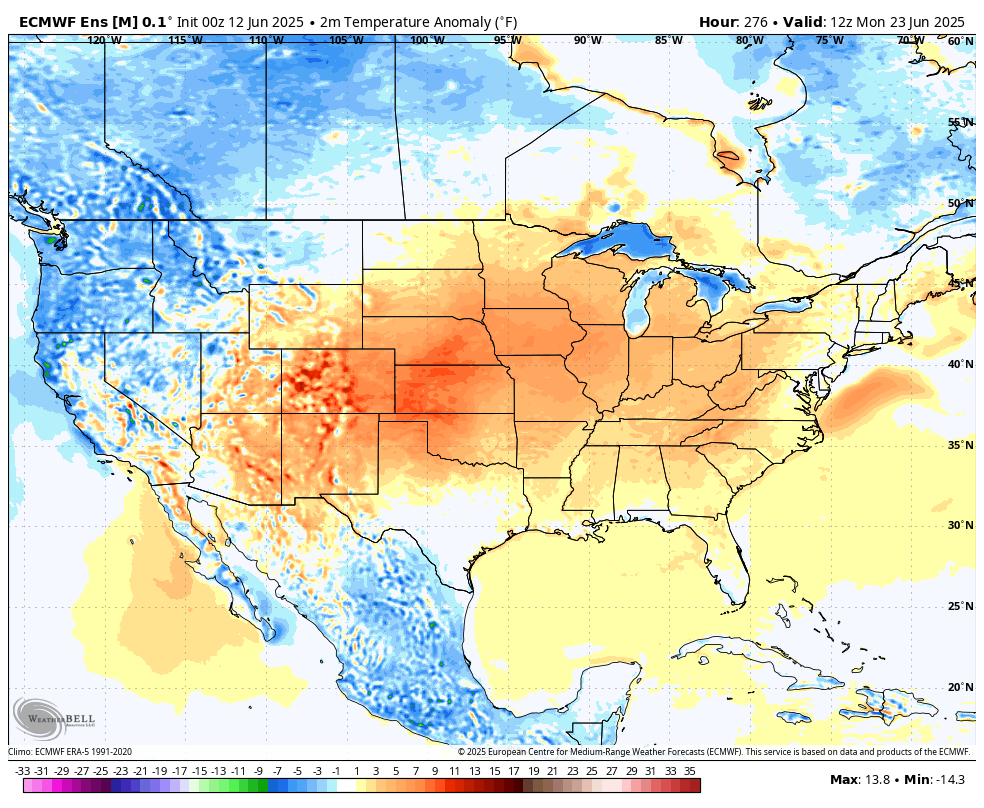
1. This is the HUGE upper level heat ridge on day 10, with height anomalies. This may shut down the rains underneath the dome with ring of fire perturbations coming around the periphery.
2. Below that are temperature anomalies.
There's a chance for enough warm air aloft from the dome to cap a huge area underneath it that exceeds expectations. This is NOT the type of weather pattern we prefer for growing crops.
Always very important are rains the next week. This map constantly updates vs the frozen images above.
7 Day Total precipitation below:
http://www.wpc.ncep.noaa.govcdx /qpf/p168i.gif?1530796126

All the constantly updated weather:
11 am is the USDA.
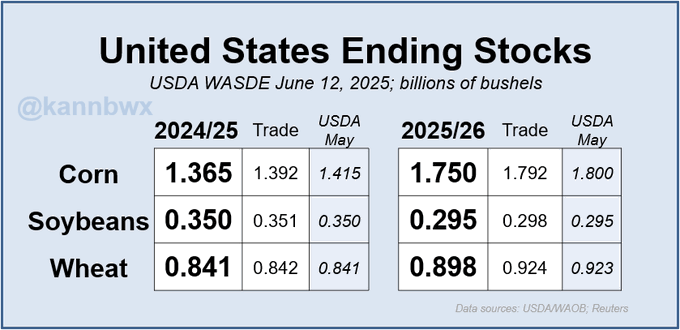
US #corn stocks come in below expectations on a boost to old-crop exports. No changes for #soybeans, but new-crop #wheat exports were increased, thus lowering stocks.
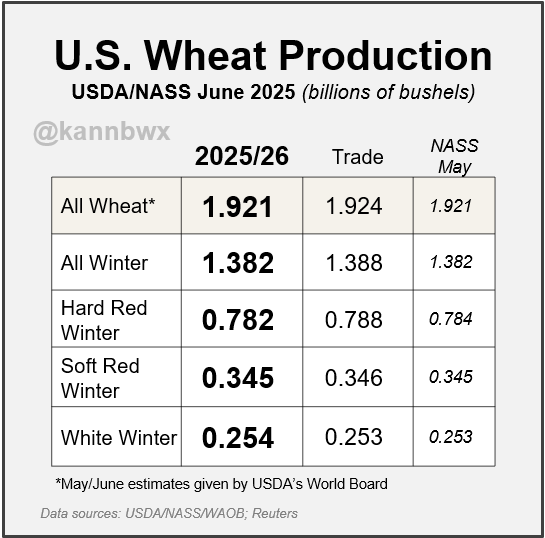
Virtually no change on 2025/26 US #wheat production this month, which is still largely driven by the winter wheat estimates. NASS will add its spring and durum wheat forecasts to the mix next month, which could shake things up.
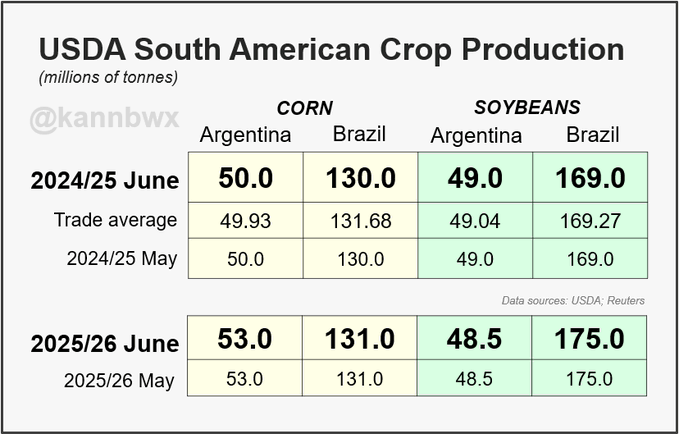
USDA leaves South American corn and soybean production unchanged from last month on all fronts. Fun fact: Conab's estimate for Brazil's 24/25 soybean crop is now higher than USDA's.
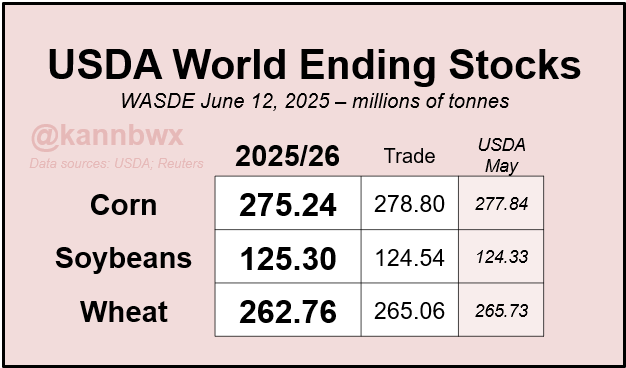
World #wheat stocks fall from last month on higher exports and lower old-crop Russian supply. #Corn stocks are below expectations and last month due to a reduction in old-crop supply. #Soybeans are up from last month on reduced old-crop crush in China.
metmike: USDA must be assuming that the tariffs will be hurting our exports in making such a low forecast!
As of June 5, US #corn export sales for 2024/25 covered 98% of USDA's brand-new export target of 2.65 billion bushels. In the last 18 years, there were 8 where coverage by this point exceeded 95%. Seven of those 8 saw bigger final exports than what USDA estimated in June.
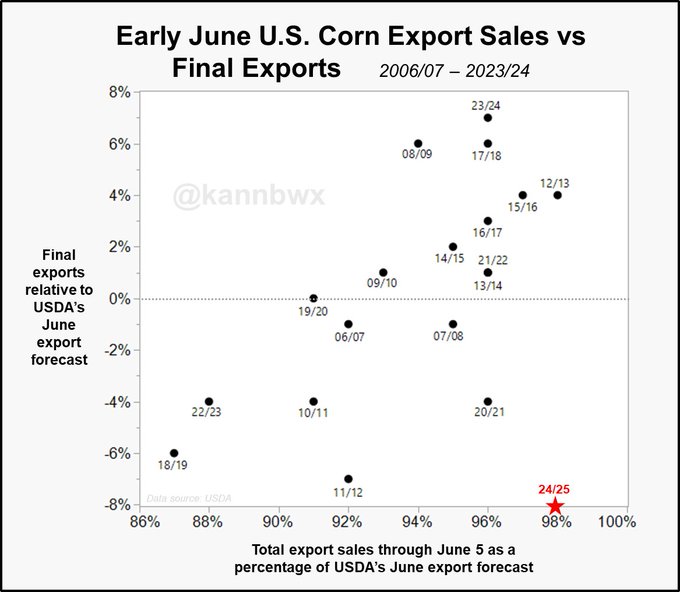
Will the huge export volume be limiting? The 2020/21 outlier might raise that concern, but there isn't necessarily strong evidence to support it. Exports exceeded 2.2 bln bu in 6 of the last 18 years. Final exports were lower than the June estimate twice (07/08, 20/21).
Exports exceeded 2.2 bln bu in 6 of the last 18 years. Final exports were lower than the June estimate twice (07/08, 20/21).
Heeeeeere's Eric:
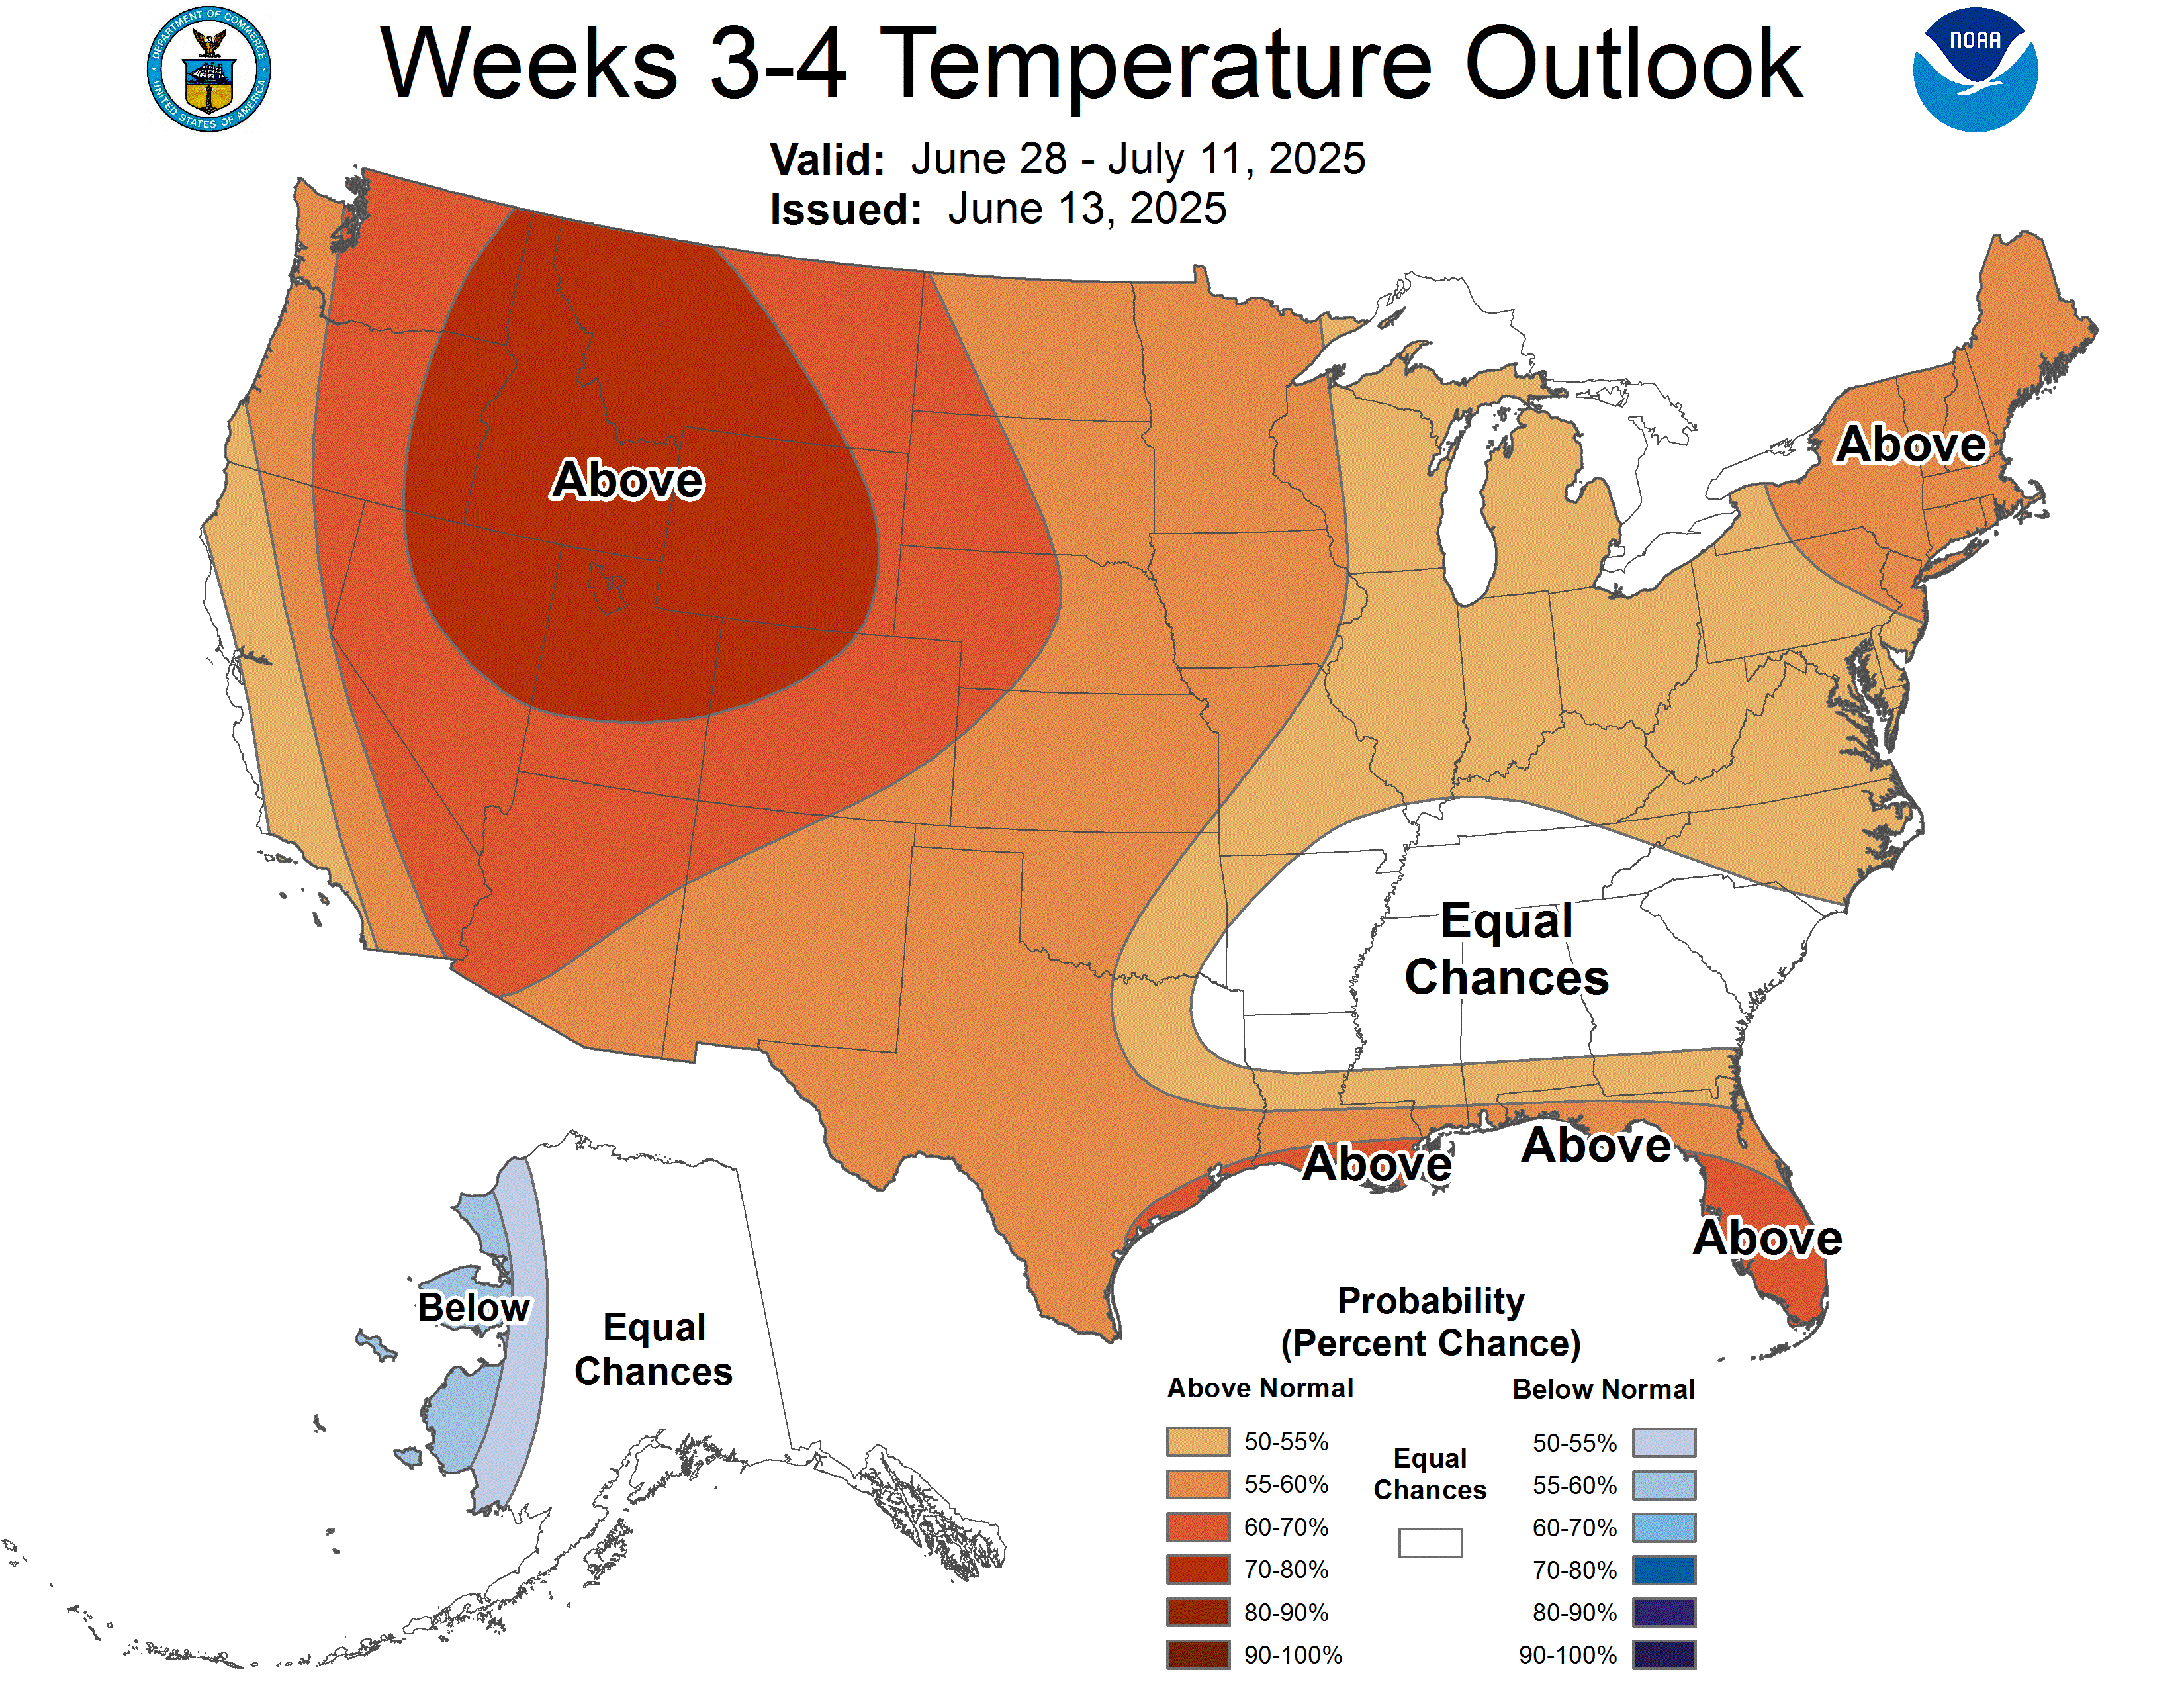
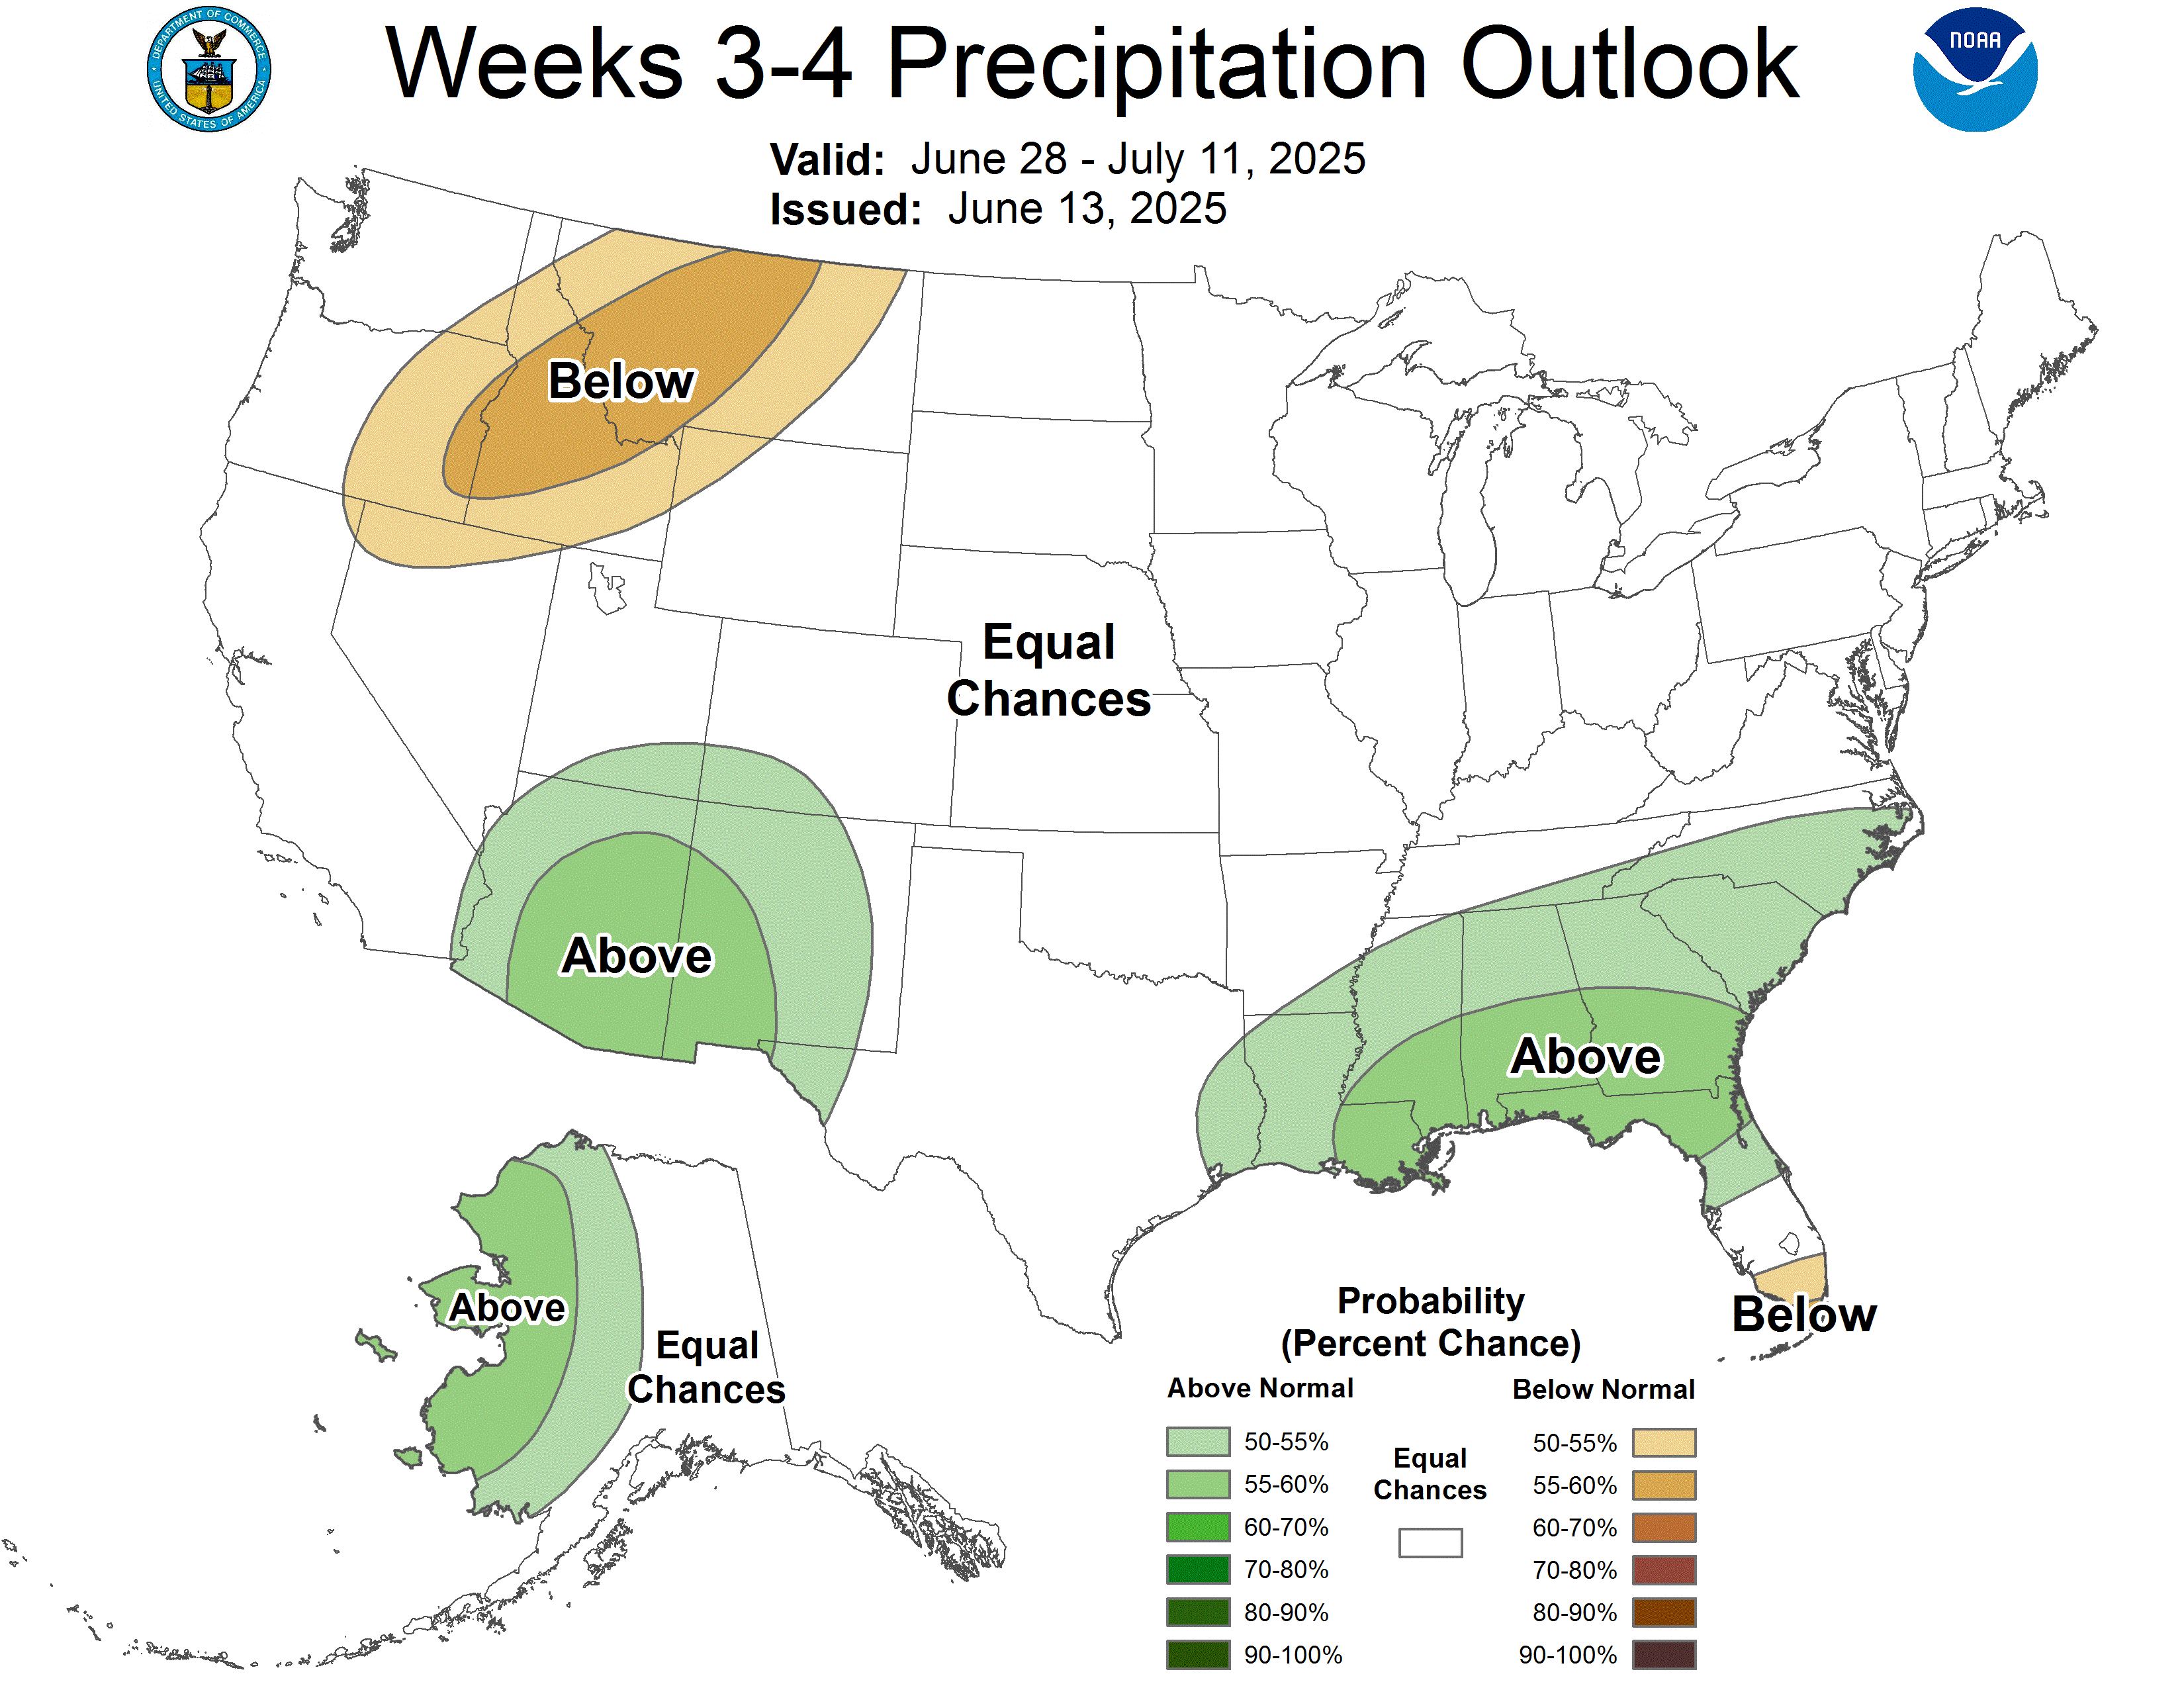
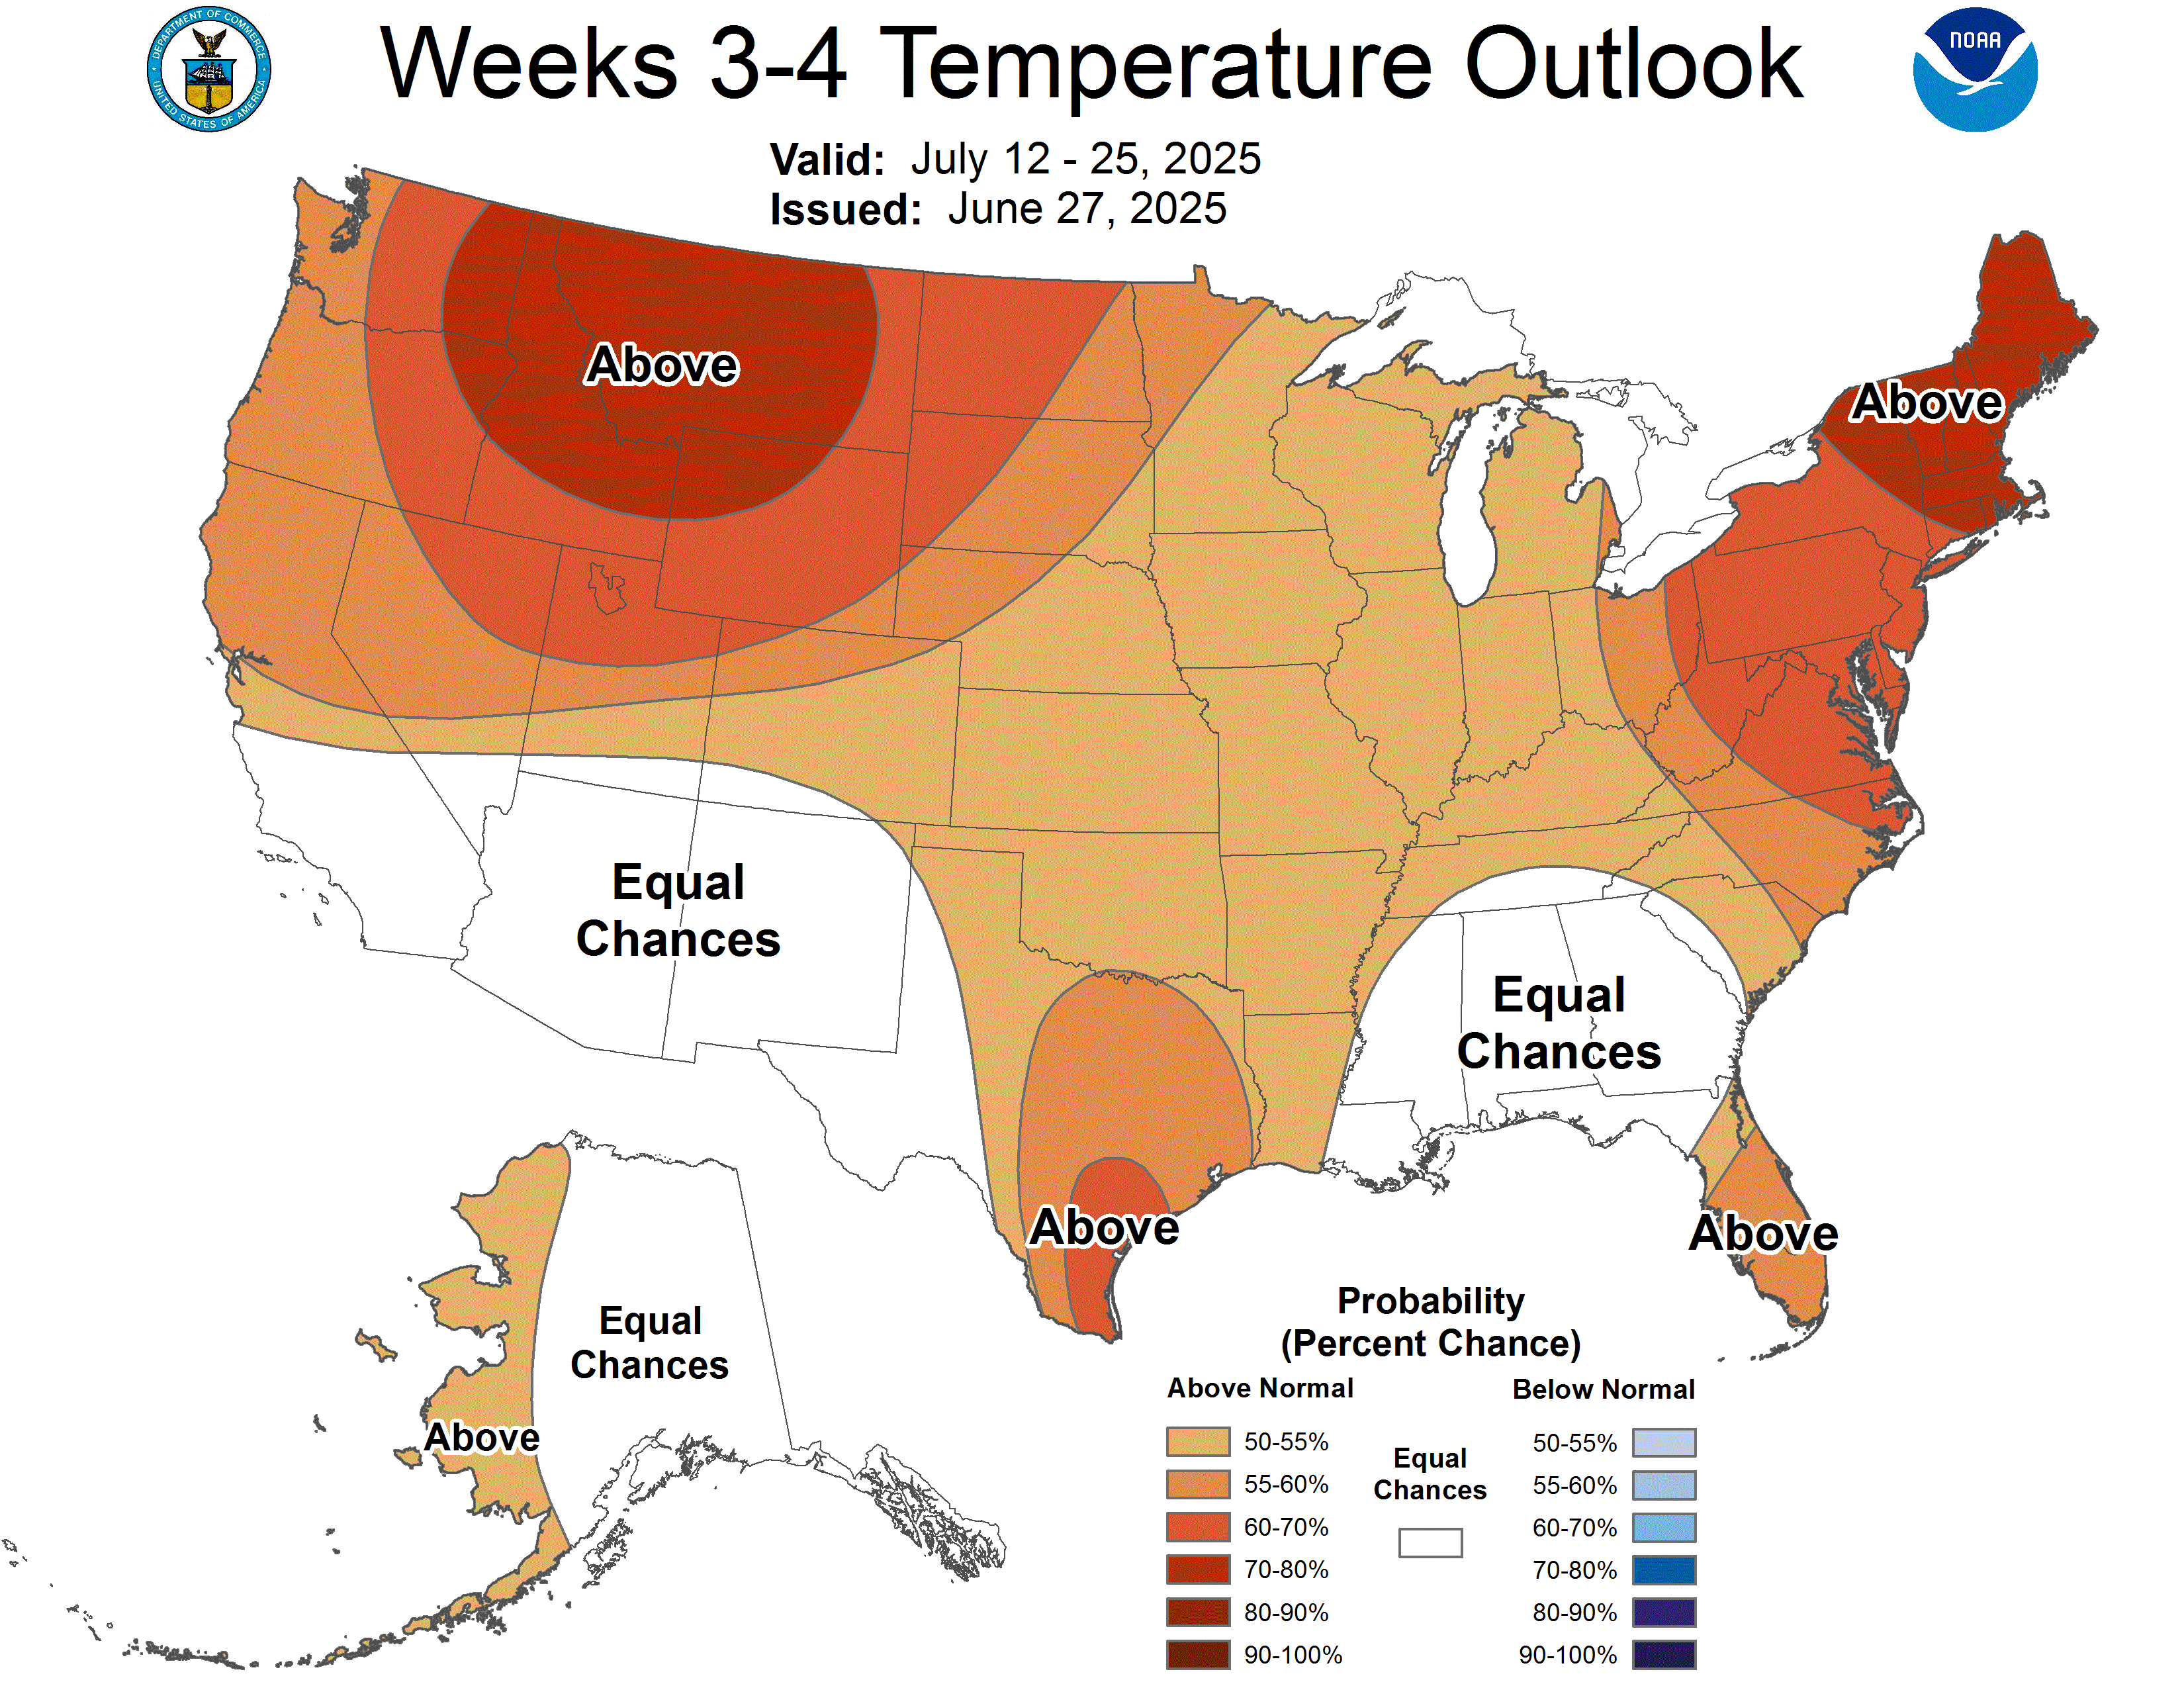
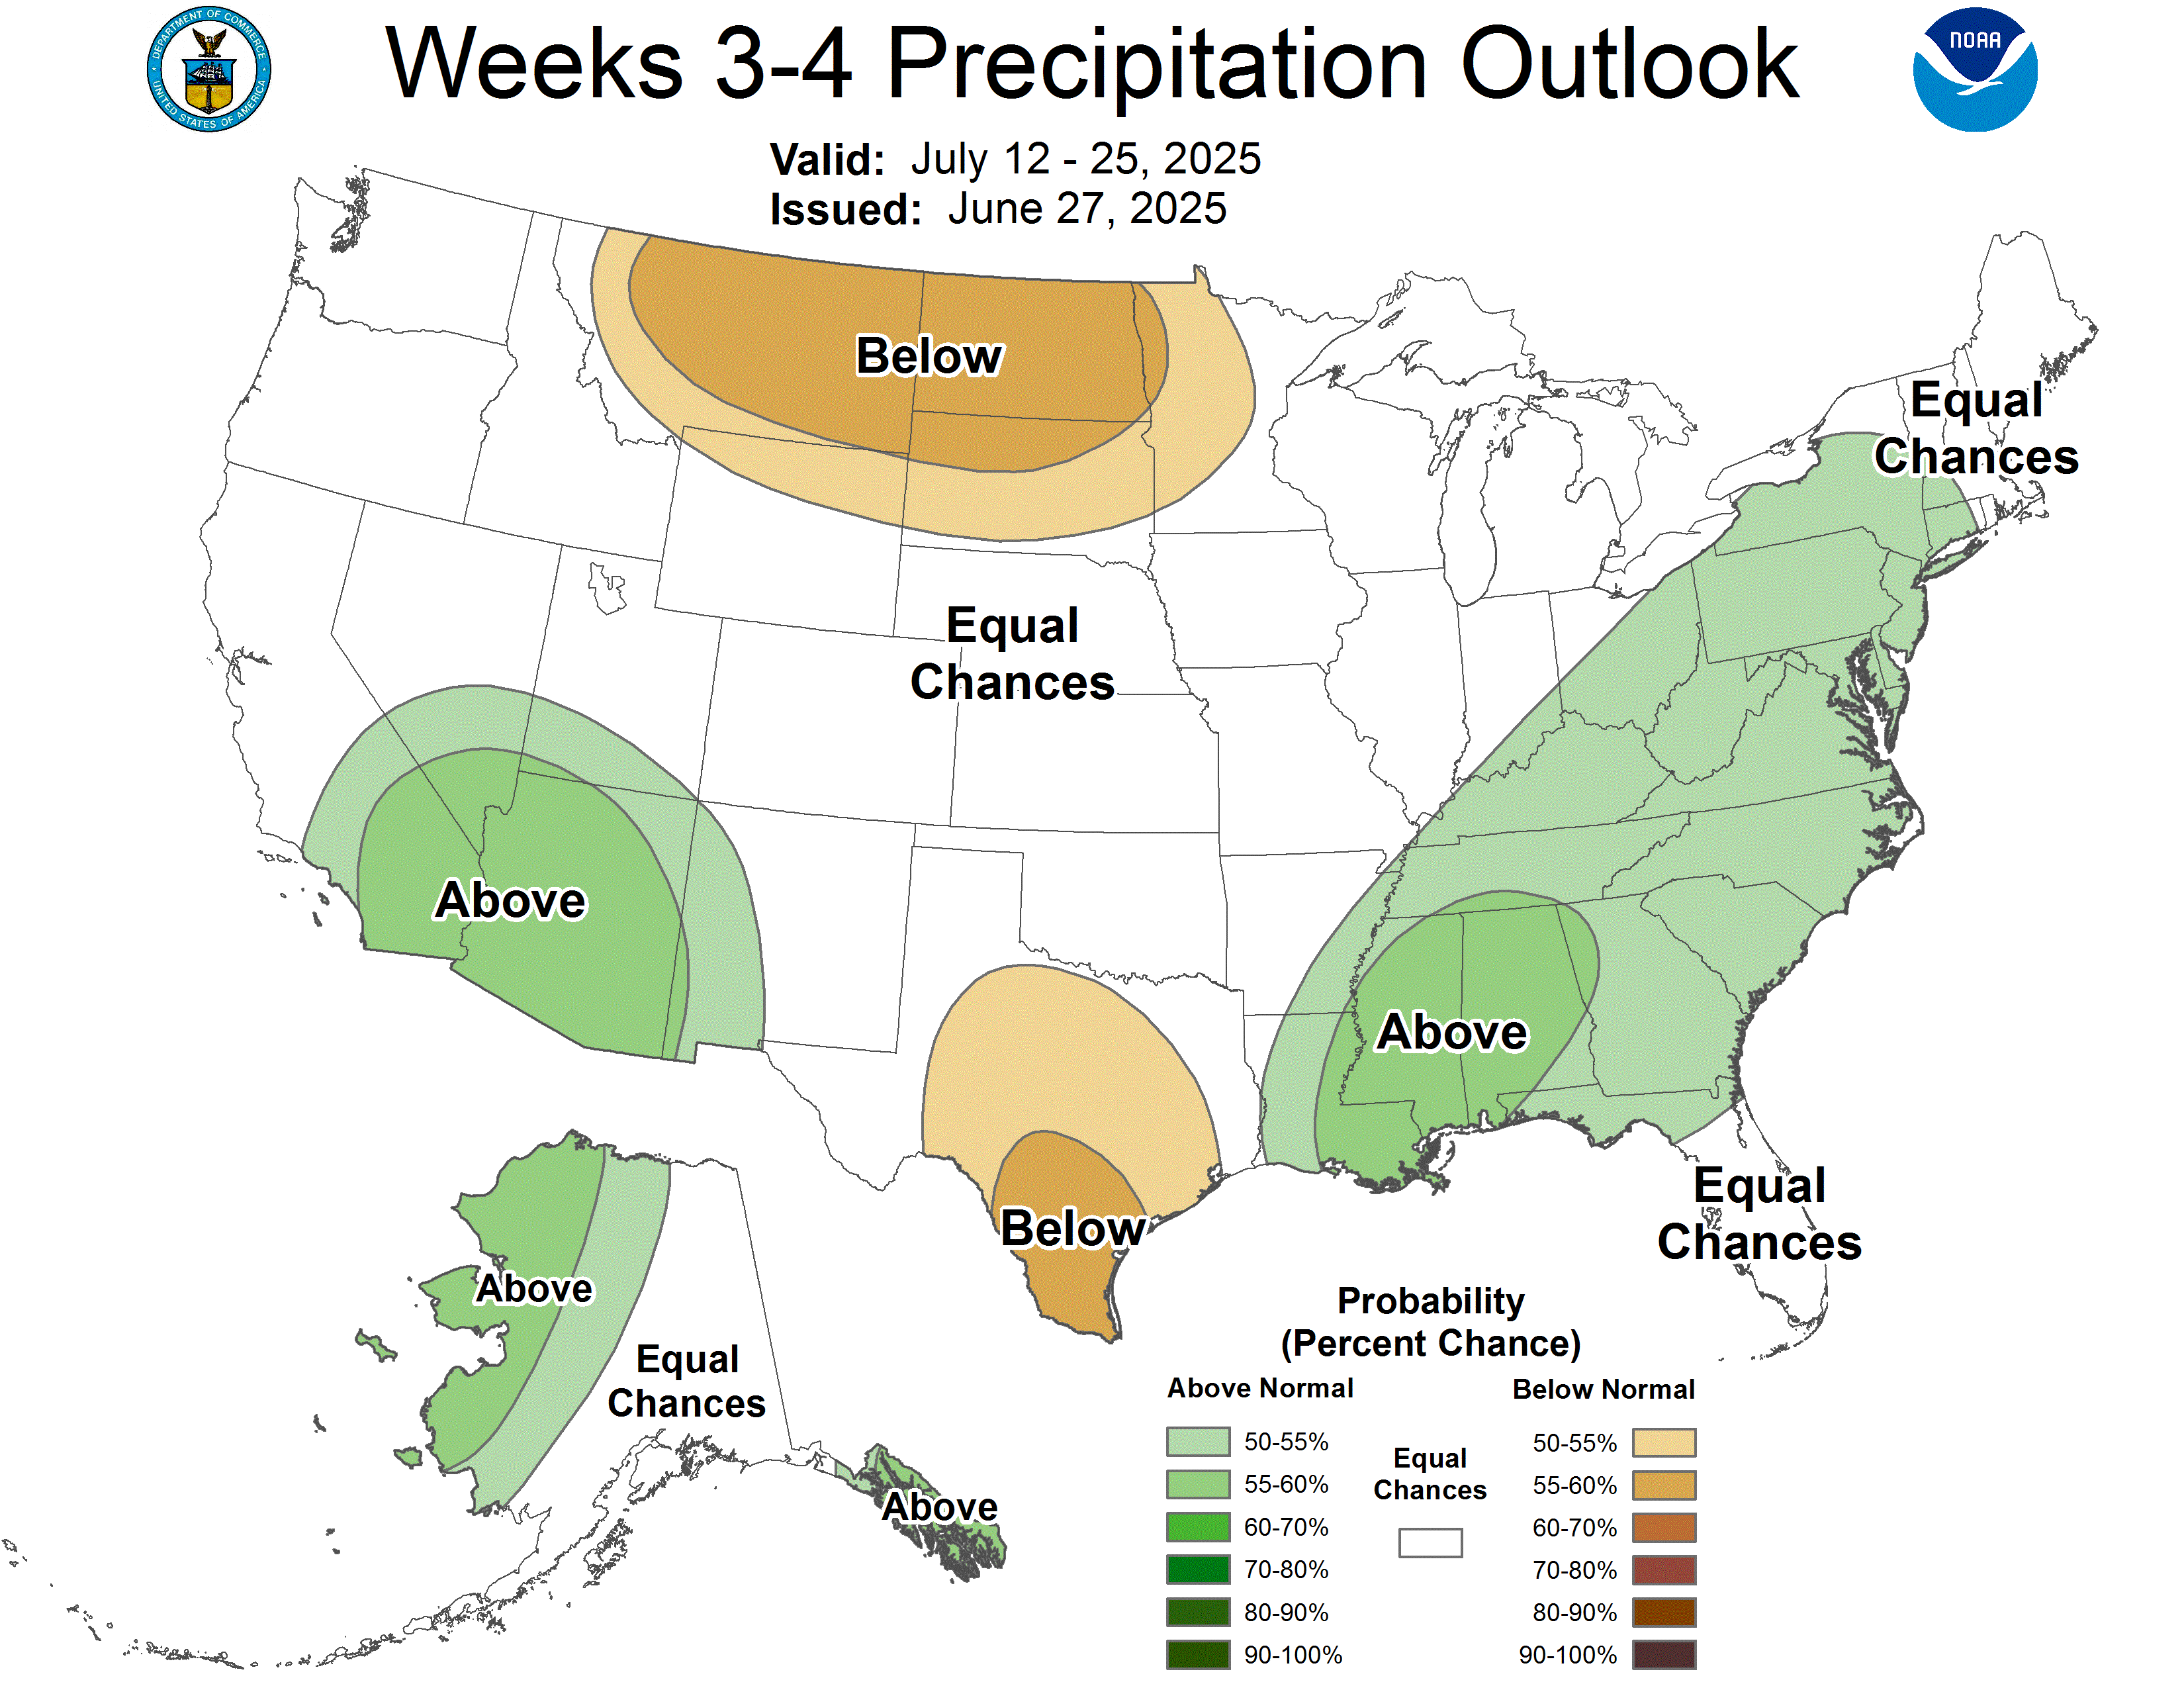
Low skill forecast, weeks 3-4. Just updated here on 6-13-25.
I agree pretty much on the temps. Intense heat West, spilling into the Plains.
On the precip. I would decrease amounts in the Plains to possibly the western Cornbelt.
Updated drought page:
https://www.marketforum.com/forum/topic/83844/#83853
This is why the rains in the next week will be appreciated in IA.
https://www.marketforum.com/forum/topic/83844/#83848
7 Day Total precipitation below:
http://www.wpc.ncep.noaa.govcdx /qpf/p168i.gif?1530796126

Late June and July are looking pretty hot still in the Plains, northwestward, with the heat spilling eastward at times. I think rains will start shutting down in the Plains/WCB in early July.
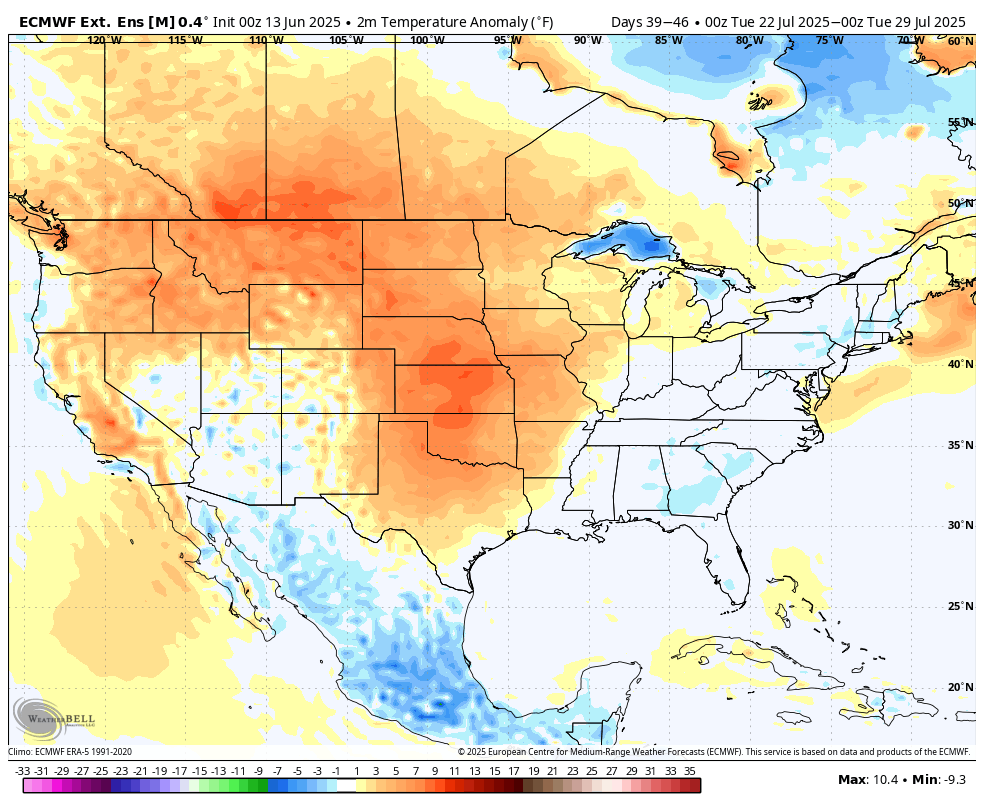
These are the temp anomalies in the last week of July below. Keep in mind that this is the hottest time of year, when its toughest to have positive temp anomalies. Highs will likely be hitting 100 degrees in the Plains!
Is this forecast 'enough' to buy, or at least cover shorts?
Hi tjc,
I dunno. Still too much rain between now and when the heat ridge shifts in and starts shutting down the rains in the Plains and WCB for ME to buy but that's the current weather trading set up.
Buy when enough rain comes out or has already fallen and then the dome is within 2 weeks and MORE impressive.
My biggest draw downs in the past were when I bought "too soon" and tried to hang on.
I can't afford that this time, so ideally what would be nice is that OVERNIGHT next week, all the models would simultaneously shift the dome into the Cornbelt earlier and stronger to provide a definitive weather trade buying signal.
The latest forecast below, with this much rain over IA, which NEEDS the rain is pretty short term bearish.
However the market knows much of this and is trading on weather for late June/July.
For example, if all the rains predicted below fall but the weather turns hot/dry for weeks after that it's very bullish.
Waiting until its obvious, means that everybody else knows too already and you will pay a hefty premium/higher prices for waiting until the early birds are already long.
I know how much you love being an early bird, tjc and that's why you just asked that question!

7 Day Total precipitation below:
http://www.wpc.ncep.noaa.govcdx /qpf/p168i.gif?1530796126

All the constantly updated weather:
https://www.marketforum.com/forum/topic/83844/
I will have to add this to be completely transparent and honest to a trader like you tjc.
Trading will hopefully be my biggest source of income this year. I had an extensive discussion with Larry in the natural gas thread, earlier this month about how dang challenging it is to trade today compared to 2 decades ago because of the wild price gyrations and large trader algorithms. You know about this better than anybody.
This is a public forum called MarketForum. There aren't many posts outside of mine but we have many hundreds of regular readers and at times well over 1,000 readers.
I'm assuming with high confidence that some of them actually trade on a regular basis because the information and insights that I provide are so useful to traders.
With that being the case, although my MAIN priority to have this site is to share as much authentic, useful and positive information as possible as well as give others the opportunity to share their stuff, the one thing that I can't do is advertise when I am putting an order in or a position on BEFORE I put it in.
If I'm correct and I have a following, this will sabotage my effort to get the best price when I place that order.
You understand this but let me provide an example.
On Sunday, June 1, 2025 I bought the open of NGN at 3.501. It was the low of the week, so buying the open at the market was a smart move (unfortunately I got stopped out with a small gain that was too tight and bad choice).
If, early that afternoon I advertised what I was doing and the reasoning(VERY BULLISH-MUCH HOTTER WEATHER). Anybody else that trades ng and follows me would have likely wanted to do the same thing. Buy natural gas on the Sunday Night open, just like me.
My order was actually to buy at 3.501 or better so I got REALLY lucky that it barely got filled as the low. If a couple of other traders wanted to buy the open like me and priced it higher(even though this was still around $600 above the previous close) I would have missed it.
If my order was, let's say 3.550 or higher and my bullish posting caused a couple of traders to buy the open, my price would NOT have been 3.501. They would have gobbled up some selling orders at 3.501 and possibly a bit higher with their higher bid than mine. I make no money from posting here but the last thing I want to do is cause my trading to suffer from worse fills.
When I have a position on, I'm also extremely stressed and trying to focus on every weather map of every model as the updates come in as well as tracking each CDD update for each period as it comes in as well as watching the live price constantly.
So for brief, key periods ahead of putting an order in and sometimes when the position is on, I can't be available to give traders here a heads up. Also, my last 6 positions were only on for minutes(because I messed up with a stop that was too close in 5 of those cases). Posting the position and bad stop placement would likely have messed people up.
I do enjoy it when others post what they will do and their positions and especially their set ups and strategies but with MY information, would strongly prefer people use it to decide for themselves how to apply it to their trading and not copy my actual trades.
I can be wrong about trades and was really wrong about my stops in June but I am almost always right about my weather analysis ON THAT DAY. On the next day, my updated weather analysis will hopefully have some improvements that make yesterday's forecast wrong(or not as good).
That's called using the scientific method and the exact reason that makes this so much fun! Changing dynamics and critical information that gets updated constantly. Don't get married to a weather forecast (or trading position). Every day, in fact every hour of every day, be looking for why you might be wrong as fresh/better information comes out.
Then be ready to acknowledge it and immediately adjust. Rarely boring and often powerful impacts.
I'm still not sure when the market will start reacting strongly to what looks to likely be a very stressful July.
UPDATE: I spent much of my time focusing on nat gas last week and after looking at the charts and grains, maybe the time to buy WAS LAST WEEK! Specifically on the Friday morning open!
Temps will be much above average in the Plains to WCB with high confidence and rain likely below average there with moderate confidence.
The ECB is likely to be closer to average for both rain and temps in July but leaning a bit hot and dry.
Maybe right now is the time to buy on the July forecast? Still a great deal of needed short term rains in the driest areas to offset that mentality but those will be long gone after a week of hot/dry. The news from the Middle East and Trumps tariffs provides unusual risks to any positions right now.
One thing I can say is that I'm NOT looking to sell with this set up unless the ridge/trough couplet shown below retrogrades westward by over 500 miles.
7 Day Total precipitation below:
http://www.wpc.ncep.noaa.govcdx /qpf/p168i.gif?1530796126

All the constantly updated weather:
https://www.marketforum.com/forum/topic/83844/
+++++++++++++++++++++++++
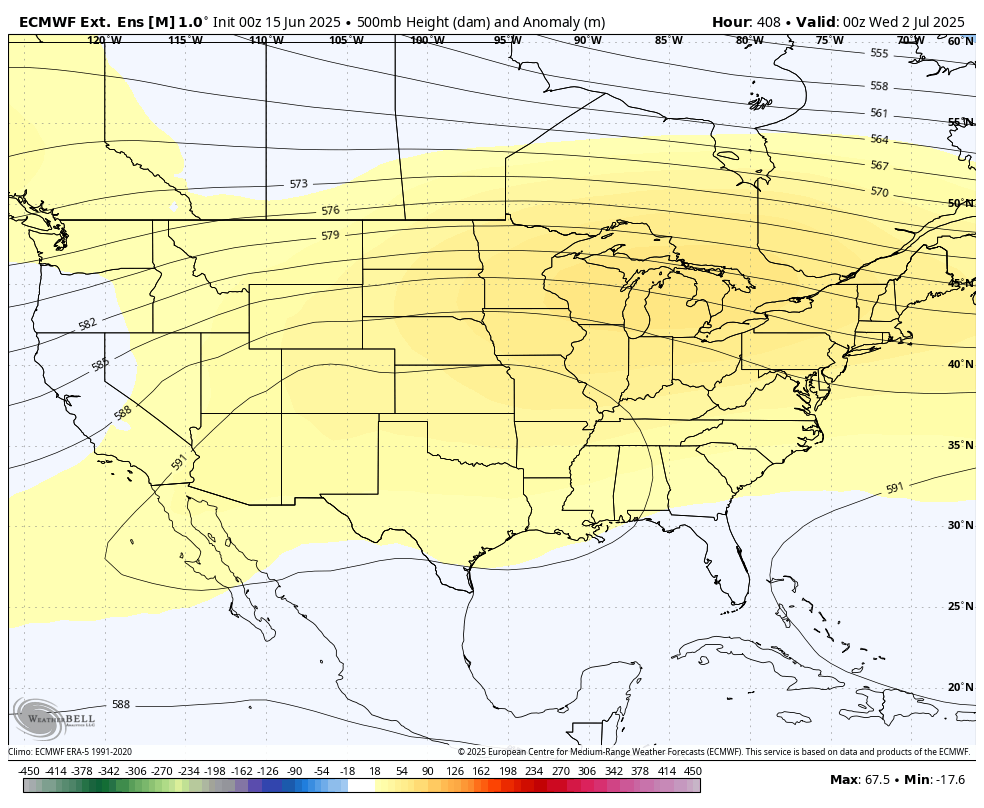
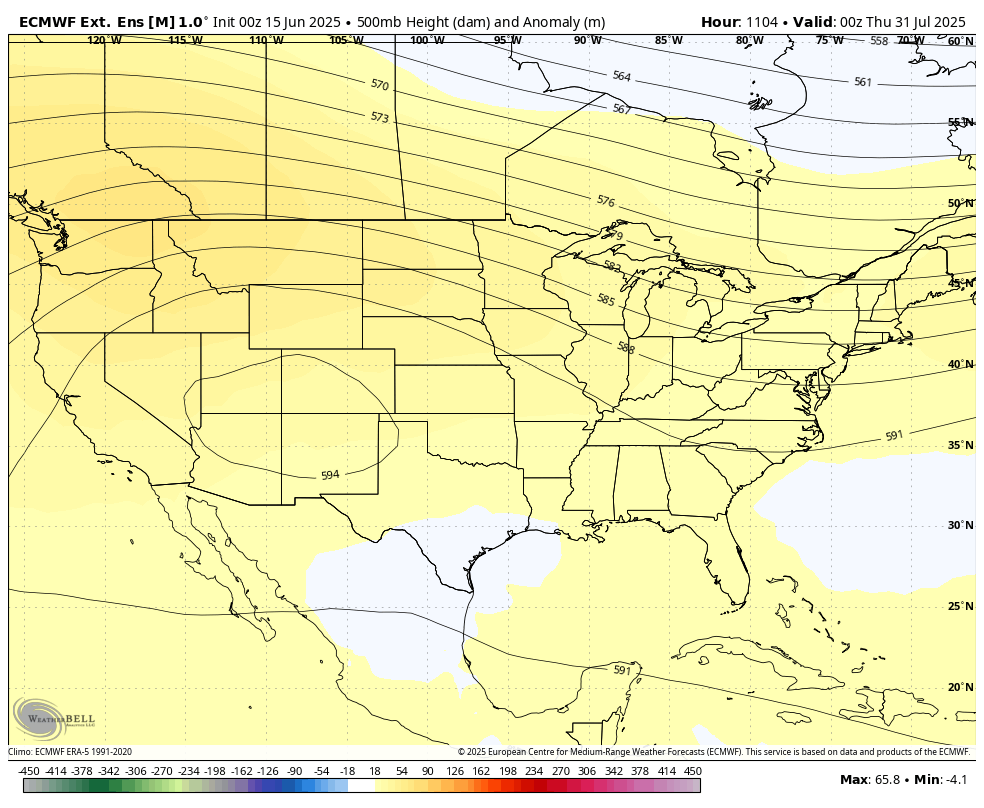
1. 500 mb map to start July with anomalies. Huge upper level ridge and positive anomalies. Widespread intense heat. How far north will the warm air aloft cap the air and defeat rain making??
2. 500 mb map to end July-upper level ridge backing up westward. Troughing in the East. Western half of the US will have the greatest heat. Troughing in the East. Temperatures may be closer to average along the East Coas
Beans spiked to +10c seconds after the unch opening but have backed off.
Corn to +2c but now is a bit lower. Wild trading week ahead!
The just out 18z GEFS is not as bullish as the previous runs!
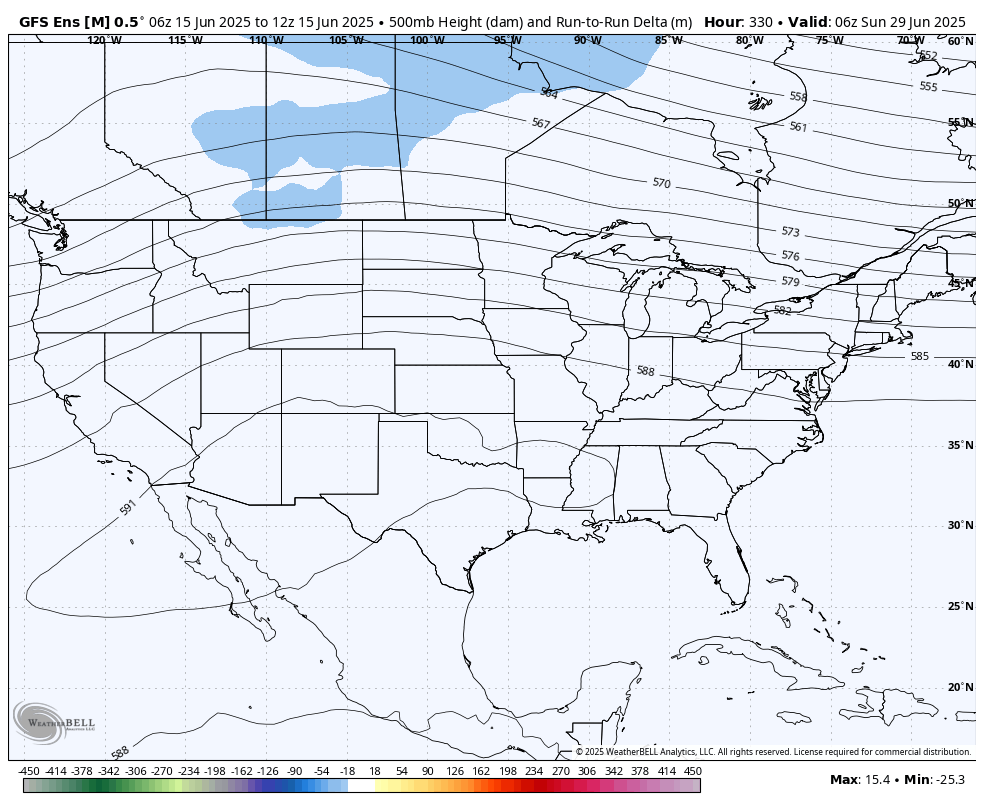
Late in the week 2 period the heat ridge backs way up to the Southwest and northwest flow strengthens across the Midwest. Colors are just the change in the anomalies from the previous run.
More troughing than the previous run in blue, stronger ridging than 6 hours earlier in yellow. It's just 1 run and might look different overnight. However, if this trend continued it would end up pretty bearish in the long run.
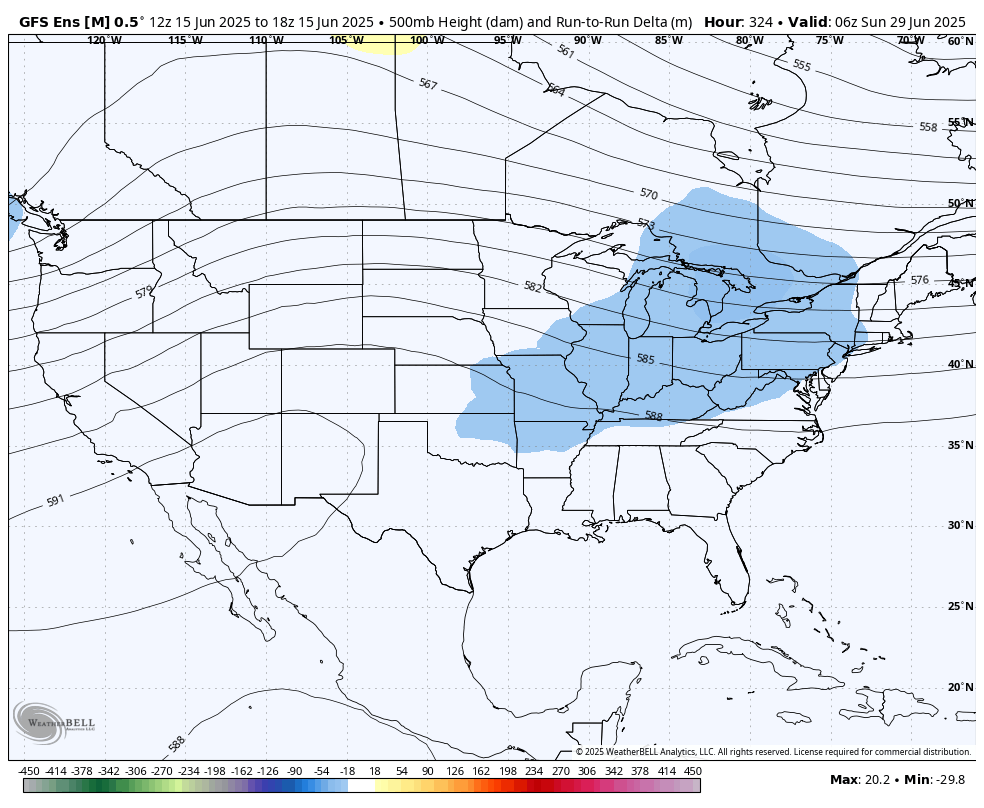
This was the previous 12z run below. Upper level ridge much stronger.
Latest 2 weeks rains from the just out 18z run below. More rain than 6 hours earlier
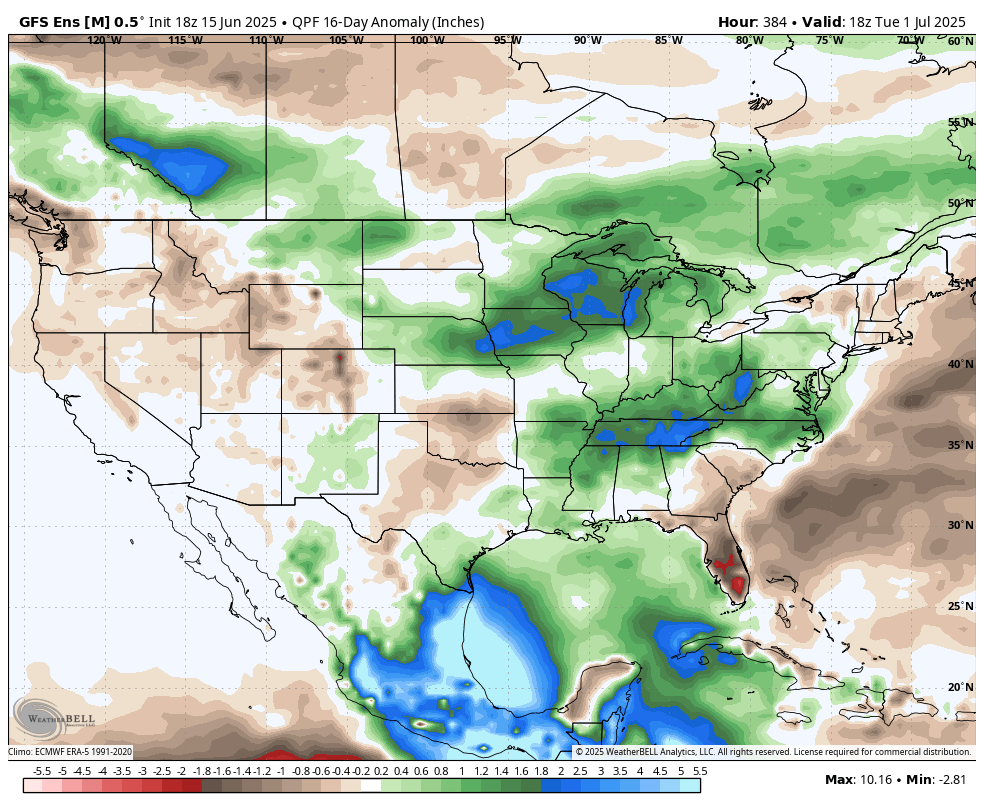
Previous 2 week rains from the 12z run below. The new run above is much wetter.
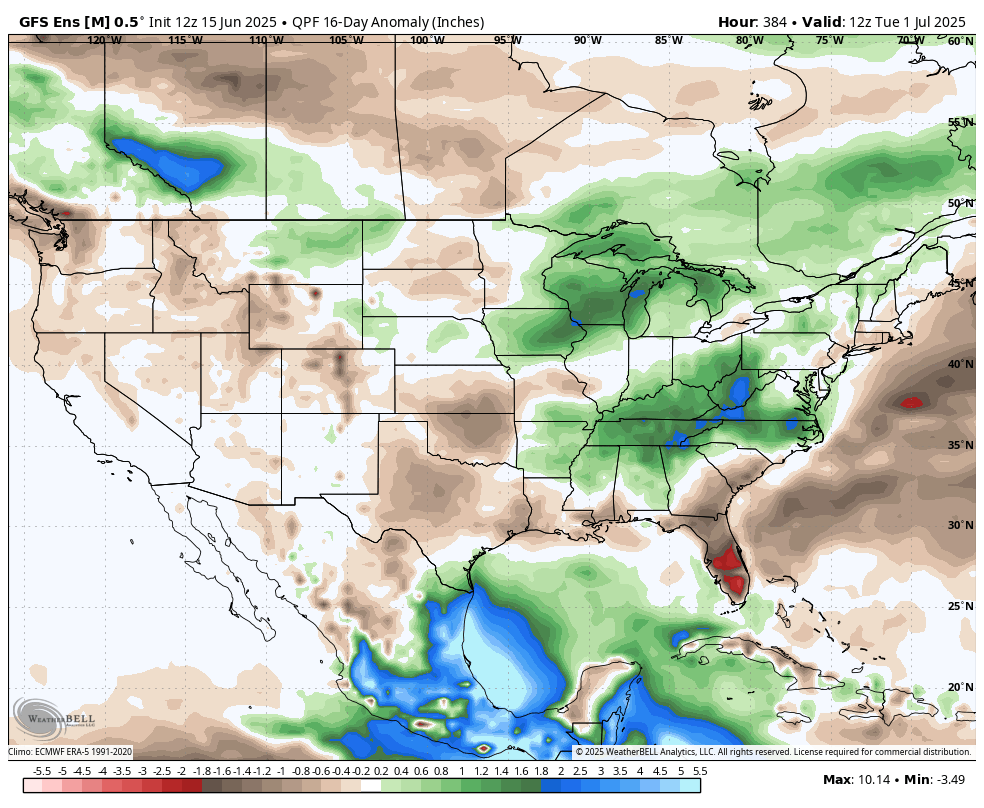
CZ now -2.5c
SX is now lower after the spike to +10c in the first minute.
Price charts in a minute.
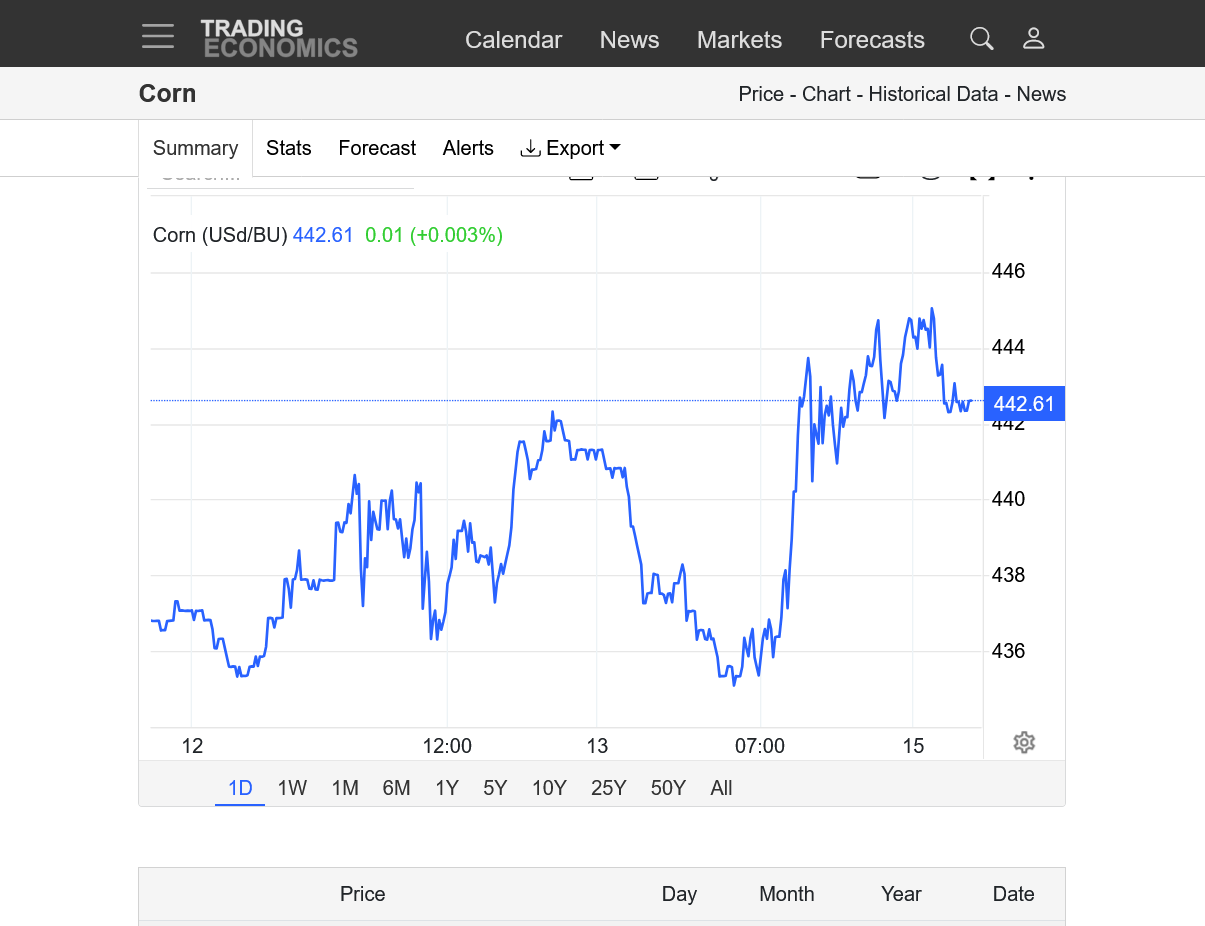
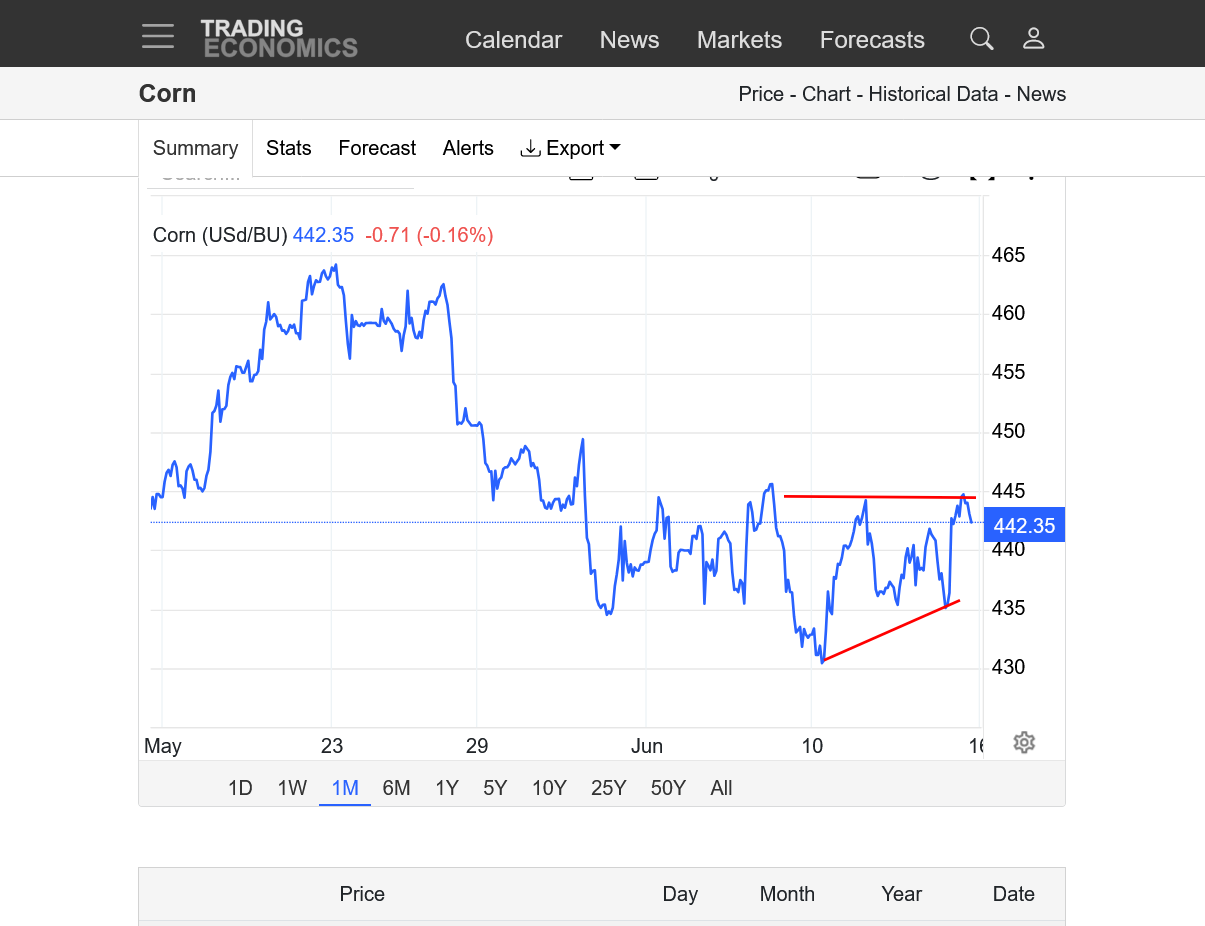
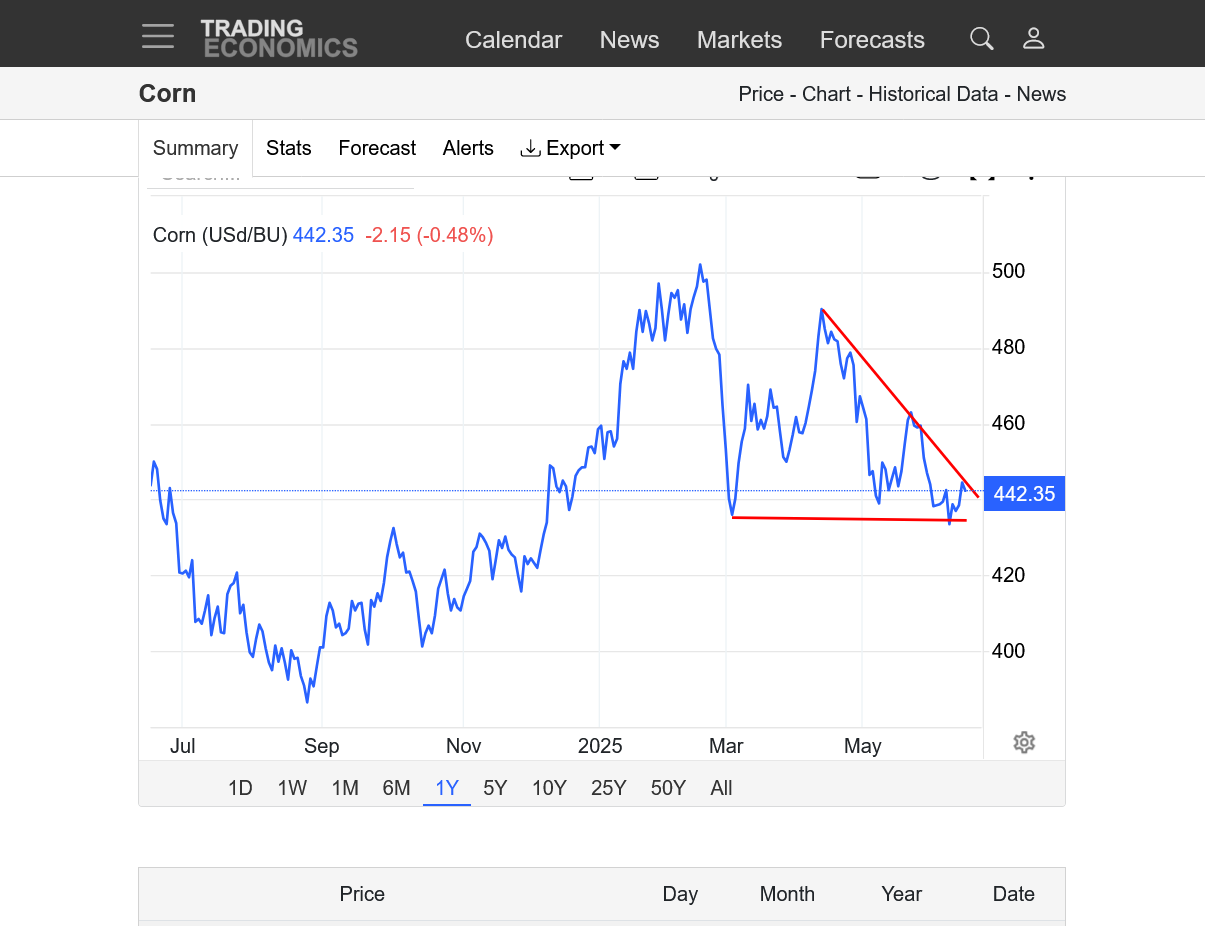
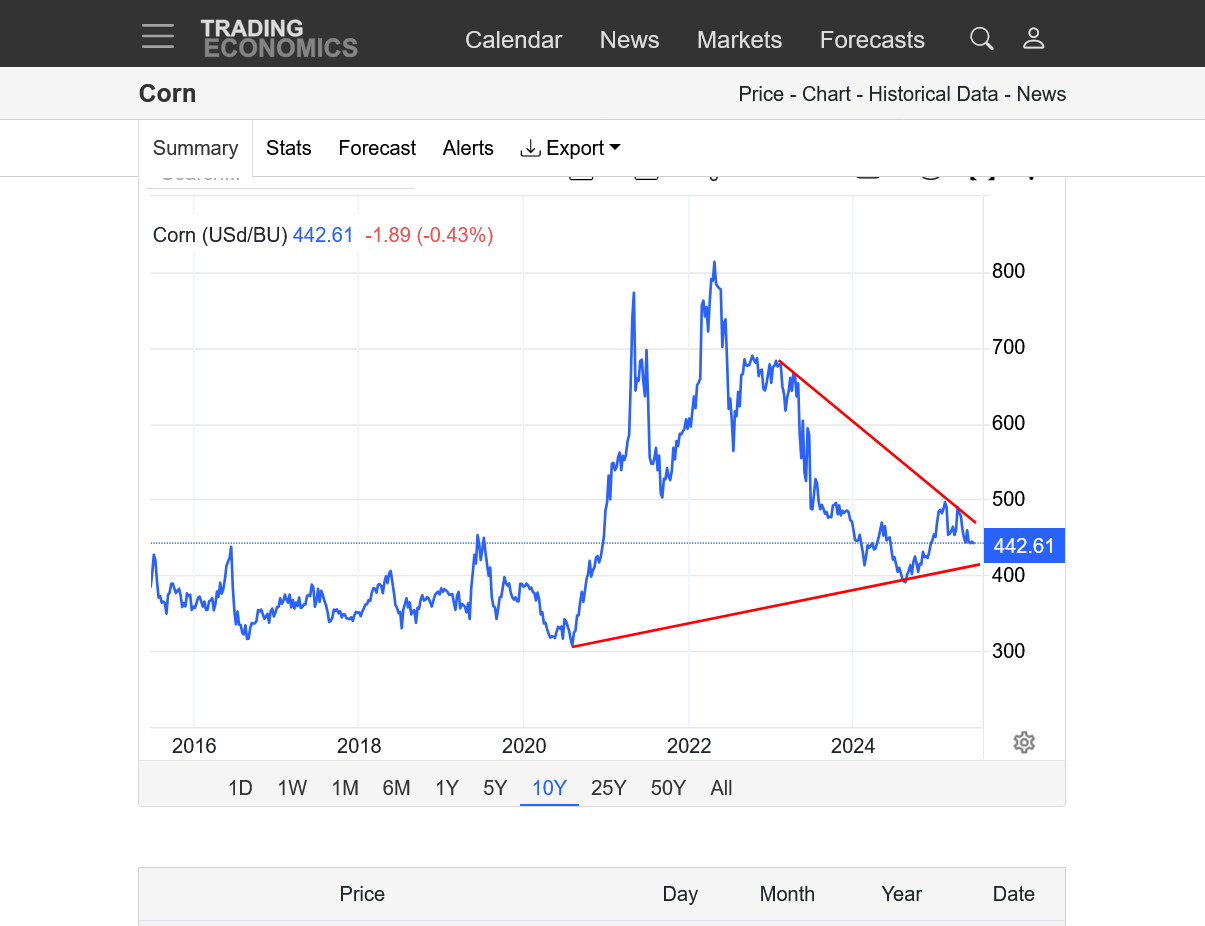
Corn
https://tradingeconomics.com/commodity/corn
1. 1 day-reversing lower this evening
2. 1 month-backing off of resistance after June 10 low and +15c rally
3. 1 year-descending triangle. support = 430 CN(June 10). resistance is tonight's high 446.5.
4. 10 years-symmetrical triangle-lower highs and higher lows. Break out coming soon.
+++++++++++
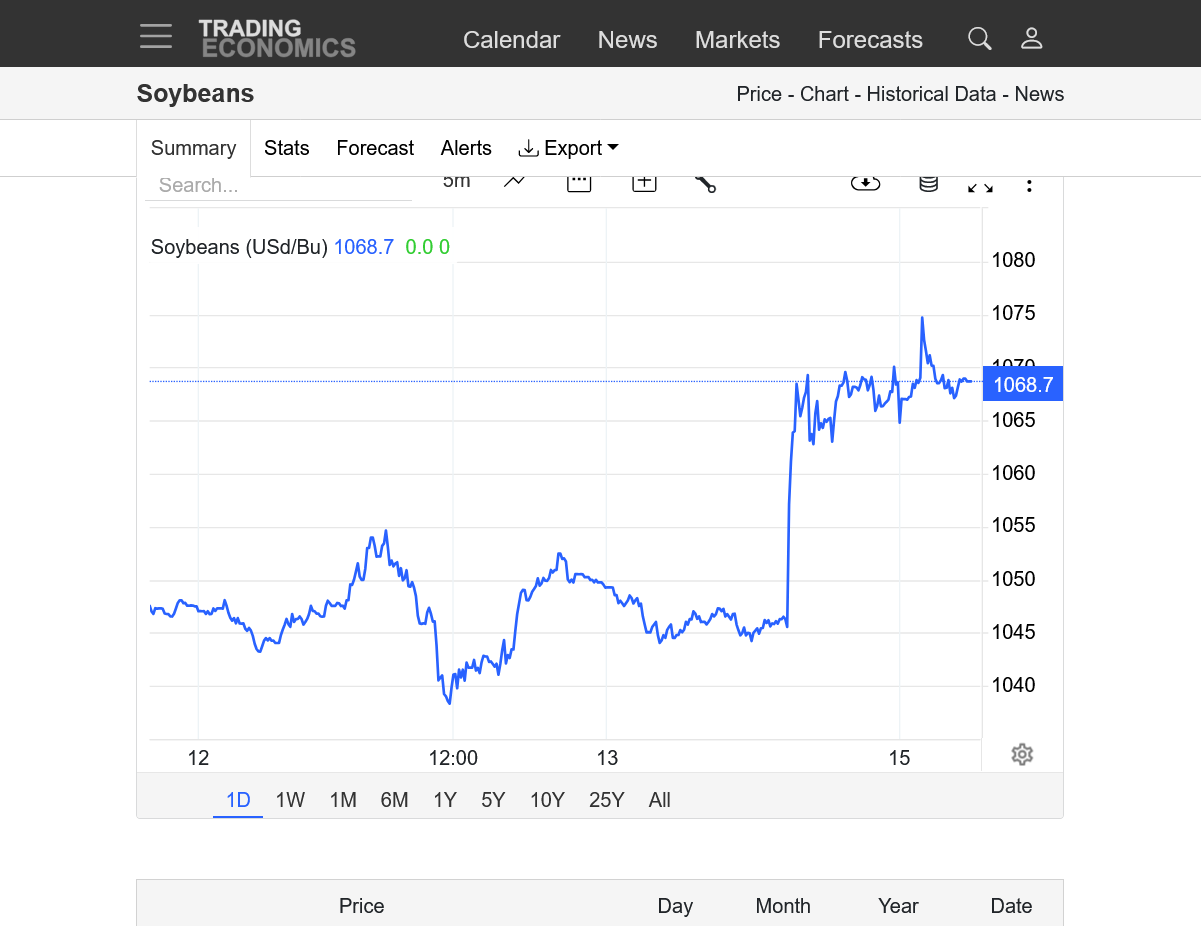
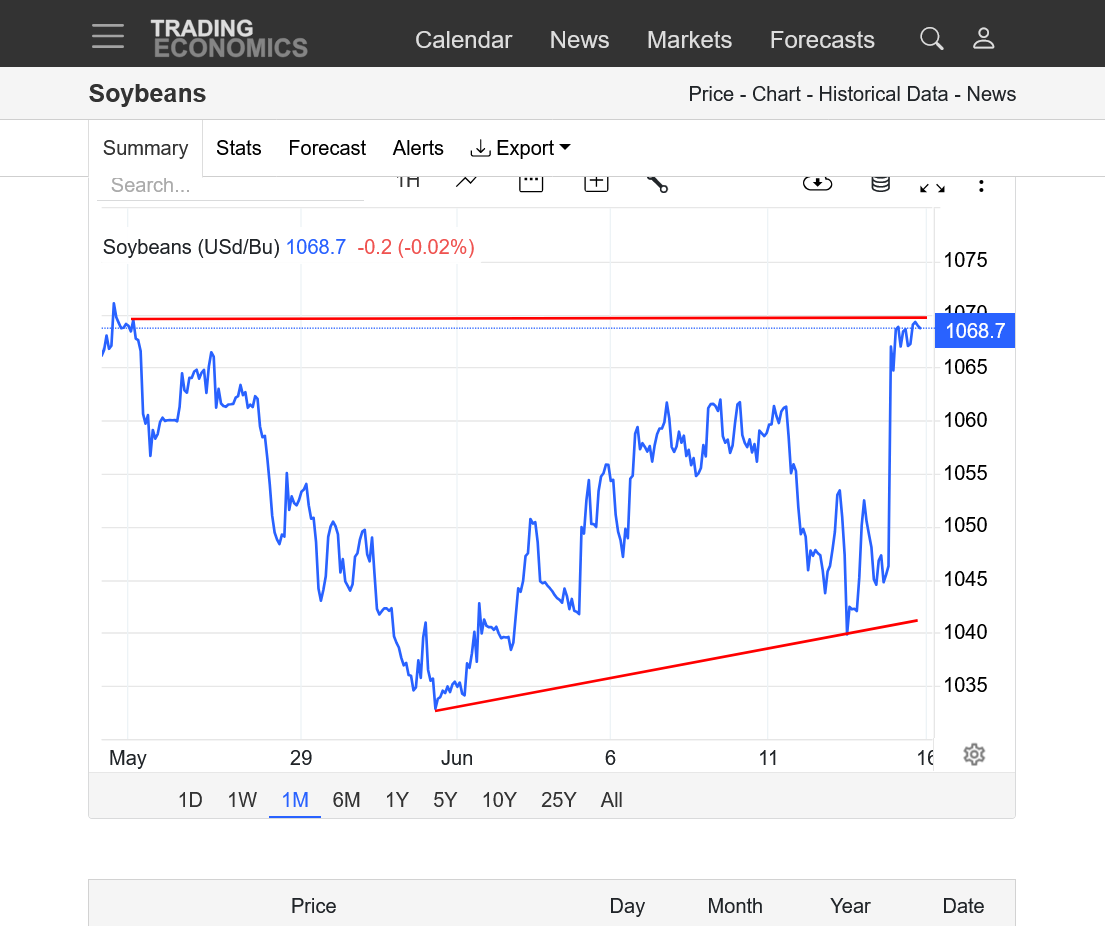
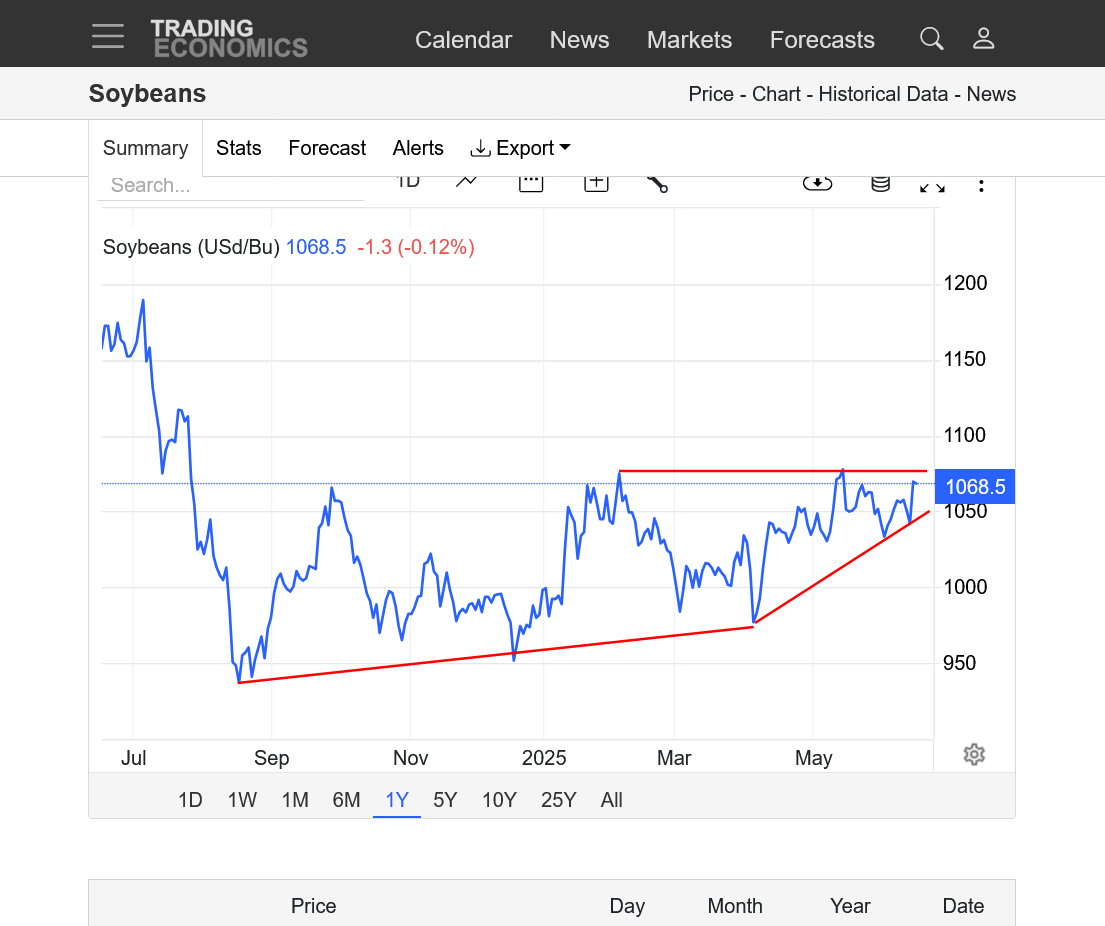
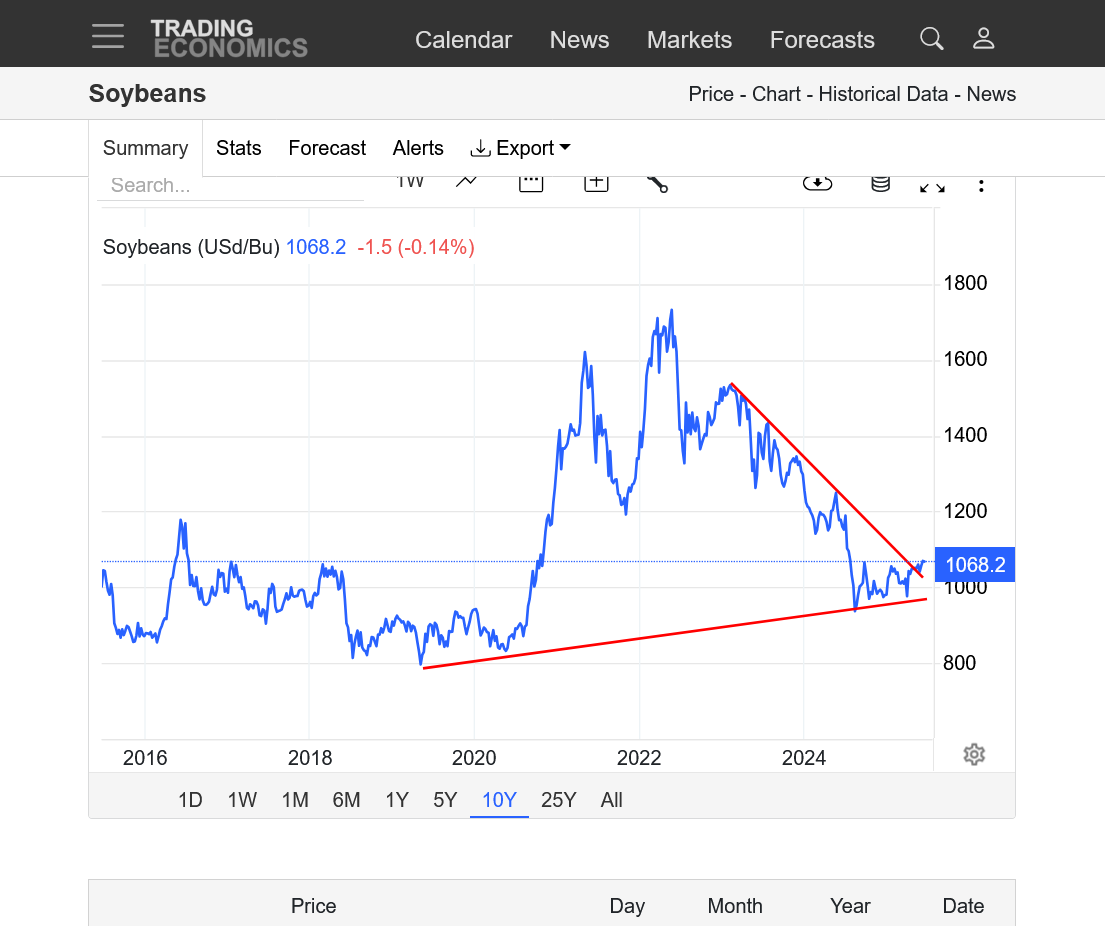
Soybeans below
https://tradingeconomics.com/commodity/soybeans
1. 1 day: HUGE 25c+ gain on Friday. +10c right after the open tonight but now a bit lower. The spike higher on Friday was from news about blending more soybean oil in diesel fuel. See the post below about that.
2. 1 month-uptrend in June bumping up to resistance earlier tonight.
3. 1 year-ascending triangle. Higher lows since last August and production losses from drought at the end of the 2024 growing season. Steepening uptrend channel since April. We hit strong selling resistance right after the open.
4. 10 years-Huge symmetrical triangle with higher lows and lower highs. Very close to breaking out to the upside if we can go higher here from this shorter term wedge. Or it could end up being a bear flag/pennant/wedge if we break to the downside instead.
Money managers last month dug themselves very, very deep into bear territory on Kansas City #wheat futures & options. Although they have been slight net buyers for four consecutive weeks now, funds continue holding a massive net short position.
The huge spike higher in the price of beans on Friday was (mostly) not from weather! See below.
However, if the hot/dry weather pattern kicks in during July and lasts into August it will hurt beans the most, so that could be a factor since August is pod fill for beans and the most important weather month determining final yields. You may remember that the weather in 2024 turned very dry/flash drought in the 2nd half of August thru Fall and it was enough to seriously hurt the bean yields. The USDA started dialing that in with the November crop report but didn't completely report the yield losses until the January crop report.............4+ months AFTER it had happened in the fields.
USDA January 10, 2025/grains
Started by metmike - Jan. 10, 2025, 11:38 a.m.
https://www.marketforum.com/forum/topic/109451/#109481
By metmike - Jan. 10, 2025, noon
EXTREMELY BULLISH!!!!!!!!
++++++++++++++++++++++++++
By metmike - Jan. 10, 2025, 12:45 p.m.
+++++++++++++++++++++
https://tradingeconomics.com/commodity/soybeans
++++++++++++++++++++++++++
Last week's US #corn export inspections come in at the top end of trade expectations - destinations were diverse. Inspections of #wheat & #soybeans were modest but in line with expectations. No grains or oilseeds inspected for China last week.
The trade keeps chasing US spring #wheat conditions on their way up and still can't catch them. Huge improvement from 3 weeks ago (45% good/exc). #Corn conditions rose this week but #soybeans fell, as did winter wheat ratings.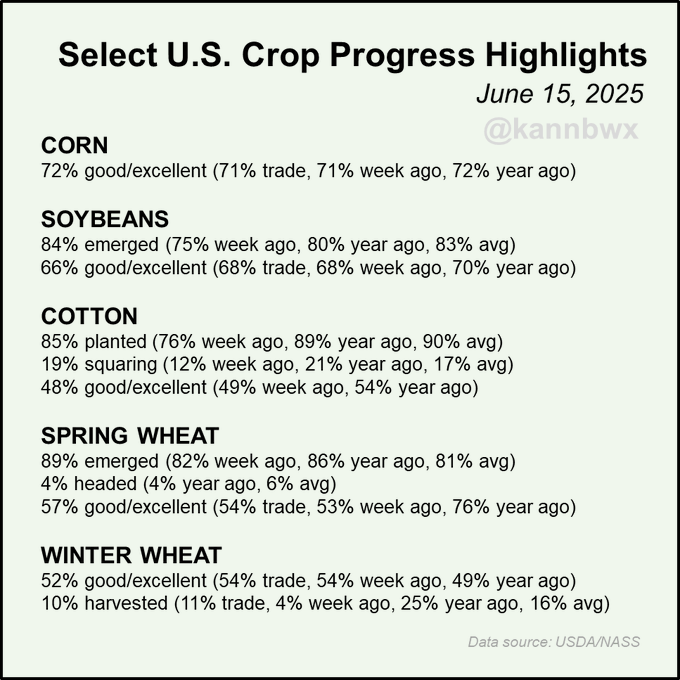
Conditions for US #soybeans fell 2 points this week, led by declines in Michigan, Louisiana & Wisconsin. Nationally, 66% good/excellent is actually 2 pts above the 5yr avg. The table also shows how each state compares with its 5yr avg for the week (Iowa is 10 pts ahead, e.g.).
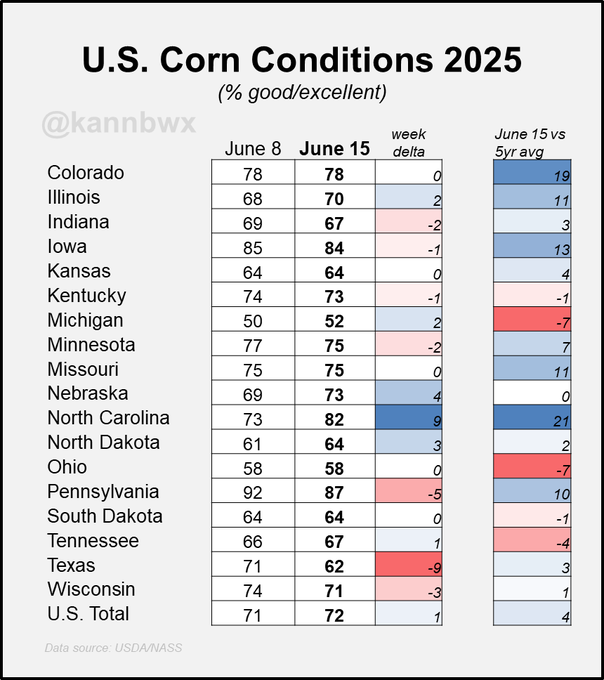
At 72% good/excellent, U.S. #corn conditions are 4 points above the week's 5-year average. This table shows you:How state-level conditions changed in the latest week How the latest state-level conditions compare with 5-year averages for this same week
The price of new crop is breaking out to the upside today because of the bullish weather coming up.
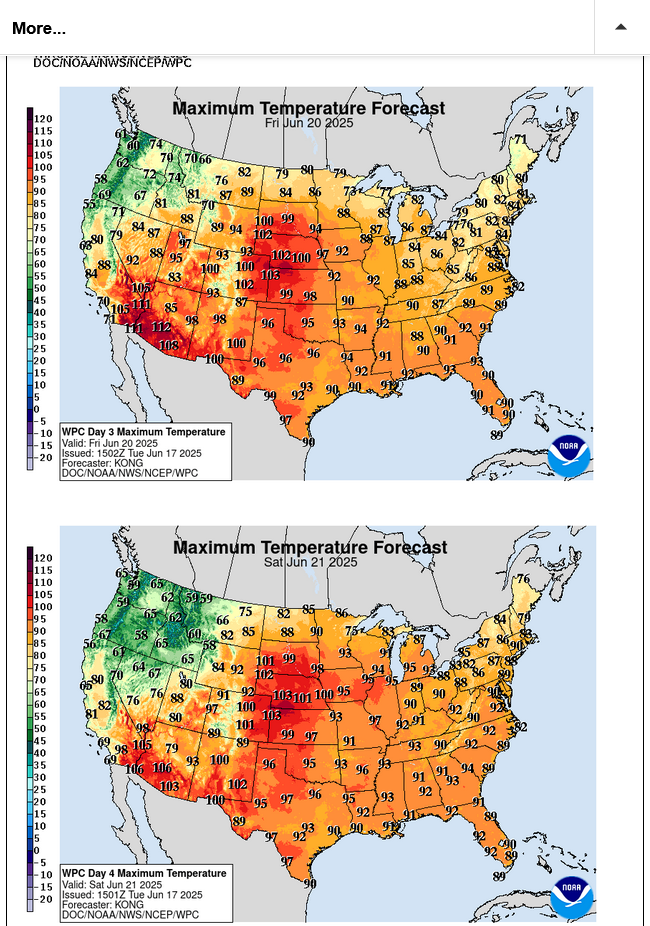
Intense heat LATE THIS WEEK that will temporarily shut down rains for around a week in many places.......before another wave of rains returns next week in the UPPER Midwest.
Old crop prices, especially with corn are not following the weather as much and are lagging or even lower today with corn.
Matt is in today:
June 17, 2025: "Quietly Dry" July Analogs | Kansas Windstorms | Midwest Ridge & Summer Heat
If,if, the rains would come out of the extended forecast then grains would fly but....
November canola is highest since sept 22 2023. 50% retrace would be about 880. 858 last high.
Thanks, cutworm!
Absolutely agree on if the rain comes out of the forecast we could go up alot!
Heat wave coming, June 17+ 2025
Started by metmike - June 17, 2025, 4:02 p.m.
https://www.marketforum.com/forum/topic/112618/
+++++++++++++=
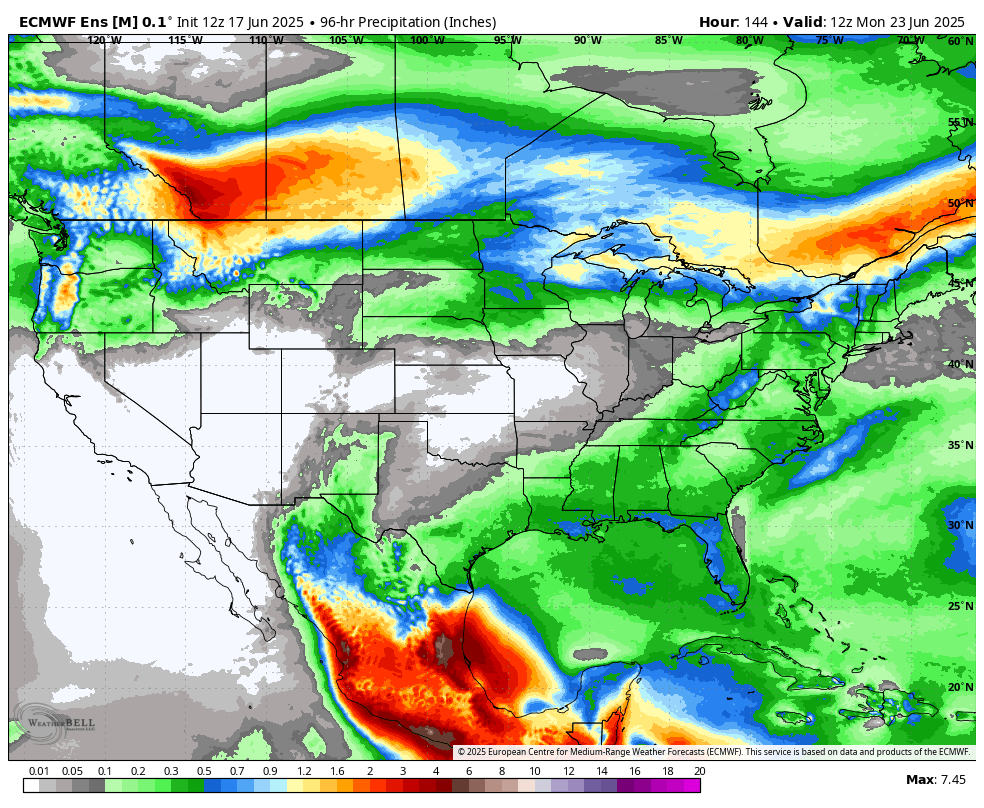
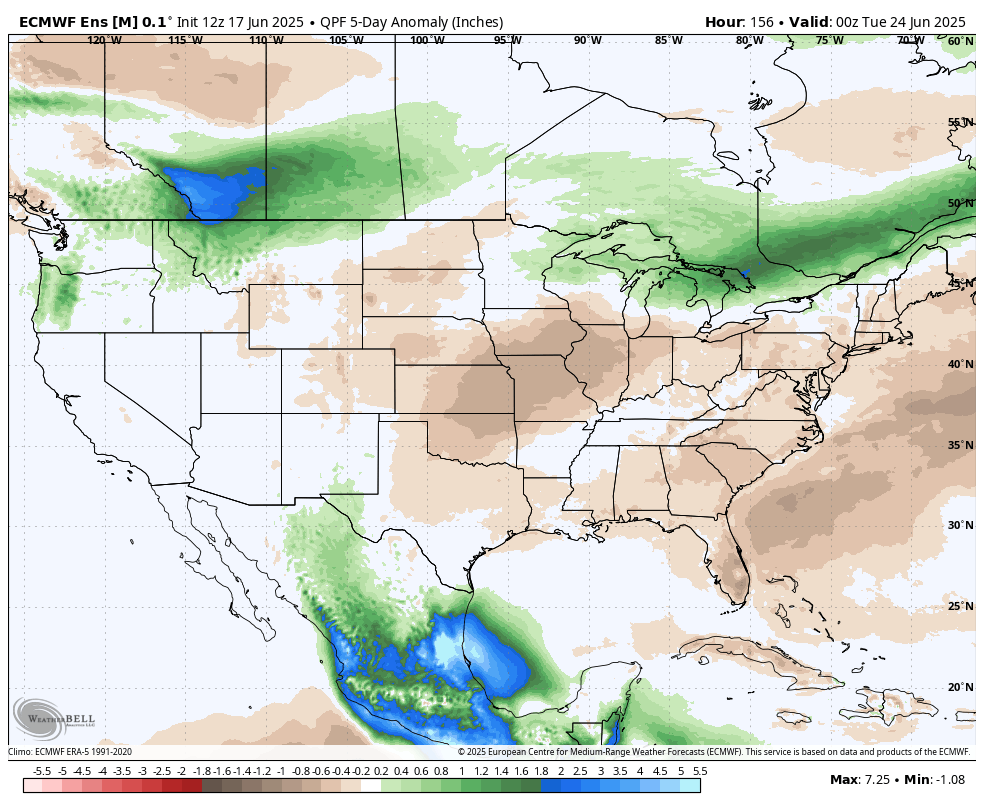
After the rains from this current pattern finally end on Wednesday Night. There will be a 5 day period(Thu-Fri-Sat-Sun-Mon), show below from the last 12z European model with most of the Cornbelt dry. With the intense heat at the same time, the dry areas of the Cornbelt will dry out fast. But then rains start returning after that.
1. total rains Thu-Mon
2. departure Thu-Mon
Eric is in with his awesome weather:
Grains are higher, likely from the intense heat in the forecast which will also feature a week+ of dry weather in some places(southeast half of the Cornbelt).
We need to take out more rain to get REAL bullish. The July weather models do that, especially in the WCB so this is also a bullish underlying factor today.
7 Day Total precipitation below:
http://www.wpc.ncep.noaa.govcdx /qpf/p168i.gif?1530796126

Heat wave!
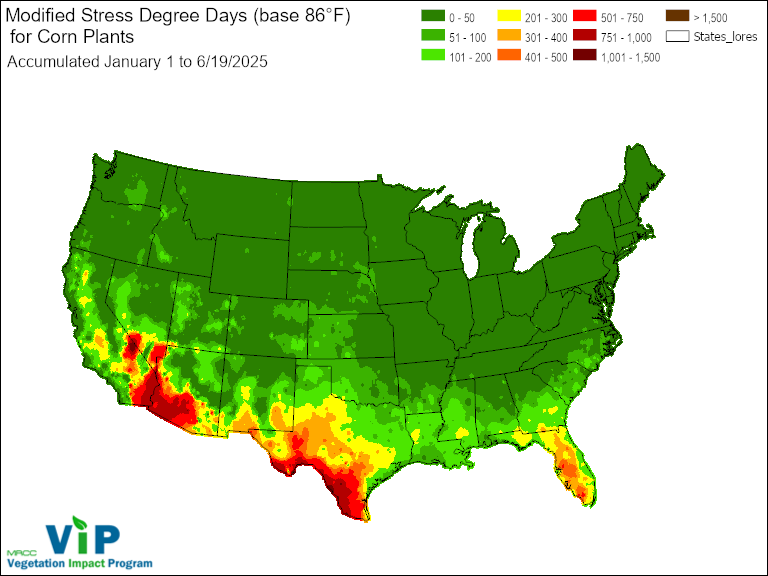
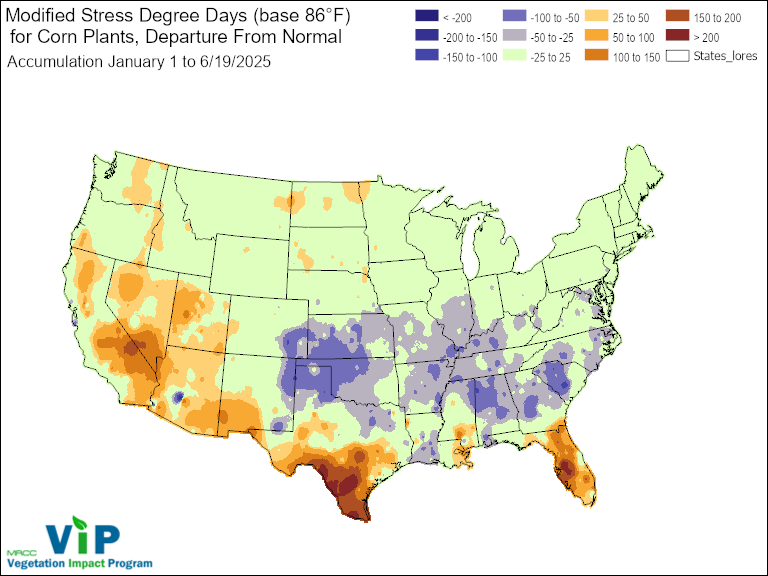
Eric Snodgrass Stress degree days discussion at about 10 min mark
Over 140 stress degree days can cause yield loss.( Iowa research ) Stress degree day is the high temp minus 86 degrees F
WOW!
Thanks cutworm. I never thought about this before.
https://mrcc.purdue.edu/VIP/indexSDD
+++++++++++
Here's a little secret that never makes the news about this metric.
Higher CO2 levels allow plants to do better when the weather features greater stress degree days from heat.
Also when moisture is less than optimal.
https://www.intechopen.com/chapters/73636
https://www.nature.com/articles/s41598-024-53343-2
and sell it not; also wisdom, and instruction, and understanding
« Crops and 130 Years of Climate Records
CO2 causes plants to be more water efficient and droughttolerant:
https://buythetruth.wordpress.com/2009/06/13/photosynthesis-and-co2-enrichment/
It's hard to get too bullish with this much rain in the forecast, exactly where they need it the most:
7 Day Total precipitation below:
http://www.wpc.ncep.noaa.govcdx /qpf/p168i.gif?1530796126

Just out 6z GEFS for 2 weeks:
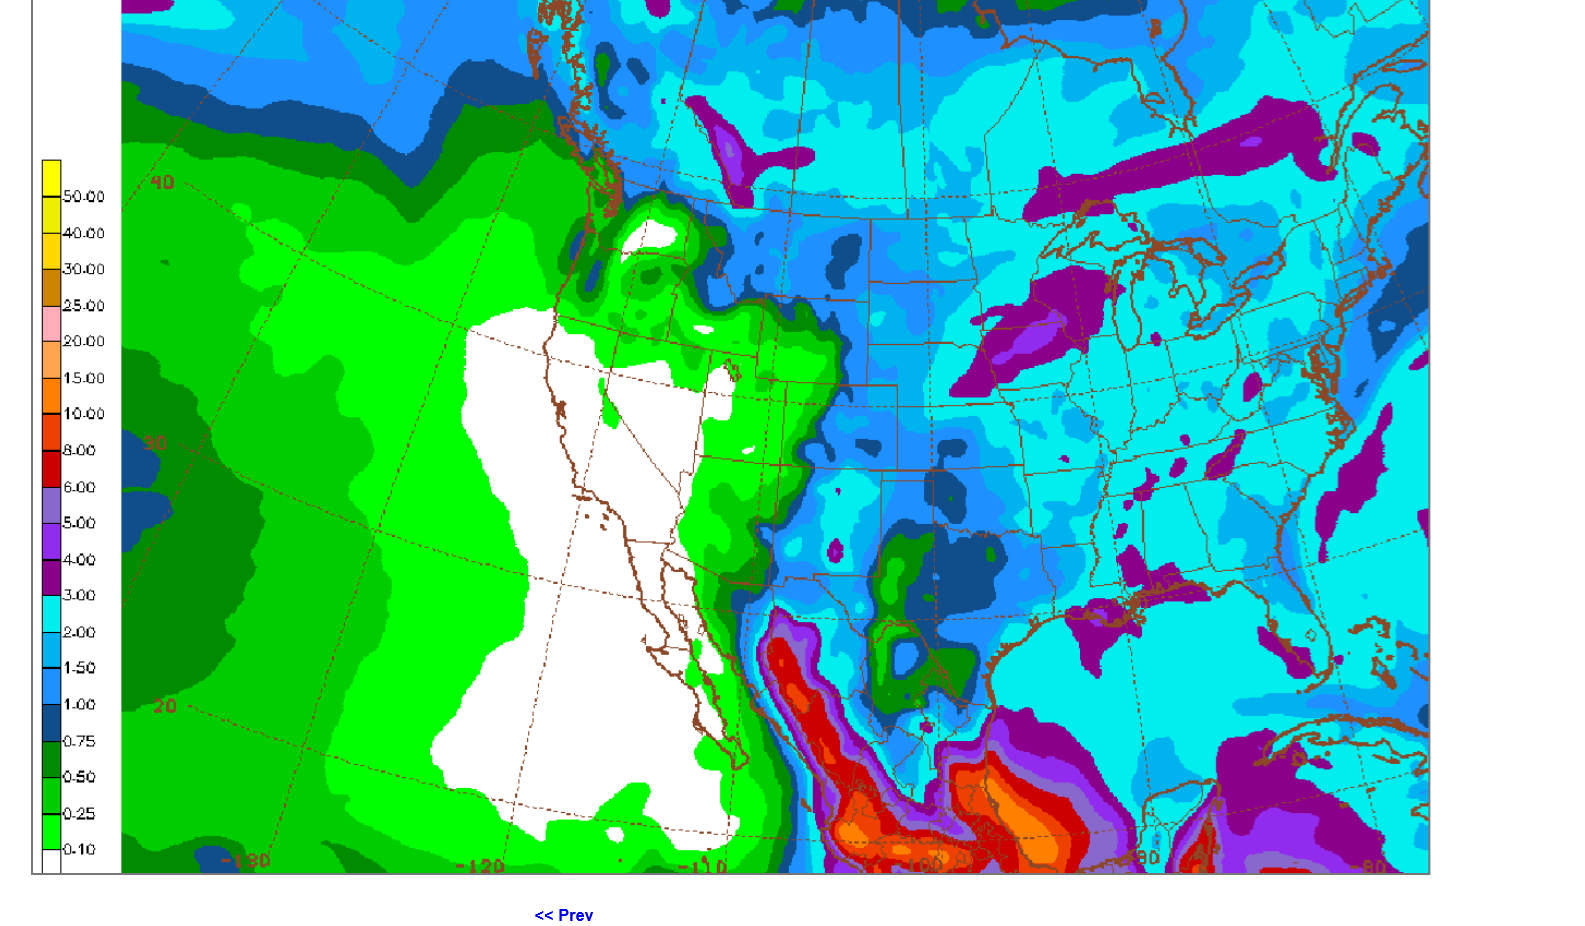
https://www.marketforum.com/forum/topic/83844/#83853
Soilmoisture anomaly:
These maps sometimes take a day to catch up to incorporate the latest data(the bottom map is only updated once a week).
https://www.cpc.ncep.noaa.gov/products/Soilmst_Monitoring/US/Soilmst/Soilmst.shtml#


The intense heat is already gone for the Upper Midwest and there is too much rain in the forecast for grains to get bullish in late June.
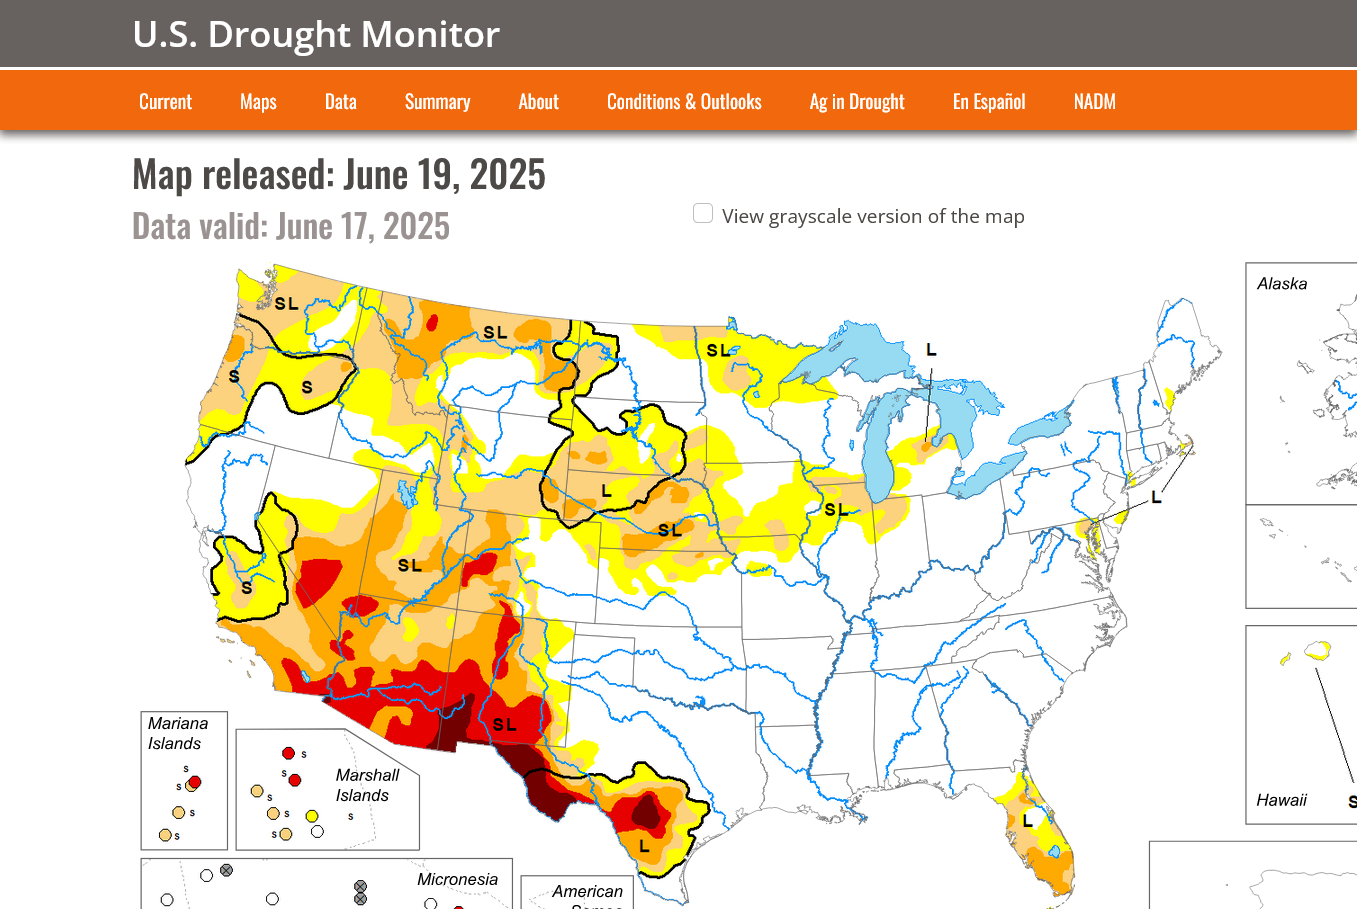
These rains will be falling exactly in the driest areas!
DROUGHT MONITOR
https://droughtmonitor.unl.edu/
7 Day Total precipitation below:
http://www.wpc.ncep.noaa.govcdx /qpf/p168i.gif?1530796126

Agronomy Question: Heat
Started by tjc - June 22, 2025, 11:11 a.m.
https://www.marketforum.com/forum/topic/112740/
++++++++++++++
All the weather:
US #corn conditions declined this week, first decline of the season. #Soybeans held steady but spring #wheat ratings dropped 3 points. The earliest corn and soybeans are now heading into the reproductive stages, and winter wheat harvest is 19% complete.
US #corn conditions unexpectedly fell 2 points on the week but remain above average for the date. Here's the state-level breakdown, incl. a 9-point plunge in North Dakota. Guessing some of that came from storm damage, can't say for sure though. Anyone have any reports?
Conditions for US #soybeans were unchanged this week, though there were some state-level movements. Big improvements in the Delta were offsets by declines across the I-states, Nebraska & North Dakota. The I-states accounted for 37% of national soybean production last year.
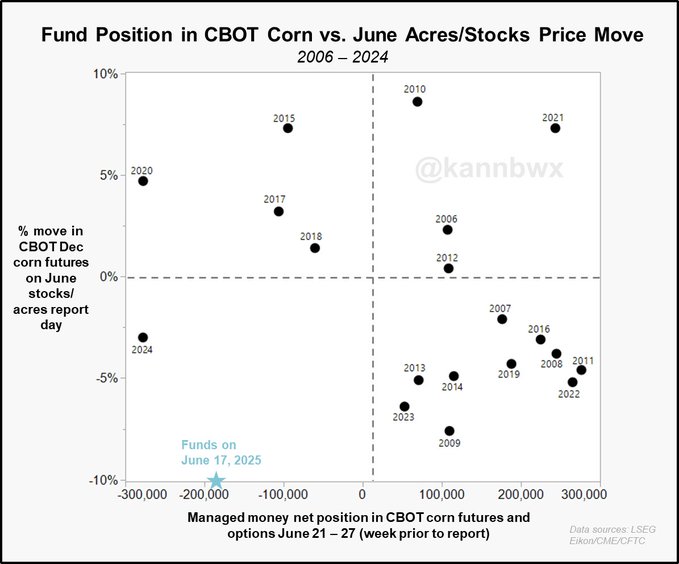
Interestingly, funds' net short in CBOT #corn futures & options is nearly identical to a year ago. US corn stocks/acres were both bearish vs expectations last June, and specs went on to an all-time record short in early July. Does funds' recent momentum stick? They have been net
Will CBOT #corn rally or fall on June 30? There were only four examples, but prior to last year, December corn rallied on June 30 (when USDA releases US stocks/acreage surveys) whenever funds were bearish going in. 2024 broke that trend and funds are net short again
https://www.youtube.com/watch?v=TTHtVVdXdiQ
++++++++++++++++
Brazil Cash Corn Price Collapses to $3 Bucks! With Matthew Kruse
https://www.youtube.com/watch?v=VlGGzxlMBU8
+++++++++++++
https://www.youtube.com/watch?v=iyhR2ciezuU
+++++++++++
Still too much rain in the driest locations to be bullish:
7 Day Total precipitation below:
http://www.wpc.ncep.noaa.govcdx /qpf/p168i.gif?1530796126

All the constantly updated weather:
Andrew is in with the short term weather:
June 25, 2025 | Pockets of Severe Storms Through Sunday | Pattern Rolls Over in July
Crop report is Monday June 30
Yes, thanks cutworm!
I'll probably start a new thread with that one. I have moderate confidence that the pattern is going to turn consistently hot in the Plains/WCB in July with below average rains which will dry out the soils and cause crop ratings to drop later in the month.
But the market will rally BEFORE the crop ratings drop shows up, maybe by 2 weeks before that happens.
Depending on what the crop report shows, theres a decent chance that we may put in the lows in the next week or sooner because of how bullish the July weather looks.
I think the lows might be in, depending on the USDA Monday and the changes in weather over the weekend.
Low skill level but I'm hotter and drier, especially in the Western Cornbelt than this forecast and that period.
This would equate to BULLISH weather and prices for C and S.
https://www.cpc.ncep.noaa.gov/products/predictions/WK34/
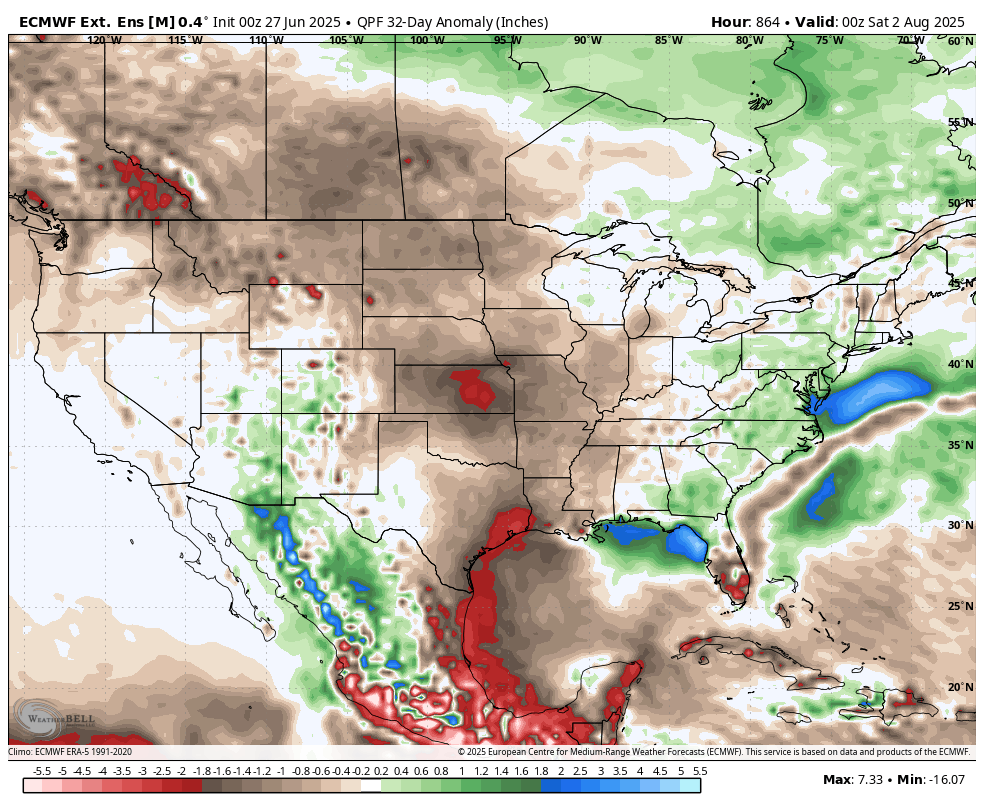
This was the last, just updated rainfall departure map for July from the European model.
There were the temperature departures:
Keep in mind that July is the warmest month of the year and the month which is toughest to feature positive anomalies in.
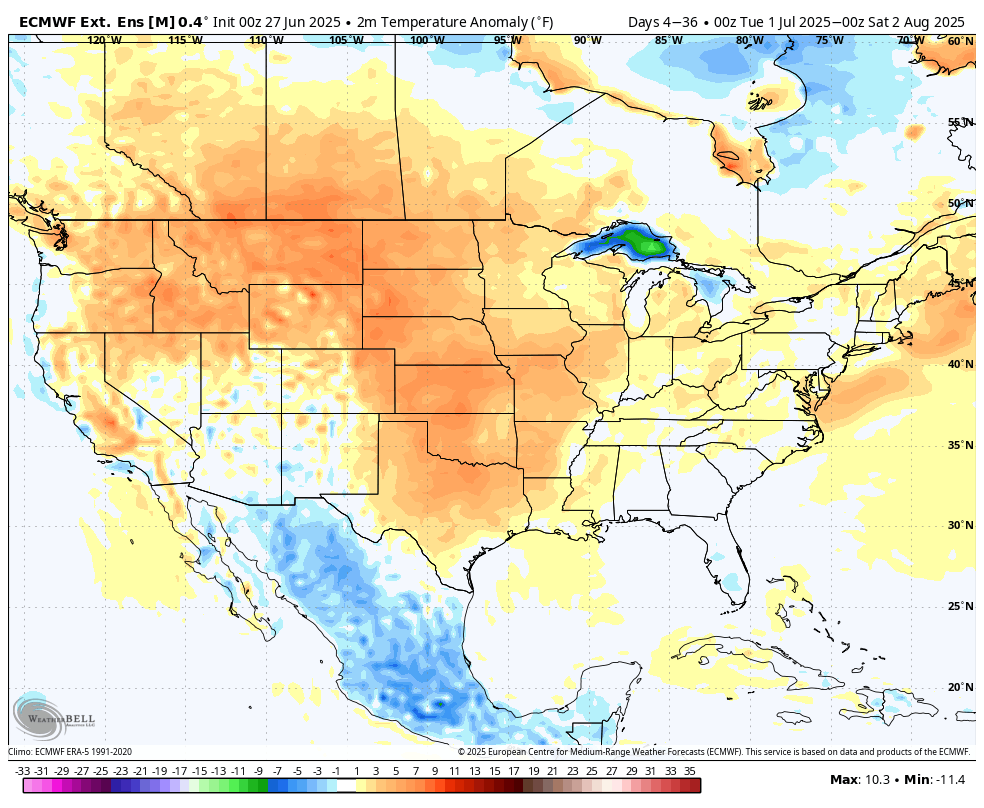
Is this from climate change?
A couple degrees of it, probably is from climate change.
Just a reminder of the difference between weather and climate:
It really boils down to this, once again(Cliff Mass can be counted on as an elite source for using objective, authentic science)
https://cliffmass.blogspot.com/2016/03/the-golden-rule-of-climate-extremes.html
The GoldenRule
Considering the substantial confusion in the media about this critical issue, let me provide the GOLDENRULE OF CLIMATE EXTREMES. Here it is:
The more extreme a climate or weather record is, the greater the contribution of natural variability.
Or to put it a different way, the larger or more unusual an extreme, the higher proportion of the extreme is due to natural variability.
This was 89 years ago, well before CO2 had increased the global temperature from greenhouse gas warming.
https://www.wunderground.com/cat6/North-Americas-Most-Intense-Heat-Wave-July-and-August-1936
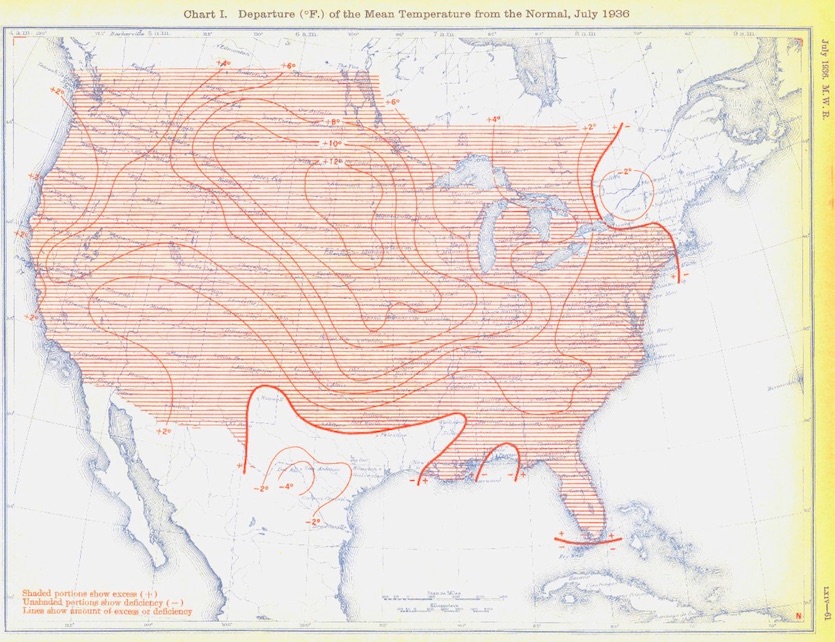
And the Dust Bowl decade of the 1930s happened several times in the 1800s BECAUSE OF the low CO2 levels and much cooler atmosphere! Climate change IS PROTECTING US FROM THAT in this age.
Re: Re: Re: Re: Re: Death by GREENING!
By metmike - Feb. 2, 2025, 7:54 a.m.
The weather is slightly lees bullish but the trade is positioning for the ISDA report later today.
We know this because corn is down around 3c but beans are up.
in a weather market at this time of year, they both move strongly in the same direction most,of the time.