
+++++++++++++++
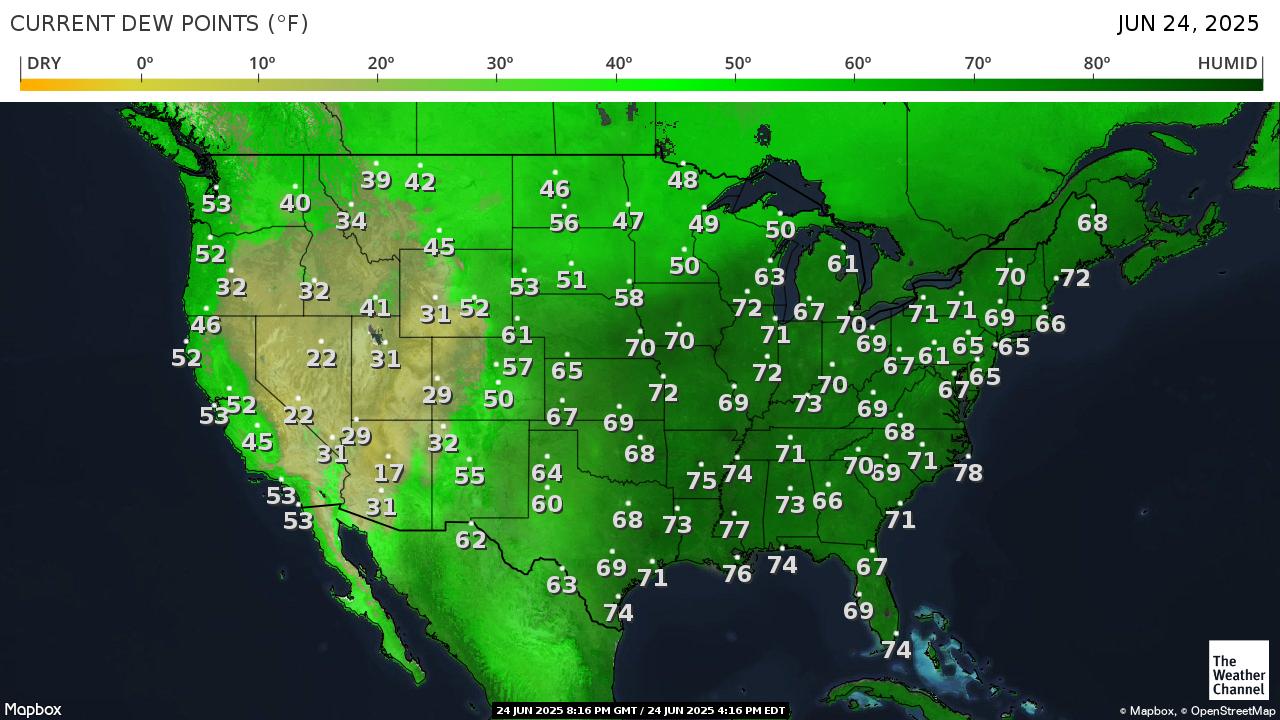
The humidity is a big part of it!


The very cool weather pattern that has been dominating this part of the country thru May and into June is about to completely change later this week!
These were the May temperatures below. It was nice while it lasted but we knew the heat would eventually get here in the Summer, like it always does. The first heat wave always seems the hottest because we haven't acclimated yet. It's coming with certainty and isn't anything that hasn't happened 100+ times before in the last few decades.
https://www.cpc.ncep.noaa.gov/products/tanal/temp_analyses.php
This has been advertised by the models for awhile but the amount of heat in the forecast jumped up last weekend(causing natural gas to have an upside break out in prices on the Sunday evening open).
All the constantly updated weather here:
https://www.marketforum.com/forum/topic/83844/
+++++++++++++++++++
Summer arrives on the calendar on June 20th...........and the weather pattern will also be very Summer-like!
The dew points(humidity) will be very high too, so the Heat Index in the afternoon will be well above 100 Deg. F. On a couple of days, next week it will likely top out at 110+ Deg. F!
This will keep the temperatures at night from dropping much below 80 Deg. F on several nights next week.
https://www.marketforum.com/forum/topic/83844/#83851
Highs for upcoming week:
https://www.wpc.ncep.noaa.gov/medr/medr_max.shtml


++++++++++++++++++++++++++++++++++++++ +++++++++
Lows for upcoming week below:
https://www.wpc.ncep.noaa.gov/medr/medr_min.shtml
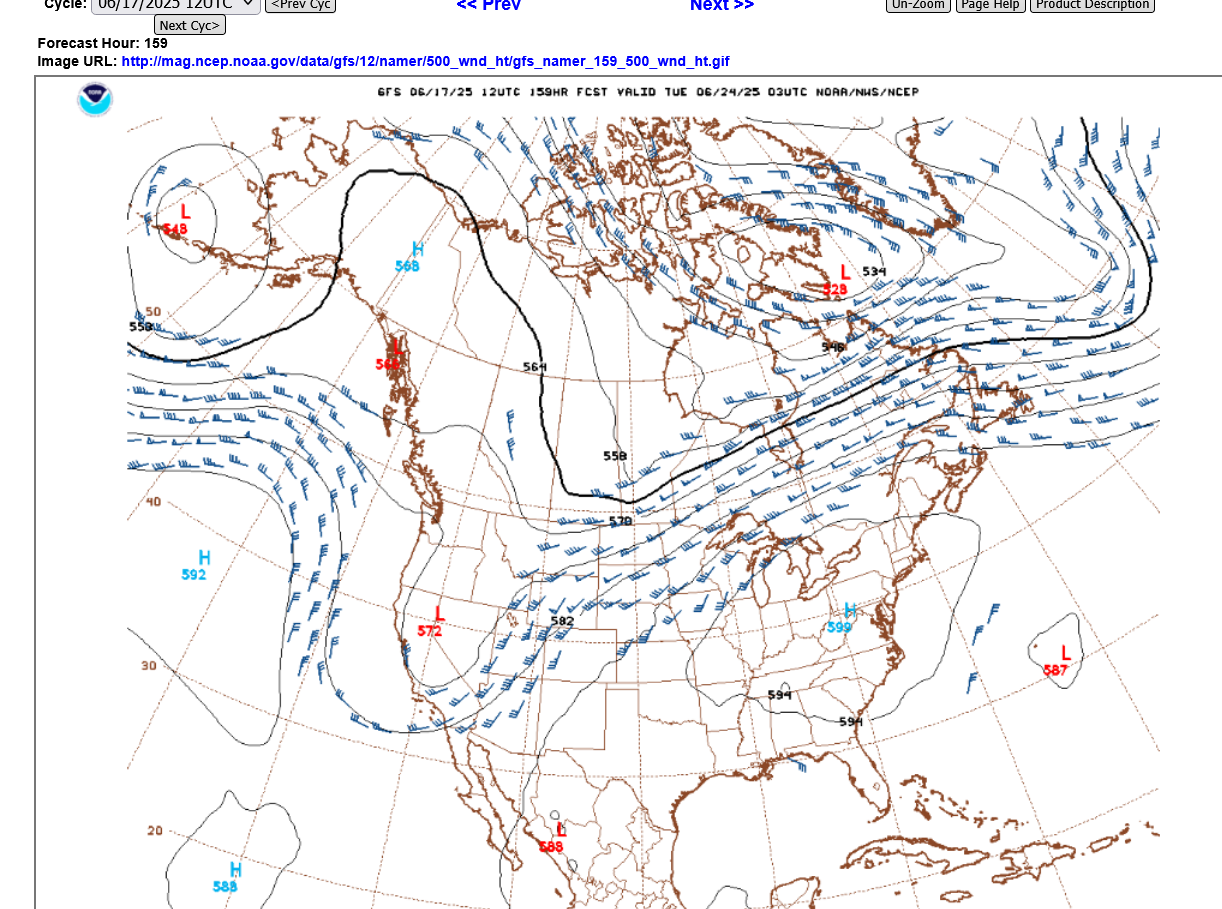
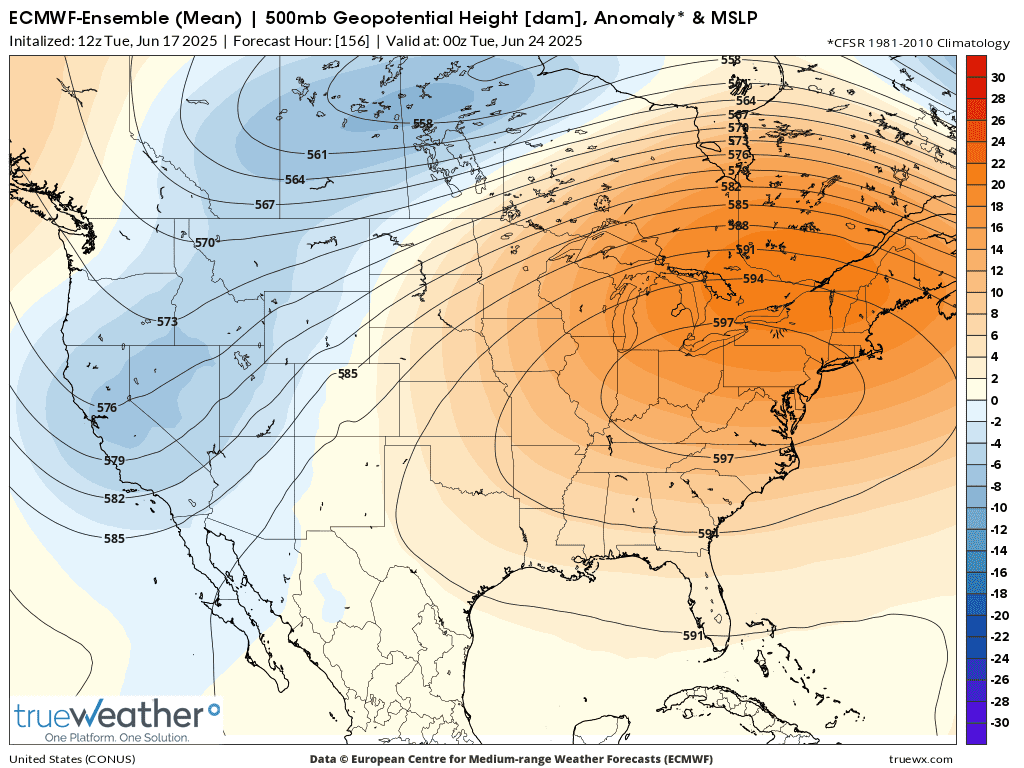
Here's the upper level heat ridge(dome) that will be responsible for the heat wave.
Hot air at the surface but also warm air aloft that will defeat any rain making attempts because it will suppress air parcels from rising.
This is early next week at 500 mb, 20,000 feet which is around halfway up in the atmosphere from the last 12z GFS model.
This was the 12z European Ensemble model with the anomalies in colors.
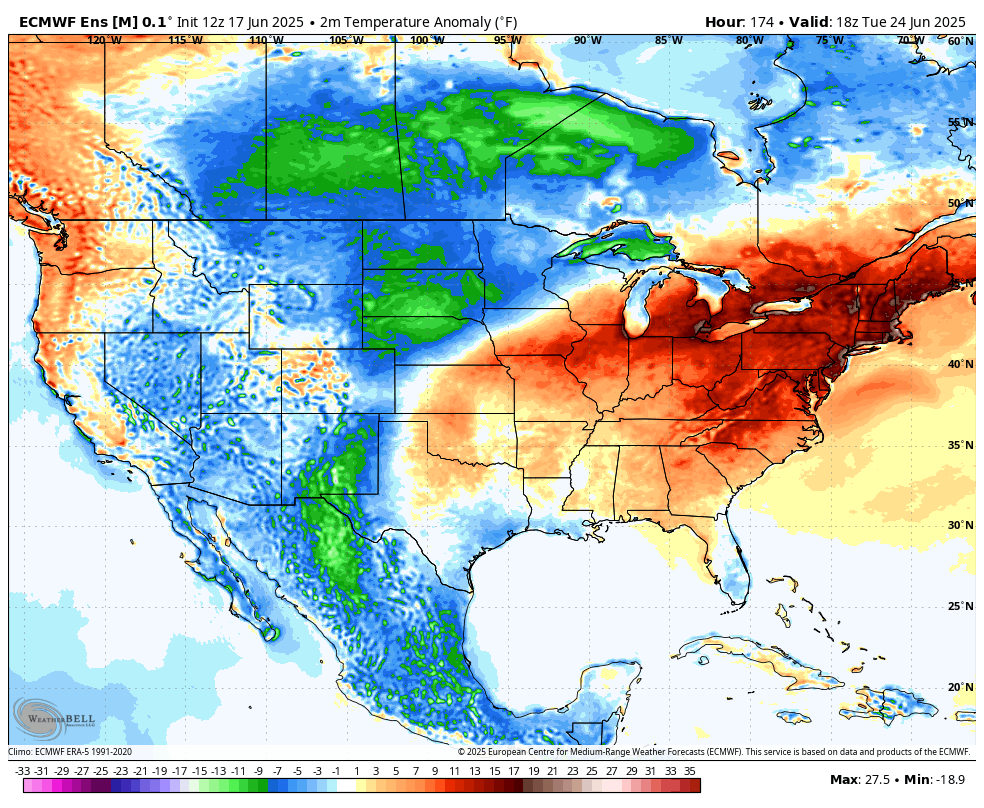
These are the surface temperature anomalies(compared to average) for next Tuesday Afternoon:
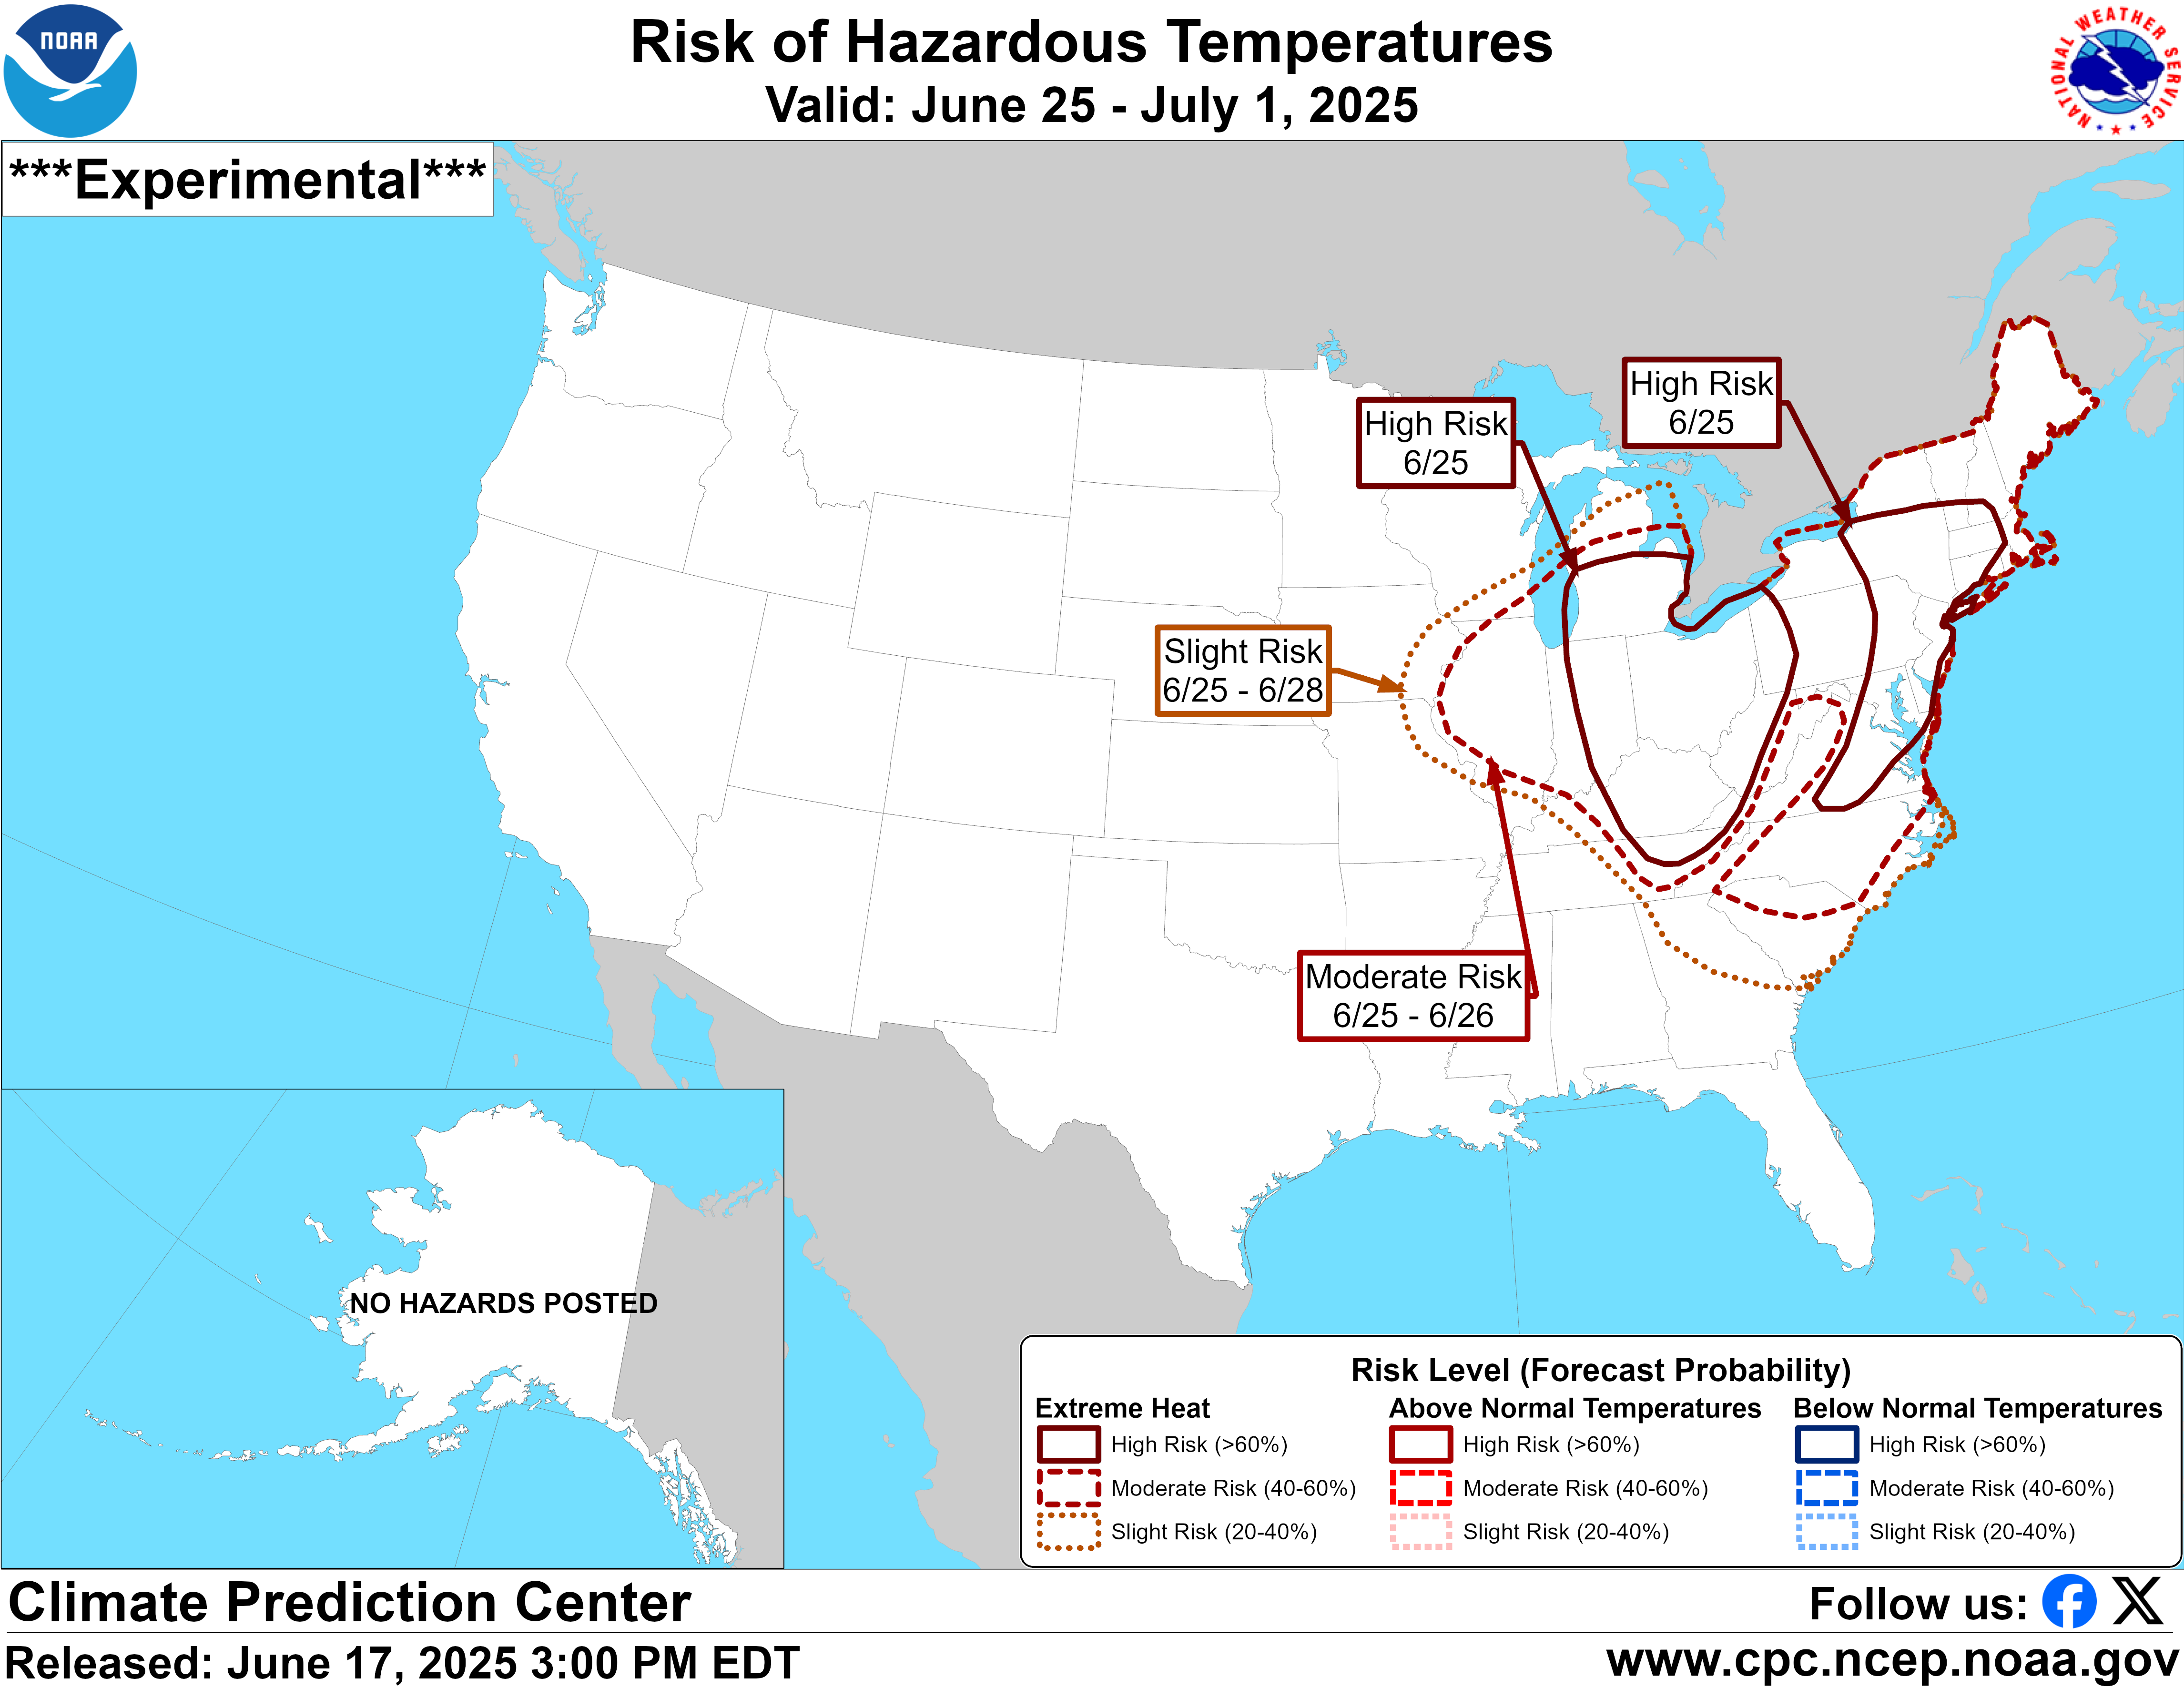
Current Hazards at the link below.
For your NWS and county, go to the link below.
Then you can hit any spot on the map, including where you live and it will go to that NWS with all the comprehensive local weather information for that/your county.

Here's what the colors on the map above stand for:
These are mostly heat related right now!
THo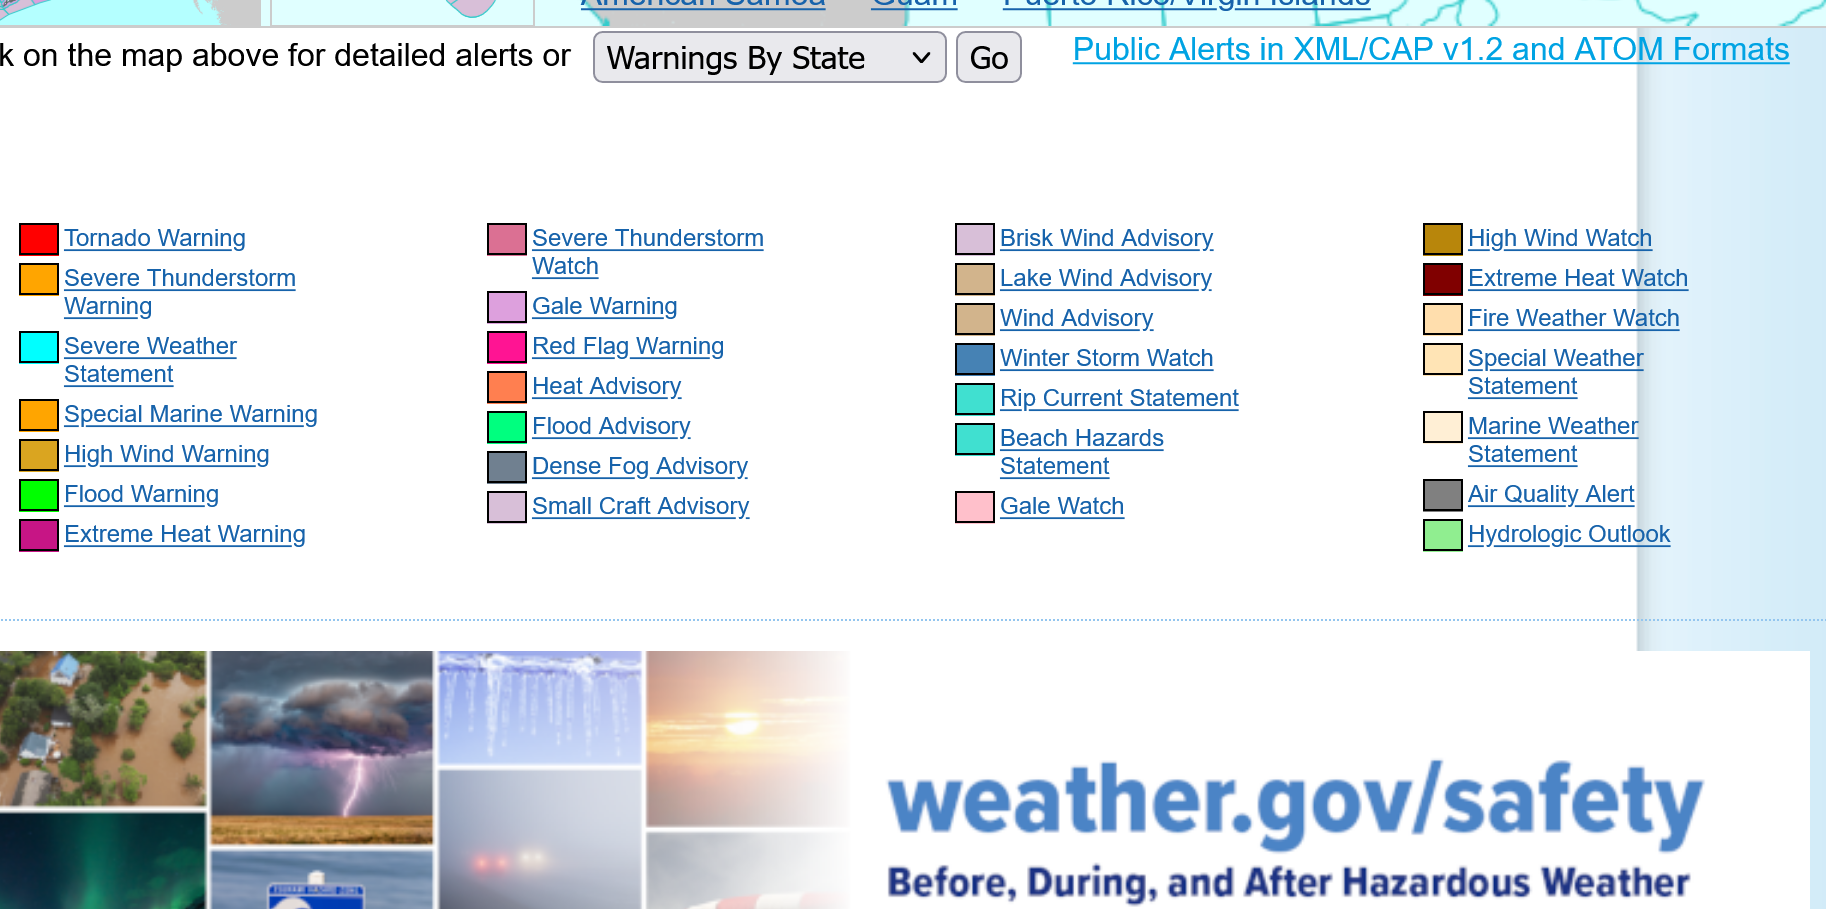
+++++++++++++++++++++++++++++++++
We can see from the Hazards map, where the heat wave continues. They Upper Midwest and Western Cornbelt are past the intense heat and will now see heavy rains..........exactly in the driest spots!
++++++++++++++++++++++++
https://www.marketforum.com/forum/topic/83844/#83853
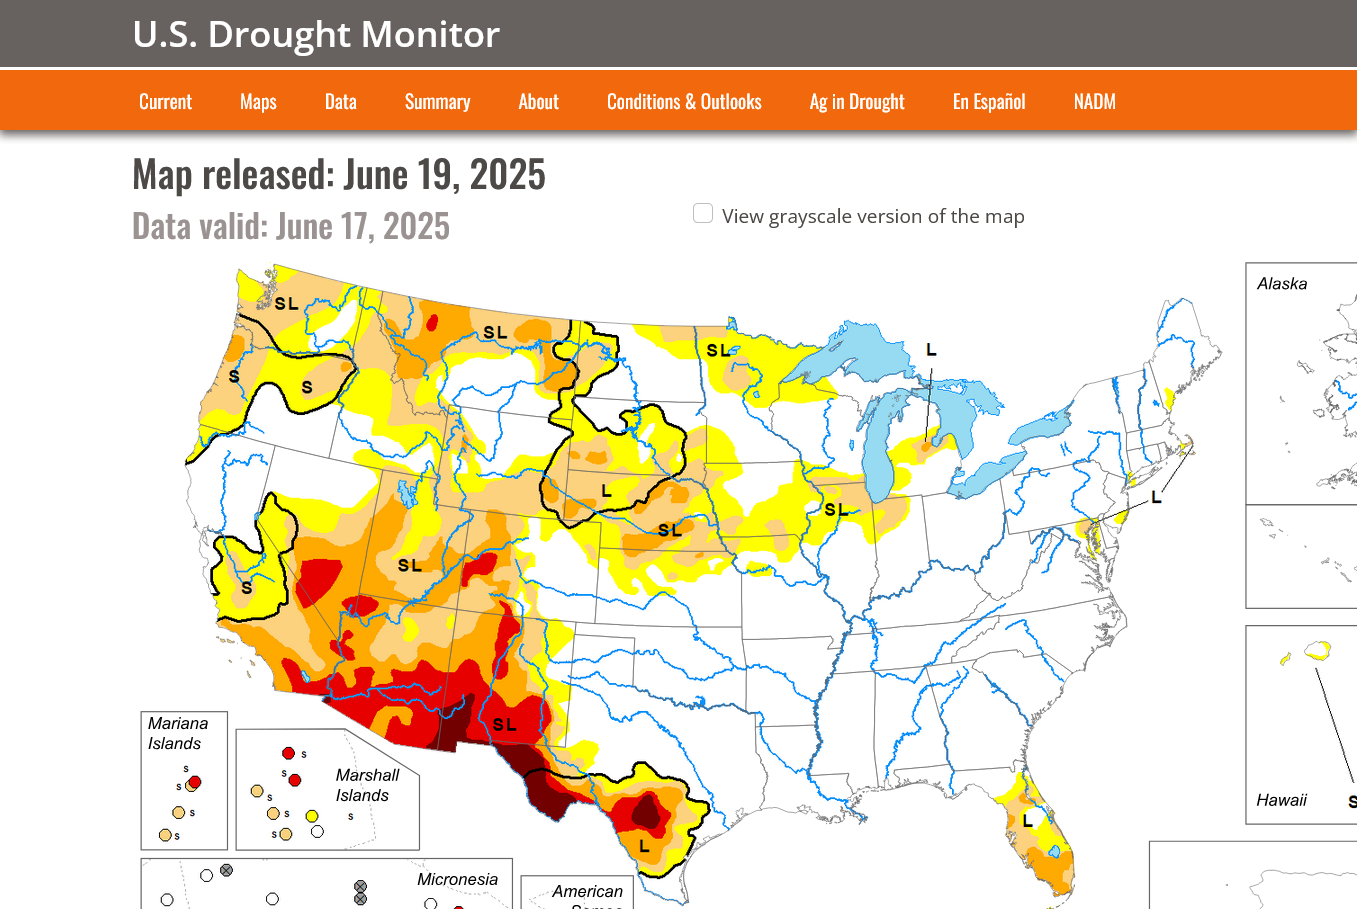
DROUGHT MONITOR
https://droughtmonitor.unl.edu/
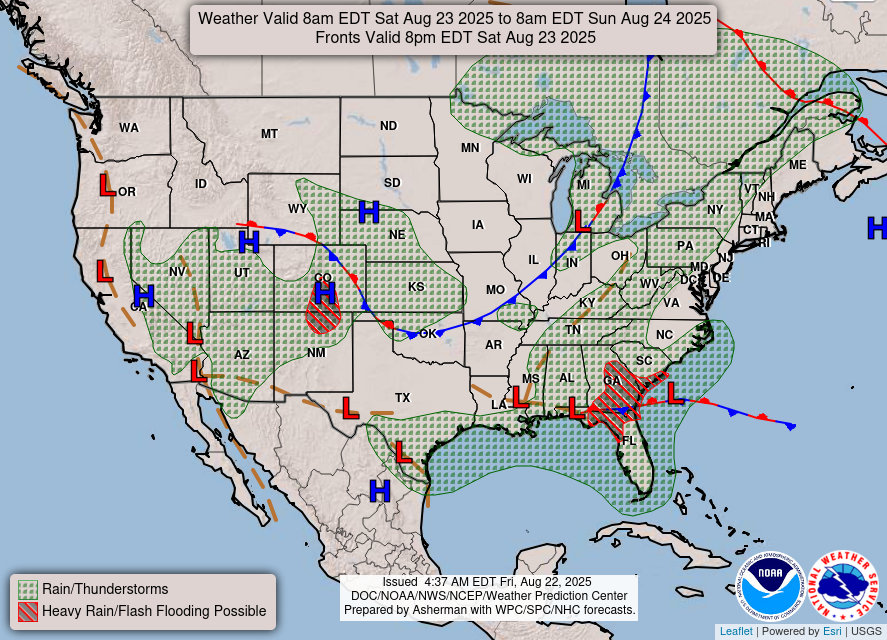
1. Weather map now.
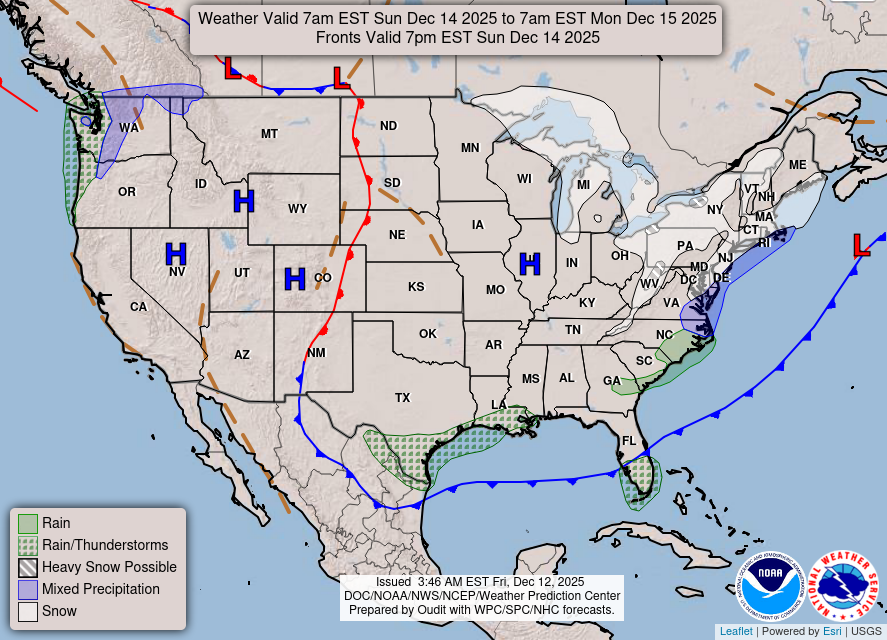
2. In 24 hours and
3. In 48 hours.
https://www.wpc.ncep.noaa.gov/#

+++++++++++++++++++++++++++++++++++++++++++++++++
Surface Weather maps for days 3-7 below:
https://www.wpc.ncep.noaa.gov/medr/medr.shtml

+++++++++++++++++++++++++++++++++++++++++++
The latest 7 day precip forecasts are below.
Day 1 below:
http://www.wpc.ncep.noaa.gov/qpf/fill_94qwbg.gif?1526306199054

Day 2 below:
http://www.wpc.ncep.noaa.gov/qpf/fill_98qwbg.gif?1528293750112

Day 3 below:
http://www.wpc.ncep.noaa.gov/qpf/fill_99qwbg.gif?1528293842764

Days 4-5 below:
http://www.wpc.ncep.noaa.gov/qpf/95ep48iwbg_fill.gif?1526306162

Days 6-7 below:
http://www.wpc.ncep.noaa.gov/qpf/97ep48iwbg_fill.gif?1526306162

7 Day Total precipitation below:
http://www.wpc.ncep.noaa.govcdx /qpf/p168i.gif?1530796126

Snapshot of the current Heat Index:
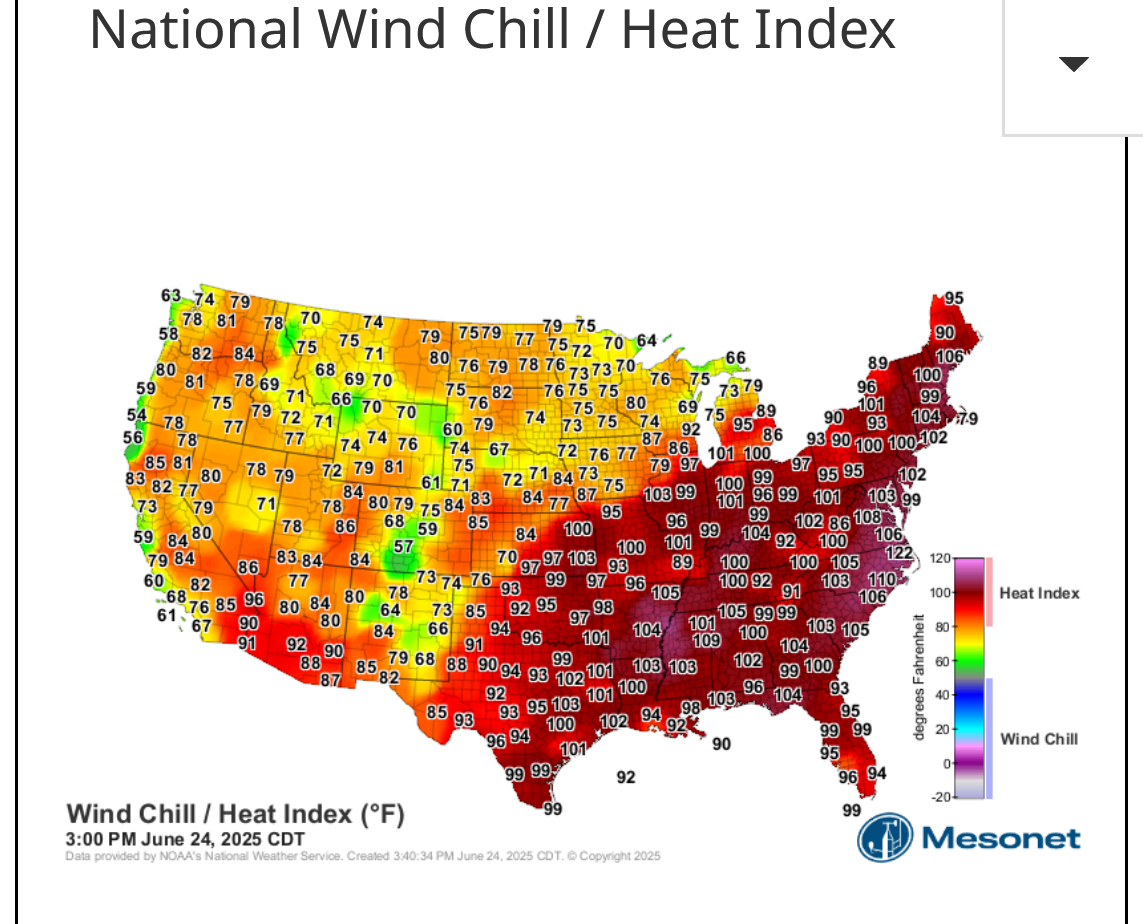
Live/updated versions here:
https://www.mesonet.org/weather/air-temperature/national-wind-chill-heat-index
+++++++++++++++
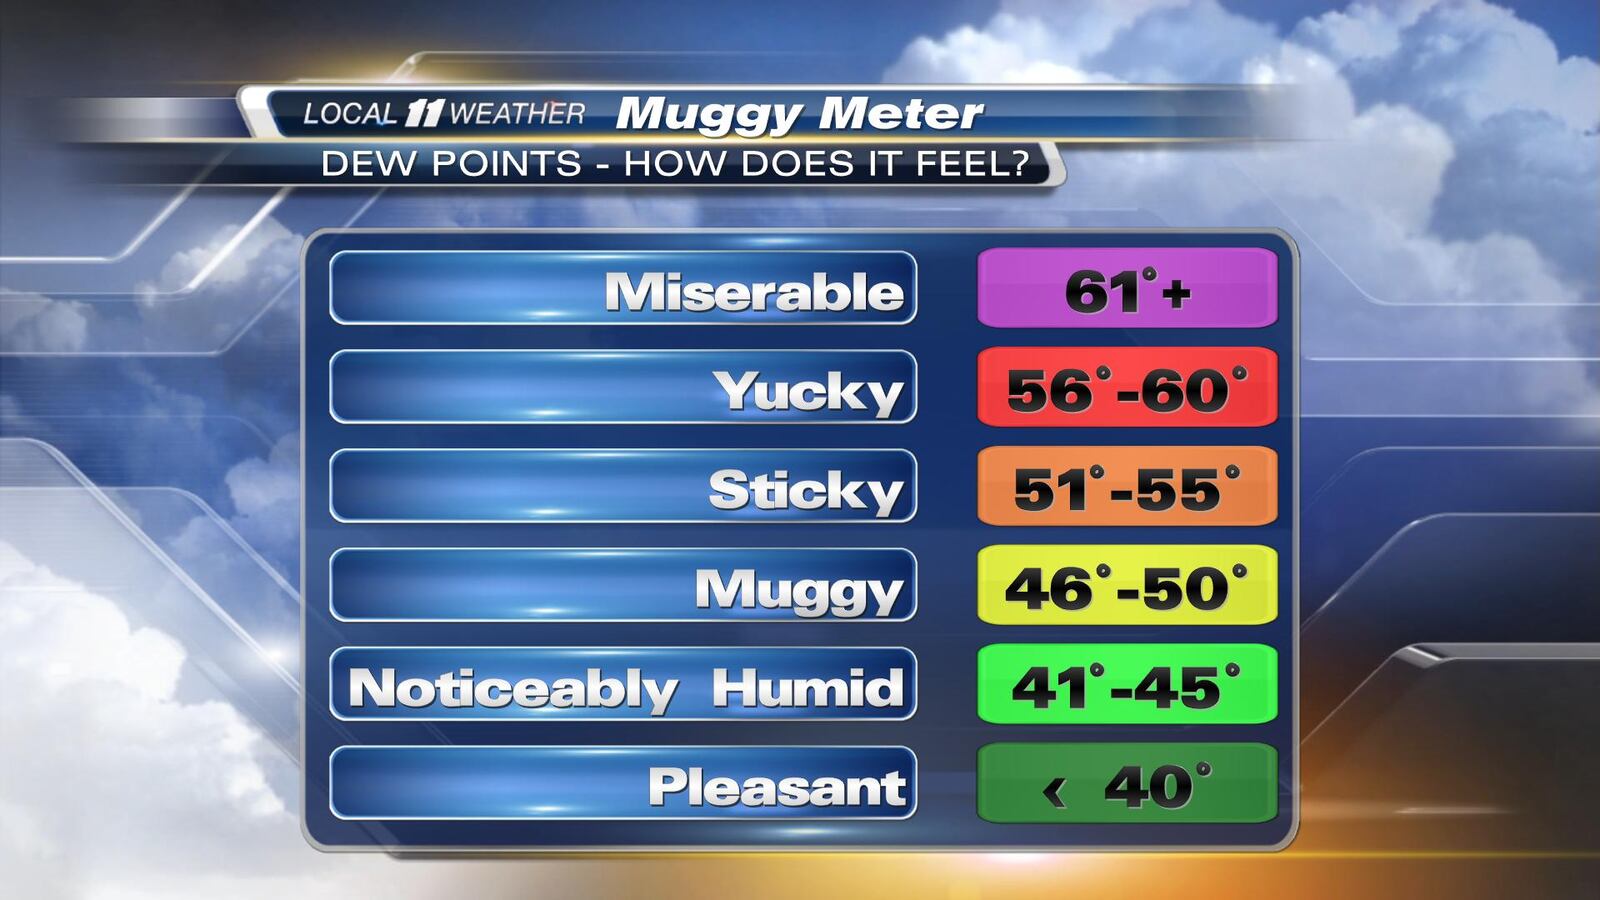
The humidity is a big part of it!
Here's an interesting fact.
The amount of humidity/dew point considered uncomfortable depends on where you live and what you're used to.
The previous page used this graph which corresponds to much of the country east of the Rockies, where Gulf moisture is the the main contribution to high dew points.
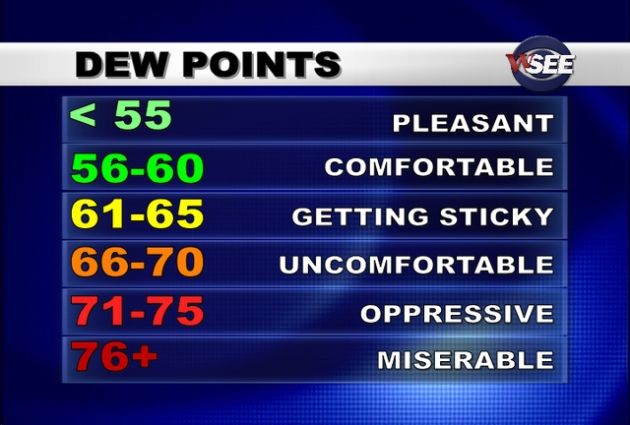
People that live in the Gulf States might think that 61-65 is still comfortable in the Summer, for instance instead of getting sticky.
People in ND think that 56-60 is getting sticky instead of comfortable.
Here's an example from a meteorologist in the state of Idaho, defining their "feels like" dew points. Idaho almost always has very low dew points.
Note that the above scale is pleasant below 55 degrees, while the scale below at 51-55 is Sticky!!!
https://www.kmvt.com/content/news/Weather-blog-Heat-and-humidity-384614071.html
I have a sister that's lived in Anchorage, AK for 40 years. When she would visit in Detroit, she always thought it felt very humid in the Summer.........even when it felt comfortable to people in the Midwest.
Larry, who lives in the Atlanta area is used to even more humidity in the Summer.