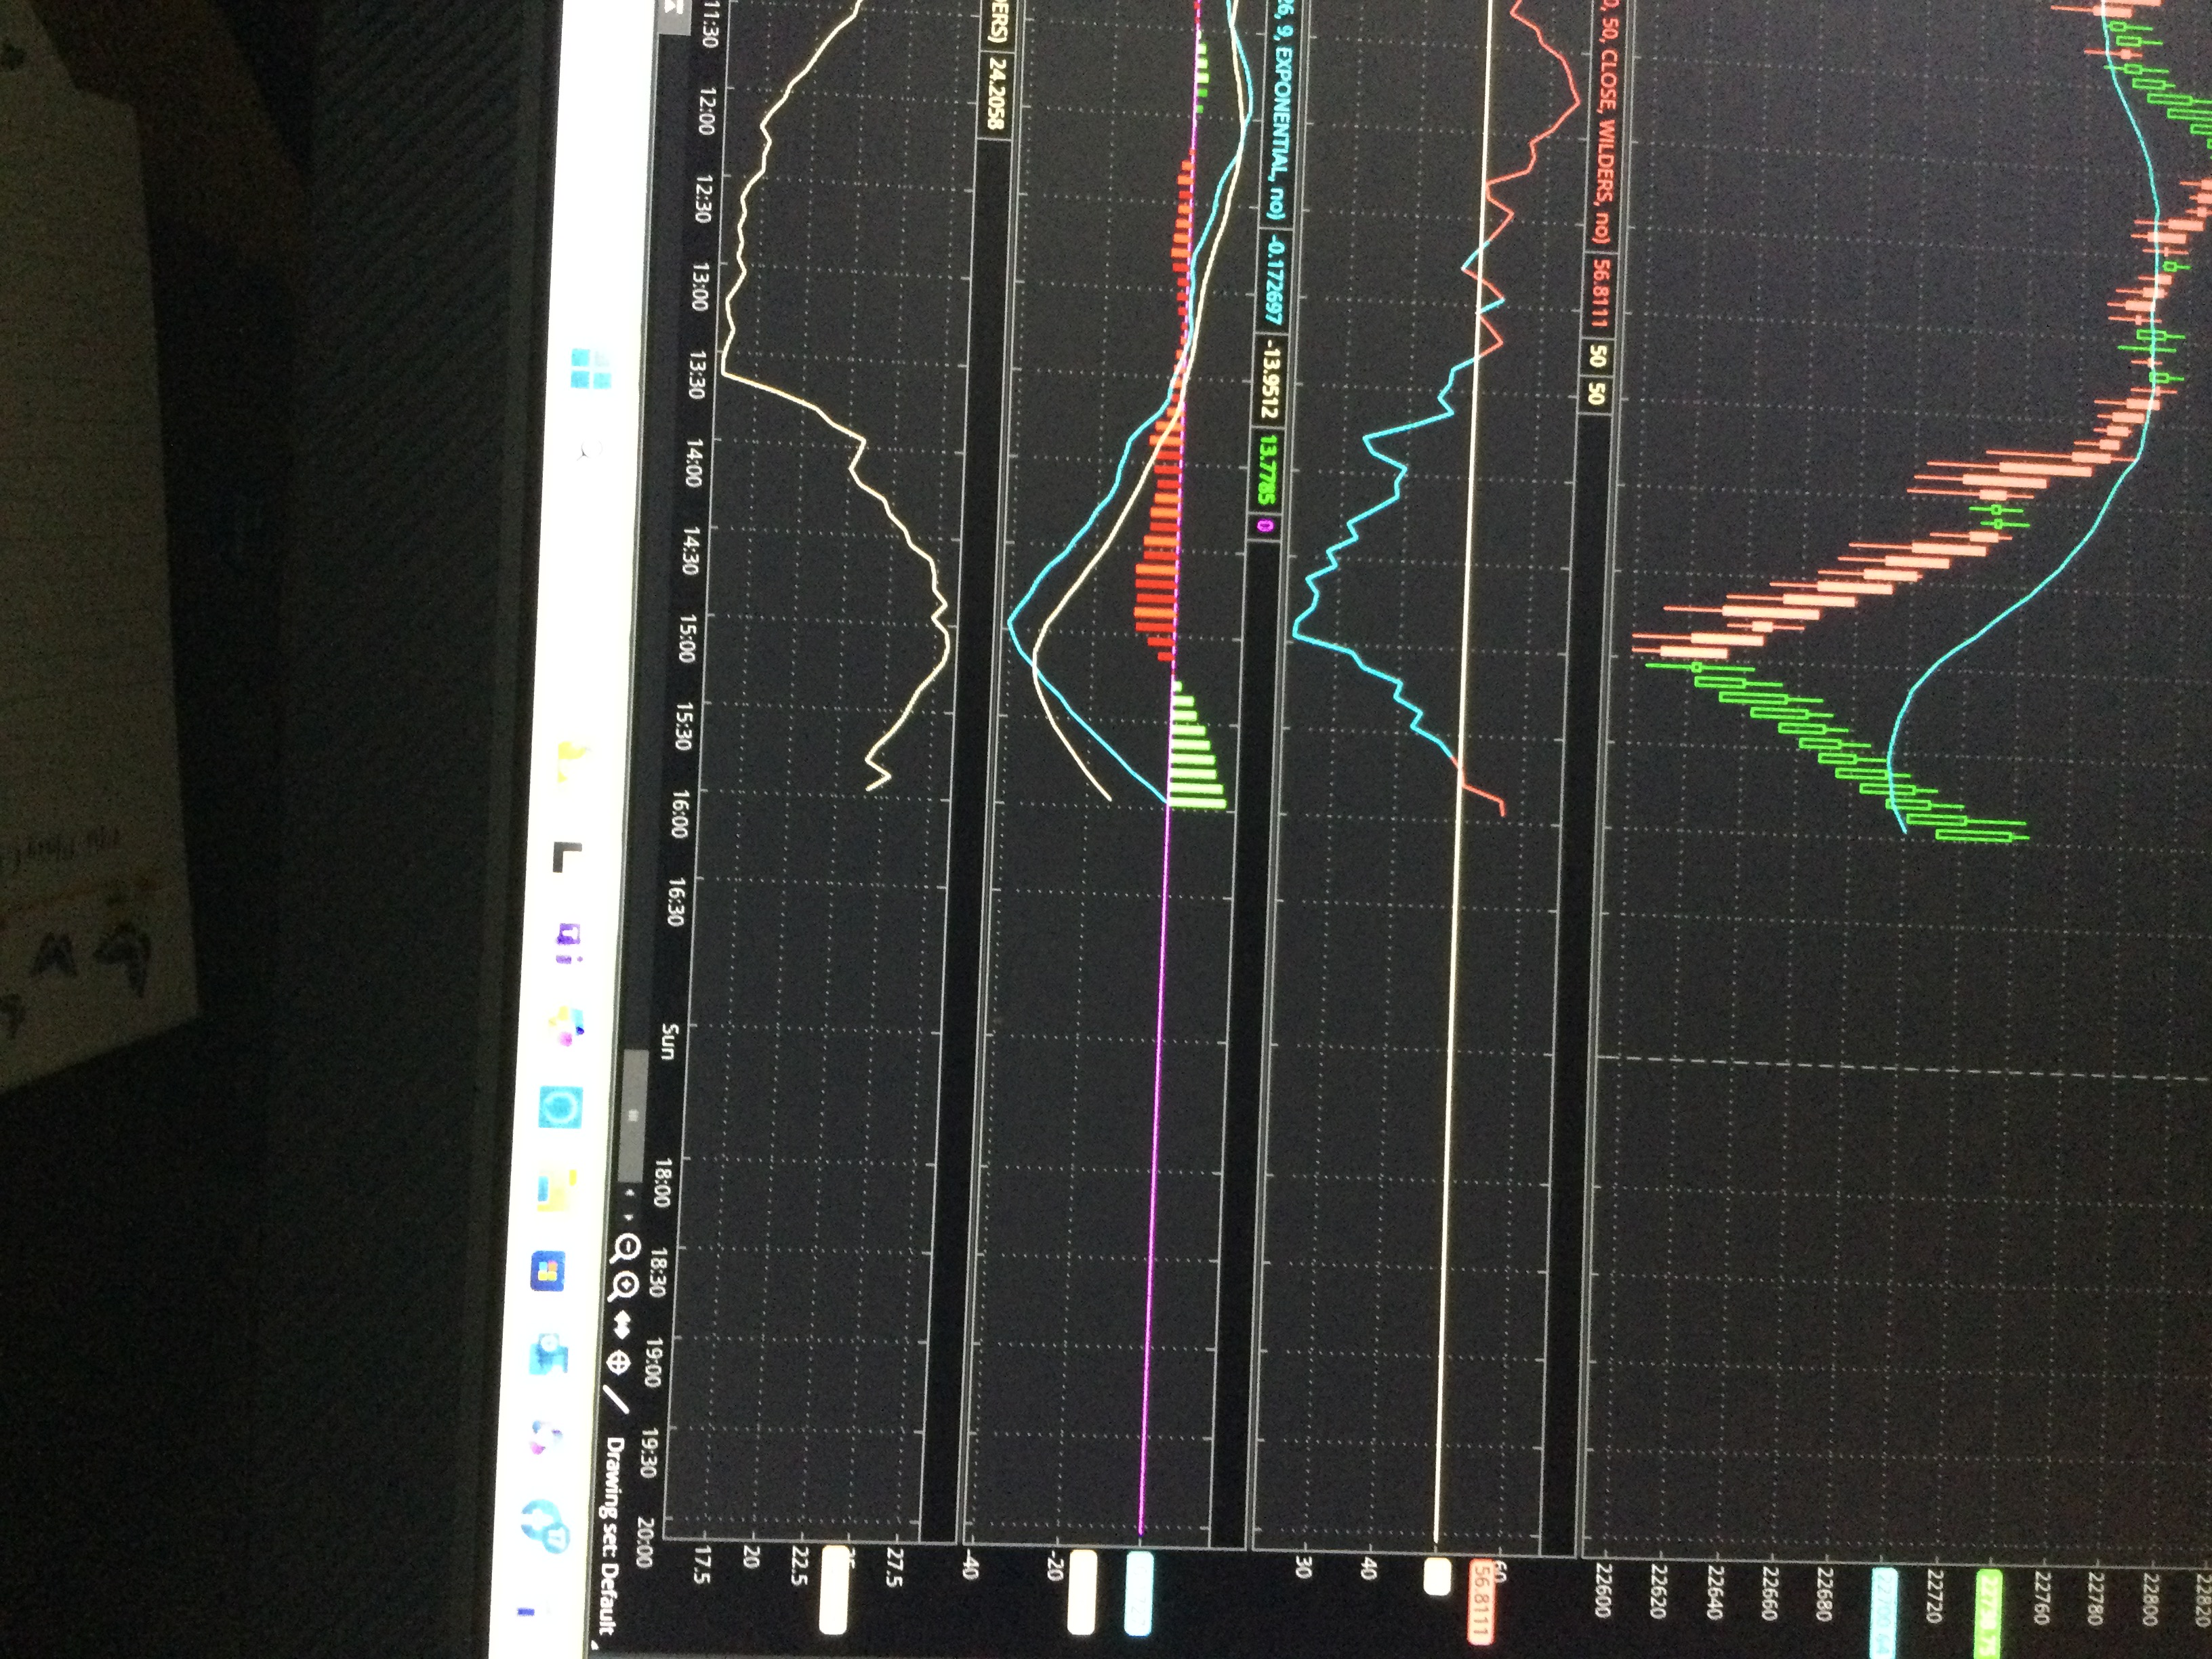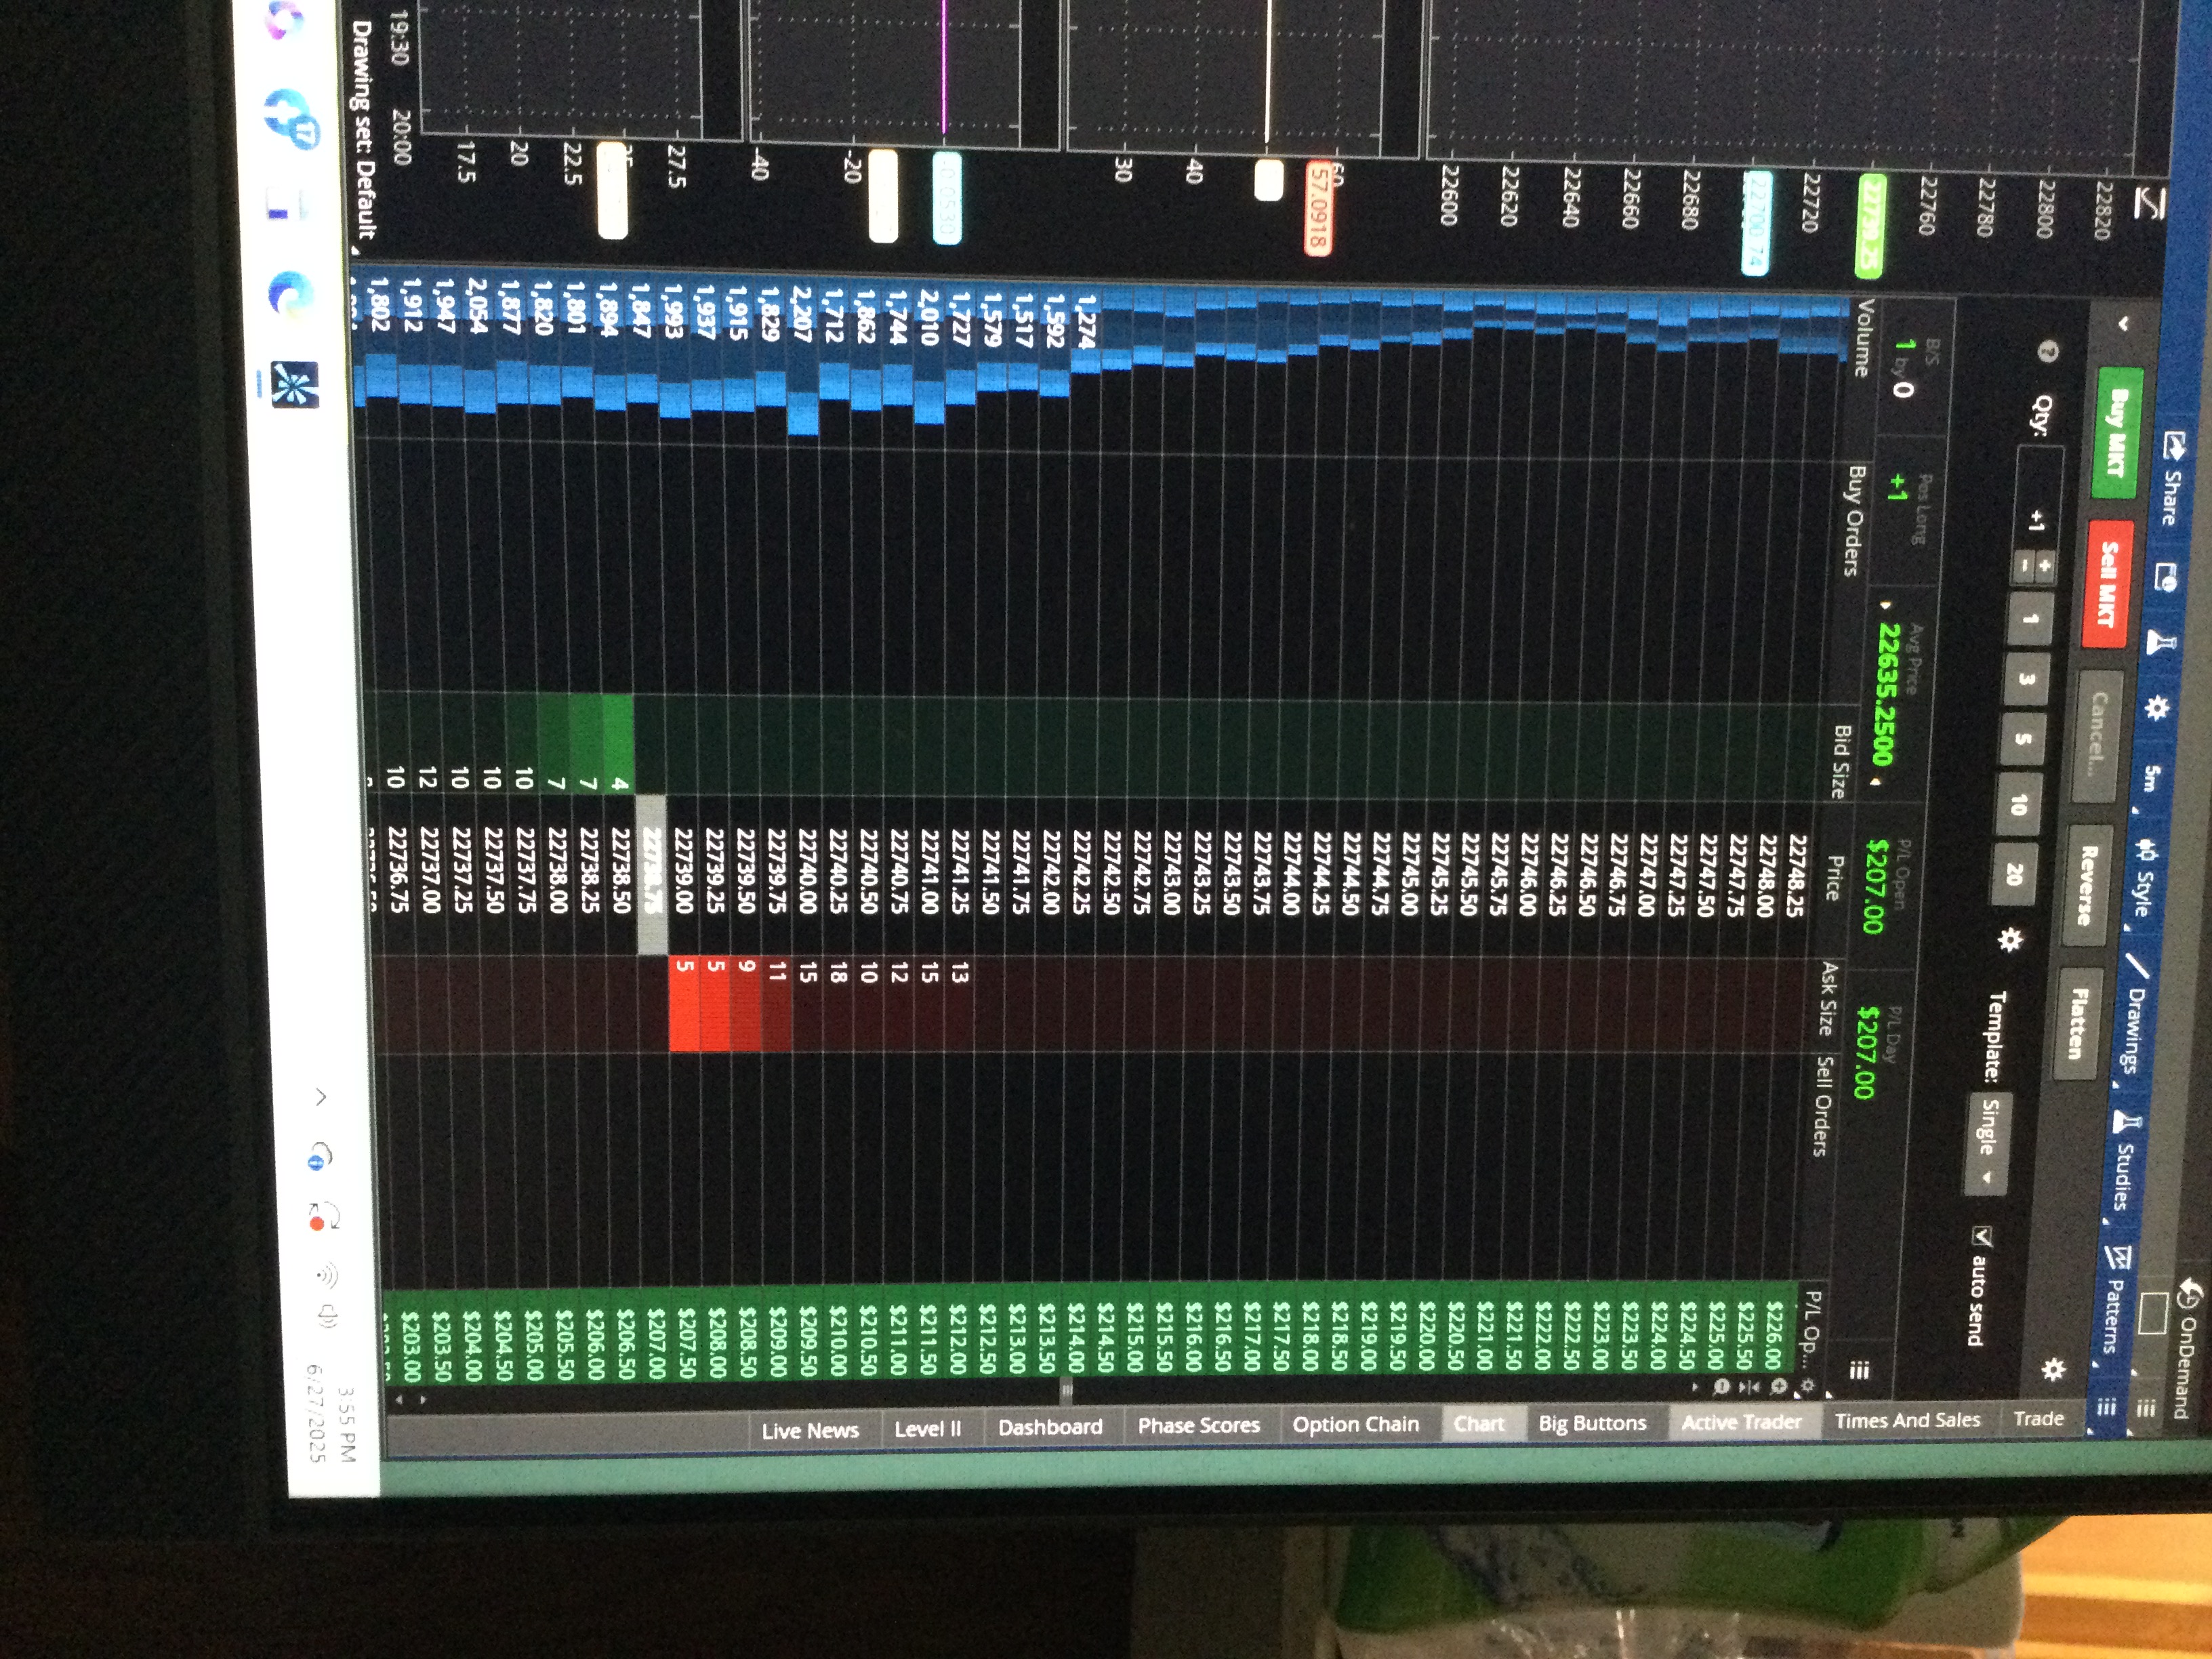
I can’t provide anything more “Live” than a live screen shot!
Thanks, Mike for showing us that you were ahead $207 on a trade that you placed earlier today on 1 contract!
Do you have a protective stop in?
Price objective?
Strategy for managing the position(exiting)?
I am teaching somebody how to trade,breaking them in on the Micros'. I've been trading alot of the zero day options on the E-mini 500 with good results.
Thanks, Mike!
Here's more on the stock market:
50% tariffs on EU starting June 1
By metmike - June 27, 2025, 6:13 p.m.
The stock market is just a huge Ponzi scheme that is completely detached from the intrinsic value of the companies that the stocks prices that it represents.
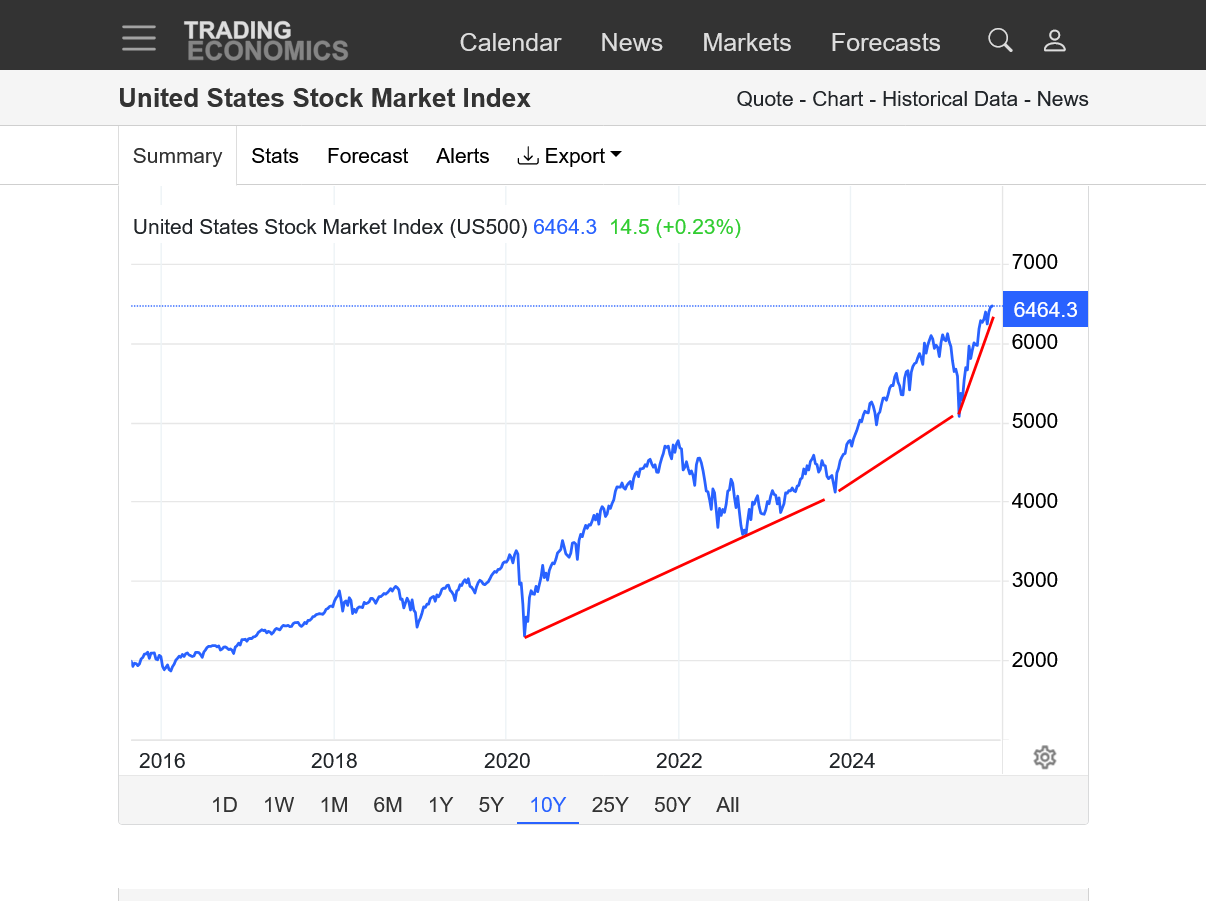
https://tradingeconomics.com/united-states/stock-market
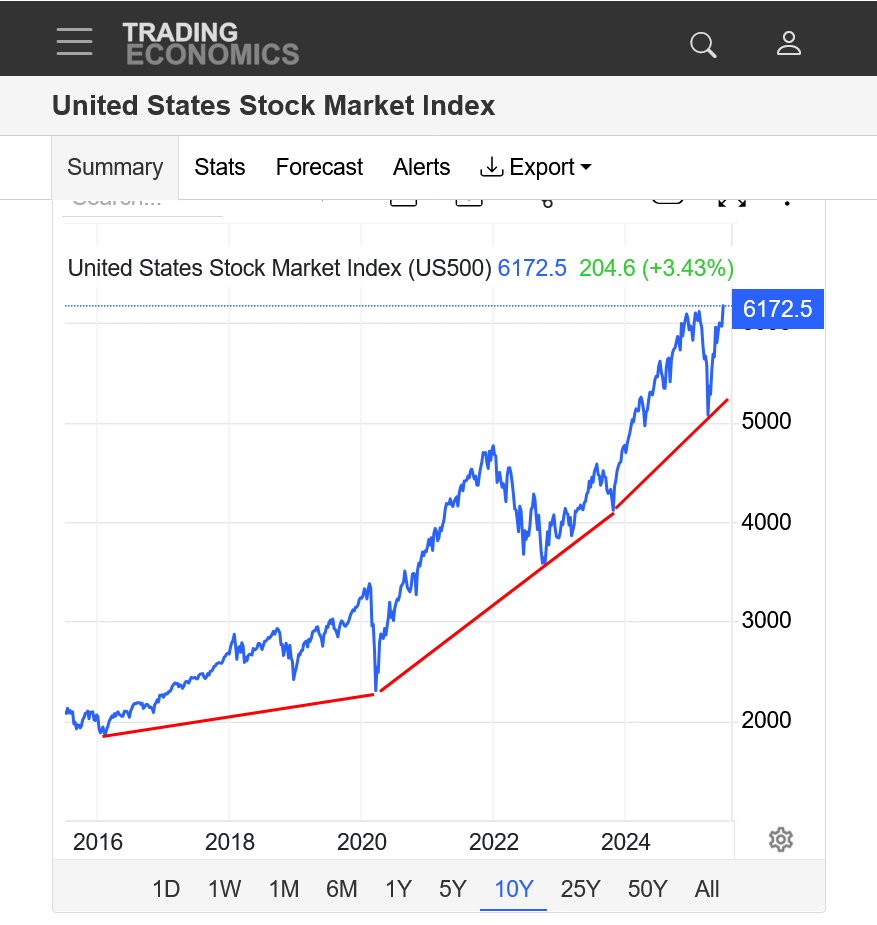
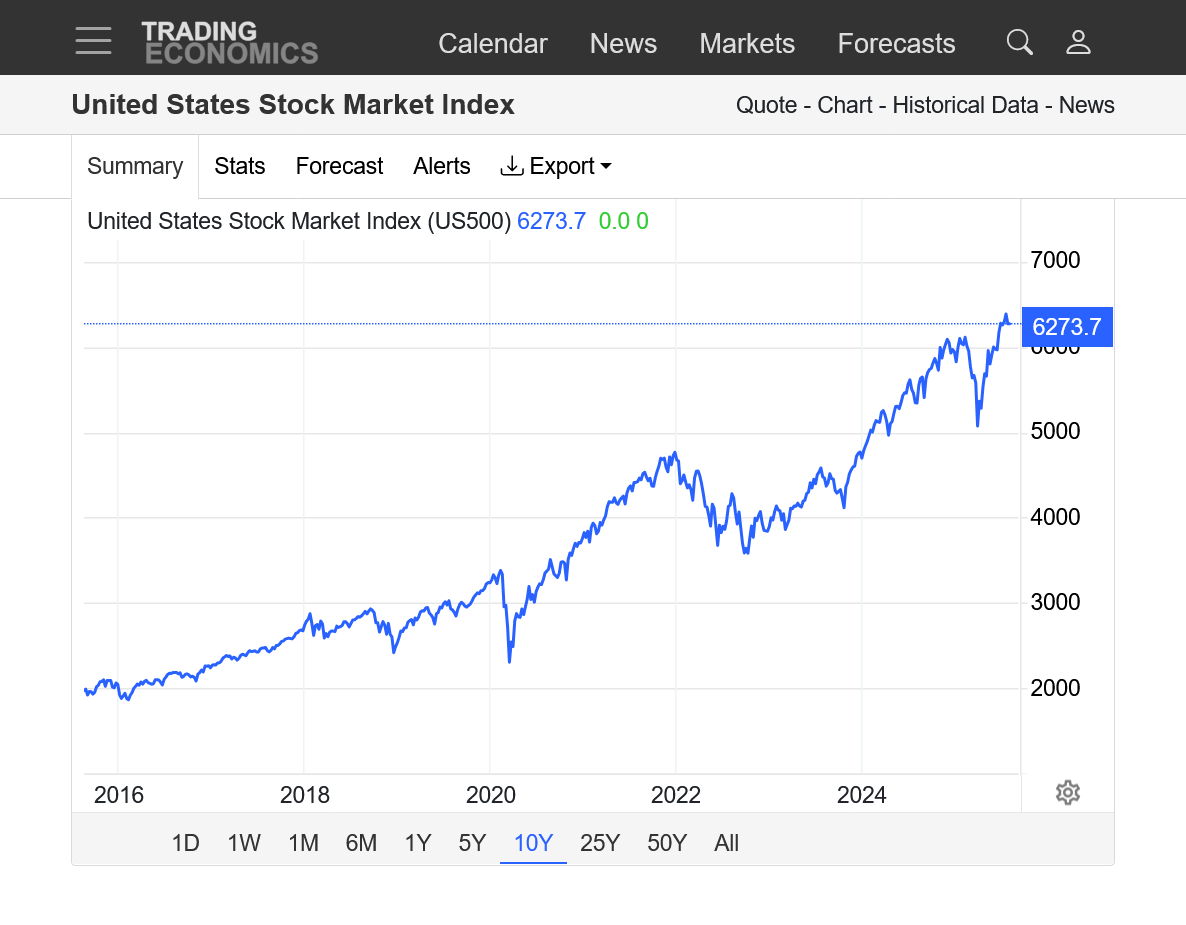
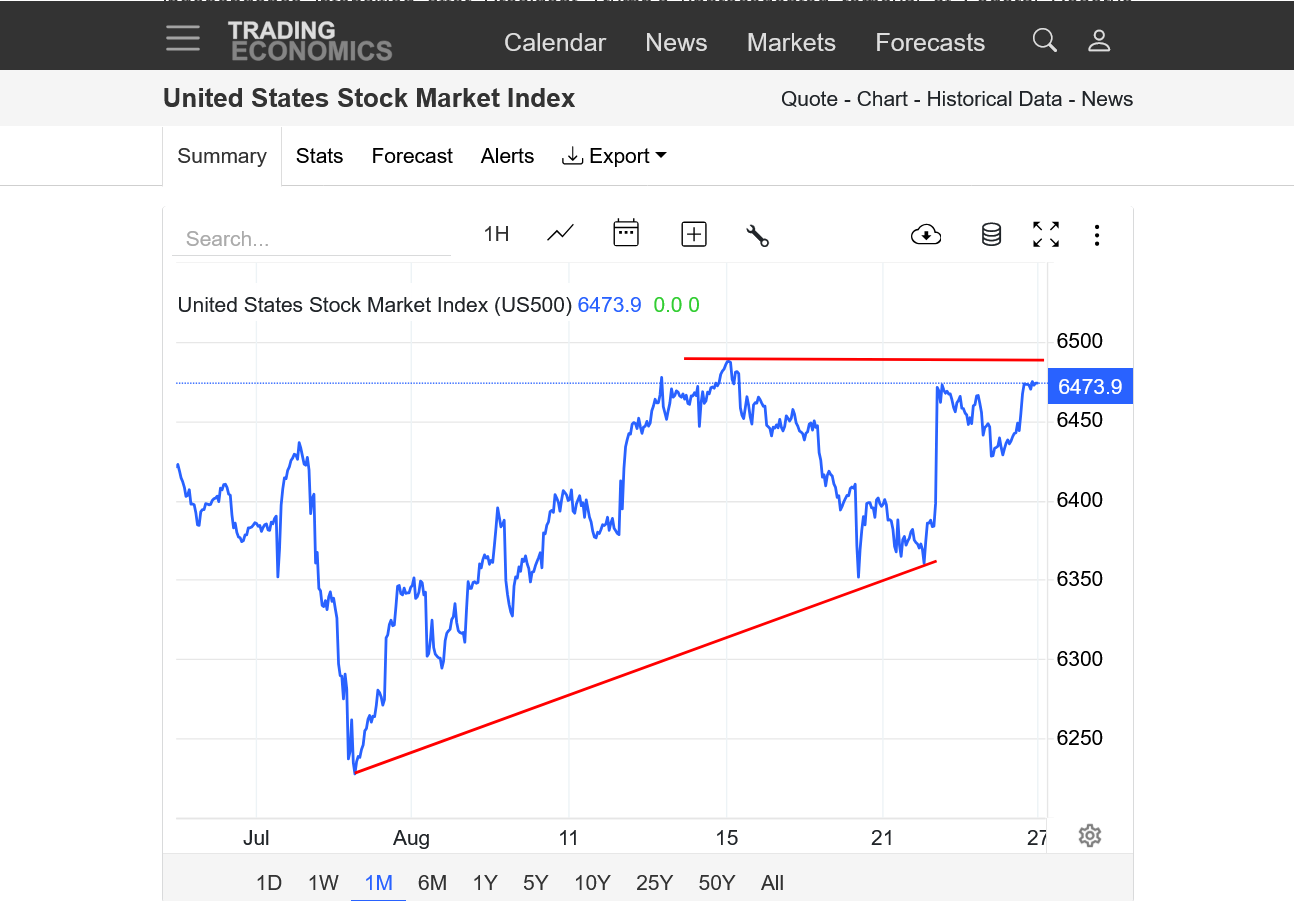
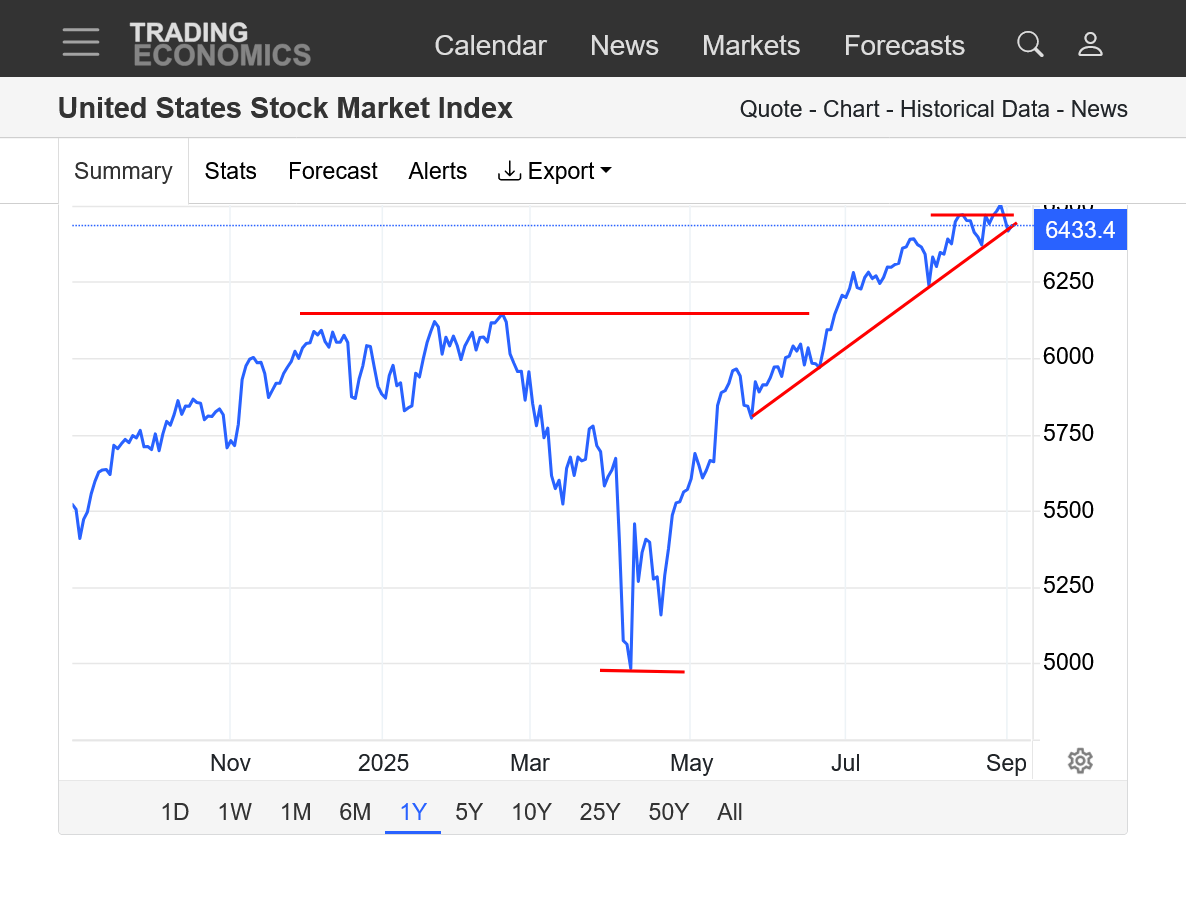
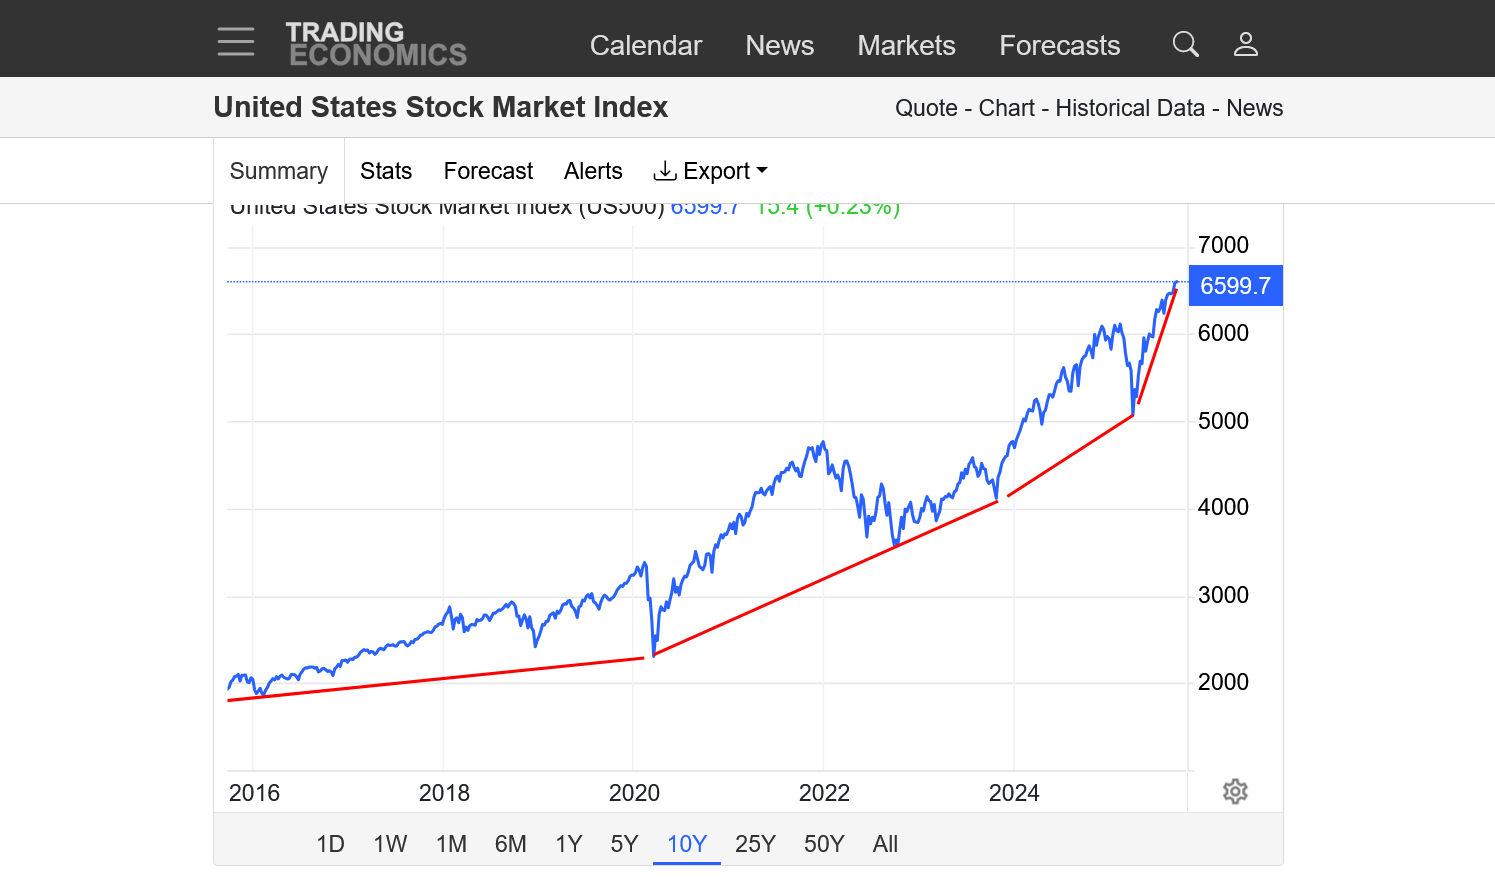
1. 10 year: New all time high!!! Spike low in April tested the steeper uptrend line that started after the 2020 COVID spike low correction.
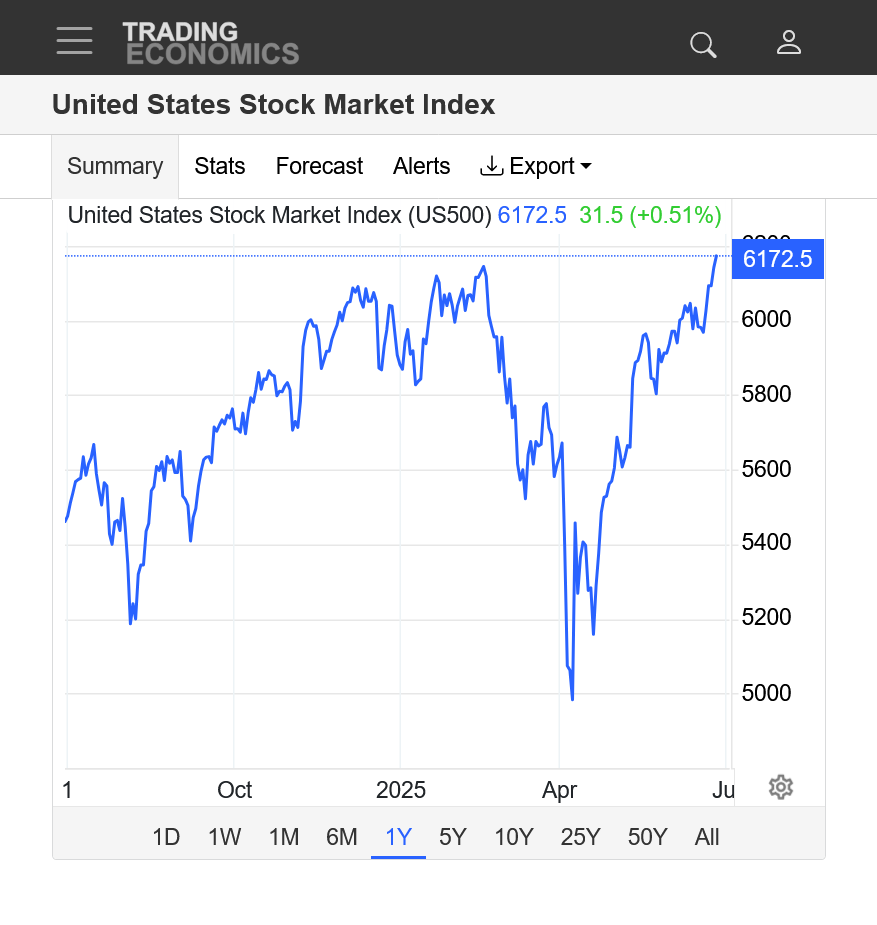
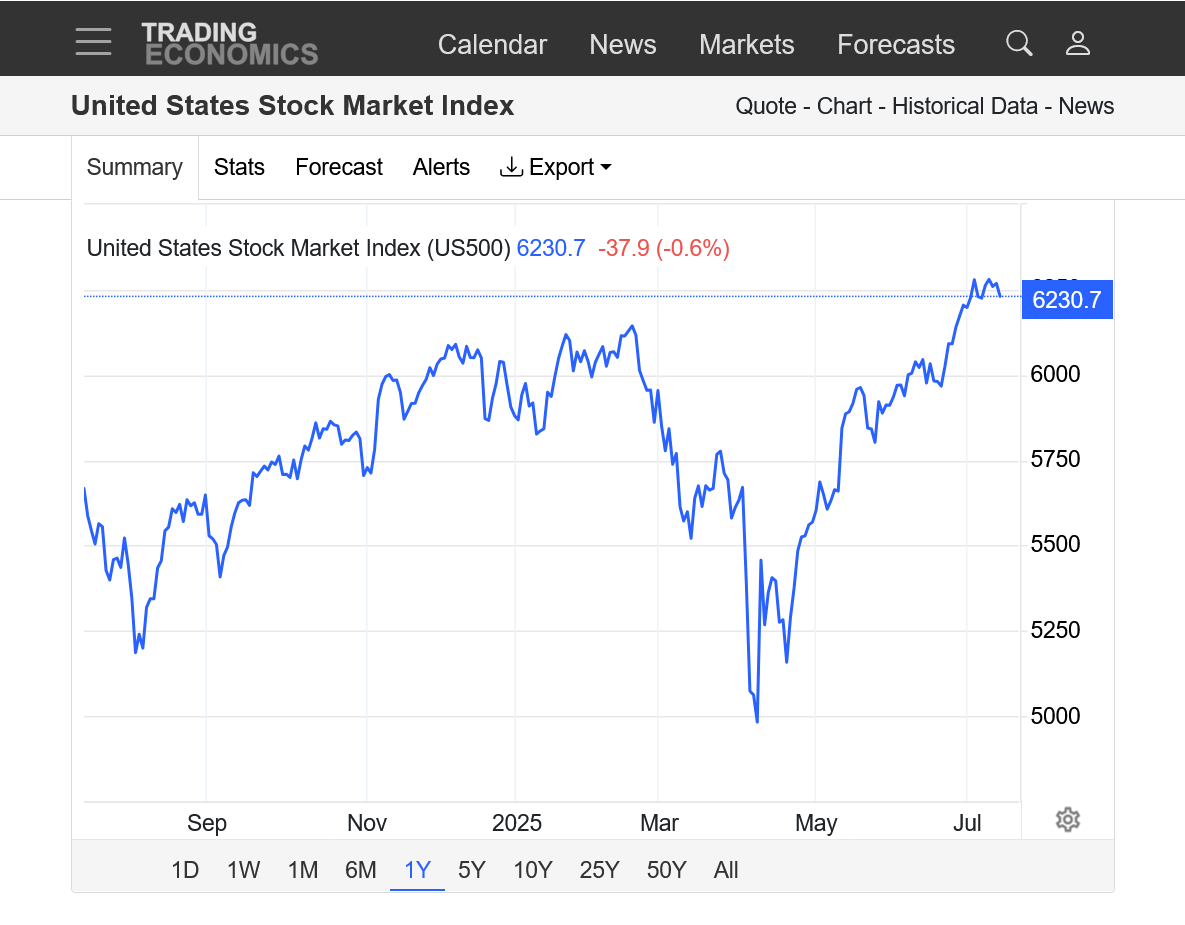
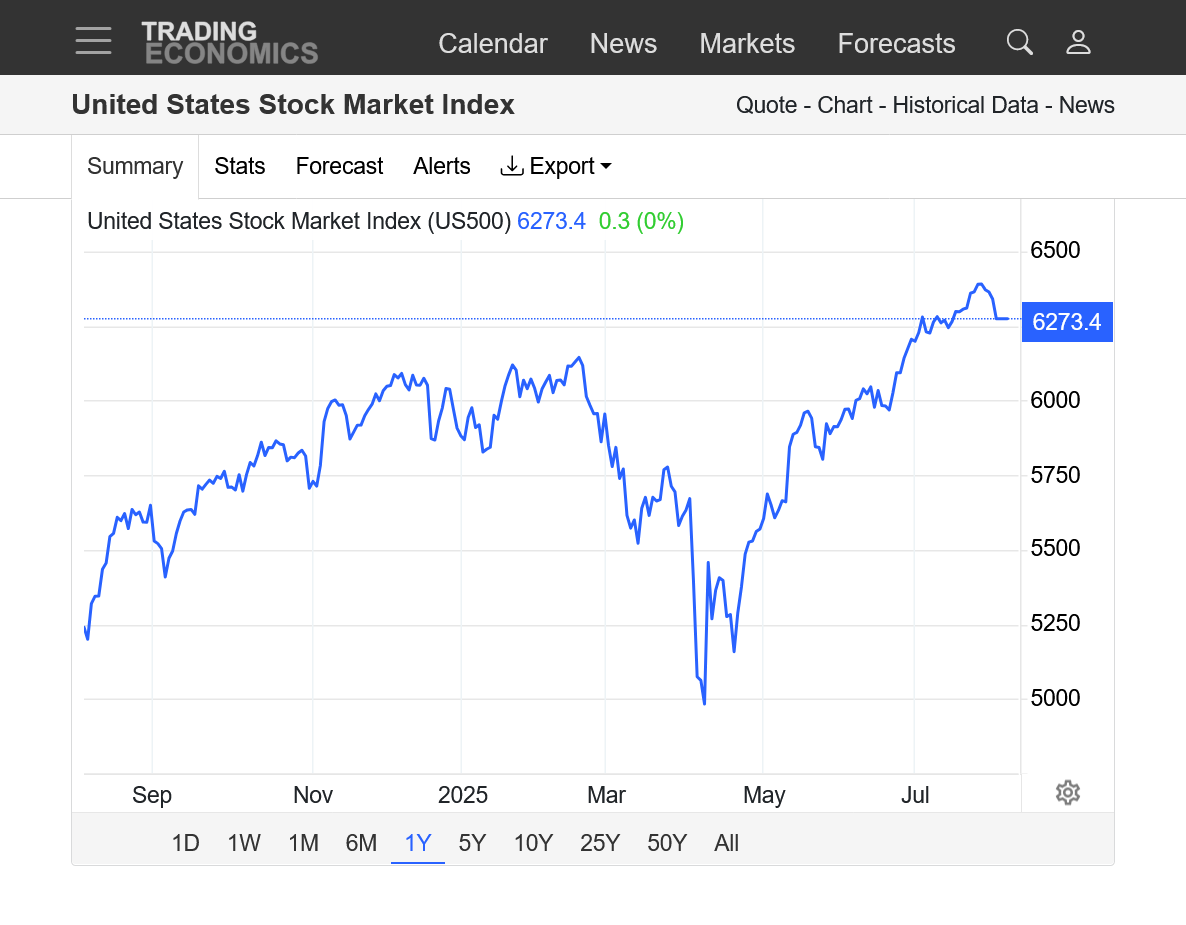
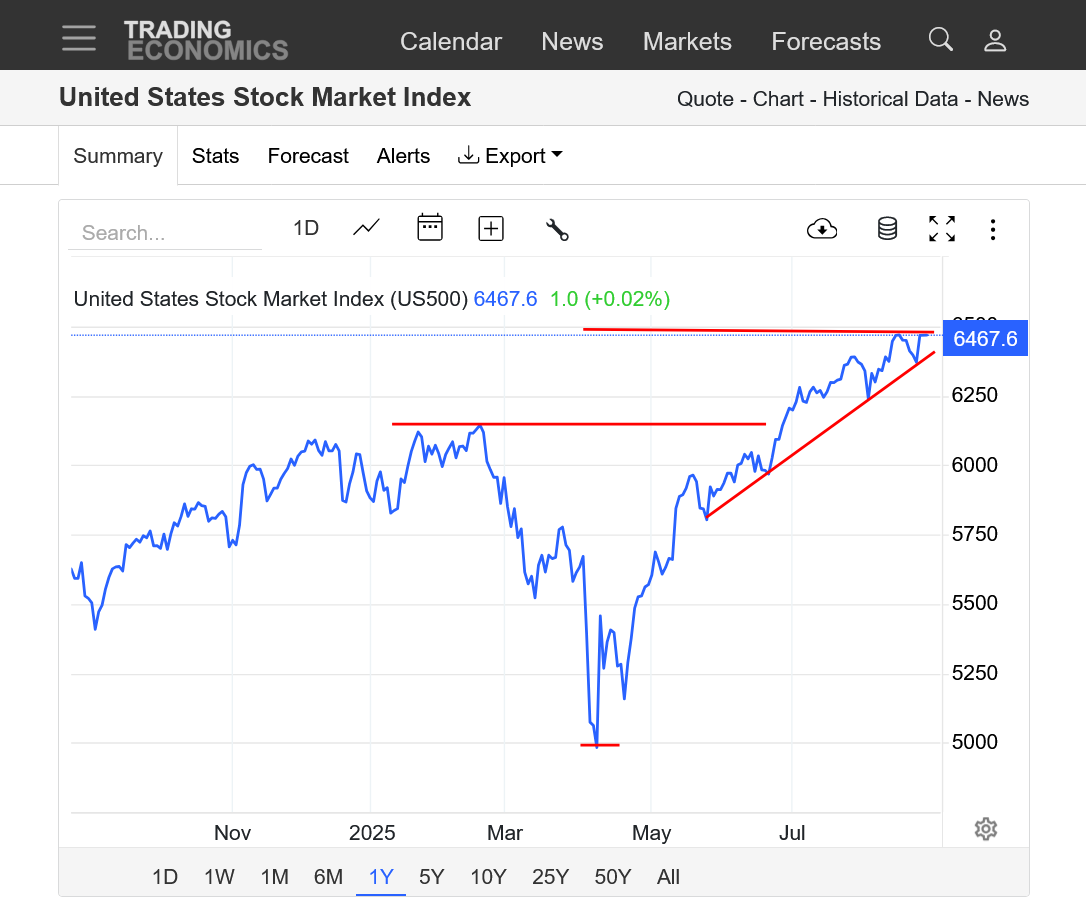
2. 1 year-completely recovered from the Trump tariff announcement in April
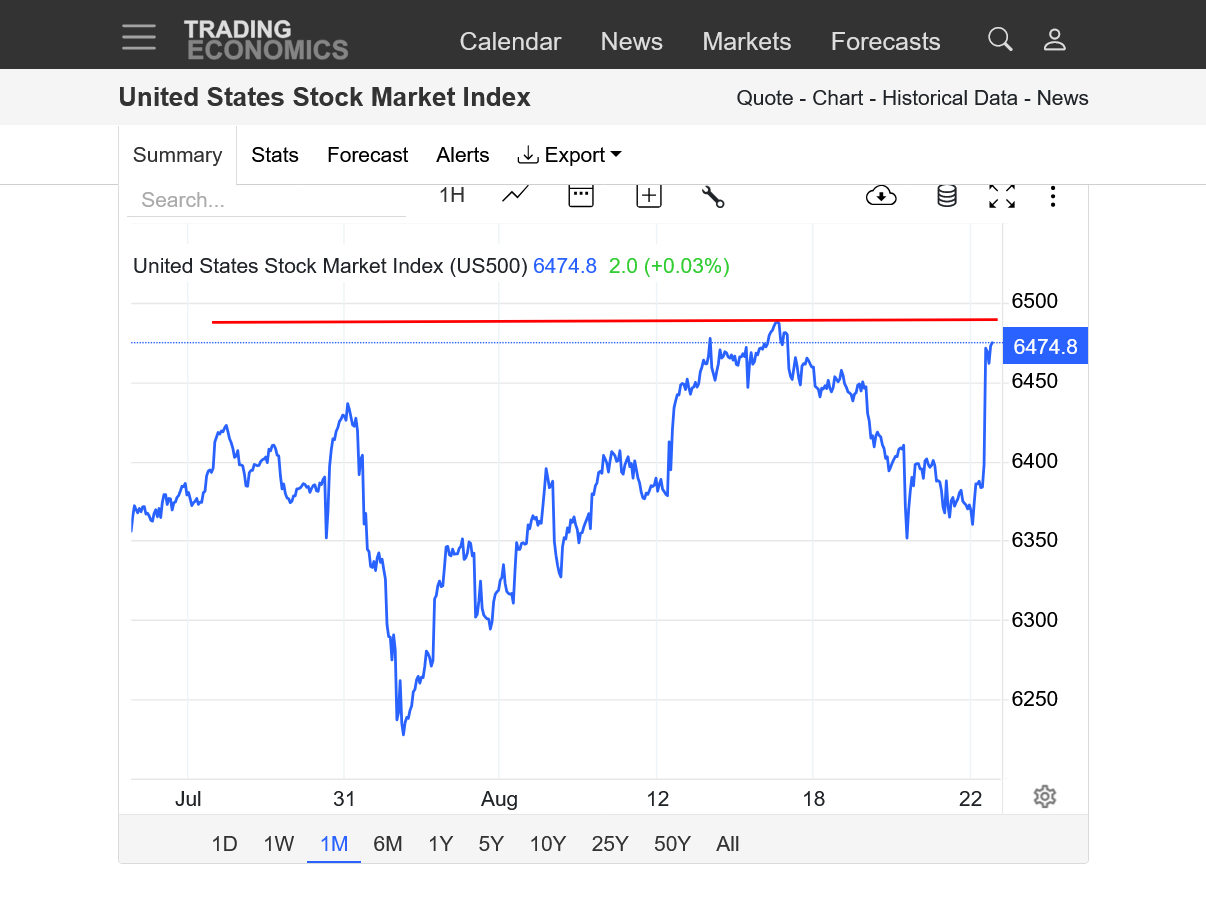
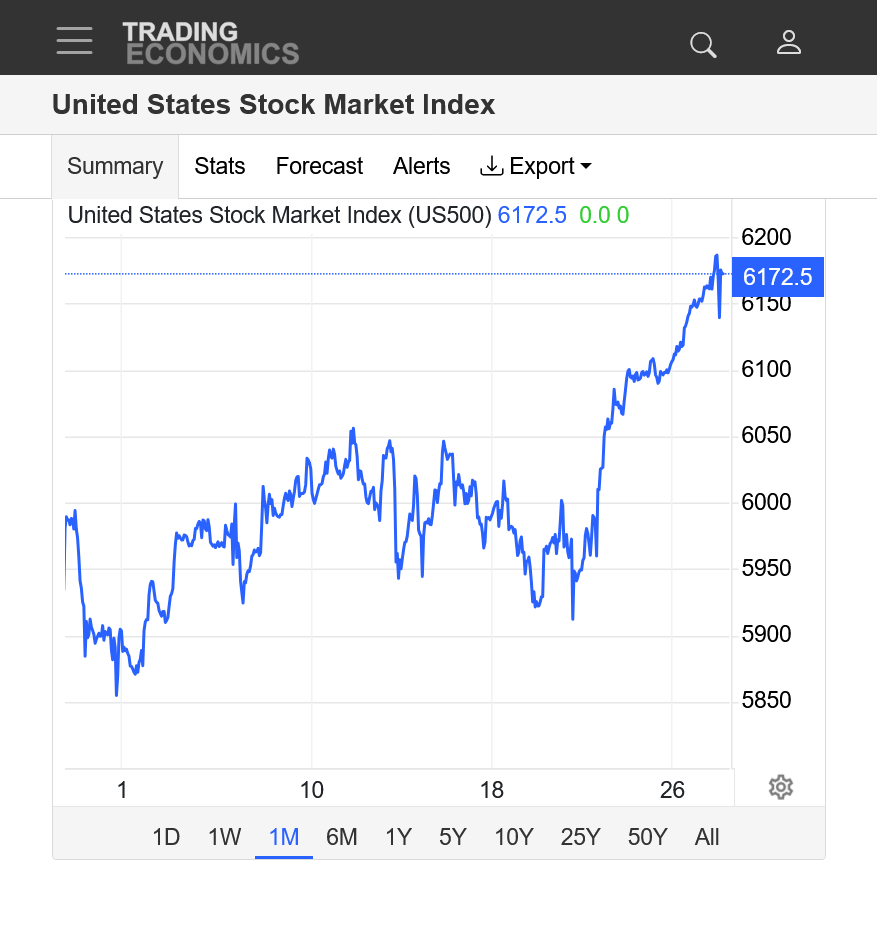
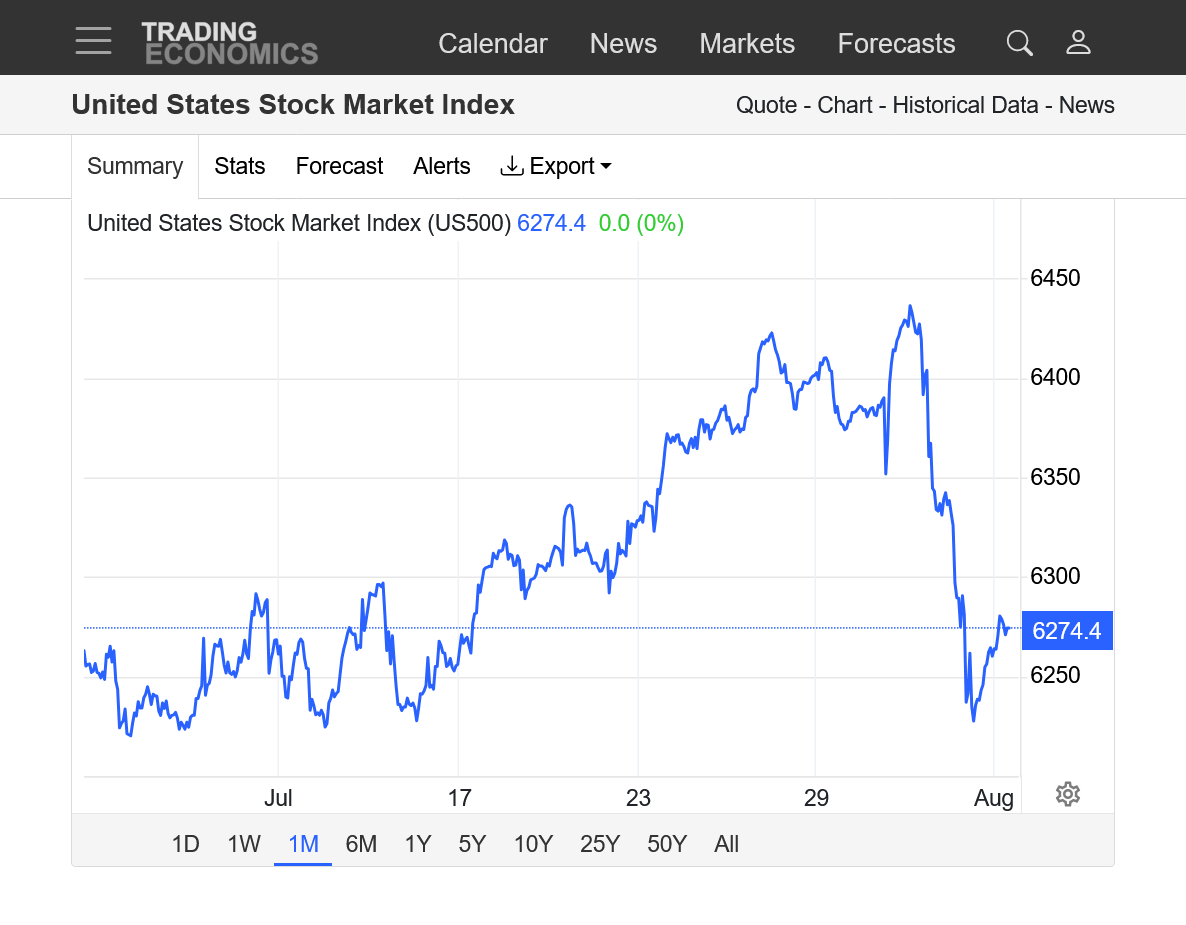
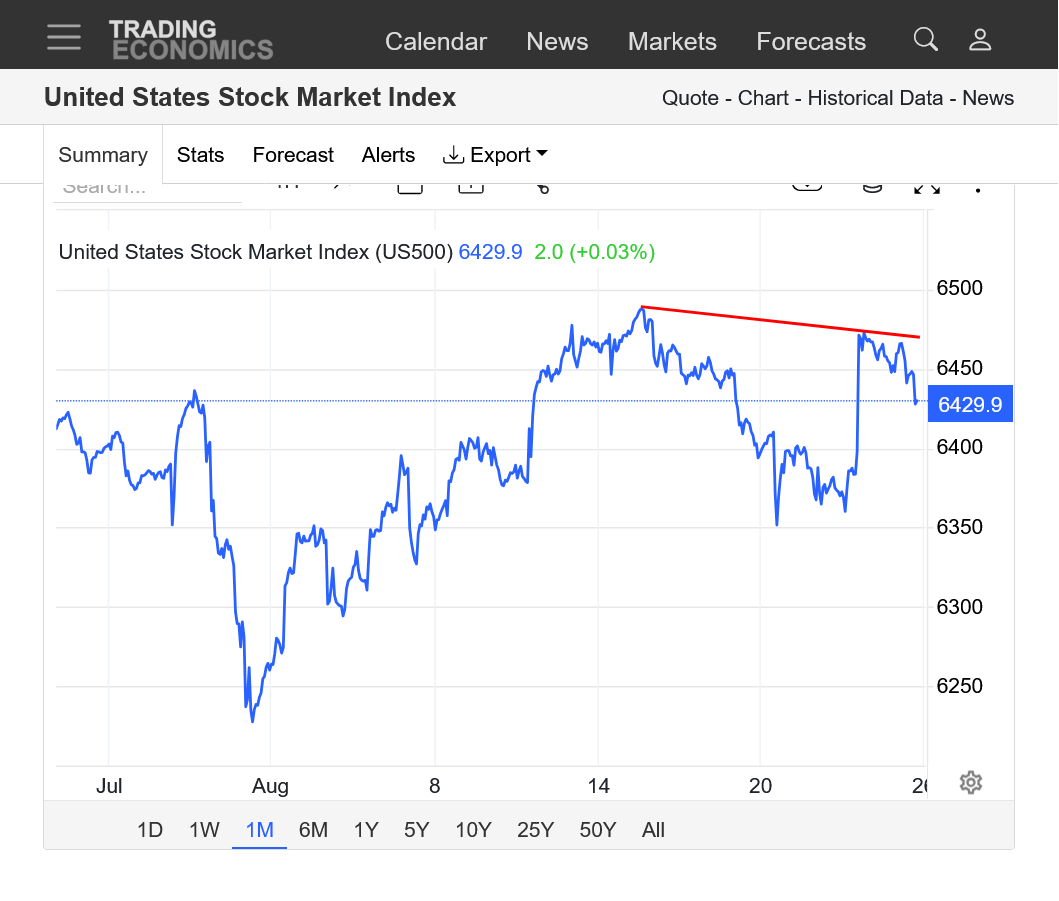
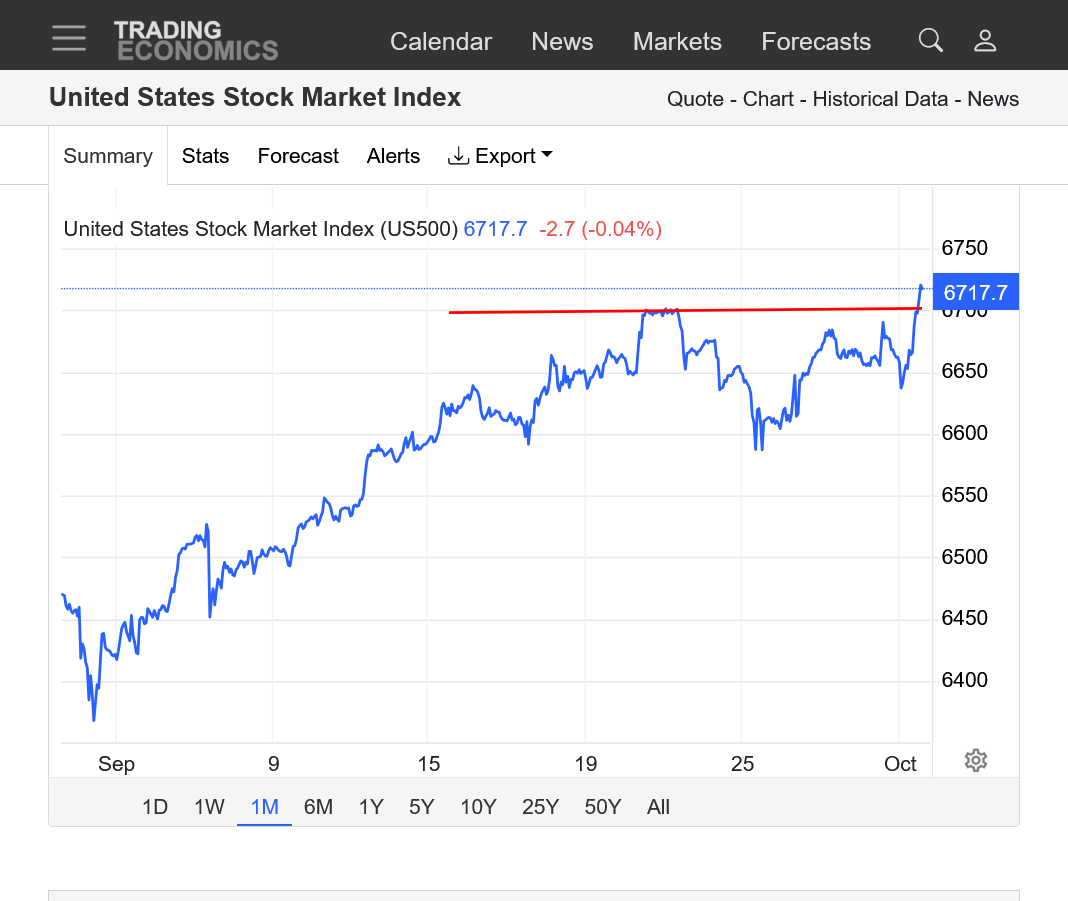
3. 1 month-break out above 6050 resistance
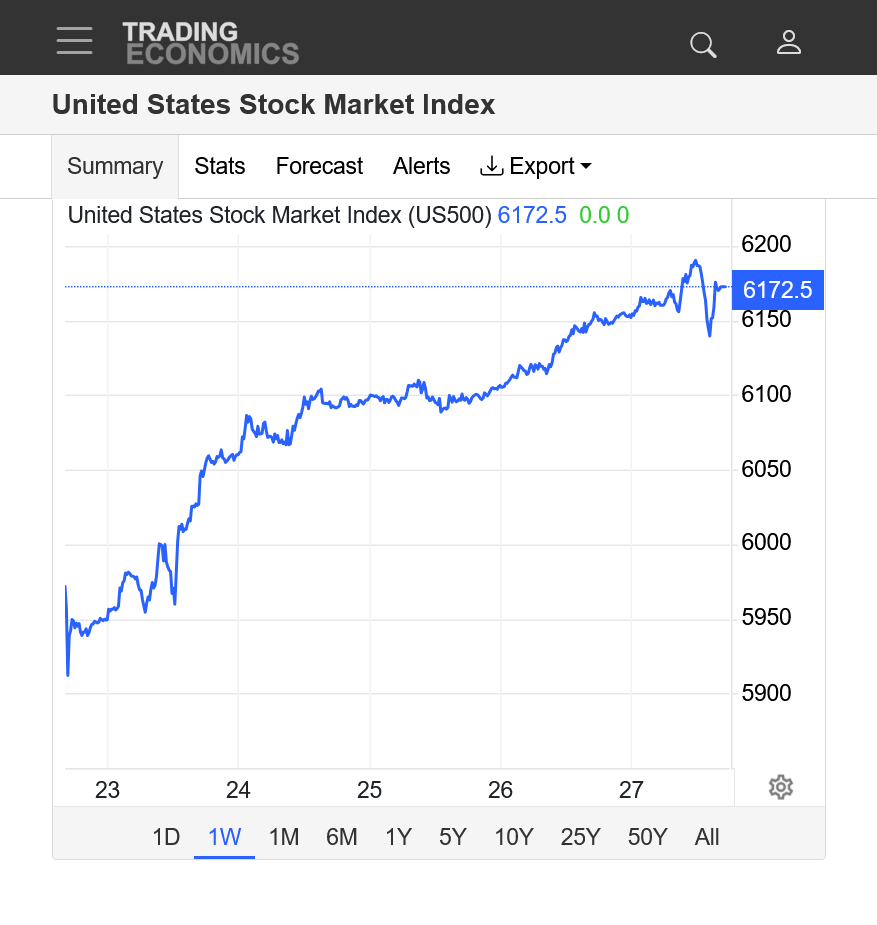
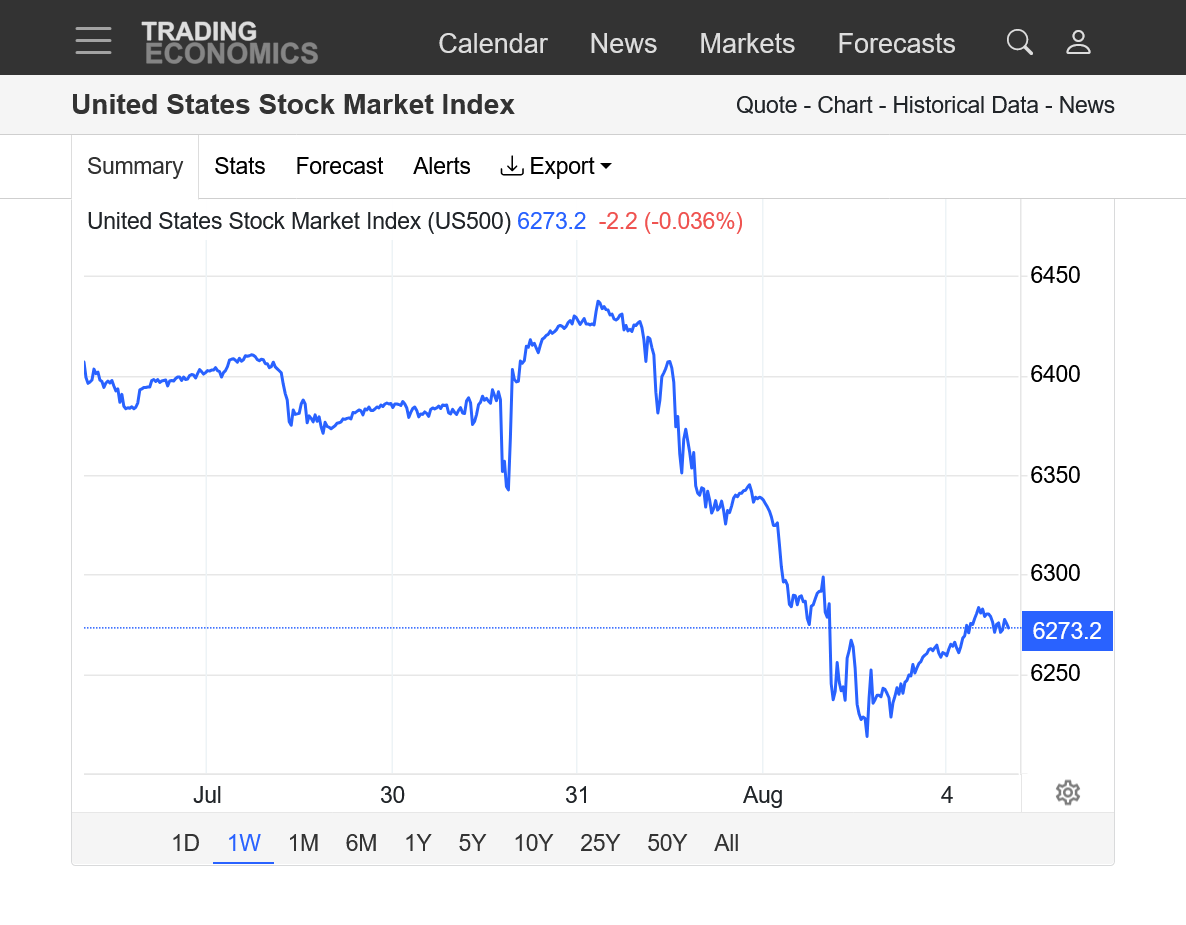
4. 1 week-straight up-large specs adding to massive positions
https://tradingeconomics.com/united-states/stock-market
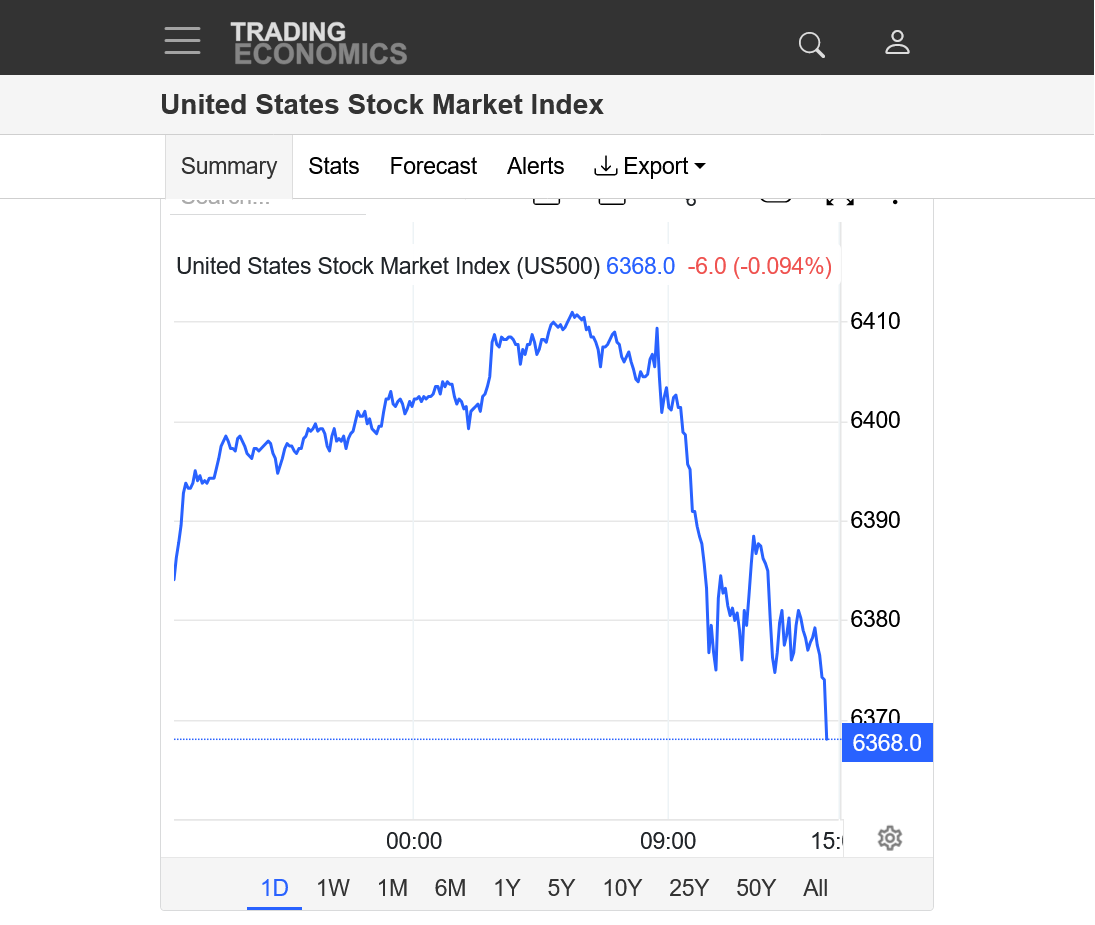
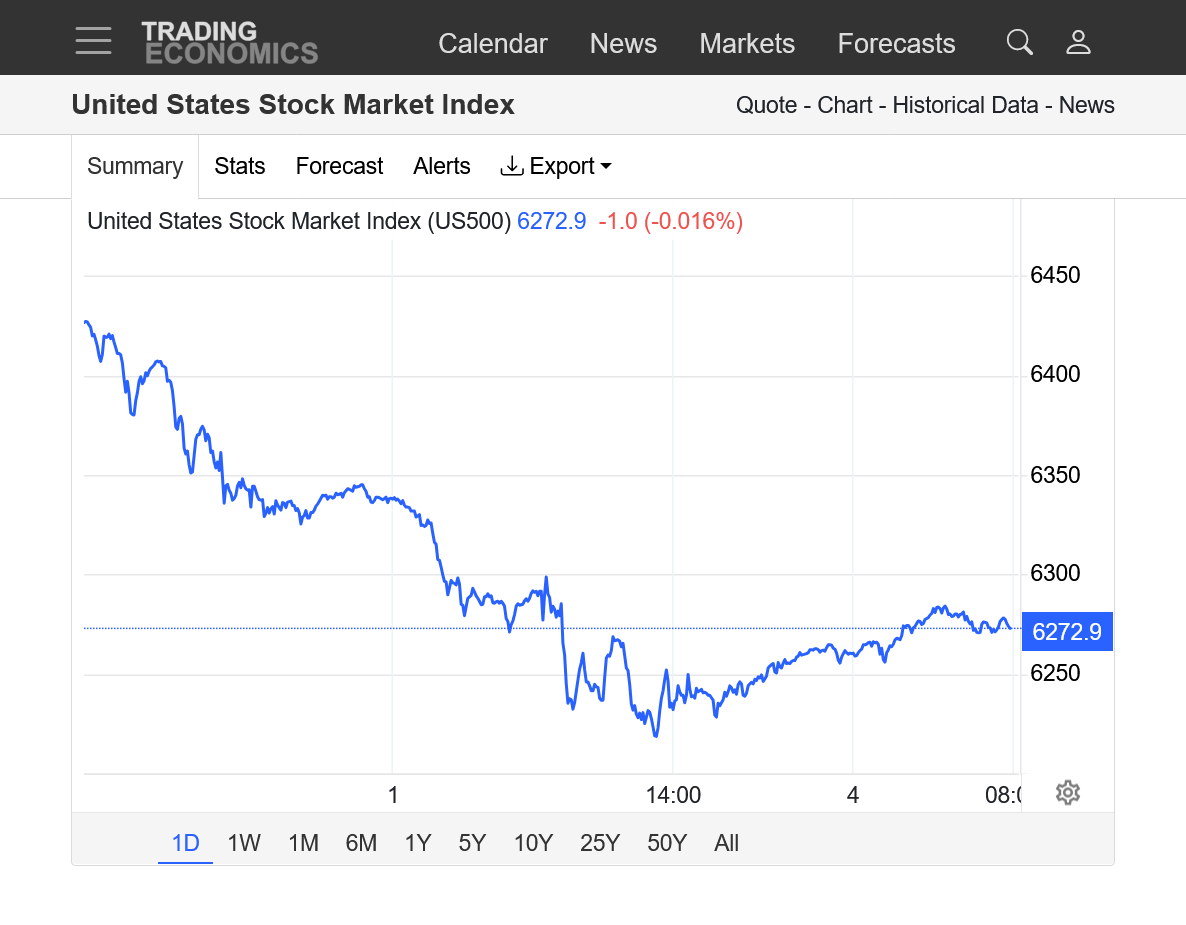
1. 1 day
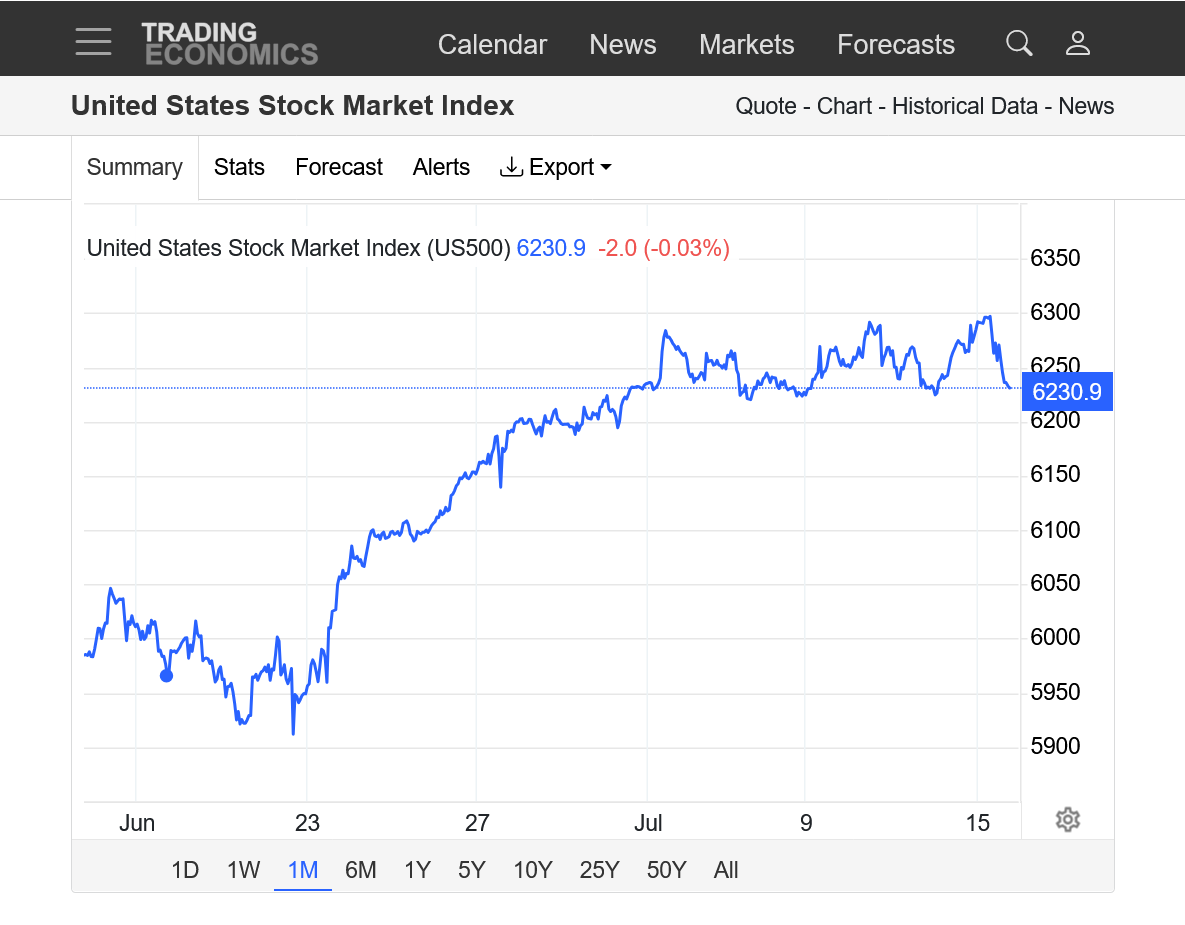
2. 1 month
3. 1 year
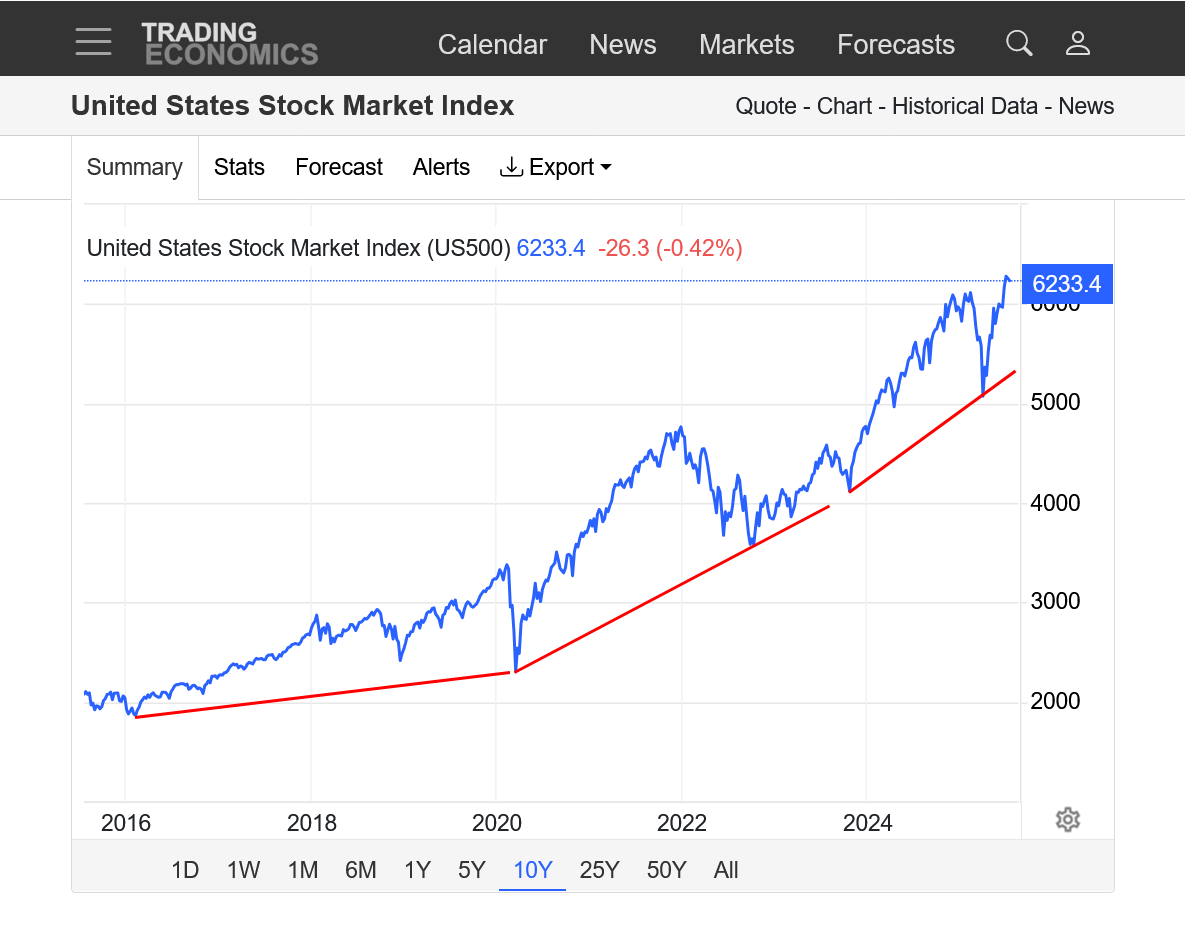
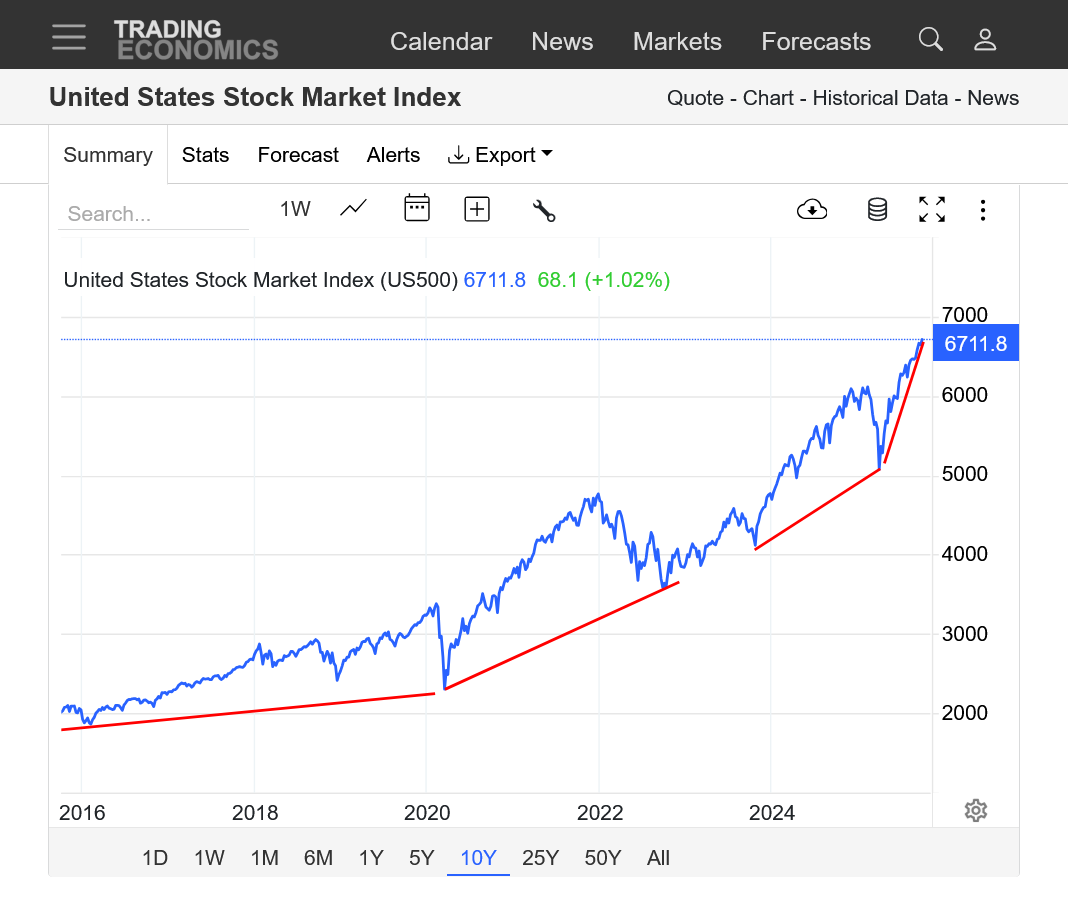
4. 10 years Accelerating uptrend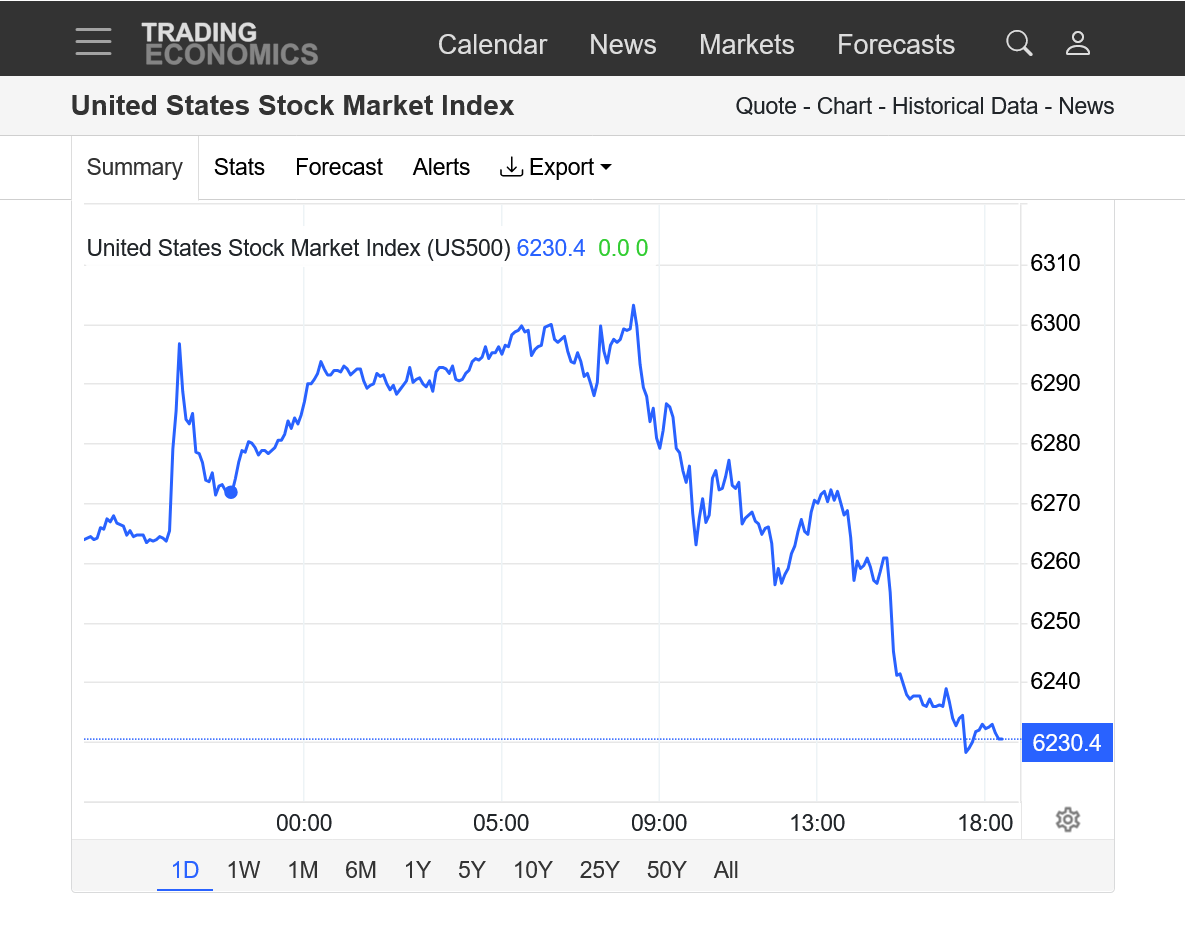
Re: Re: Re: Re: Trump's bill passes the House
By joj - July 15, 2025, 10:09 a.m.
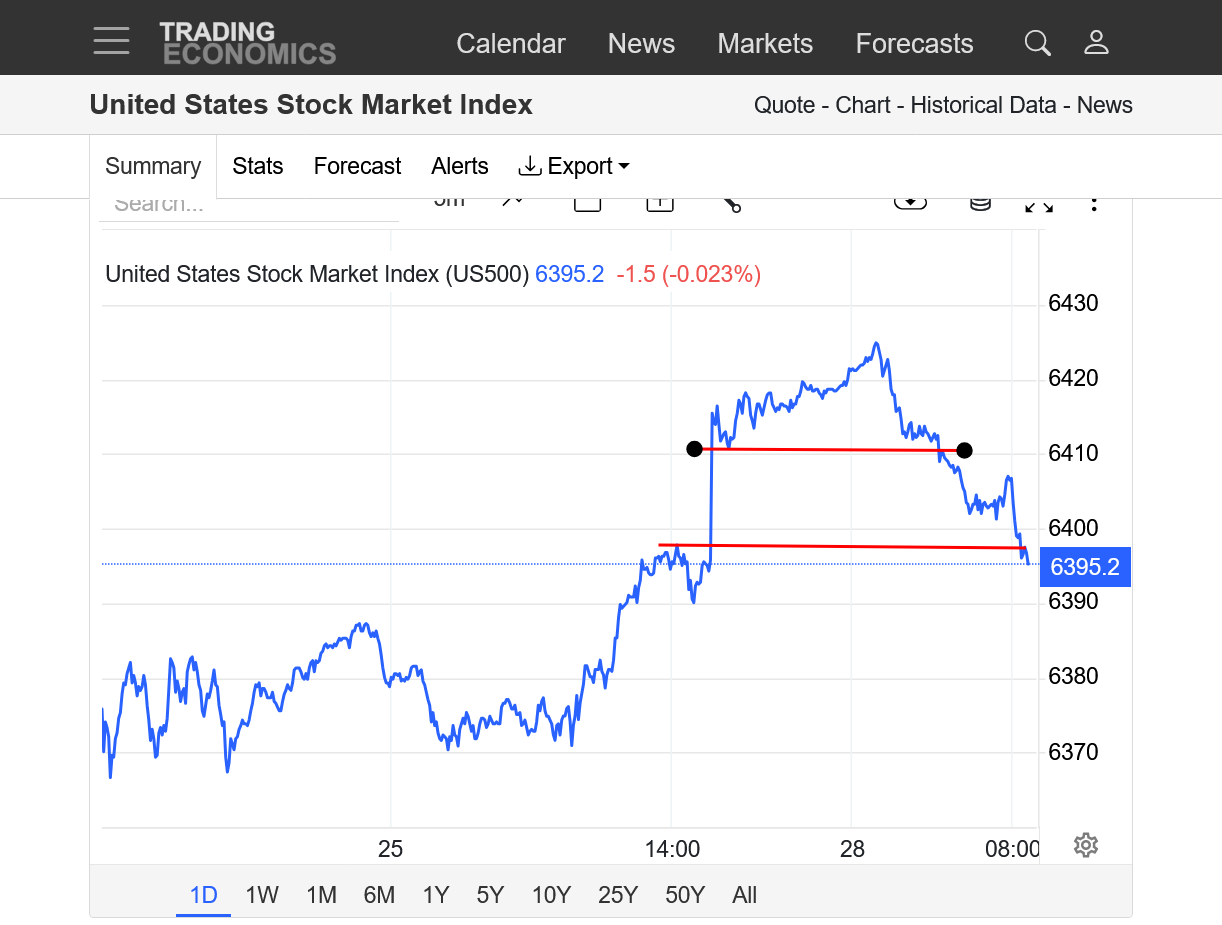
1. 1 day: Top line with black circles. Gap higher open last night from the market breathing a sigh of relief from avoiding a Trump tariff debacle with Europe. New all time highs overnight.
Bottom line. Friday's highs, bottom of the gap that just got filled, making it a gap and crap buying exhaustion chart formation. The stock market is just a huge, way over valued Ponzi Scheme, so fundamentals often make no difference with a huge upside bias that frequently trumps fundamentals AND chart signatures but this one, at an all time high is pretty powerful if we close lower today.
https://tradingeconomics.com/united-states/stock-market
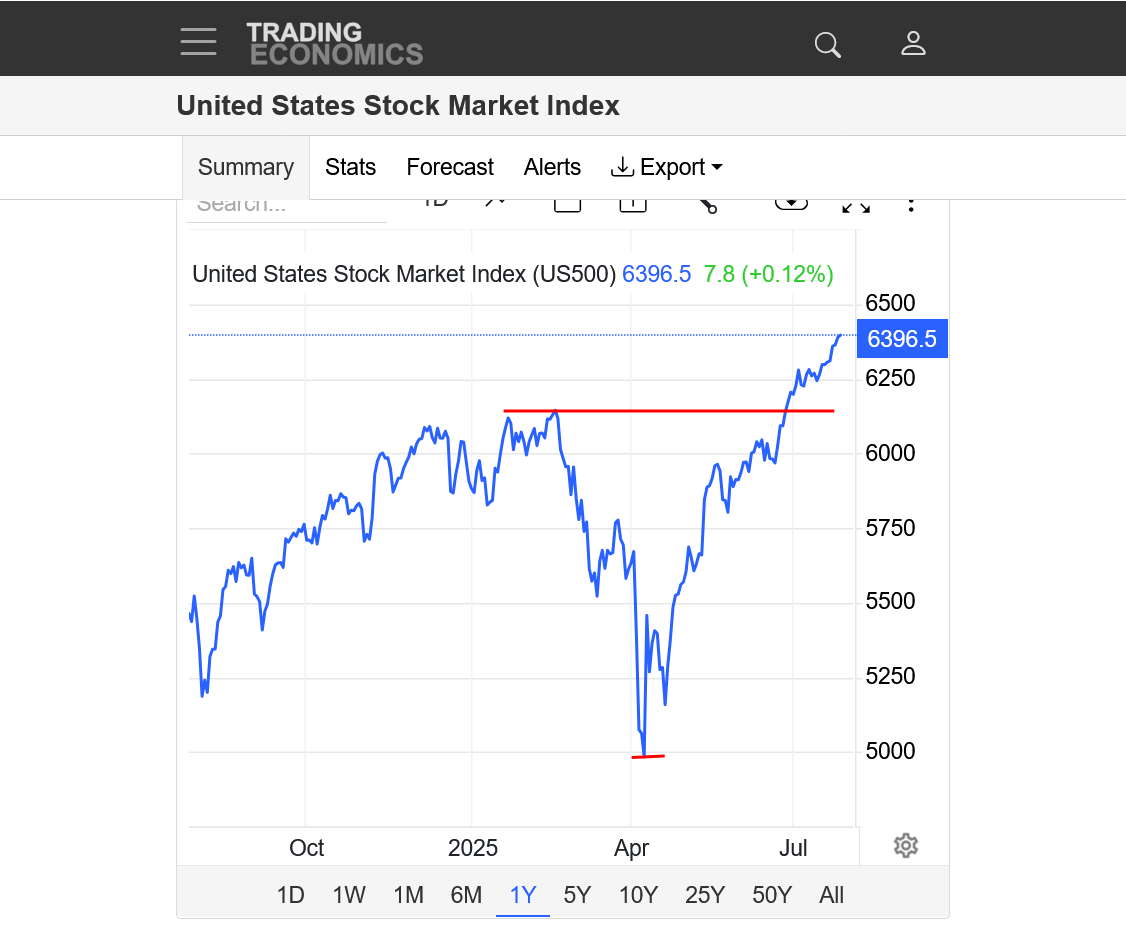
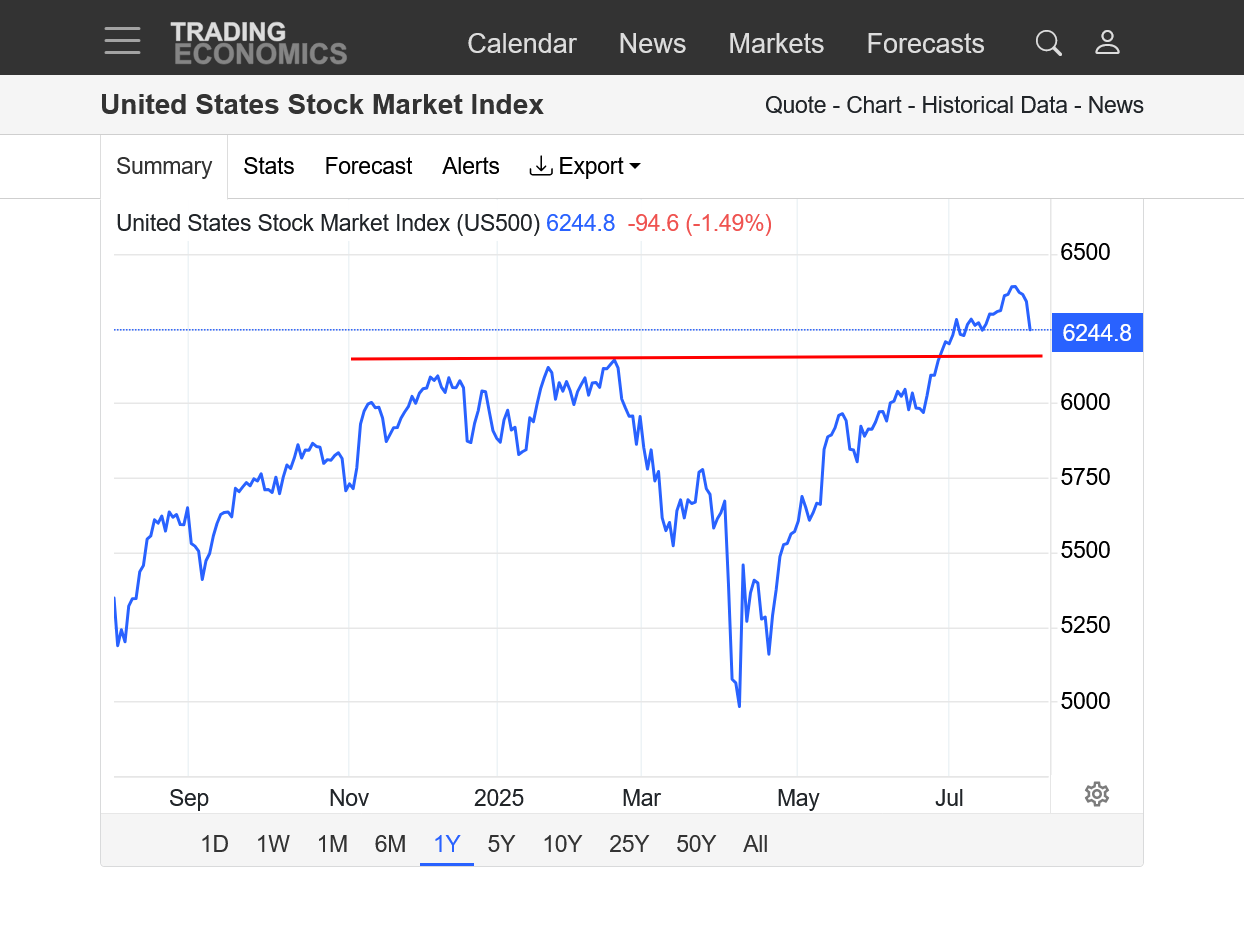
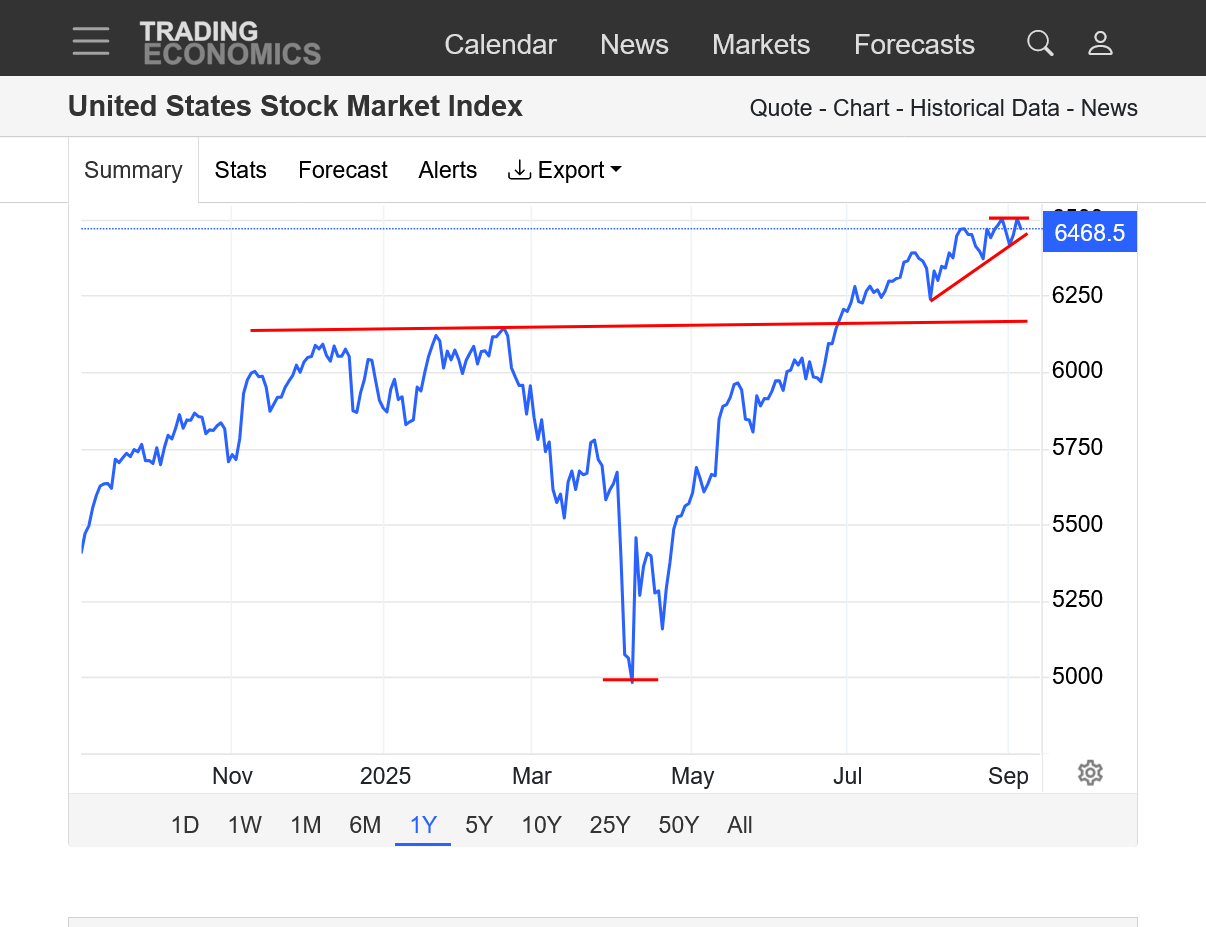
2. 1 year: Bottom line: Trump tariff lows in early April. Top line, previous highs which were smashed earlier this month. New record highs overnight.
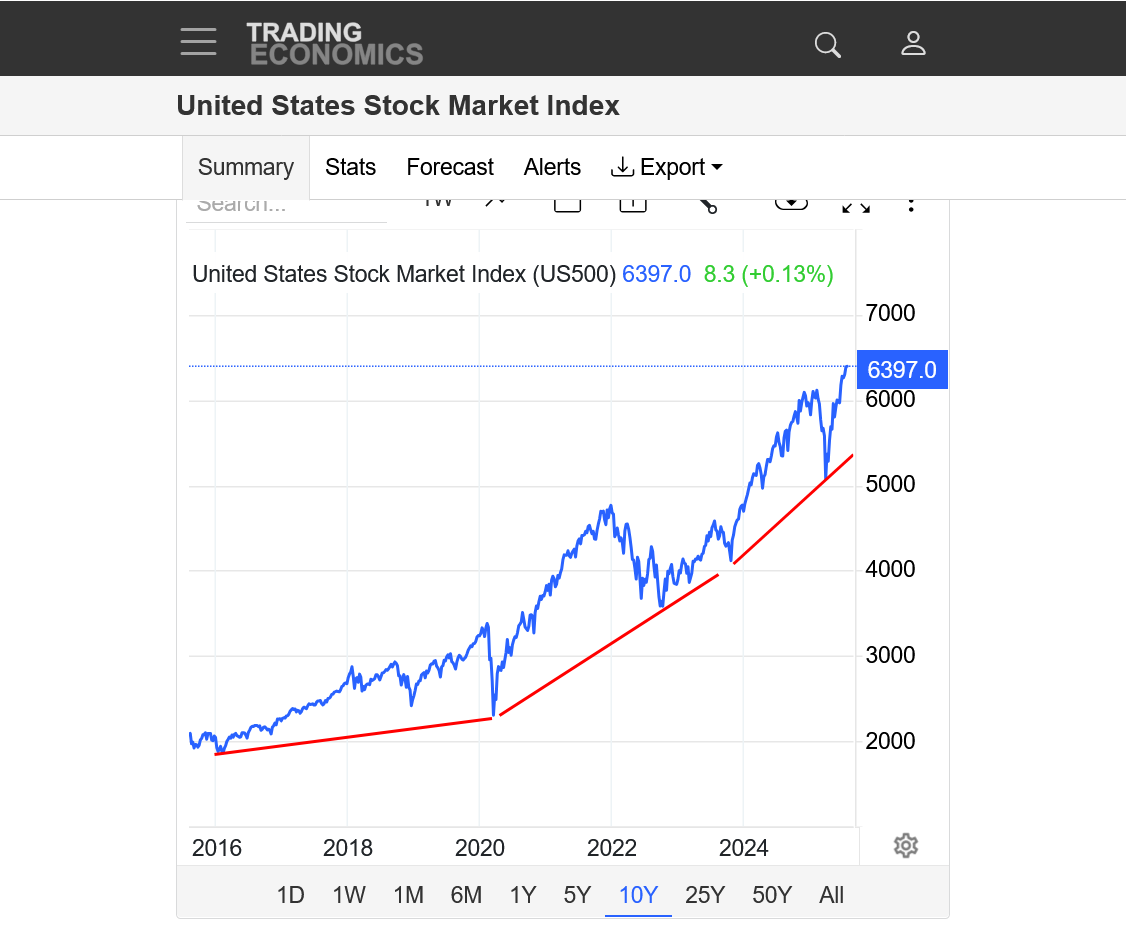
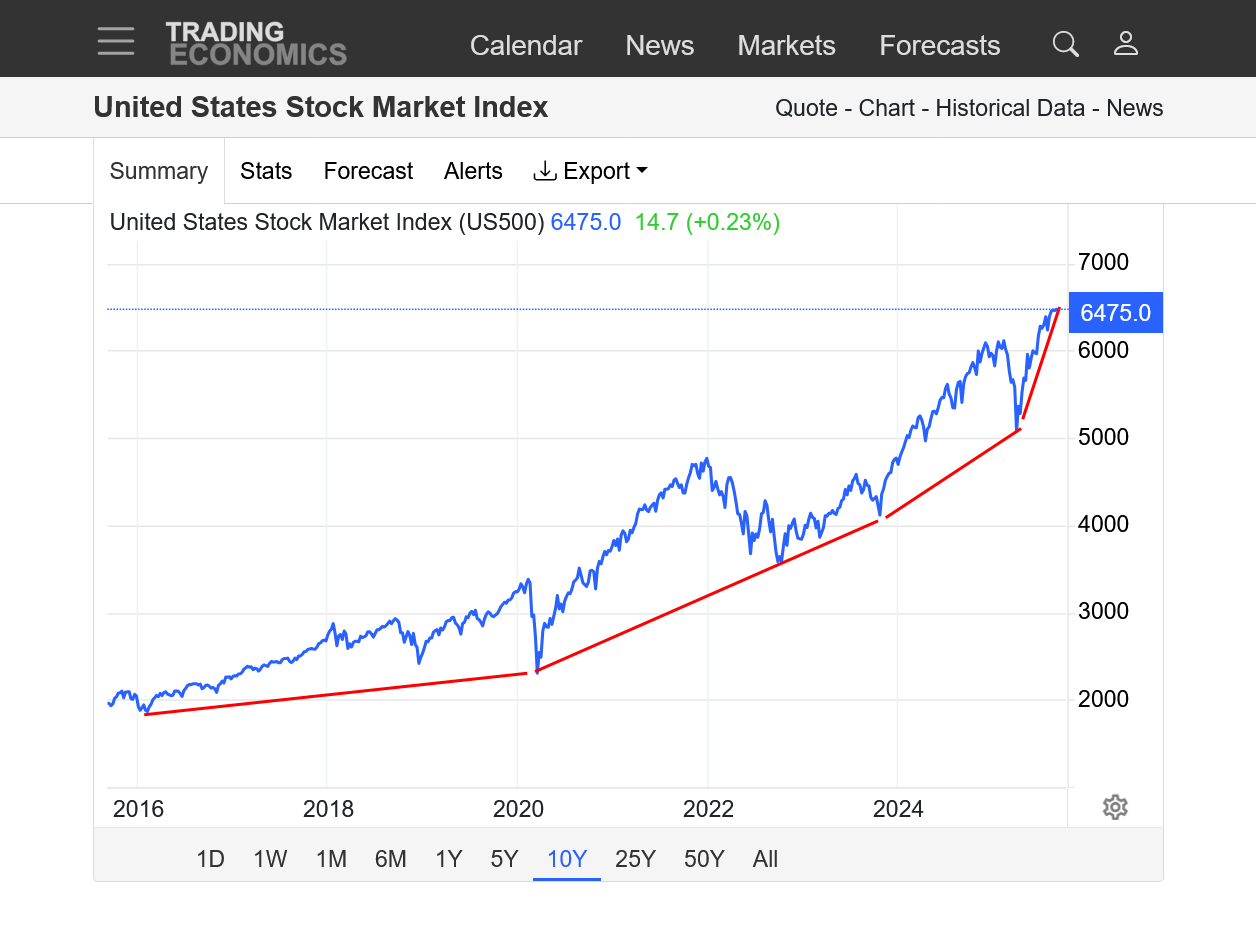
3. 10 years: Strong uptrend with prices greatly exceeding the value of the companies in the stock market. Steepening uptrend channel slope with a semi parabolic (exponential) move higher. New record highs overnight.
Gap and crap buying exhaustion at a major top, identified yesterday morning is being confirmed!
https://tradingeconomics.com/united-states/stock-market
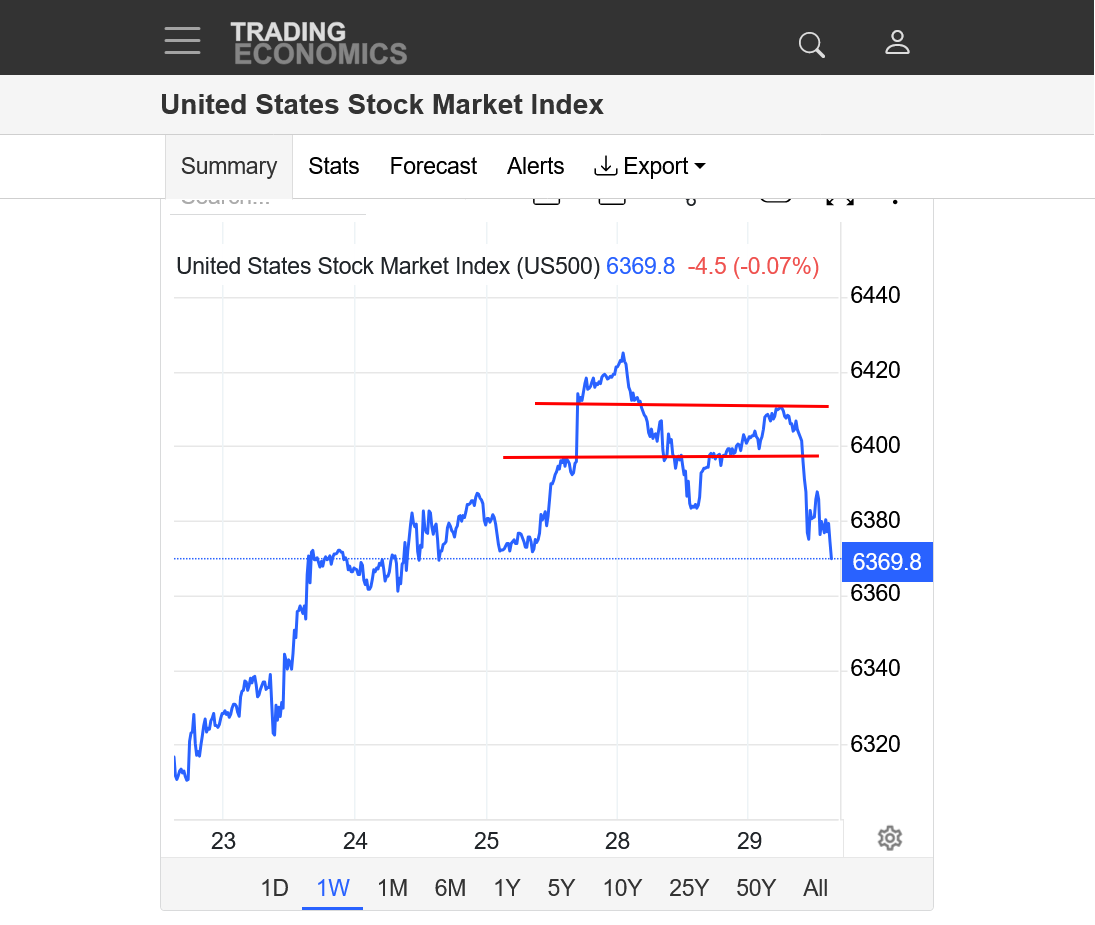
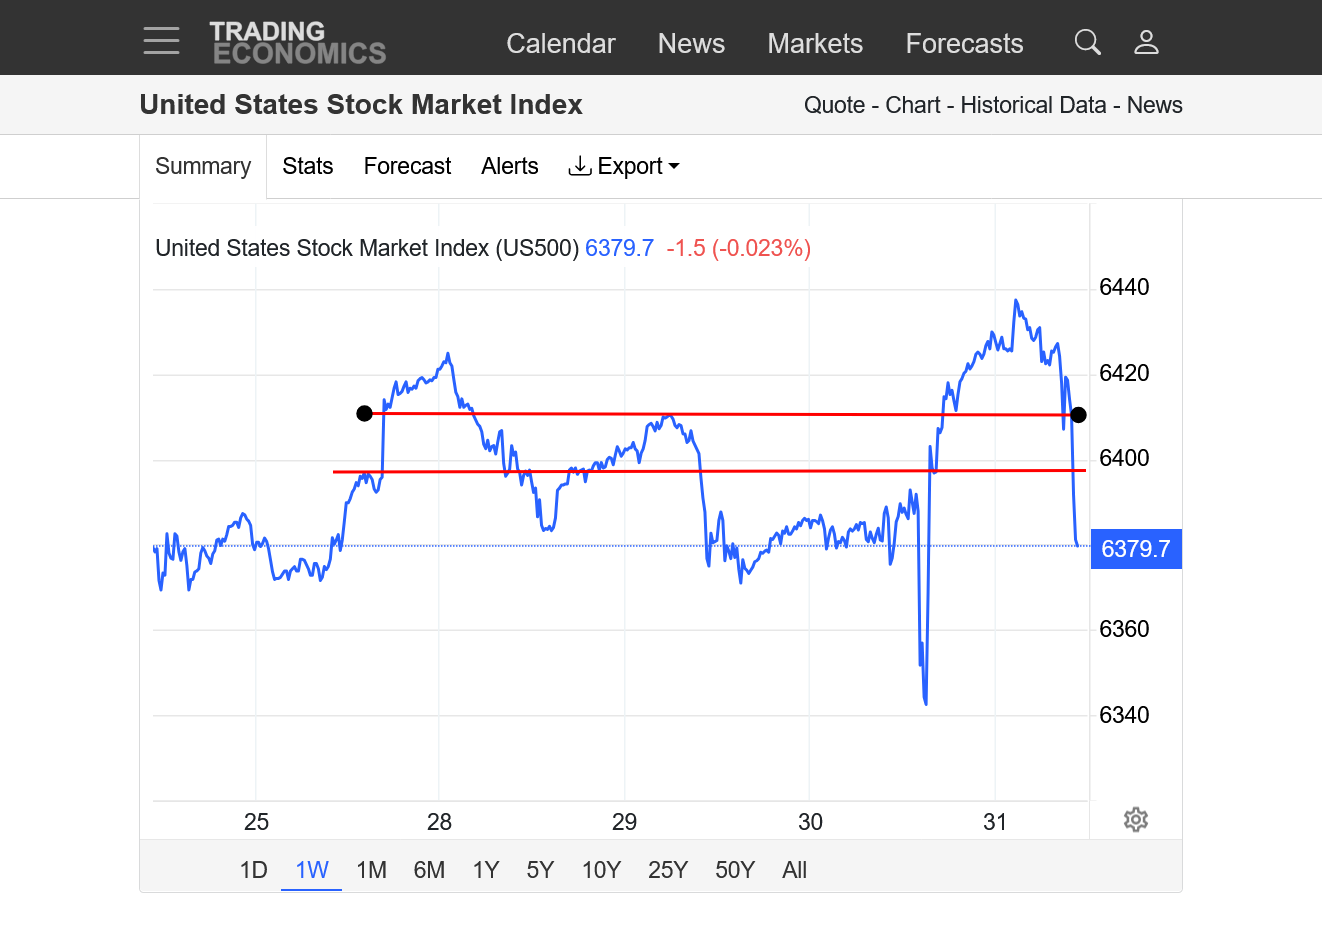
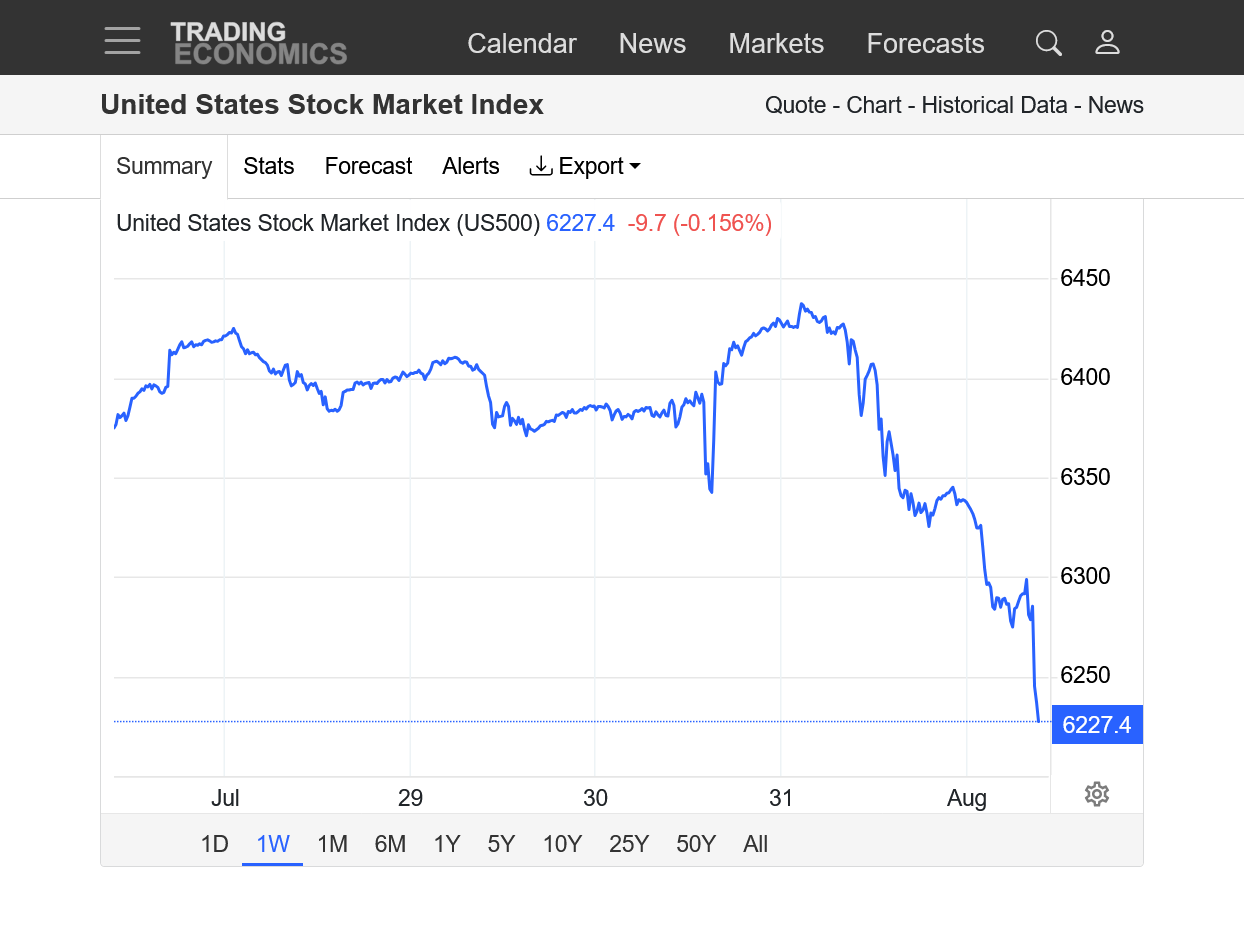
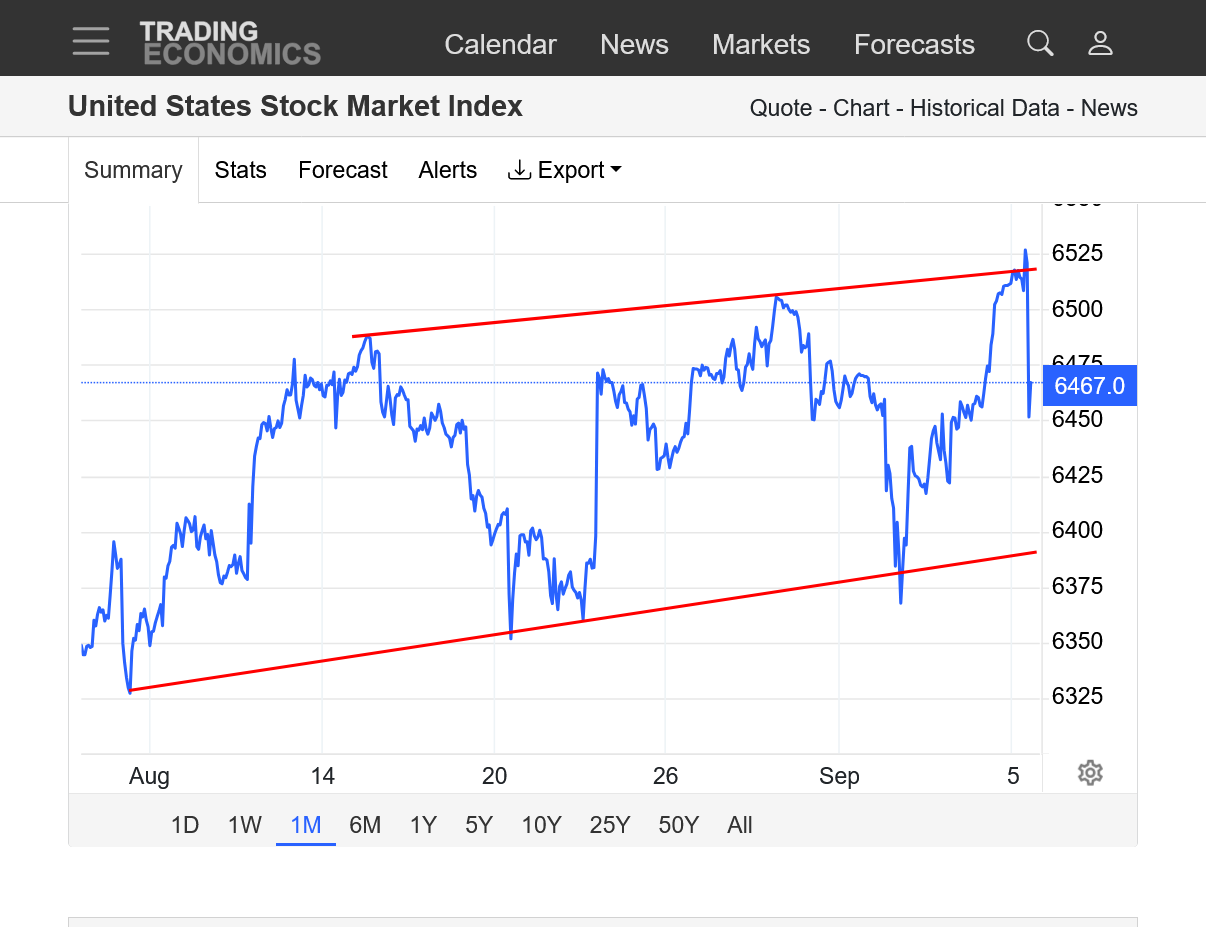
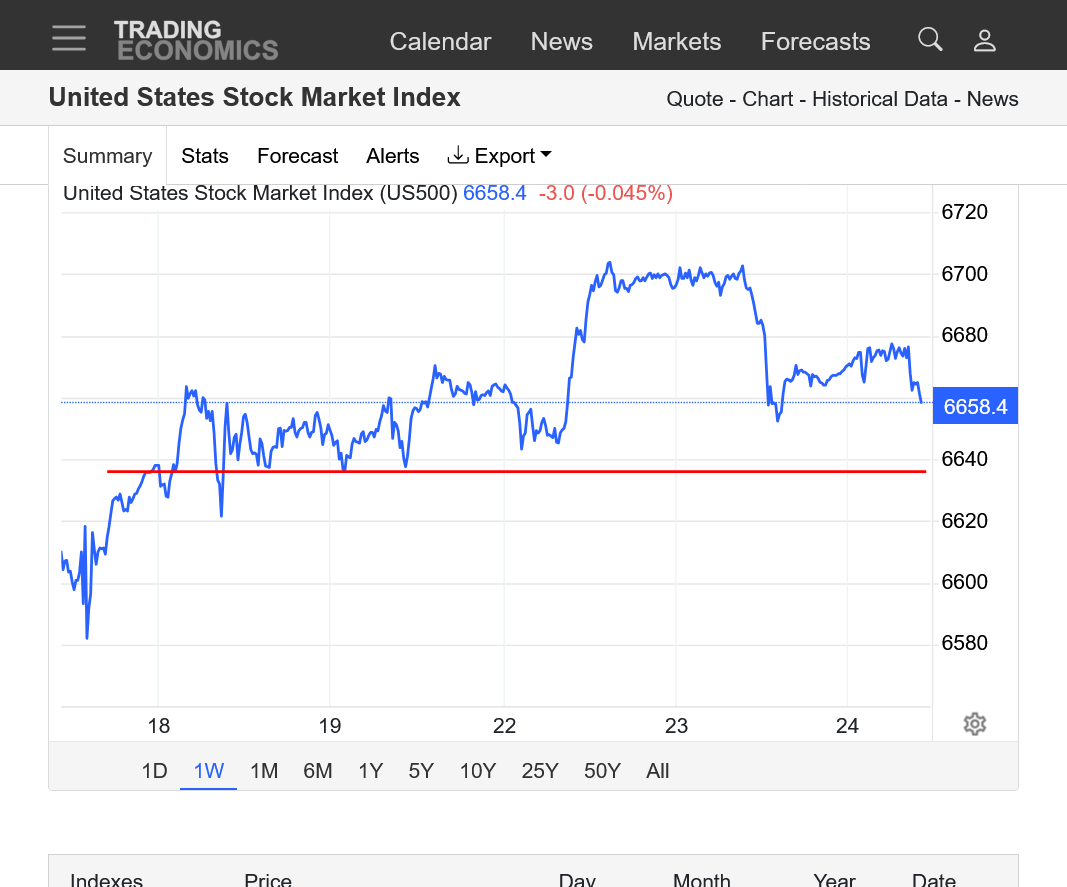
1. 1 week: The lower red line is the bottom of the gap/Friday's highs. The upper red line is the top of the gap, which was Sunday Nights open. This was not only a daily gap higher but a WEEKLY gap higher to all time highs THAT FAILED. This is about as powerful of a reversal signal that exists on chart formations.
Note that after we filled the gap yesterday, because this is the stock market (which is a Ponzi Scheme with incredible, long side bias that has turned it into a massive bubble-3 times the actual value) we still had enough buyers to take up back up to TEST the top of the gap.........then we ran out of fresh buying and have plunged to the lows of the week.
2. 1 day chart: In most markets, I would say PUT A FORK IN IT! But this is the Ponzi Scheme Market, so who knows.
Trumps policies(especially the tariffs) and his 2+ decades as a sex predator, including pedophilia being exposed make this market extremely vulnerable for the rest of the year!
The powerful, gap and crap buying exhaustion/reversal down formation is having a hard time inspiring follow thru. In almost any other market, we'd be plunging. But this is the stock market. It trades like a Ponzi Scheme with endless money piling in to offset any moves to the downside.........regardless of the actual value of the underlying assets/companies which it is completely detached from by more than 2X.
As always:
1. The overall trend is your friend and
2. The markets are always right at any moment in time. Doesn't matter what the intrinsic/REAL value of something is by other standards. If people/traders agree to pay XXX for something worth XX, then the price will be XXX and NOT XX!
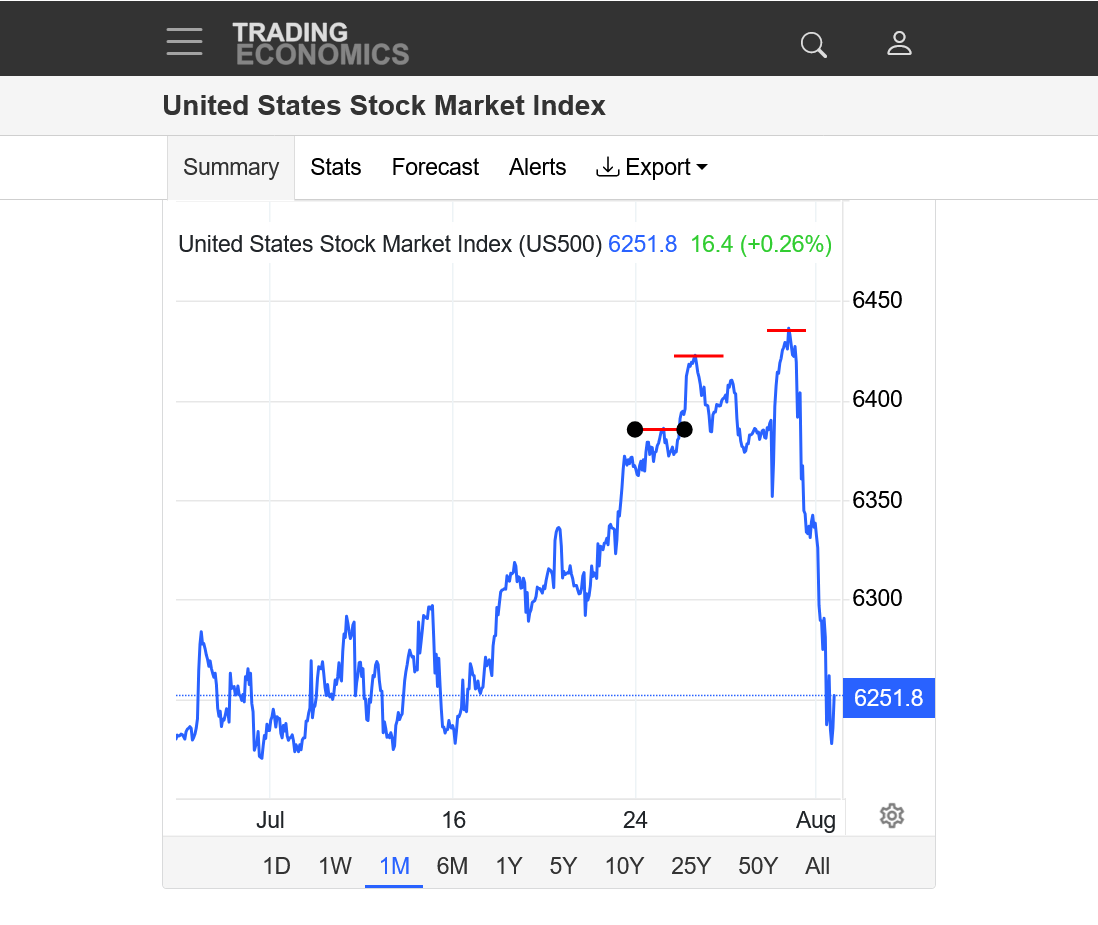
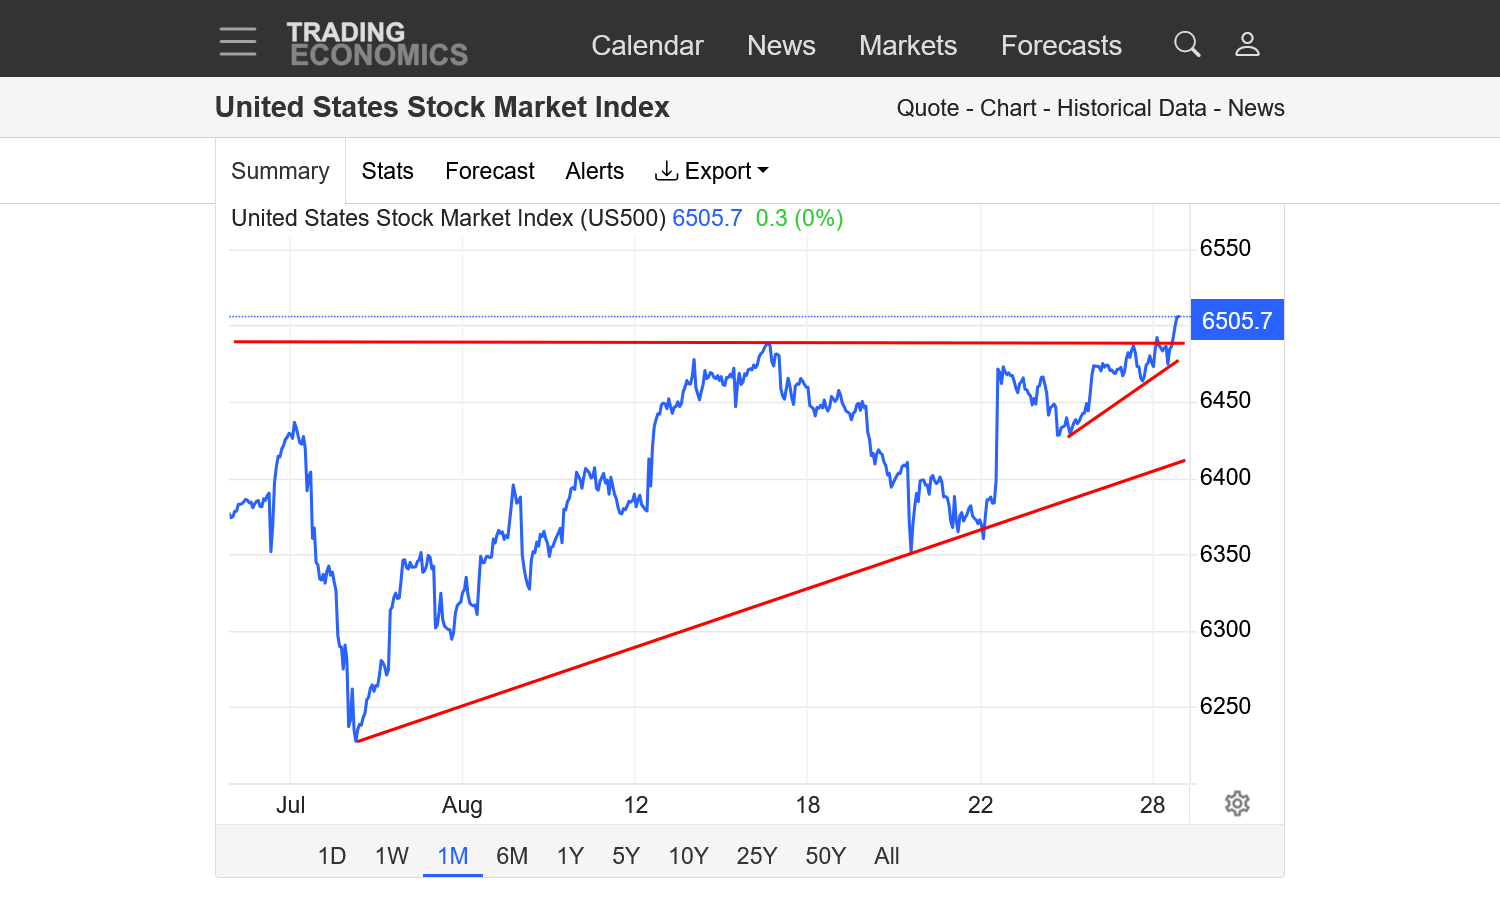
1 month chart: The lower red line was last weeks high. The top red line with the circles was the big gap higher on Sunday Night. Daily AND WEEKLY gap higher. Until we make NEW highs for this move/week, those gaps serve as a powerful gap and crap, buying exhaustion formation and reversal down. As mentioned the trade isn't too impressed with this big sell signal as we are holding up well right now.
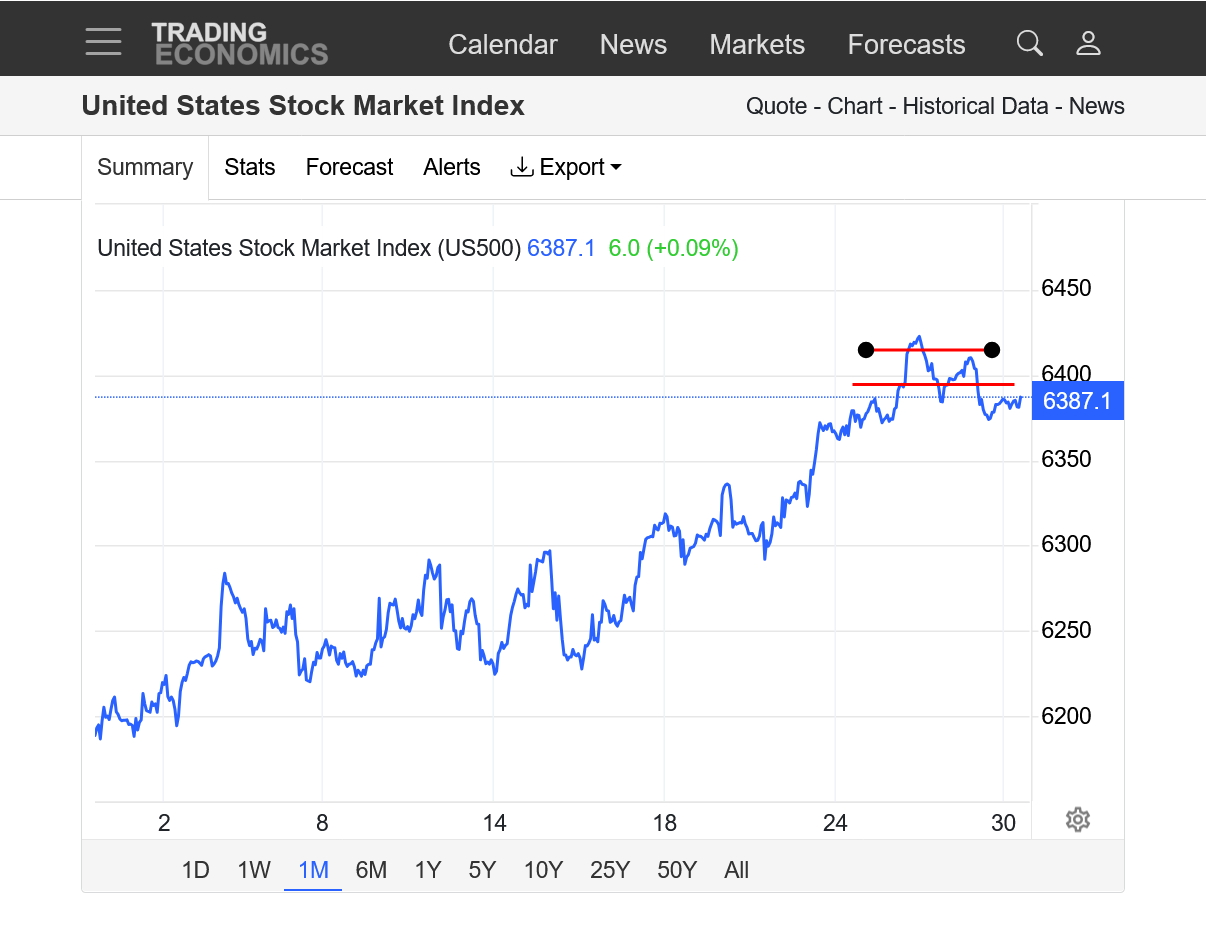
There could be alot of uncertainty related to fear of what Trump's next chaotic announcement will be. Could be the market anticipates more trade deals very soon. However, we never know with Trump. He's more likely to just extend the deadlines after NOT making deals and move the goal posts as the damage gradually mounts and the market ignores that until it reaches some sort of breaking point later this year.
There is definitely risk for both sides related to NEWS. China is the big dog that WE NEED open trading with. Our farmers are getting clobbered from permanently lost sales of things like soybeans. They are always our biggest buyer of beans and have bought 0 since Trump imposed the absurd tariffs.
Another 4 months of this and we may miss out on the best time for our farmers to lock in sales for their beans.
ALL the sales have been going to Brazil and Argentina. There are consequences to really dumb decisions that violate the basic principles of trading between countries.
Our long lived trading partners are seeking out new sources and new relationships with other countries to replace the trading between us and them. The damage becomes permanent even when crappy new deals are made between us and them as this absurd tariffs scheme is serving to isolate the United States from the rest of the trading world. instead of encouraging MORE business between us.
Some extreme spikes and volatility which is common at major tops.
The highs on Friday and last week is the lower red line. The higher red line was the price of the gap higher open on Sunday Night and the top of the gap.
We hit new highs earlier in this session after suddenly spiking down, then up yesterday (on news) but those highs couldn't hold and now we're below the gap higher on Sunday Night and lower for the week.
I have no idea where we are going but if we close lower than this on Friday, it will be an impressive reversal down for the week after opening with a gap higher to new all time highs.
However, this is the stock market and tariff news especially could cause it to do anything.
https://tradingeconomics.com/united-states/stock-market
2pm: I failed to note that today's lower close is actually ANOTHER reversal down from a NEW record high in the early morning hours. Price charts only tell us what the market thought and how it thinks right now............which can change tomorrow, especially in this current, extremely chaotic and uncertain environment being caused by the tariffs.
The market has incredibly shrugged off almost all the bad news associated with the tariffs is one thing its been telling us. This week, after the supposedly great news on Sunday, we reversed lower with a buying exhaustion formation after a record high. We came back from that(which usually doesn't happen from that signal-as I said-these signals don't apply to the stock market) and today, we had another reversal lower from a NEW record high.
The reason these powerful signals DON'T apply as well to the stock market is because they apply best in markets that trade intrinsic value and are held accountable to the laws of supply and demand of tangible products, like soybeans or crude oil.
When the front month of soybeans expire, for instance it gravitates to the CASH PRICE, where real buyers and sellers exist who exchange REAL MONEY in the REAL WORLD.
When the front month of a stock market Index expires and rolls over to the next month, there's no holding it accountable to the value of the individual companies in the Index because the value of the stocks are whatever people buying and selling it in the stock market want it to be with a massive bias towards buying that inflates values to much more than what they are really worth based on valuations of the exact same metrics before the market tripled in a short period of time but the intrinsic valuation didn't follow the same steep curve up.
Let's continue that discussion on the next page.
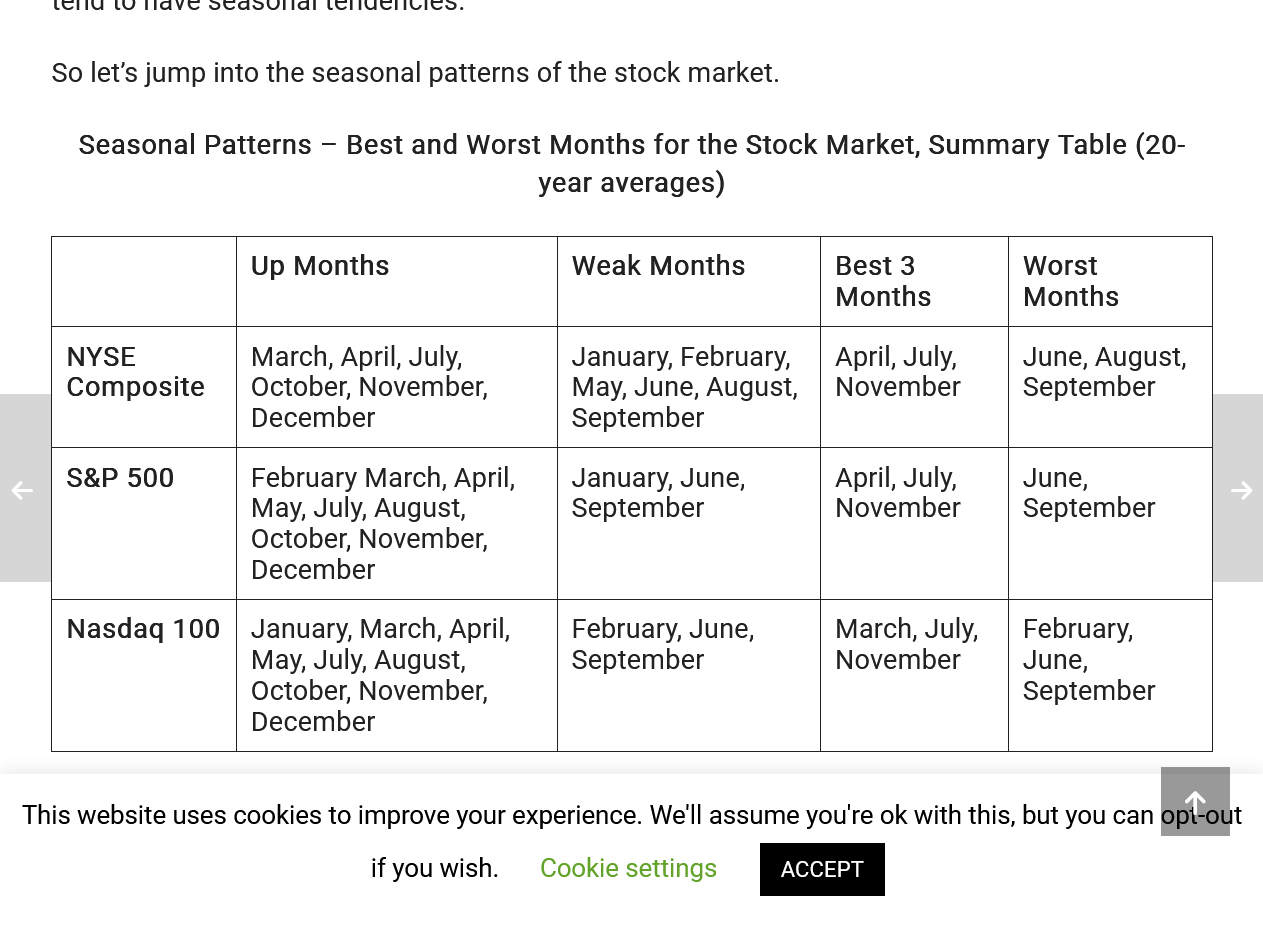
by Jennifer Nash, 7/16/25
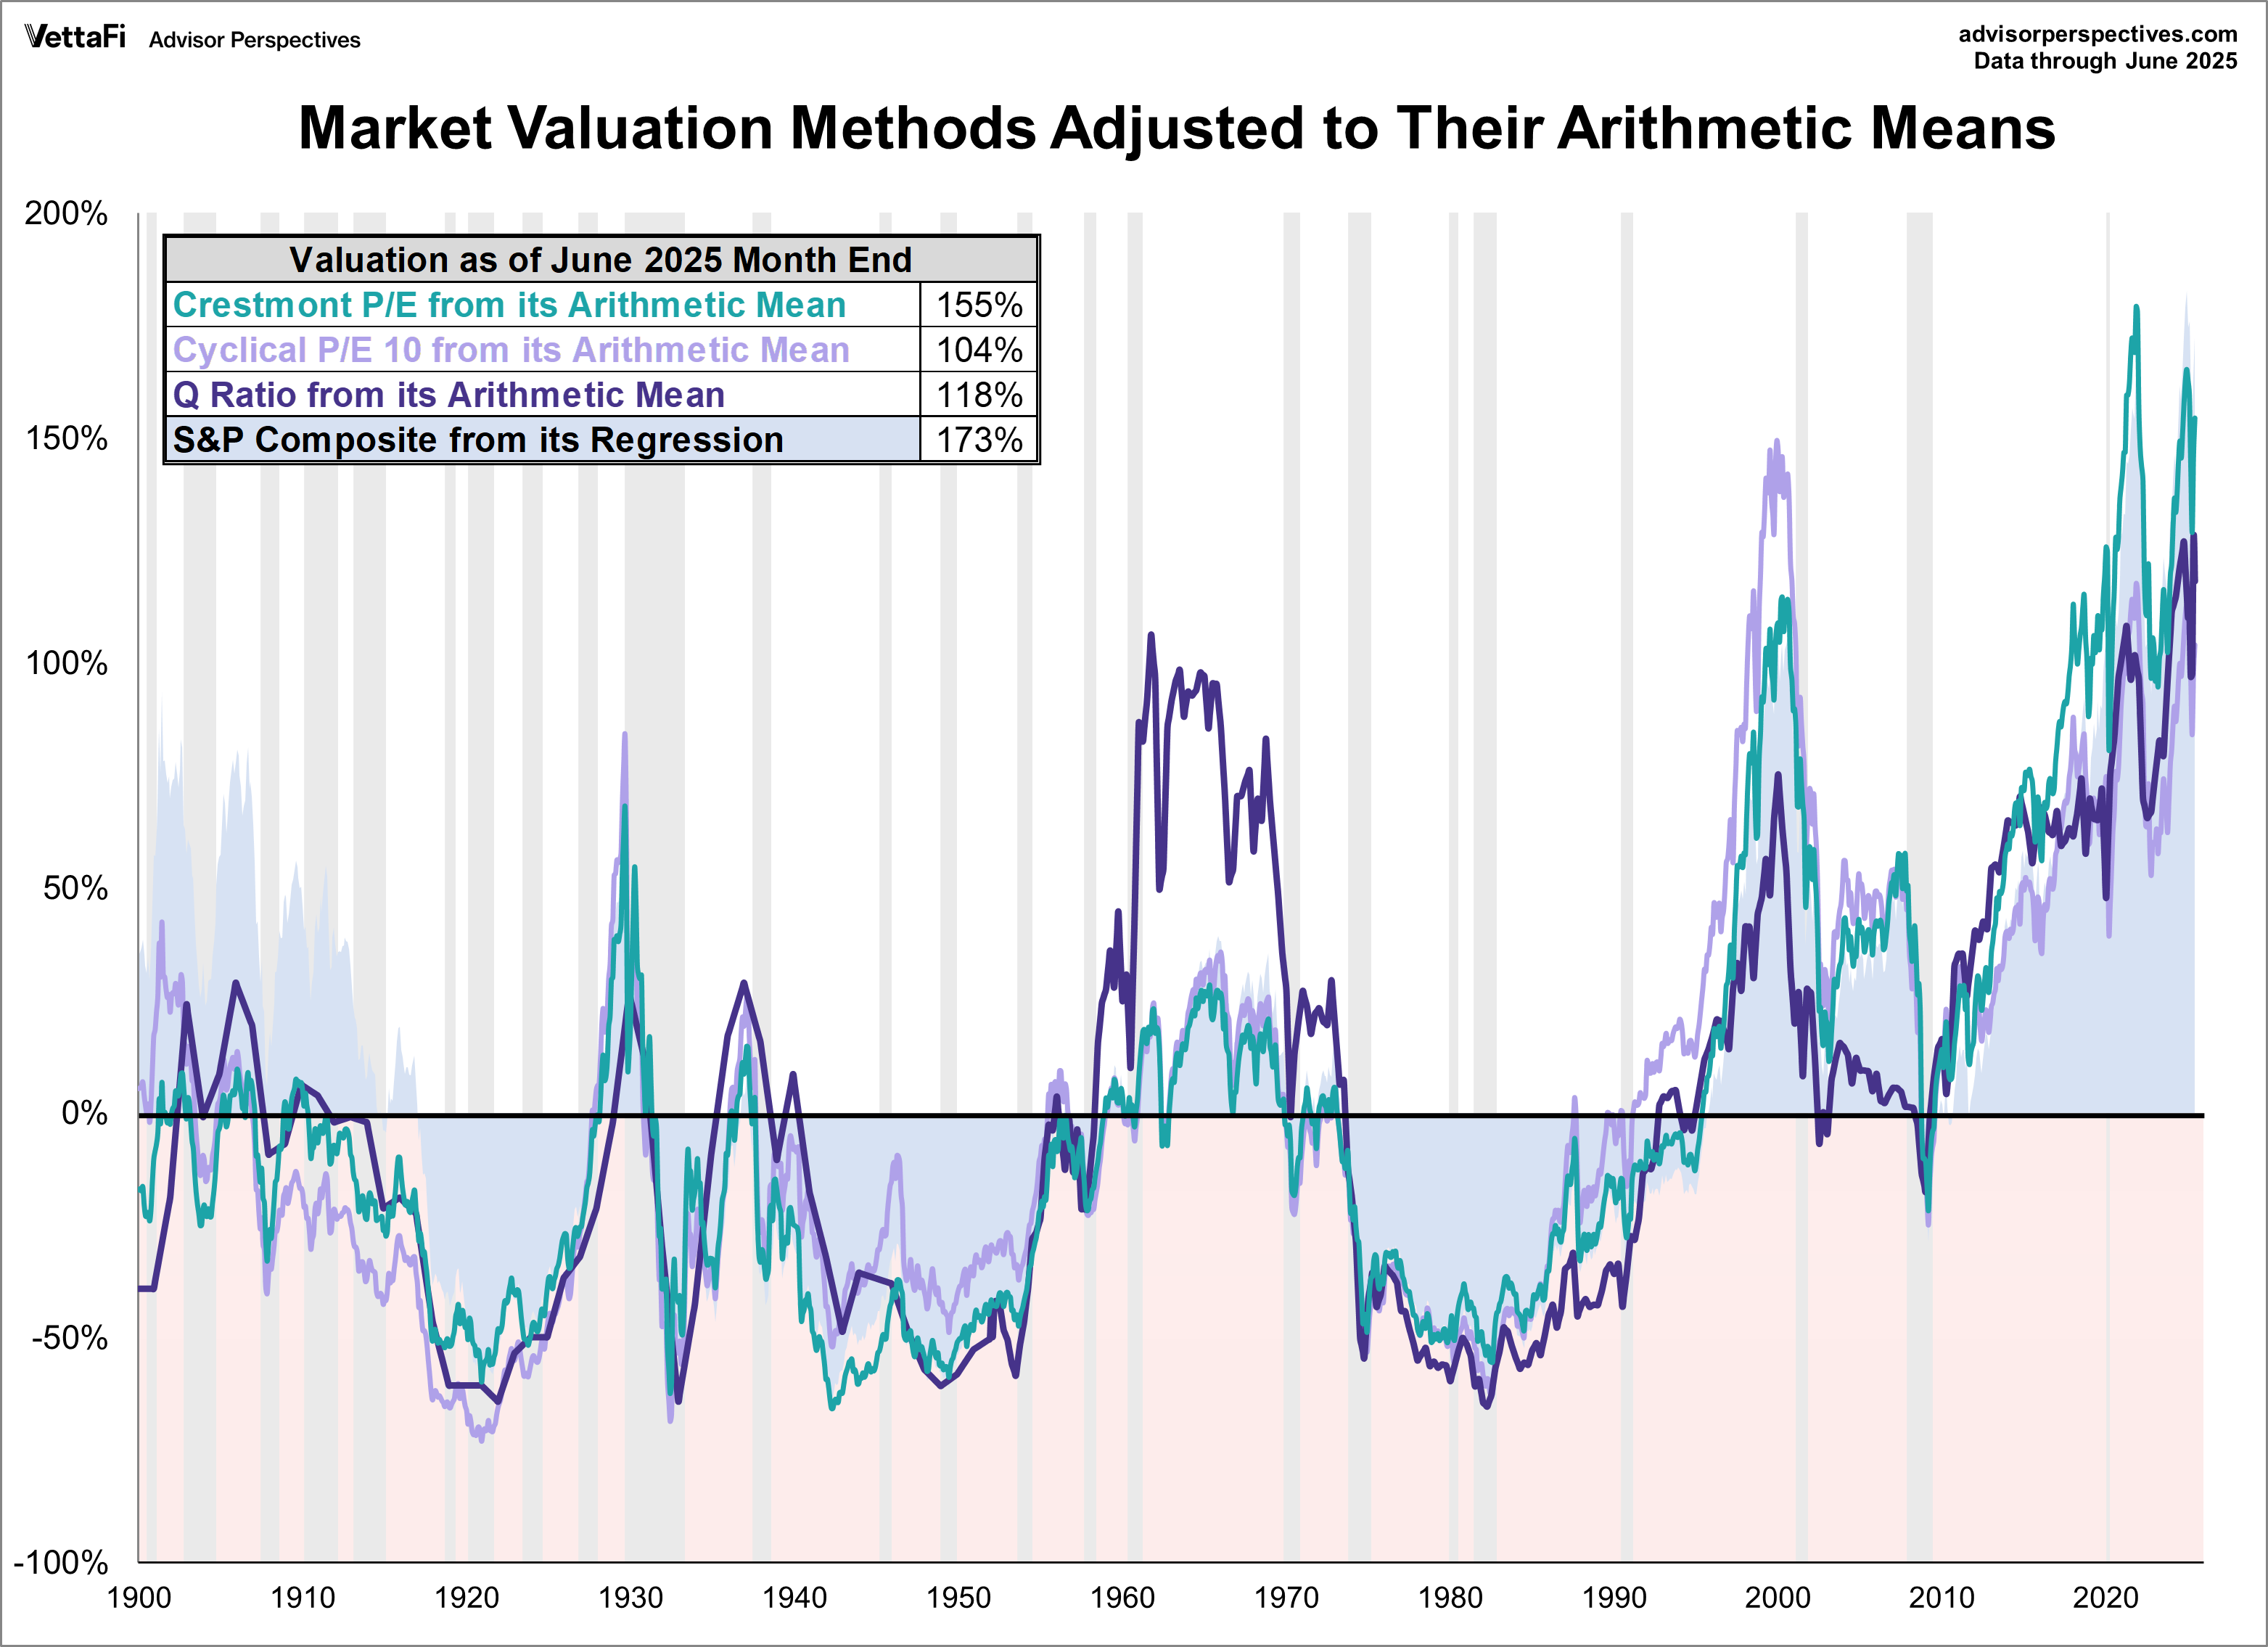
The majority of people, who have money in the stock market want the market to go up and are biased, which might make it harder to completely accept that reality of an analysis like this. People don't want to read/hear that their investment is worth, let's say only half the REAL value of it as defined in an article like this.
My analysis here on the charts is to recognize that the actual value is the price at what people are willing to buy and sell it for, regardless of any other factors. In the end, that's the only thing that matters to investors and traders.
That's what makes or loses REAL money. Investors can identify the best stocks in the best industries that will do better than the overall market for sure but it still boils down to the phrase. "A rising tide will lift all boats".
Anybody fully invested in the stock market for any length of time has probably made a ton of money, even if they had to weather a few downside corrections that almost never last long.
The stock market is also a "self fulfilling prophesy".
https://philonotes.com/2024/12/robert-k-mertons-theory-of-the-self-fulfilling-prophecy
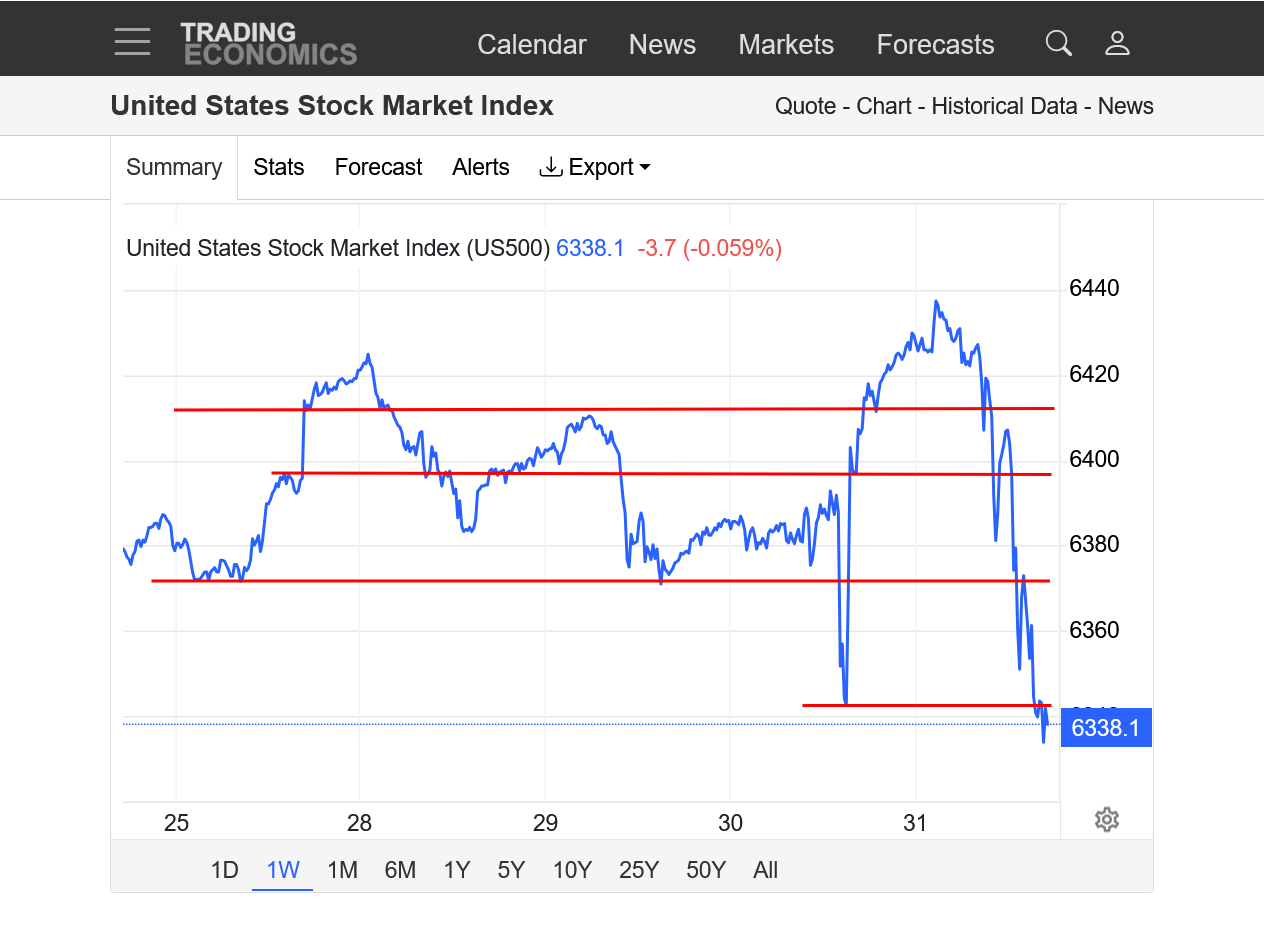
Ominous price action in the stock market right now if you just go by the chart formations this week.
We're at new weekly lows after:
1. A gap and crap buying exhaustion reversal early in the week on the daily AND weekly bars. The top 2 lines define the top and bottom of that gap.
2. New highs after that would usually negative that signal but on that same day, we had a 2nd reversal lower to reject that NEW high.
3. We dropped below 2 levels of support(3rd line-4th line was the spike low) and are on the lows of the week, here early in the Friday trading session.
4. This is the bullish biased stock market where bearish signals that are usually powerful indicators in most markets, often get rejected by the underlying bullish, self fulfilling prophesy mentality. Volatility often increases at tops.
https://tradingeconomics.com/united-states/stock-market
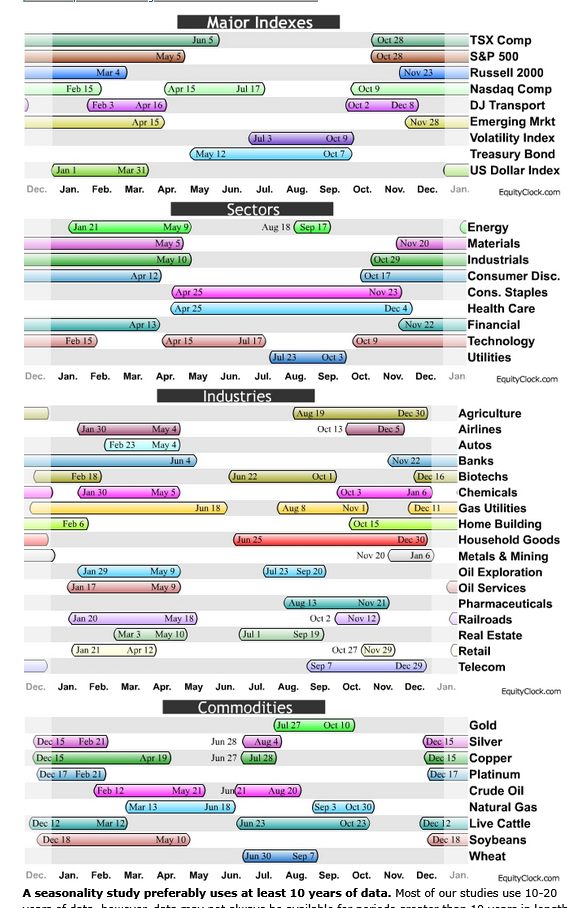
We're also entering a period of seasonal weakness for stocks:
This chart below identifies seasonal strength, regardless of the color. The buy and sell dates are shown in the same color band which defines each positive seasonal.
These are POSITIVE seasonals only.
We should note that this is NOT the best time for any of the major stock indices.
https://equityclock.com/seasonality/
https://tradingeconomics.com/united-states/stock-market
Here's the 1 week chart with the EXHAUSTION BUYING GAP HIGHER from Sunday Night on the far left now, that was filled quickly on Monday after new record highs and resulted in a reversal lower. Very bearish formation.
Then we had a spike low followed by BRAND NEW record high on Thursday, which temporarily, rejected the very bearish gap and crap, reversal down formation from earlier in the week.
But that turned into a HUGE FAKE OUT!
That brand new record high yesterday was immediately followed by another reversal lower that same day that strongly REJECTED THE FRESH RECORD HIGHS and a lower close on the daily and weekly bars.
That means 2 separate reversals down from fresh record highs this week on the daily bar.
Currently, early on Friday Morning we are trading at fresh lows for the week. The medium and longer term charts are still in extremely strong up trends despite these short term, very powerful topping and reversal down formations.
In most markets this would be a TECHNICAL signal to cover longs/take profits and put on new shorts.
However, the stock market is controlled by huge money with a "self fulfilling prophesy" and sometimes "news" and not supply/demand fundamentals like most other markets are.
The jobs report this morning was awful with the new July jobs coming in ~40K below the midrange guess and, more importantly, with May-June, combined, being revised down a whopping 285K!
All major stock indices are way down (1.3.% or more).
Thanks very much, Larry!
Yeah, that was pretty bad news and the market had already seen 2 very powerful bearish formations. Reversals down from record highs on both Monday and Thursday as described in comprehensive detail above.
It's hard to imagine anything but a lower weekly close today, which would also confirm a powerful WEEKLY reversal lower from record highs. Along with this very bearish news, it's hard to imagine the big money trying to fight all these very negative indicators.
The biggest wildcard is our unpredictable, mentally ill president and how he will react to the dropping stock market that he worships so much. When it makes new highs, its reinforcement for his really dumb, counterproductive tariffs schemes. If the market crashes, 2 things are possible.
1. He could announce a tariff deal with China and others out of desperation to stop the market crash. It will likely be a dumb deal and worse than what we had before but not AS BAD as it is now.
2. He WILL blame the Fed for not lowering interest rates. That one is a given!
https://tradingeconomics.com/united-states/stock-market
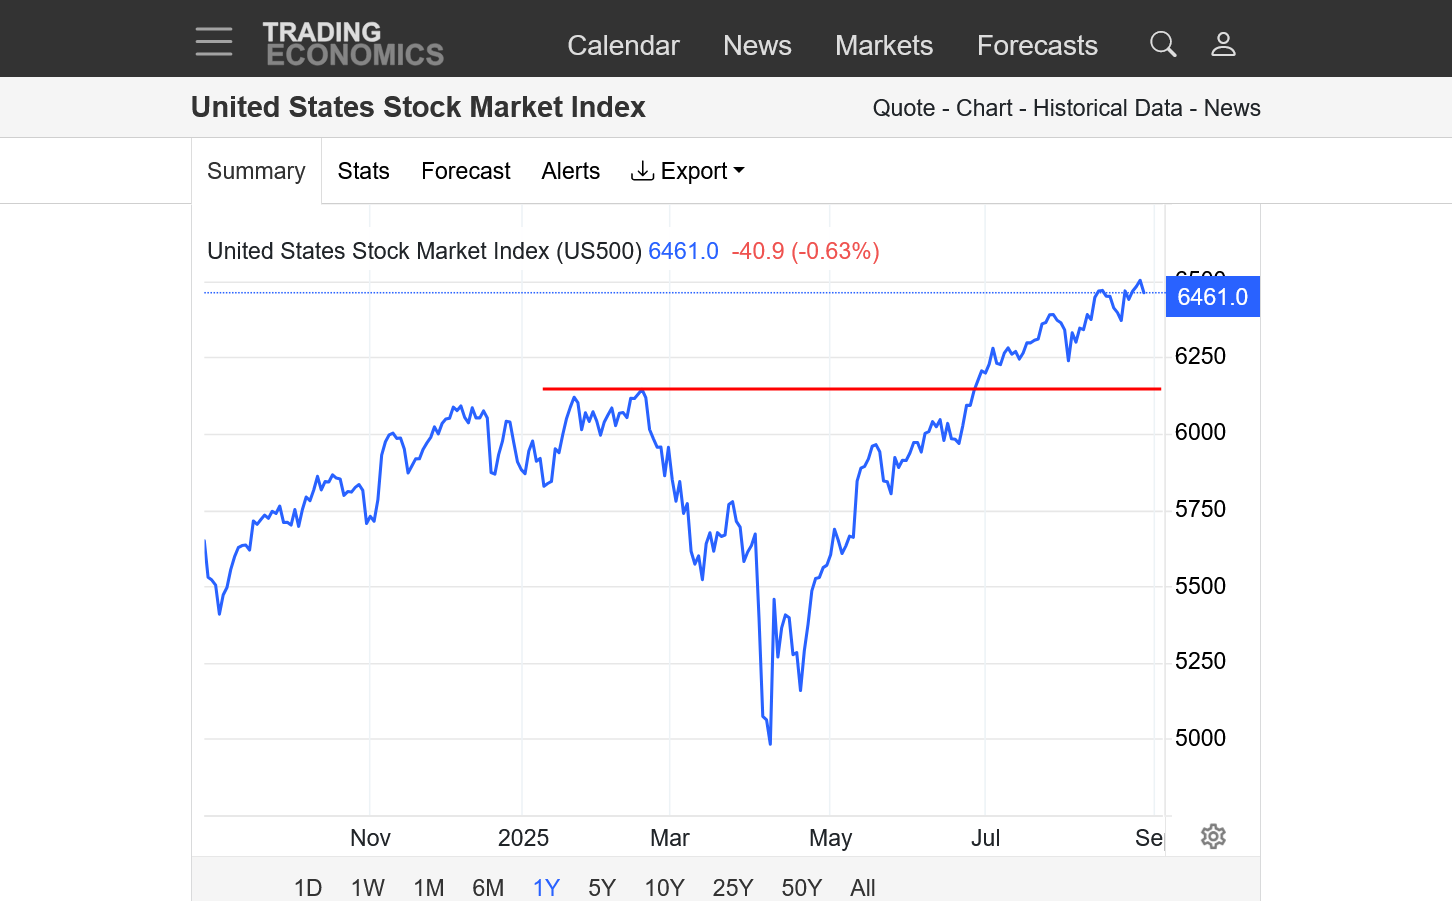
If we were projecting an INITIAL downside target for this correction, one might point to the previous highs that were made back in February.
This chart below is for prices the past year. The chart above is from just this week. We can see the huge spike lower in April when President Trump announced his tariffs scheme.
Just to repeat, the stock market is controlled by big money that doesn't need to follow supply/demand or intrinsic valuation fundamentals or chart formations. They pushed prices to record highs AFTER and DESPITE the economy damaging tariffs schemes.........which made no sense, except in the world of a self fulfilling prophesy.
If Trump allows the ACTUAL, increasing damage to be inflicted as the year goes on, it will be hard to keep ignoring it. His tariffs are based on a complete lack of the understanding of the basic principles that define effective free trading between countries that are beneficial to BOTH SIDES!
https://www.npr.org/2025/08/01/nx-s1-5488807/jobs-employment-labor-trump-tariffs
https://www.marketforum.com/forum/reply_post/113599/
Factories shed 11,000 jobs in July. Domestic manufacturers are supposed to be the beneficiaries of the president's trade policies. But factory managers complain that uncertainty over import taxes has depressed orders and other activity. The federal government has been charging a 10% tax on nearly everything the U.S. imports since April, and higher tariffs are set to take effect on many goods next week.
"These tariff wars are beginning to wear us out," one anonymous factory manager said in a survey released Friday by the Institute for Supply Management. "There is zero clarity about the future, and it's been a difficult few months trying to figure out where everything is going to land and the impact on our business. So far, tremendous and unexpected costs have been incurred."
https://fortune.com/2025/08/01/trump-fires-erika-mcentarfer-bureau-labor-statistics-chief/
President Donald Trump on Friday ordered the firing of Dr. Erika McEntarfer, the Commissioner of the Bureau of Labor Statistics (BLS), igniting a political and economic firestorm as the administration grappled with unexpectedly weak jobs numbers that included a large downward revision of the last two months of jobs data. “I have directed my Team to fire this Biden Political Appointee, IMMEDIATELY,” Trump said on social media Friday.
The decision followed the release of July’s employment report, which showed that only 73,000 nonfarm payroll jobs were added to the U.S. economy—far below economist forecasts. The report also included sharp downward revisions to the previous two months, with 258,000 jobs stripped from earlier estimates and unemployment ticking up to 4.2%.
On social media, Trump also claimed without evidence that McEntarfer “faked the Jobs Numbers before the Election to try and boost Kamala’s chances of Victory,” referencing to his defeated opponent in the 2024 election, Vice President Kamala Harris. Trump declared: “Important numbers like this must be fair and accurate, they can’t be manipulated for political purposes.”
++++++++++++++
More powerful evidence of what I've been insisting for the past year. President Trump is mentally ill and his pathological thinking from his delusions of grandeur mentality that makes him omnipotent and infallible is advancing and leading to worse and worse decisions as he rules as an authoritarian fist, unchallenged by the R Congress that has capitulated/given up their critical role in our Constitution that requires a BALANCE OF POWER.
With his serial predatory criminal behavior staying in the headlines for many weeks to come and the economy starting to get hurt from his damaging tariffs and other policies (because he is unable to comprehend basic economic principles) this is a very dangerous time for a mentally ill Trump to be president.
Re: Re: 50% tariffs on EU starting June 1
By metmike - Aug. 1, 2025, 2:26 p.m.
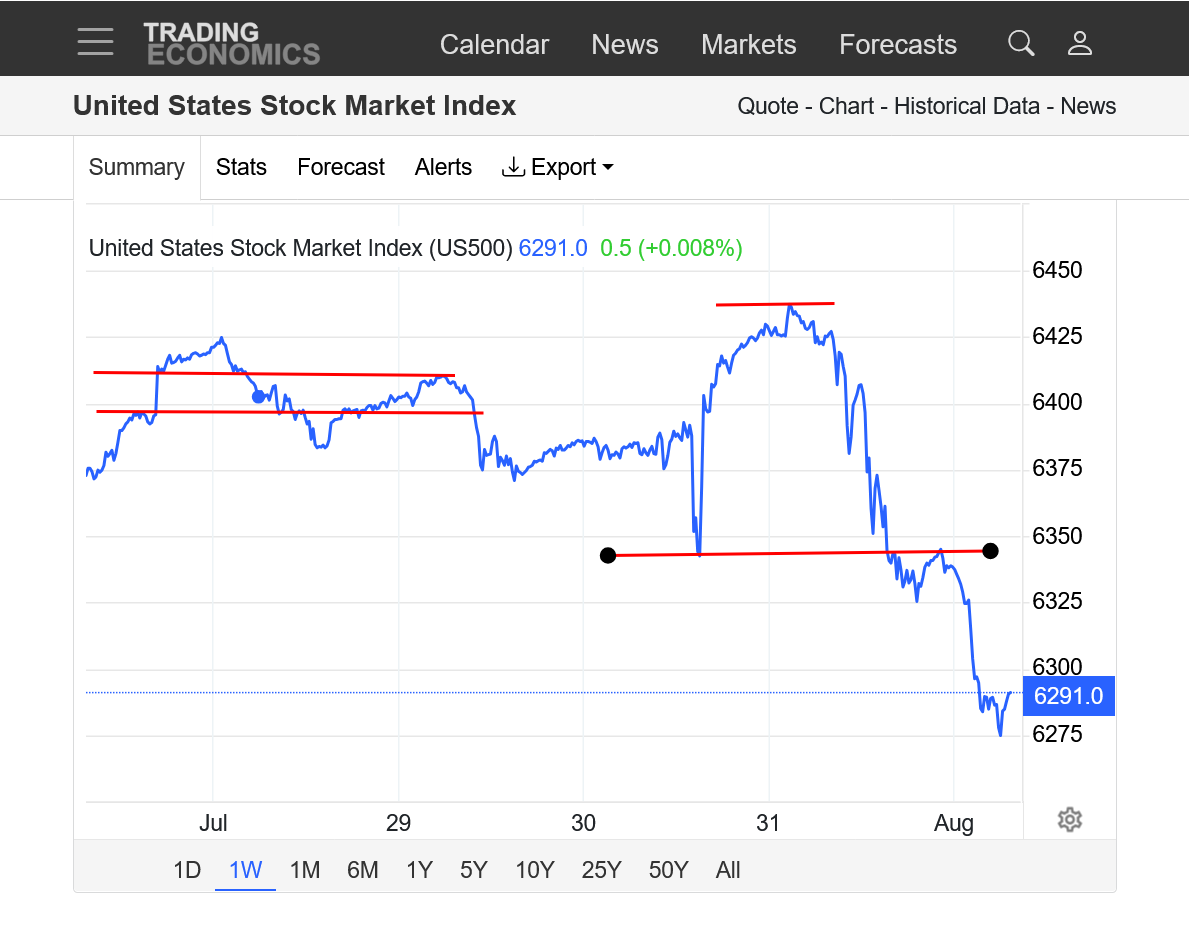
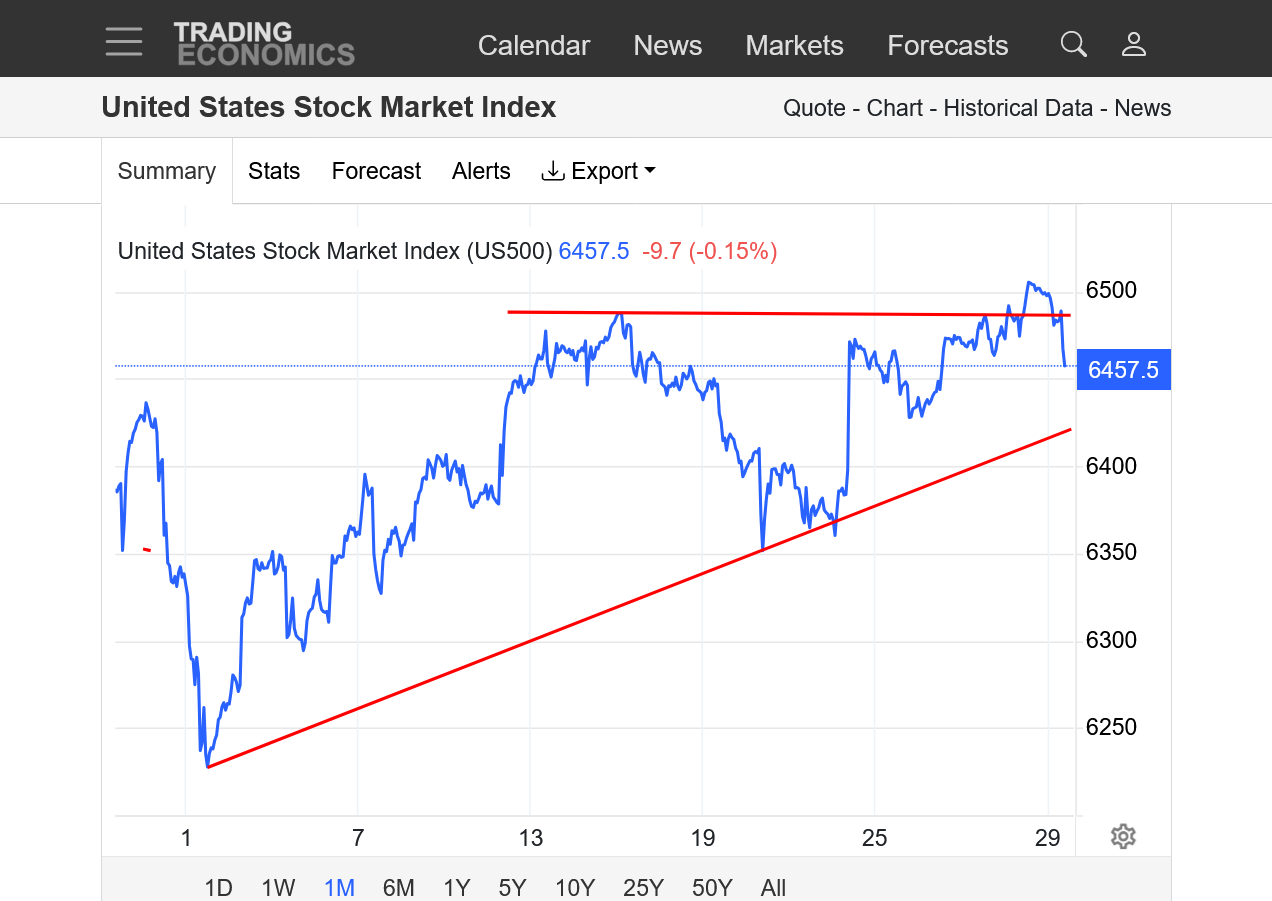
Let's look at the 1 month chart for a change:
1st red line was last Friday's all time record high.
2nd red line was Monday's new all time high which reversed lower that day after a gap higher open on Sunday Night that was filled and represented a buying exhaustion that day.
3rd red line was Thursday's(yesterday's) new all time high with an even MORE POWERFUL reversal lower.
We are closing near the lows for the week. This sets us up for the potential for a GAP LOWER OPEN on Sunday Night. If that happened it would not only be a gap lower on the daily chart but also a gap lower on the weekly and monthly chart and possibly the monthly chart(below the July lows if its a big enough gap).
However, the news, almost entirely related to unpredictable Donald Trump could completely change everything.
He would suddenly rescind tariffs with China or announce some other news that takes away his damaging tariffs in order to manipulate the markets.
At the same time, firing the top statistics person at the Labor Department is the sign of somebody losing it that blames THE WRONG REASONS/PEOPLE for what HE CAUSED.
The Epstein scandal is not going to get any better and could actually take him down if several of his victims suddenly came forward.
His mental illness makes him capable of starting a nuclear war with Russia to take the heat off because he knows that so many NON MAGA people hate Russia, including the MSM. I will speculate that there is at least a 10% of him doing that if:
1. The stock market crashes lower
2. The Epstein-gate scandal gets worse
3. Economic indicators continue to go in the WRONG direction.
4. The Rs in Congress, suddenly get a conscience and start doing their jobs to balance power and send out strong messaging to oppose his tariffs and other dictatorship type leading ......... and there is some talk about impeaching him.
https://tradingeconomics.com/united-states/stock-market
The Rs at some point will need to start a private discussion about impeaching him or else suffer a big risk in the mid-terms in November 2026 if the economy tanks and we all know it was Trump, the serial, criminal predators fault.
Americans would be so fed up with Trump and the Rs enabling him that all the close races might go to the Ds to REJECT the Rs for causing this.
I seriously think that impeaching Trump as in REMOVING HIM FROM OFFICE would be the biggest gift to our country that the Rs could deliver to us by an extremely wide margin.
Then have his mentally stable VP Vance (who not only never committed crimes but he served our country admirably in the Marines) lead which would stabilize the markets, the country and the world and actually allow the Rs to continue with the same agenda using SANITY.
Vance, leading on his own without Trump could end up being a terrific president.
Sorry about the politics but its going to be a big factor driving some of these markets which have been greatly DEstablized and deserve a much better leader in the role of most powerful person in the world.
Vance could help heal some of the major damage with our global partners and allies.
We just can't have this for another 3.5 years without paying major consequences in several realms. It's only been 7 months and the turmoil/chaos is an order of magnitude greater than any other president in history.
++++++++++++=
Anyways, Trump could suddenly cave on most of his tariffs over the weekend and the market would open higher on Sunday Night.
The stock market is off to a solid start this week, holding some support.
Last week's powerful reversal down signals are still valid. News is a main driver of this market, along with the self fulfilling prophesy of traders that have caused enormous over valuation(Ponzi Scheme mentality). This can go on indefinitely until the big money REALLY loses confidence.
Or..........its very vulnerable in a time frame like this.
1. Last week's sell signals flashing on computer screens
2. Seasonal weakness
3. Economic indicators turning strongly down
4. Unpredictable news. The most powerful man in the world is mentally ill and focused on making himself look good and doing damage control with a complete lack of comprehension of the solid principles of things like the long term trading relationships between countries and why they benefit BOTH sides tremendously. When the inevitable consequences start hitting the fan...........he fires objective people that provide the information he should be using to ADJUST HIS RUINOUS STRATEGY so that he can justify continuing the strategy, in denial of reality. When he's wrong about something, this mentality incurs continuing damage to it. The stock market is at risk.
https://tradingeconomics.com/united-states/stock-market
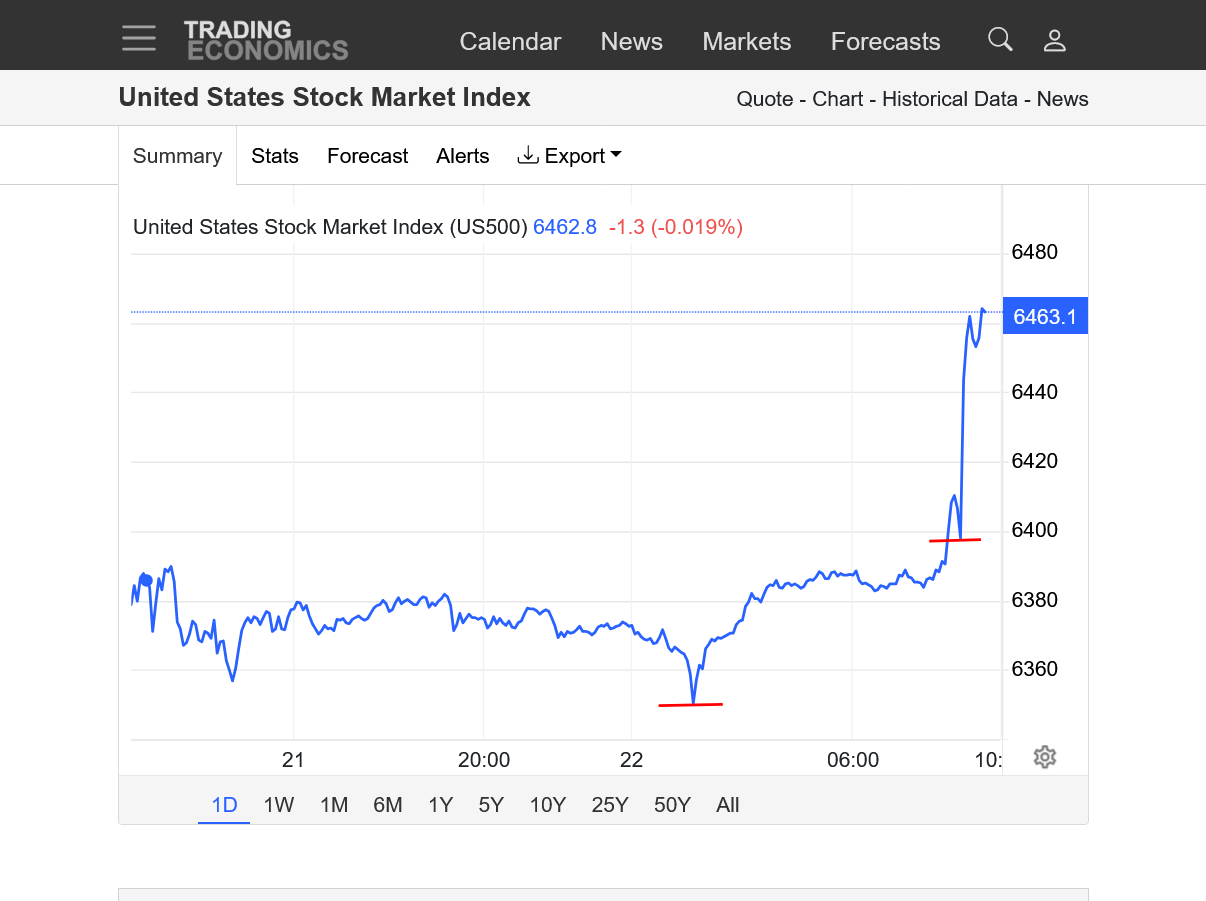
1. 1 day-higher. Is it a bottom or dead cat bounce?
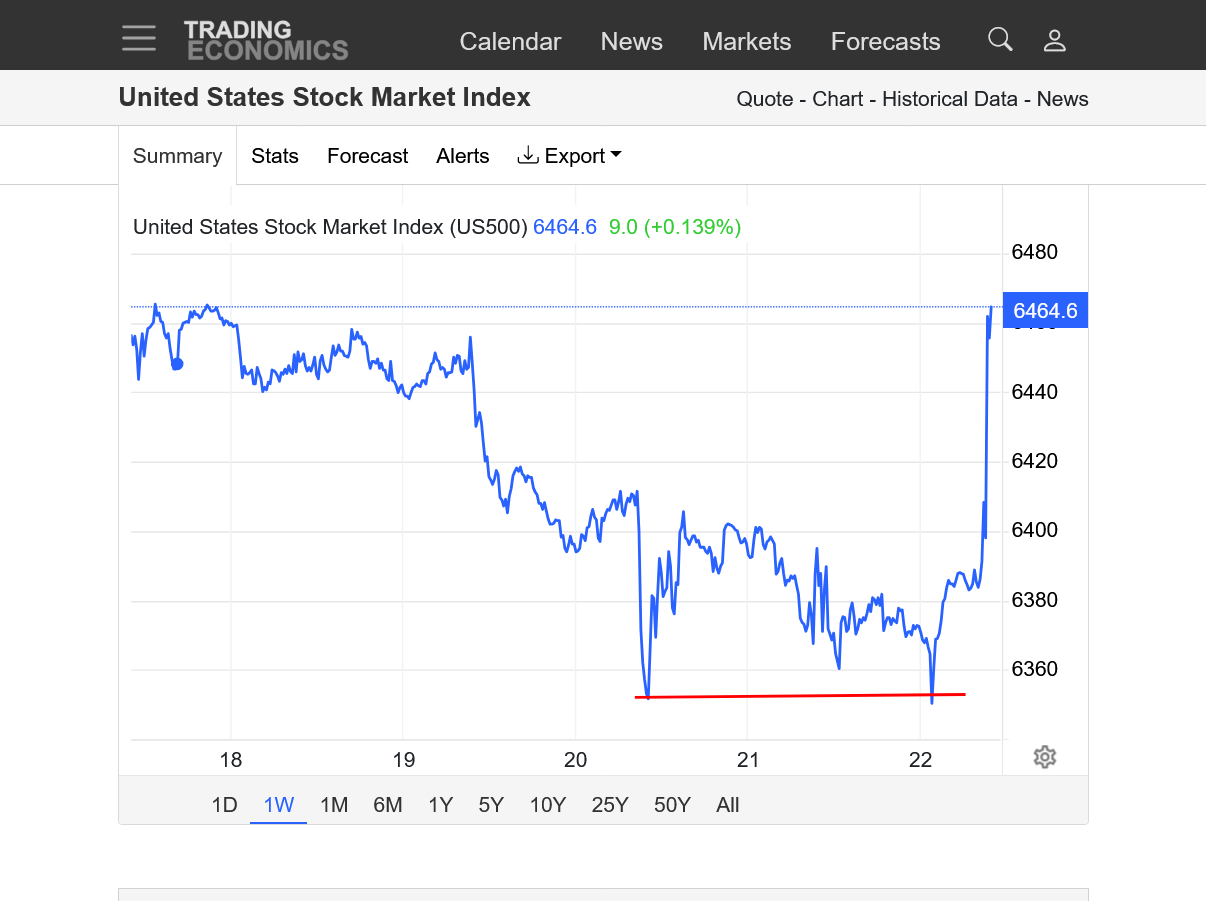
2. 1 week: higher-bottom or dead cat bounce?
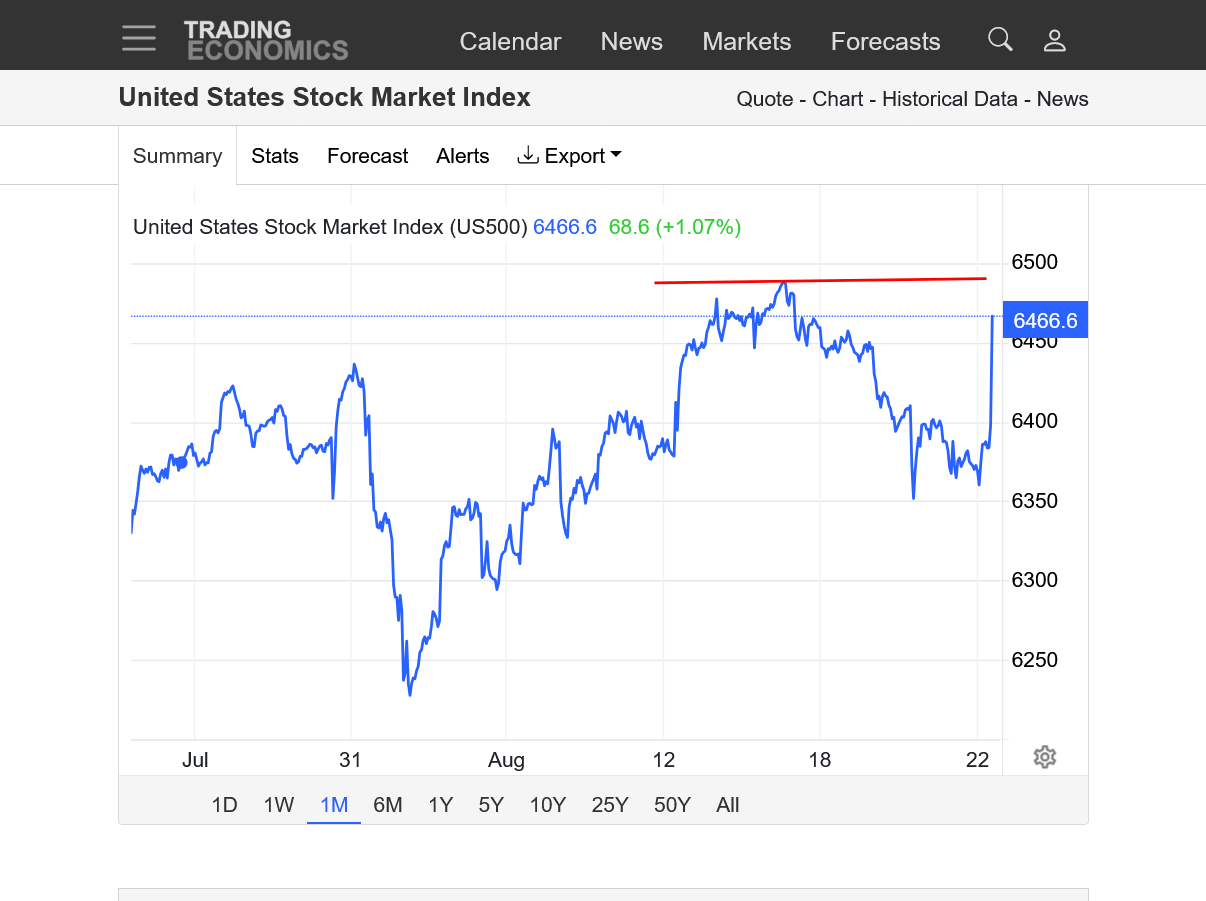
3. 1 month-held some solid support
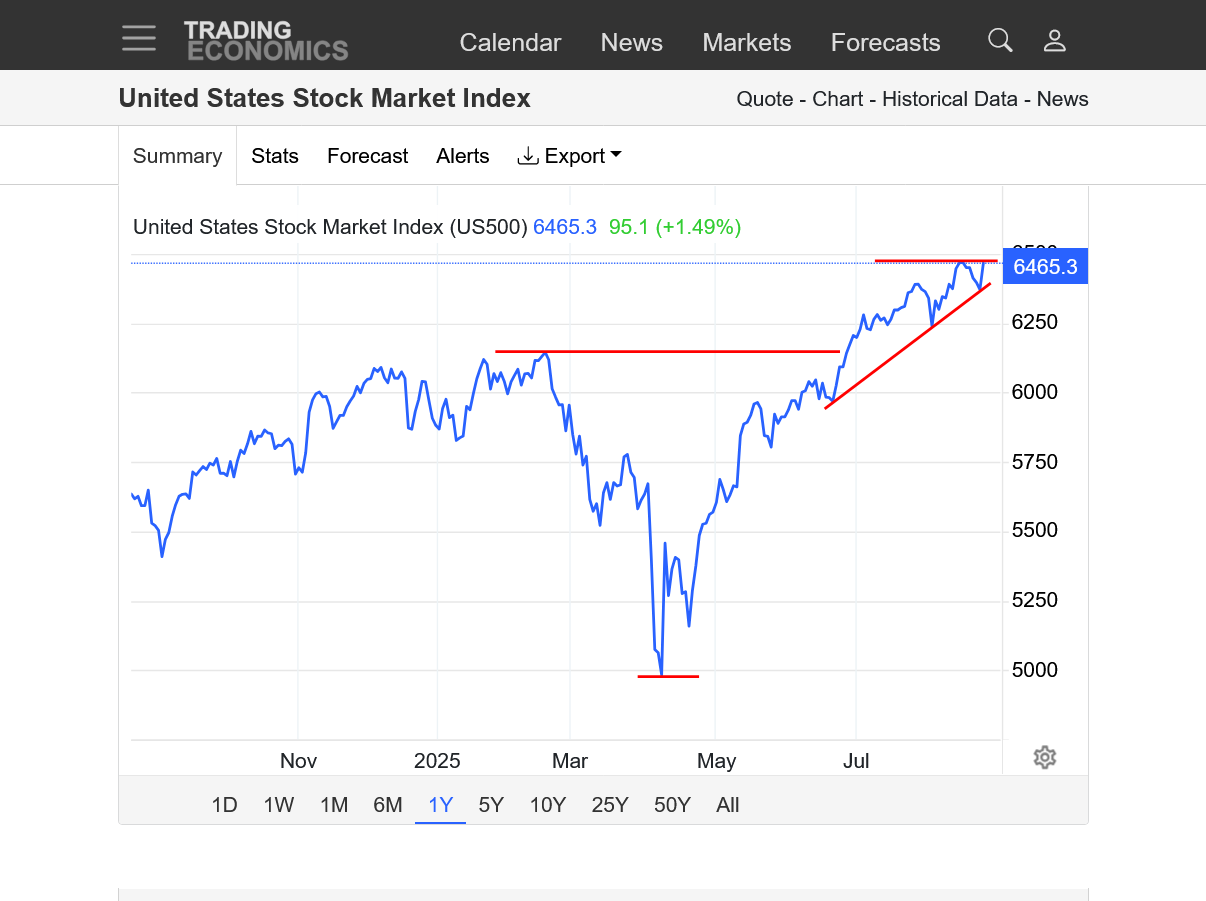
4. 1 year-bull flag or top? Still well above previous record highs earlier this year that should serve now as solid support
5. 10 years-this tiny blip lower hardly even shows up.
https://www.axios.com/2025/08/22/powell-interest-rates-trump-fed
The stock market spiked higher on this!
1. 1 day-lower interest rate news
2. 1 week-lower interest rate news
3. 1 month-new highs earlier this month, then a slight retreat-lower interest rate news spiked us back near the highs
4. 1 year-tariffs spike lower in April. Break out to new all time highs.
5. 10 years-strong trend up with steepening slope
Going to be extremely interesting the next 2 months. The Ponzi Scheme stock market which is overvalued by 2-3 times and continues to scream higher from rich people being increasingly over-leveraged from adding to already extreme positions and the law of self fulfilling prophesies ruling because of their profound control of money flows.
However, there is extreme risk because of numerous factors.
1. Trump's damaging policies which are causing an economic slowdown and job losses, especially his ruinous tariffs schemes with inflation going back up. Stagflation is not good for the economy. His mental instability with impulsive, chaotic and strategy absent thoughts and actions are a huge problem. He's completely driven by self serving interests in realms where he lacks comprehension to understand the dynamics and consequences of his decisions.
2. Momentum indicators appear to be weakening right now.
3. The next month+ is seasonally/historically weak. With the most stock market crashes coming in this period.
4. This is the most over value bubble in history.
5. However, we can keep going higher if rich people keep buying more and with falling interest rates, this makes other interest rate dependent investments less appealing and stocks MORE appealing.
The DOW and other indices made new record highs on Friday, although this one does not show it.
https://www.investopedia.com/articles/financial-theory/09/october-effect.asp
+++++++++++
Turns out that September is the weakest month!
++++++++++
This chart below below identifies seasonal strength, regardless of the color. The buy and sell dates are shown in the same color band which defines each positive seasonal.
These are POSITIVE seasonals only.
We should note that this is NOT the best time for MOST of the major stock indices or sectors.
https://equityclock.com/seasonality/

Potential double top?
https://tradingeconomics.com/united-states/stock-market
50% tariffs on EU starting June 1
54 responses |
Started by metmike - May 23, 2025, 8:13 a.m.
https://www.marketforum.com/forum/topic/112084/
Mail in voting/Trump's revenge justice
26 responses |
Started by metmike - Aug. 21, 2025, 8:30 p.m.
https://www.marketforum.com/forum/topic/114099/
https://www.marketforum.com/forum/topic/114099/#114188
evolution of Atlanta fed est. of GDP...shocking
28 responses |
Started by mcfarm - June 6, 2025, 6:22 p.m.
https://www.marketforum.com/forum/topic/112363/
https://www.marketforum.com/forum/topic/112363/#113946
++++++++++++
The downside risk in the stock market here is incredibly huge. The potential upside reward is small.
That doesn't mean we can't keep going higher if the big money continues to ignore all the bad things and the unstable person causing ALL of it and instead, continue to feed the self fulfilling prophesy.
++++++++++++
Why stocks keep hitting records despite economists’ warnings about the threat from tariffs.
https://www.nbcnews.com/business/markets/how-trump-tariffs-impact-stock-market-investors-rcna224521
++++++++++++++++++=
Here's an ironic twist. The stock market trading to new highs has convinced Trump that his tariffs are a good thing.........so he double and triples down even more on the ruinous tariffs schemes.
It's a dysfunctional/pathological relationship because the self fulfilling prophesy of big, over leveraged money isn't based on a healthy economy, so the man making the bad decisions, instead of being held accountable is being rewarded and POSITIVELY REINFORCED (in his mind) when he makes bad decisions, leading to doubling and tripling down on his bad decisions.
And a massive bubble that is ripe for popping.
Big day up for the stock market Tuesday! Back close to last Fridays high.
Could just be another small bull flag if we hit close strongly above the previous highs.
Regardless, the stock market is very vulnerable the next month+ for the previous reasoning.
https://tradingeconomics.com/united-states/stock-market
My 2cts..
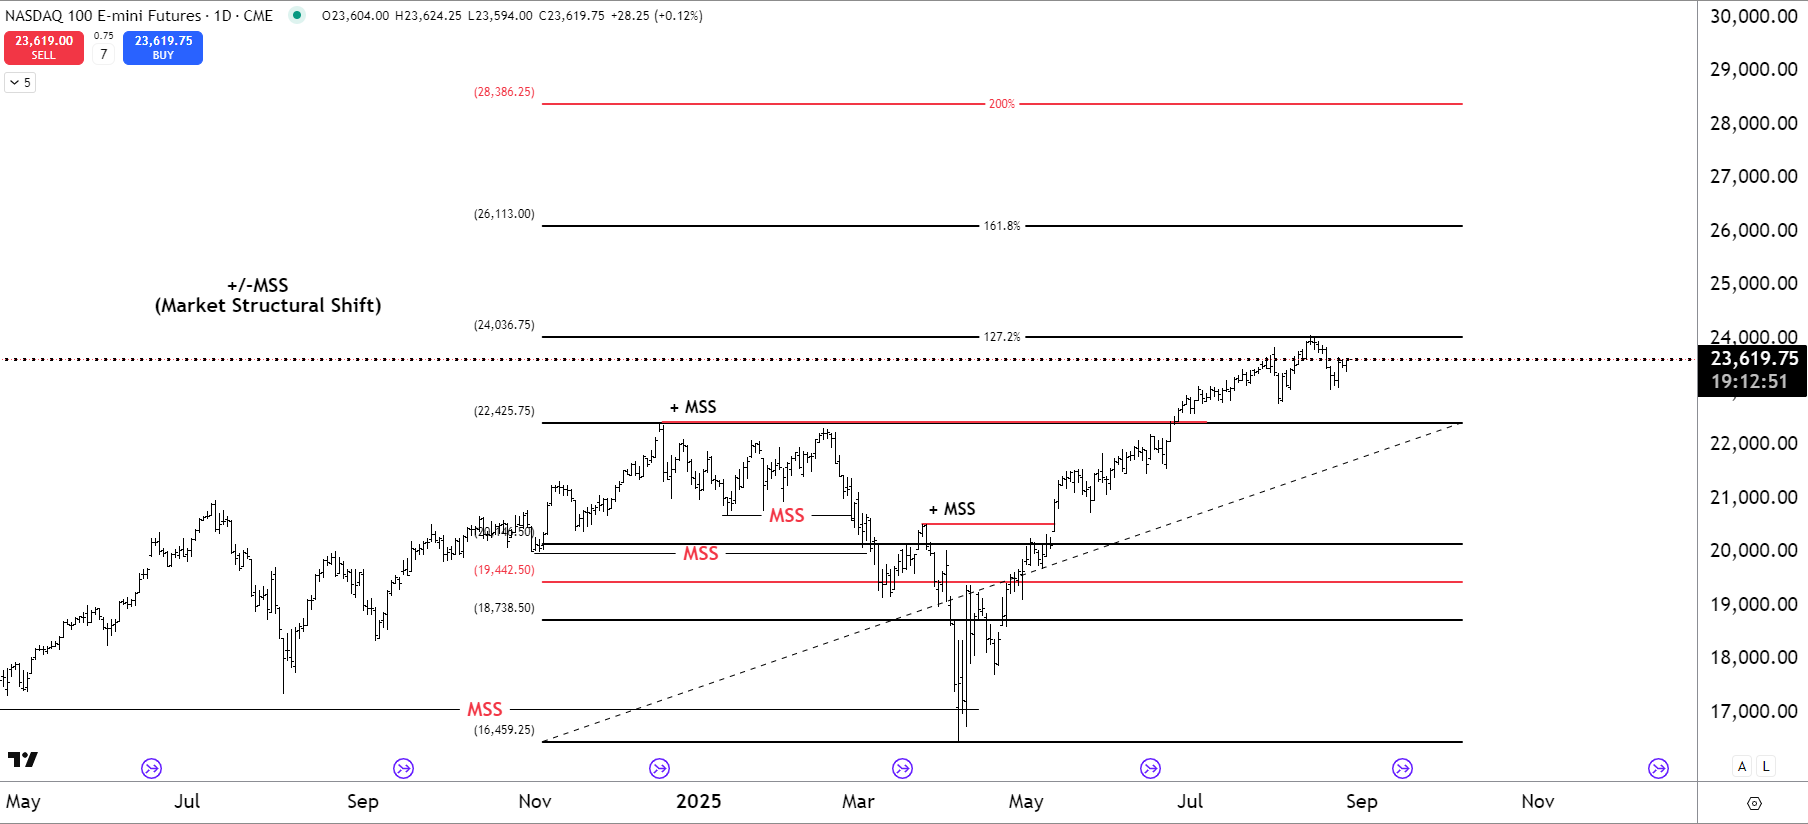
My idea over the next quarter or two. DXY continues its lower run sending foreign currencies higher. A weak dollar, investors will seek yield in risk assets which should result in US indices rallying. This is my 3–6 month outlook. That doesn't mean we won't see price runs against this bias, i.e. - a correction at fib. Ext. 127%. My bias has & will continue to be to the upside. On a weekly timeframe NQ may go to 26,370.
Thanks very much gedigan!
Great chart! The trend up has been stock market traders friend for sure!
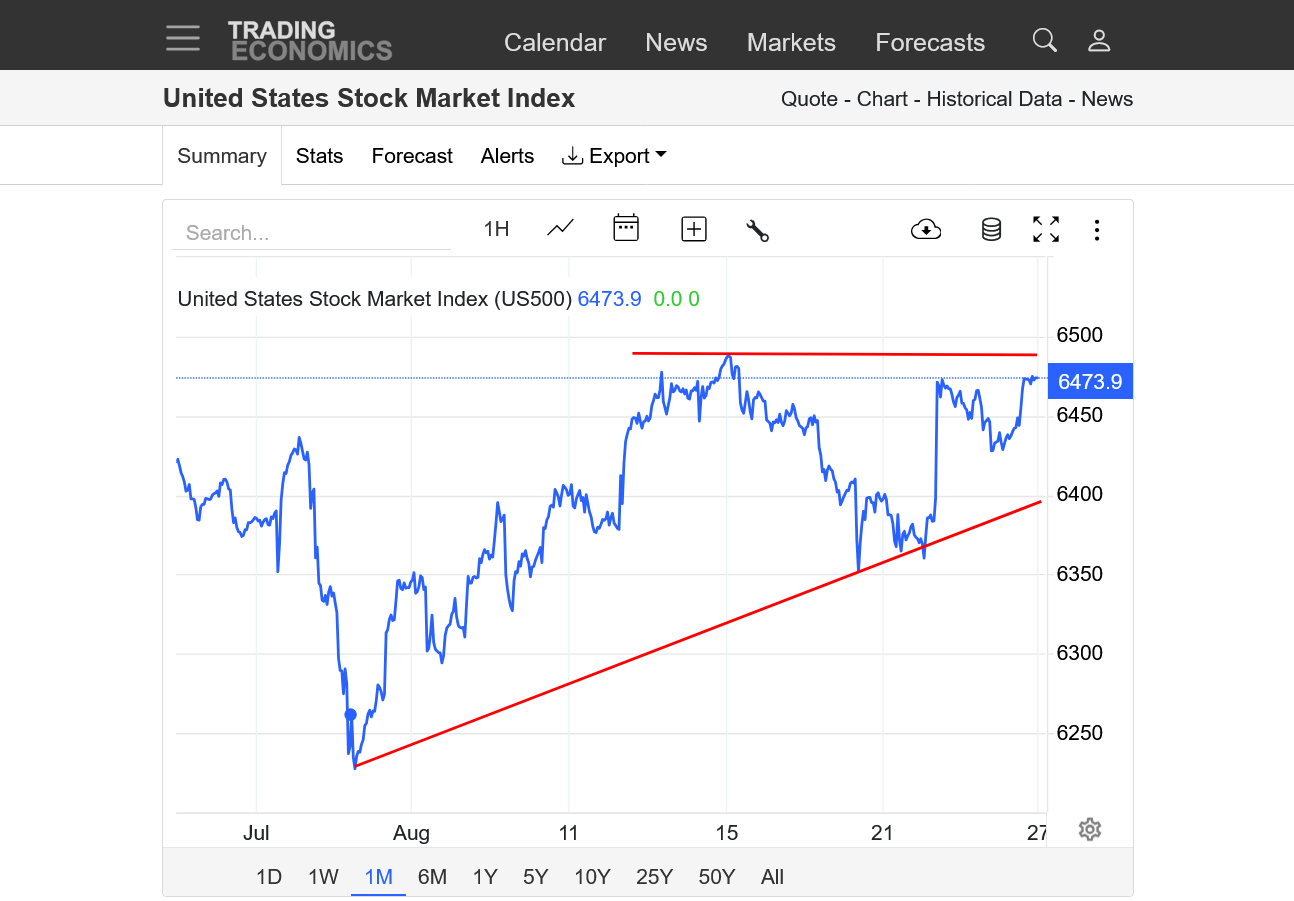
I'm taking the contrarian viewpoint because of the potentially rocky road ahead! We can make a case for the formation below to be an ascending triangle.
https://tradingeconomics.com/united-states/stock-market
+++++++++++++++++++++++++++++++=
Re: Re: Re: Re: Re: Re: Gold Trading Range
By metmike - Sept. 12, 2024, 8:25 a.m.
potential bull flag in a bull market/uptrend.
https://haikhuu.com/education/stock-ascending-triangle-pattern

Breaking out to the upside from the bullish, ascending wedges/triangles.
We can actually draw 2 of them. 1 from BEFORE the fed announced intentions to lower interest rates. 1 from AFTER the Fed announced intentions to lower interest rates with a STEEPER up trend line.
The spike higher on the 22nd was from the Feds interest rate cut verbiage during a speech. We had a small correction and are now trading at all time highs.
We need to stay above the top red line to remain bullish.
https://tradingeconomics.com/united-states/stock-market
Here it is again: This is a continuation pattern that features buyers stepping in to buy at higher and higher prices/corrections and not waiting for lower prices because they are so bullish.
potential bull flag in a bull market/uptrend. We need to STAY ABOVE THE BREAK OUT POINT OR IT BECOMES A FAKE OUT AND INSTEAD A TOP FORMATION!
https://haikhuu.com/education/stock-ascending-triangle-pattern
1. 1 month: News in the form of slightly higher inflation from Trump's tariffs has impacted the price and chart formation. It's now a potential false upside break out and top formation.
Closing below the lows/prices that last touched the uptrend line would confirm it. The market is EXTREMELY SENSITIVE TO NEWS RIGHT NOW! A HUGE report coming up next week is the jobs report. The market is trading whether the Fed will cut interest rates(bullish) or not (bearish). Losing more jobs again from the weak Trump economy will increase the chances of a rate cut, despite inflation from Trump's tariffs.
2. 1 year: Closing below the red line/highs from earlier this year would be an especially bad top formation. It could trigger some accelerated selling as momentum indicators turn down along with the factors mentioned earlier.
By metmike - Aug. 24, 2025, 7:44 p.m.
++++++++++++++++++
By metmike - Aug. 25, 2025, 10:10 p.m.
+++++++++++++++++++++++++
https://tradingeconomics.com/united-states/stock-market
False break outs:
https://priceaction.com/price-action-university/strategies/false-break-out/
https://www.puprime.com/understanding-the-failed-ascending-triangle-pattern/
Traders often adjust their strategies when a pattern fails. For example, they may initiate short positions if the price breaks below the ascending support line or wait for new patterns to emerge before committing capital. The key is to monitor volume and momentum indicators to confirm the breakdown and avoid trading on false signals.
Yes, it’s possible for a failed pattern to recover if market conditions improve or new buying pressure emerges. However, traders should wait for clear confirmation of a bullish breakout before re-entering a long position.
To minimise risk, always confirm breakouts or breakdowns with volume and use stop-loss orders to cap potential losses. Additionally, combining ascending triangle analysis with complementary indicators like RSI or MACD can provide more reliable signals.
No, while ascending triangles are often associated with bullish trends, they can also appear in bearish markets as a reversal pattern. The direction of the breakout (up or down) depends on the prevailing trend and market conditions.
++++++++++++++=
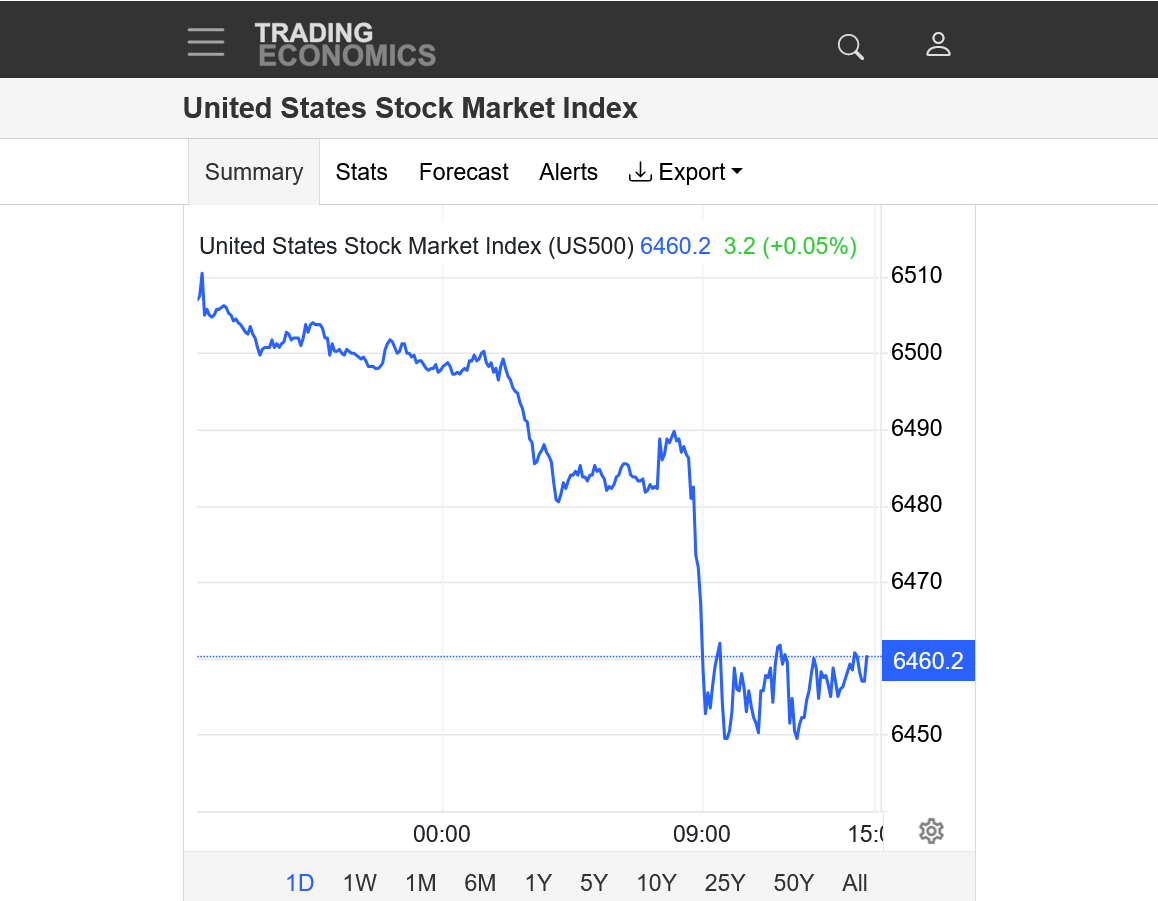
3pm update:
1 day price chart: Closing near the daily lows. The stock market doesn't need any negative news over the long weekend as it would cause a daily gap lower open to start next week and September which would be pretty negative after we just came back down below the previous highs with a potential false upside breakout from the ascending triangle/wedge pattern.
A gap lower would be a downside break away gap, which COULD be especially powerful, coming from all time highs that just got rejected with no follow thru buying.
https://tradingeconomics.com/united-states/stock-market
Earlier today, there was positive news as the economy grew at 3.3% in the 2nd quarter which was higher than expected after the much weaker than expected 1st quarter number.
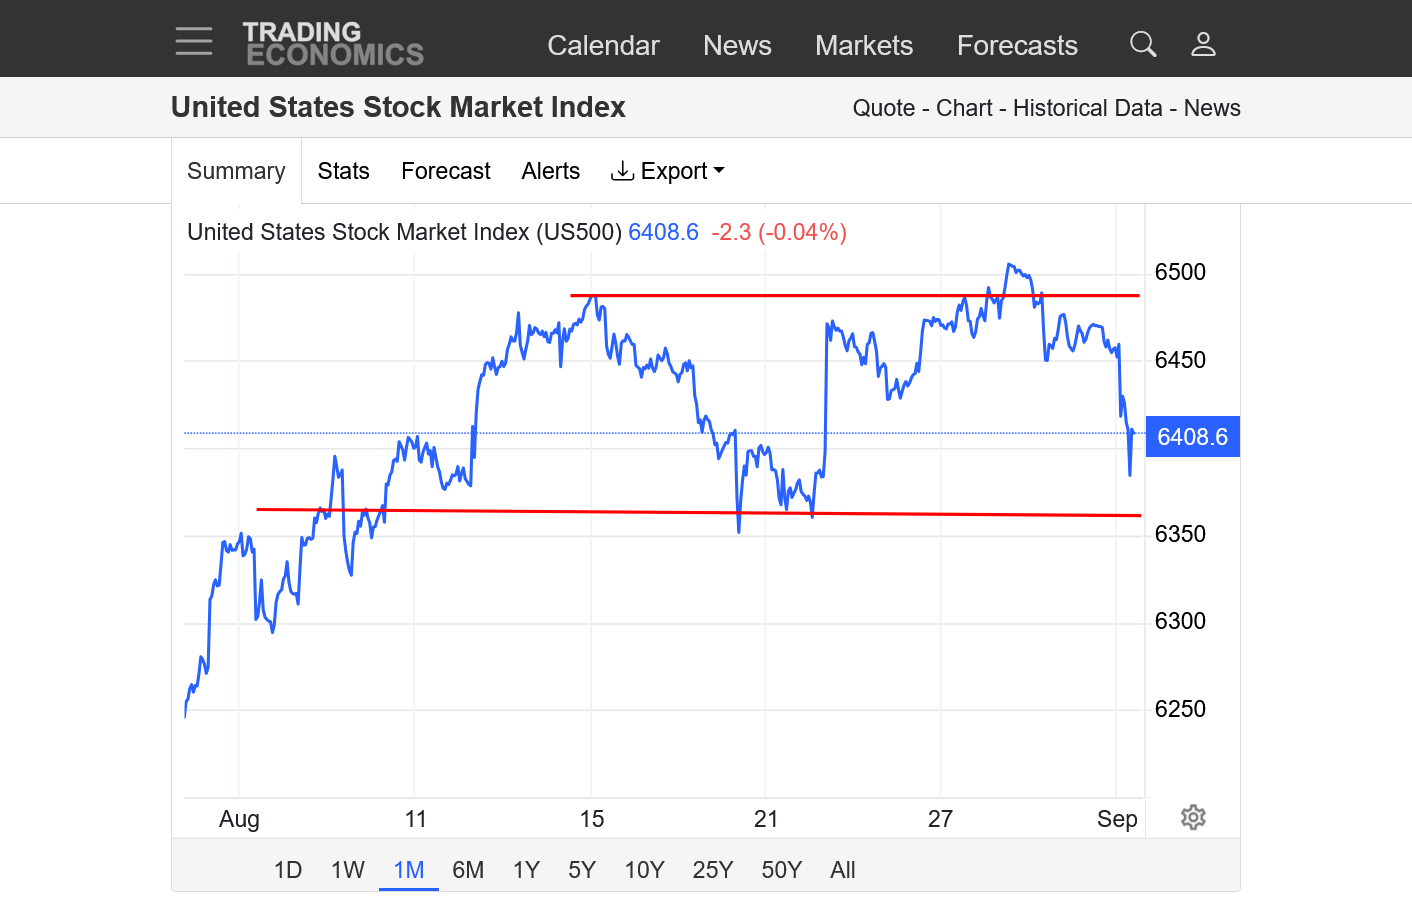
POTENTIAL double top formation! False Upside break out to new highs last month? LOOK OUT BELOW?
https://tradingeconomics.com/united-states/stock-market
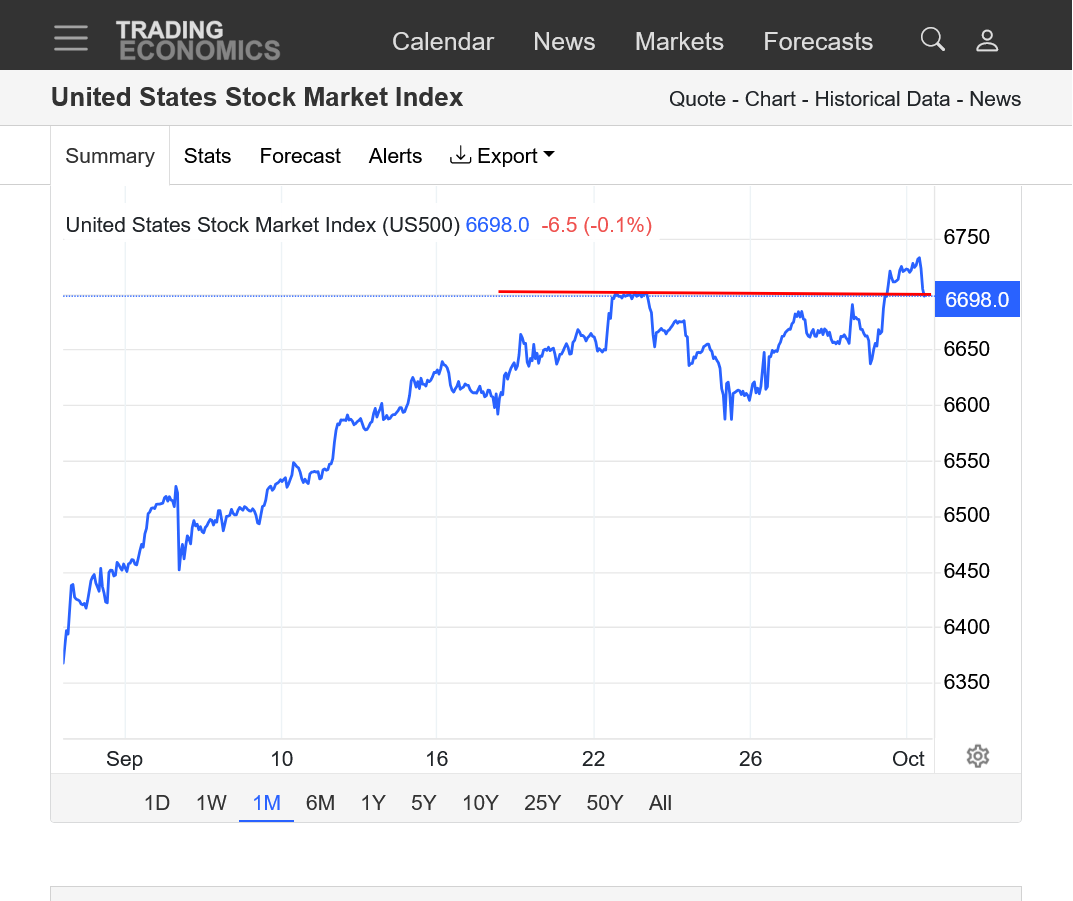
1. 1 month. Possible double top. Support is where we were trading before the Fed gave a stronger signal that they would lower interest rates in September. A close below support is a top confirmation sign.
2. 1 year: Potential double top. Challenging the recent, accelerated uptrend. Still well above the previous highs in early 2025 and WAY above the spike lows from Trump's ruinous tariff schemes agenda announcement in early April.
3. 10 year: POWERFUL trend up. Even the spike lower in April couldn't make it down to the upward accelerating up trend.
We held key support and have bounced. One can still make a bullish case here.
https://tradingeconomics.com/united-states/stock-market
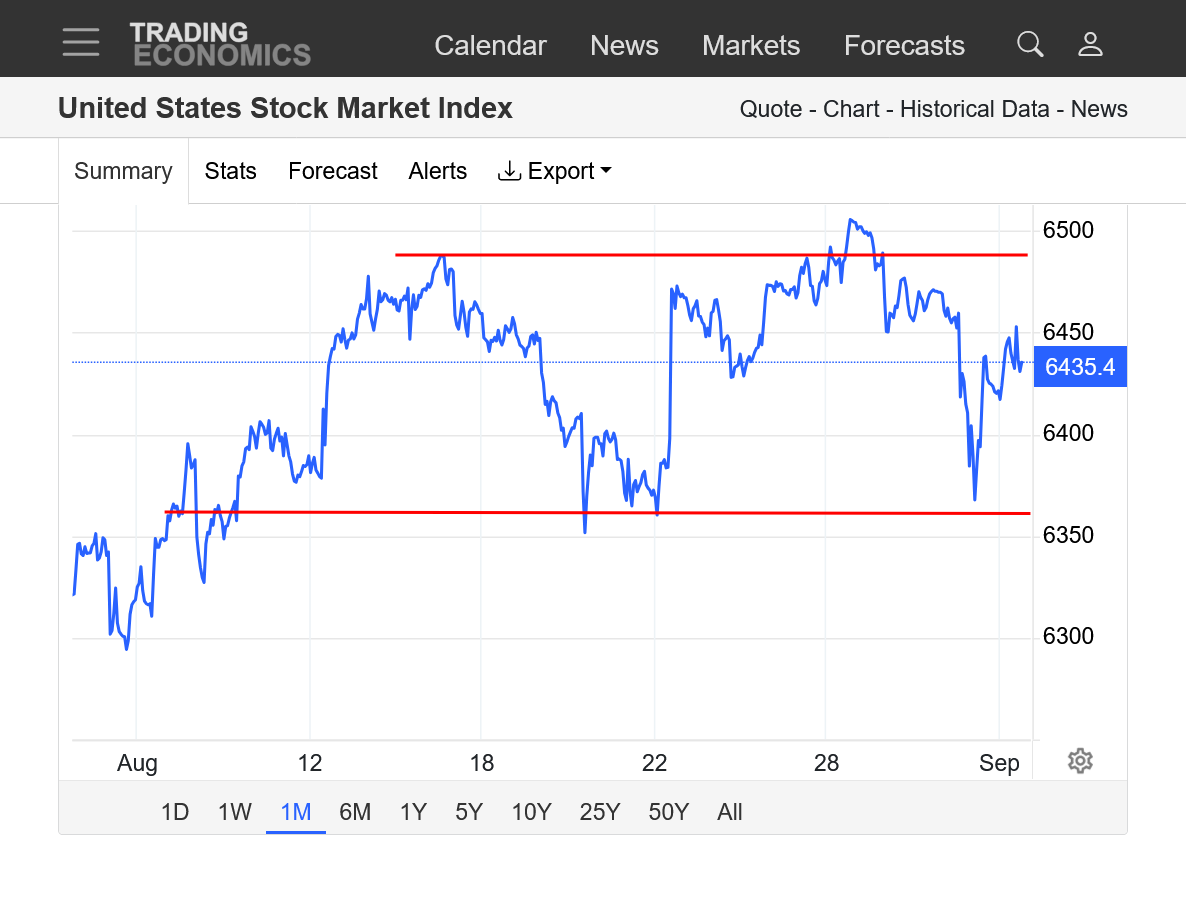
1. 1 month: Potential double top. But we held support, so a potential sideways, continuation pattern.
2. 1 year: Prevailing trend hasn't been violated yet. Spike lower from the Trump tariff announcement in early April at the bottom. Previous high above that from early 2025. As long as we stay above the previous high, the bullish cause is still strong. A close solidly below that may flash a lot of sell signals on computer trading programs.
3. This interpretation can't know what the news will be. Its only graphing what HAS happened and using technical analysis that will provide strong/good possibilities but NEVER know the actual news that will play a critical role in determining the future pricing.
For example, if Trump's tariffs were suddenly all cancelled, it's likely to have a powerful spike up. Sometimes, the REACTION afterwards is noteworthy. If the market can't hold gains from very bullish news...........it suggests that the trade is running out of bulls.
The spike lower in April was met with sustained buying which took us to new highs because the trade shrugged it off from its overall bullish mentality(lots of bulls that saw that as a buying opportunity)
The Ponzi scheme stock market continues to try to ignore Trump's ruinous, economy damaging, pathological thinking/decision making but is struggling against increasing pressure from the damaging news coming up.
The charts still say we should go higher but my bias is LOWER because of the Trump economy and still valid factors mentioned previously.
The stock market is a self fulfilling prophesy tool for rich speculators to keep feeding it, that's not tethered to authentic valuation or fundamentals. It's CRAZY overvalued here and with a CRAZY man making really bad decisions from the White House, this irrational exuberance bubble is very vulnerable.
By metmike - Aug. 24, 2025, 7:44 p.m.
+++++++++++++++++++++++++++
https://tradingeconomics.com/united-states/stock-market
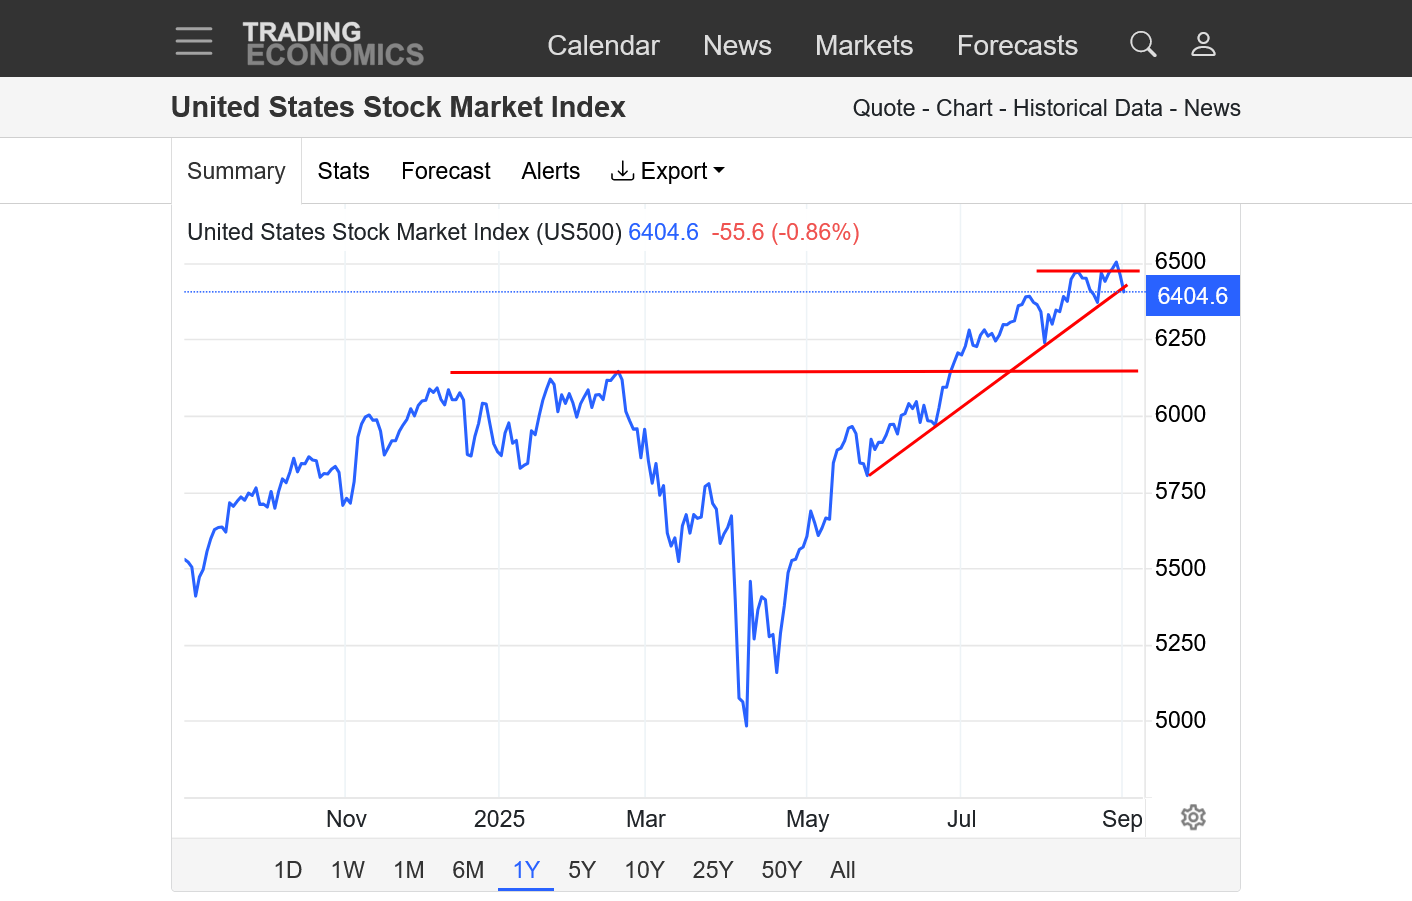
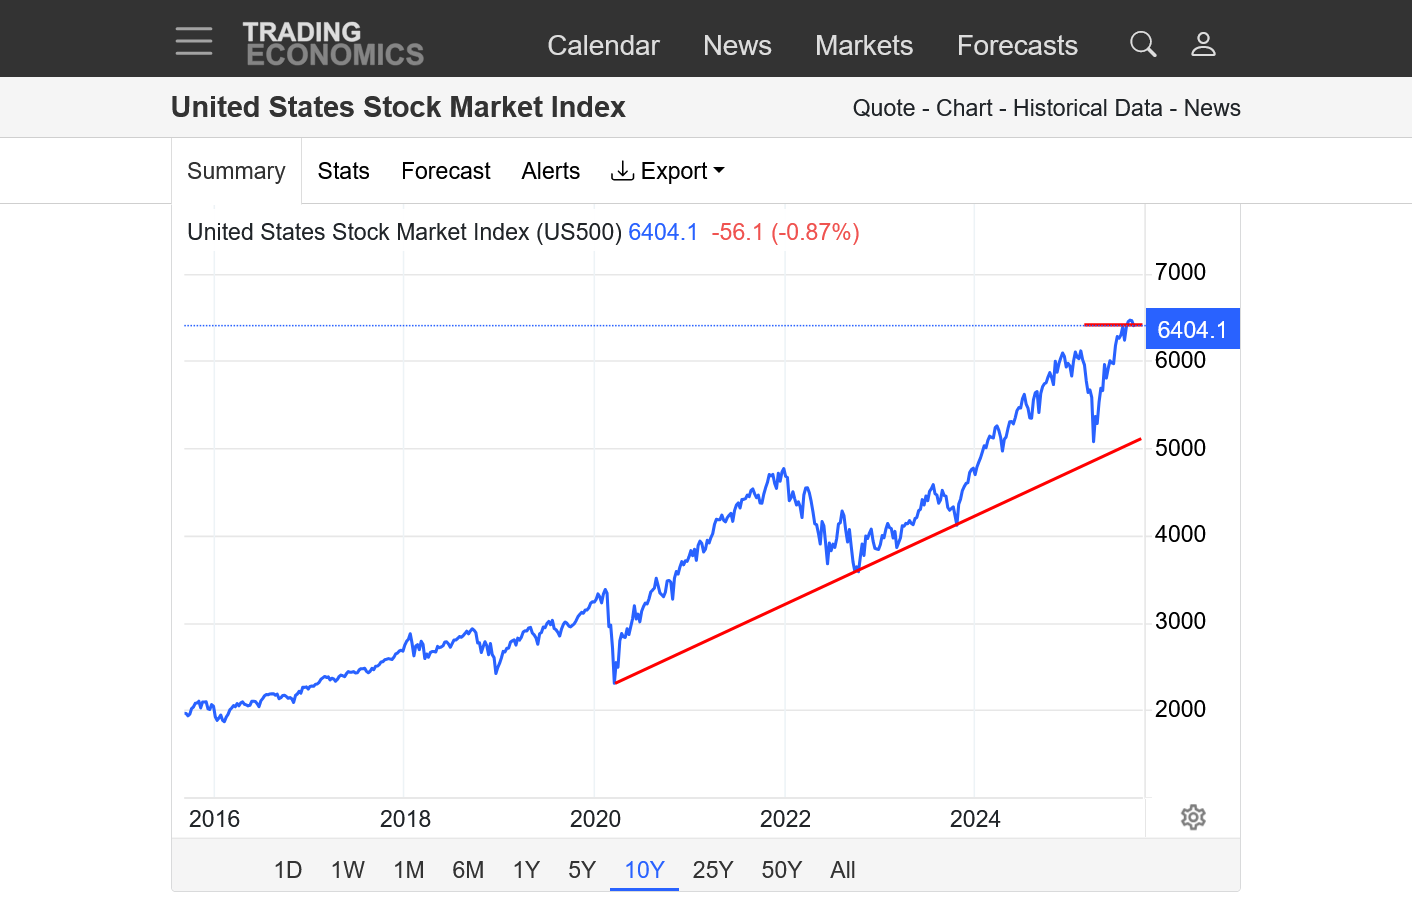
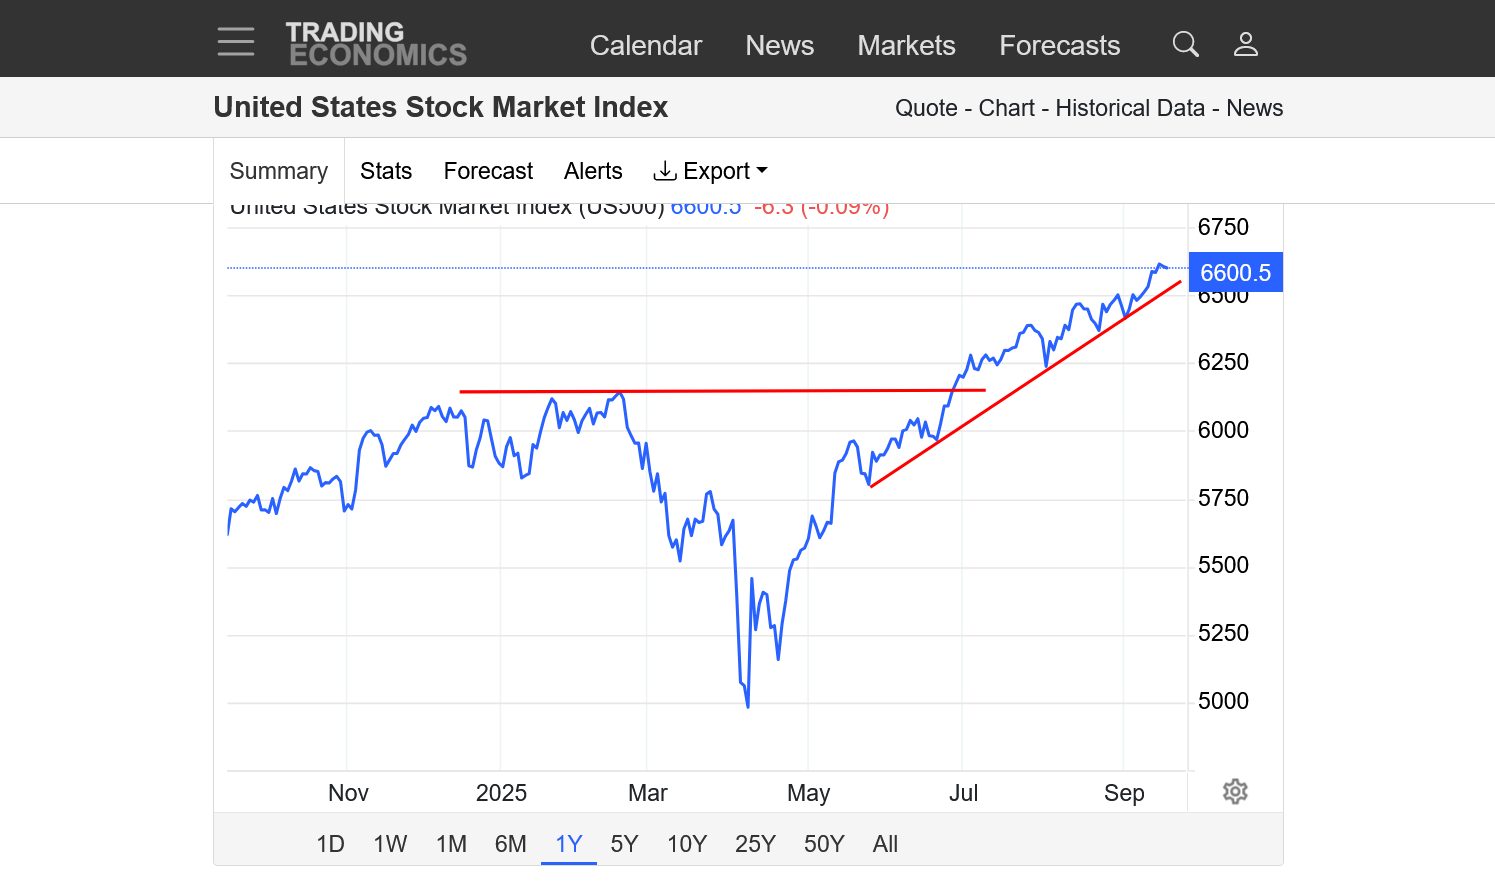
1. 1 year: April, spike low from Trump's tariffs at the bottom. Previous highs=long red line. Recent uptrend looks like a bull flag(continuation chart formation) or possible top.
2. 1 month: Uptrend channel or possible triple top.
3. 10 years: Strong uptrend with increasing slope with a parabolic/exponential move higher that is UNSUSTAINABLE but the timing of it ending is NOT PREDICTABLE!
New record highs for the stock market indices on Thursday!
Bad news for the economy and the majority of people in the US is GOOD NEWS for rich people and the stock market that want the lower interest rates to stimulate the weak economy that will send more money to the stock market.
https://tradingeconomics.com/united-states/stock-market
https://qz.com/stock-market-rally-tech-jobs-fed-interest-rates
The paradox is that bad news for workers has become good news for markets.
+++++++++++++++++++
Bingo!
I think there's a good chance that the reality of the interest cuts being announced will cause a buy the rumor, sell the fact type reaction in the stock market that will put the highs in.
https://tradingeconomics.com/united-states/stock-market
1. 1 day: Red line marks the release of the interest rate cut
2. 1 month
3. 1 year
4 10 years
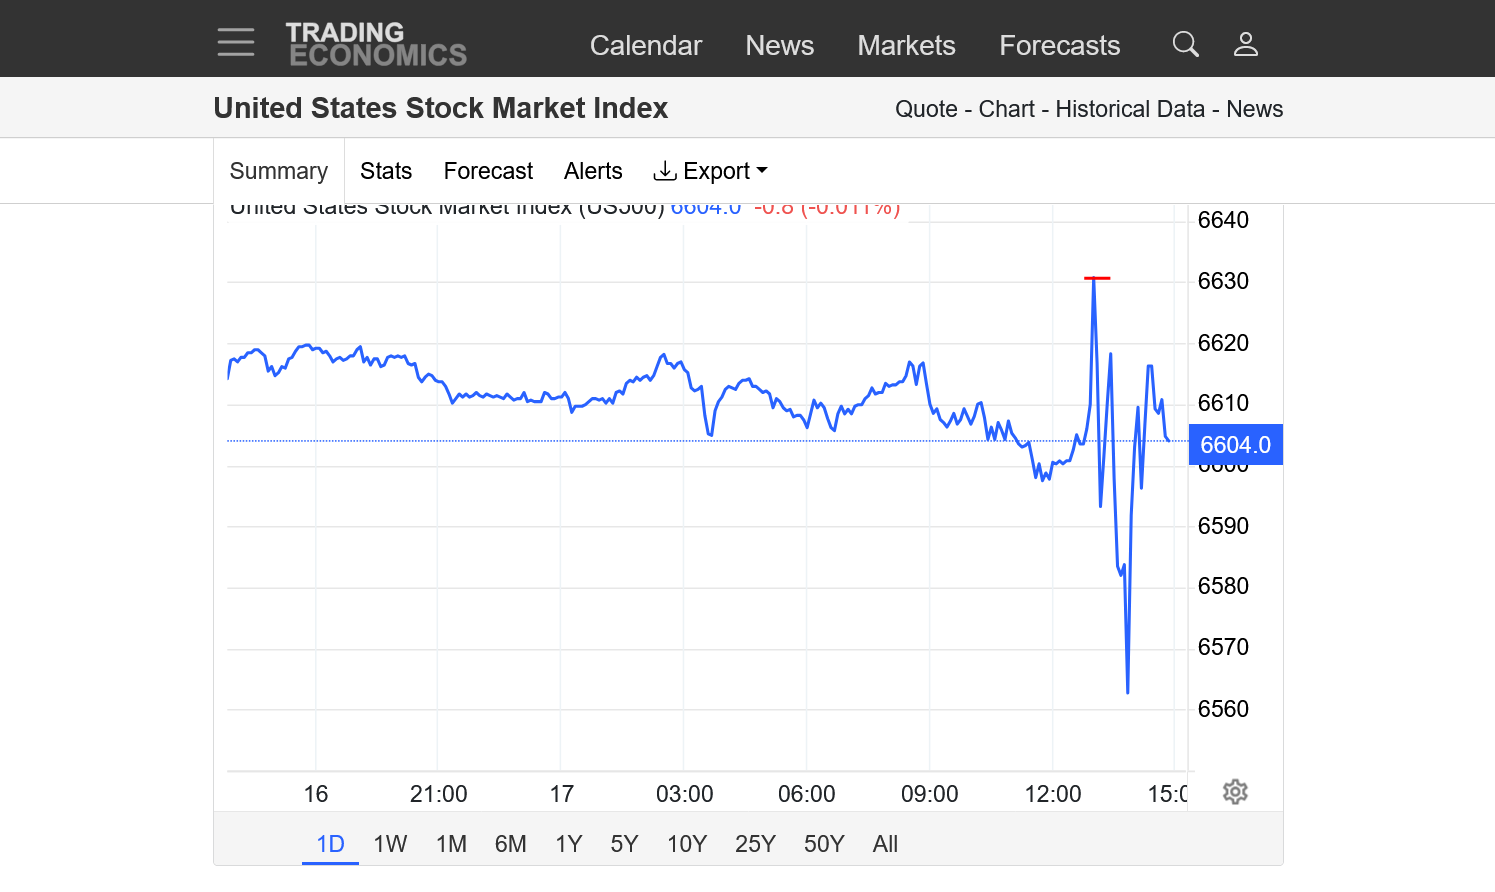
Potential reversal lower on the weekly chart if we close below the red line.
This is a Ponzi Scheme market detached from economy bearish fundamentals as wealthy people keep feeding it with more and more leveraged money, creating a greater and greater disparity between intrinsic value based on the companies in the indices and the real world and stock prices.
This is the time of year when the stock market is most vulnerable.
This is NOT a prediction or suggestion of taking a position. Just having fun following the factors which control the market, including psychology, fundamentals and technical/charts.
https://tradingeconomics.com/united-states/stock-market
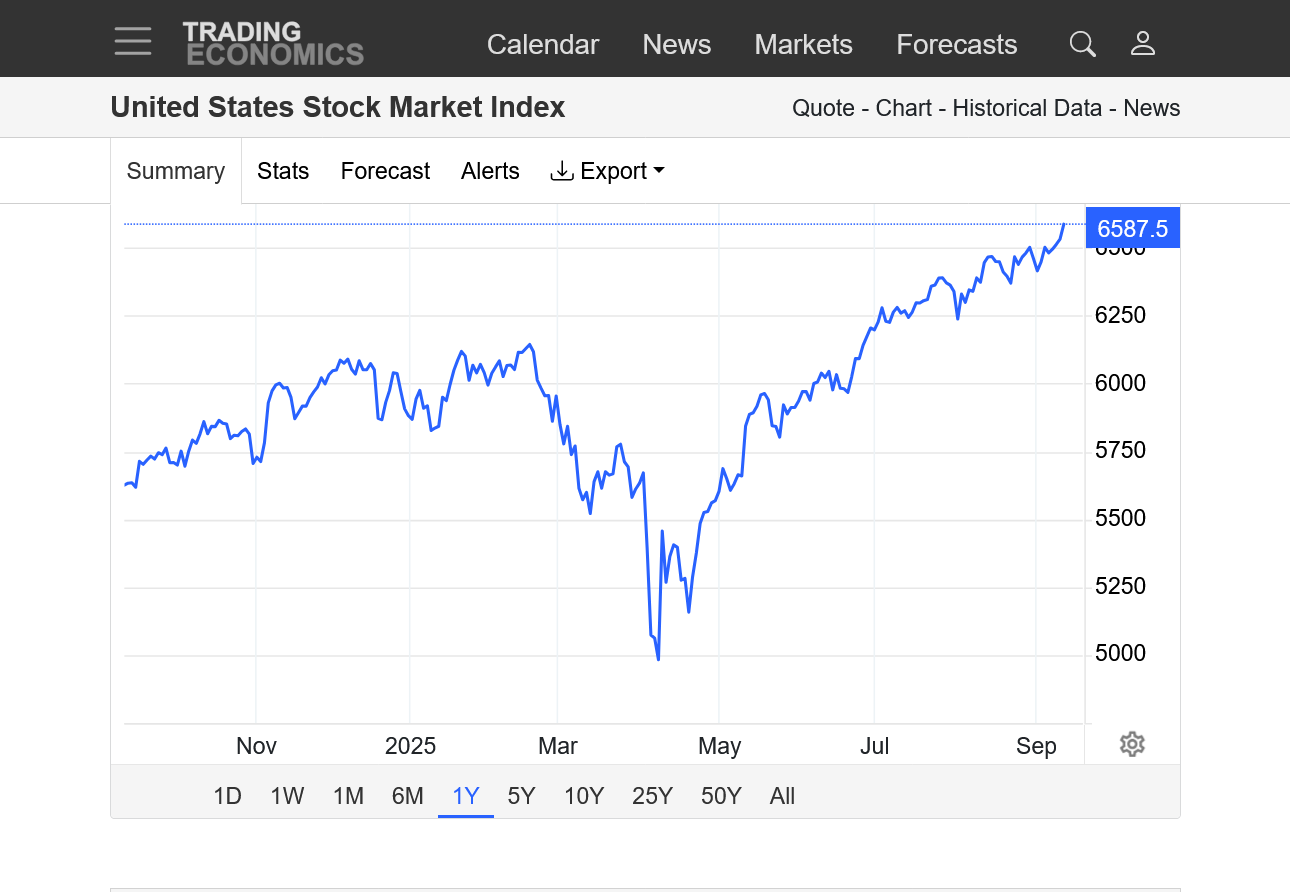
Fresh all time highs again today for the wealthy people's Ponzi scheme!
1. News of an economic slow down and weak economy and lost jobs = record highs
2. News of excessive inflation = record highs
3. News of additional ruinous tariffs with no rhyme or reason in setting them =record highs.
4. News of a government shutdown = record highs
5. Increasingly unhinged, lunatic rants from a pathologically thinking and acting president that completely makes up and imagines the world he describes = record highs
6. Record highs in the stock market =Trump's positive reinforcement message that the wealthy people want him to keep doing exactly what he's doing and in fact, double and triple down on it.
++++++++++++++++
https://tradingeconomics.com/united-states/stock-market
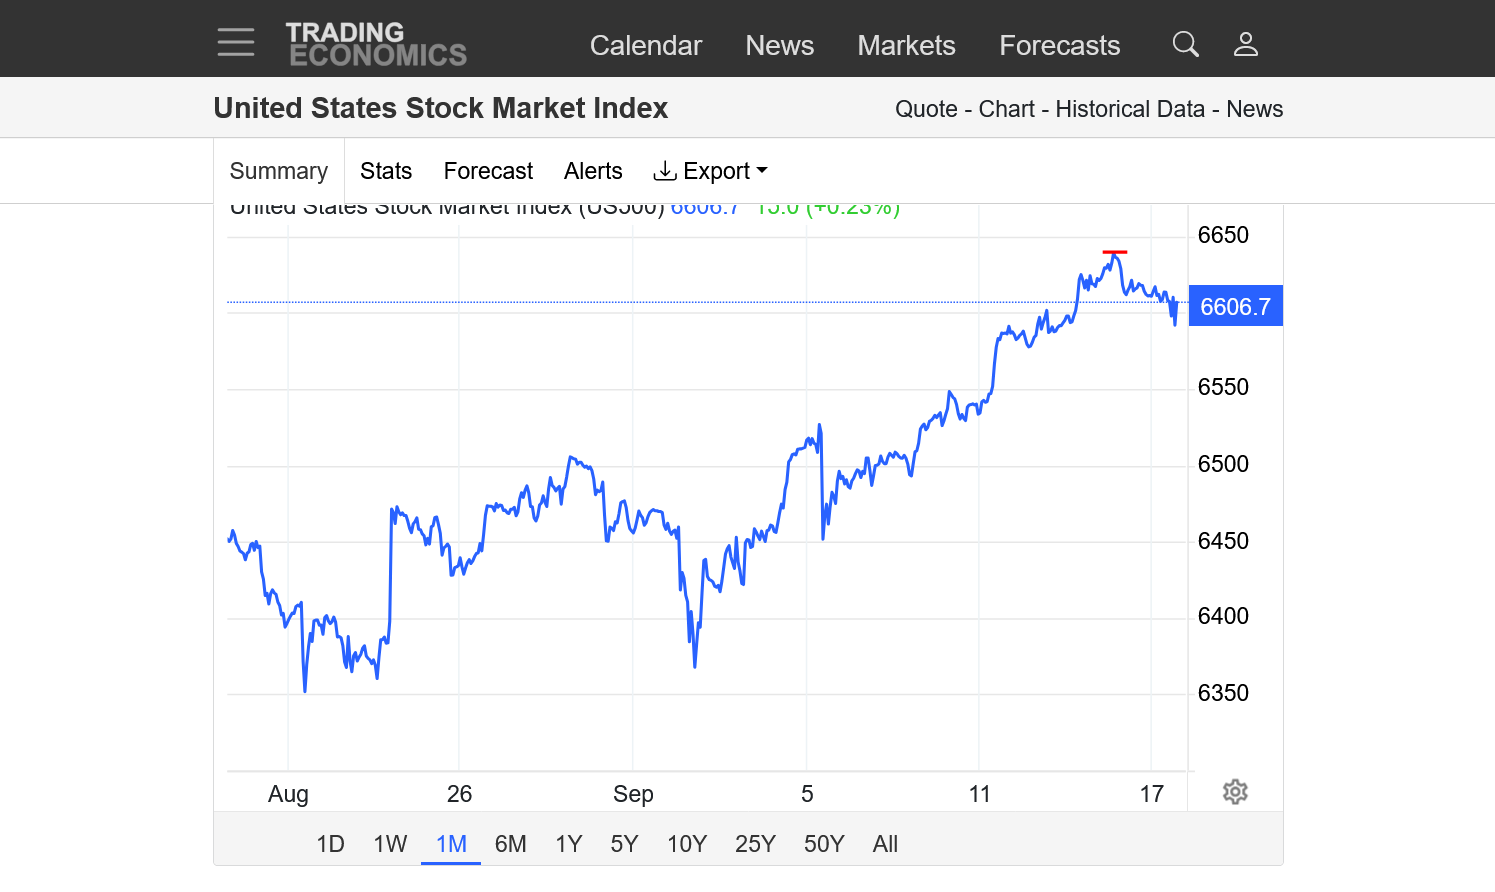
1. 1 month. New highs today
2. 10 years. Parabolic/exponential move higher with an increasingly steep uptrend slope line. Completely detached from intrinsic valuations. Money flows are dumping in from rich people based on the principle of a "self fulfilling prophesy".
https://philonotes.com/2024/12/robert-k-mertons-theory-of-the-self-fulfilling-prophecy
++++++++++++++=
+++++
The Stock Market Is Disconnected From Reality.
It's impossible to know when this will end or how high it will go but every parabolic/exponentially moving market like this in history DID END. And when it ended, it came down even faster than it went up for awhile.
Potential reversal lower today? Considering the overwhelming really bad news that can serve as fuel to ACCELERATE a drop lower, an enormous plunge lower is a high probability when the Ponzi Scheme buying runs out of steam and the bubble bursts!!!
But it all depends on the psyche of wealthy stock market investors/traders/speculators. If they continue to pile on with added buying, ignoring most of the bad news........we can keep going higher.