Previous thread:
https://www.marketforum.com/forum/topic/112055/
Last post:
By metmike - June 29, 2025, 4:37 p.m.
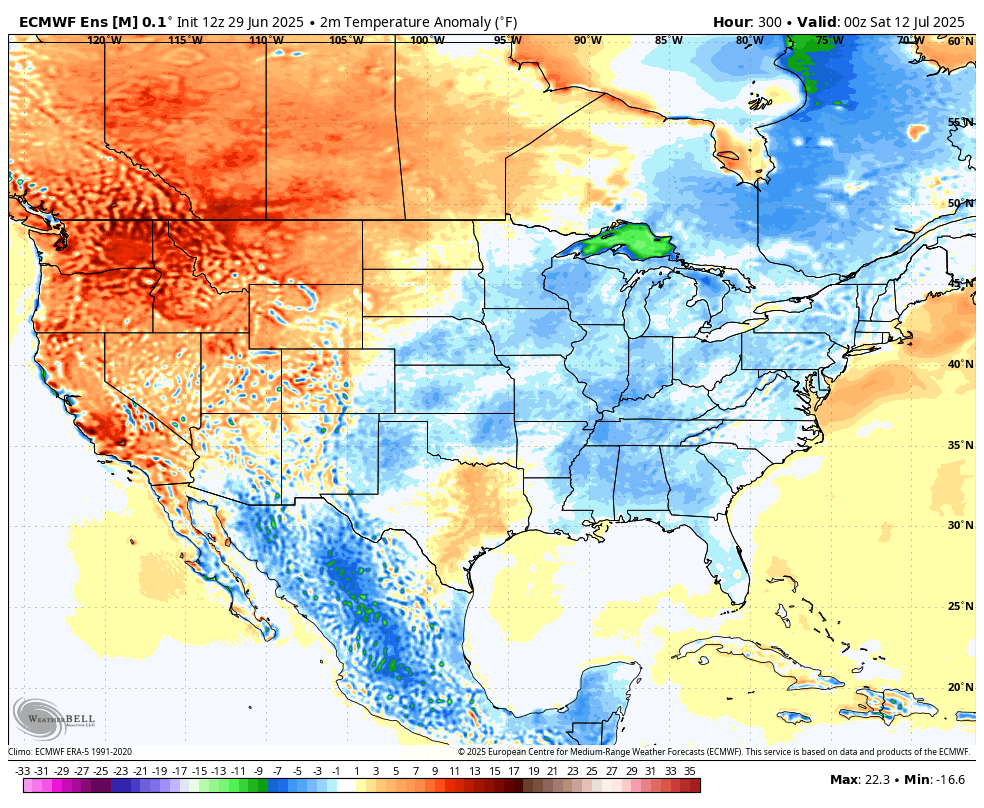
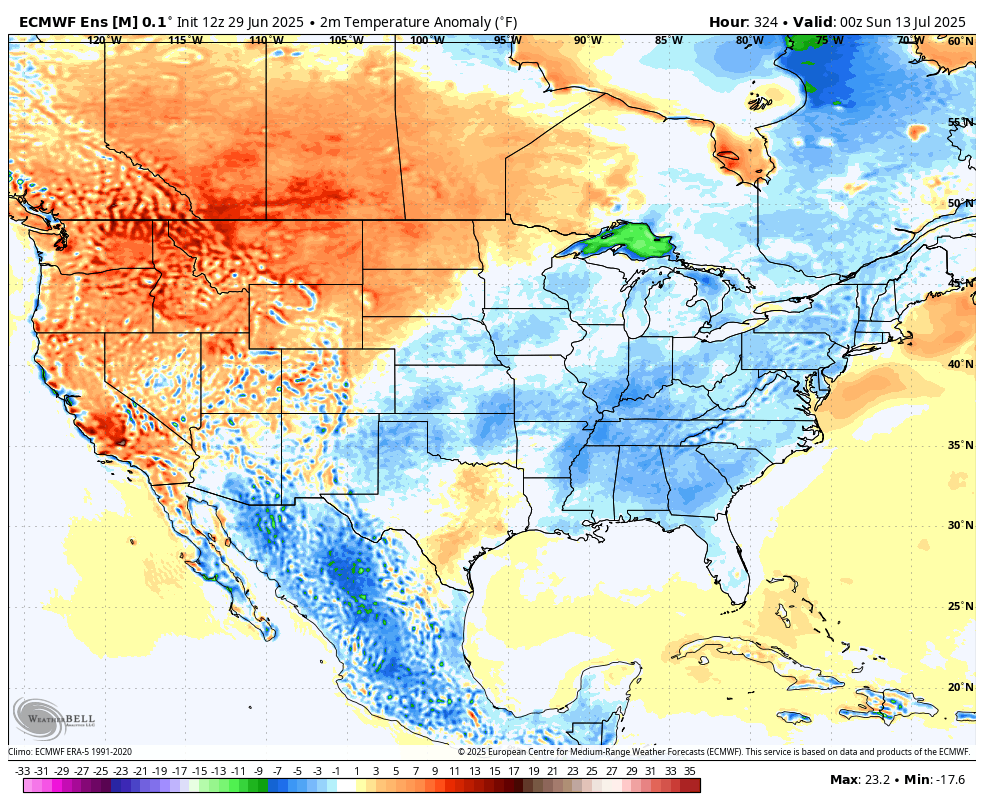
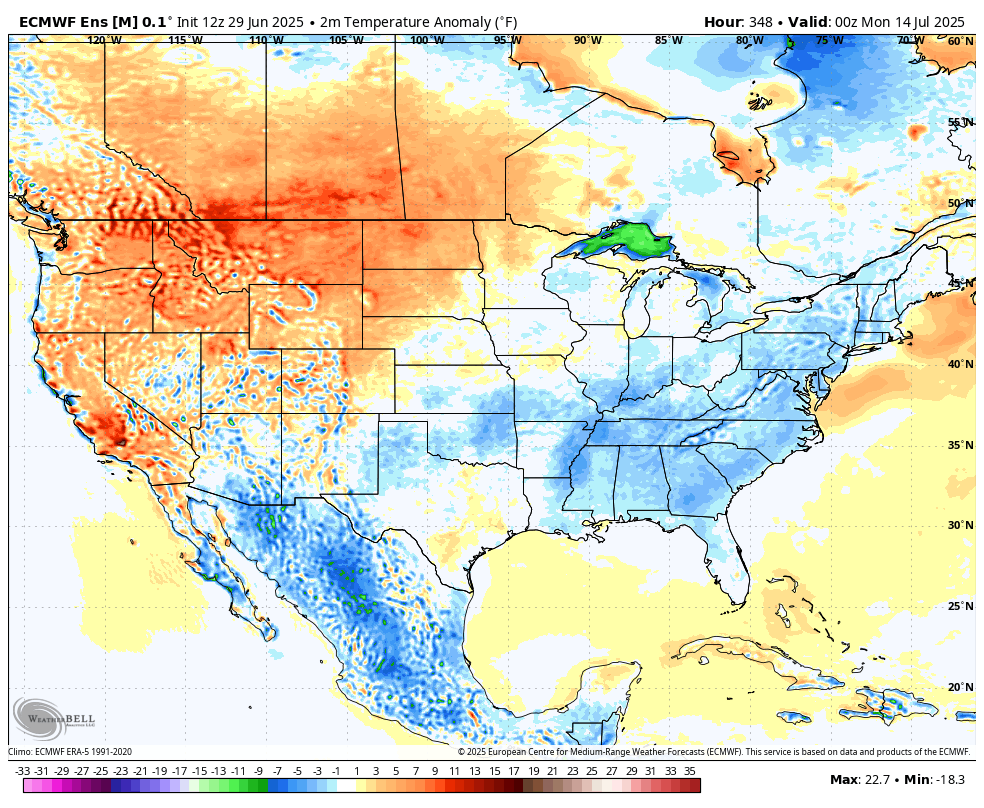
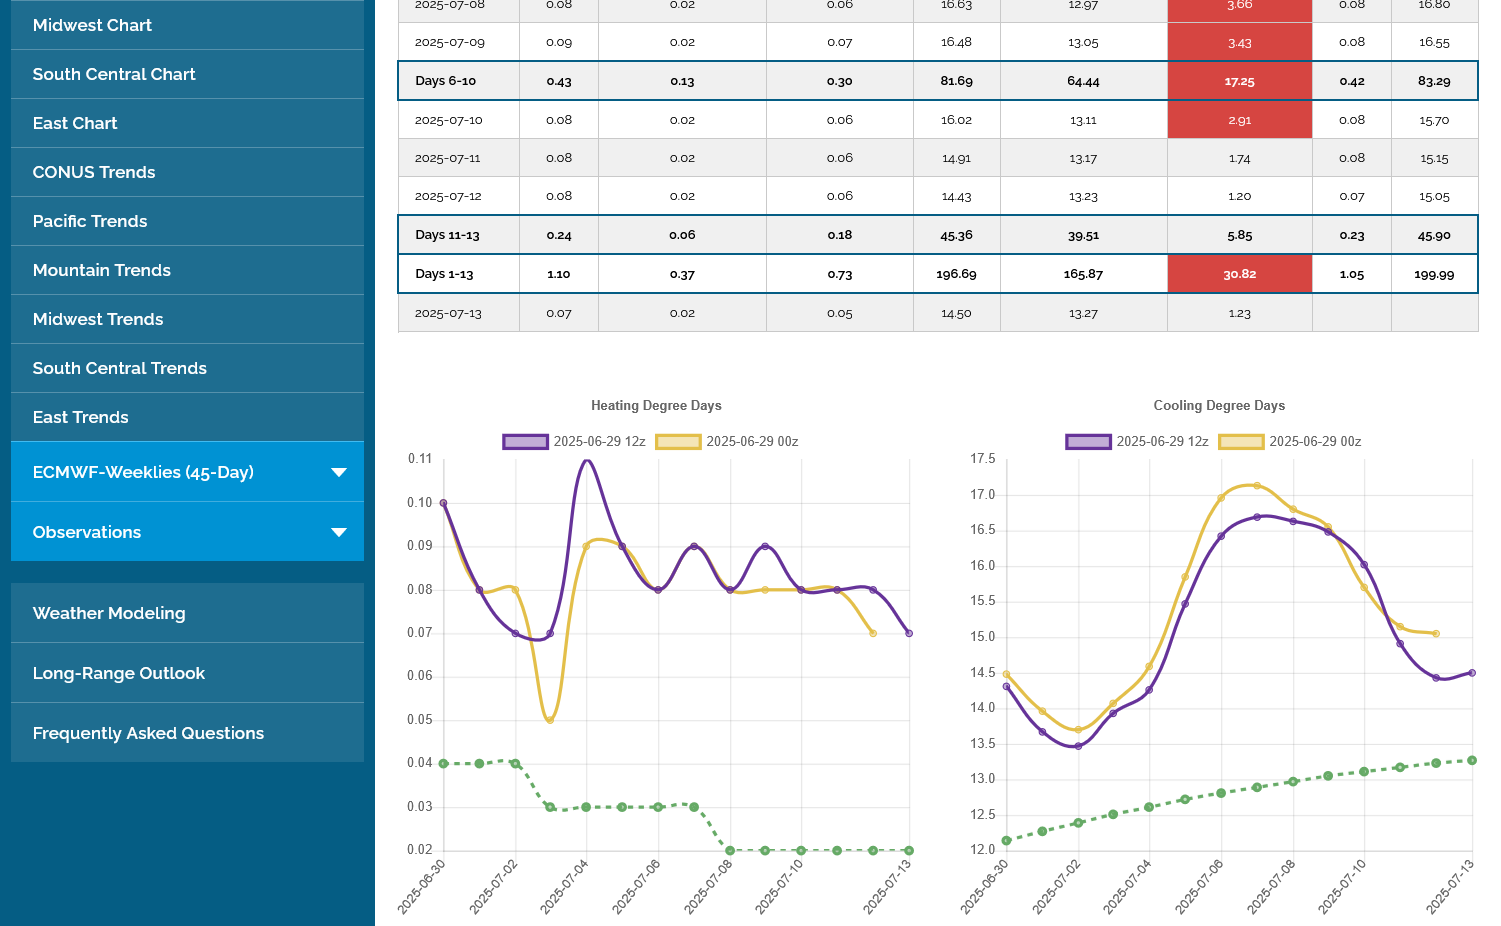
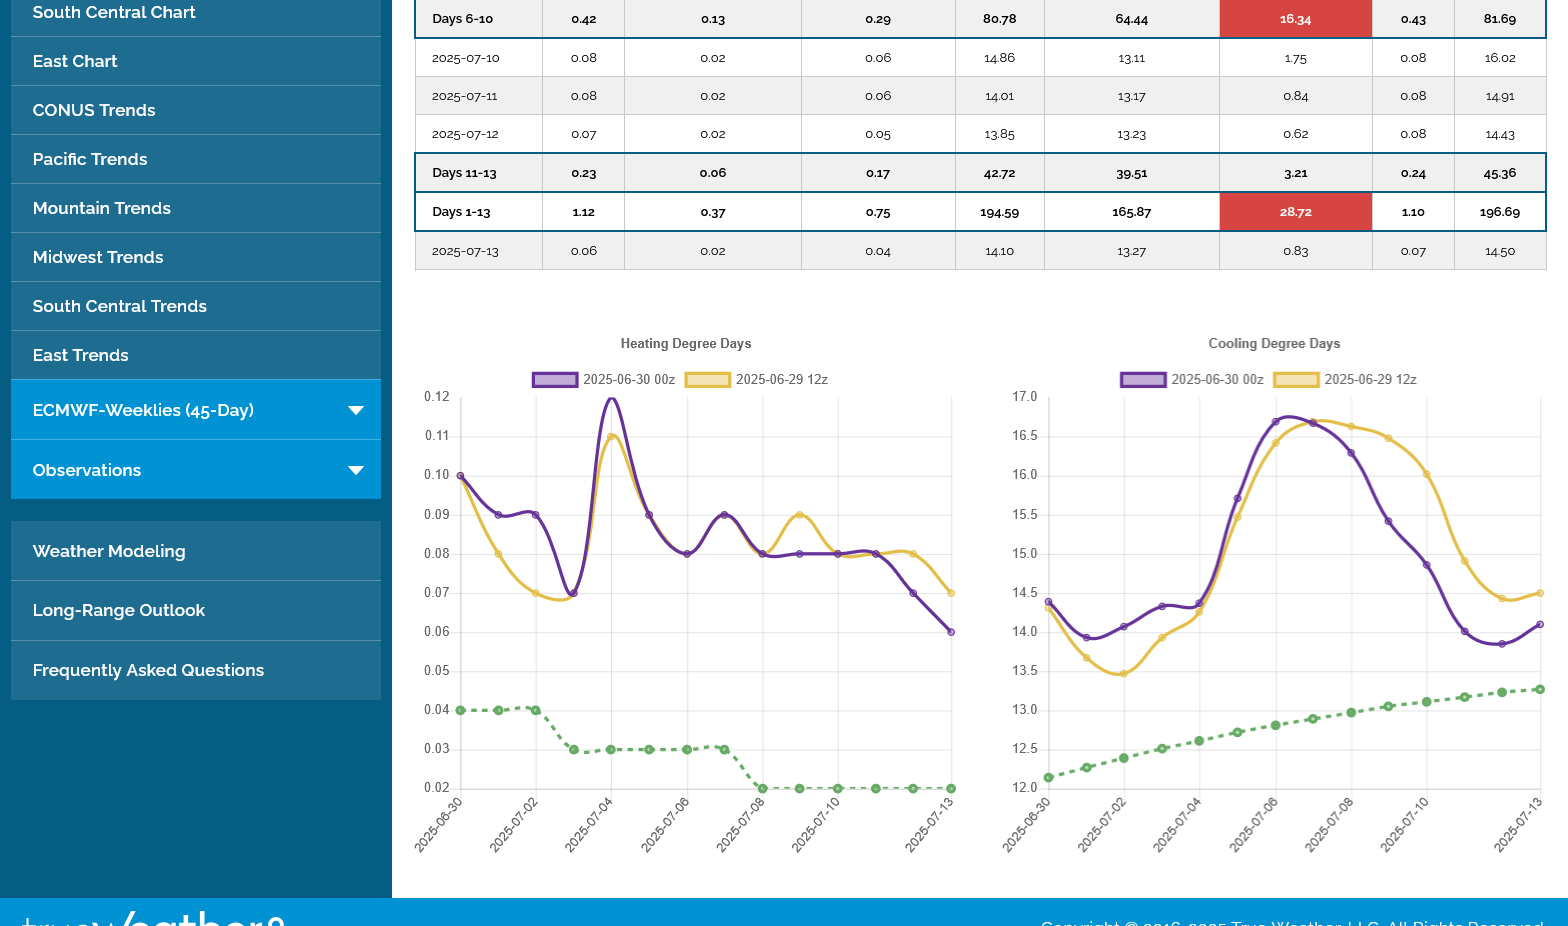
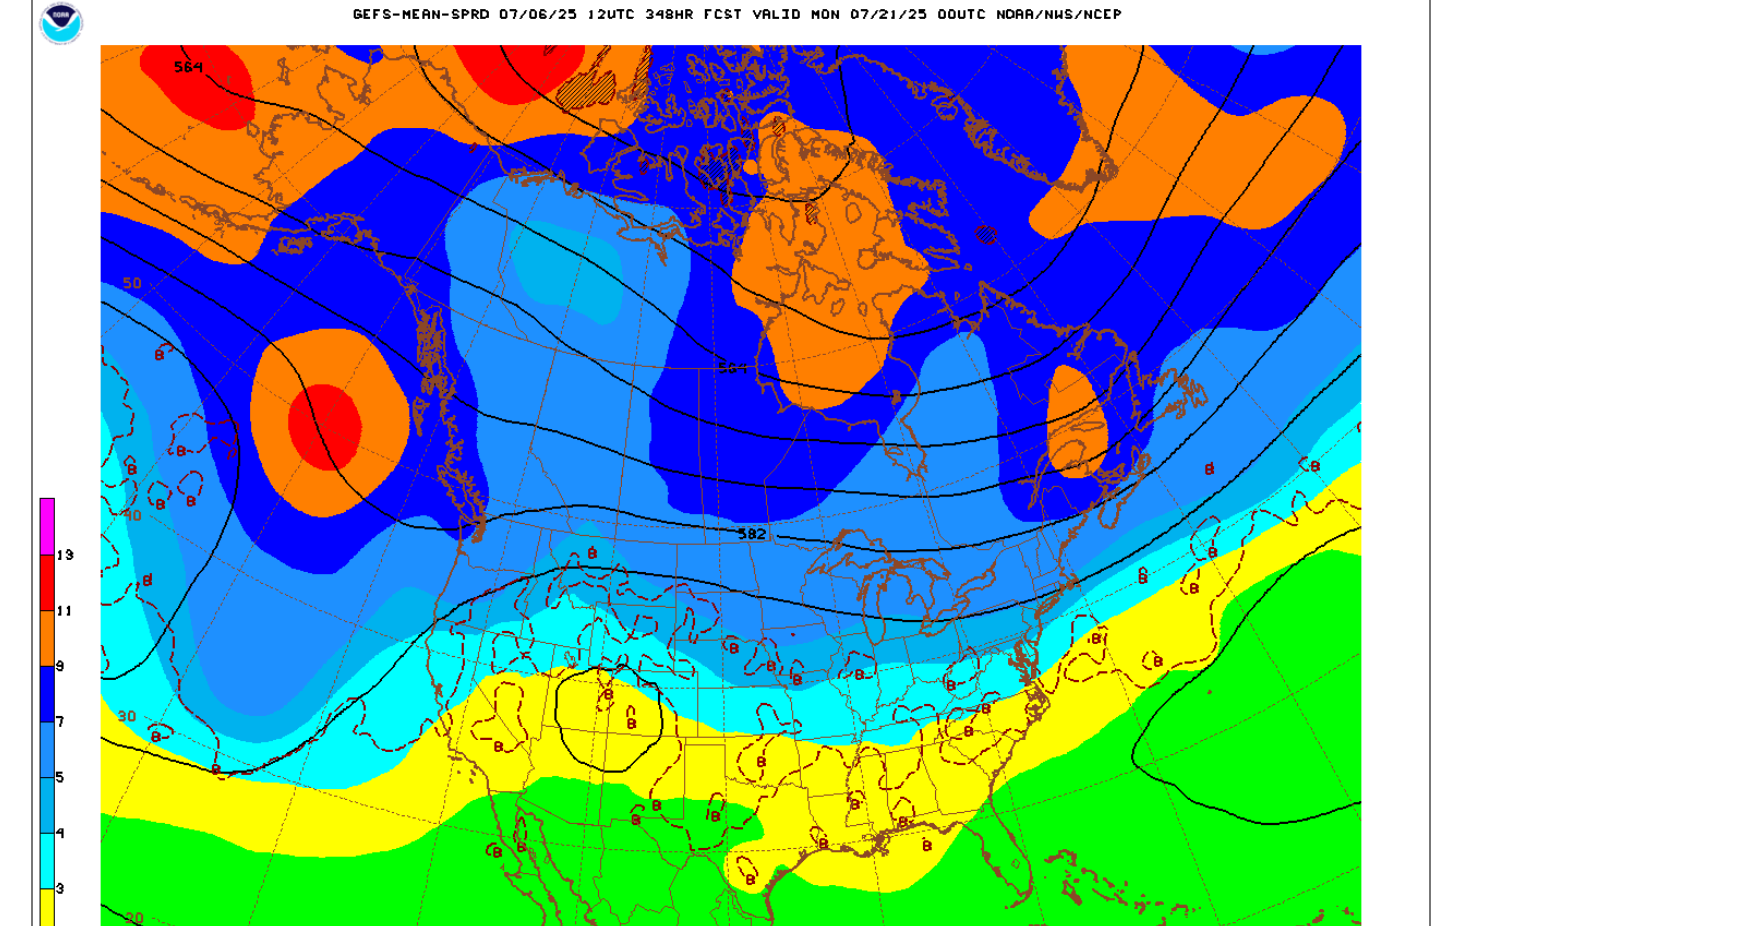
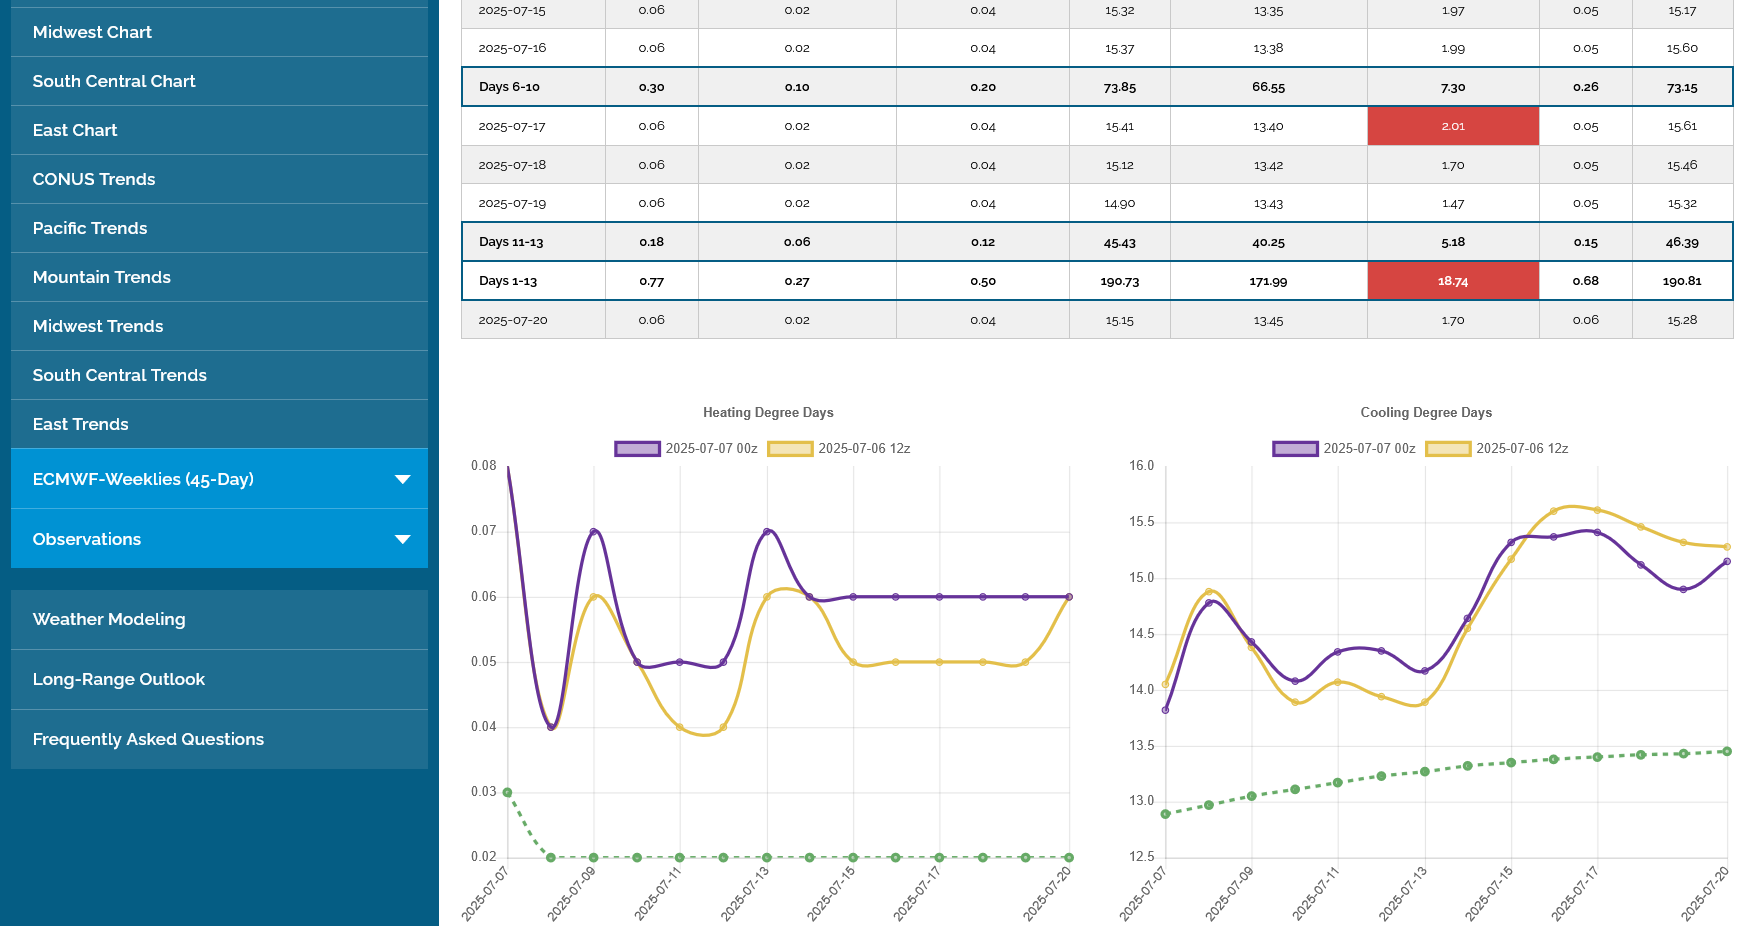
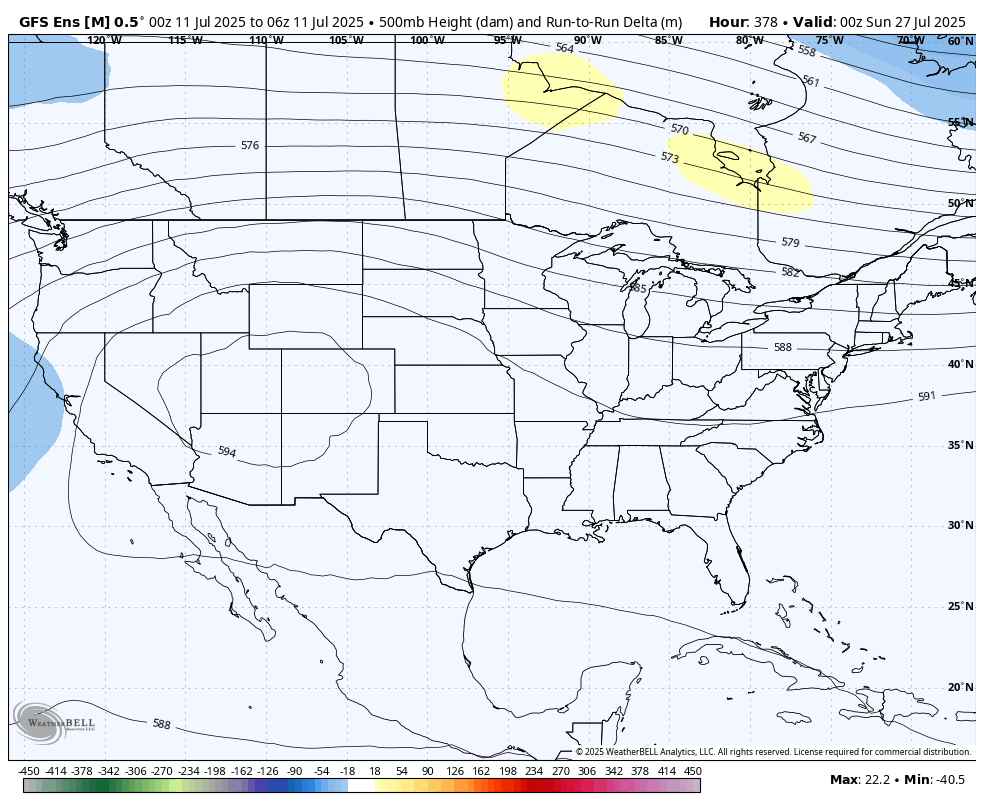
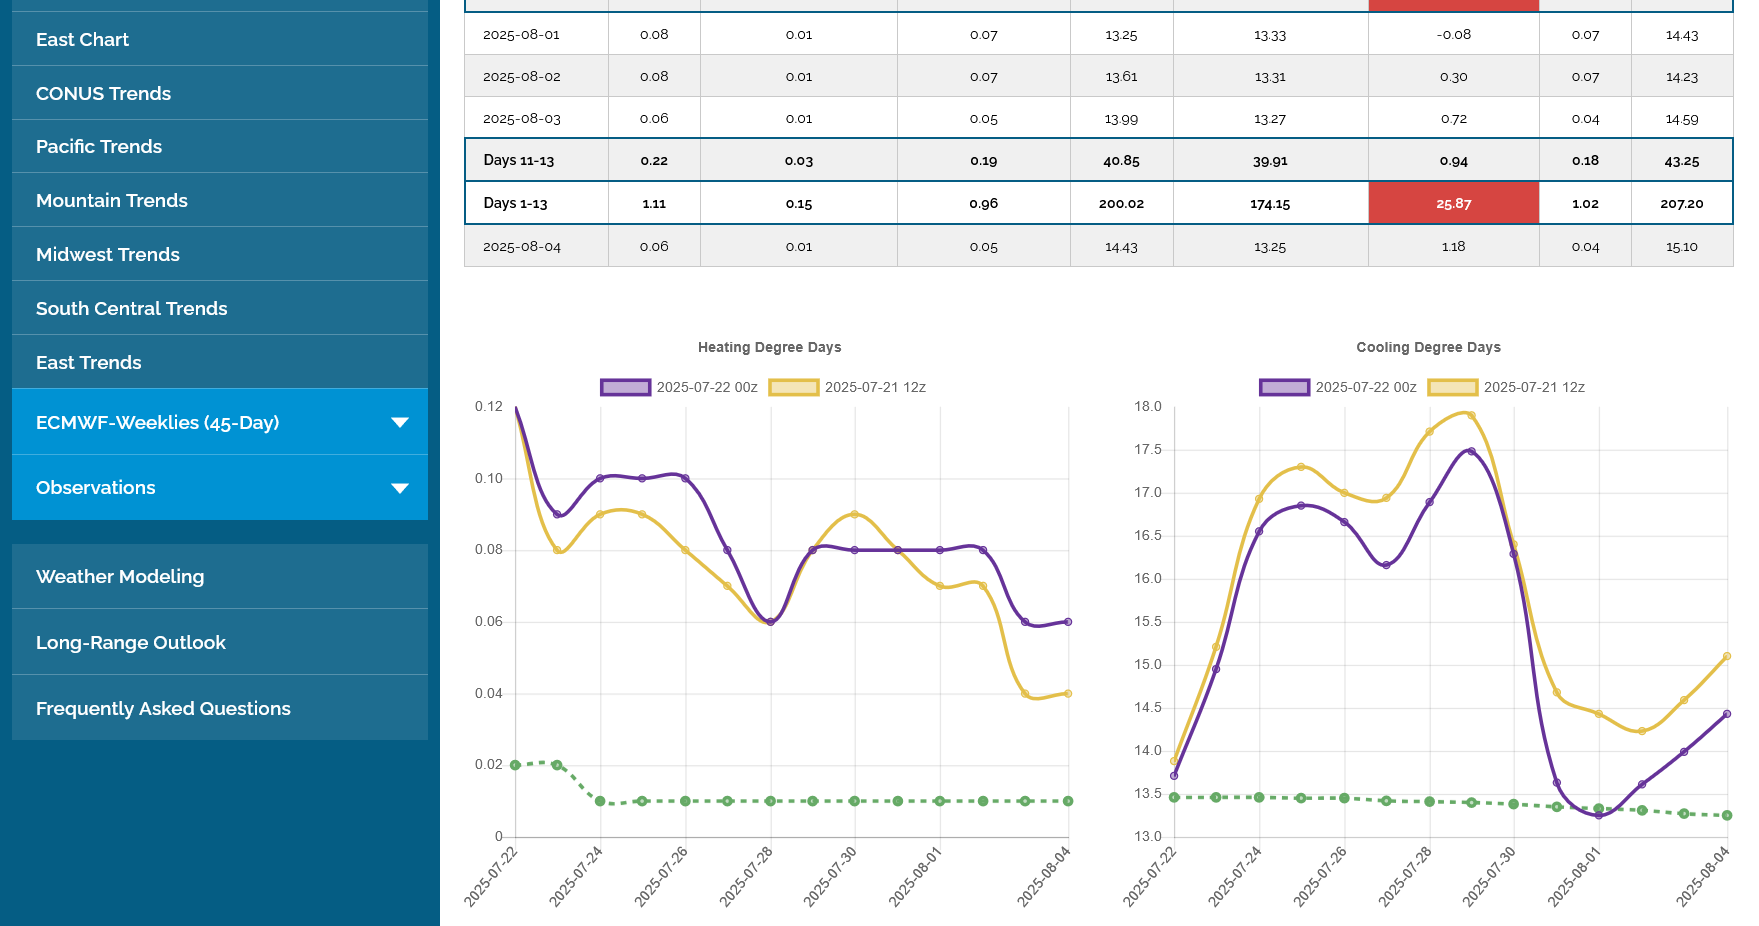
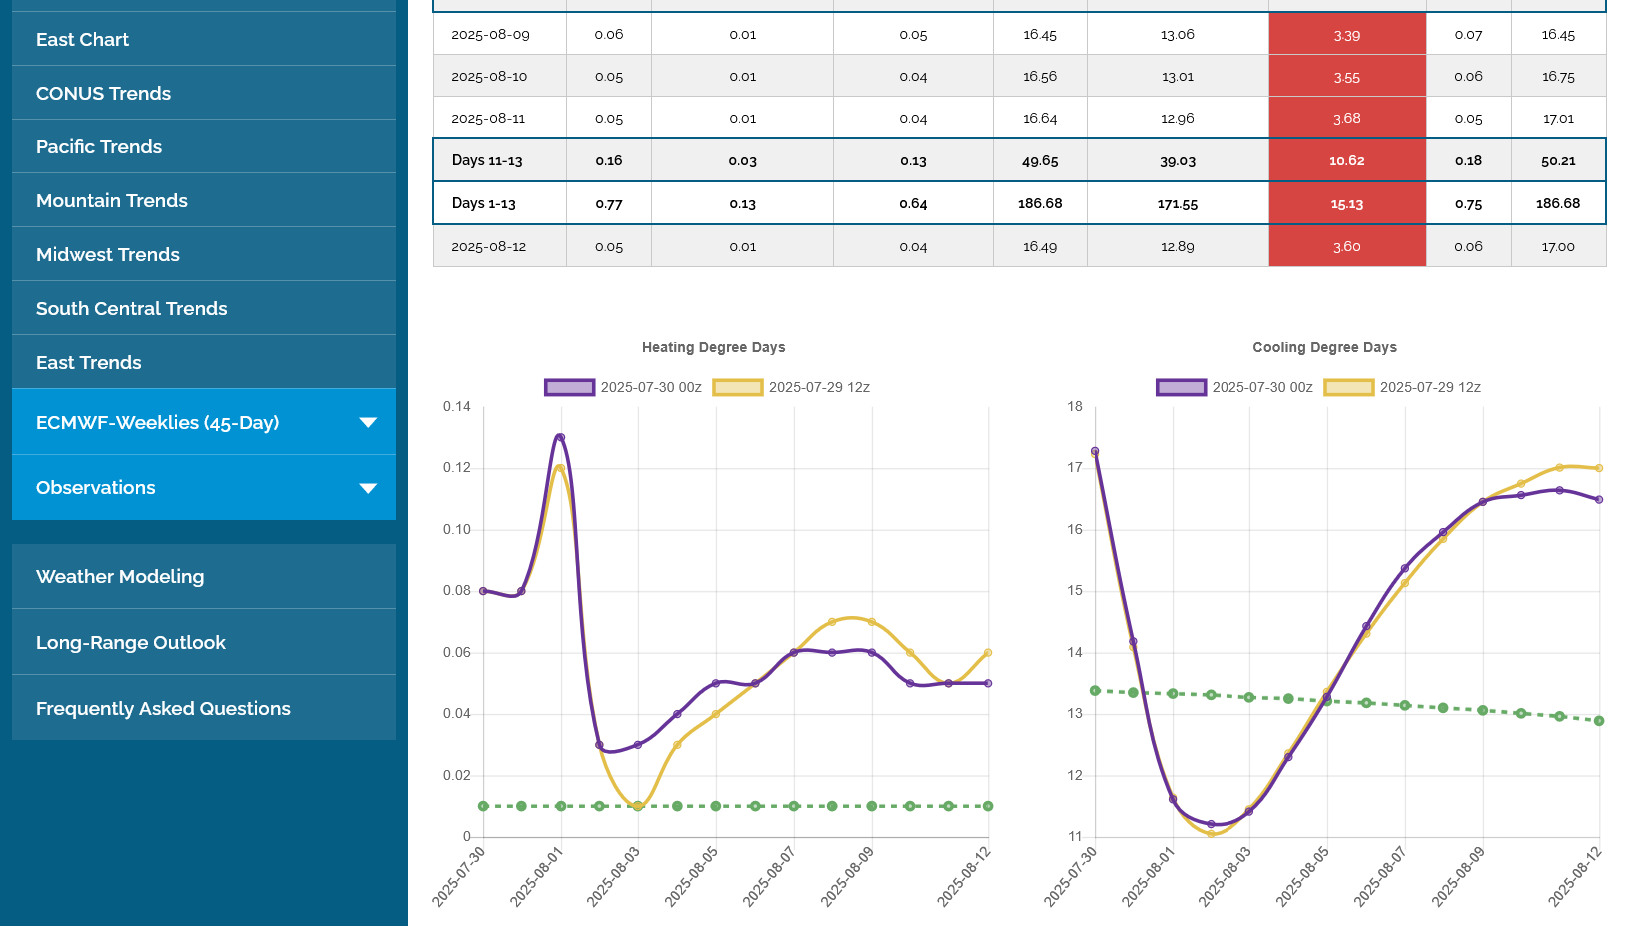
Big COOLER changes in the week 2 part of the forecast where the upper level ridge backs up westward and a modest trough develops in the eastern 1/3rd of the country by day 11. This cools temps in that part of the country to BELOW average for several days with the heat retrograding to the West, spilling out to the N.Plains.
(The automated NWS 8-14 day is out to lunch today and too hot in the areas in blue below.
These are the coolest days Fri-Sun July 11-13th. This is the departure from average highs.
+++++++++++++++++++++
By metmike - June 27, 2025, 8:16 a.m.
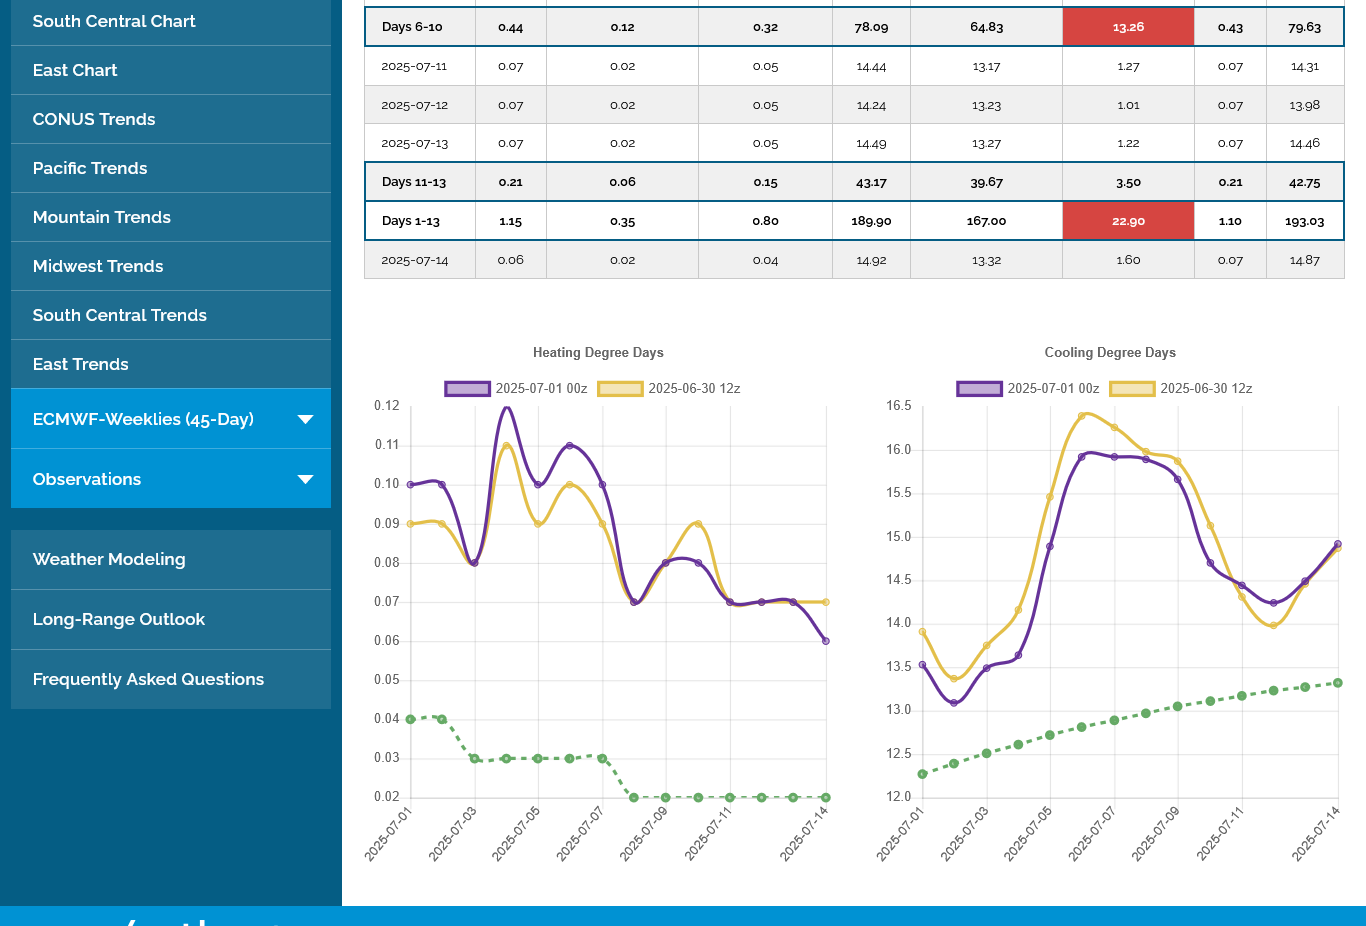
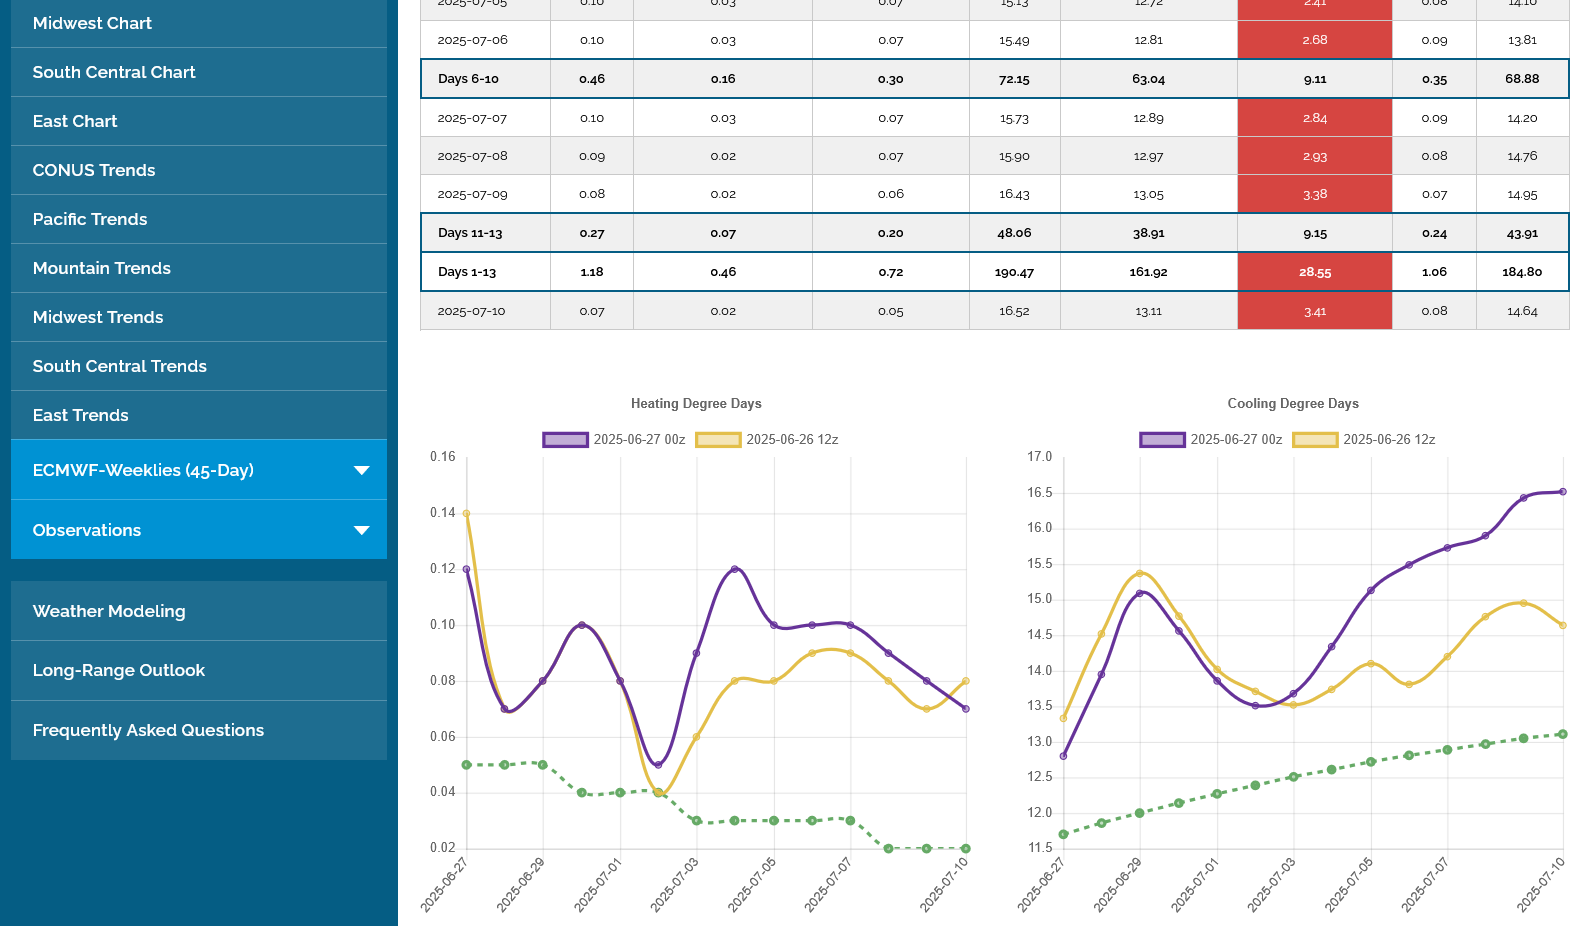
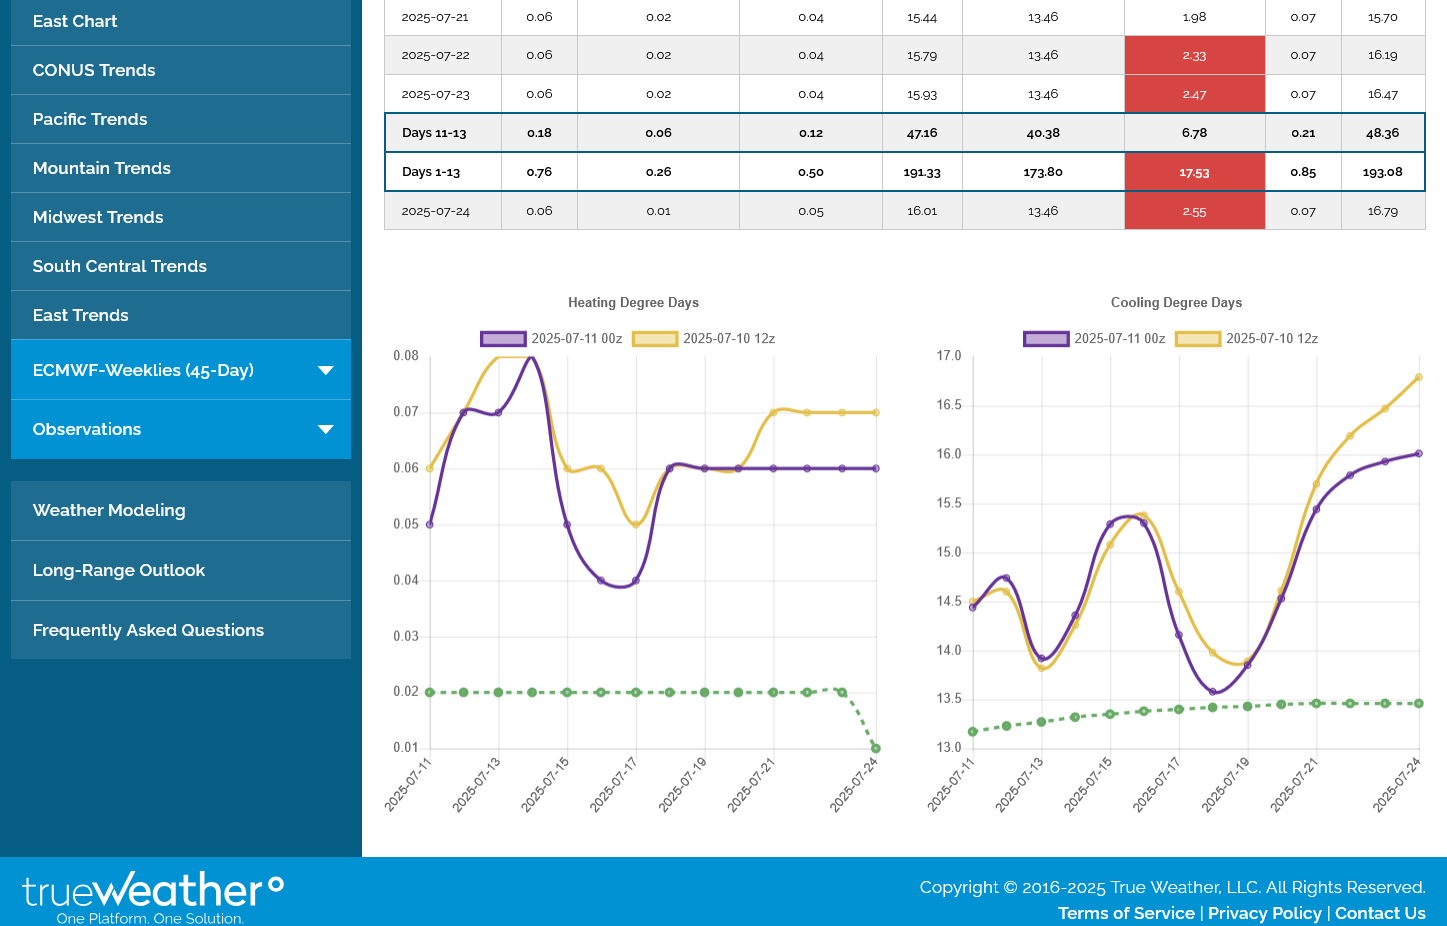
The last 0z European Ensemble model in purple, on the right was a whopping +5.6 CDDs vs the previous 0z run. NG prices have spiked higher overnight.

+++++++++++++
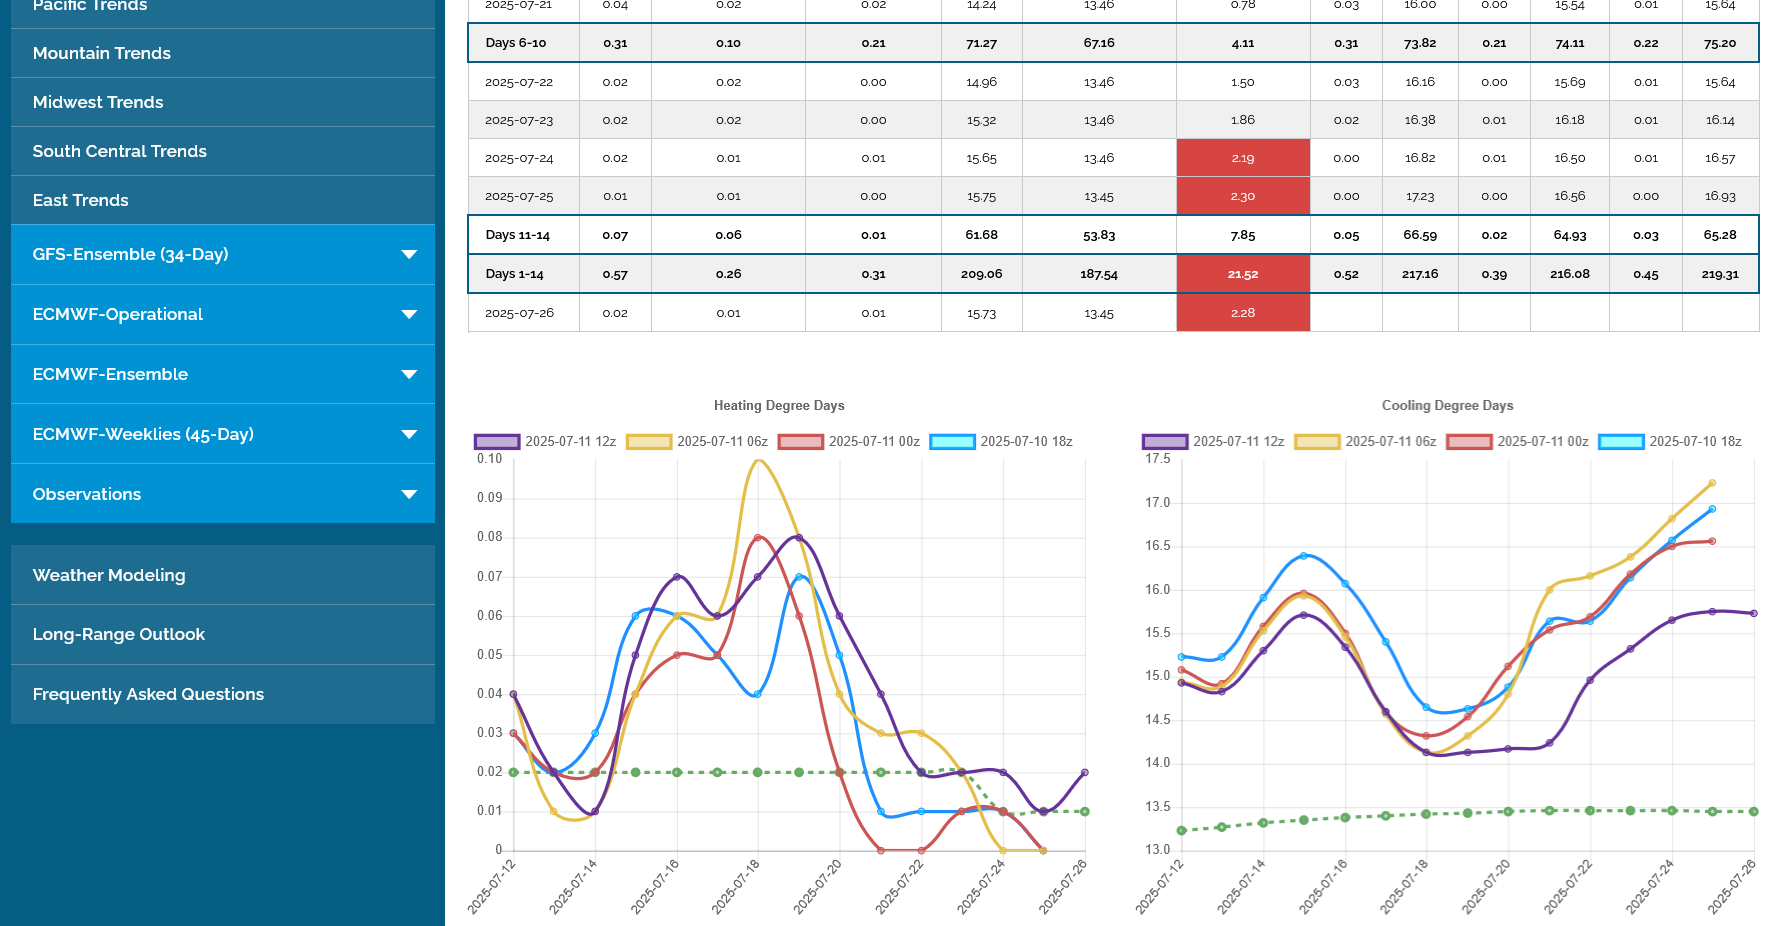
Here was the just updated 12z EE model CDDs. -3 CDDs from the previous 0z run, 12 hours earlier but LOOK AT WEEK 2!!!! This run is 2.5 days later than the one above, there is a shift of 2.5 days to the left below.
1. The heat spike is MUCH EARLIER and more intense. However the the last 5 days are the complete opposite. On Friday, above they were going straight up, last 2 data points around 16.5. On Sunday, below they are crashing down last 2 data points 14.5.
Out to lunch in the East!!!
https://www.cpc.ncep.noaa.gov/products/predictions/814day/index.php
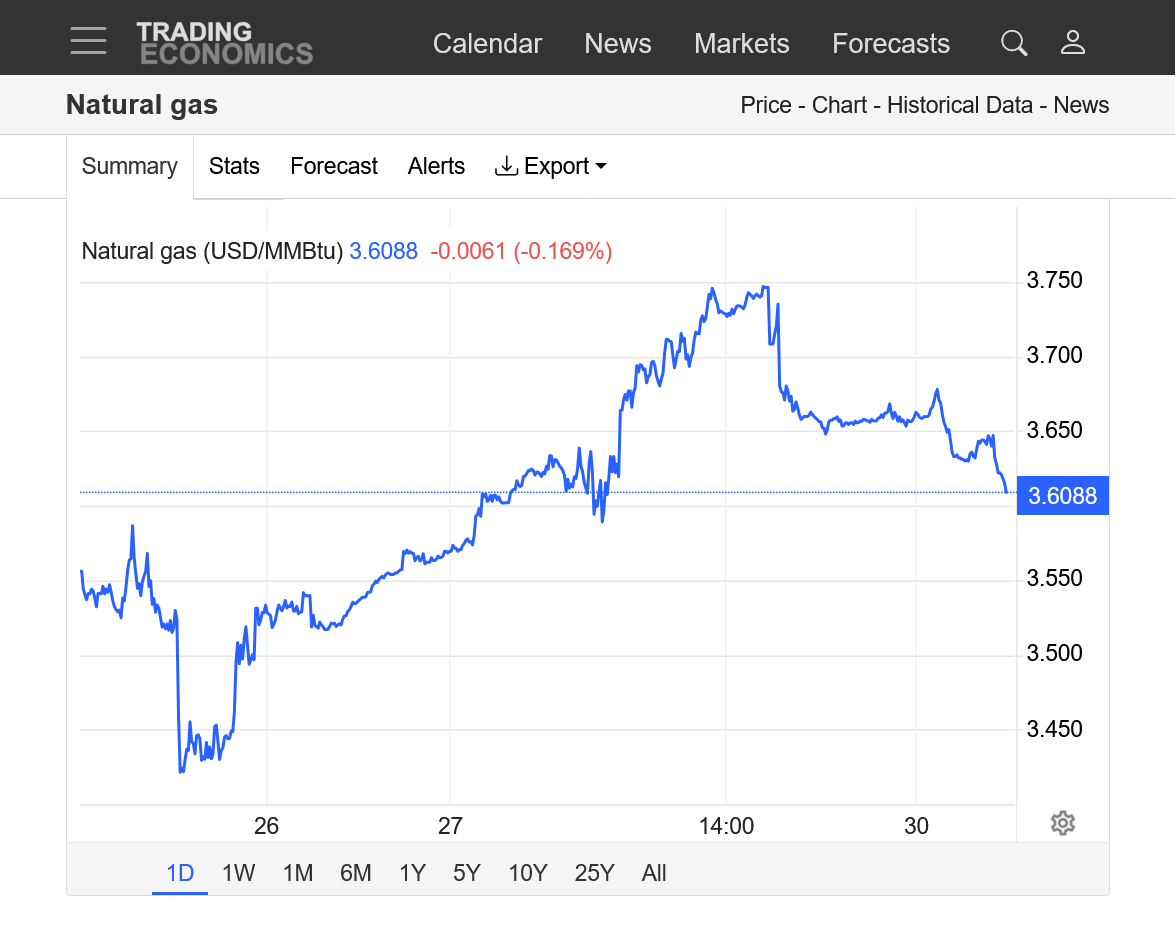
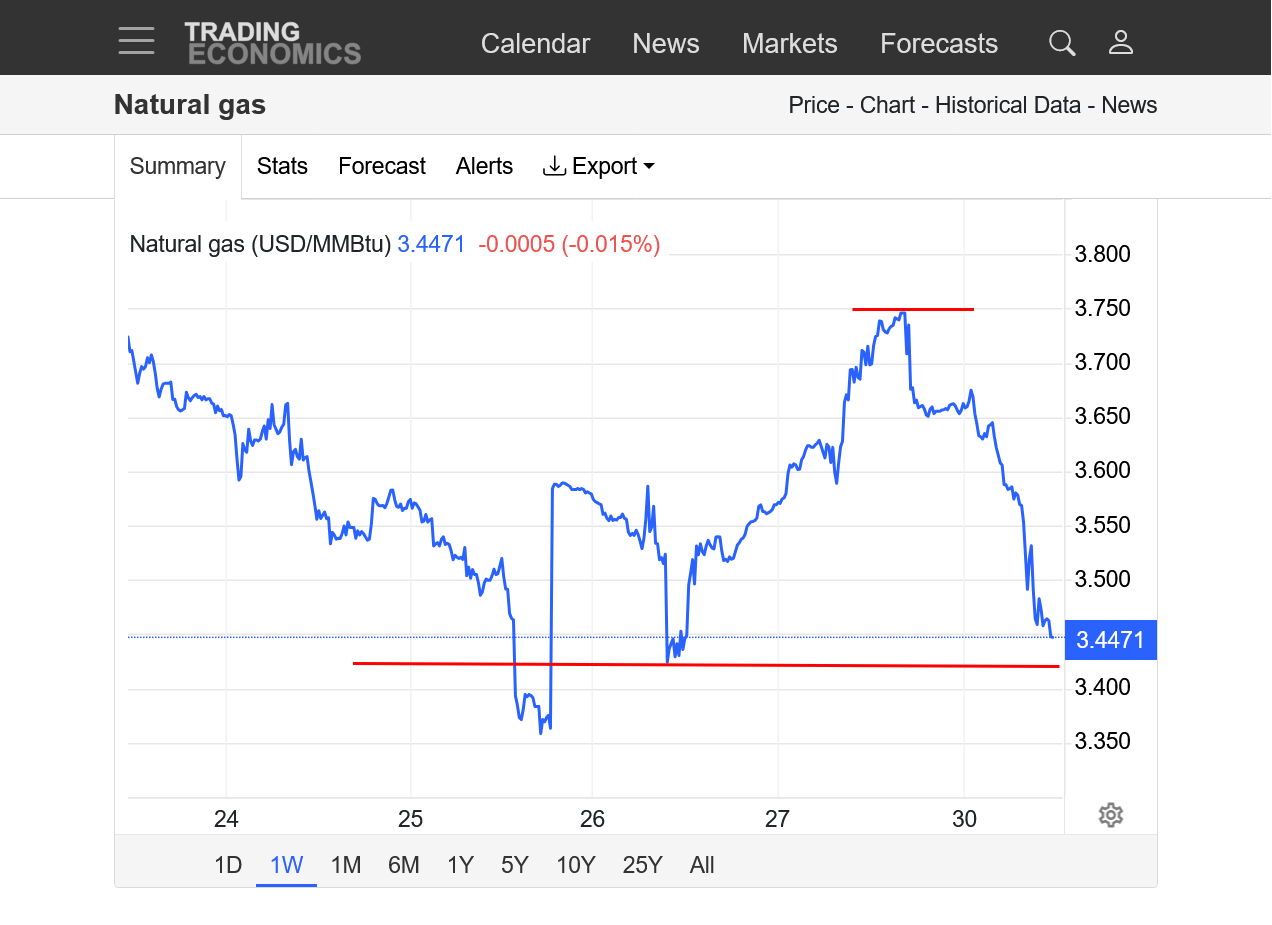
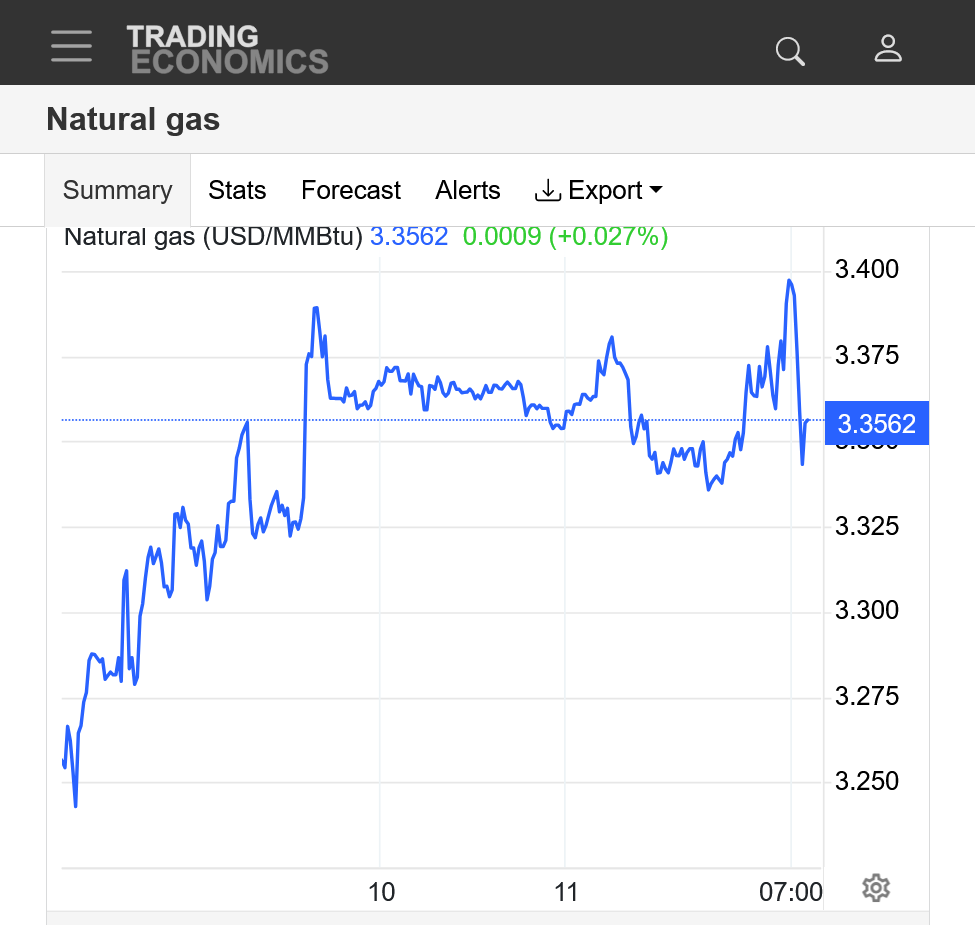
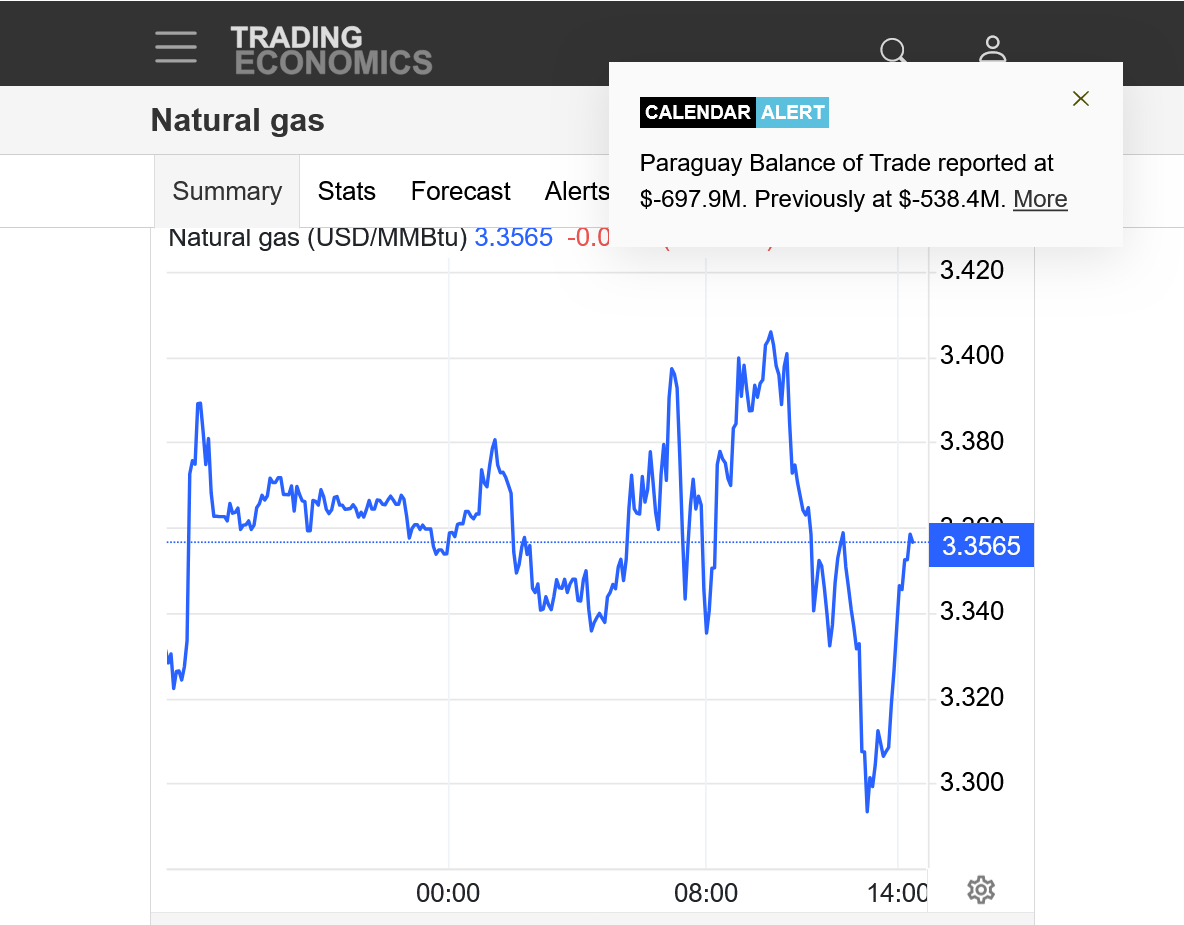
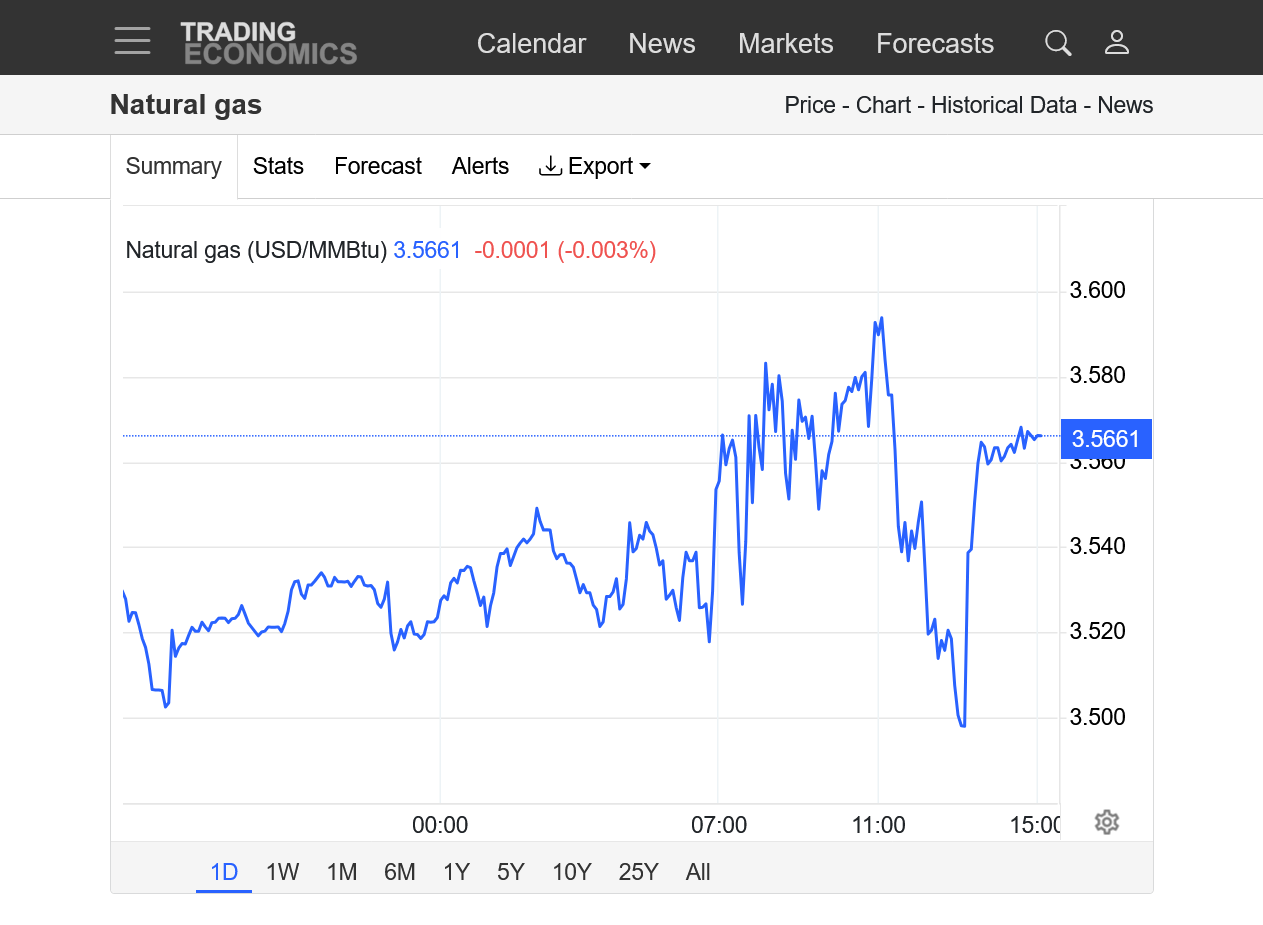
NG opened slightly lower and has been under selling pressure from the open -$580/contract now. This is because of the much cooler change described above. Weekly price below.
https://tradingeconomics.com/commodity/natural-gas
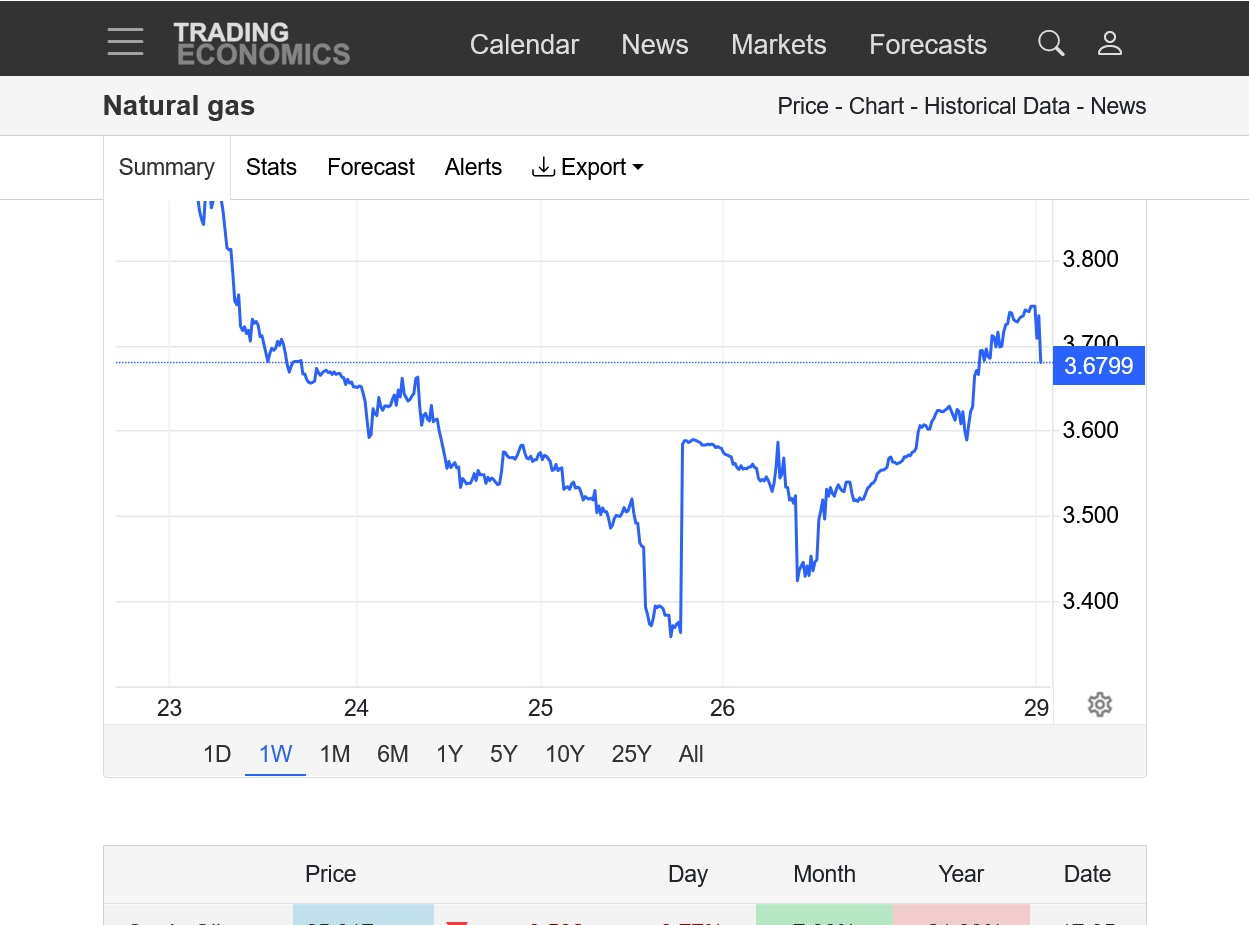
Sunday night chart: 6:28 pm update: Remaining under pressure since the open!
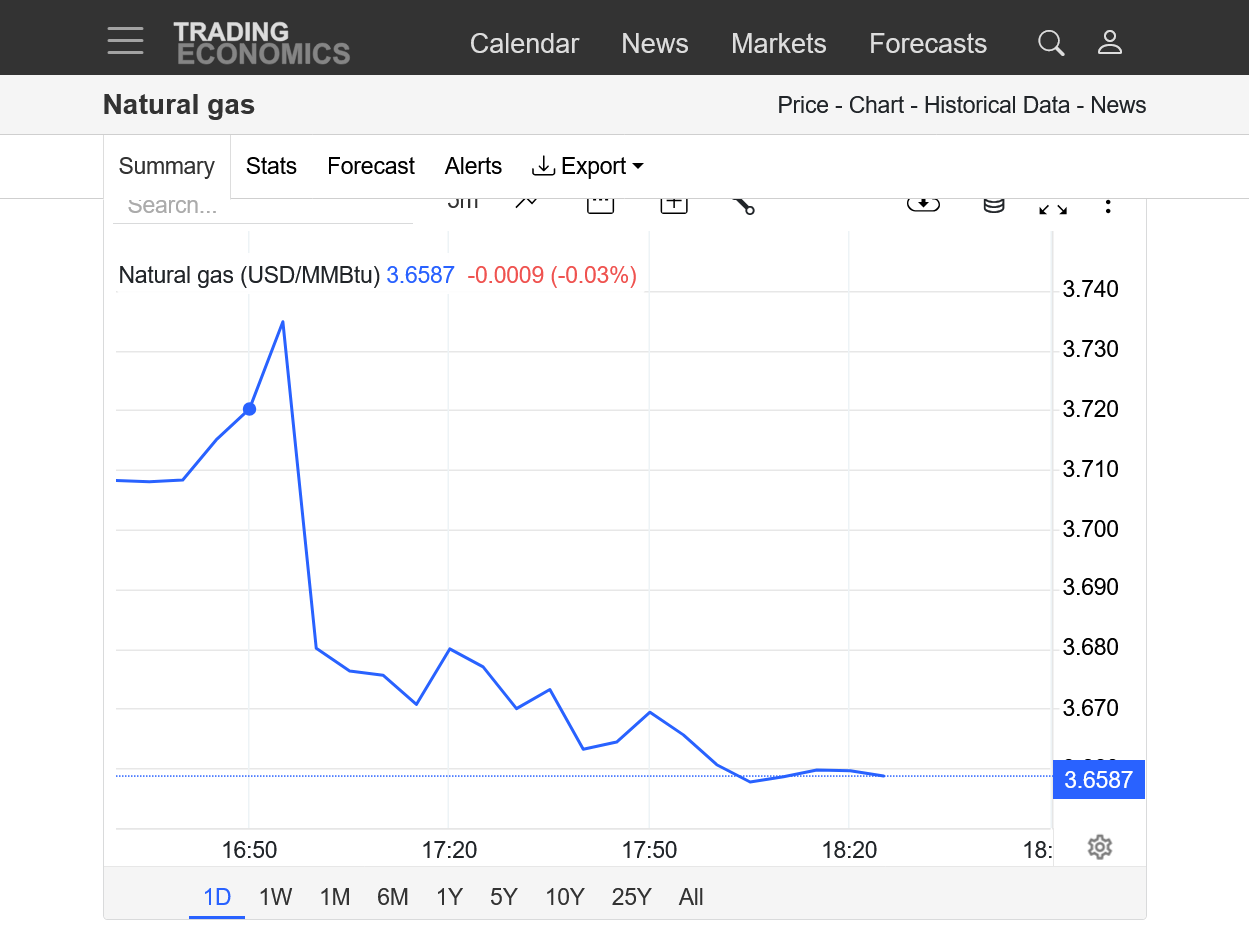
0Z EE was an additional -2 CDDS vs the previous 12z run, so natural has been making new lows for the session overnight. Temps are almost down the green climatological average at the end of the period from the new pattern described above.
https://tradingeconomics.com/commodity/natural-gas
The last 24 hours, including Friday morning after the overnight models got much hotter and prices soared higher on Friday. Giving up much of those gains overnight Sunday.
The EIA report for this Thursday, will NOT be robust like the previous 10+ reports. However, the market dialed in the much lower injection much earlier this months.
https://www.cpc.ncep.noaa.gov/products/tanal/temp_analyses.php
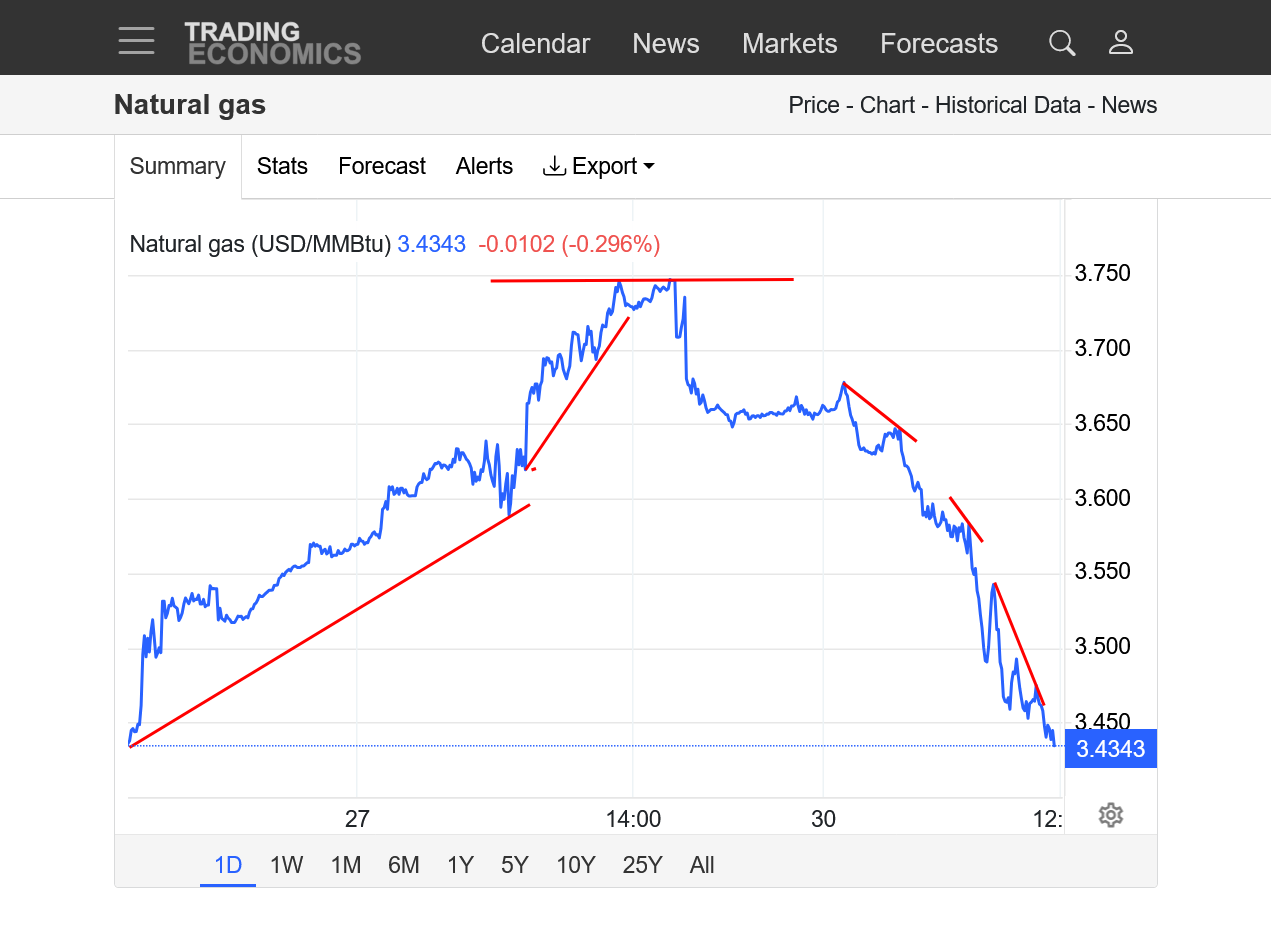
Natural gas prices continue to have one of their weakest days ever because of the weather pattern change in week 2 described above on Sunday.
https://tradingeconomics.com/commodity/natural-gas
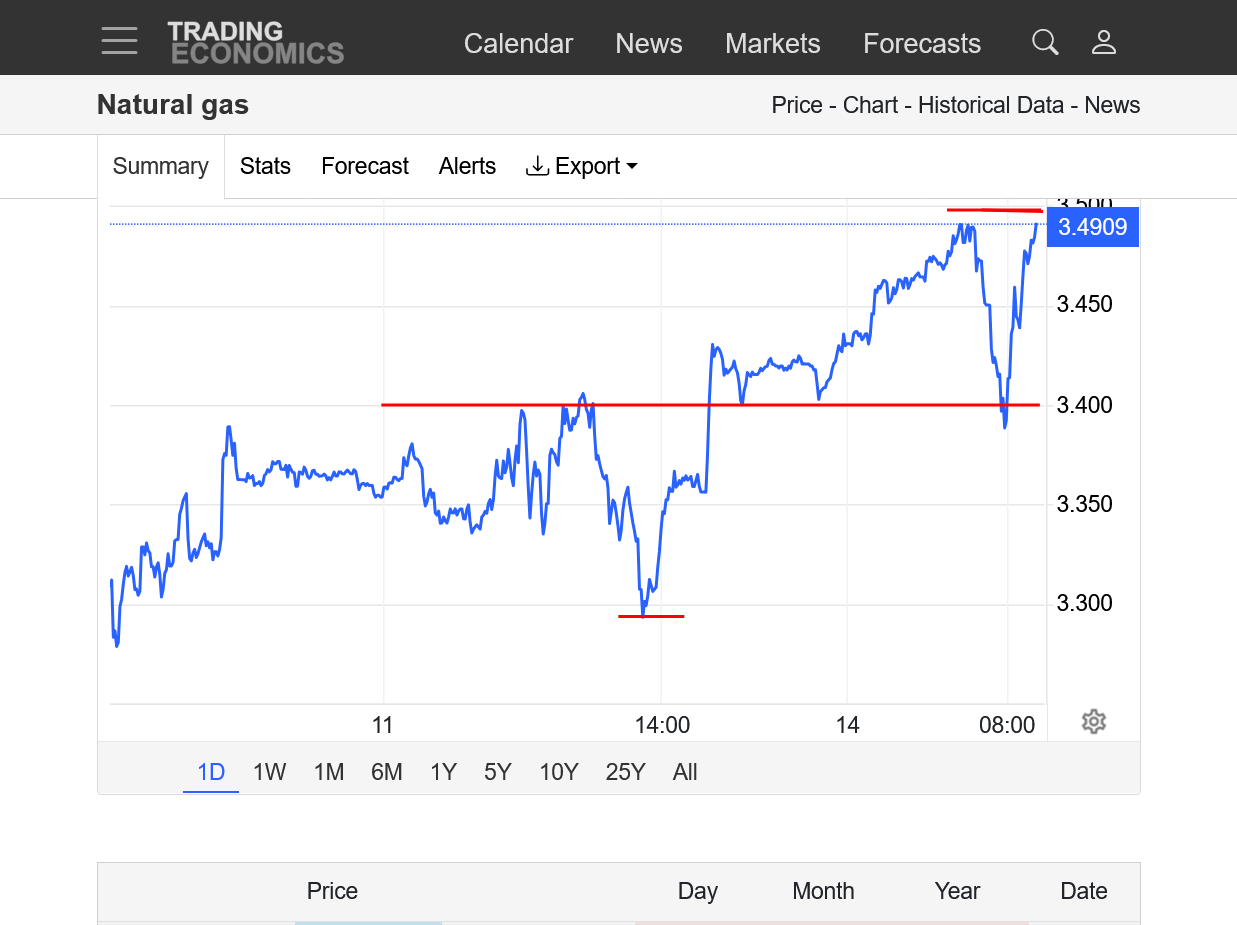
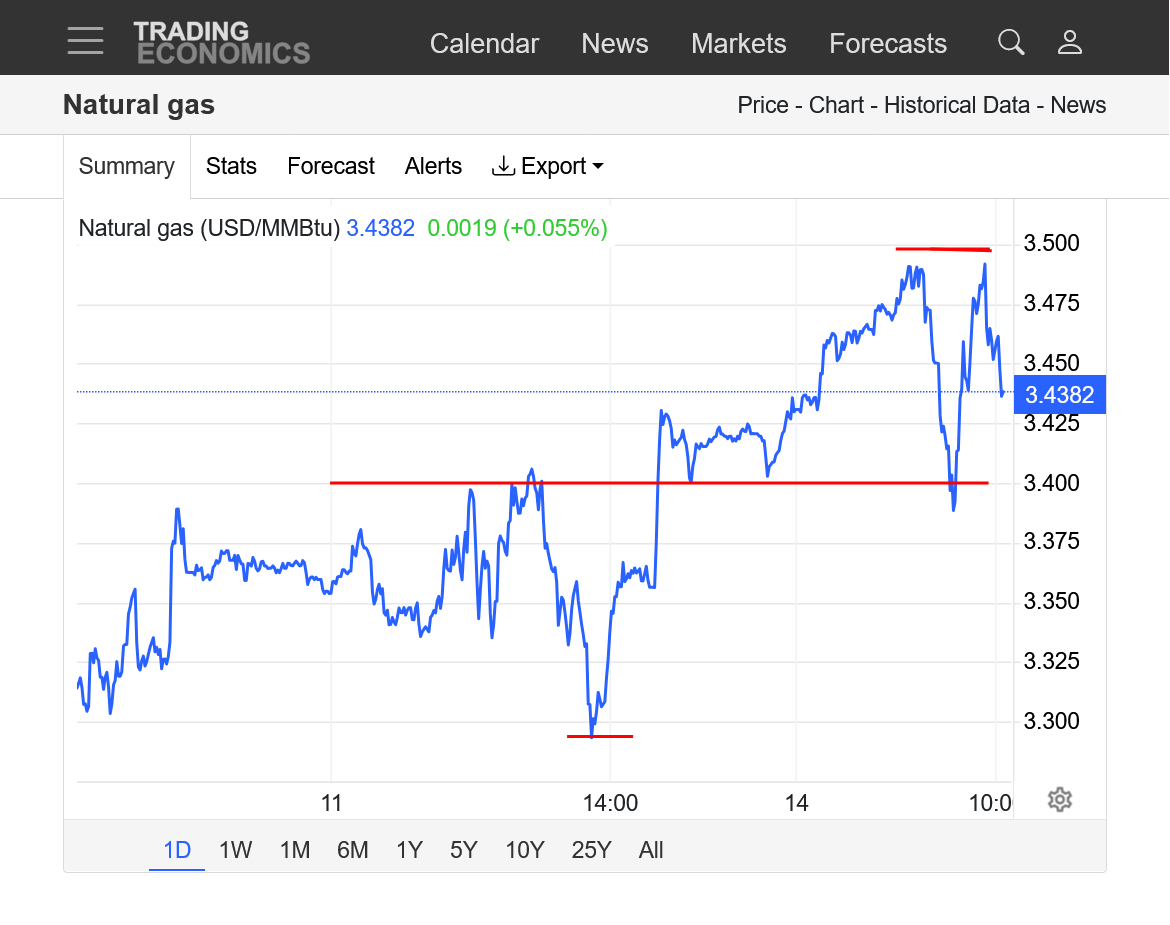
1. 1 day: Friday featured massive, buying from much hotter overnight weather models that accelerated after the even hotter midday model. That hit a top, where we opened close to Sunday evening. Since then we've been under tremendous waves of intensifying, aggressive selling pressure since the open Sunday evening(Just below the top red line which was Fridays high)
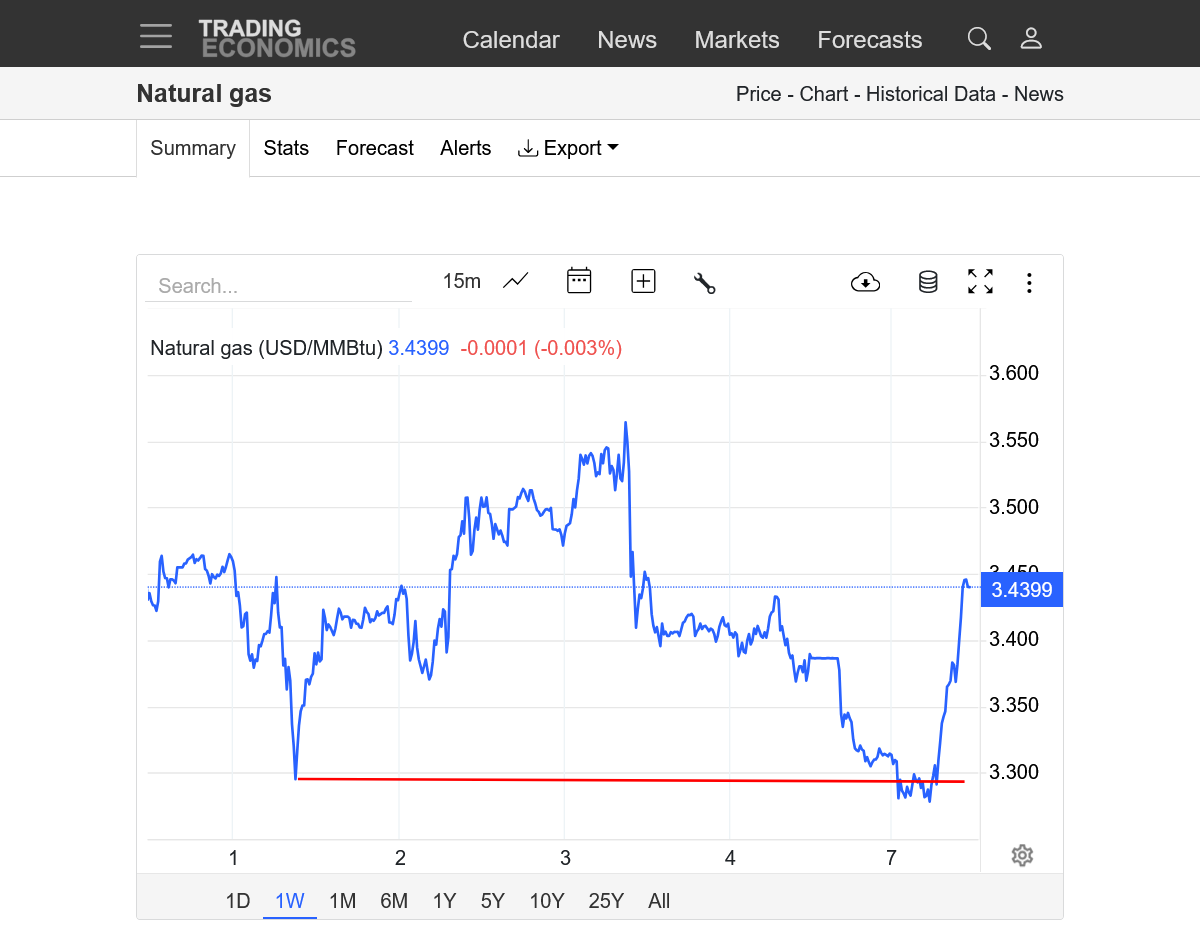
2. 1 week: Last weeks low for the new August contract is the bottom red line(put in just after the BEARISH EIA report on Thursday). Highs on Friday are the top red line. We opened close to the top last evening and now are already approaching last weeks lows. The lower prices the day before were from the previous JULY CONTRACT that was trading $2,000/contract LOWER than the current August contract. The straight up spike higher($2,000) was the rollover from the July to the August price for graphing purposes.
The NWS was much closer with their 8-14 day outlook today compared to yesterday being much too hot.
https://www.marketforum.com/forum/topic/83844/#83852
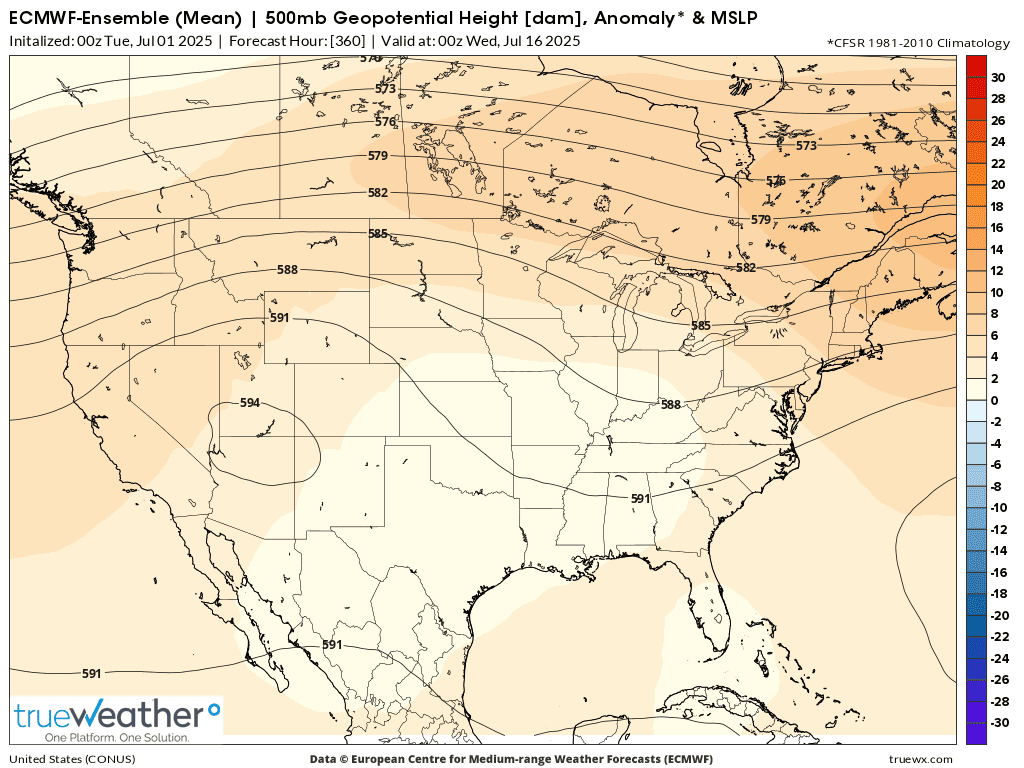
1. The heat ridge/dome backs up much farther west compared to last week. This was the last 500 mb map on July 15th from the last 0z EE. .........northwest flow in the Midwest which should feature active perturbations tracking around the periphery of the heat ridge in the Northern Rockies, then drop southeast and amplify in the positive tilted Great Lakes/Eastern Midwest to Western Gulf States trough.
2. The last 0z EE in purple on the right was another -3 CDDs vs the previous 12z. Spike higher in heat later this week, then MUCH cooler in week 2 but still above average overall for the country.
3. Also, not nearly as hot as last week Friday's forecast which caused nat gas to soar higher!
+++++++++++
The last 0z EE in purple on the right was another whopping -6 CDDs bearish. NG had a spike low on Tuesday of 3.3, down $4,500 for the week, with a decent $1,500 recovery which continued early last night until this solution came out and quickly took away half of those gains.
The EIA tomorrow could be pretty bullish and this huge, MUCH LESS HOT forecast has been traded all week so its hard to say how much lower we will go on even LESS HEAT right now but I would NOT be buying here on weather.
As we can see below, the LESS HOT part of the forecast is during the heat wave, not at the end.
We've now bounced back to unch from the spike down from this bearish EE, instead of continuing lower so, at least for the moment the market has exhausted the OVERNIGHT selling momentum/follow thru from FRESH bearish weather news several hours ago.
The large specs could decide to renew the selling shortly when we start the day session or they too could be sold out ahead of the EIA number on Thursday. We should also keep in mind that the much less hot changes below are only to INDIVIDUAL DAYS and not to a sudden, long lasting pattern change like we saw earlier in the week. The CDDs start to go up again at the end of week 2 and the market is now looking at week 3 for guidance on July temps impacting NG pricing.
This just out 6z GEFS was a whopping +7 CDDs(purple right) and ng is spiking a bit higher.
The last 12z EE reversed its previous much cooler solution and was +4 CDDs vs that prior 0z model run. The market, after spiking up and down overnight from individual solution had ZERO reaction, in fact it dropped a tad. Likely because we were already up almost $1,000/contract from the MUCH hotter 6z GEFS and this just shows the same thing.
EIA report at 9:30 am.
https://ir.eia.gov/ngs/ngs.html
![]()
for week ending June 27, 2025 | Released: July 3, 2025 at 10:30 a.m. | Next Release: July 10, 2025
| Working gas in underground storage, Lower 48 states Summary text CSV JSN | |||||||||||||||||||||||||
|---|---|---|---|---|---|---|---|---|---|---|---|---|---|---|---|---|---|---|---|---|---|---|---|---|---|
| Historical Comparisons | |||||||||||||||||||||||||
| Stocks billion cubic feet (Bcf) | Year ago (06/27/24) | 5-year average (2020-24) | |||||||||||||||||||||||
| Region | 06/27/25 | 06/20/25 | net change | implied flow | Bcf | % change | Bcf | % change | |||||||||||||||||
| East | 602 | 589 | 13 | 13 | 658 | -8.5 | 584 | 3.1 | |||||||||||||||||
| Midwest | 688 | 665 | 23 | 23 | 776 | -11.3 | 678 | 1.5 | |||||||||||||||||
| Mountain | 228 | 223 | 5 | 5 | 239 | -4.6 | 178 | 28.1 | |||||||||||||||||
| Pacific | 287 | 281 | 6 | 6 | 282 | 1.8 | 256 | 12.1 | |||||||||||||||||
| South Central | 1,148 | 1,140 | 8 | 8 | 1,175 | -2.3 | 1,085 | 5.8 | |||||||||||||||||
| Salt | 342 | 352 | -10 | -10 | 327 | 4.6 | 311 | 10.0 | |||||||||||||||||
| Nonsalt | 806 | 788 | 18 | 18 | 848 | -5.0 | 774 | 4.1 | |||||||||||||||||
| Total | 2,953 | 2,898 | 55 | 55 | 3,129 | -5.6 | 2,780 | 6.2 | |||||||||||||||||
| Totals may not equal sum of components because of independent rounding. | |||||||||||||||||||||||||
Working gas in storage was 2,953 Bcf as of Friday, June 27, 2025, according to EIA estimates. This represents a net increase of 55 Bcf from the previous week. Stocks were 176 Bcf less than last year at this time and 173 Bcf above the five-year average of 2,780 Bcf. At 2,953 Bcf, total working gas is within the five-year historical range.
For information on sampling error in this report, see Estimated Measures of Sampling Variability table below.

The last 12z EE in purple was a whopping -6+ CDDs vs the previous 0z run.
This contributed to additional weakness in the price after the BEARISH reaction to the EIA report. We should note the trend for the last several days.
Not only is the trend up, we are hitting the highest numbers at the very end, suggesting major heat in week 3 which traders consider to be important right now.
August Nymex natural gas futures sank lower Thursday after a heavier-than-expected storage build pointed to solar and coal generation stealing market share from gas during last week’s record-breaking heat.

2+ days until the markets open again on Sunday Night and this can change a great deal before then.
This was the just updated NWS weeks 3-4 outlook. I agree with the widespread heat/temperatures but would add even more heat in the N.Plains/Upper Midwest. That would be bullish weather for the 2nd half of July because residential use of air conditioning will be ELEVATED, so the demand for electricity generated by burning natural gas will be much greater than average.
https://www.cpc.ncep.noaa.gov/products/predictions/WK34/
Before then:
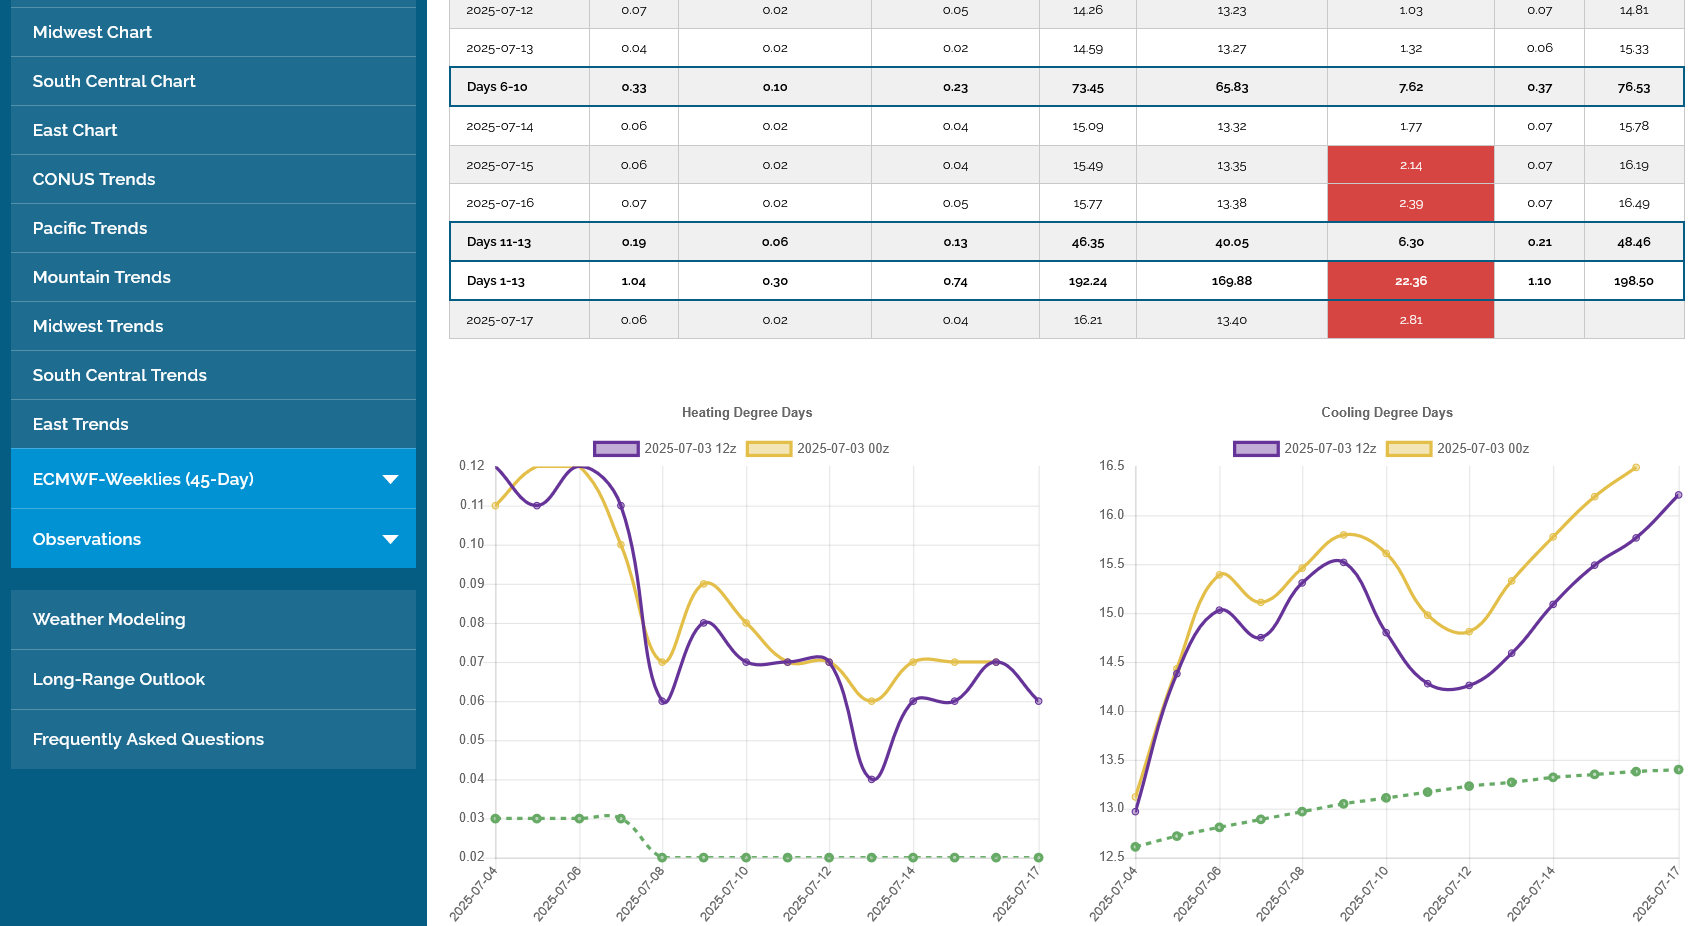
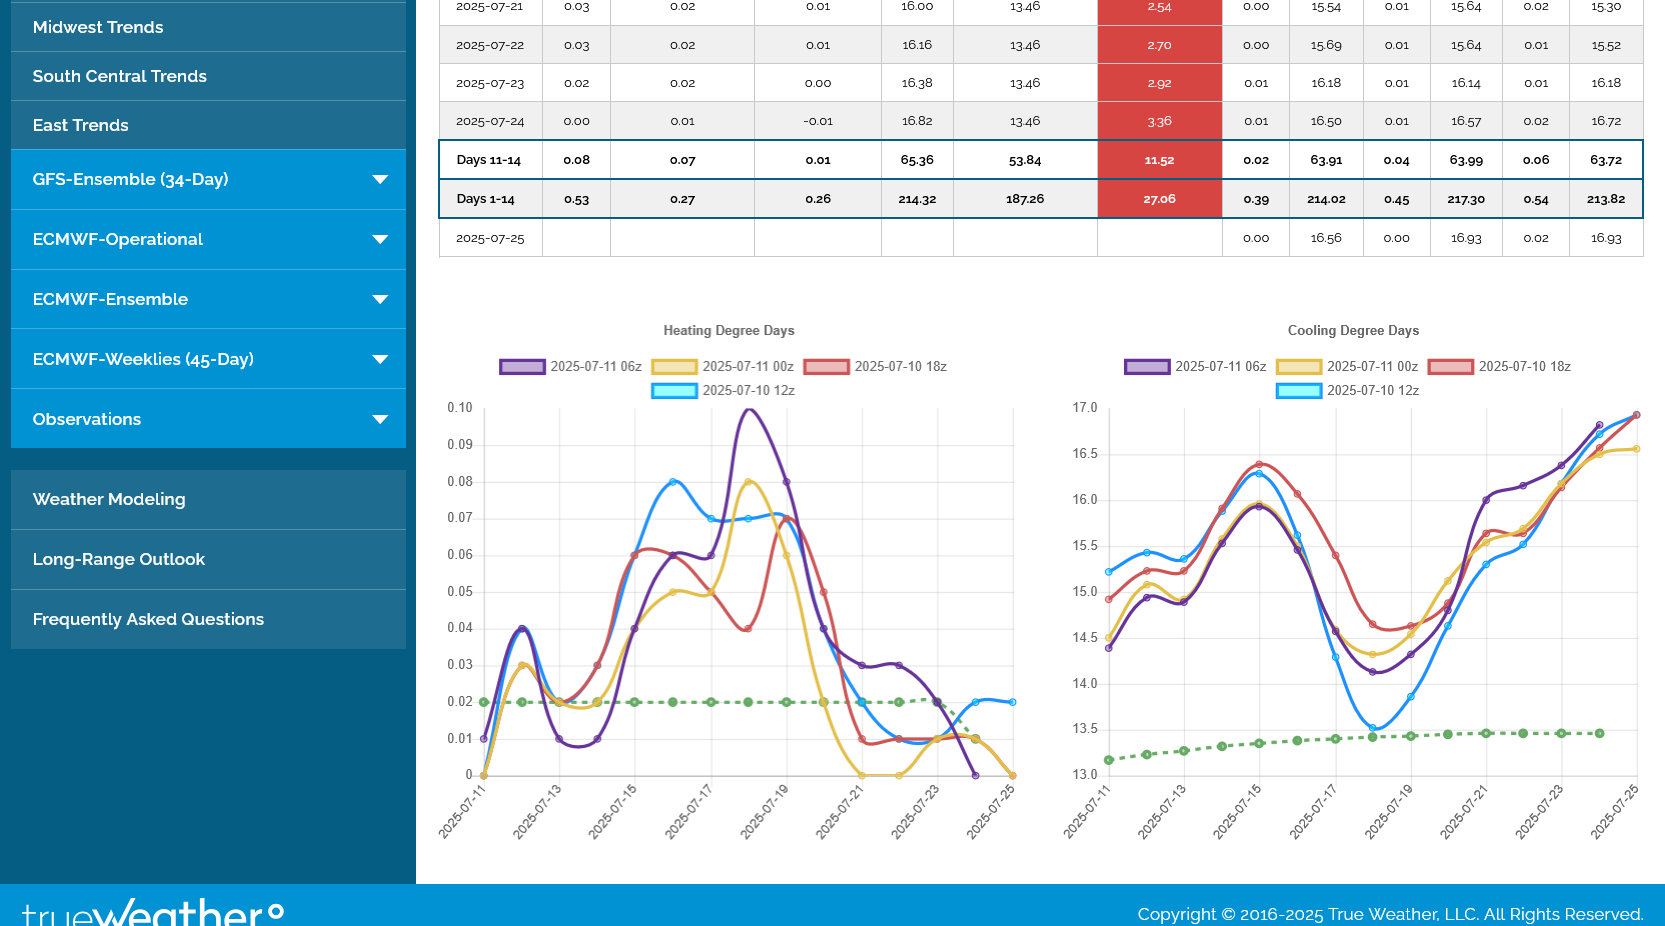
The last 12z EE is in purple. The models all show major heat returning in week 2.
Very elevated during the 2nd half of week 2 which equates to well above average temperatures, during the hottest time of year.
The seasonal/climatological peak in temperatures is seen approaching with the dashed green line leveling off in mid July.
1. The last European Ensemble model was -4.4 CDDs LESS HOT! And instead of heat rapidly increasing at the end of the period, the heat is waning a bit as the dome/heat ridge retrogrades to a position much farther west.
2. Compare that to the Friday EE and the CDDs going straight up in week 2 with the heat ridge farther east and impacting more high population centers in the eastern half of the country.
3. Upper level map in 2 weeks, on july 20th. Upper level ridge centered in the S.Rockies. Very weak troughing in the Great Lakes/Northeast.

NG was under pressure all night, after the gap lower Sunday Night which was actually surprising to me considering how much heat we still have in the July forecast(I was almost long over the weekend which would have lost a bunch of money).
The forecast DID turn LESS hot on Sunday but its still pretty hot.
At around 6am, the market took off like a rocket (probably the large specs entering) and we are up almost $2,000 from the lows and put in a gap and crap chart formation which is a selling exhaustion signature and very bullish.
https://www.tradingsim.com/day-trading/exhaustion-gap
This puts in an extremely bearish, gap and crap technical formation............in a condensed, extremely volatile short term time frame that is different that most gap and craps that occur from a buying exhaustion at the top of a long uptrend.(which marks the end of the bullish mentality).
++++++++++++++++
GapandCrap buying(selling) exhaustion formation
1 response |
Started by metmike - Aug. 30, 2019, 6:12 p.m.
https://www.marketforum.com/forum/topic/38044/
+++++++++++++++++
Island Reversal – Reversal Candlestick Pattern
https://www.tradingsim.com/blog/island-reversal
++++++++++++++++++++++++++
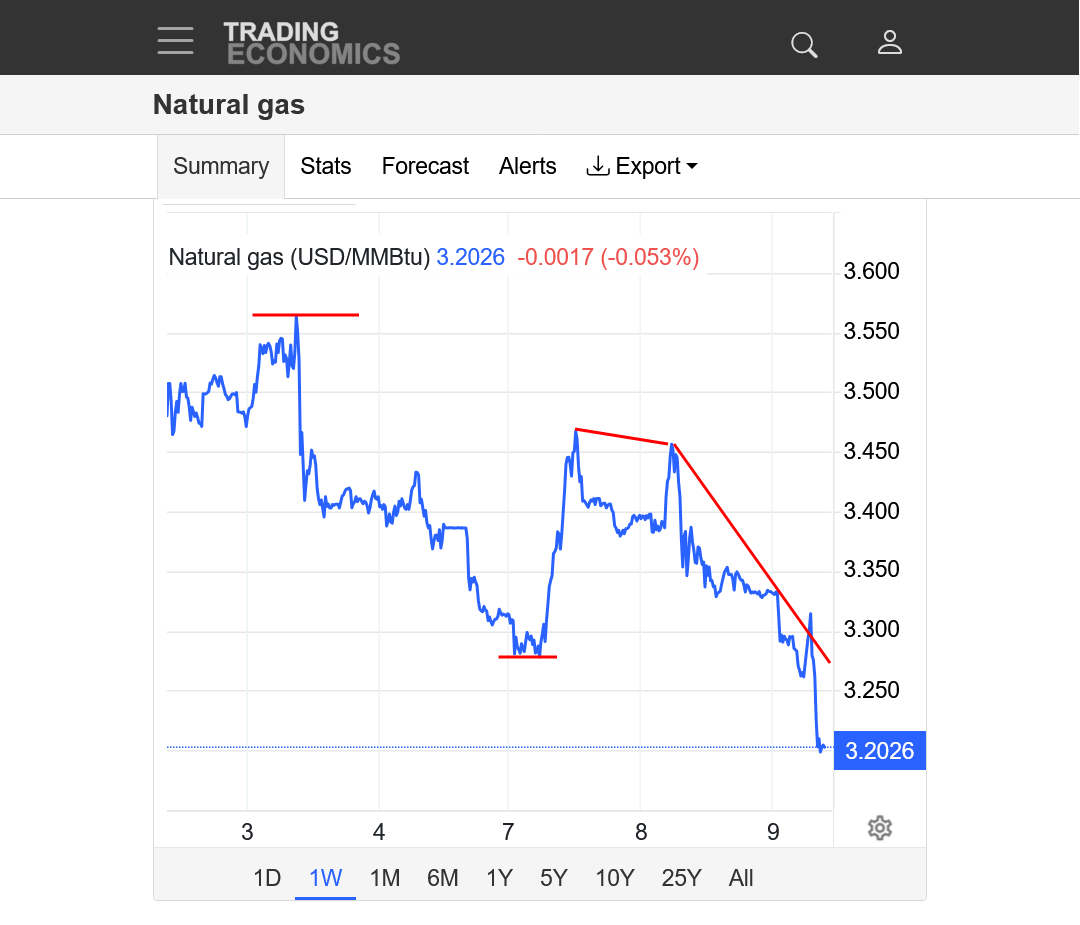
7-7-25 charts:
1. 1 day: Gap and crap. This chart does not show the gap lower open last night properly but we are now clearly ABOVE the close on Friday.
2. 1 week: Double bottom
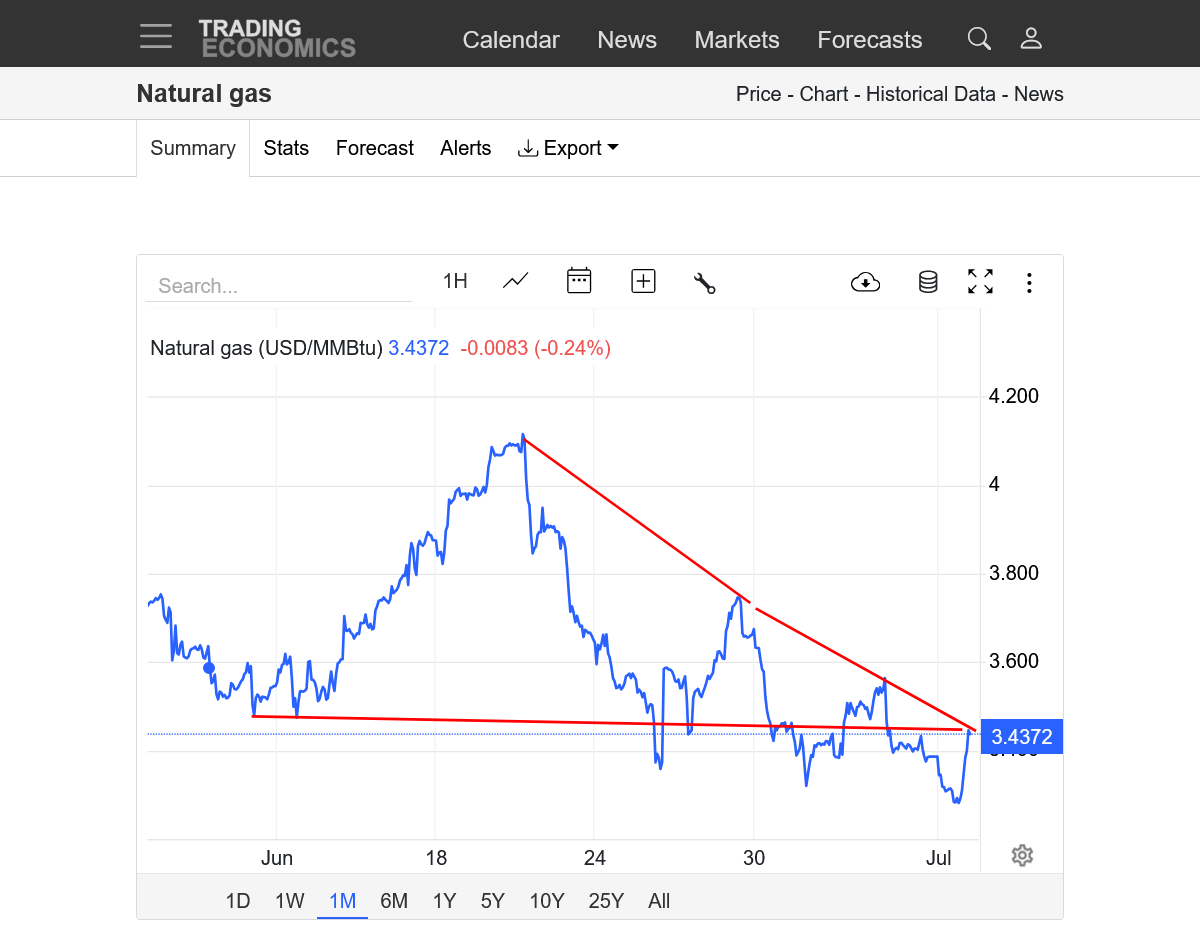
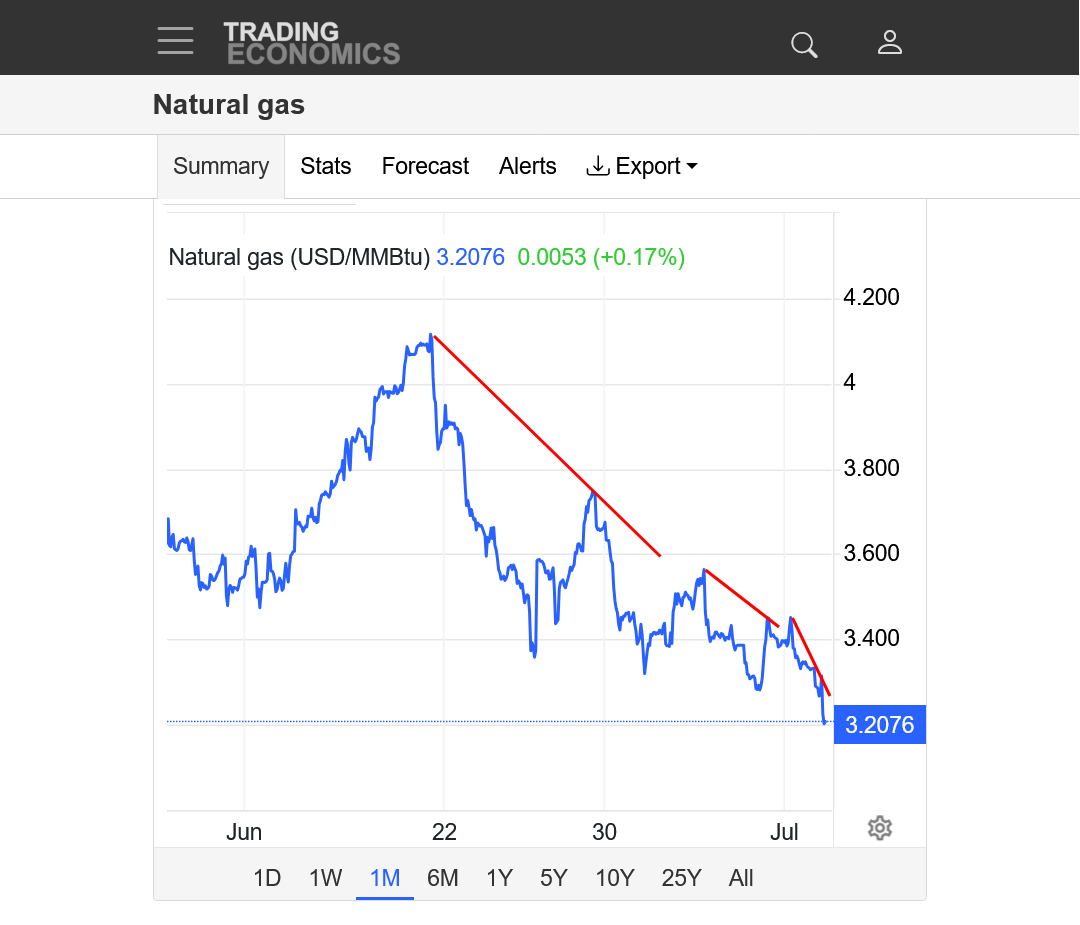
3. 1 month: Decisive top in June with 3 selling waves lower(bear flags). This last one has triggered a selling exhaustion signal with the reversal up after a gap lower that was filled.
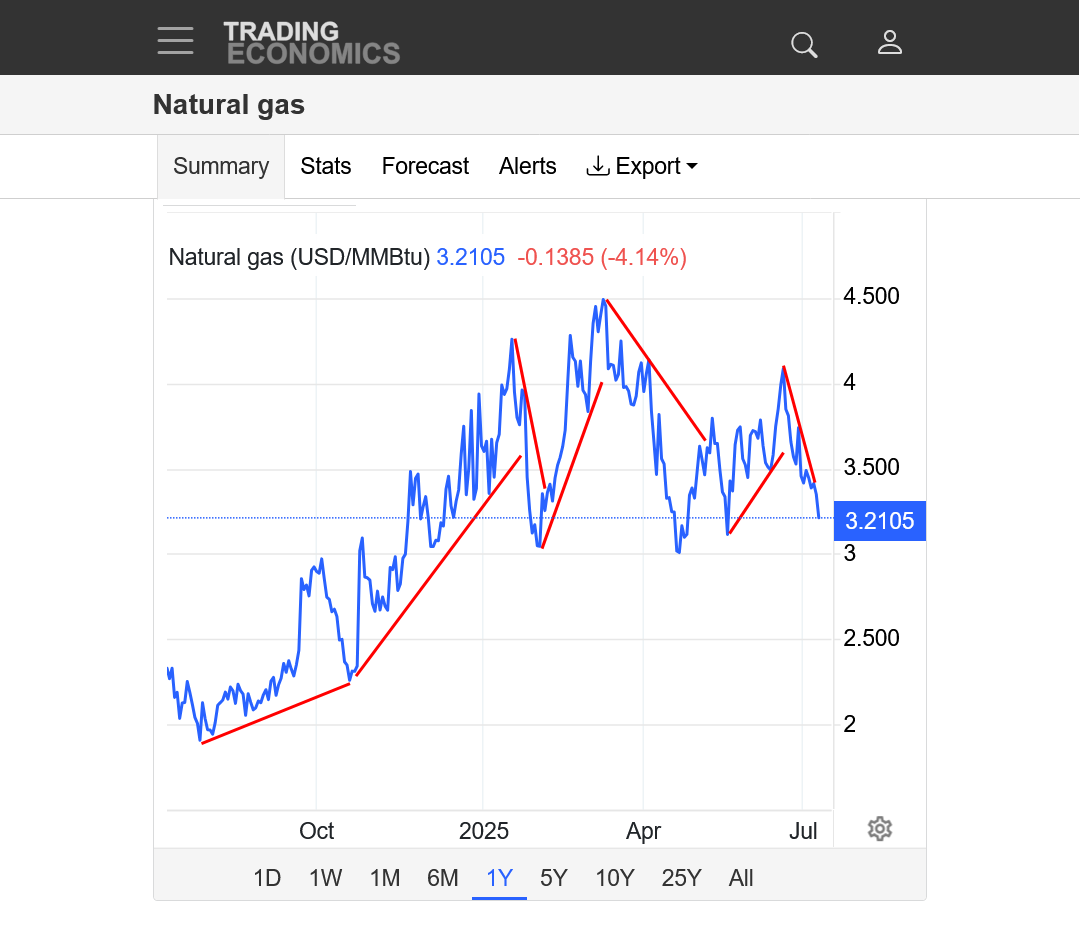
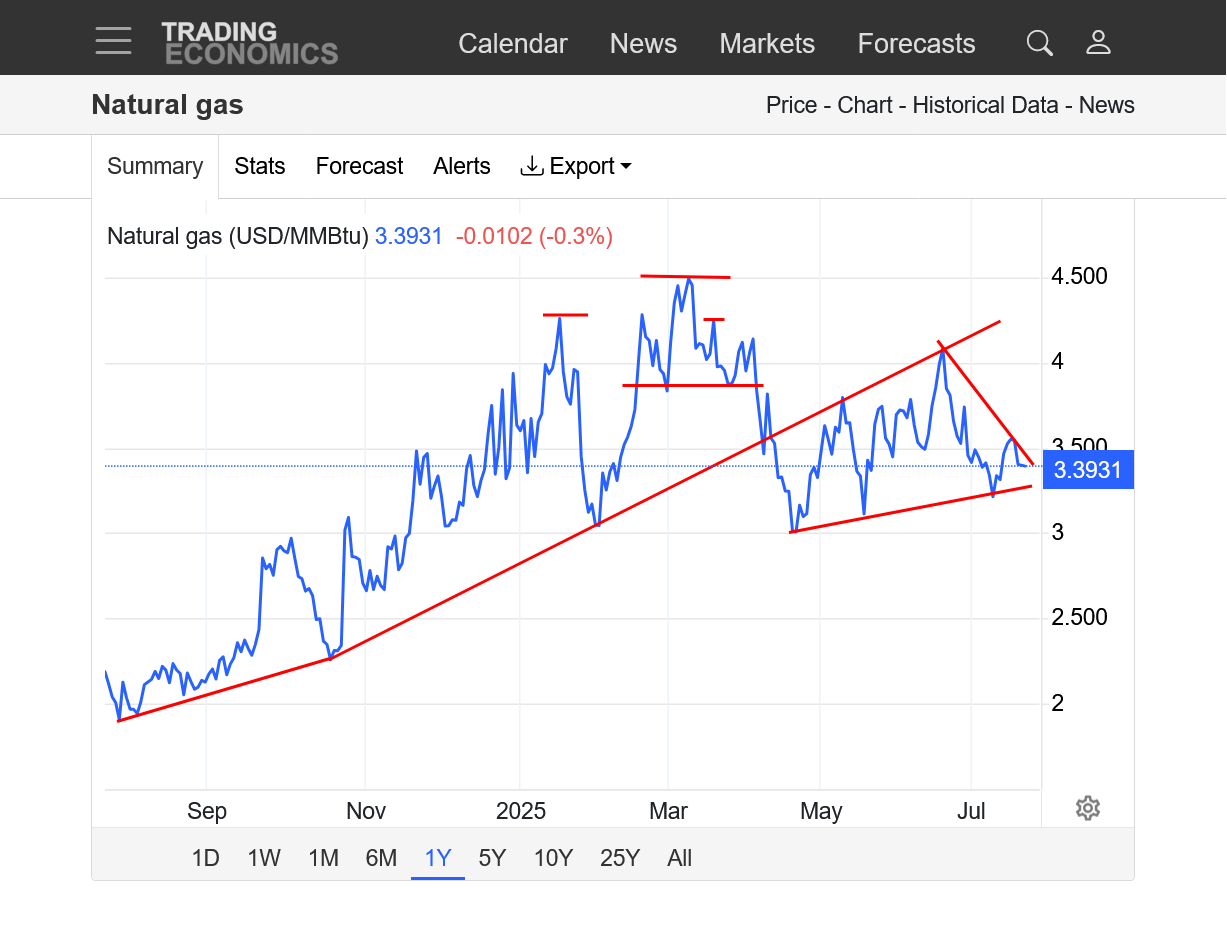
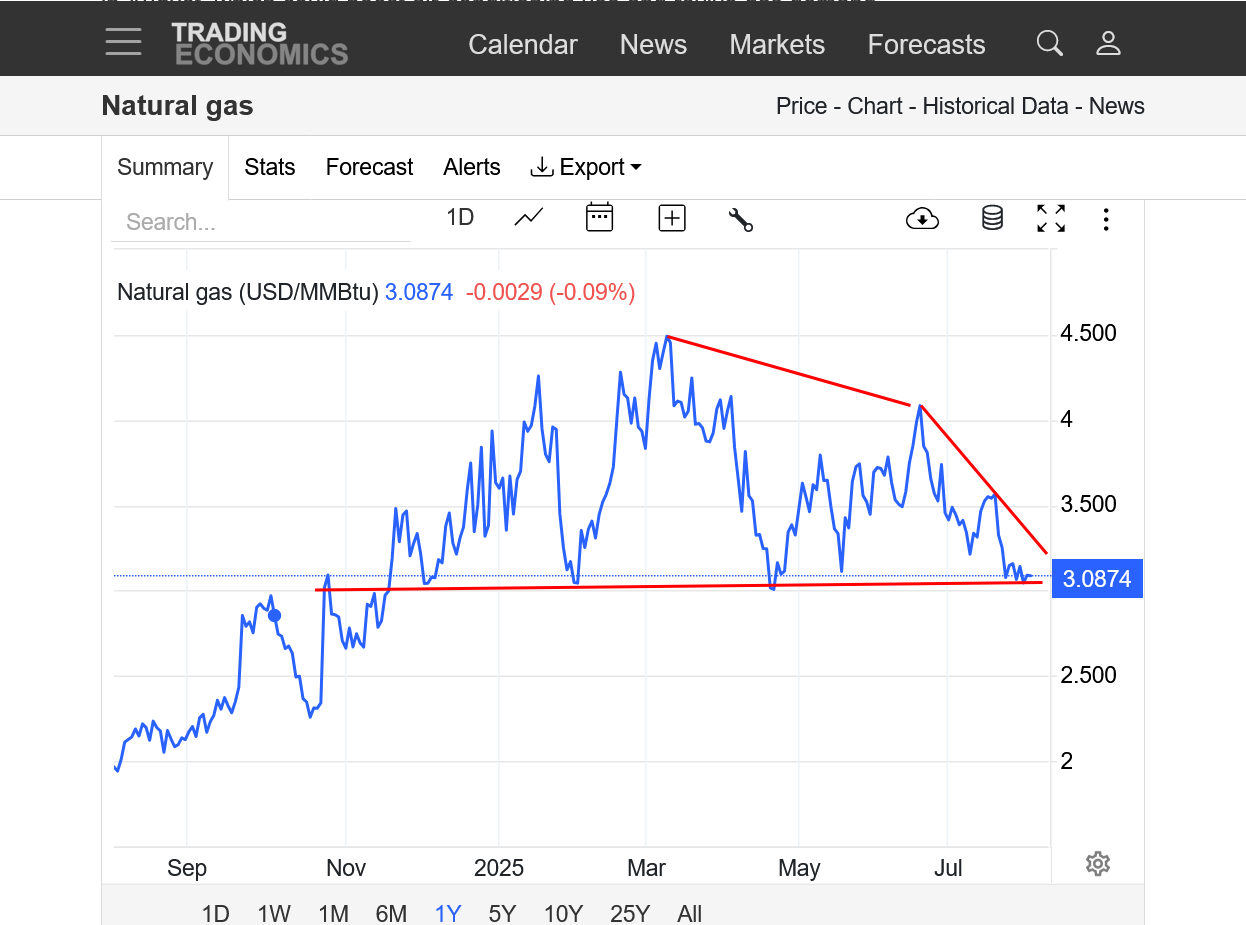
4. 1 year: Head and shoulders top in the Spring. Bull flag currently. Symmetrical wedge.
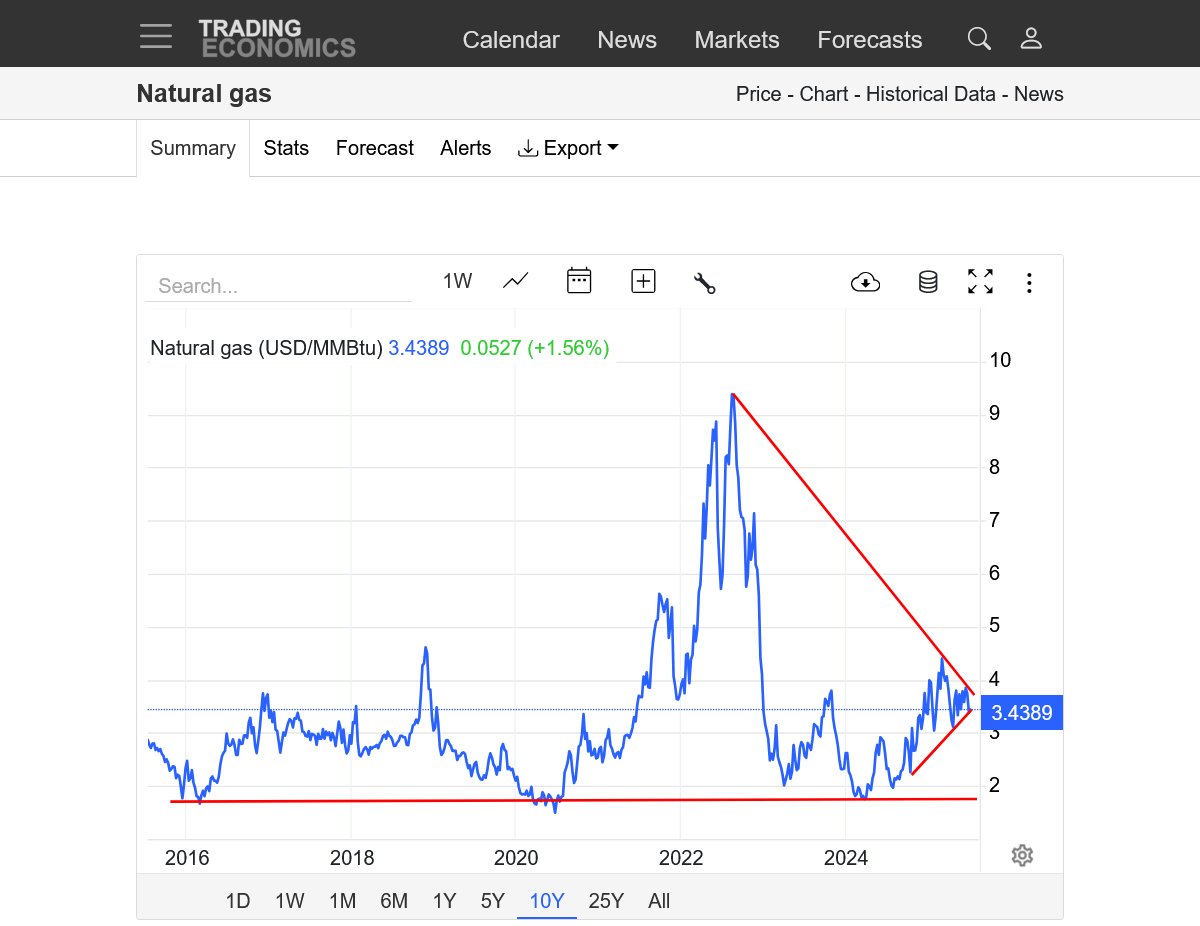
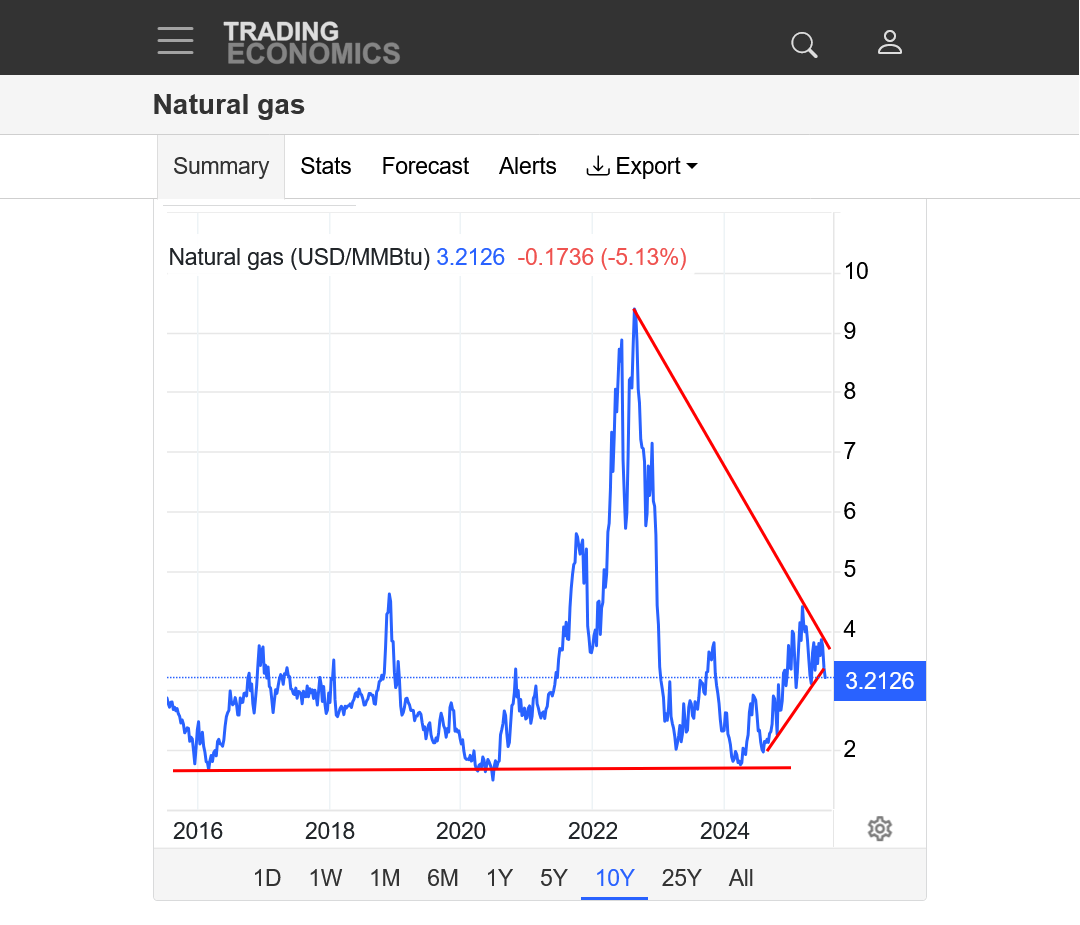
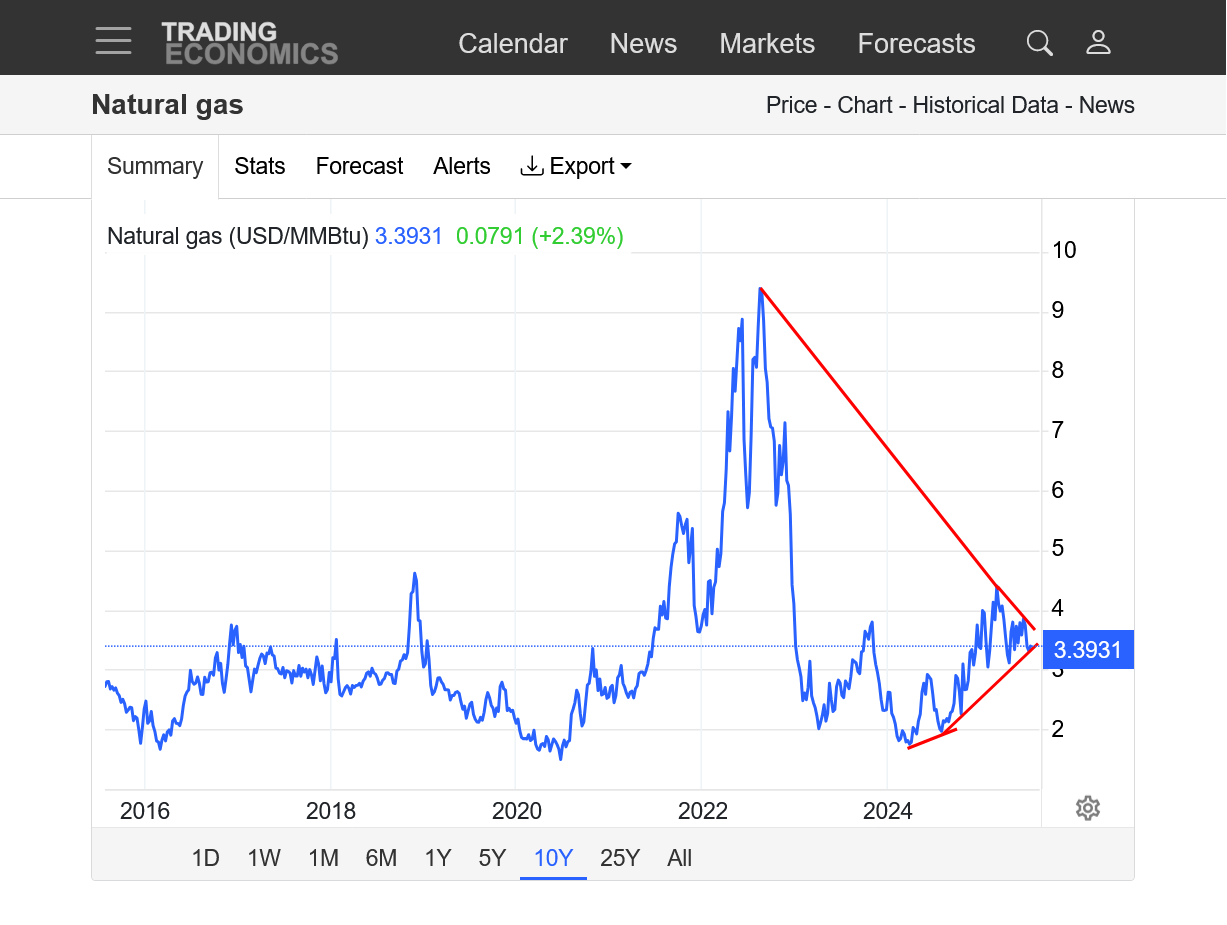
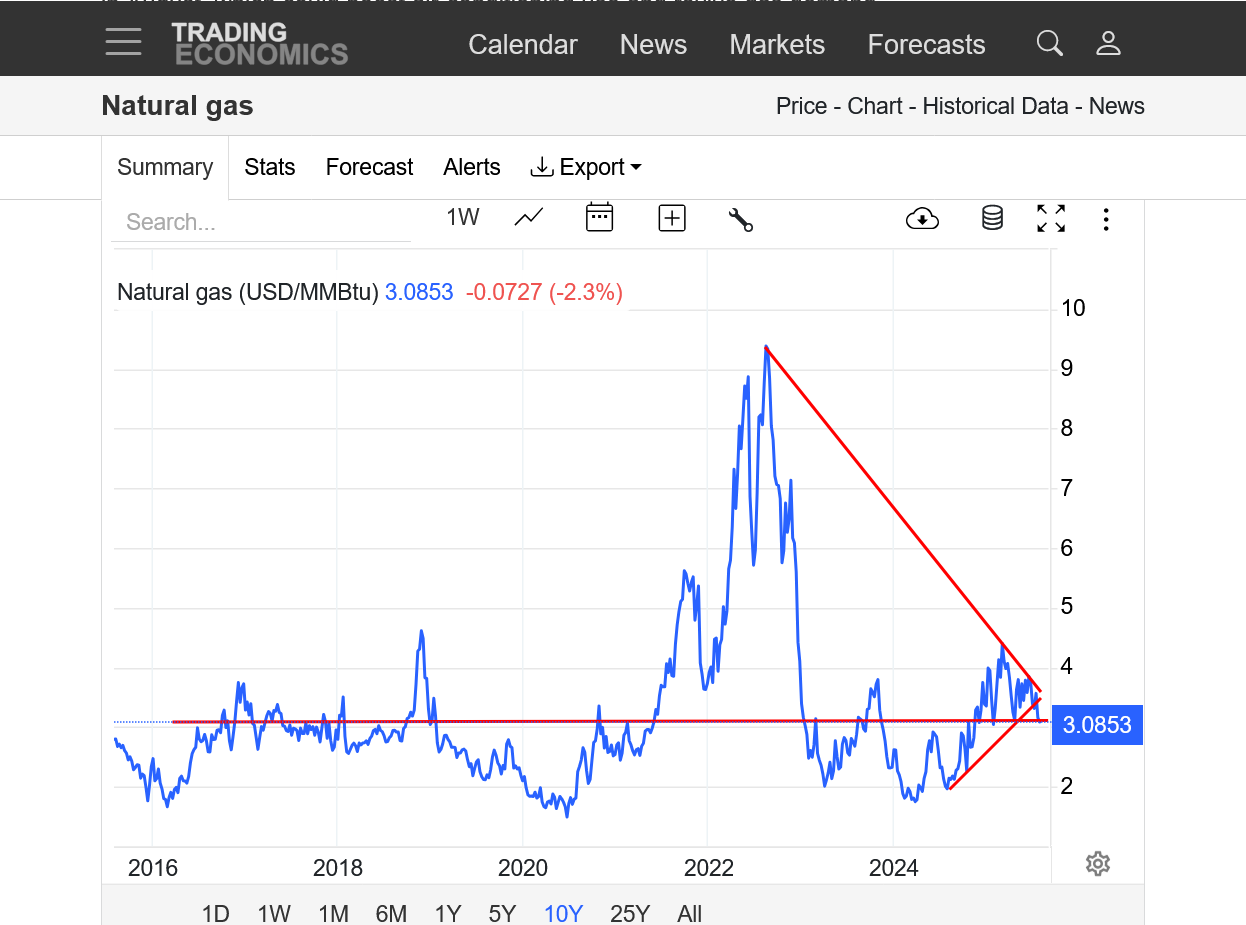
5. 10 years: Major support tested last year with a triple bottom. Last Winters cold drained storage and resulted in a new uptrend that was tested recently. This was after the June spike higher from the pattern change to hot tested the downtrend line. So we have a very impressive SYMMETRICAL WEDGE from lower highs and higher lows.
https://tradingeconomics.com/commodity/natural-gas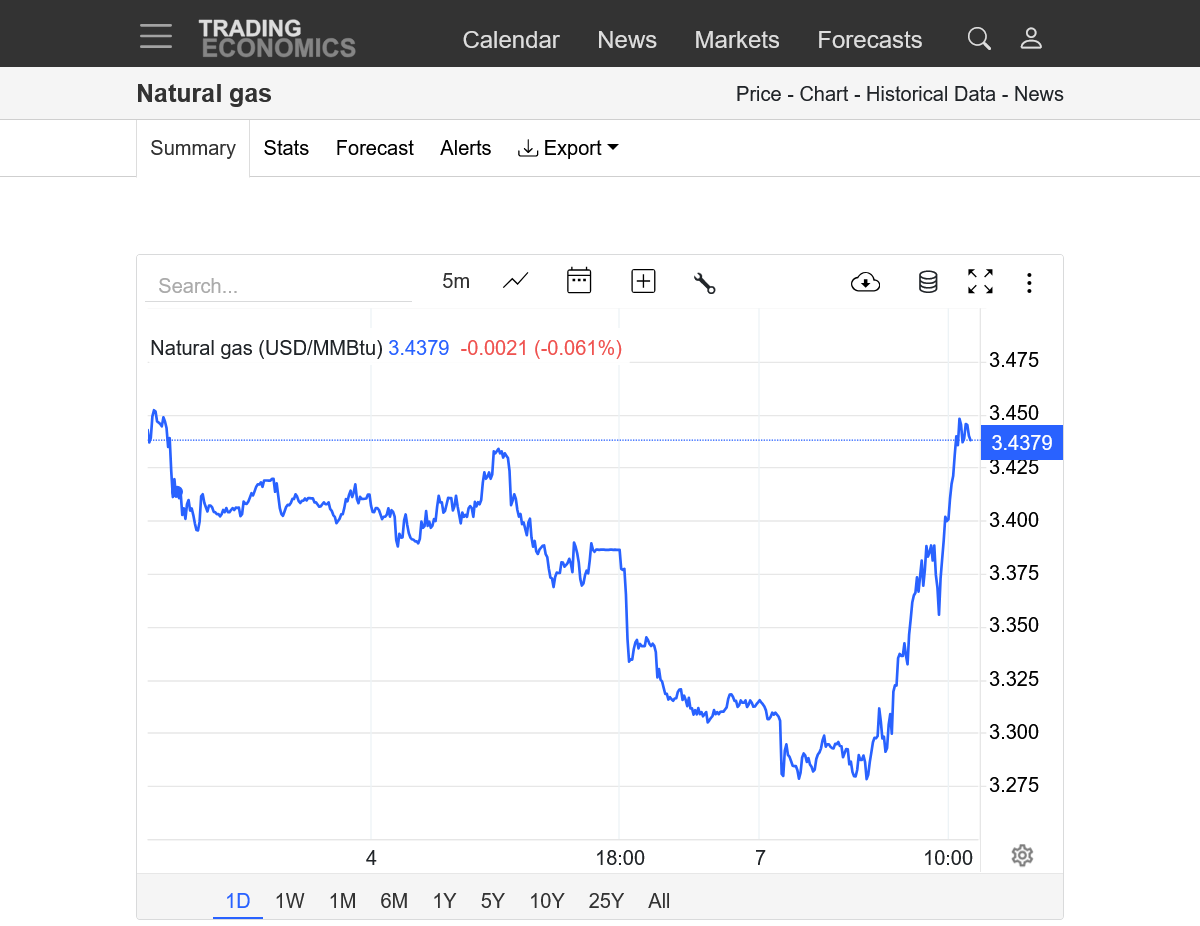
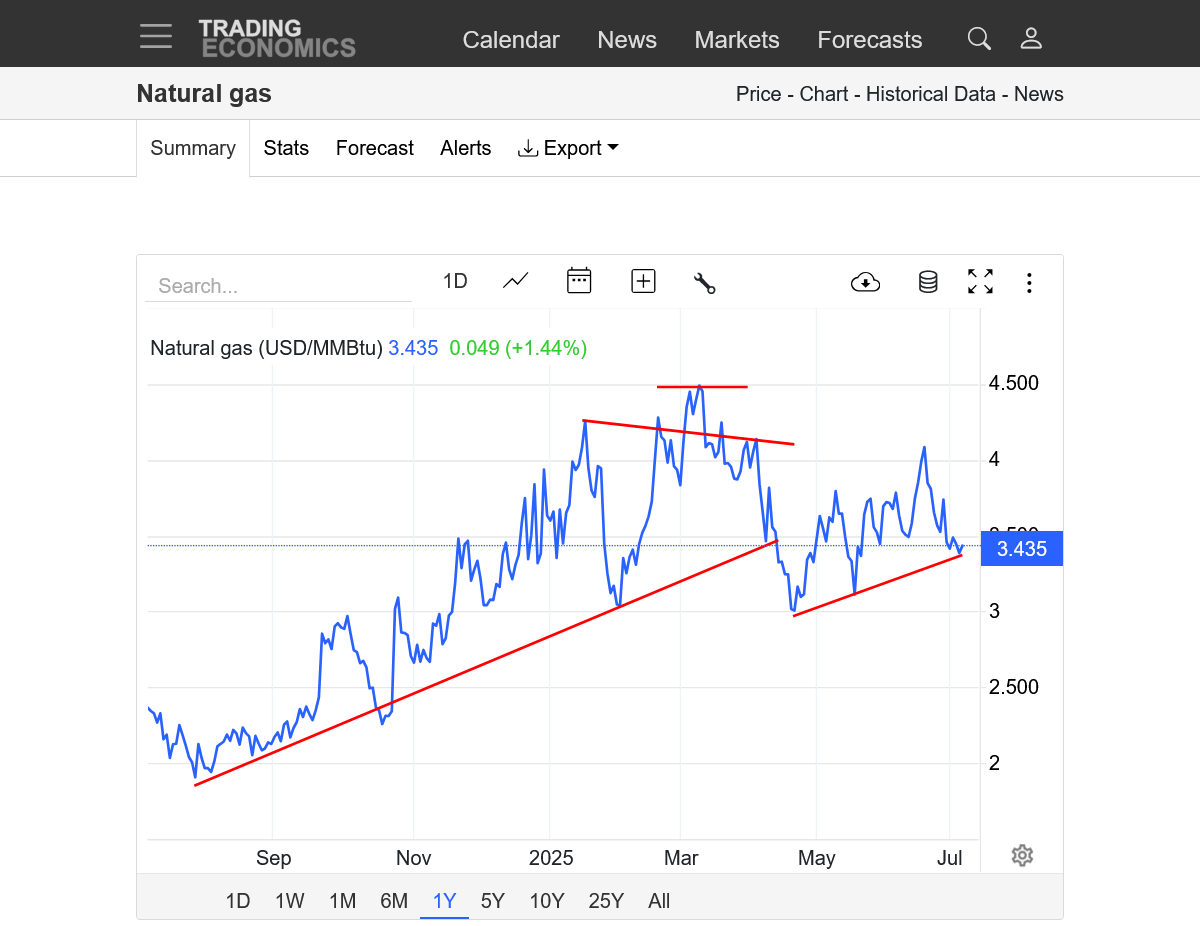
https://itez.com/en/blog/education/lower-highs-higher-lows-trading-guide
++++++++++++++++
7-7-25 continued: The last 0z EE was actually a tad bearish compared to the previous run and definitely compared to last Friday.
+++++++++++++++++++++++++++
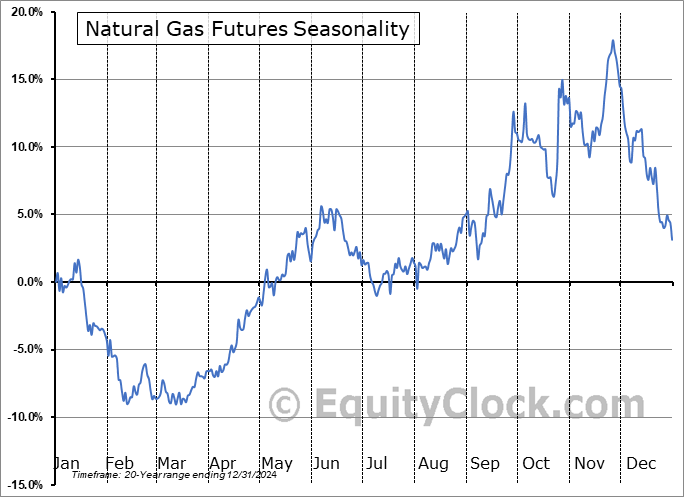
Seasonals also turn positive here:
https://charts.equityclock.com/natural-gas-futures-ng-seasonal-chart
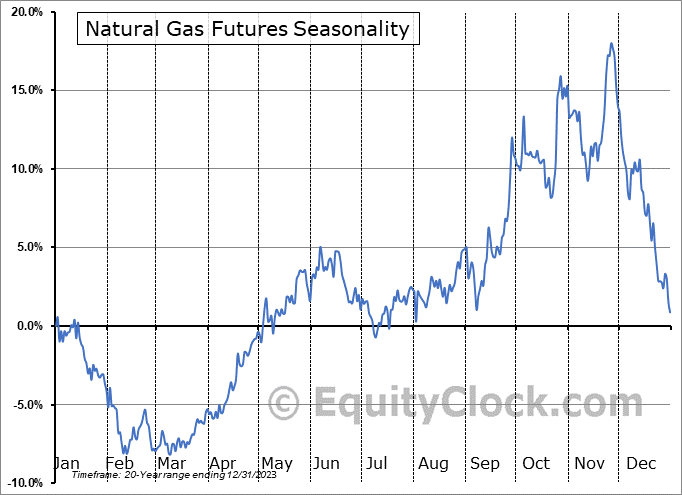
Days 9-12 were much cooler in the middle of the country on this last 12z EE(from a stronger cold front) which caused nat gas to sell off back to around unchanged but still well above the open last night and above the top of the gap lower, so the gap and crap chart formation is still valid.........for now.
U.S. Natural Gas Power Burns Stumble for First Time in Four Years
Natural gas-fired electricity generation declined in the opening half of 2025 for the first time since 2021, falling 1.8% year/year as higher prices and increased competition from other generation undercut demand.

Less heat in the forecasts and no follow thru after yesterday’s powerful selling exhaustion formation.
the last 2 runs of the GEFS were -4 CDDs compared to the previous 2 runs, although the EE is close to the same.
1. This last 0z EE(purple/right) was a whopping -6 CDDS cooler than the previous run and even has some below average days. This immediately spiked natural gas lower when it was coming out not long after midnight and we've continued sharply lower!
2. The last 6z GEFS in purple sees the same cooler CDDs but not AS cool. It runs every 6 hours compared to the EE run every 12 hours so there are 4 separate runs on the graph compared to just 2 for the EE the past 24 hours.
I did the analysis slightly different on a couple of charts below to show the impact of changes in weather/models.
1. 1 day: 1st red line was after the cooler EE. 2nd red line was after the cooler GEFS.
2. 1 week: a. Top after the release of the bearish EIA last Thursday.
b. Followed by the bottom, which had followed the gap lower on Sunday night, reversal up on Monday that got filled after a selling exhaustion and hot forecasts.
c. d. Weather forecasts turning less hot, then COOLER
3. 1 month: Top in late June after the heat in wx forecasts peaked with an accelerating downtrend as forecasts progressively turned cooler.
4. 1 year: EACH OF THE 7 RED LINES represents the inflection point that resulted from a change in the weather forecast. Mostly noteworthy was the bullish impact of last Winters colder than average temps)
5. 10 years: Triple bottom just below 2, lowest from COVID. Symmetrical wedge/triangle since the MAJOR 2022 high(when storage had plunged-followed by record injections late that year). We are threatening to break out to the downside of that wedge/triangle formation right now, depending on how much cooler the forecasts get. If we turn really hot again and it lasts, then this could be a bull flag.
https://tradingeconomics.com/commodity/natural-gas
The last 18z GEFS in purple is the coolest yet (-3 CDDs vs the previous one) of the last 4 runs and they have consistently been getting cooler and cooler since Saturday.
Above average temps in some places last week. Northwest to N.Plains. Great Lakes to Mid Atlantic.
https://www.cpc.ncep.noaa.gov/products/tanal/temp_analyses.php
++++++++++++++
https://ir.eia.gov/ngs/ngs.html
![]()
for week ending July 4, 2025 | Released: July 10, 2025 at 10:30 a.m. | Next Release: July 17, 2025
| Working gas in underground storage, Lower 48 states Summary text CSV JSN | |||||||||||||||||||||||||
|---|---|---|---|---|---|---|---|---|---|---|---|---|---|---|---|---|---|---|---|---|---|---|---|---|---|
| Historical Comparisons | |||||||||||||||||||||||||
| Stocks billion cubic feet (Bcf) | Year ago (07/04/24) | 5-year average (2020-24) | |||||||||||||||||||||||
| Region | 07/04/25 | 06/27/25 | net change | implied flow | Bcf | % change | Bcf | % change | |||||||||||||||||
| East | 616 | 602 | 14 | 14 | 679 | -9.3 | 601 | 2.5 | |||||||||||||||||
| Midwest | 710 | 688 | 22 | 22 | 797 | -10.9 | 699 | 1.6 | |||||||||||||||||
| Mountain | 231 | 228 | 3 | 3 | 244 | -5.3 | 184 | 25.5 | |||||||||||||||||
| Pacific | 291 | 287 | 4 | 4 | 288 | 1.0 | 262 | 11.1 | |||||||||||||||||
| South Central | 1,158 | 1,148 | 10 | 10 | 1,182 | -2.0 | 1,087 | 6.5 | |||||||||||||||||
| Salt | 339 | 342 | -3 | -3 | 327 | 3.7 | 306 | 10.8 | |||||||||||||||||
| Nonsalt | 819 | 806 | 13 | 13 | 855 | -4.2 | 782 | 4.7 | |||||||||||||||||
| Total | 3,006 | 2,953 | 53 | 53 | 3,190 | -5.8 | 2,833 | 6.1 | |||||||||||||||||
| Totals may not equal sum of components because of independent rounding. | |||||||||||||||||||||||||
Working gas in storage was 3,006 Bcf as of Friday, July 4, 2025, according to EIA estimates. This represents a net increase of 53 Bcf from the previous week. Stocks were 184 Bcf less than last year at this time and 173 Bcf above the five-year average of 2,833 Bcf. At 3,006 Bcf, total working gas is within the five-year historical range.
For information on sampling error in this report, see Estimated Measures of Sampling Variability table below.
++++++++++++++
Story of the Day
The U.S. Energy Information Administration (EIA) on Thursday reported a 53 Bcf injection of natural gas into storage for the week ended July 4, a bullish surprise that briefly bolstered futures before they gave back the post-report gains.
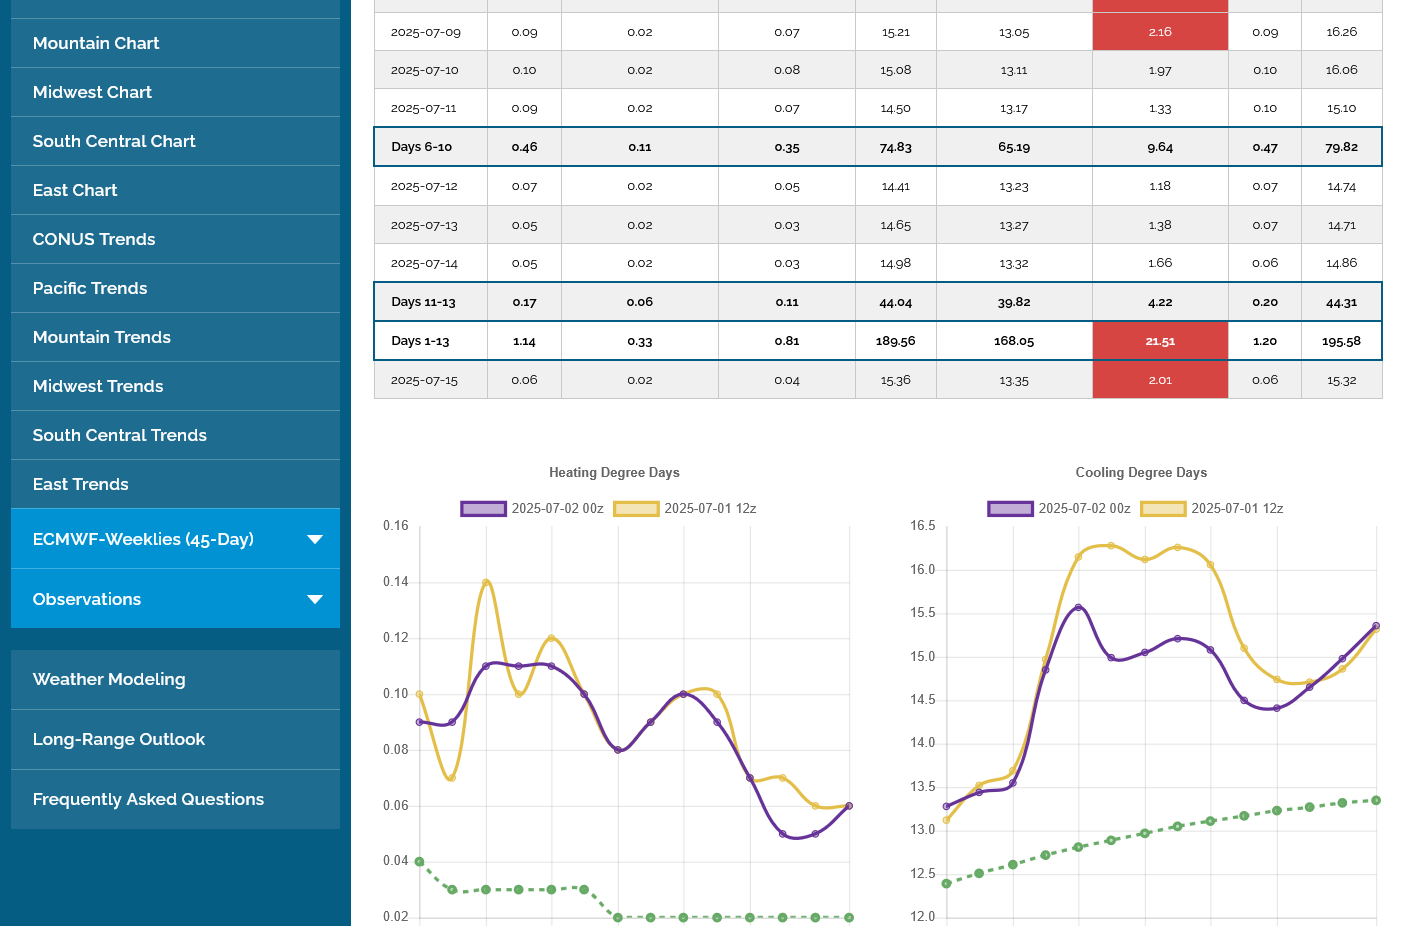
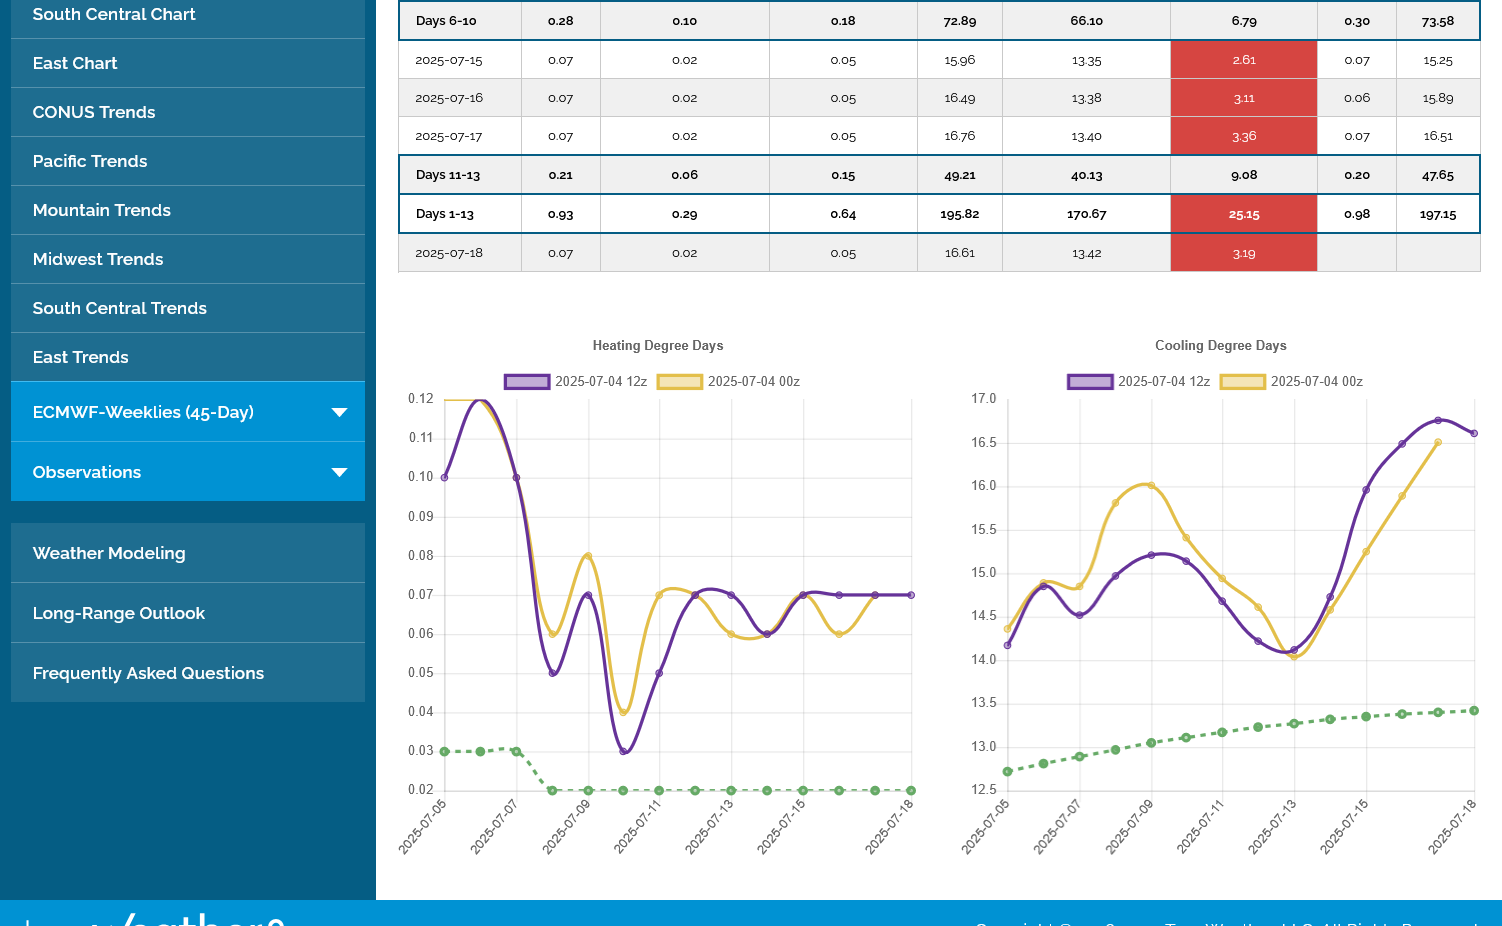
The last 0z EE in purple was +2 CDDs, so maybe the constant cooling in the models since Saturday is over.
Also, the big dip in CDDs below which was NOT expected a week ago is followed by rapidly increasing, widespread heat. It's likely we've now dialed in the big dip with much lower prices and could now be trading the increasing heat.
2pm: The 12z EE was quite a bit hotter which has supported prices after the somewhat bullish EIA! Another +4 CDDs vs the previous oz run.
Maybe the lows are in now?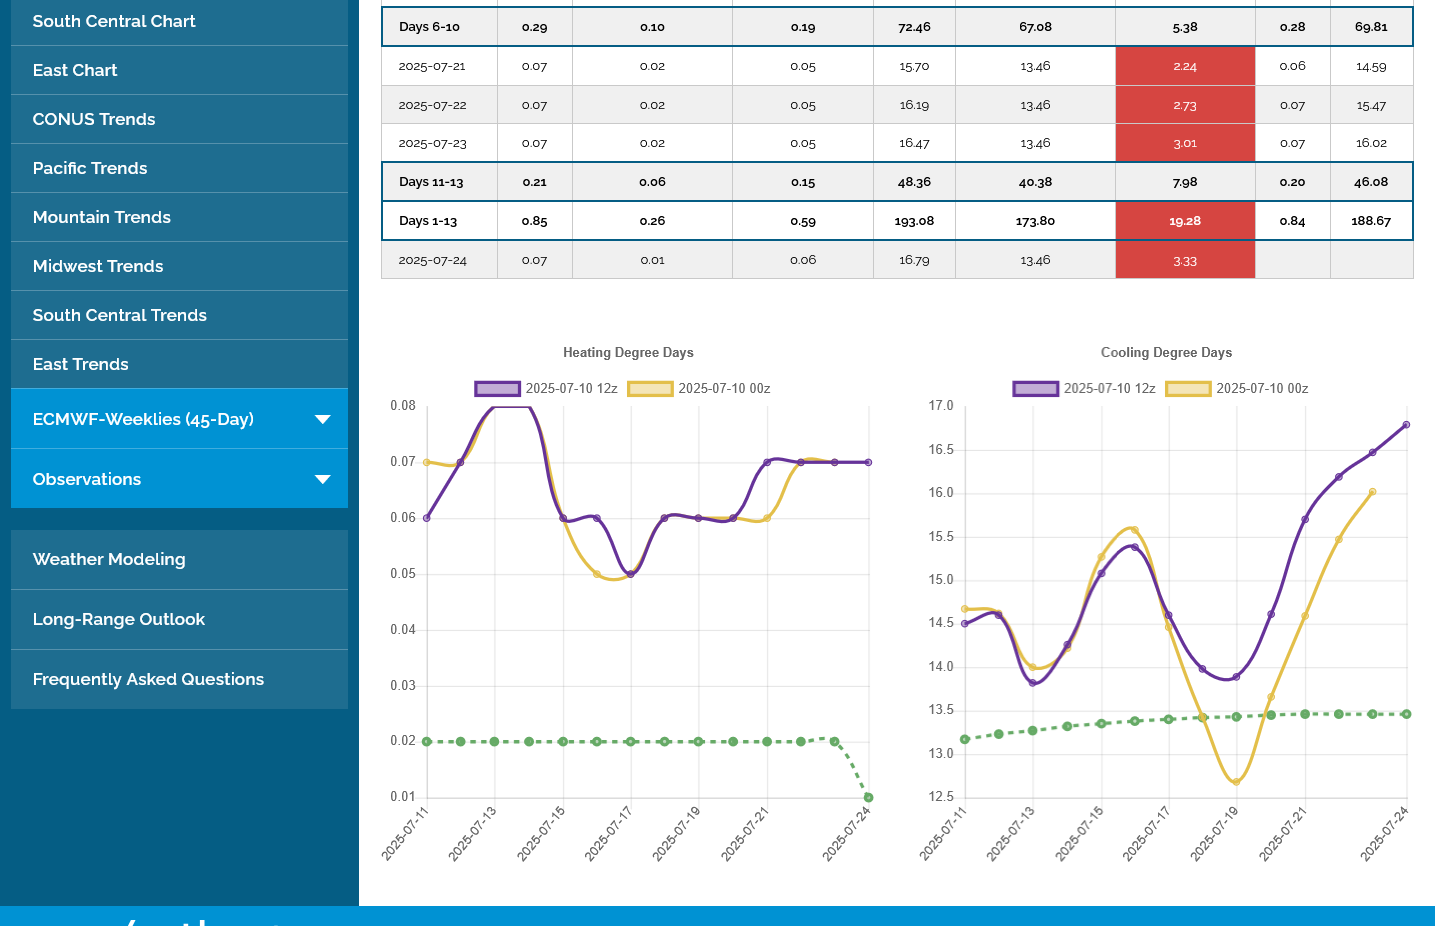
-2 CDDs on the last 0z EE in purple which knocked the nat gas down from some evening gains.
Look at the trajectory in week 2. Will this lead to hotter days at the end of the forecast replacing not AS hot days early in the forecast?
However, the models for the past couple of weeks have been underestimating the strength of the northern stream coming down from Canada and carving out a cooling trough in the Midwest/Northeast which retrogrades the heat ridge to a position centered in the Southwest.
7am: The week 2 part of the 6z GEFS in purple below came out hotter. NG spiked to new highs for the session, then came right back down.
https://tradingeconomics.com/commodity/natural-gas
++++++++++++
The very last map of the just out 6z GEFS is not very bullish to me. Heat ridge/dome, centered in the S/C.Rockies with a trough in the eastern 1/3rd of the US keeping the heat away. Northwest flow in the Midwest feeding into the trough.
NORTHERN STREAM JULY SURPRISE!
The northern stream has turned unexpectedly strong in July and instead of the bullish teleconnections coming from the Pacific taking over into the Western Cornbelt, that impact has been deflected farther west by the push from the unexpected northern stream(upper level trough in Southeast Canada) into the Midwest/Northeast.
1. Day 7 jet stream at 250 mb from the just out 12z GFS.
2. Day 10 jet stream at 250 mb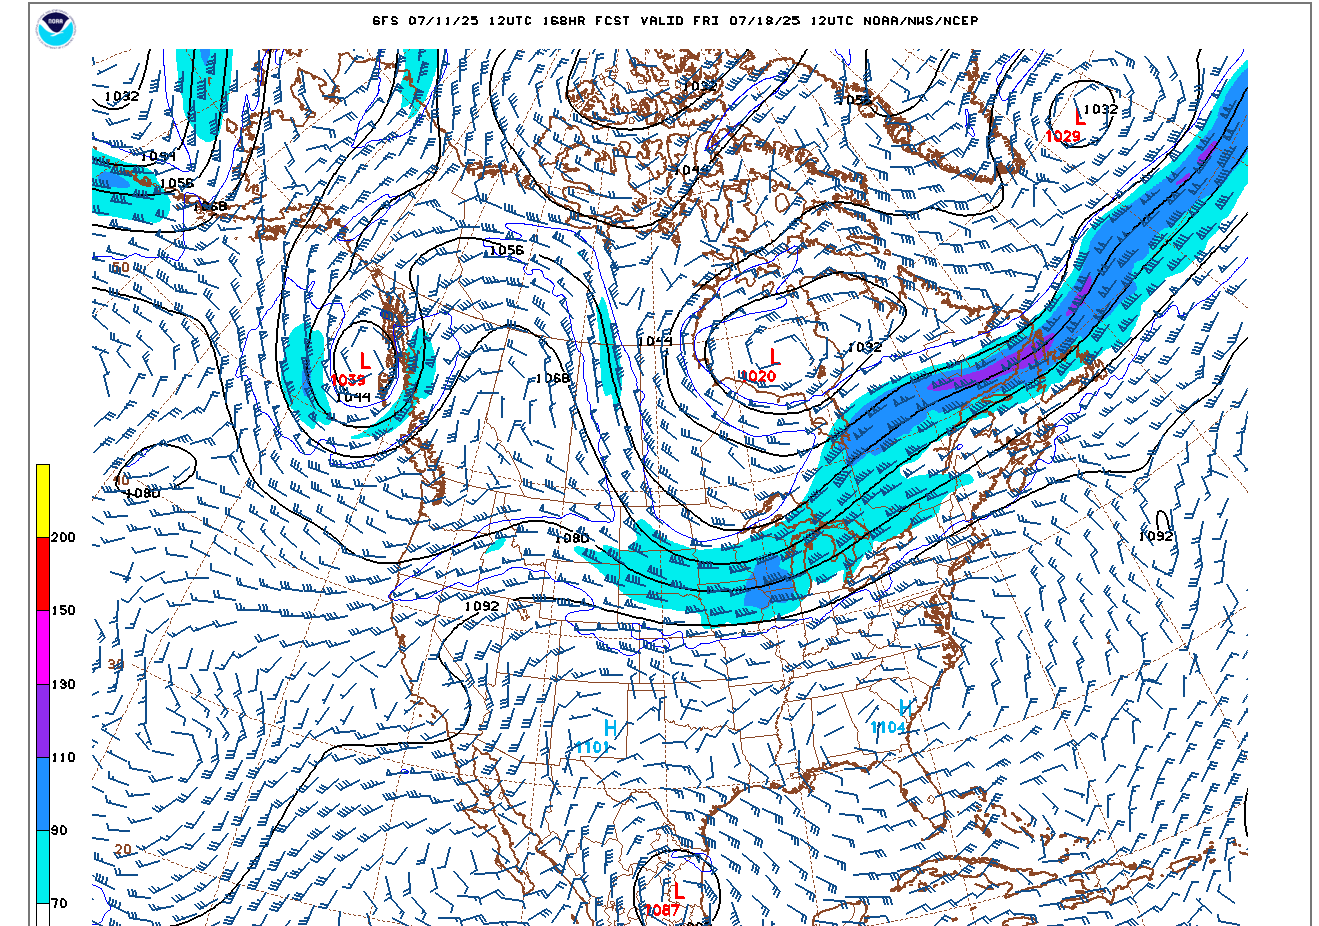
1. Another HUGE cool surprise to the 12z GEFS model. A whopping -8 CDDs (in purple) vs the previous model run!!!
2. In the Midwest only, it was a shocking -14.5 CDDs!!! These cool surprises have defined the models in July!
1. 1 day price chart below: The MUCH cooler 12z GEFS spiked the price to new lows but we've recovered to the bottom of the previous range from the updated 12z European Ensemble model coming out a bit hotter (not confirming the much cooler GEFS).
Note the upward spike from earlier in the morning when the 6z GEFS came out HOTTER in week 2. Increased volatility right now in natural gas.
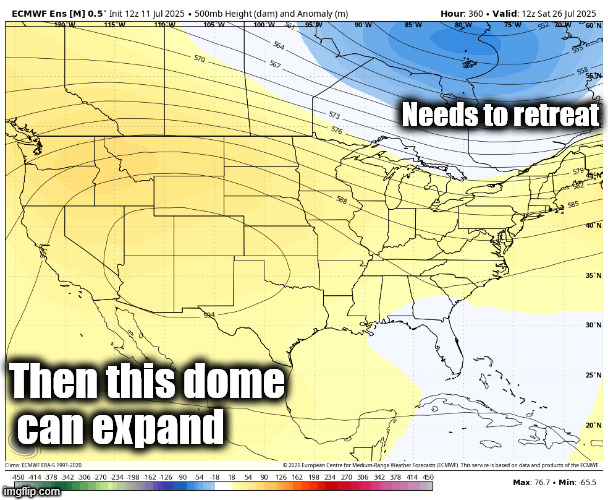
If the forecast STOPS cooling off in week 2 and instead heats up again and that stays, the lows in ng will be in. But the northern stream associated with the Southeast Canada upper level low needs to retreat farther north so the Pacific teleconnections can expand east and northeast instead of being deflected farther southwest.
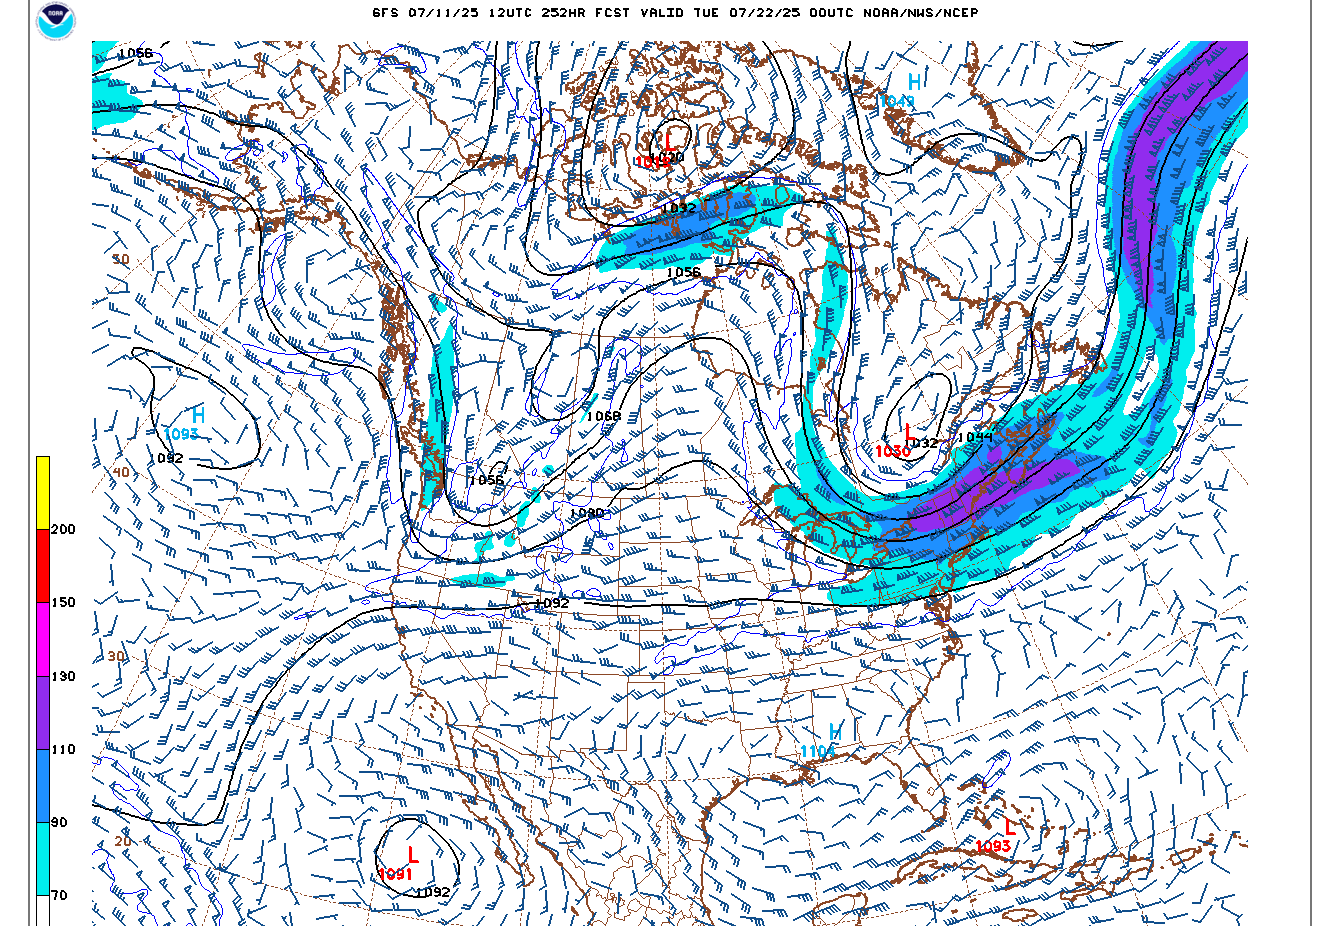
2. 500 mb map on day 15 of this last 12z EE model.
Day 15 of the last 12z European model. Strong northwest flow in the Midwest that keeps the intense heat away with active cold fronts.
Models have turned decidedly hotter over the weekend. Sharply higher open for natural gas tonight.
The stronger northern stream that has surprised models and forecasters the last couple of weeks, finally retreats and the teleconnetions coming out of the Pacific can rule with impunity which will finally vindicate all the forecasts for heat this Summer.
Got the sharply higher open. Not quite a gap higher but above the highs on Fri.
I had an order to buy multiple contracts at 3401 or better but only 2 contracts got filled and its been the low so far
Will put a trailing sell stop in and look for a chance to buy more.
Out at 3416, make that 3414.
Looking at the long side only here.
Hey Mike,
Congrats on 260 gross profit. A win is a win!
Thanks, Larry!
I was frustrated that only 2 contracts were filled when it looked like that would be the low but then when we dropped to a new low of 3395 and I was out with my tiny profit, it took away the frustration and provided a small psychological boost.
I had the chance to buy as many as I wanted at the original price, 3401 but chose NOT to and will wait for overnight. I was pretty active trading ng over a month ago but didn't do anything for many weeks after that.
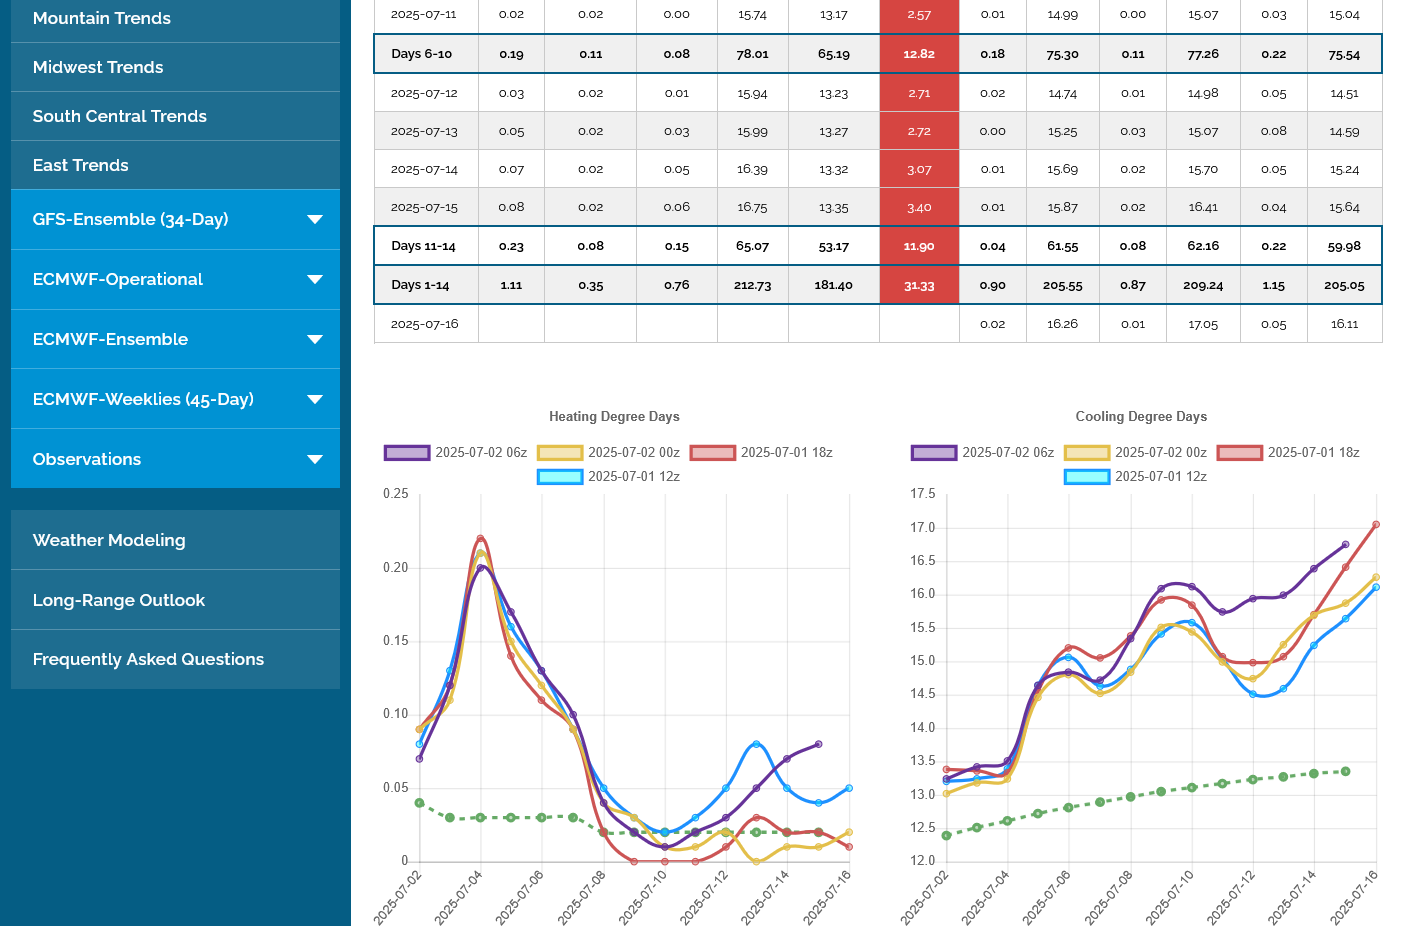
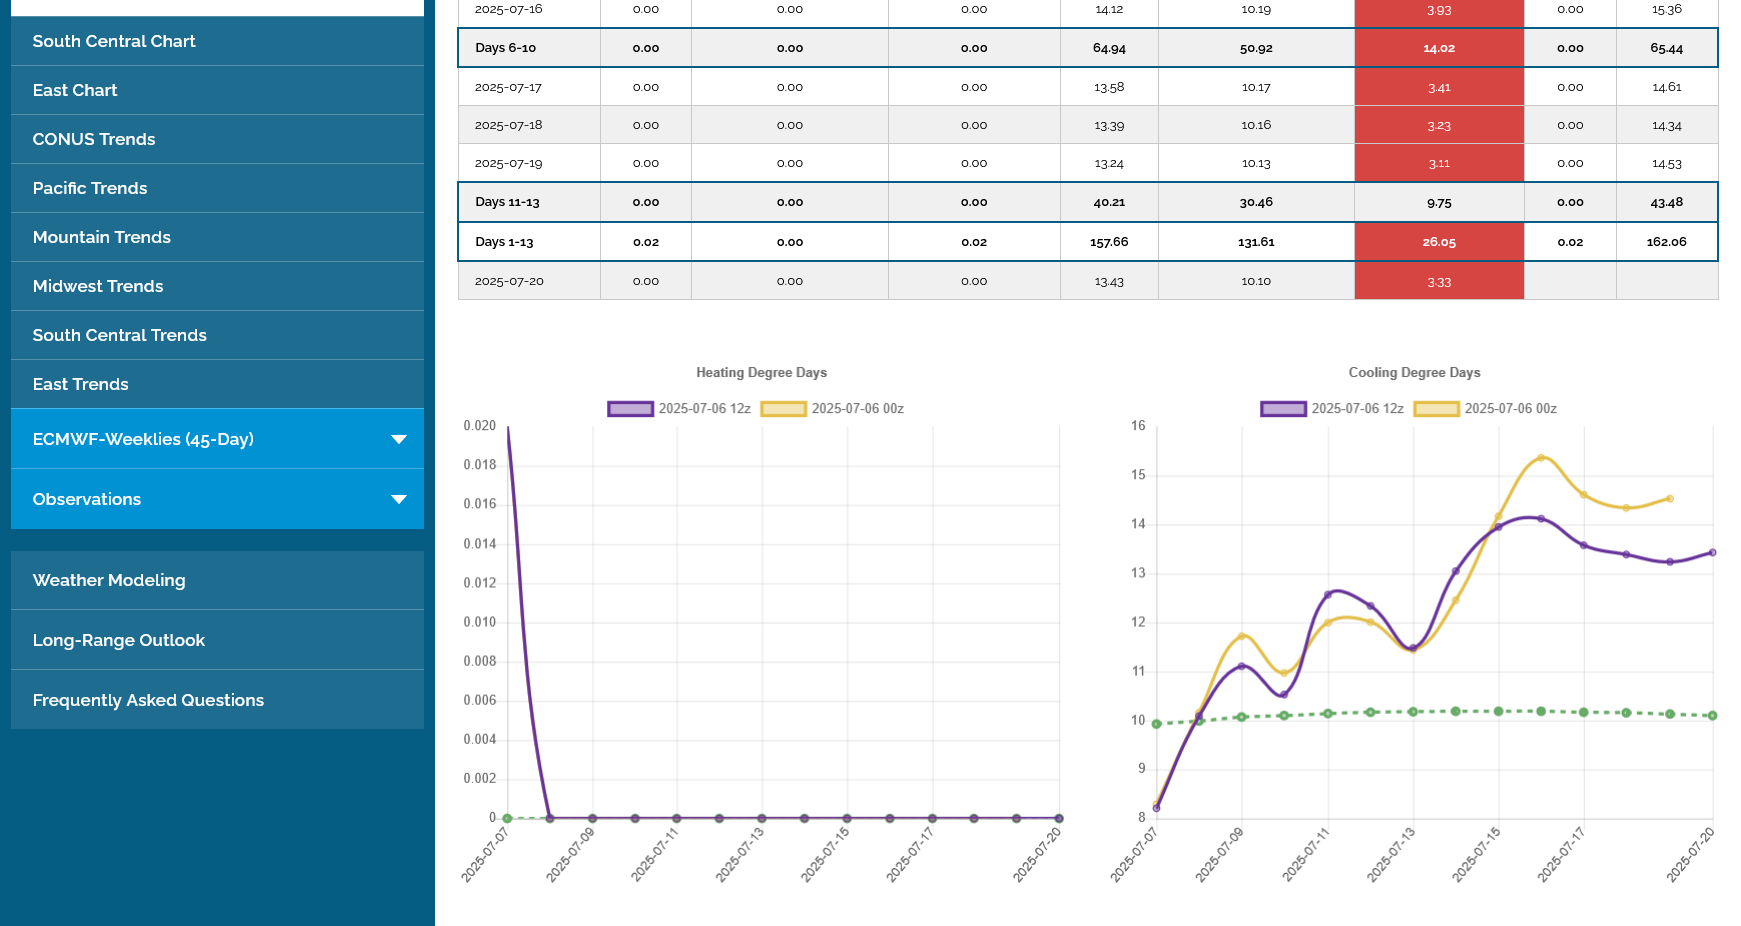
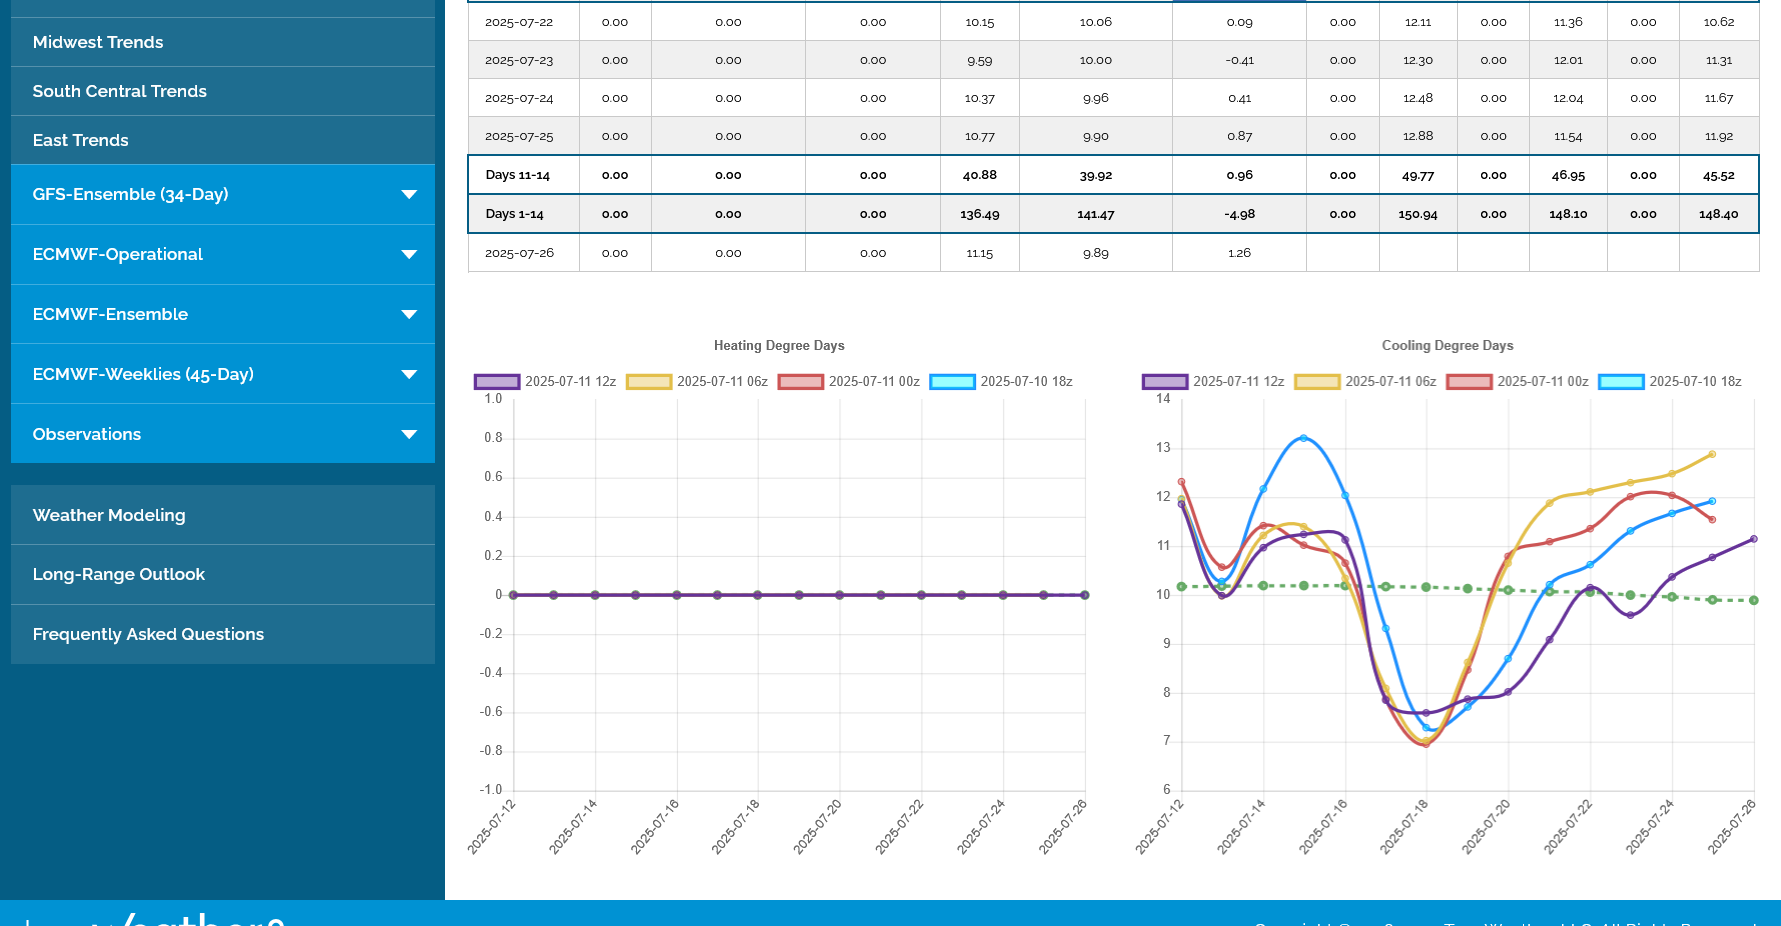
This was the last 12z European Ensemble model. Another +2.4 CDDs vs the previous 0z model.
Note the trajectory in week 2. Straight up early on then basically maintaining that heat. Note also the green, climatological average line. It levels off in around a week, then starts drifting lower since the average temperatures have peaked. Weeks 3-4 look pretty hot and hotter than they looked last Friday. If that verifies, then the lows for NG are likely in.
Last 0z run of the EEmodel was extremely bullish at the end of week 2,
6z GEFS not AS bullish as the very bullish 0z EE
added: wow! After spiking up $1,000 from the lows after the mega bullish EE, we came back down and made new lows for the session after the 6z GEFS that is still pretty bullish. This is pretty lame action by nat. gas that could also be trading the Trump recession and drop in industrial demand coming up.
++++++++++++
9:25am: That was some of the most insane trading ever which is why Larry stopped trading this market and me too backing off trading it like I used to.
1. We spiked down Friday late AM on a much cooler GEFS then recovered to a mid range close.
2. This was followed by a sharply higher open Sunday Night, just above the long red line, which was also around the Friday highs. We tested that 2 times, then took off overnight/early am, especially after a HOT EE model.
3. Then, at 6am, when we were +$1,000 from the lows, we had an enormous spike low to NEW lows and below the long red line.
4. This spike lower ended at 8am and we've spiked all the way back from new lows for the session to test the highs (3499-higher than the graph shows).
5. At the moment, we've backed off slightly to 3468.
https://tradingeconomics.com/commodity/natural-gas
Mike,
And then per the chart, it hit (barely) a new session high near 9:15AM CDT! Do you know why?
The chart is wrong, Larry. The high overnight was 3499 and all we did was test it.
The 6z GEFS was still pretty bullish but might have been the excuse for the spike down that started at 6am, then the market got over that spike at 8am and went back to trading the HOTTER pattern.
However, I've noticed the most extreme spikes seem to occur during this same time frame on other days.
It might be that a new group of traders(for the day session) start trading(with much larger positions) at this time frame and have a different mentality than the overnight traders???
I almost bought a decent sized position after 6am when we were collapsing at several points and may have risked it to new lows..........then gotten stopped out for a loss........then been proven right. Maybe the algorithms are trying to jerk around traders with this same idea when the price spikes to a new low in UNjustified fashion.
I was really wanting to buy below 3.4 just because of the amount of heat in the forecast but the magnitude of the sell off to new lows had me thinking the market must not care about the weather as much as I thought.
This makes weather trading more like high risk gambling at times.
10:20 am:
Now we're back closer to mid range. The heat in the forecast is extremely bullish but this is a market battling some bearish items too which is causing indecision:
This was the last 0z EE. WOW! at the end: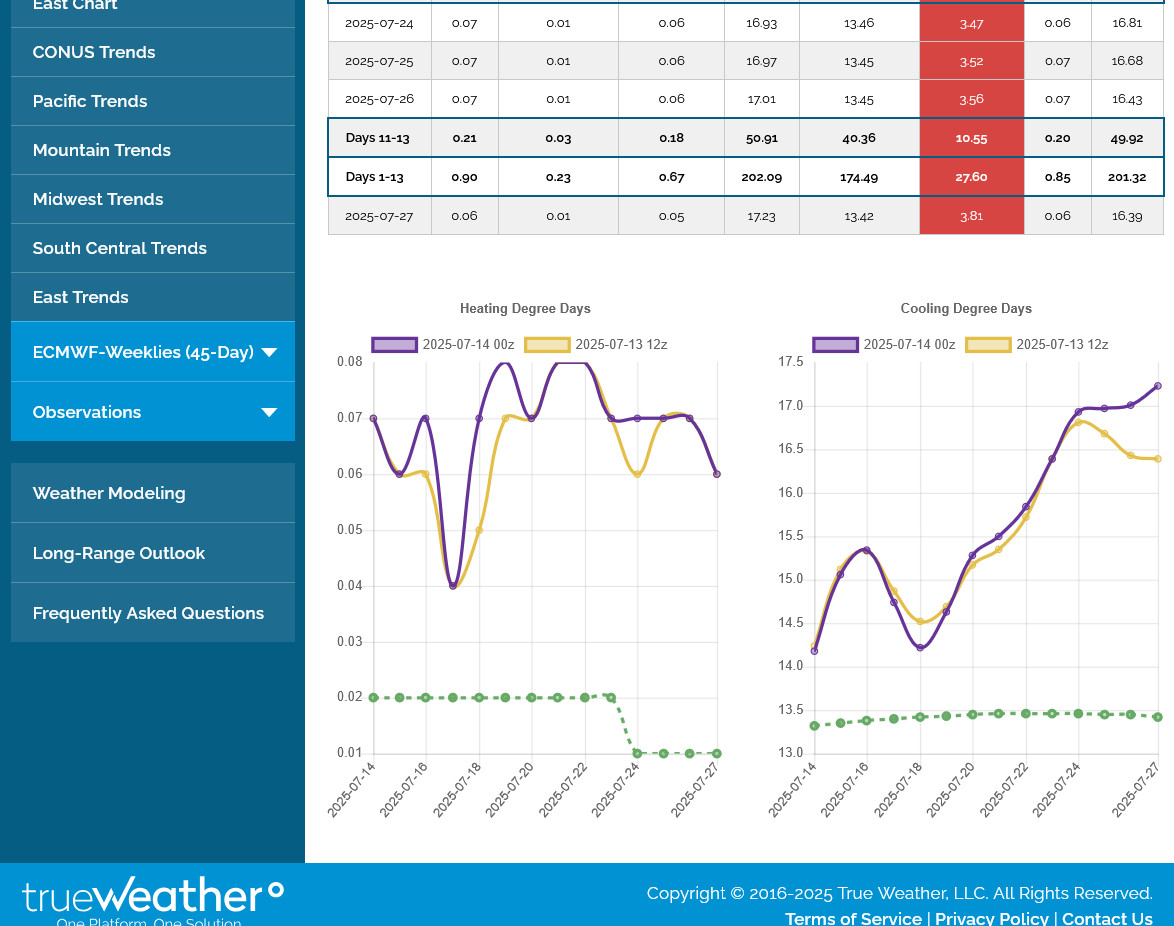
Mike said:
“9:25am: That was some of the most insane trading ever which is why Larry stopped trading this market and me too backing off trading it like I used to.”
——————-
Thanks, Mike. That’s why IF I ever get back to trading NG, I’d probably need to shoot for only modest targets like perhaps a few hundred per contract and use trailing stops more often in addition to no more than a few contracts per trade.
***Edit: Maybe I’d mainly just stick to options?
Thanks, Larry!
The problem with options is that you might pay out the wazoo to be long, either calls or puts so that it takes a pretty good move to make money on it.
i haven’t checked but with the extreme volatility in natural gas, I imagine this is resulting in a hefty premium for IV(implied volatility).
Some of that would still be left when you sold it but time value will bleed you too.
my actual trading experience with options is limited to selling out of the money coffee calls in the Brazil winters in the 1990s when there was no freeze and holding them to expiration.
I only did that because Craig solberg from weather trades had suggested that. We are both familiar with him.
extremely sharp guy!
tjc likes to BUY options amd,producers sometimes have reasons to do this for production protection strategies but I will NEVER buy.
You just have to sacrifice too much and,pay too much.
Options sellers with deep,pockets rake,in most of the dough.
For NG options to negate the bid/ask spread, I’d try to buy only as the highest bidder rather than at the ask. I may not get filled, which would be better than buying way up at the ask.
By going it that way, I’ve made decent money on NG options. Also, I’ve made good money on KC and OJ options that way.
I believe you, Larry!
Your strategy might work.
When we have crazy moves like the last 24 hours(that didn't used to happen) wouldn't it increase the cost of ng options from higher IV?
It would for sure give you staying power for longer term moves based on a major weather pattern change that features days like this one.
I can say that even if I had a million dollar account with tremendous cushion for risk/drawdowns, it would be hard to justify going up almost $1,000 after putting the trade, then staying in the position to a point of being behind the same day.
When a market doesn't respond the way that I anticipate, I automatically assume that I must be wrong about how important the weather is and look for reasons to lower risk.
Natural gas does this on a regular basis, so its impossible to know if I'm wrong or that its just being natural gas, which is why I always put in a trailing, tight stop. Which usually takes me out with small profits, while always missing the big moves.
Similar to MANY days, the pattern over the last 24 hours has featured a new group of traders that come in around 6am and trade algorithms that cause the ng price to gyrate up and down, sometimes with a different mentality to overnight traders.
After a grinding drop all night long from SOME models not being as hot, just before 6am, ng took off higher to barely take out the highs of the session(in the midst of the 6Z GEFS coming out LESS hot. Then it immediately spike down close to the lows, then immediately reversed up to set NEW highs for the session, then turned down back into the top part of the previous range and has remained elevated since then.
The European Ensemble from 0z was still hot. It comes out just after midnight and the market continued a slow overnight drop after it was released.
I'm still BULLISH this market based on all the heat coming up. Note the steep upward trajectory for CDDs below on the right.
NG had a solid performance today, closing at new highs for the move and week. Rapidly increasing, widespread heat is the overwhelming driving force.
The last 12z EE in purple/right added another 2.7 CDDs to the previous, already HOT 0z EE.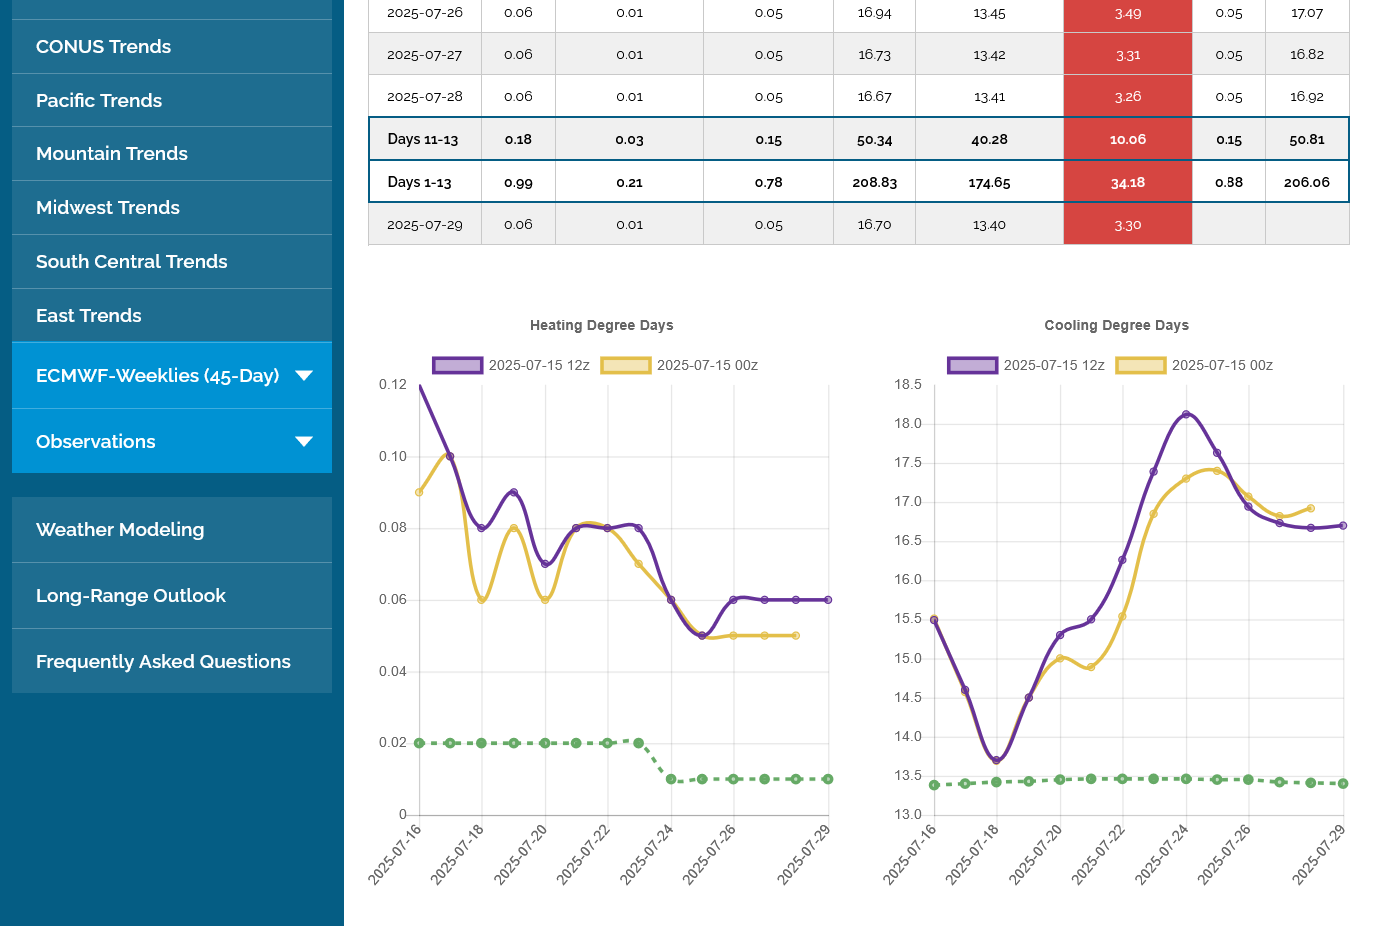
NG continues to march higher with the pattern change to widespread heat increasing.
These were temps for tomorrows EIA report. Widespread heat in some population dense areas that were using lots of AC coming from electricity generated by burning natural gas.
https://www.cpc.ncep.noaa.gov/products/tanal/temp_analyses.php
1. The last 12z GEFS (purple/right) was -5 CDDs vs the previous 2 runs and a WHOPPING -10 CDDs vs the run before.
2. 1 day chart: That caused a huge spike lower in prices............that then recovered to mid/upper range again.
https://tradingeconomics.com/commodity/natural-gas
Bearish? Slight spike down on the release.
https://ir.eia.gov/ngs/ngs.html
![]()
for week ending July 11, 2025 | Released: July 17, 2025 at 10:30 a.m. | Next Release: July 24, 2025
| Working gas in underground storage, Lower 48 states Summary text CSV JSN | |||||||||||||||||||||||||
|---|---|---|---|---|---|---|---|---|---|---|---|---|---|---|---|---|---|---|---|---|---|---|---|---|---|
| Historical Comparisons | |||||||||||||||||||||||||
| Stocks billion cubic feet (Bcf) | Year ago (07/11/24) | 5-year average (2020-24) | |||||||||||||||||||||||
| Region | 07/11/25 | 07/04/25 | net change | implied flow | Bcf | % change | Bcf | % change | |||||||||||||||||
| East | 628 | 616 | 12 | 12 | 685 | -8.3 | 615 | 2.1 | |||||||||||||||||
| Midwest | 730 | 710 | 20 | 20 | 812 | -10.1 | 718 | 1.7 | |||||||||||||||||
| Mountain | 235 | 231 | 4 | 4 | 248 | -5.2 | 188 | 25.0 | |||||||||||||||||
| Pacific | 295 | 291 | 4 | 4 | 289 | 2.1 | 266 | 10.9 | |||||||||||||||||
| South Central | 1,164 | 1,158 | 6 | 6 | 1,174 | -0.9 | 1,086 | 7.2 | |||||||||||||||||
| Salt | 335 | 339 | -4 | -4 | 319 | 5.0 | 299 | 12.0 | |||||||||||||||||
| Nonsalt | 829 | 819 | 10 | 10 | 855 | -3.0 | 787 | 5.3 | |||||||||||||||||
| Total | 3,052 | 3,006 | 46 | 46 | 3,208 | -4.9 | 2,874 | 6.2 | |||||||||||||||||
| Totals may not equal sum of components because of independent rounding. | |||||||||||||||||||||||||
Working gas in storage was 3,052 Bcf as of Friday, July 11, 2025, according to EIA estimates. This represents a net increase of 46 Bcf from the previous week. Stocks were 156 Bcf less than last year at this time and 178 Bcf above the five-year average of 2,874 Bcf. At 3,052 Bcf, total working gas is within the five-year historical range.
For information on sampling error in this report, see Estimated Measures of Sampling Variability table below.
Note: The shaded area indicates the range between the historical minimum and maximum values for the weekly series from 2020 through 2024. The dashed vertical lines indicate current and year-ago weekly periods
++++++++++++++++++++++=
10am:
https://tradingeconomics.com/commodity/natural-gas
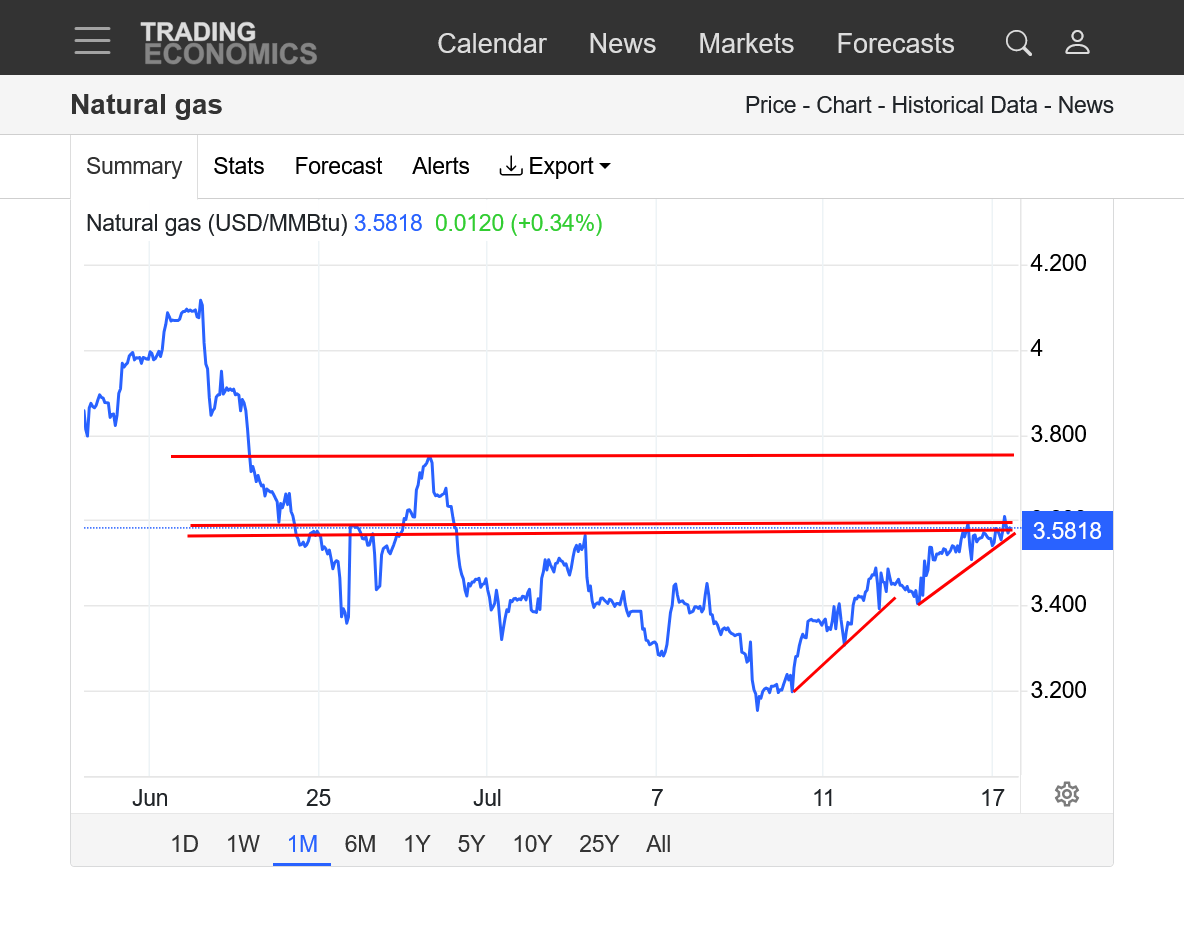
Significant July 9th low with new HOTTER weather pattern driving the uptrend line(s) after that. Hitting some resistance here. Next resistance is just below 3.8.
Lines on a chart are mainly based on what a commodity/stock did in the past.
1. 1 month. Uptrend since the July 9th low.
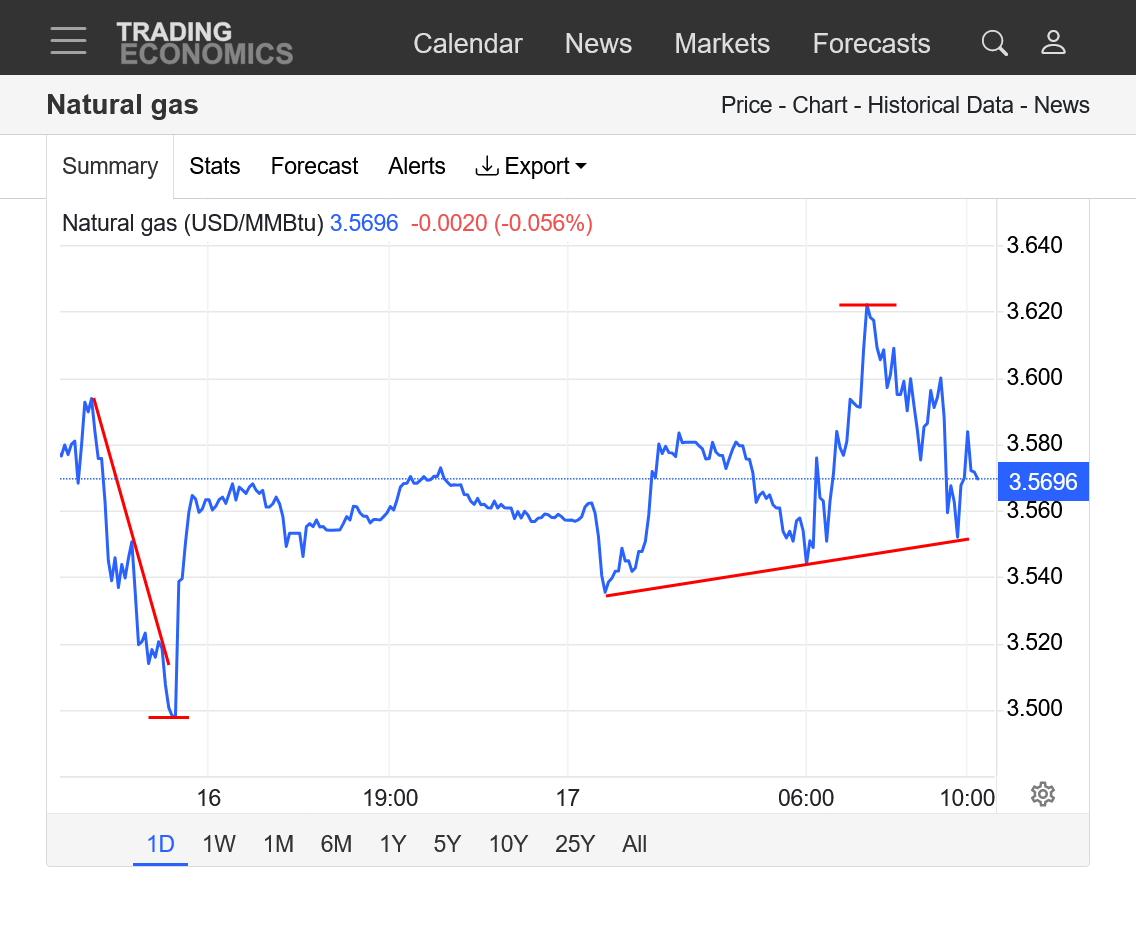
2. 1 day: Spike down -$900 Wed from less hot 12z GEFS. Than back to grinding higher from the HOTTER pattern coming up. 7:30 am high earlier this morning. Under pressure after the release of the EIA number, with the initial spike lower testing the little uptrend line.
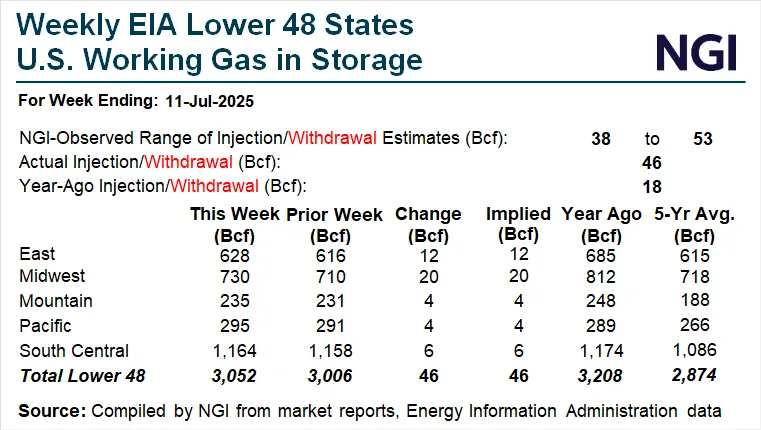
Natural Gas Futures Stumble Slightly as Inventory Build Matches Expectations
The U.S. Energy Information Administration (EIA) reported a 46 Bcf net injection of natural gas into storage for the week ended July 11, a result that aligned with consensus estimates and sent futures modestly lower.
By Andrew Baker
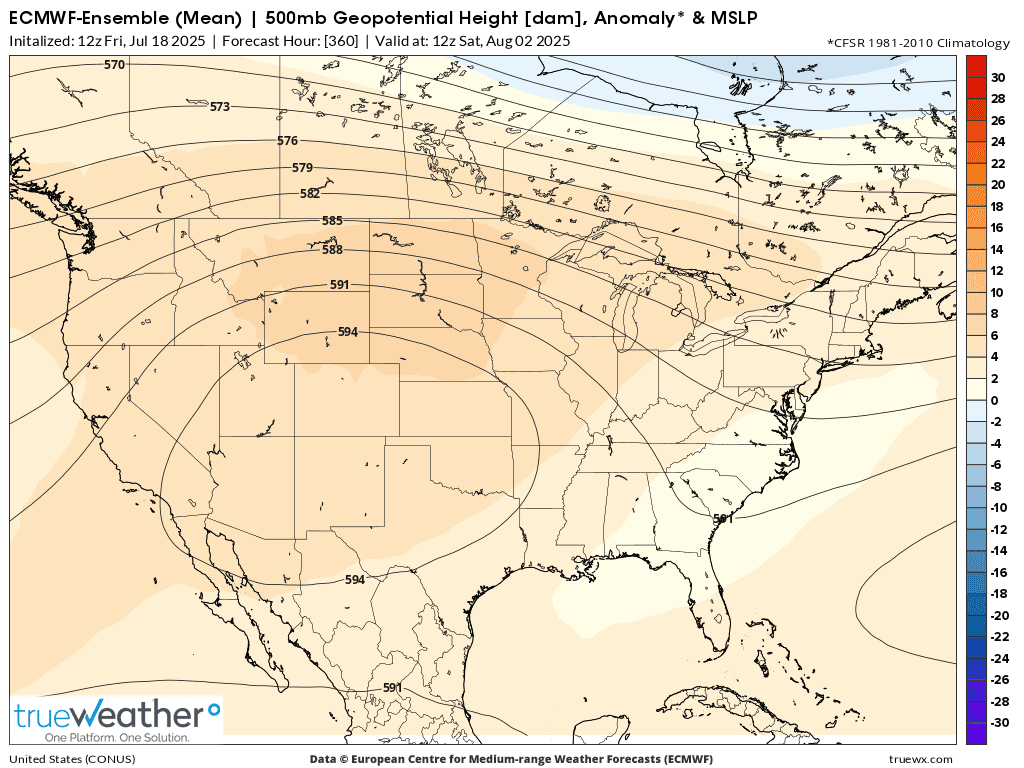
Temps continue very hot next week, then still hot but not AS hot in week 2 as the heat ridge/dome backs up farther west again, towards the Southern Rockies . Overall still bullish weather.
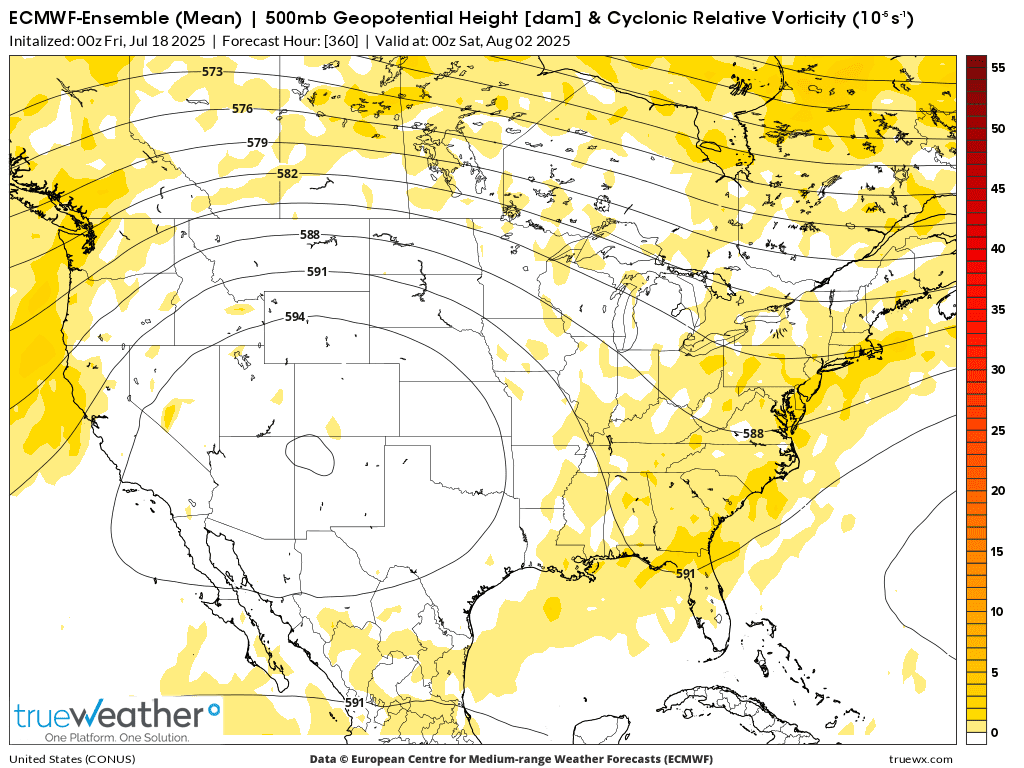
1. This was the last 0z European Ensemble model CDDs on the right in purple. Close to the previous 12z run from 12 hours earlier.
2. August 2nd 500 mb map with vorticity. Any vorticity perturbations coming around the periphery of the dome will trigger clusters of shwrs/tstorms.
I'll disagree with this just out LOW skill week 3-4 forecast since the latest end of week 2 guidance is backing up the dome farther west (along with most guidance after that) NOT putting it this far east and has troughing in the east.
If this verifies, however the August weather will be pretty bullish.
https://www.cpc.ncep.noaa.gov/products/predictions/WK34/
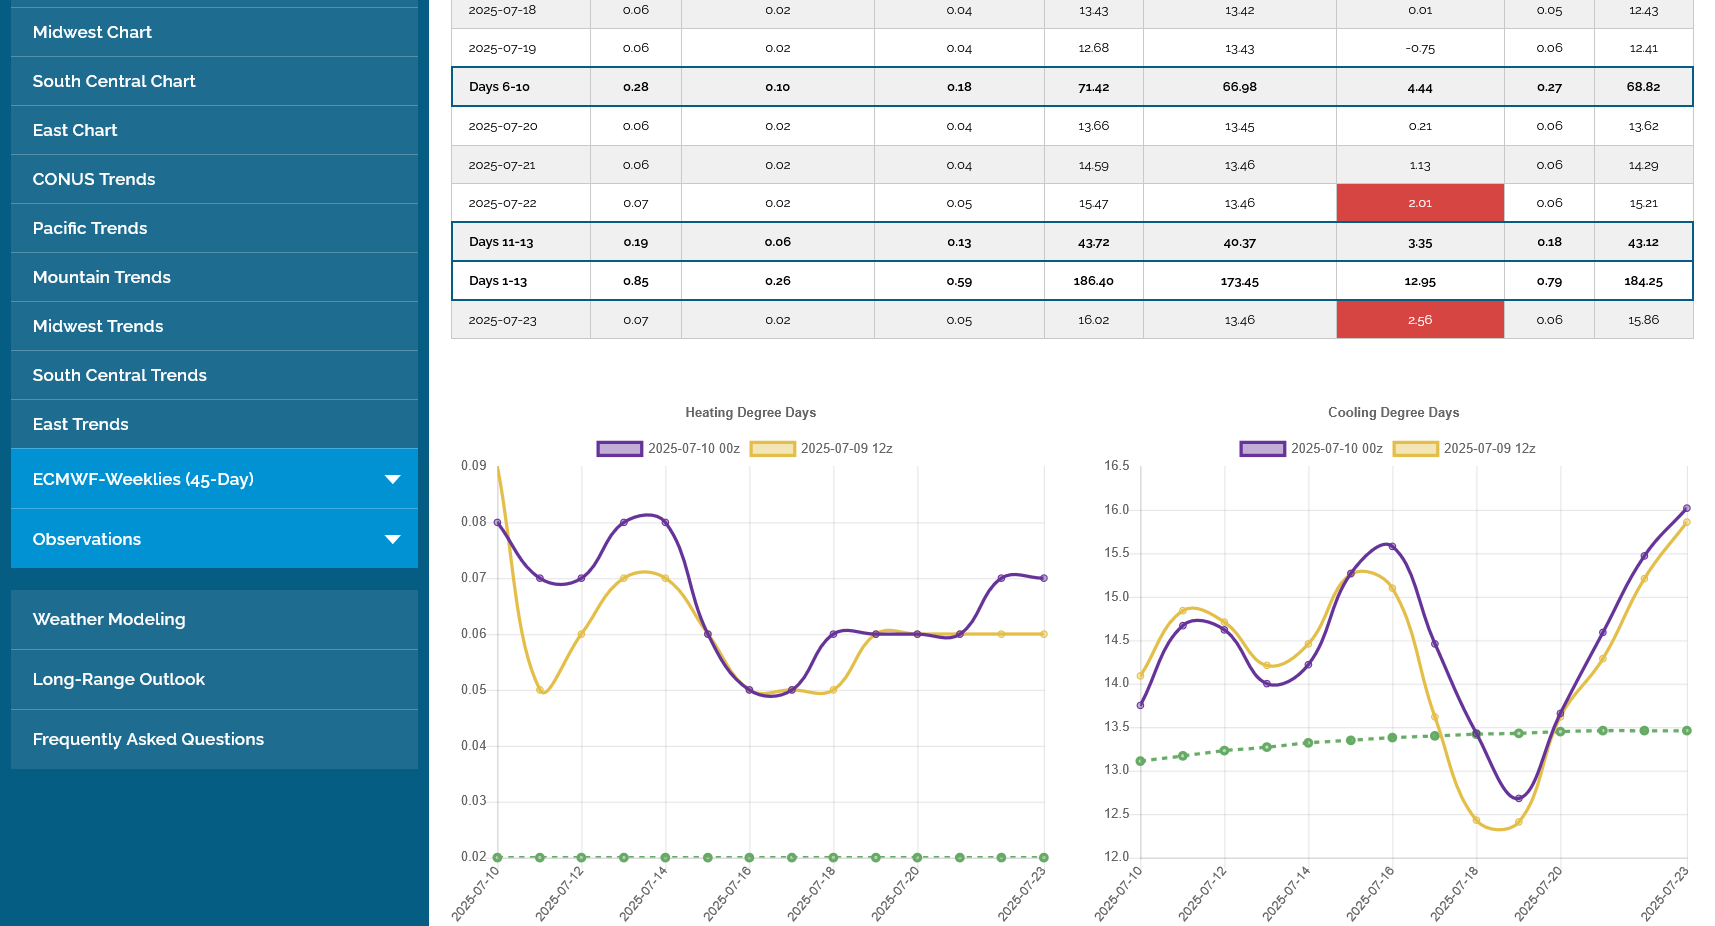
1. The last 12z GEFS, came out MUCH less hot and we spiked lower to new daily lows. Shortly following that, the 12z European Ensemble model came out HOTTER and we spiked back up towards the highs.
2. 12z GEFS model in purple/right -6 CDDs vs previous run 6 hours earlier(last 4 runs)
3. 12z EE model in purple/right ~+3 CDDs vs previous run 12 hours earlier (2 runs)
4. EE 500 mb map on August 2nd. Heat ridge/Dome is retrograding west towards the S/C.Rockies/Plains. Weak troughing along the East Coast.


Sharply lower open expected, probably a break away downside gap lower:
Same bearish/cooler forecast as for the grains.
By metmike - July 20, 2025, 4:34 p.m.
++++++++++
More shortly
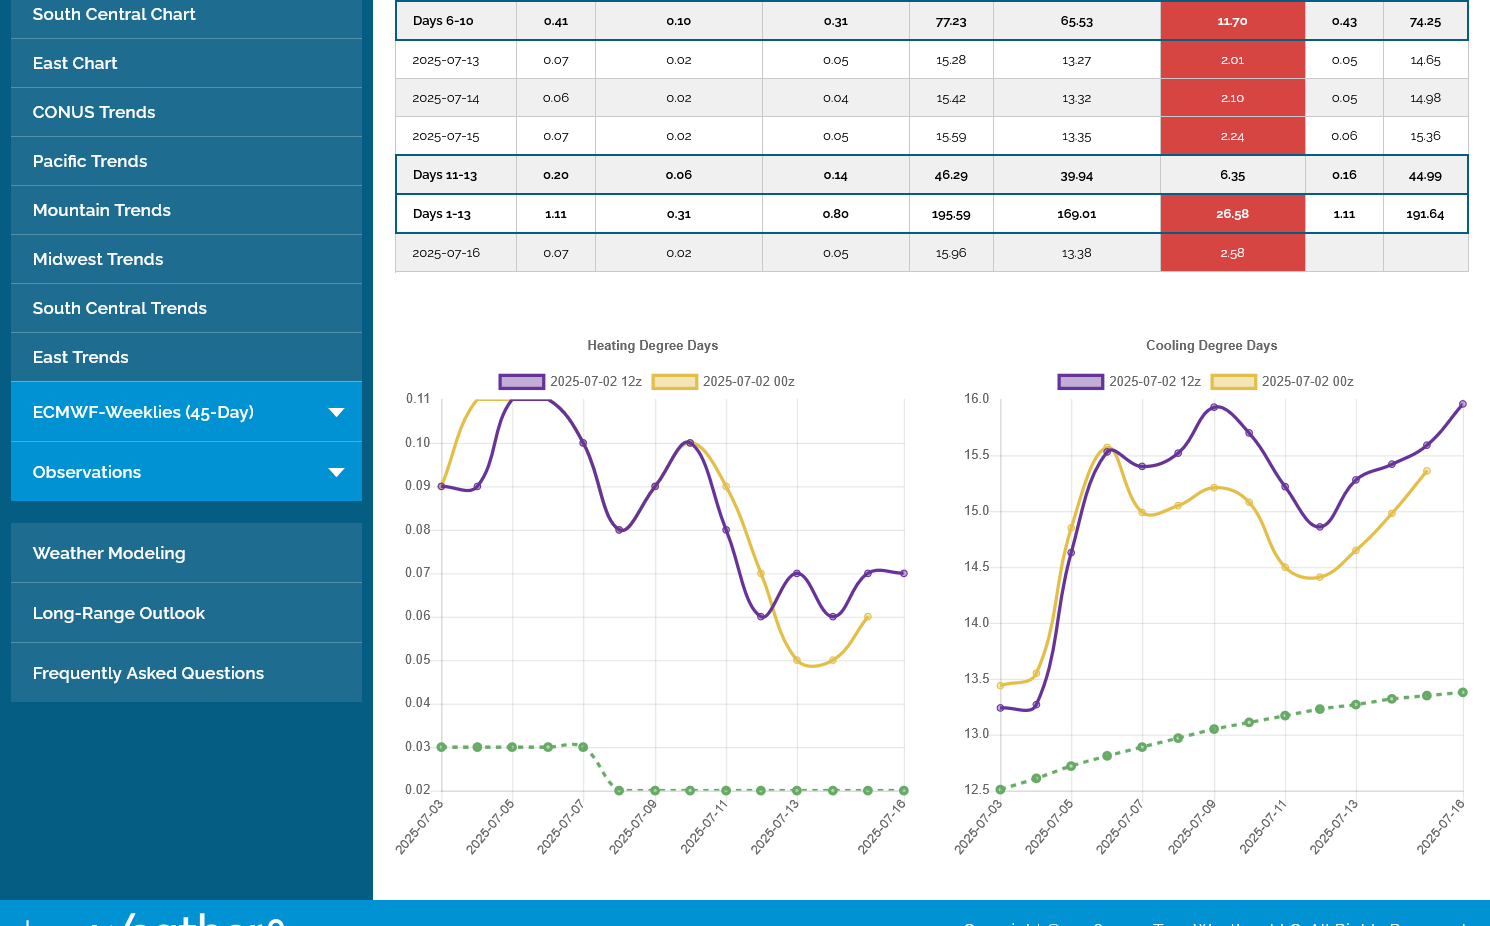
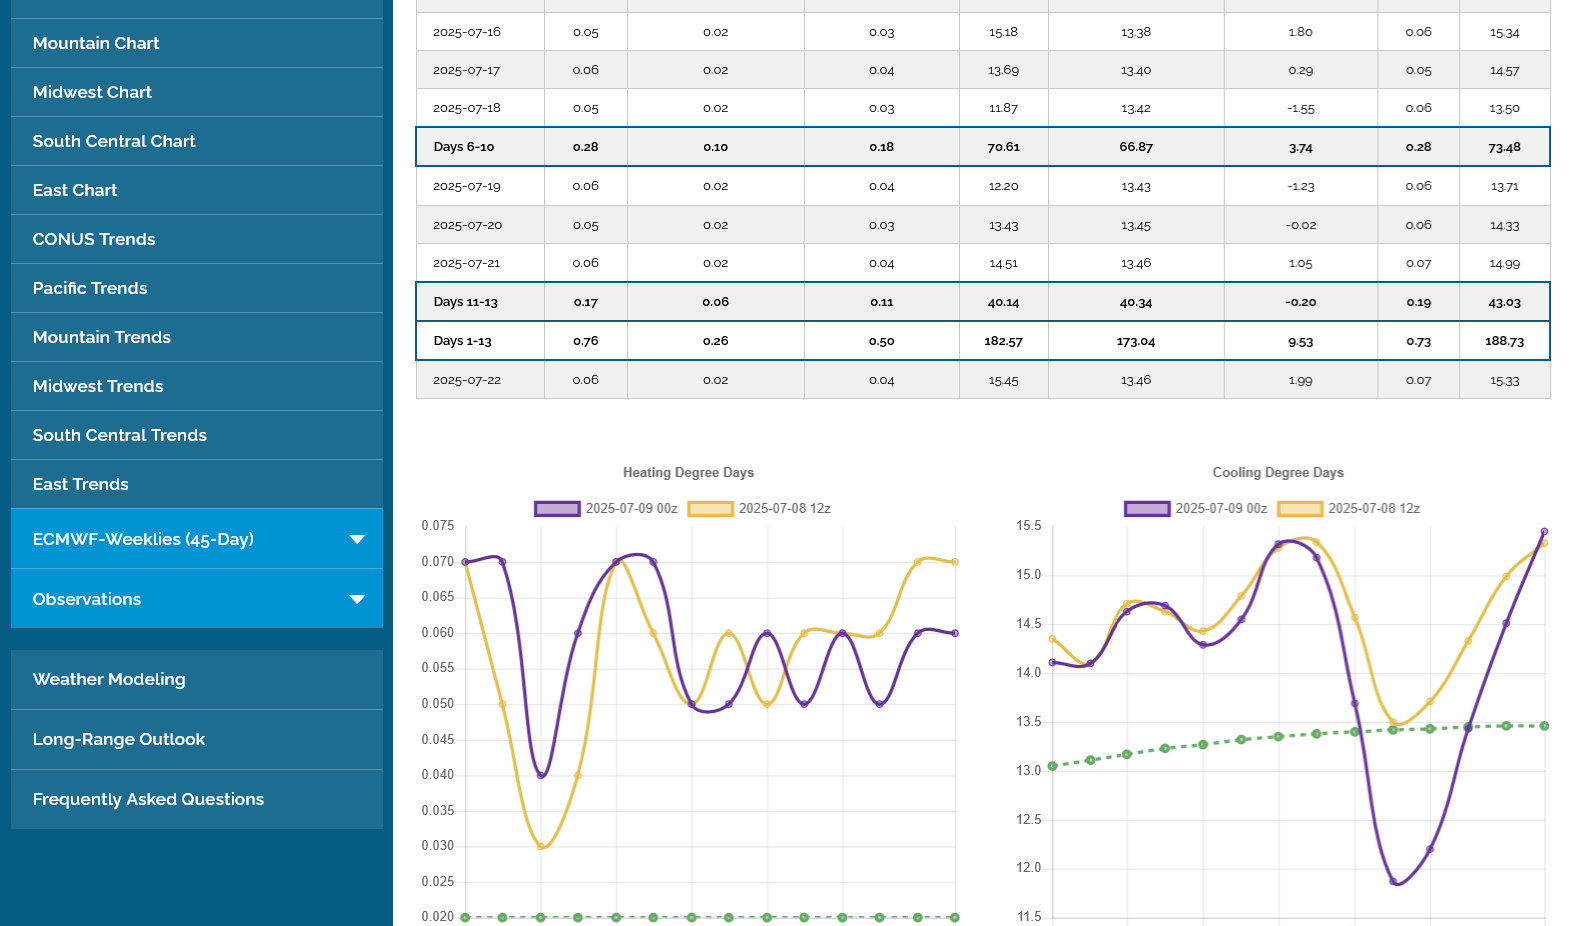
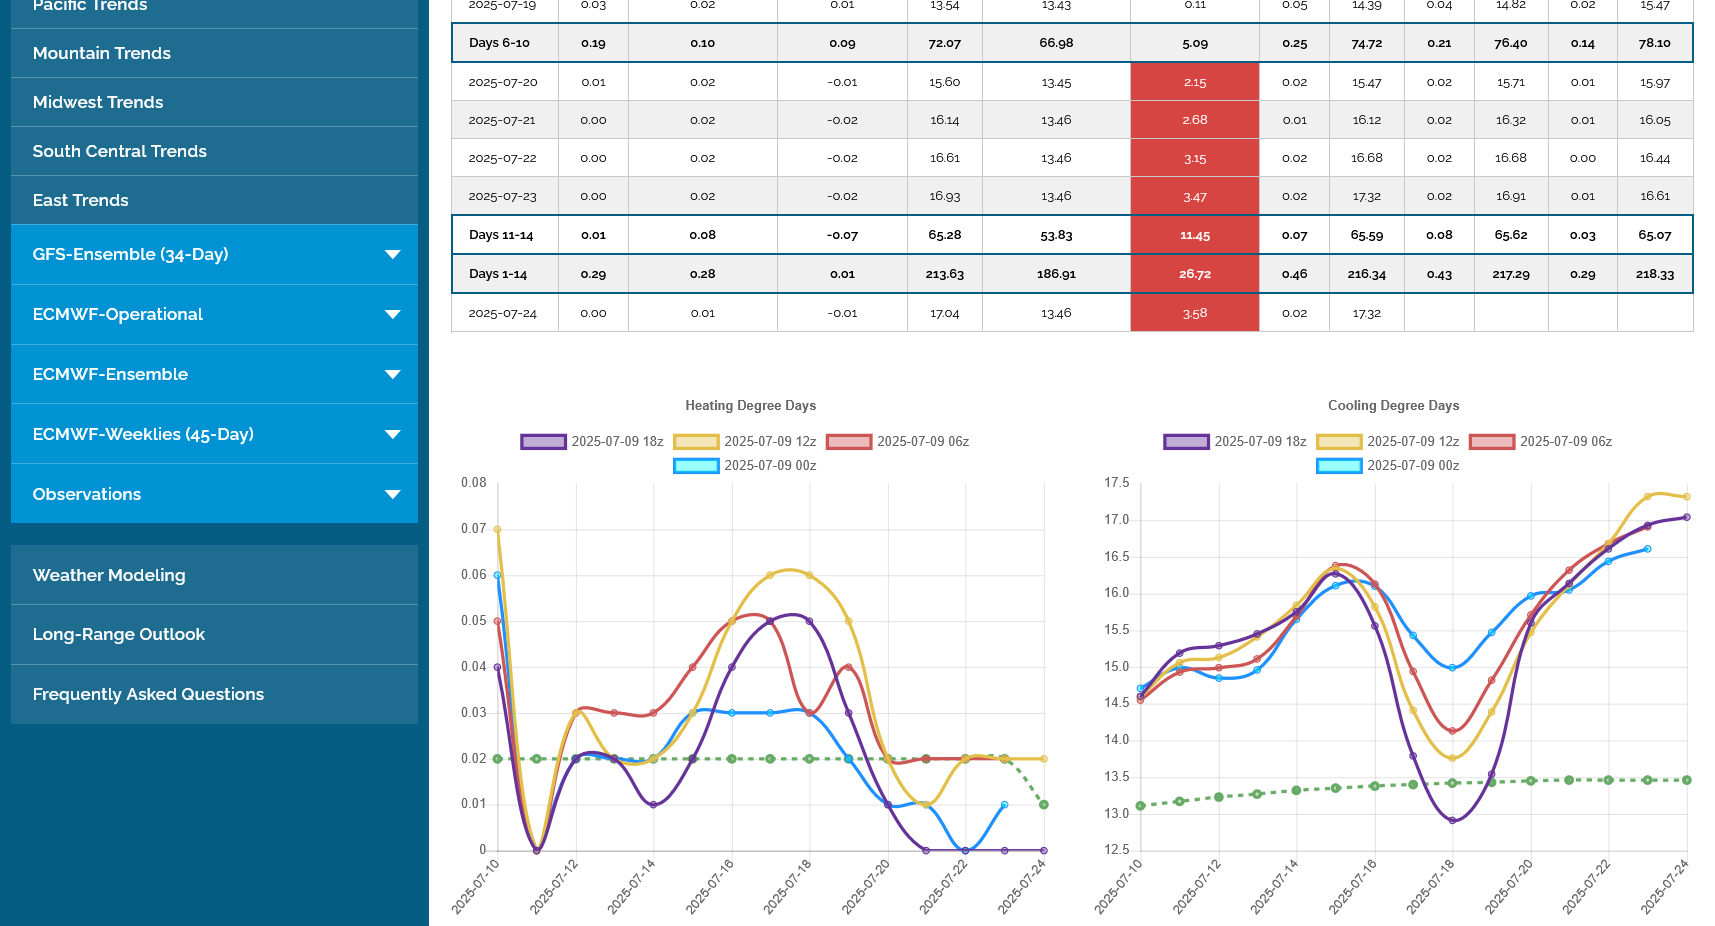
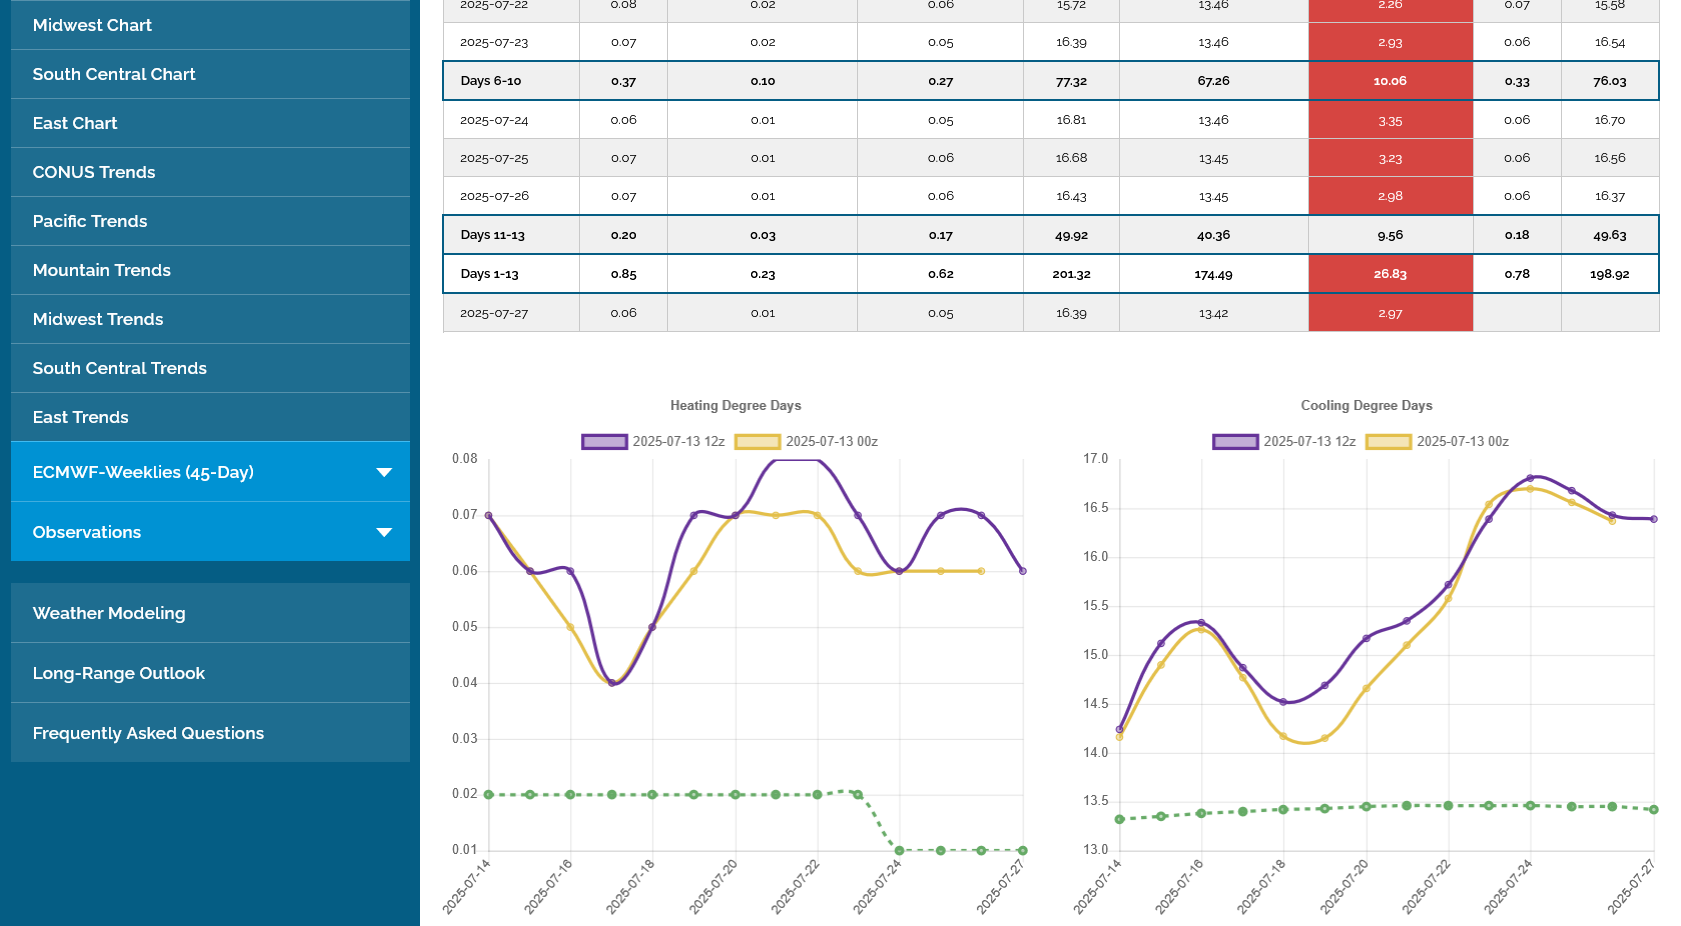
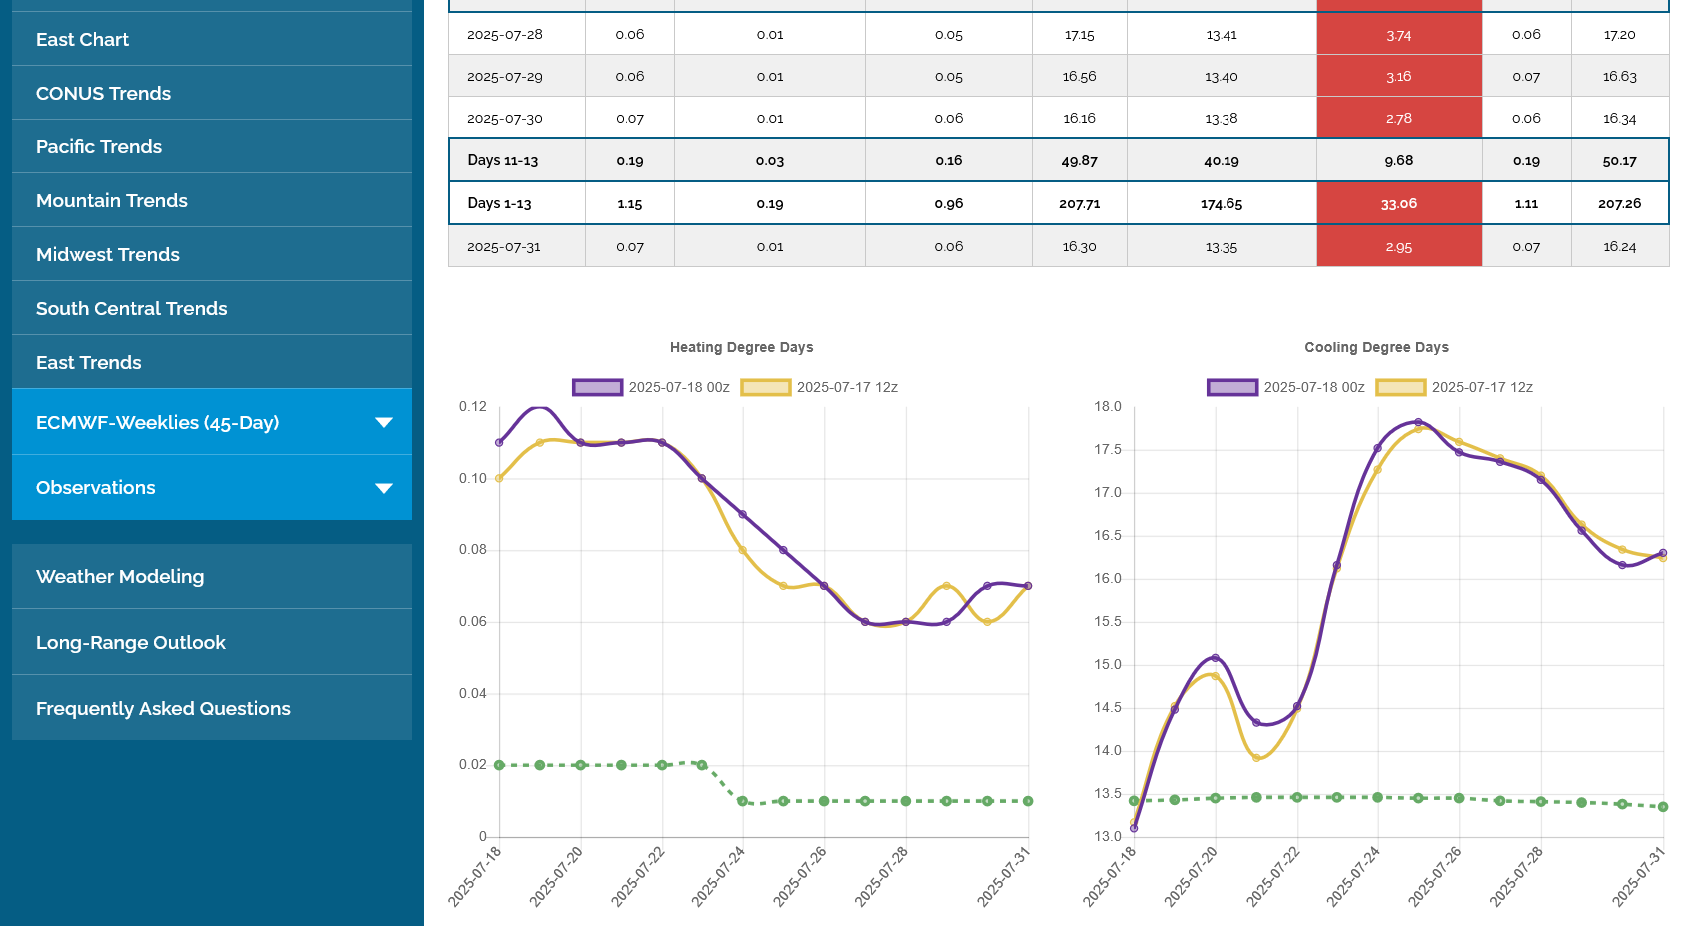
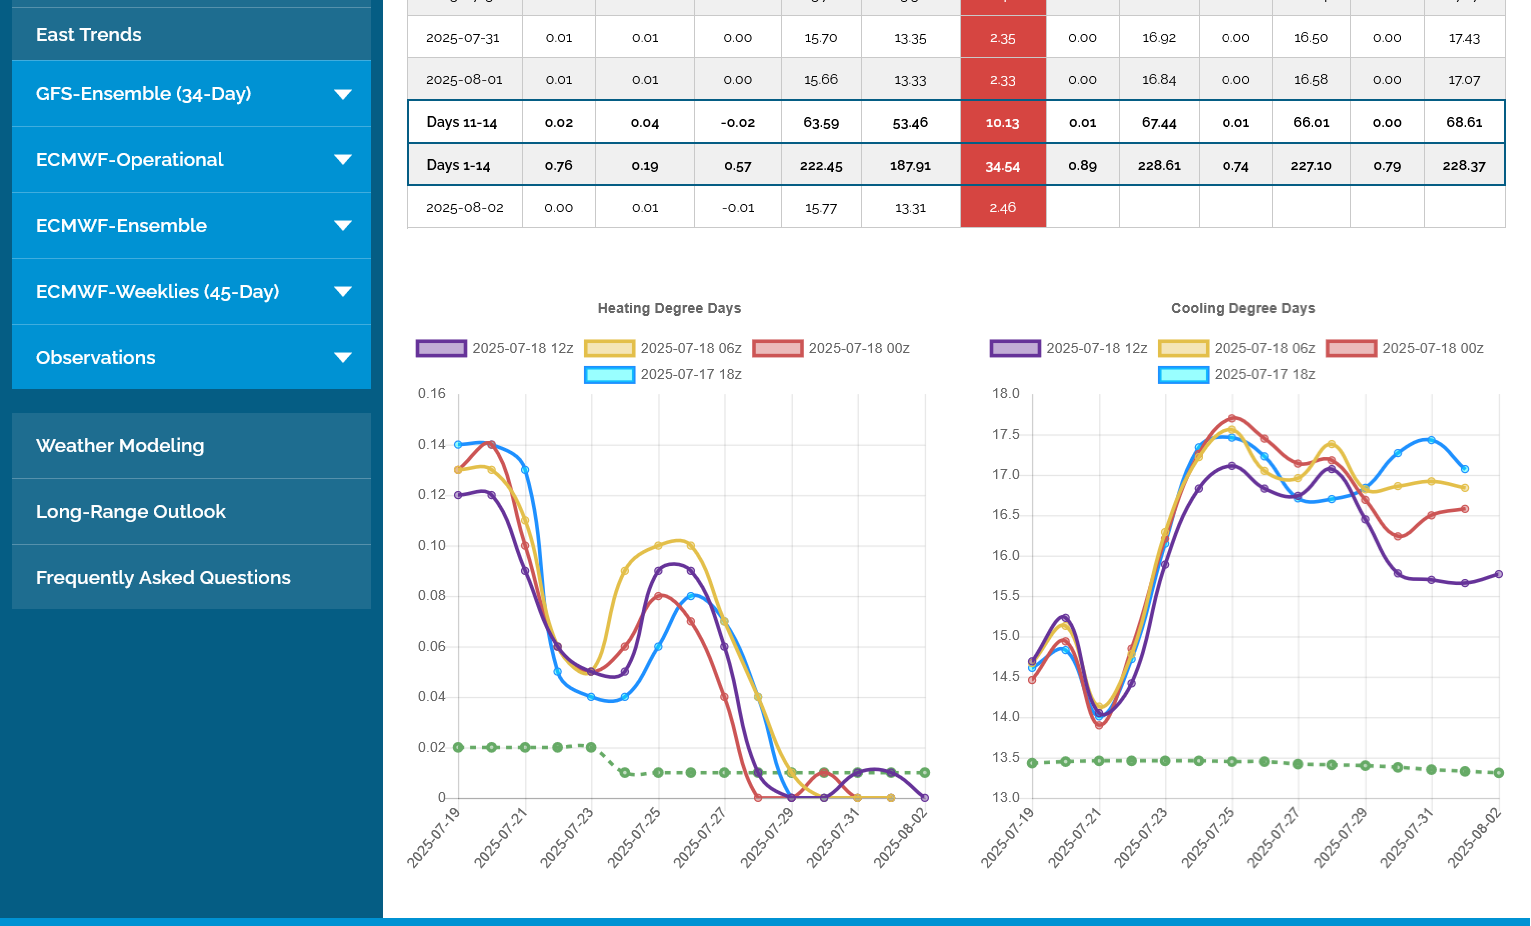
1. The last 12z European Ensemble was -3.5 CDDs vs the previous 0z run.
Note the downward trajectory after the spike higher early this week.
2. This was the last 12z EE run when the market was trading Friday afternoon. Similar to the latest one but on Friday, the CDDs stayed ABOVE 16.5/day in week 2. Now, they drop BELOW 16 /day. The downward trajectory is steeper on the first map but temps still remain pretty hot thru the period. It's also not as hot this weekend as expected.
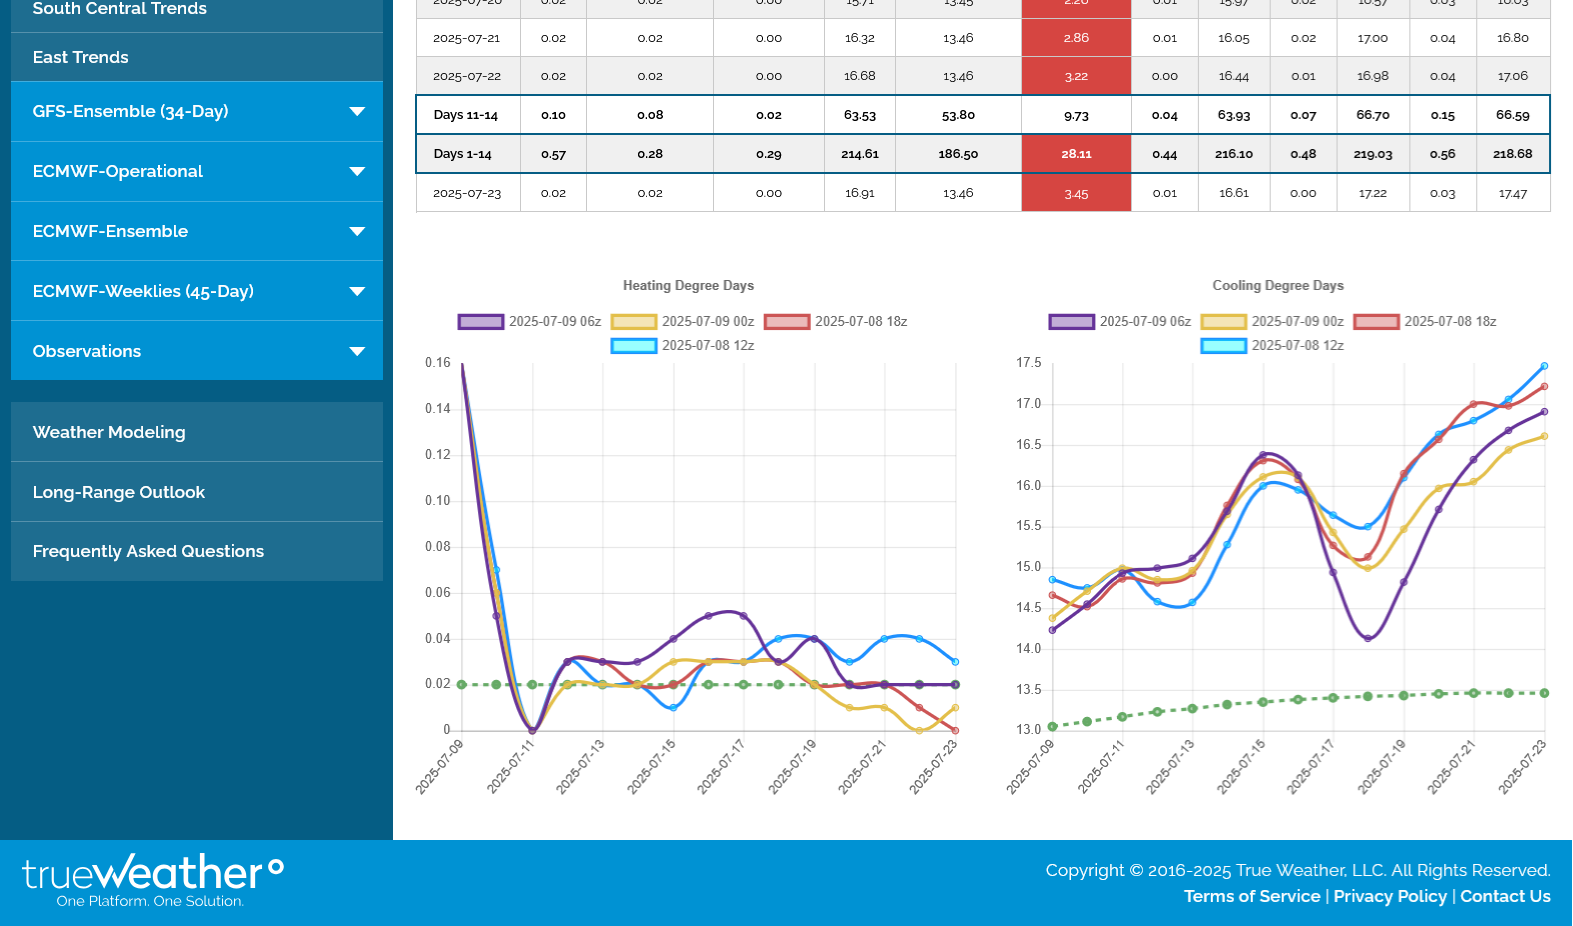
2 days ago below:
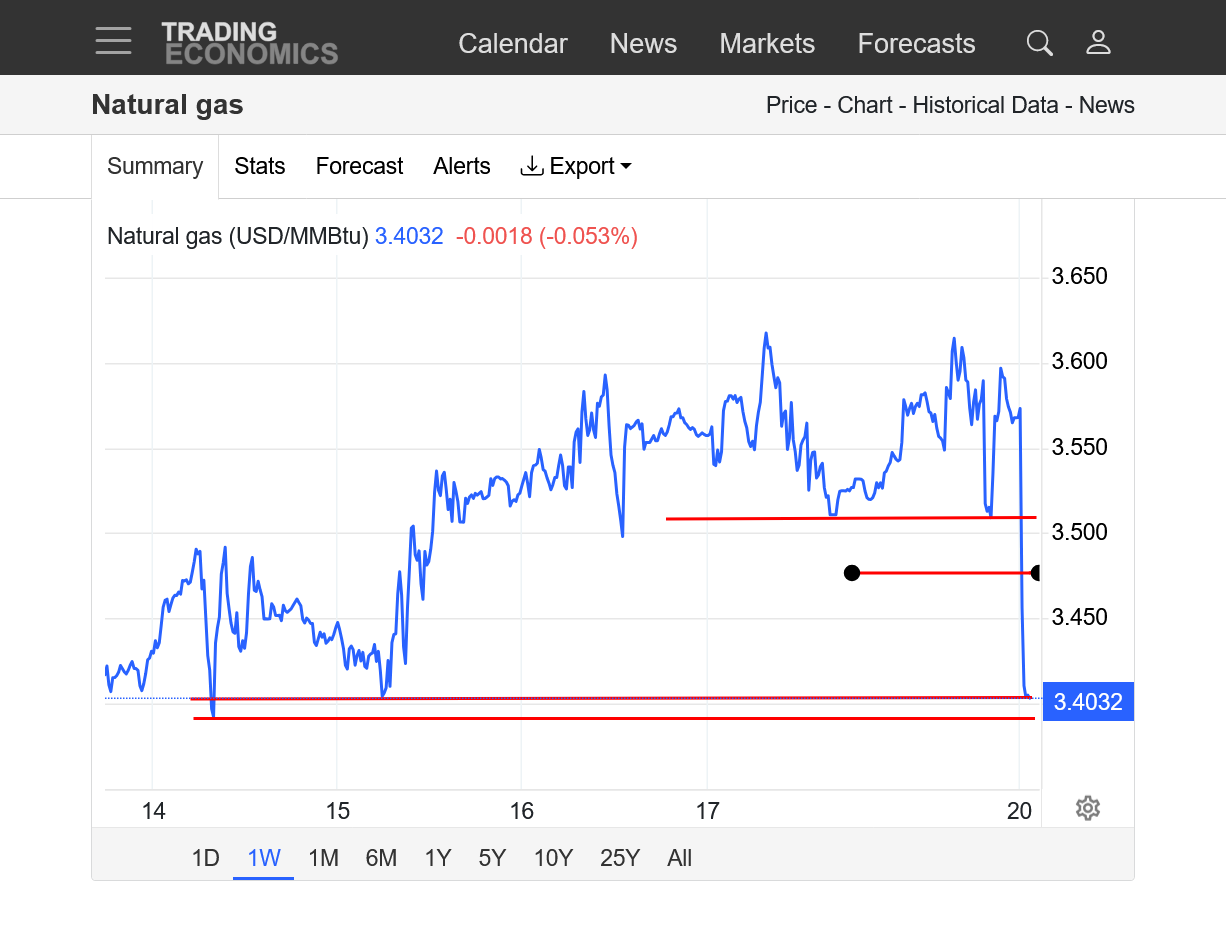
https://tradingeconomics.com/commodity/natural-gas
1. 1 week. Gap lower open this evening at 3475(red line with black circles). 3388 was the low just now. This is a downside breakaway gap lower and VERY bearish chart formation. If it would get filled, then its a gap and crap but with less significance because of the place we're at. Gap and crap exhaustion gaps are most significant at major highs and major lows.
2. 1 year: Cold Winter and sharp uptrend. Head and shoulders top at the end of Winter. Is this a bear flag.
3. 10 years: Symmetrical triangle with lower highs and higher lows.
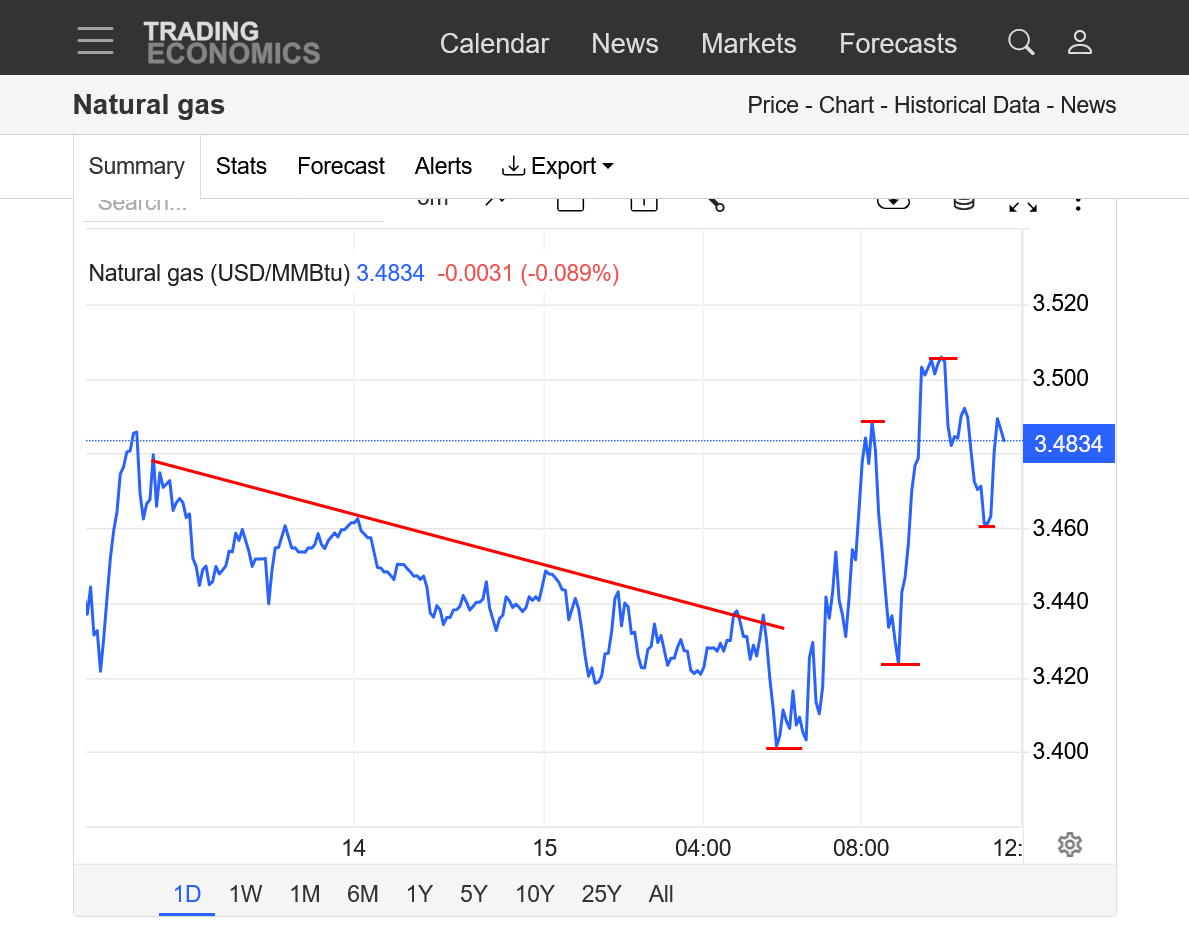
NG continues to be pummeled with an interesting twist between 6am-8am, the time frame that I've mentioned as a favored time for the big traders, using algorithms entering the day trading session to cause crazy price spikes!
https://tradingeconomics.com/commodity/natural-gas
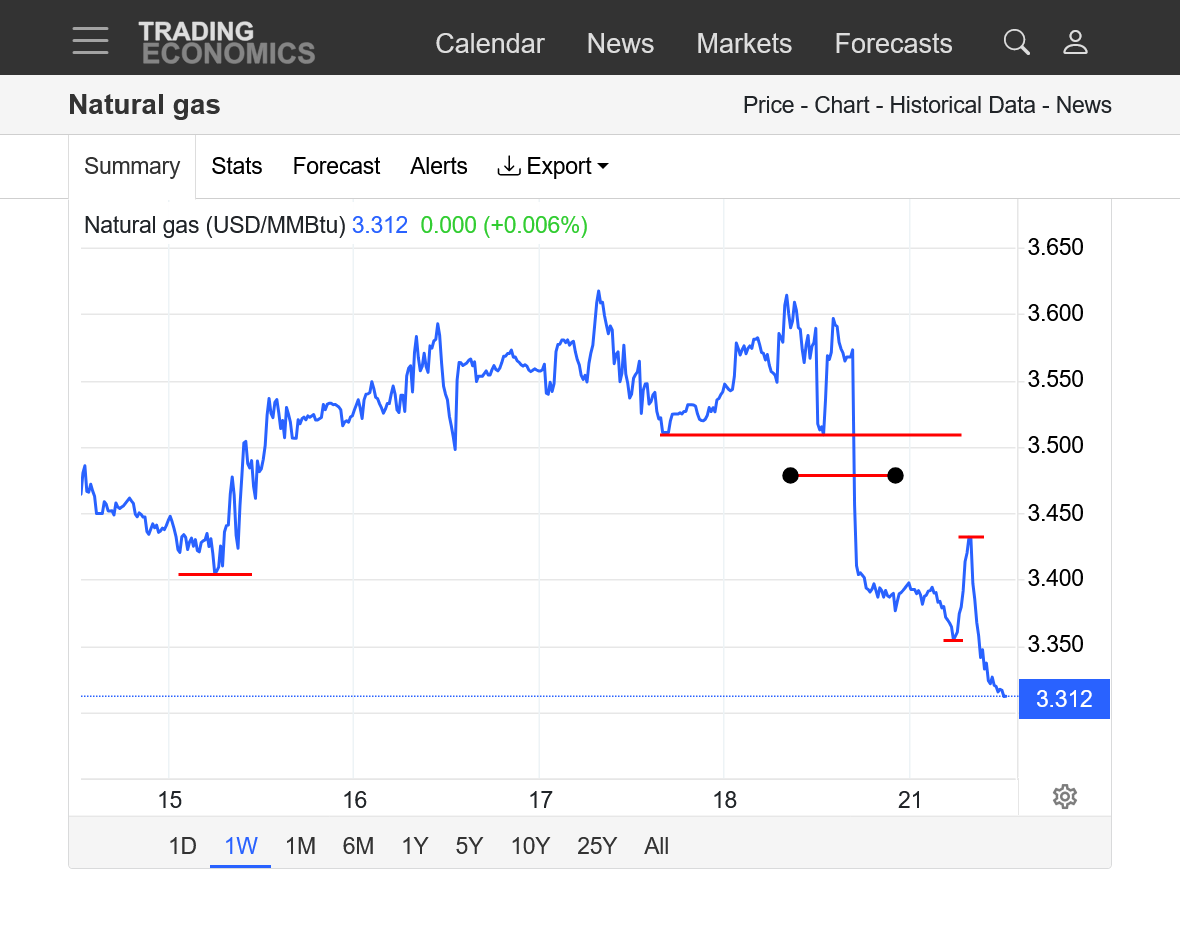
1 week chart:
1. Top line was Friday's lows.
2. 2nd line with black dots was Sunday Nights open and highs. The prices in between that and the top line above it, that were never traded are THE GAP LOWER. Downside break away gap!!
3. 3rd and 4th small lines below that represent trading between 6am and 8am. Spike to new lows ~6am, followed by a spike up of $900/contract, then a spike down by even more than that and the current NEW LOWS.
4. 5th line on the far left is the low/support from last week.
++++++++++++++
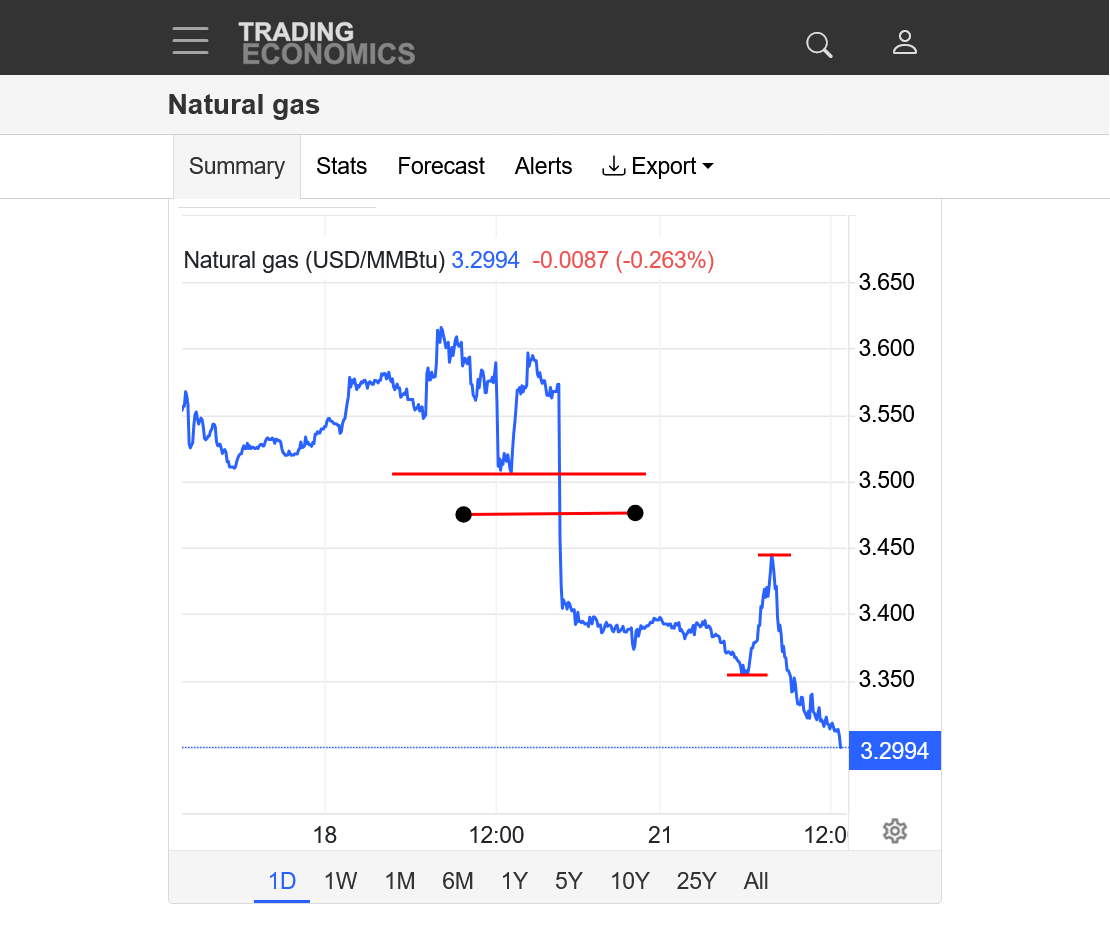
1 day chart:
1. Shows all the same price feature but on a shorter time frame that results in an amplified visual impact. The price continues to crash lower and confirming the gap lower last night as a powerful, downside break away gap.
CDDs plunged even more overnight.
This was the last 0z European Ensemble model in purple on the right. -7 CDDs compared to the previous run!!!!
What has happened is the same thing that has been happening all Summer to prevent the "Dome of Death" from moving into the Midwest. THE NORTHERN STREAM WAS UNDERPREDICTED at longer time frames(week2 ) again!
These were the last 2 run of the European Ensemble model. The last run is in purple. Incredible compared to the week 2 forecast last week! As I mentioned earlier this month, the models have been completely busting on northern stream energy all Summer!!!
July 20 CDDs below:
This heat tapers off but temps remain well above average when the latest forecast above features CDDs dropping off a cliff and ALL of week 2 average temps and even a couple of day BELOW average.
I don't remember this big of a cool change so fast in the Summer!

+++++++++++++
What's interesting is that the northern stream will be so STRONG and bump the dome waaay out of the picture the the northwest flow around the dome will shift so far west and the flow from Canada so dry, that rains will probably go below average in the cooler air in the Great Lakes and Eastern Cornbelt.
Look at the HUGE upper level low in 8 days on this last 12z EE. WOW!! This will be the source of some very cool air in the East, spilling back to the Midwest!!
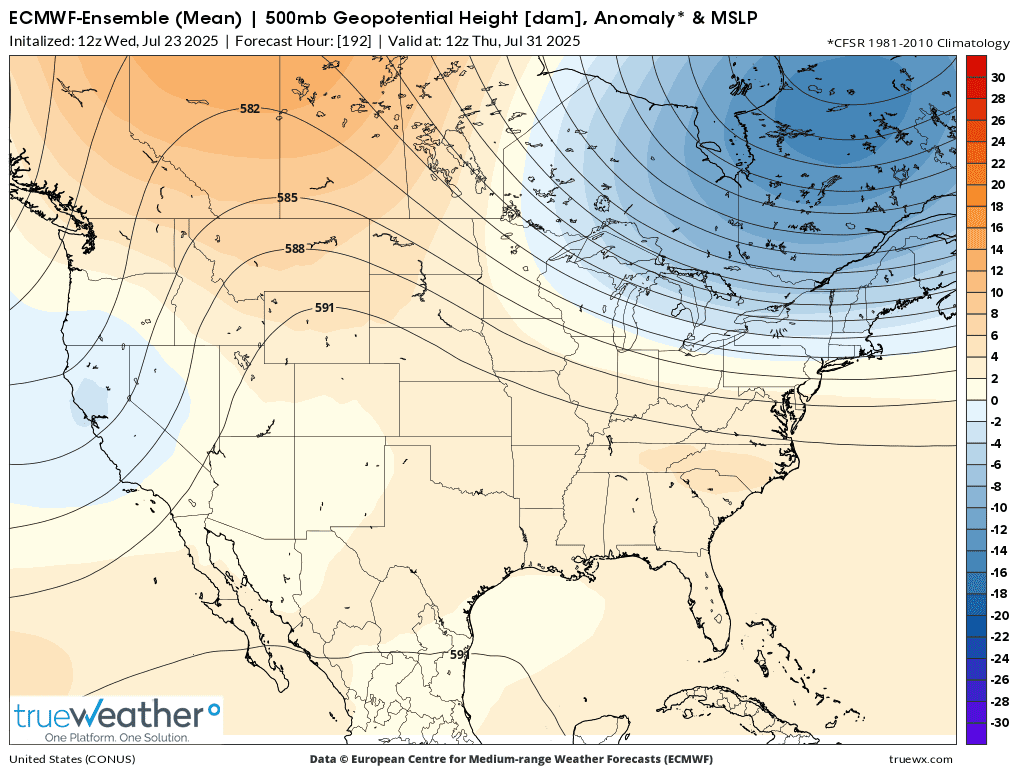
This was the same forecast 5 days ago. WOW!!!
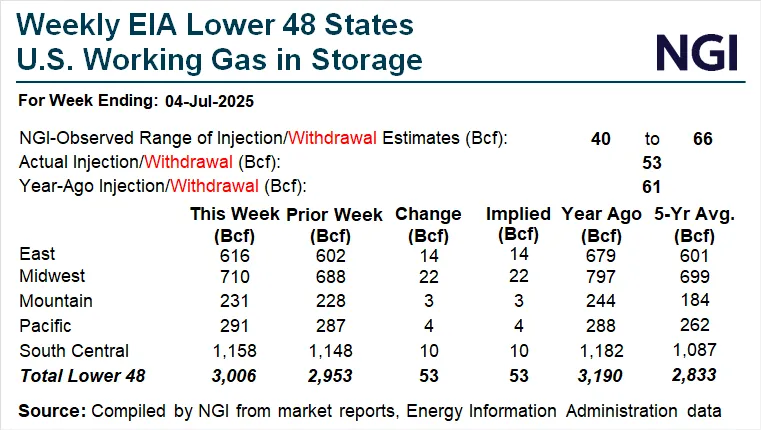
Should be a small injection but the market knew this a couple of weeks ago!
https://www.cpc.ncep.noaa.gov/products/tanal/temp_analyses.php
+++++++++++++++
https://ir.eia.gov/ngs/ngs.html
![]()
for week ending July 18, 2025 | Released: July 24, 2025 at 10:30 a.m. | Next Release: July 31, 2025
| Working gas in underground storage, Lower 48 states Summary text CSV JSN | |||||||||||||||||||||||||
|---|---|---|---|---|---|---|---|---|---|---|---|---|---|---|---|---|---|---|---|---|---|---|---|---|---|
| Historical Comparisons | |||||||||||||||||||||||||
| Stocks billion cubic feet (Bcf) | Year ago (07/18/24) | 5-year average (2020-24) | |||||||||||||||||||||||
| Region | 07/18/25 | 07/11/25 | net change | implied flow | Bcf | % change | Bcf | % change | |||||||||||||||||
| East | 634 | 628 | 6 | 6 | 695 | -8.8 | 630 | 0.6 | |||||||||||||||||
| Midwest | 746 | 730 | 16 | 16 | 825 | -9.6 | 736 | 1.4 | |||||||||||||||||
| Mountain | 239 | 235 | 4 | 4 | 251 | -4.8 | 191 | 25.1 | |||||||||||||||||
| Pacific | 297 | 295 | 2 | 2 | 289 | 2.8 | 266 | 11.7 | |||||||||||||||||
| South Central | 1,159 | 1,164 | -5 | -5 | 1,168 | -0.8 | 1,080 | 7.3 | |||||||||||||||||
| Salt | 325 | 335 | -10 | -10 | 314 | 3.5 | 291 | 11.7 | |||||||||||||||||
| Nonsalt | 834 | 829 | 5 | 5 | 854 | -2.3 | 790 | 5.6 | |||||||||||||||||
| Total | 3,075 | 3,052 | 23 | 23 | 3,228 | -4.7 | 2,904 | 5.9 | |||||||||||||||||
| Totals may not equal sum of components because of independent rounding. | |||||||||||||||||||||||||
Working gas in storage was 3,075 Bcf as of Friday, July 18, 2025, according to EIA estimates. This represents a net increase of 23 Bcf from the previous week. Stocks were 153 Bcf less than last year at this time and 171 Bcf above the five-year average of 2,904 Bcf. At 3,075 Bcf, total working gas is within the five-year historical range.
For information on sampling error in this report, see Estimated Measures of Sampling Variability table below.
Note: The shaded area indicates the range between the historical minimum and maximum values for the weekly series from 2020 through 2024. The dashed vertical lines indicate current and year-ago weekly periods.
NG appears to be up at least a little. But it’s hard to tell on Investing.com how much because the highest volume month may have changed from August on Fri to Sept this evening, which Investing.com doesn’t tell you.
Investing.com says NG is up only 2 cents (~0.5%) whereas the chart shows prices up ~7 cents (+3.3%).
Investment.com shows one continuous chart of the highest volume month as opposed to a group of months.
Mike, what say you?
Larry, you nailed it on the reason. Last trading day for August is coming up(+.08c, volume 1,600) and September has much more volume now (+.17, volume 5,550).
Thanks, Mike
It looks like NG fell ~6 cents since my last post. Bearish 0Z GEFS and/or EE?
You nailed it again, Larry!!
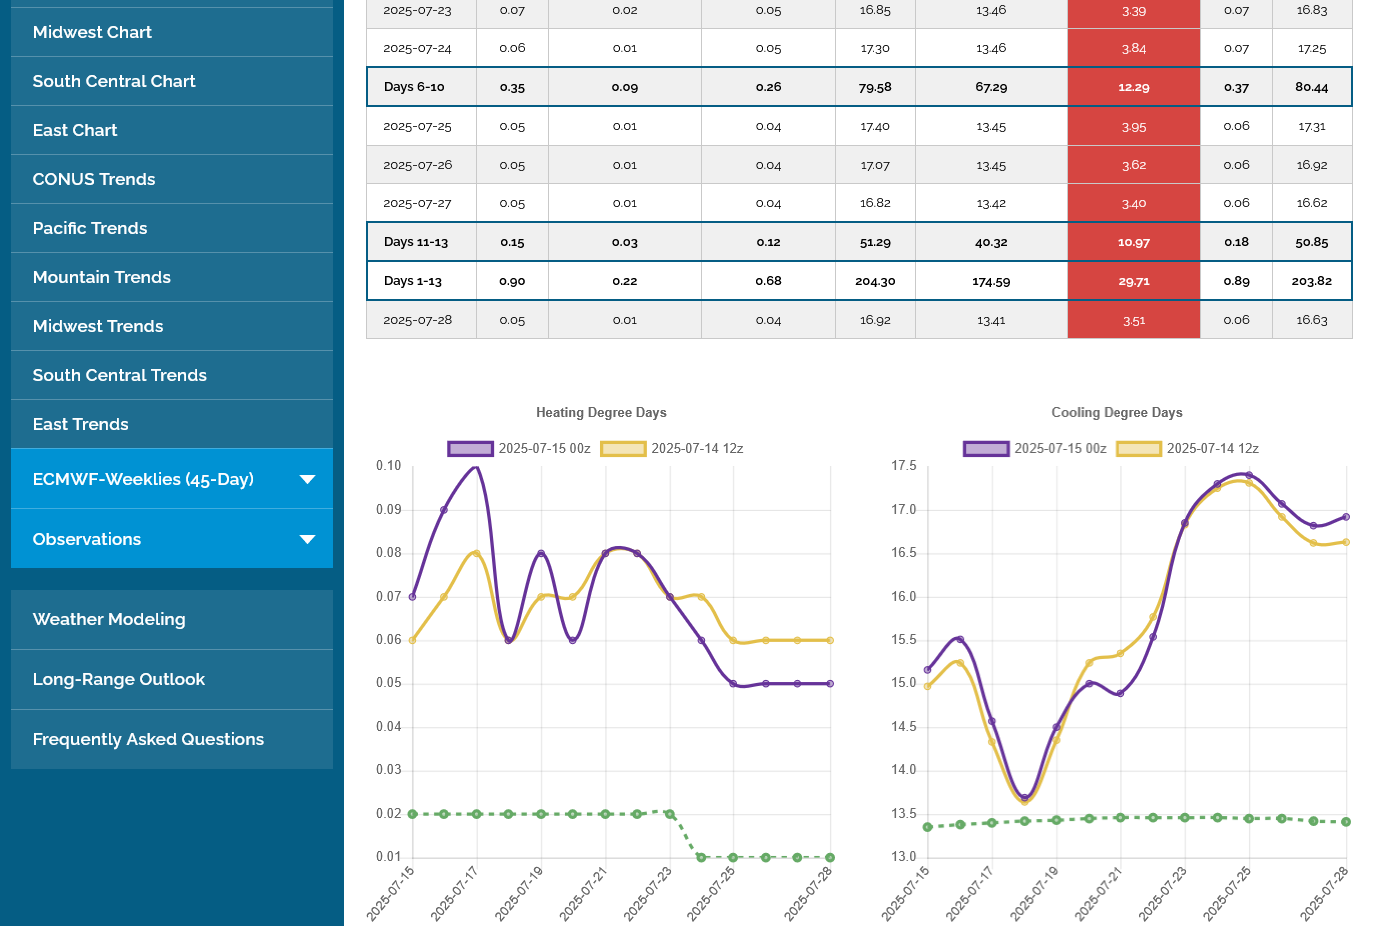
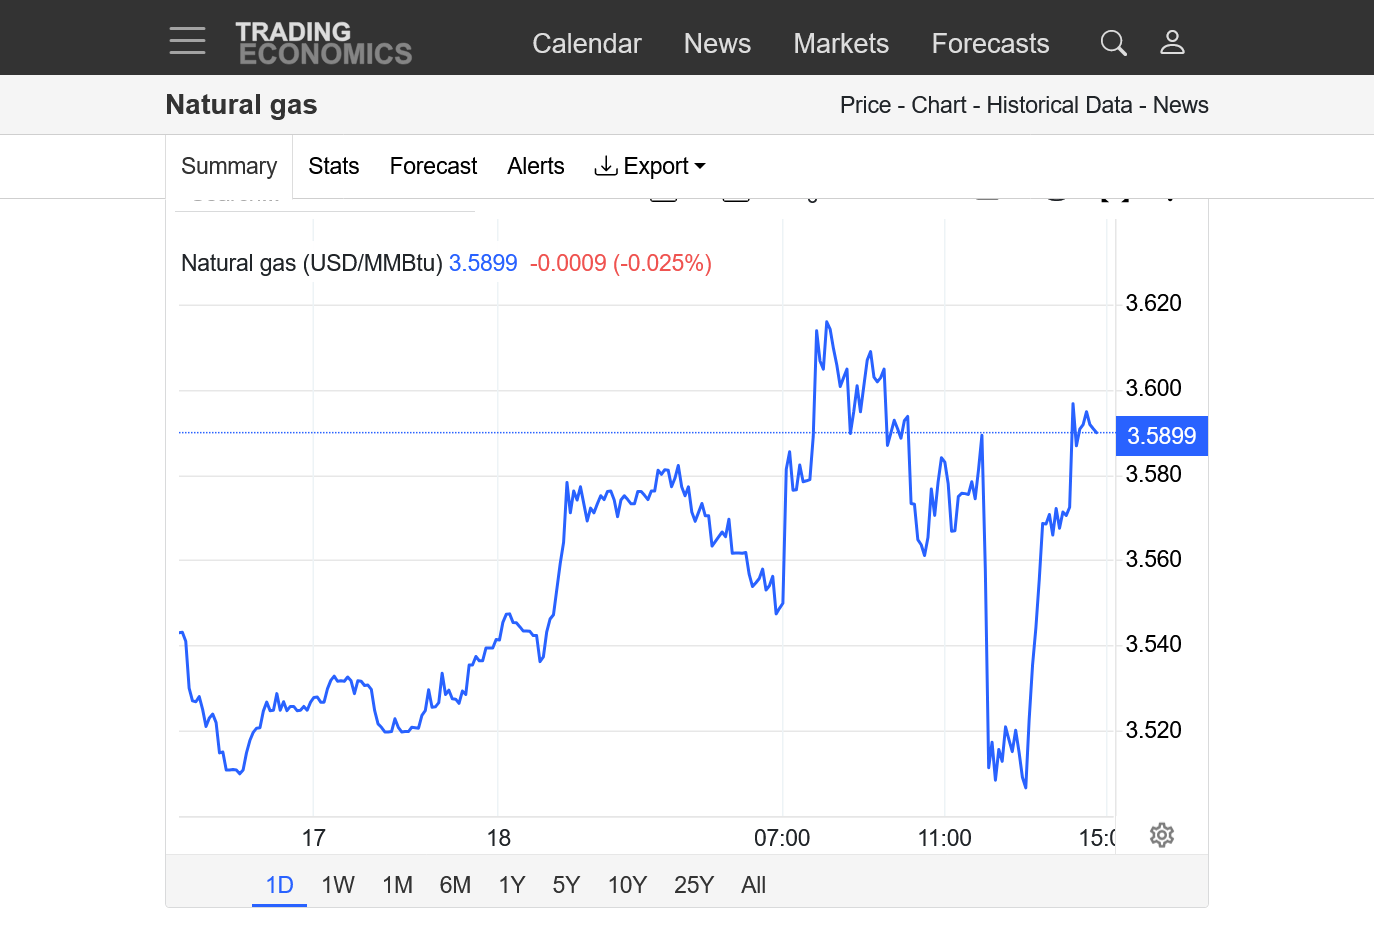
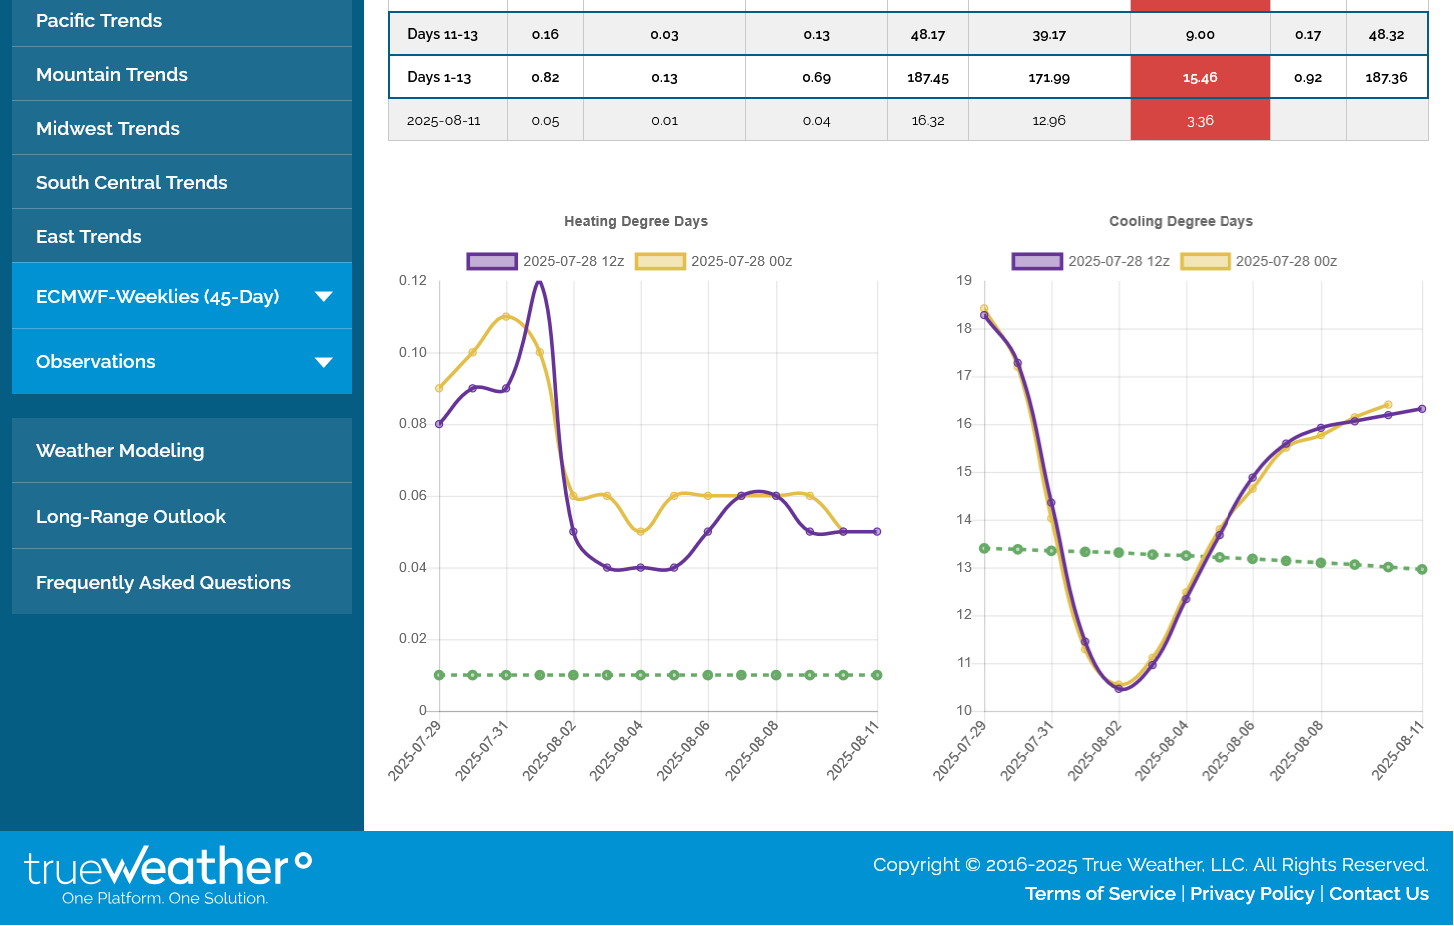
The last 0z European Ensemble, in purple on the right was -3.6 CDDs vs the previous 12z run from 12 hours earlier!
I graphed the last day's worth of prices below with red lines at significant time frames, all in CDT.
https://tradingeconomics.com/commodity/natural-gas
1. 5:01 pm- Lower open and lows for Sunday Evening. Cool weather later this week dialed in on the open.
2. 7pm: highs for the session, then the 18z GEFS came out -4.6 CDDs vs the previous 12z run and we started the drop.
3. Midnight: 0z GEFS was coming out ANOTHER -4.5 CDDs vs that last 18z run, now -9.1 CDDs compared to 2 runs earlier, so the market dropped more.
4. 1am: Oz EE was coming out -3.6 CDD so we dropped even more
5. 2am: bearish updates on the 0Z runs completely out, Price just below the open now.
6. 5am: new lows
Volume for the soon to be NEW front month, September is now 4 times the volume for the soon to expire August.
Last trading day for August, is tomorrow 7-29-25!
https://www.cmegroup.com/markets/energy/natural-gas/natural-gas.calendar.html
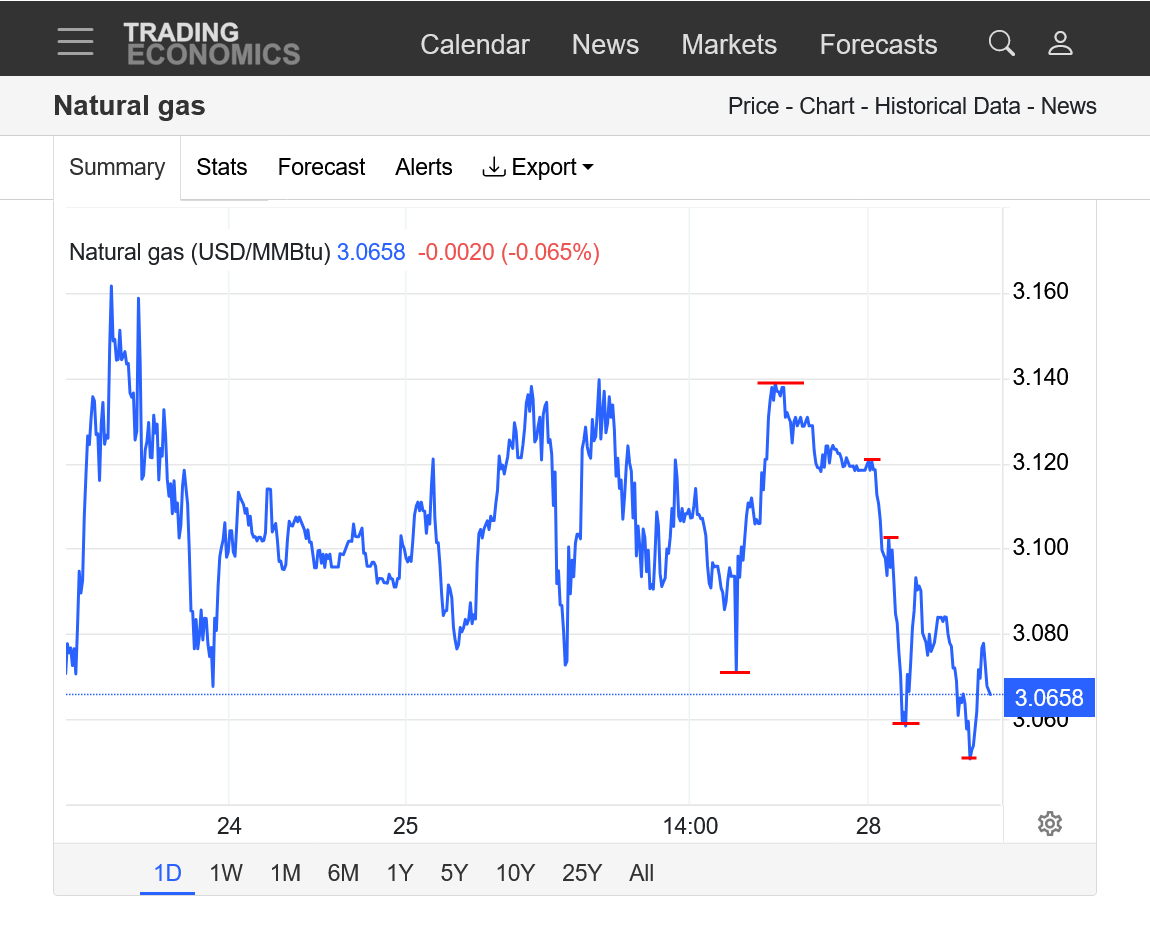
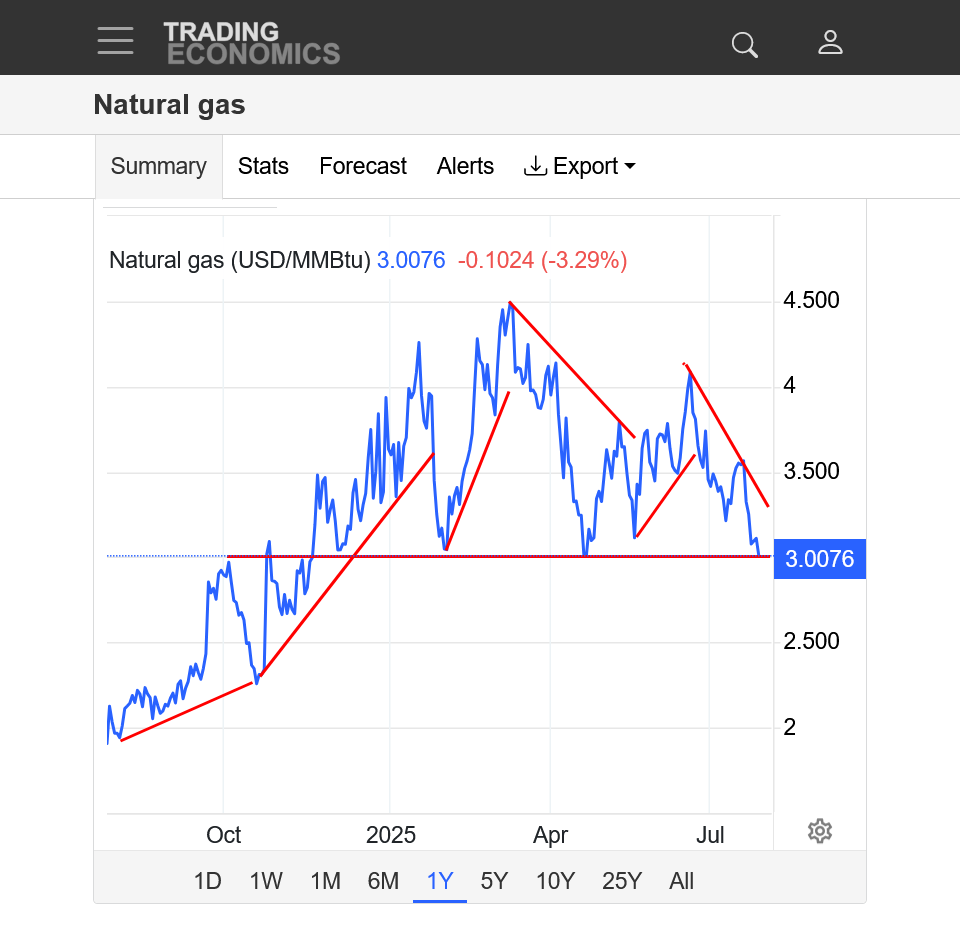
More analysis as we've made new lows and are around the lowest prices of the year(close to the April lows).
https://tradingeconomics.com/commodity/natural-gas
1. 1 day-new lows midday
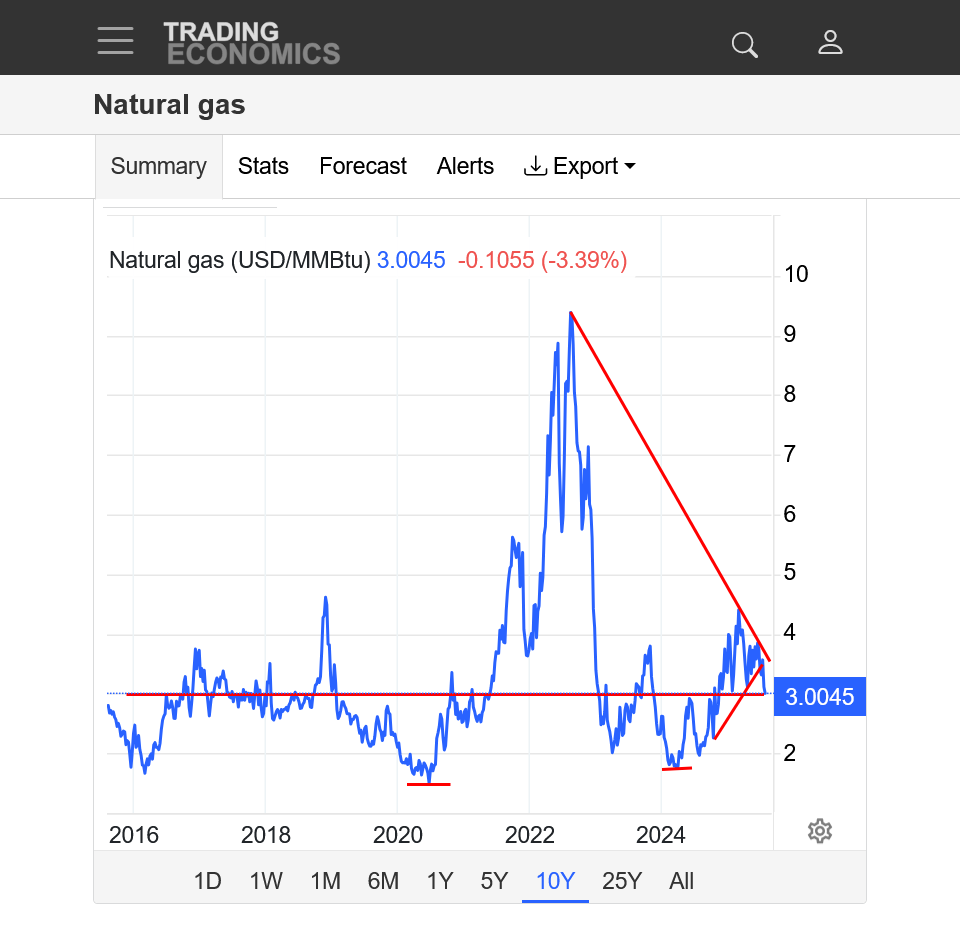
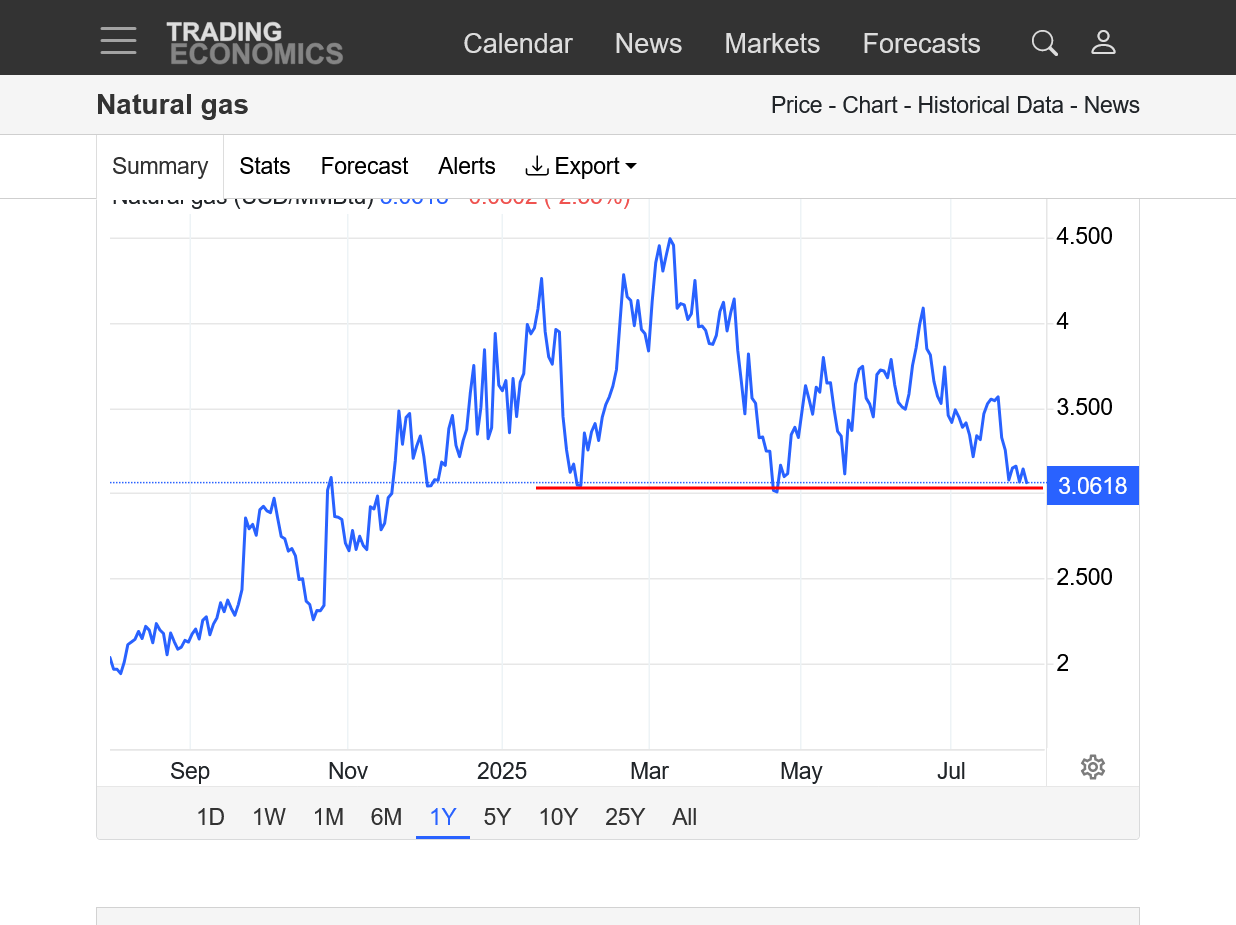
2. 1 year- $3 MAJOR support. Each trend line, mostly represents an extended period of unusual cold or heat. We had some very cold weather last Winter that caused storage to drawn down significantly by the end of Winter. This was followed by a very cool Spring(especially May) intense June heat wave spike us up. This current, short lived heat wave caused a dead cat bounce earlier this month when it showed up. The market was trading and dialing in a near record hot Summer 2 months ago based on forecast models that BUSTED numerous times because of the MUCH stronger northern stream and Upper level troughs in Southeast Canada.
3. 10 years: Significant lows in 2020(COVID) and 2024 from record surplus in storage. Spike high in 2022 from storage to very low levels(record high injections started in the Fall of 2022 with the most 100+ consecutive injections in history). Are we currently breaking out to the downside of a symmetrical triangle? Or will we hold MAJOR $3 support?
My guess is that we hold support, with more heat coming in August and seasonals being pretty positive the next 3 months as storage builds ahead of the heating season.
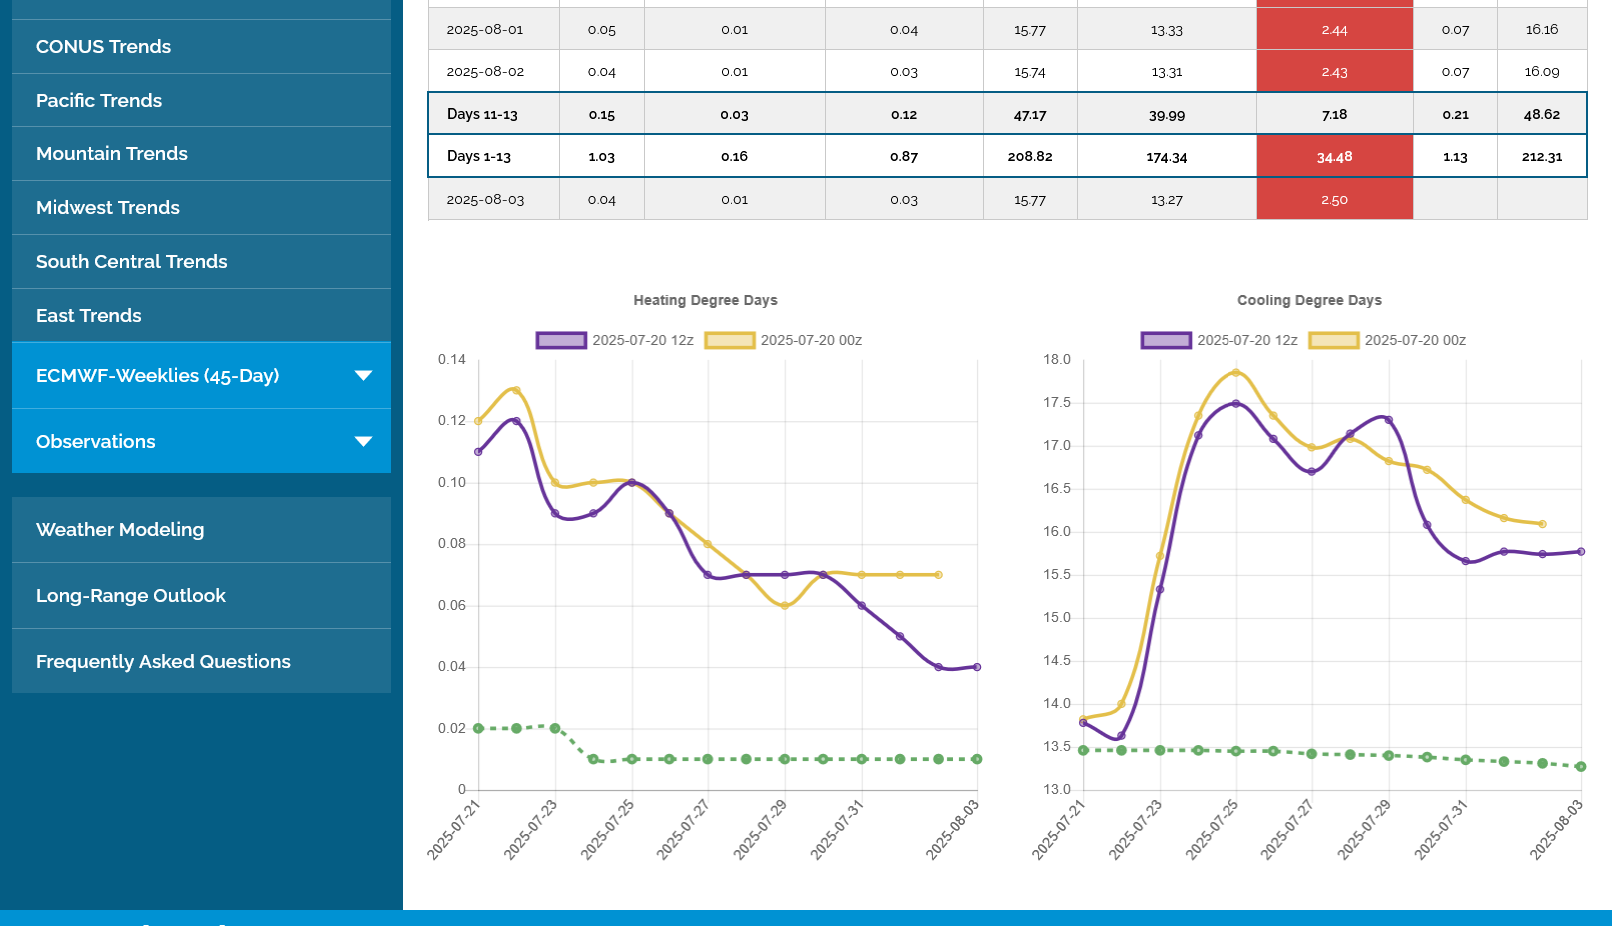
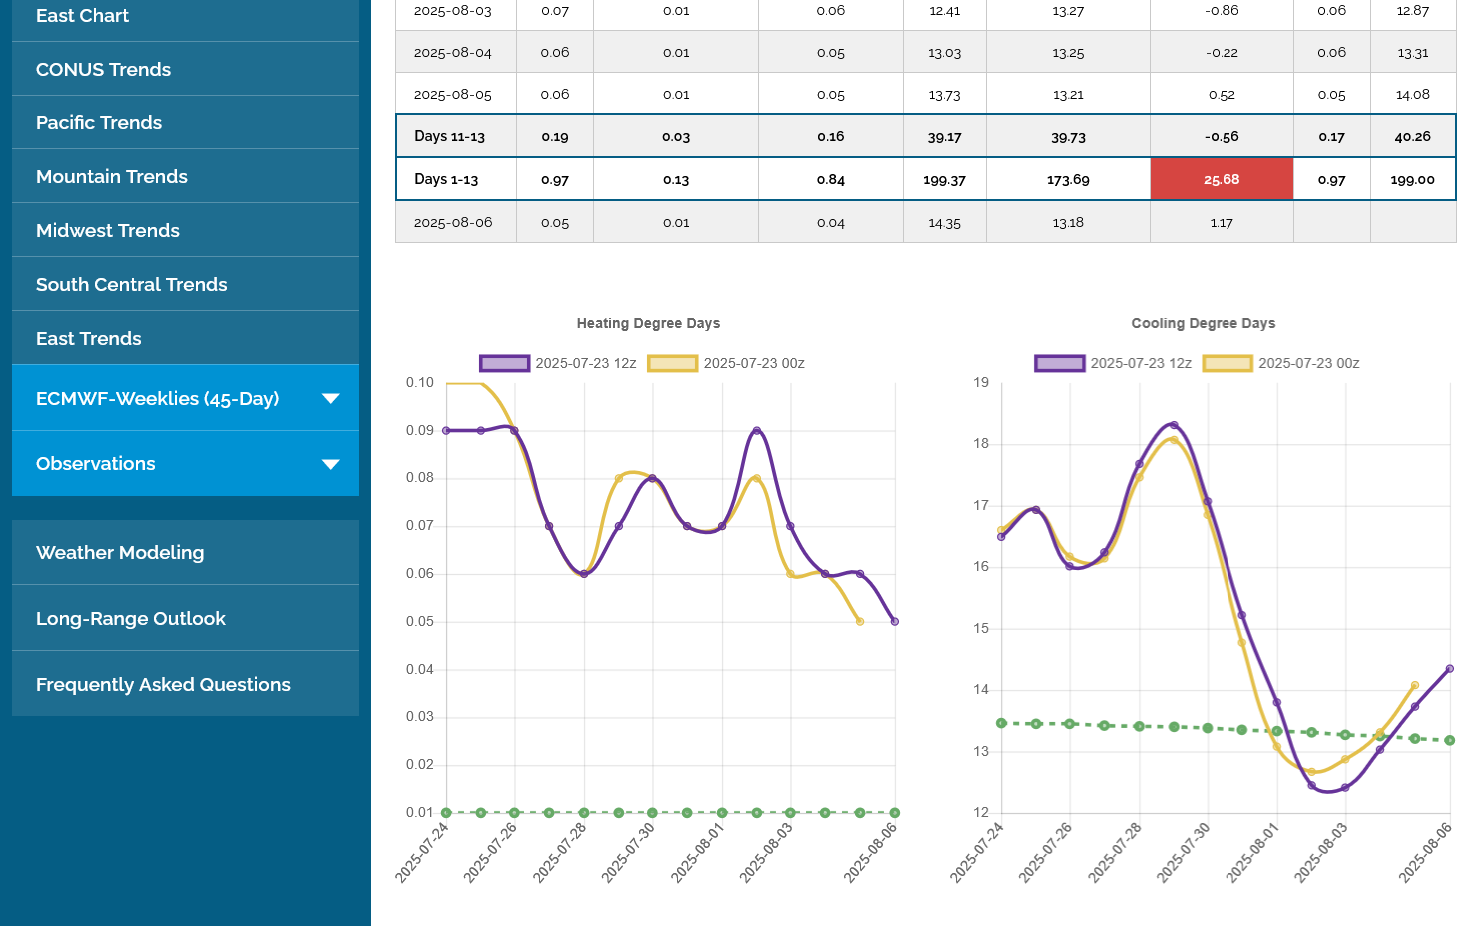
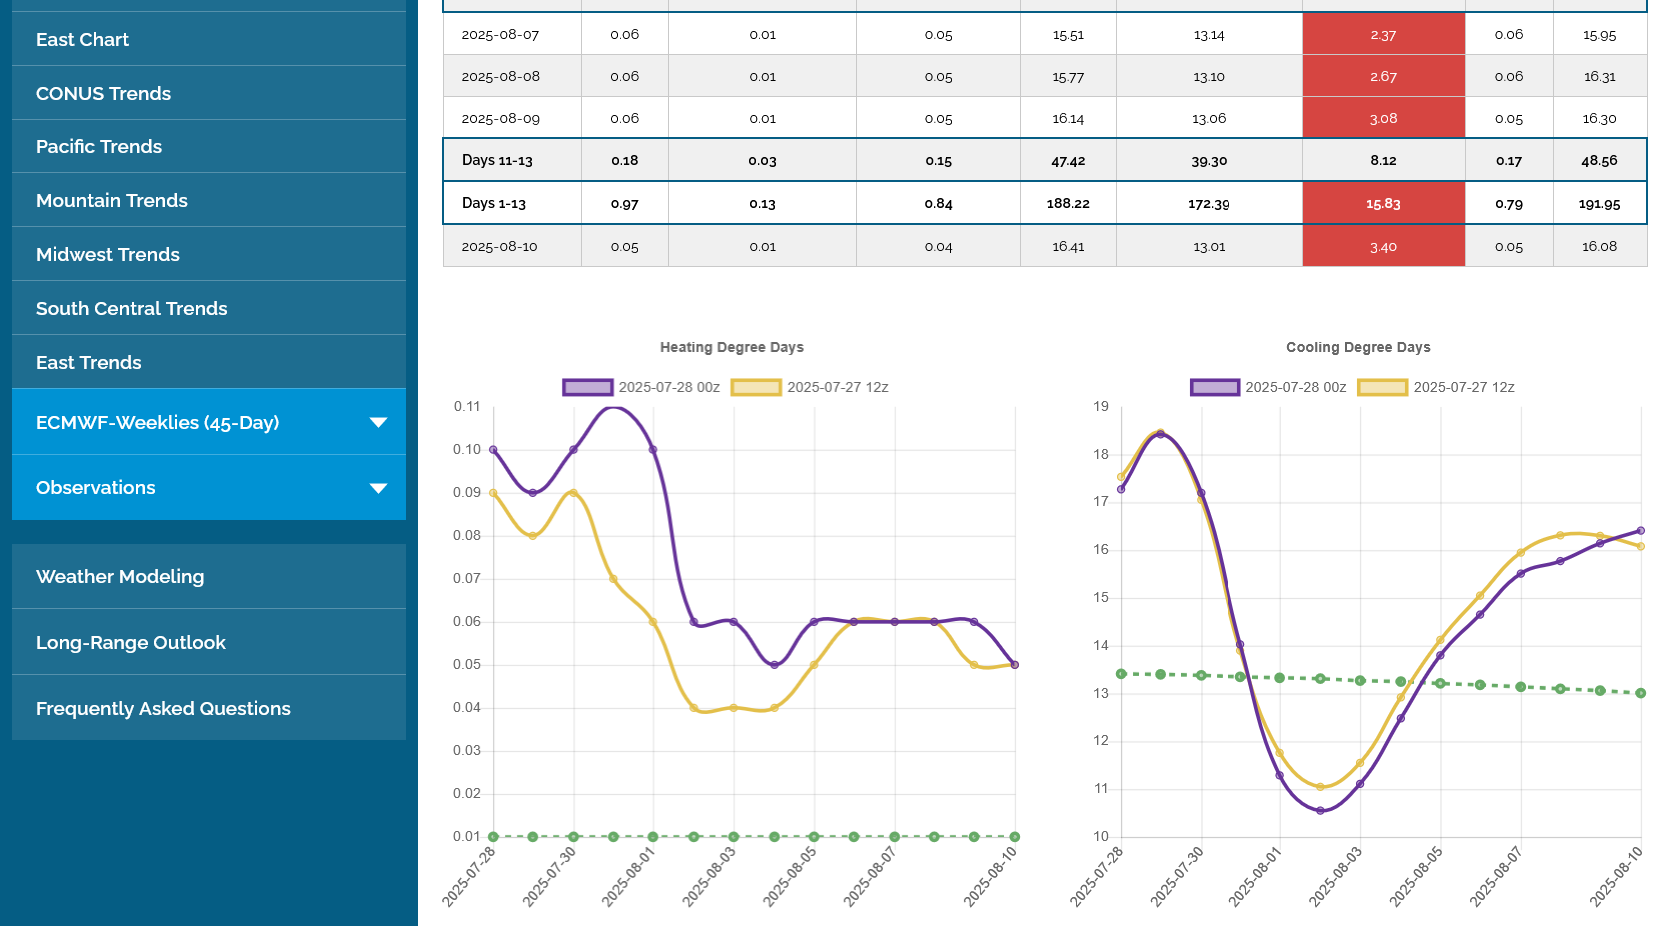
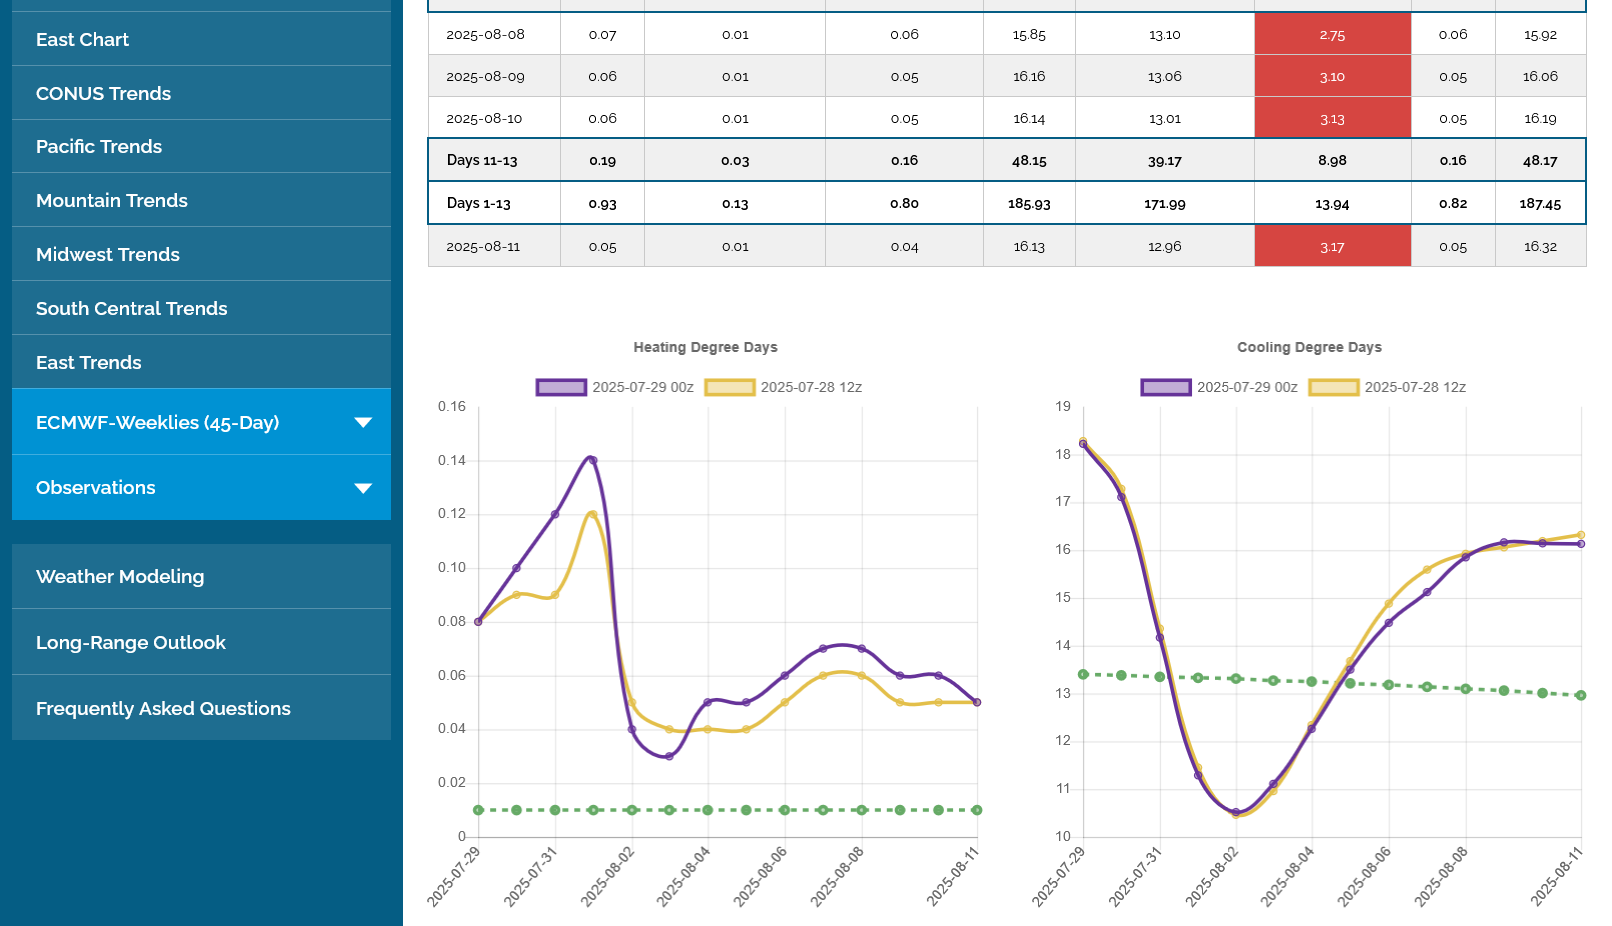
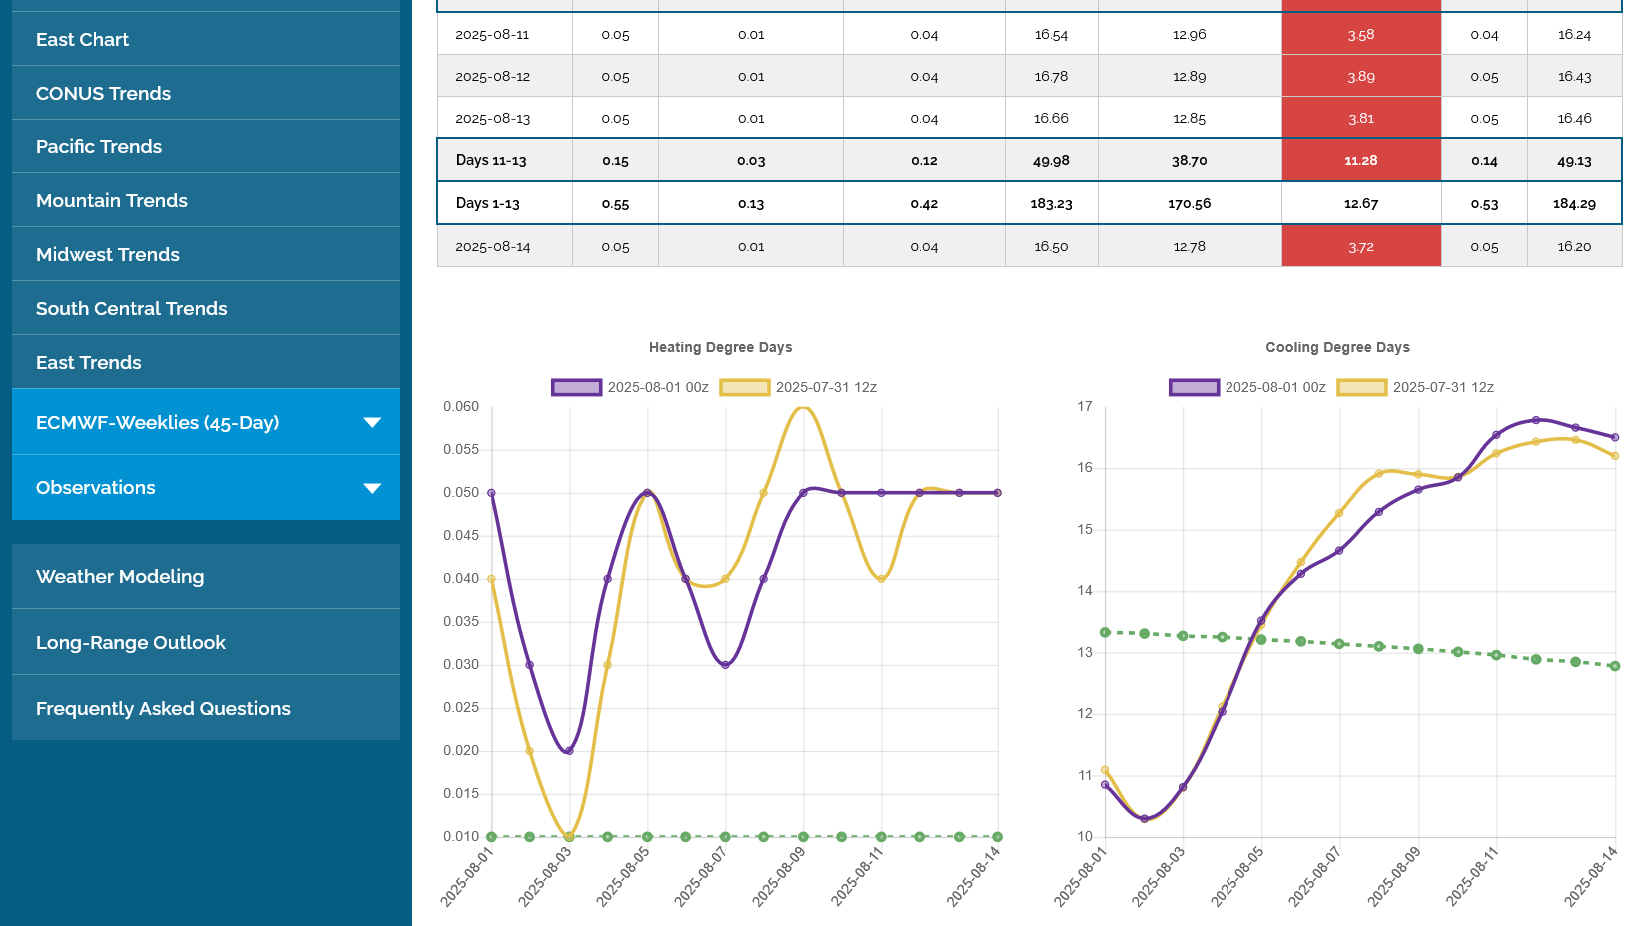
The last 12z EE was as close to the previous run as we'll ever see! Every single day was almost the same as the previous run!
We have a big spike to below average temps later this week, then temperatures warming to well above average, with widespread heat by the end of week 2.
August ng expires today. Overnight CDDs on EE was a tiny bit lower but we have the same trajectories.......drop this week to below average temps, then climbing back to well above average in week 2. $3 held as expected at least so far. If the heat continues in August, odds are that it will continue to hold.
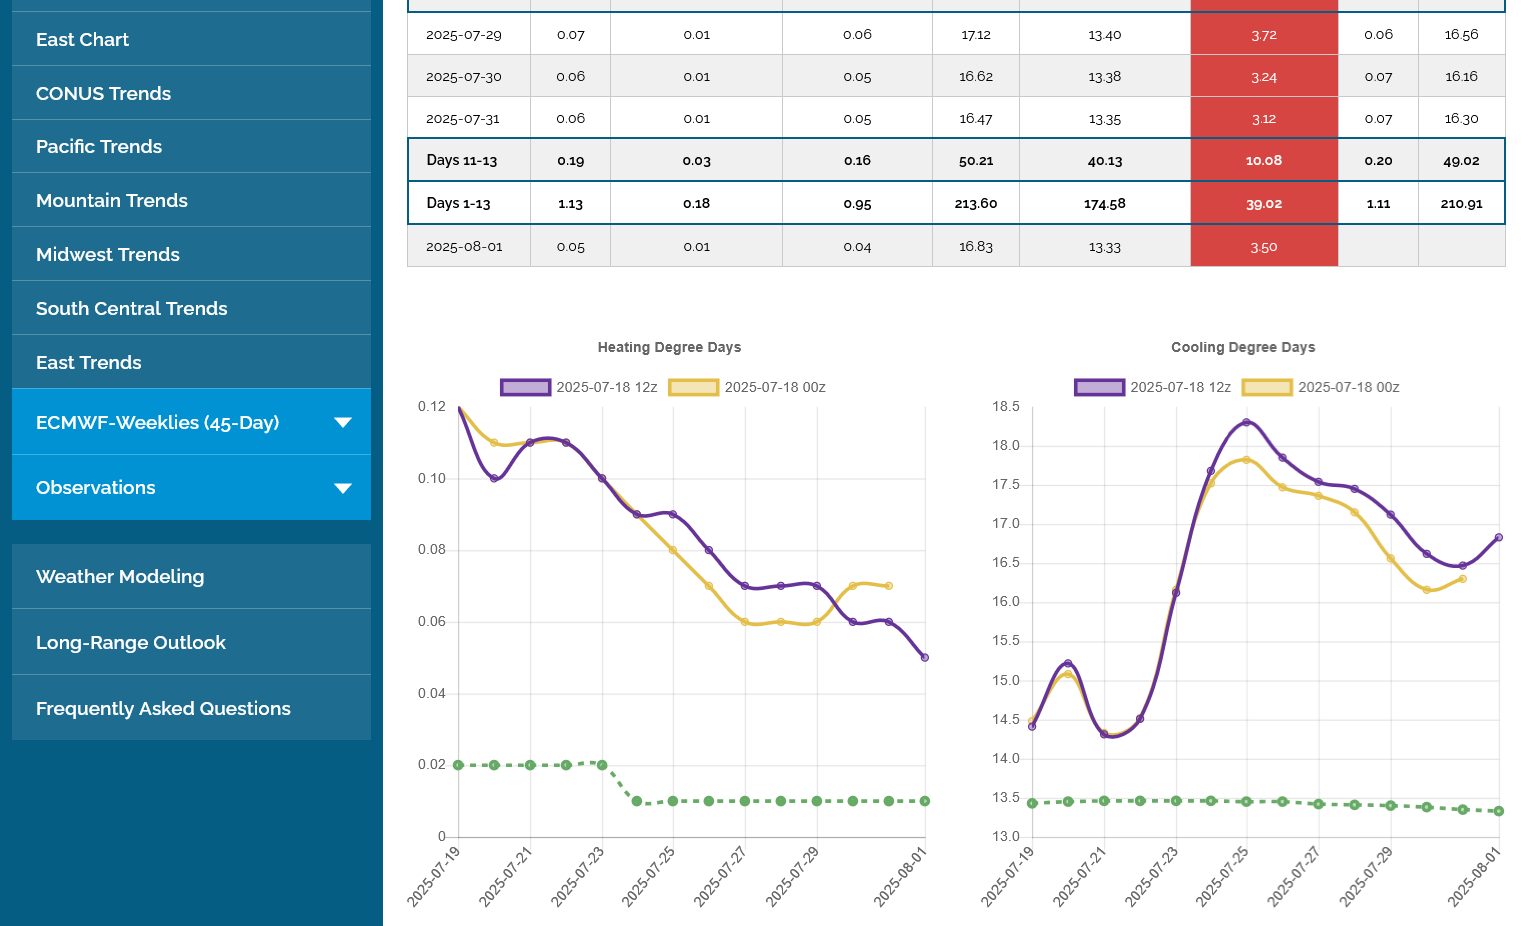
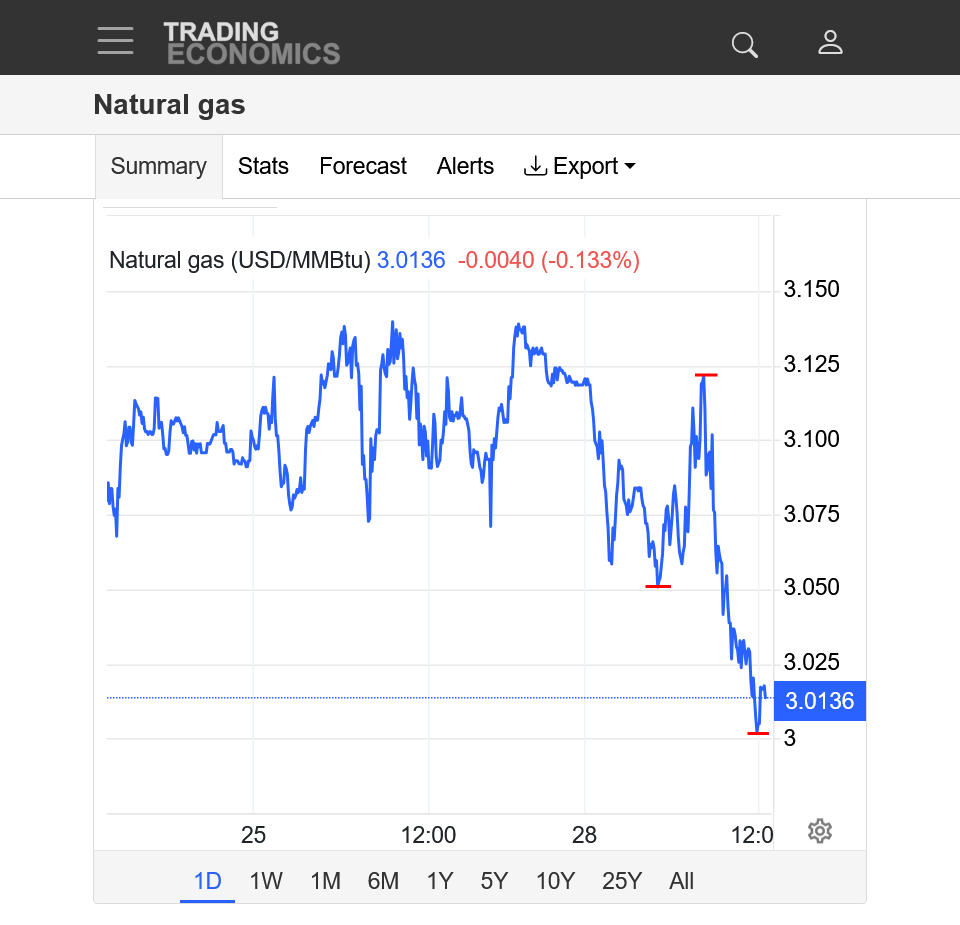
Not much change in the weather. This was the last 0z European Ensemble model in purple/right. Almost the same as the previous 12z run from 12 hours earlier. September natural is now the front month and is getting hit with selling pressure on its 1st day as the front month.
++++++++++++++++++
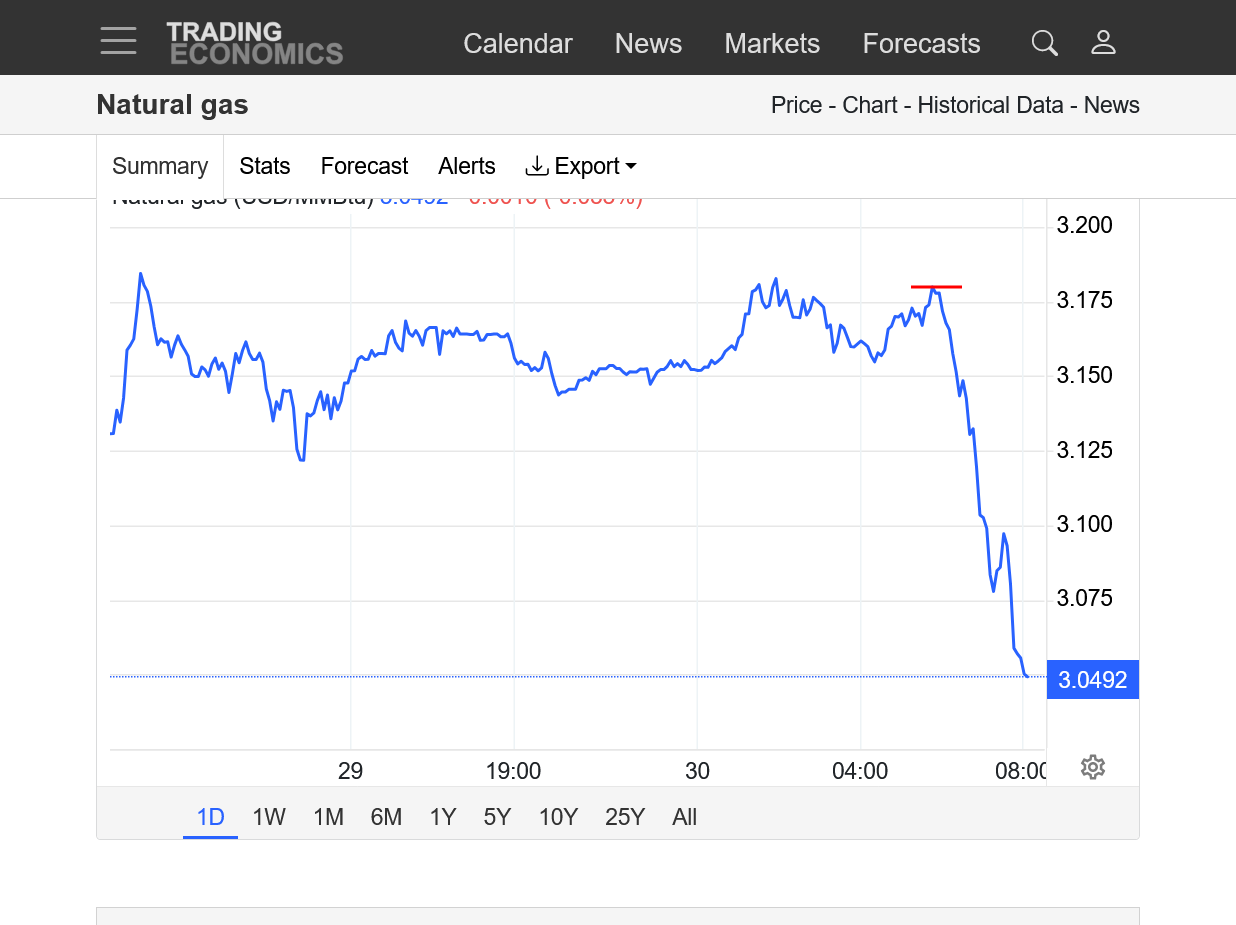
1: 1 day: 6am (red line) has been a key time frame for trading natural gas which, apparently is when the large traders using algorithms enter the market. Huge spikes up and down often take place that start then. Today, it was a spike down.
2. 1 year: threatening a downside breakout below $3. The front month, August actually spiked just below $3, very briefly a couple of days ago.
Temps for the EIA storage report tomorrow: Some serious heat in the Southeast/South, where the air conditioners were working overtime. Burning up lots of natural gas to generate the electricity to power the AC units!
https://www.cpc.ncep.noaa.gov/products/tanal/temp_analyses.php
+++++++++++++++
6pm:
September Nymex natural gas futures rolled into the lead position Wednesday on a downslide, searching for a bottom amid a confluence of weak fundamentals.
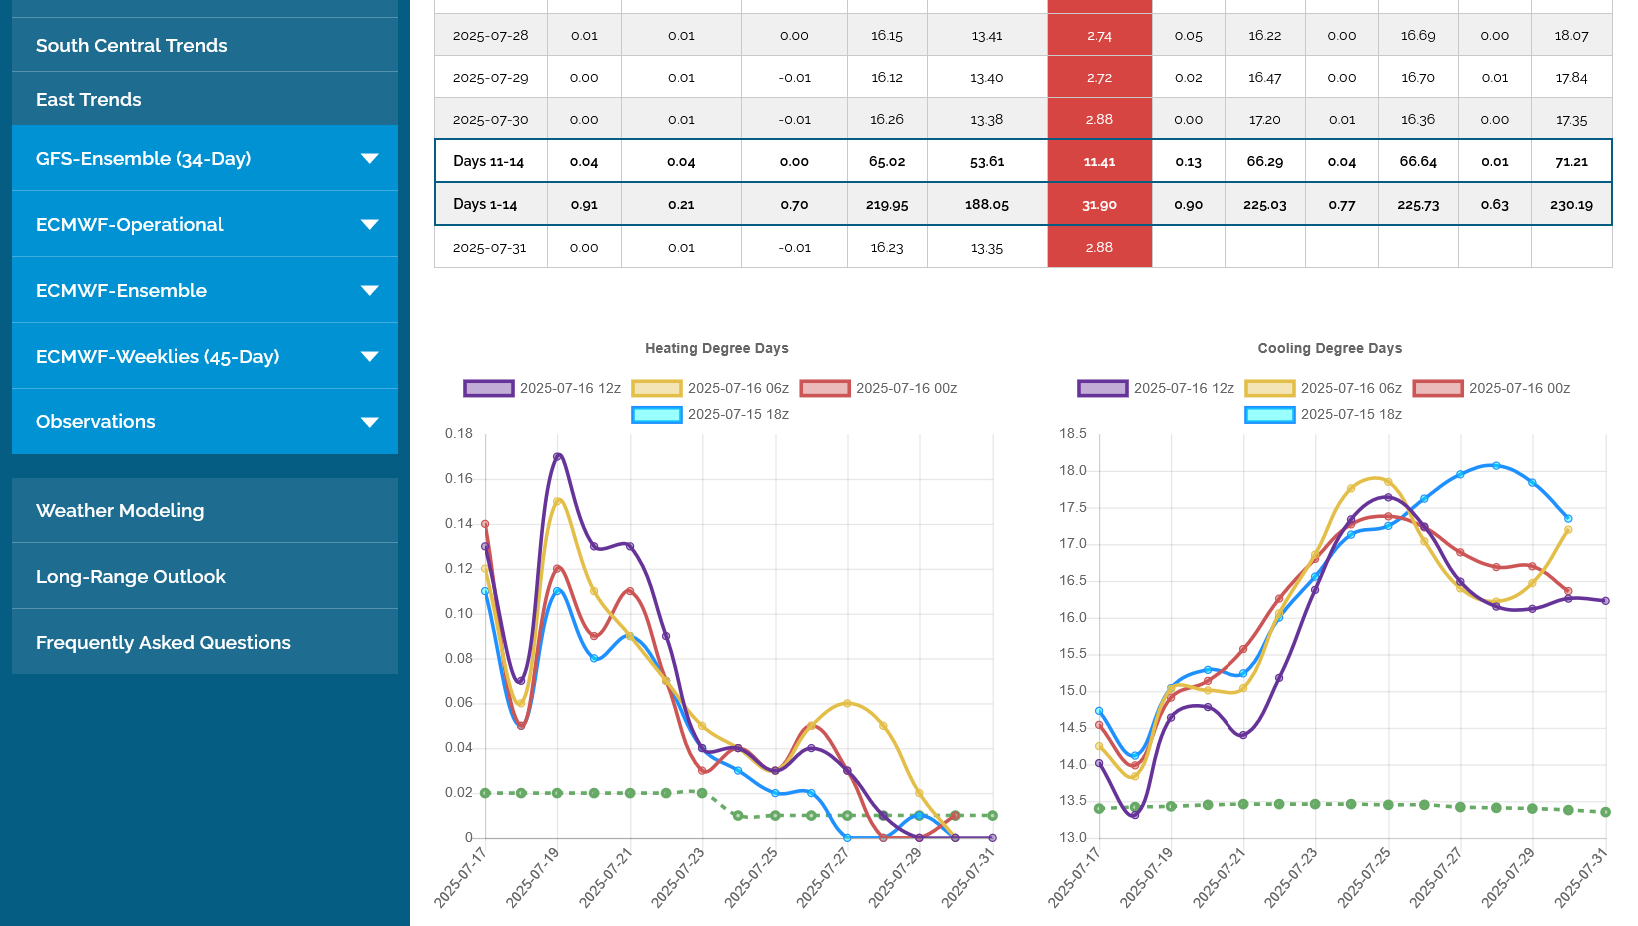
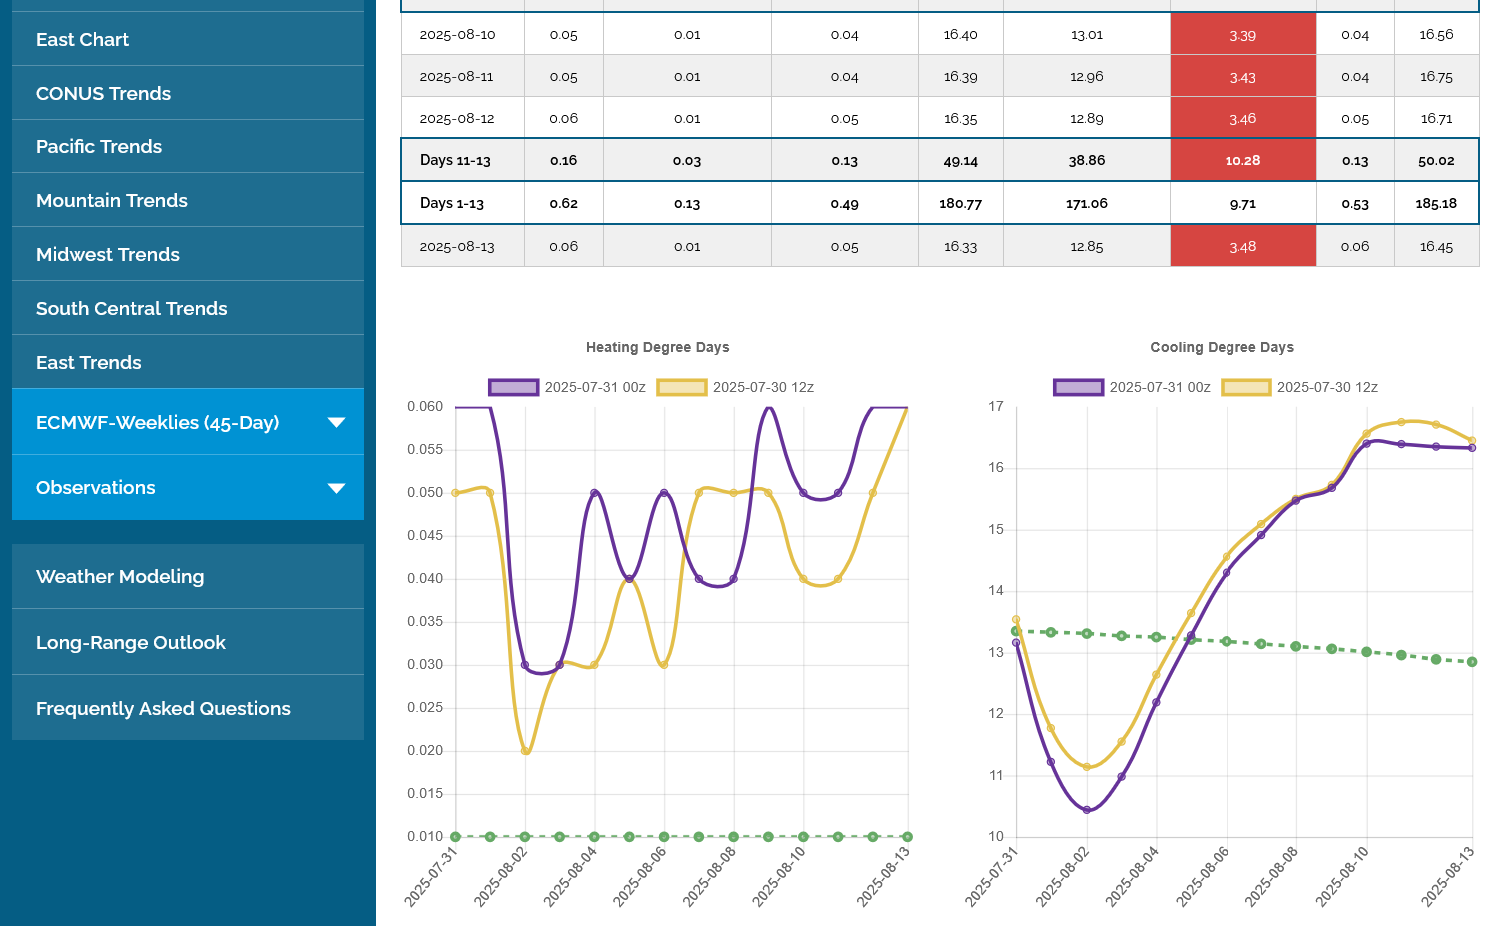
The 0z European Ensemble model in purple/right was -4 CDDs compared to the previous 12z run. The trajectory of the CDD chart has also taken on a different configuration in week 2. Instead of straight up, like it was to start this week, it goes up, hits a peak and the last several days(this is new) IS FALLING A BIT!
It's not a huge drop and seasonally, you can see from the green dashed line of the average CCDs for those same days, it basically mirrors the seasonal average drop. Regardless of that, the market is trading this last update as BEARISH and we are potentially breaking out to the downside BELOW $3!
A bearish EIA report would do it. A bullish one would help us hold this HUGE support level.
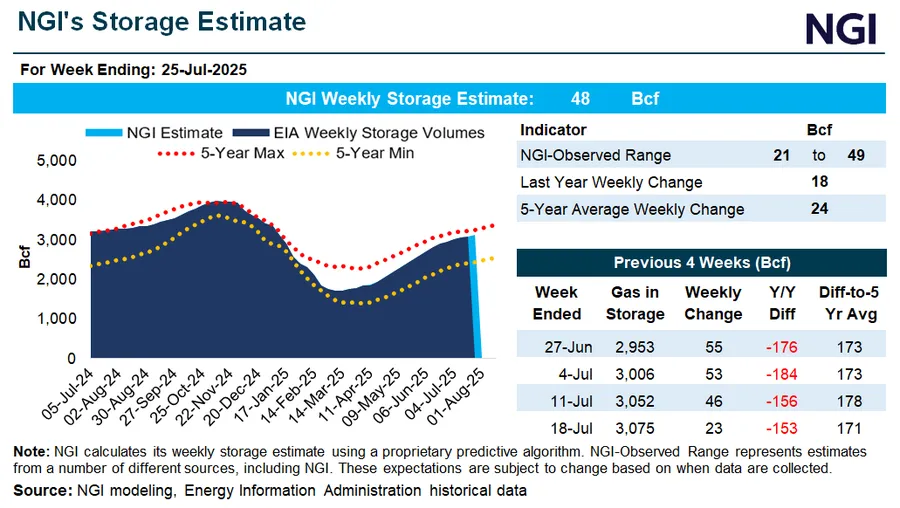
+48 Bcf. Seems a bit BEARISH to me. +21-49 was the guessing range before the report.
for week ending July 25, 2025 | Released: July 31, 2025 at 10:30 a.m. | Next Release: August 7, 2025
| Working gas in underground storage, Lower 48 states Summary text CSV JSN | |||||||||||||||||||||||||
|---|---|---|---|---|---|---|---|---|---|---|---|---|---|---|---|---|---|---|---|---|---|---|---|---|---|
| Historical Comparisons | |||||||||||||||||||||||||
| Stocks billion cubic feet (Bcf) | Year ago (07/25/24) | 5-year average (2020-24) | |||||||||||||||||||||||
| Region | 07/25/25 | 07/18/25 | net change | implied flow | Bcf | % change | Bcf | % change | |||||||||||||||||
| East | 651 | 634 | 17 | 17 | 709 | -8.2 | 644 | 1.1 | |||||||||||||||||
| Midwest | 765 | 746 | 19 | 19 | 840 | -8.9 | 753 | 1.6 | |||||||||||||||||
| Mountain | 243 | 239 | 4 | 4 | 253 | -4.0 | 194 | 25.3 | |||||||||||||||||
| Pacific | 302 | 297 | 5 | 5 | 286 | 5.6 | 266 | 13.5 | |||||||||||||||||
| South Central | 1,162 | 1,159 | 3 | 3 | 1,158 | 0.3 | 1,071 | 8.5 | |||||||||||||||||
| Salt | 316 | 325 | -9 | -9 | 308 | 2.6 | 282 | 12.1 | |||||||||||||||||
| Nonsalt | 846 | 834 | 12 | 12 | 851 | -0.6 | 790 | 7.1 | |||||||||||||||||
| Total | 3,123 | 3,075 | 48 | 48 | 3,246 | -3.8 | 2,928 | 6.7 | |||||||||||||||||
| Totals may not equal sum of components because of independent rounding. | |||||||||||||||||||||||||
Working gas in storage was 3,123 Bcf as of Friday, July 25, 2025, according to EIA estimates. This represents a net increase of 48 Bcf from the previous week. Stocks were 123 Bcf less than last year at this time and 195 Bcf above the five-year average of 2,928 Bcf. At 3,123 Bcf, total working gas is within the five-year historical range.
For information on sampling error in this report, see Estimated Measures of Sampling Variability table below.
Note: The shaded area indicates the range between the historical minimum and maximum values for the weekly series from 2020 through 2024. The dashed vertical lines indicate current and year-ago weekly periods.
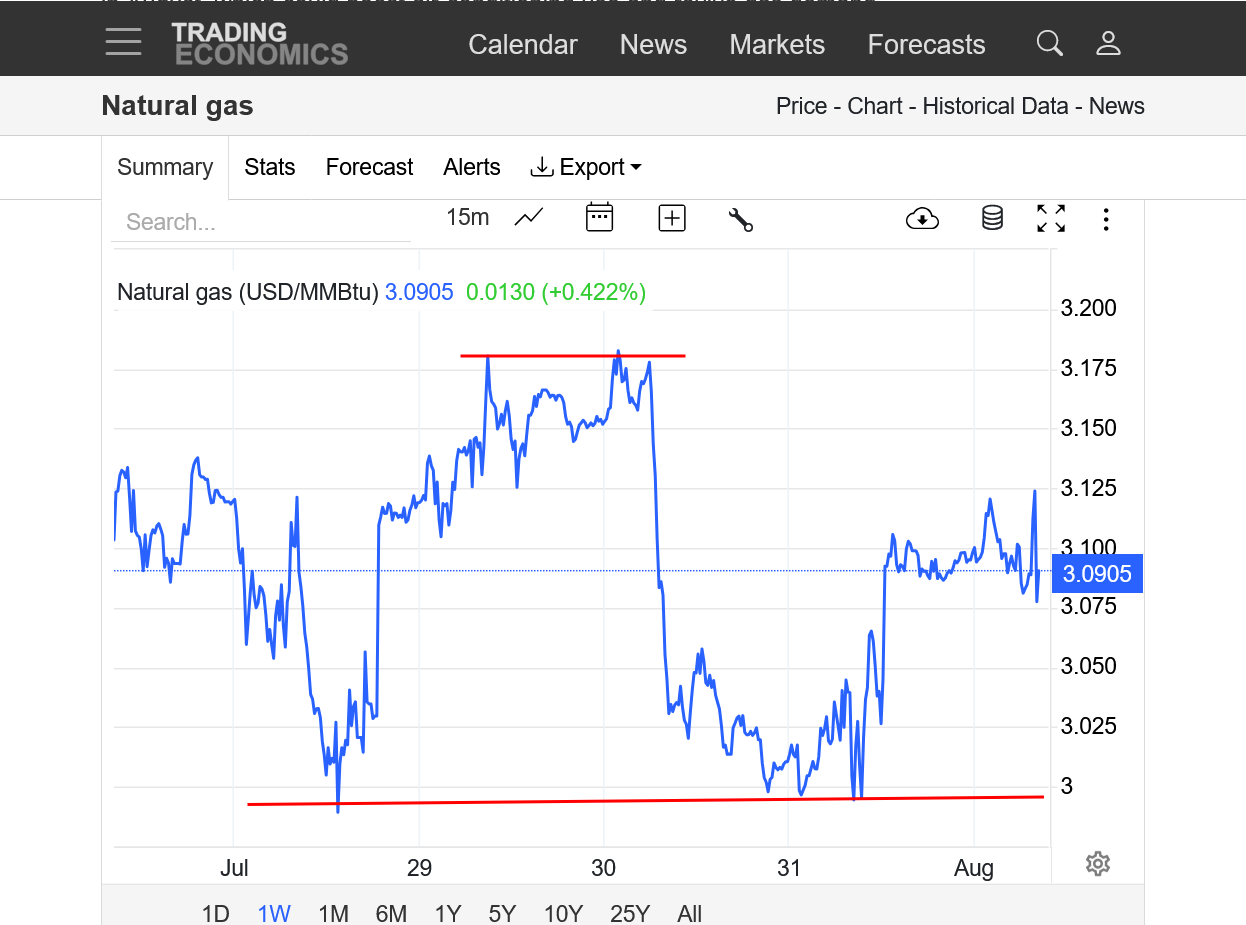
CDDS on the last 0z European model were not much different. The trajectory going up in week 2 gives the bulls some hope that the lows are in, especially after MAJOR $3 was strongly rejected on Thursday after we briefly spiked below $3, THEN HAD A BIG REVERSAL UP ON THE DAILY BAR YESTERDAY.
https://tradingeconomics.com/commodity/natural-gas
1. 1 week chart below. Tested and held $3 on 2 tests for double bottom formation that included a reversal higher yesterday/Thursday.
2. 1 year: Held $3 support but with an accelerating/steeper slope downtrend channel. We can also see the strong up trending channel on the left from the COLDER than average Winter, that peaked/topped In March.
3. 10 years. Held $3 support but potential downside break out from a longer term symmetrical triangle(higher lows and lower highs). Major top in 2022 and lower highs since then. Major bottom in 2024 with higher lows since then but that uptrend channel may be getting violated from late July's plunge lower in prices.
Great site for seasonals!
They are fairly bullish thru September. With heat returning to the forecast, my bias is to the upside.
A contracting economy, however reduces industrial demand. Also, some demand for natural gas in the Summer to burn to generate electricity for cooling/AC use has being replaced with wind and solar.
https://equityclock.com/seasonality/
https://equityclock.com/charts/
https://charts.equityclock.com/natural-gas-futures-ng-seasonal-chart