Mr. Pathological Thinker came up with a new way to inject chaos into the markets to feed his galaxy sized ego at the expense of Americans and the world.
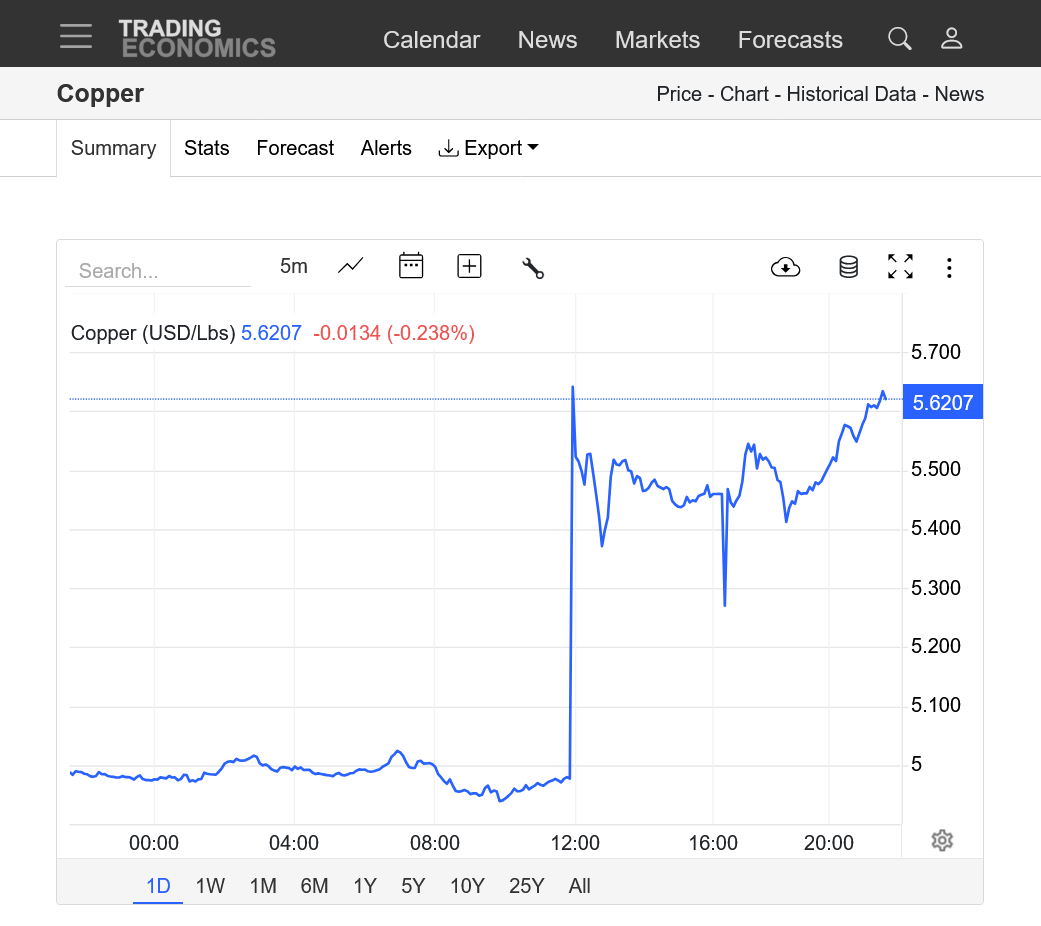
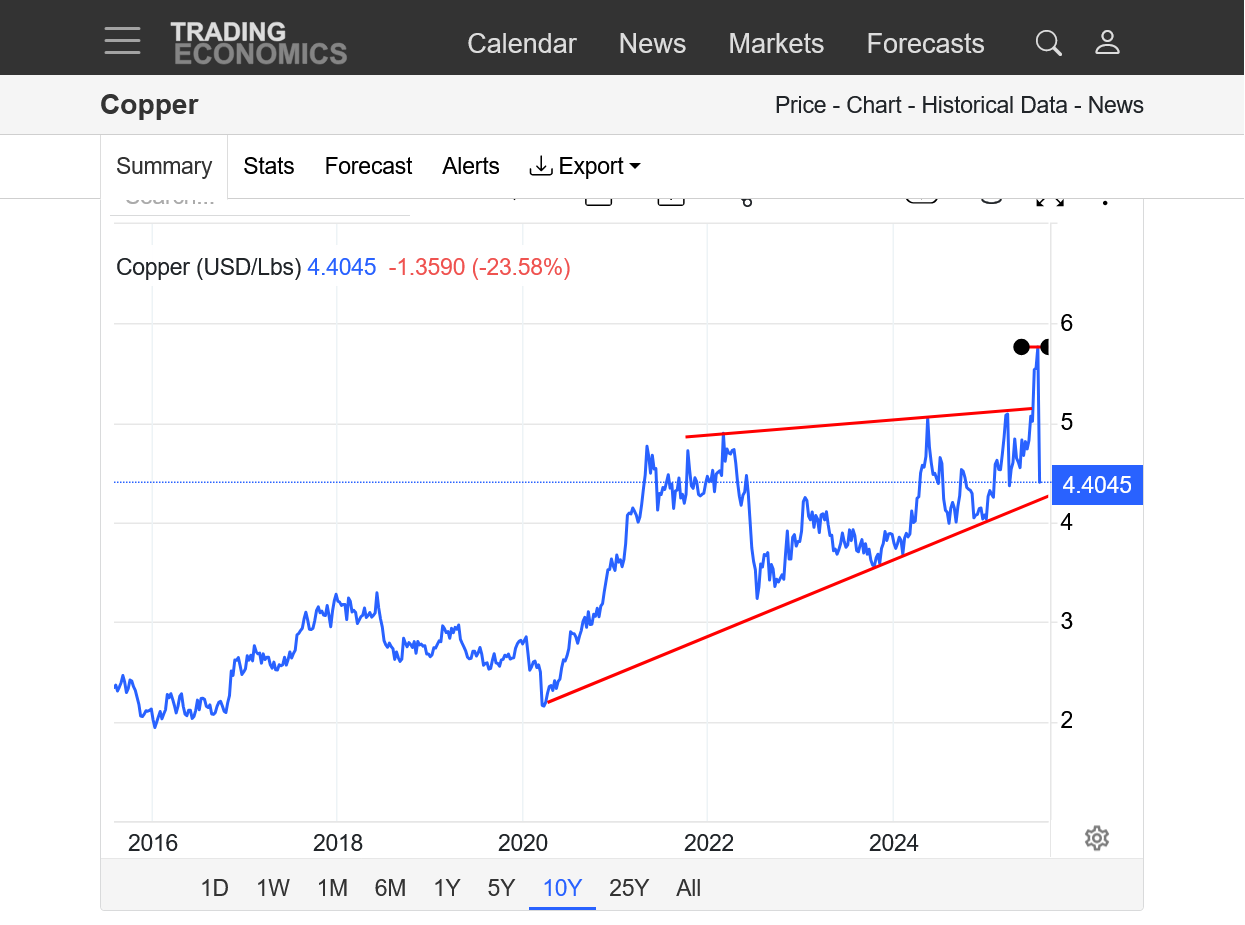
https://tradingeconomics.com/commodity/copper
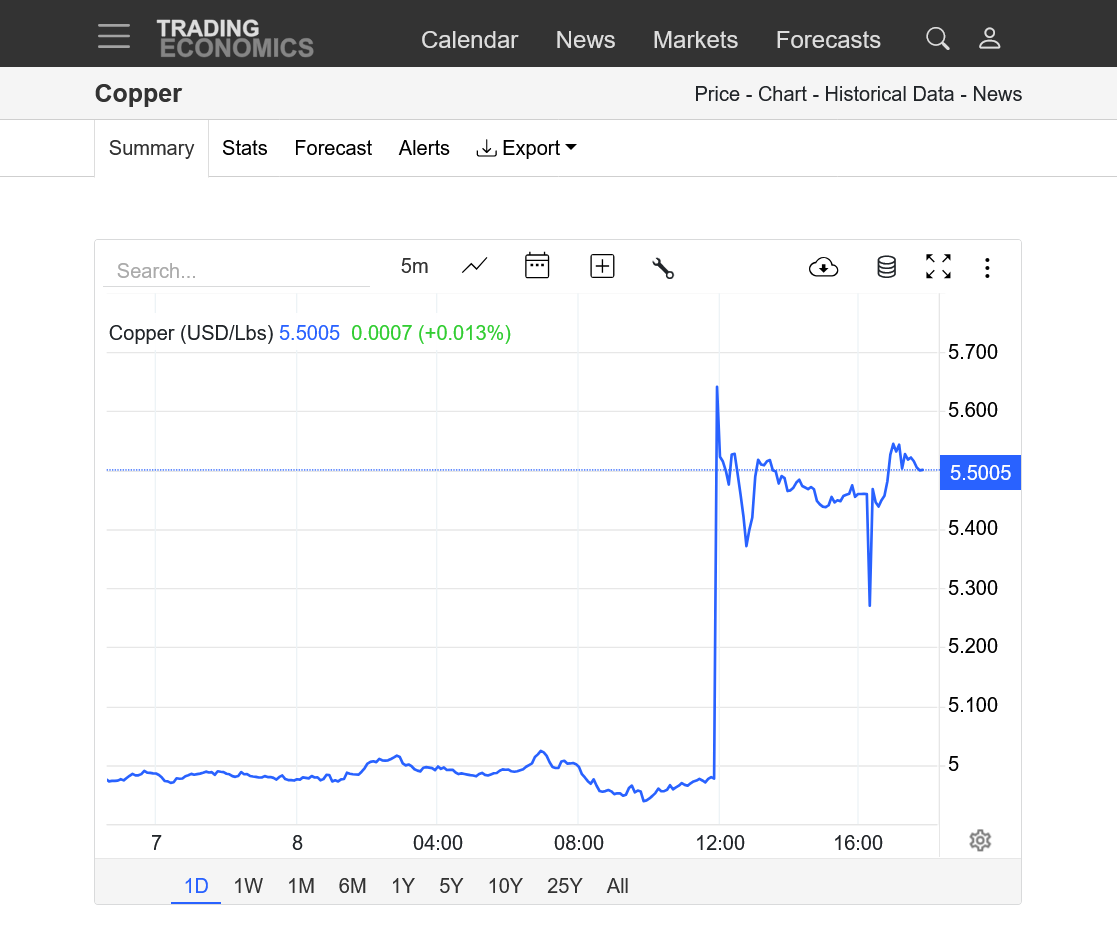
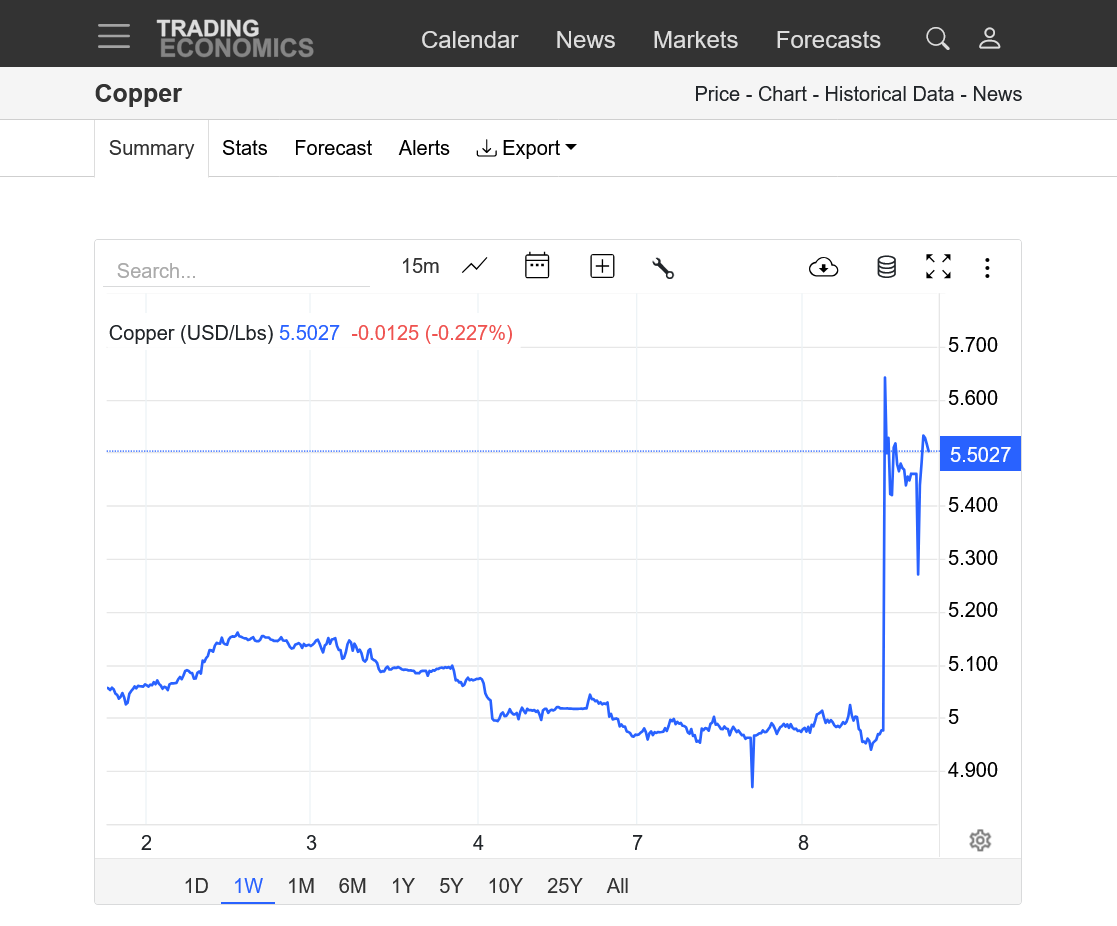
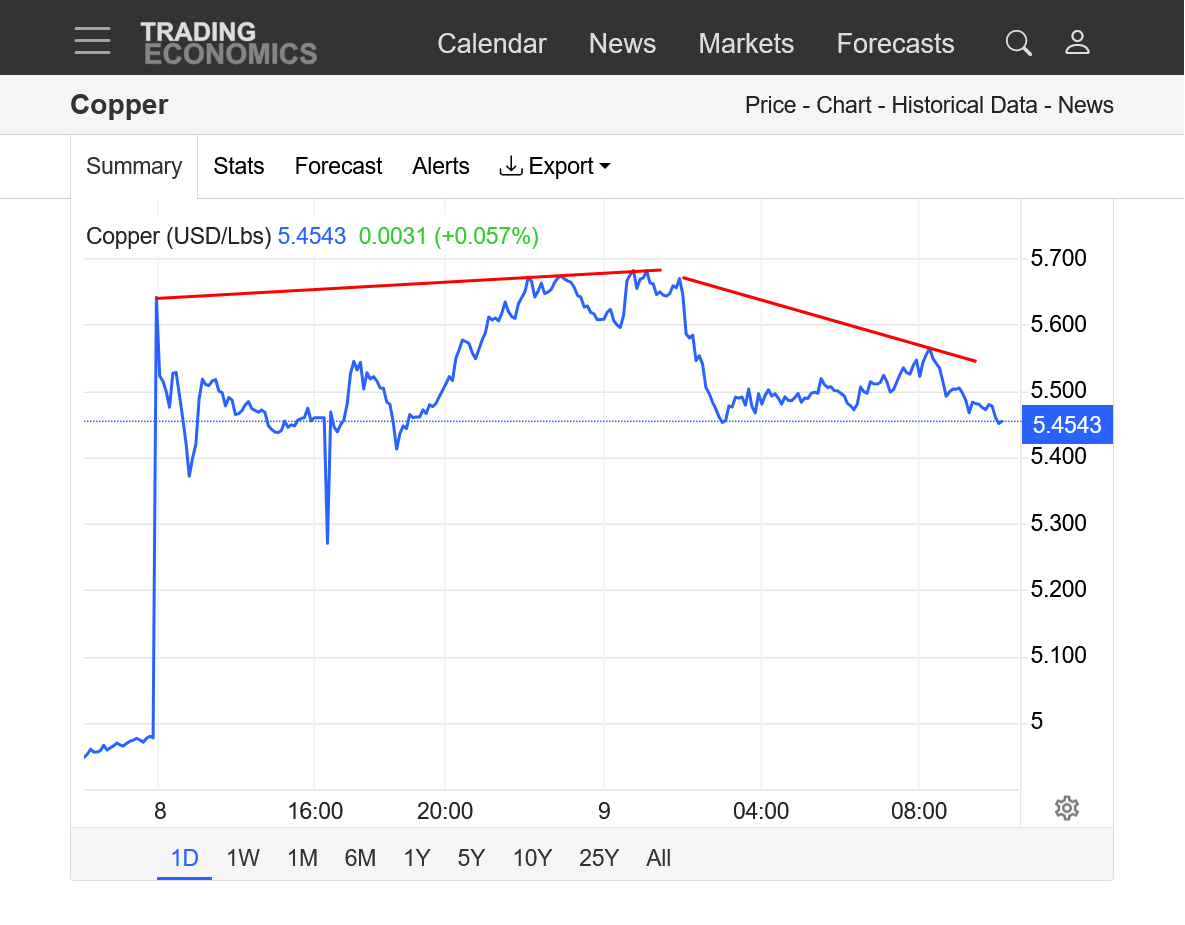
1. 1 day-can you tell when Trump made the announcement
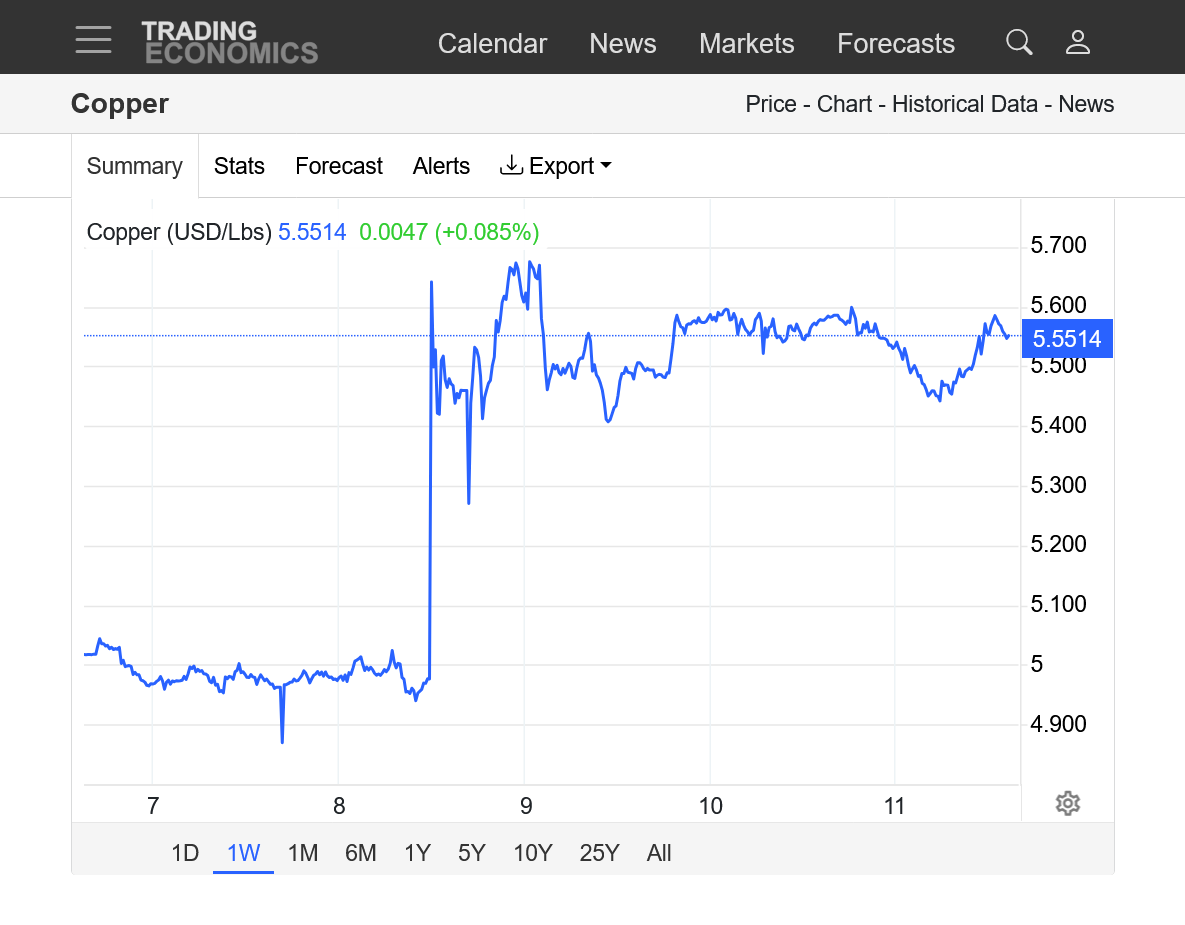
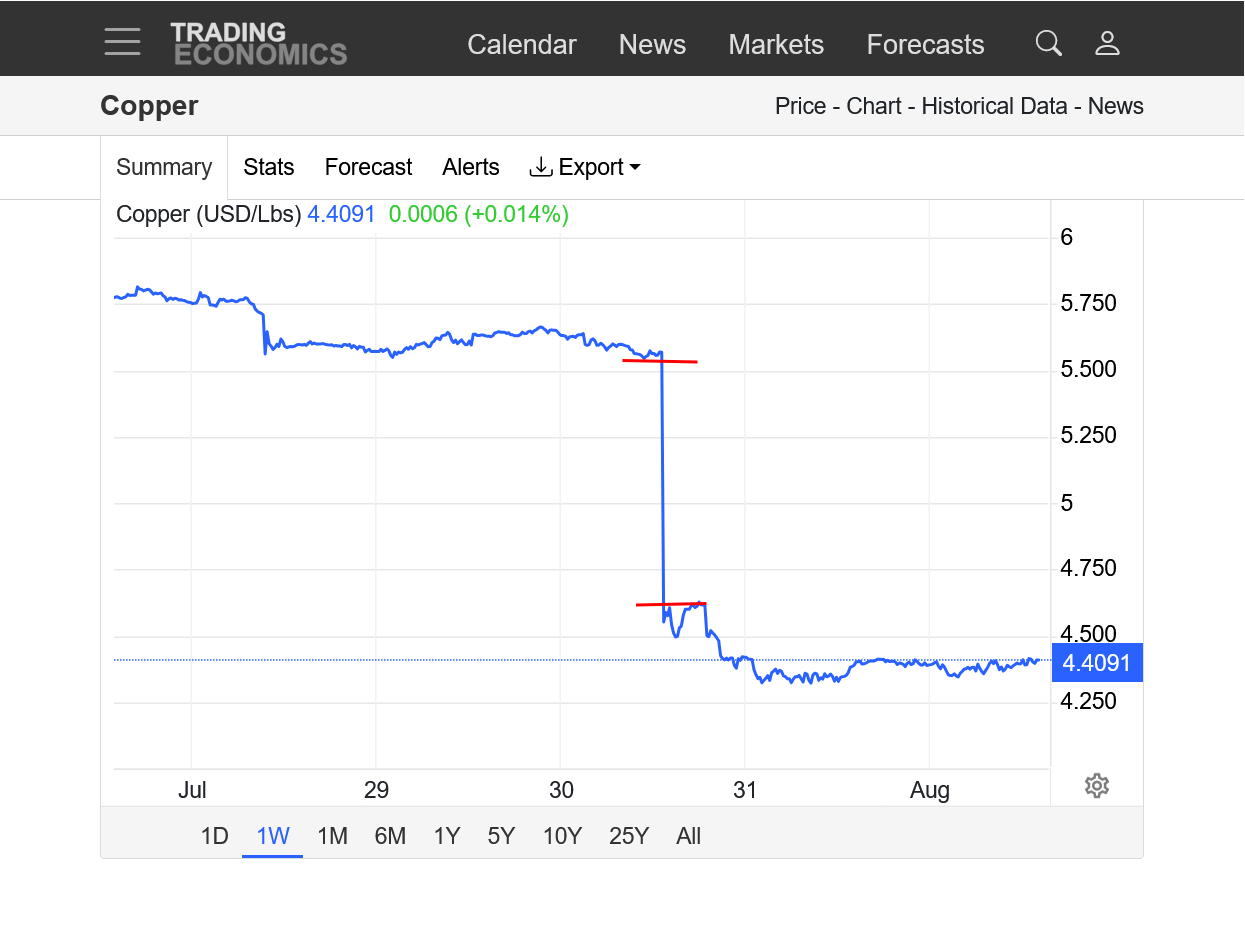
2. 1 week-after falling for several days, Copper spiked to record highs.
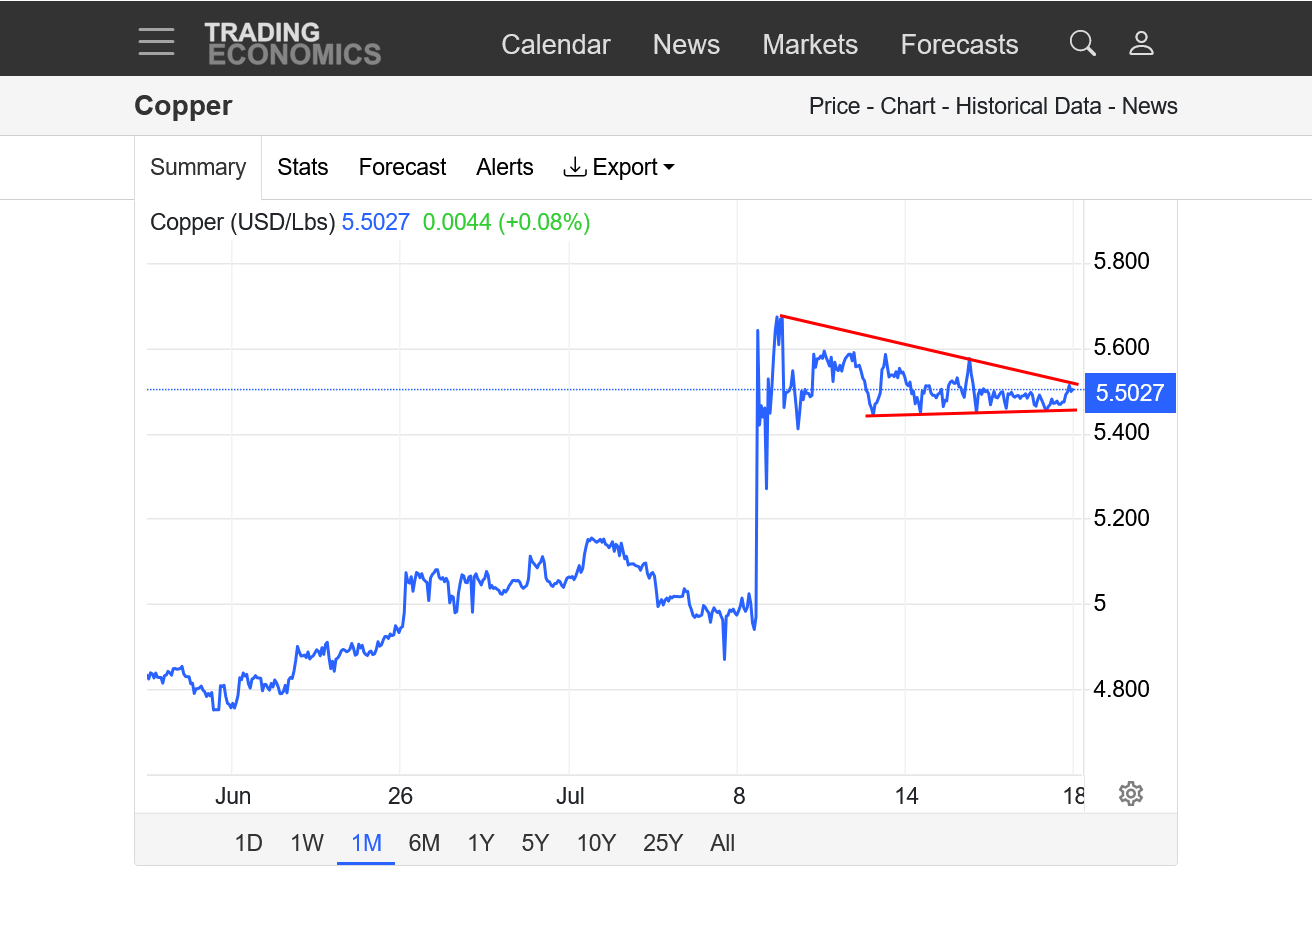
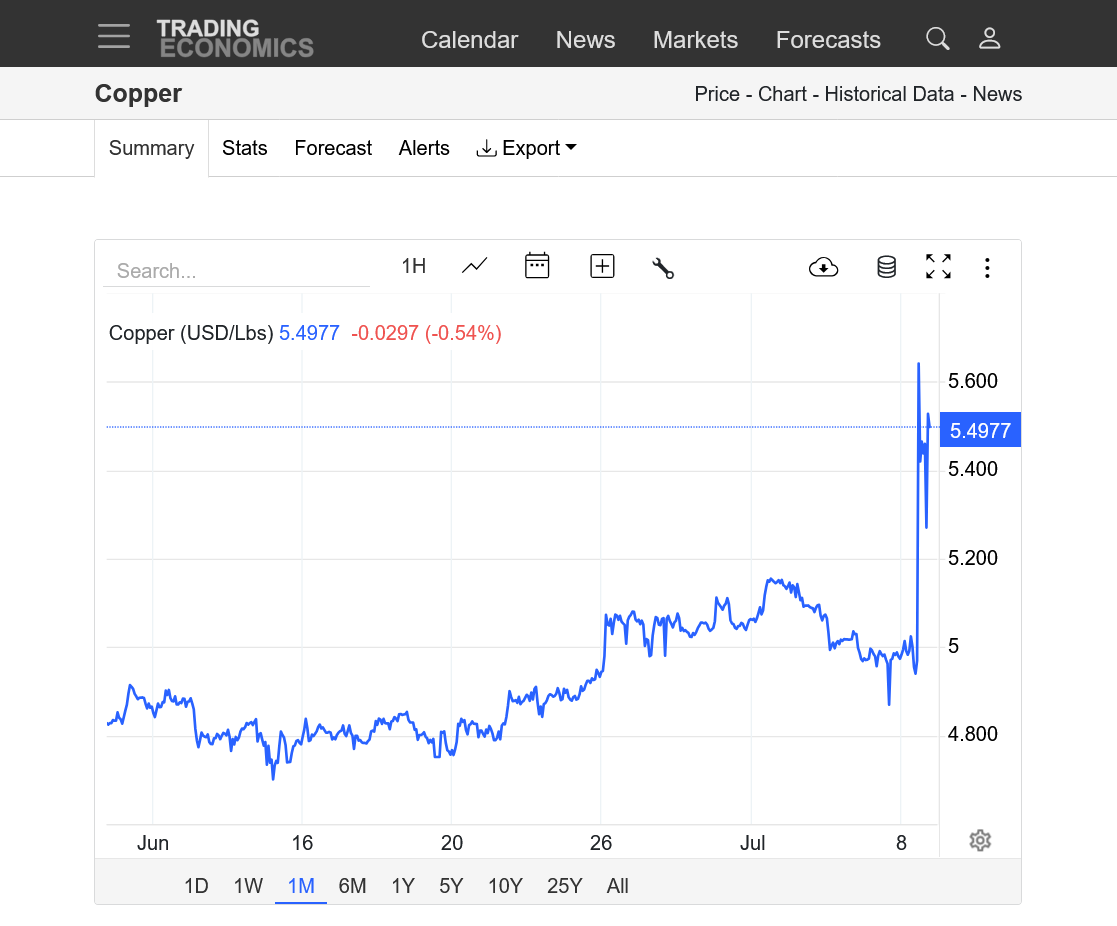
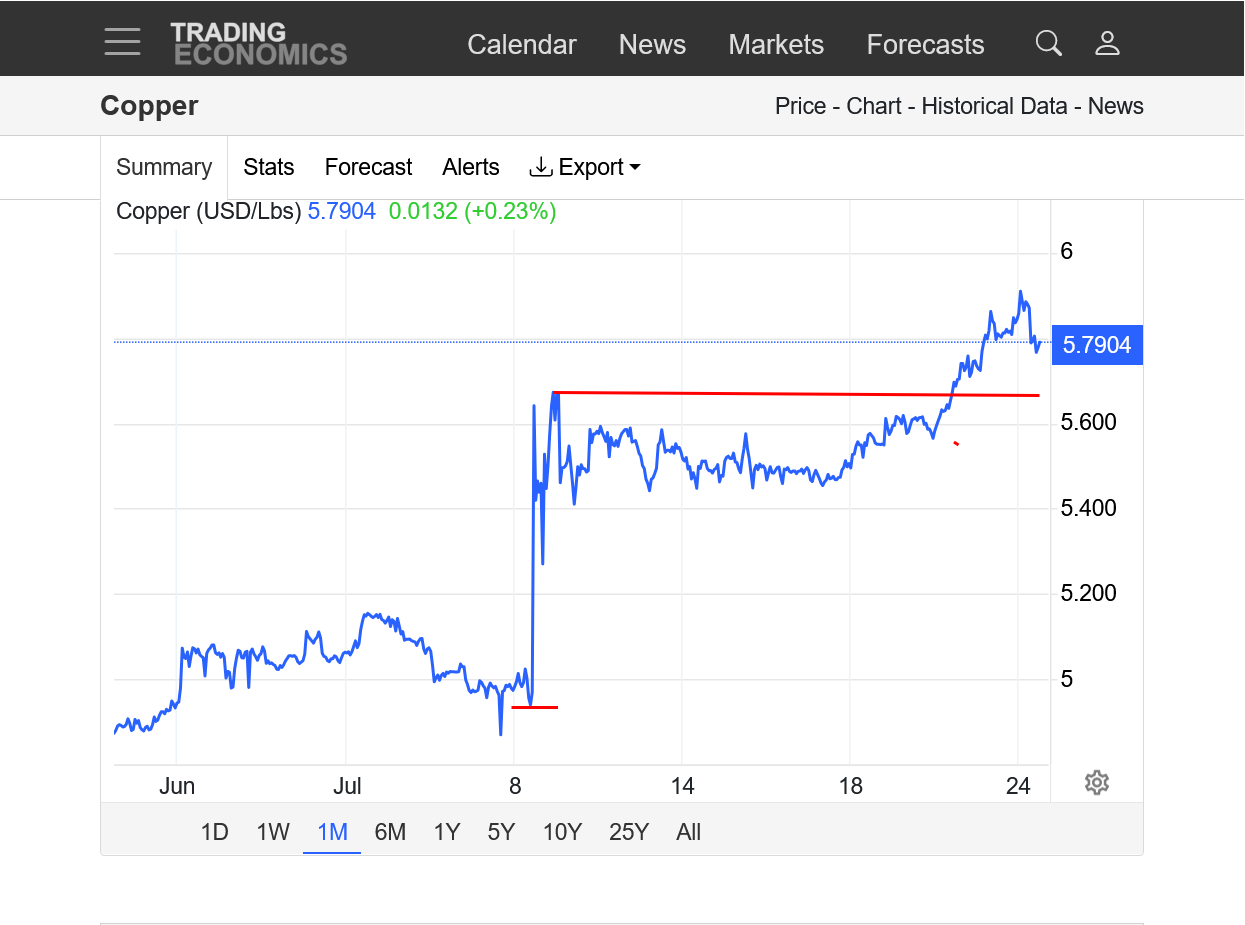
3. 1 month
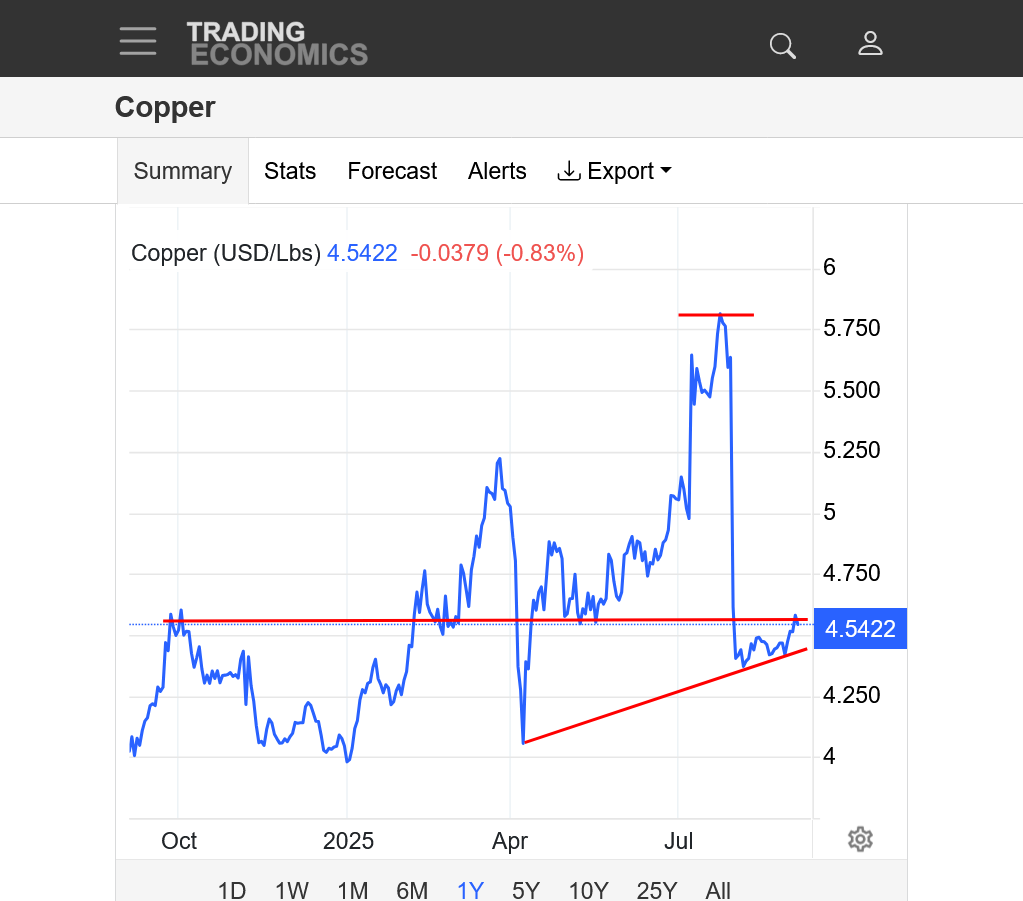
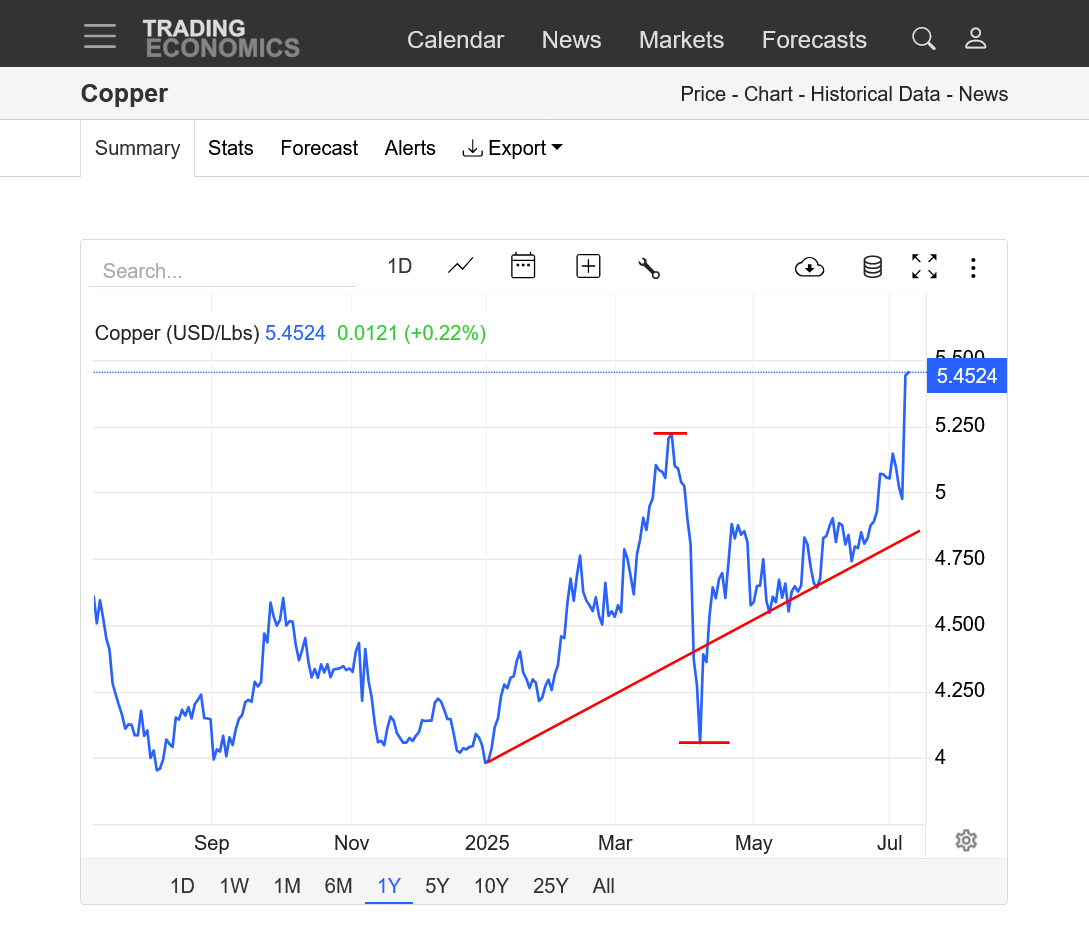
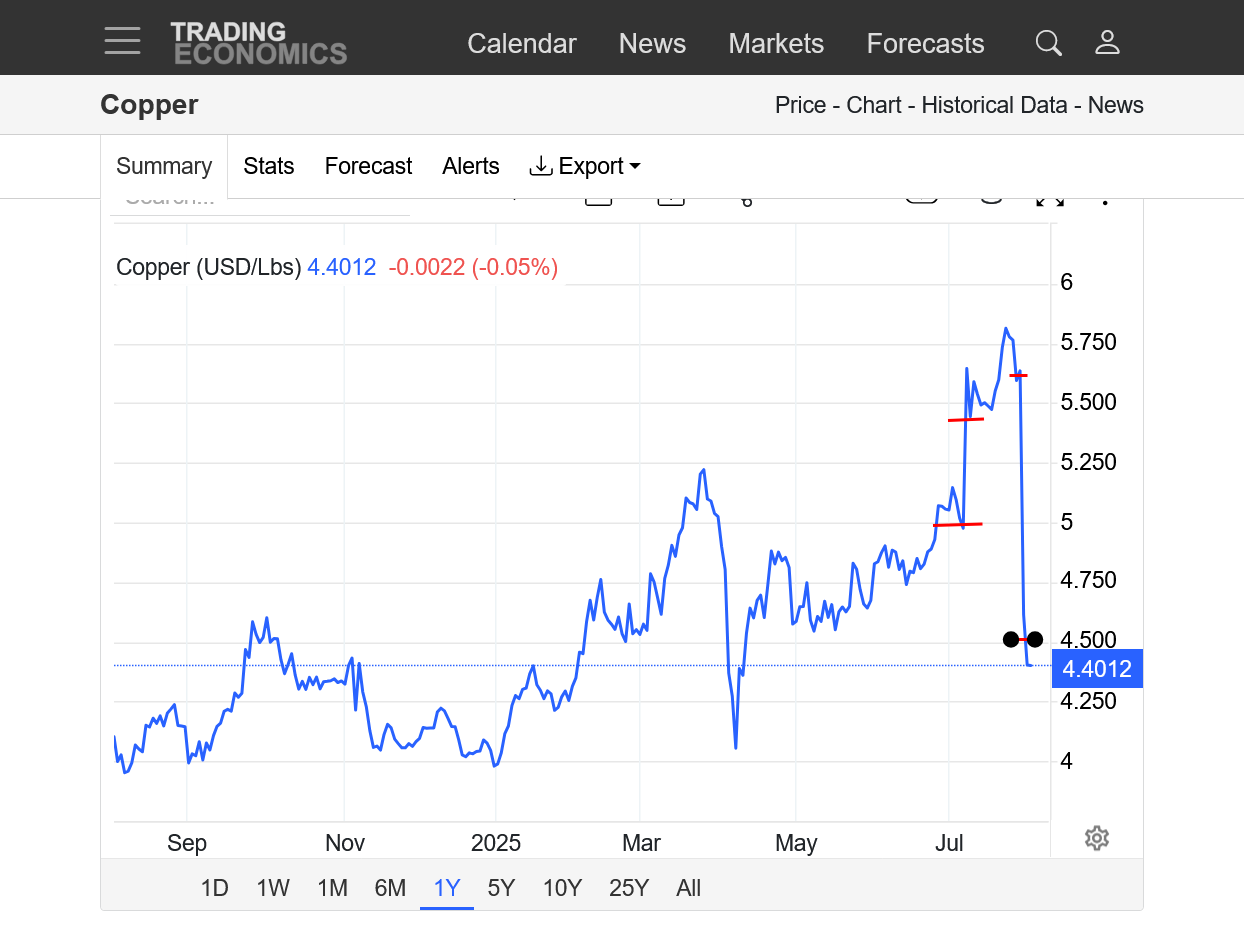
4. 1 year-The big drop lower in early April was also caused by Mr. Chaos. Expectations then that his tariffs would damage the economy and hurt demand for copper that time!
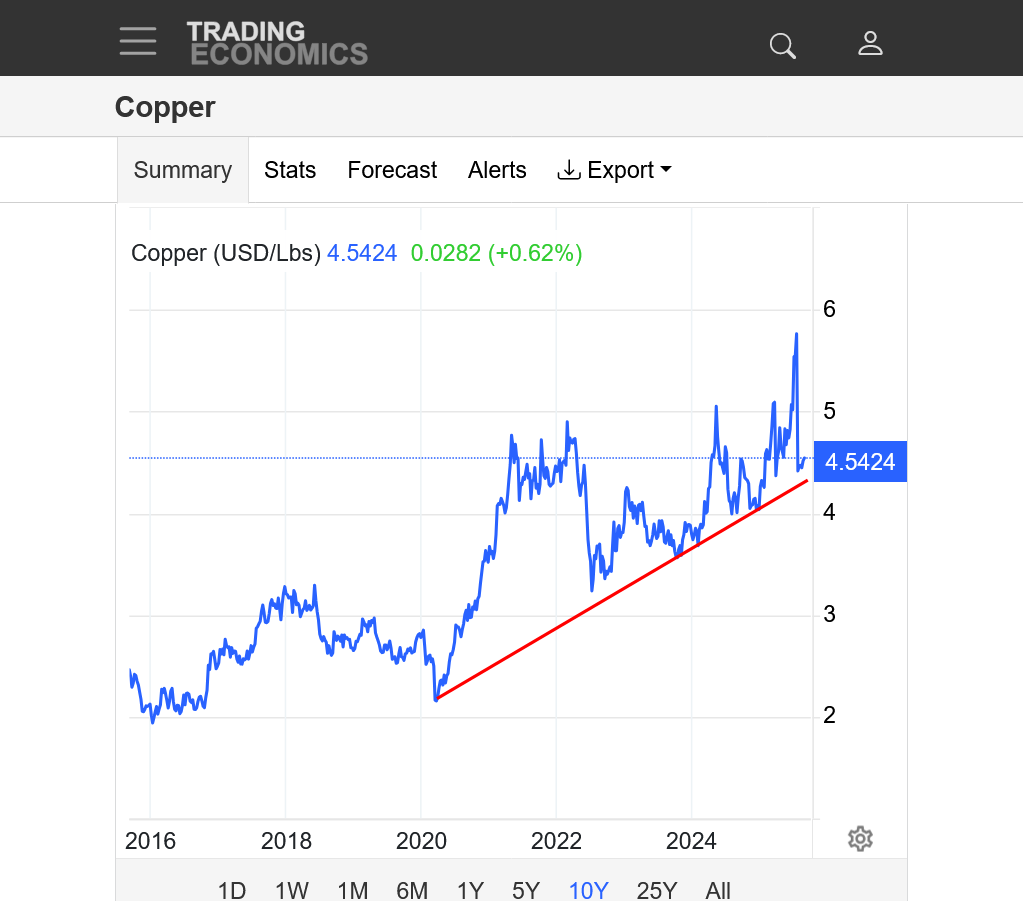
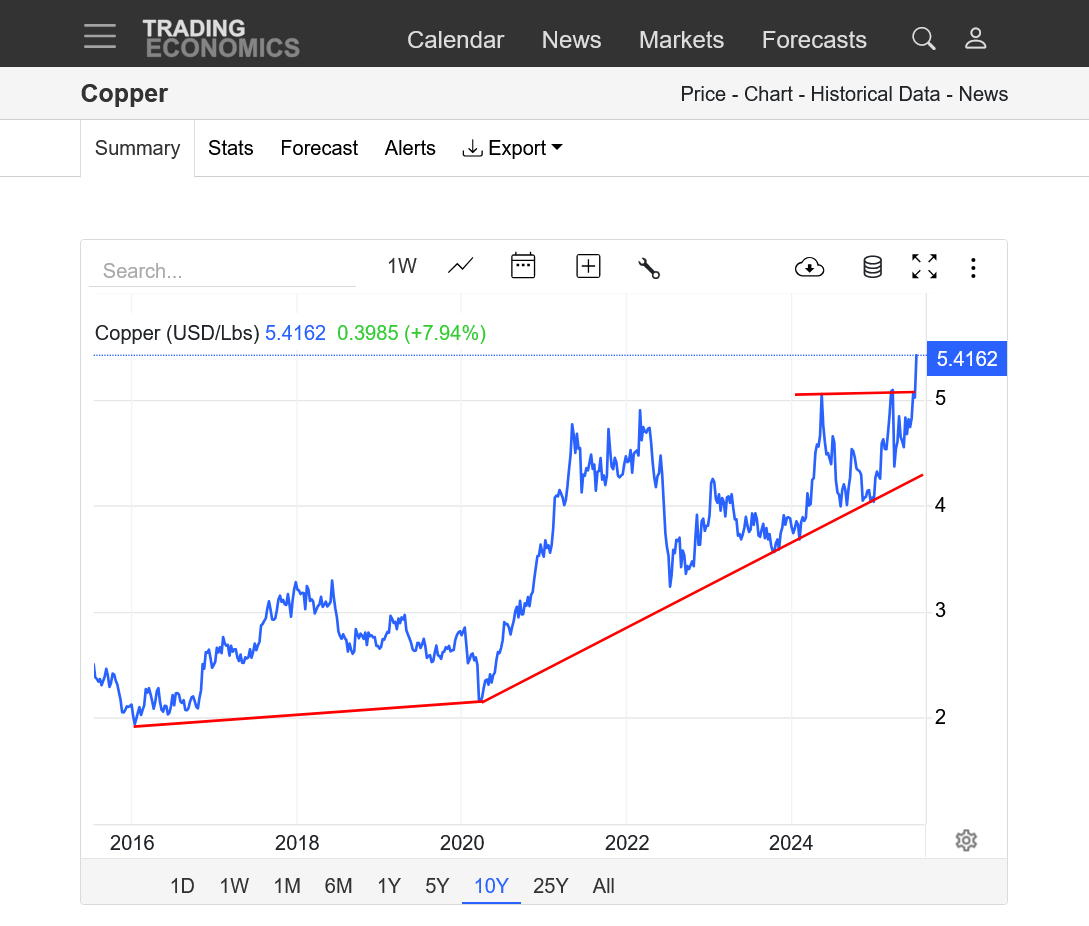
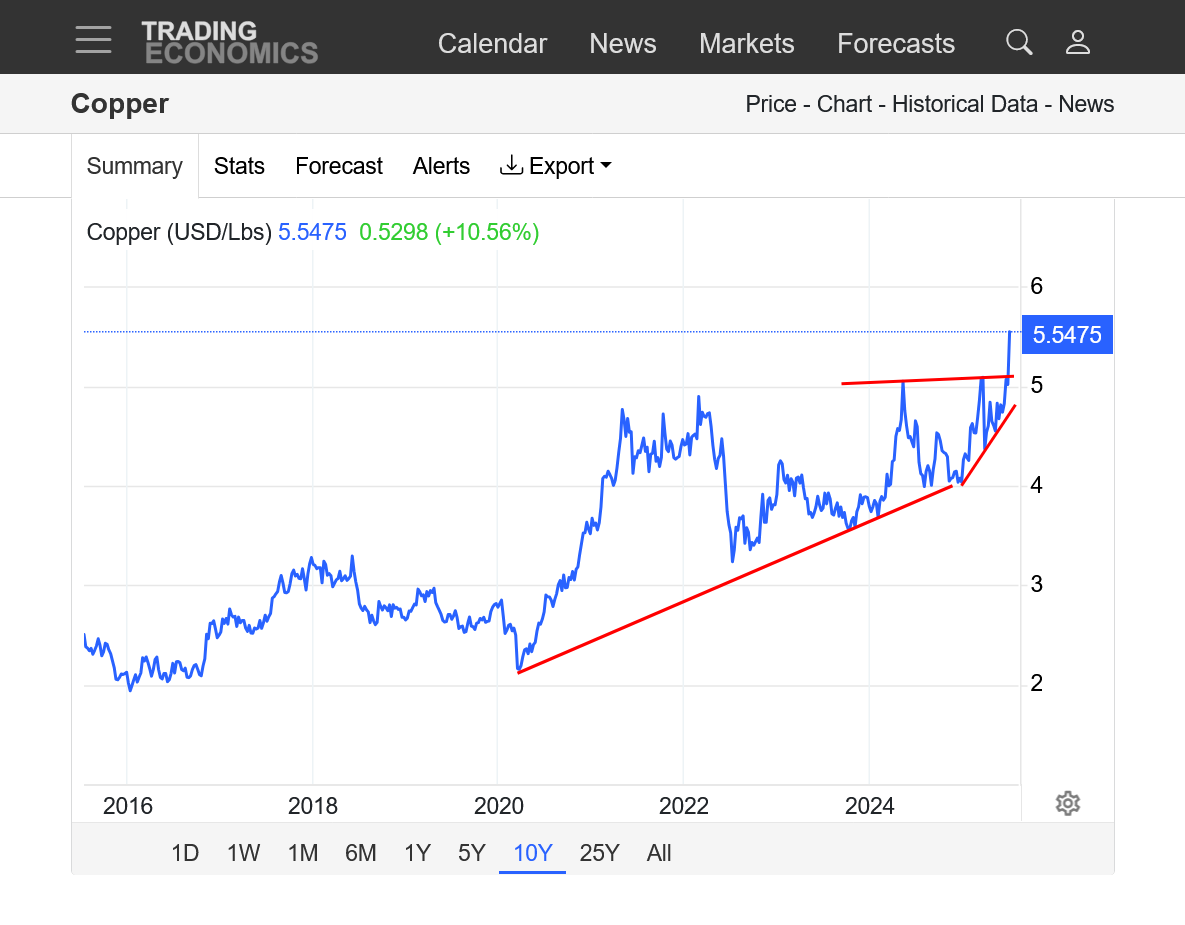
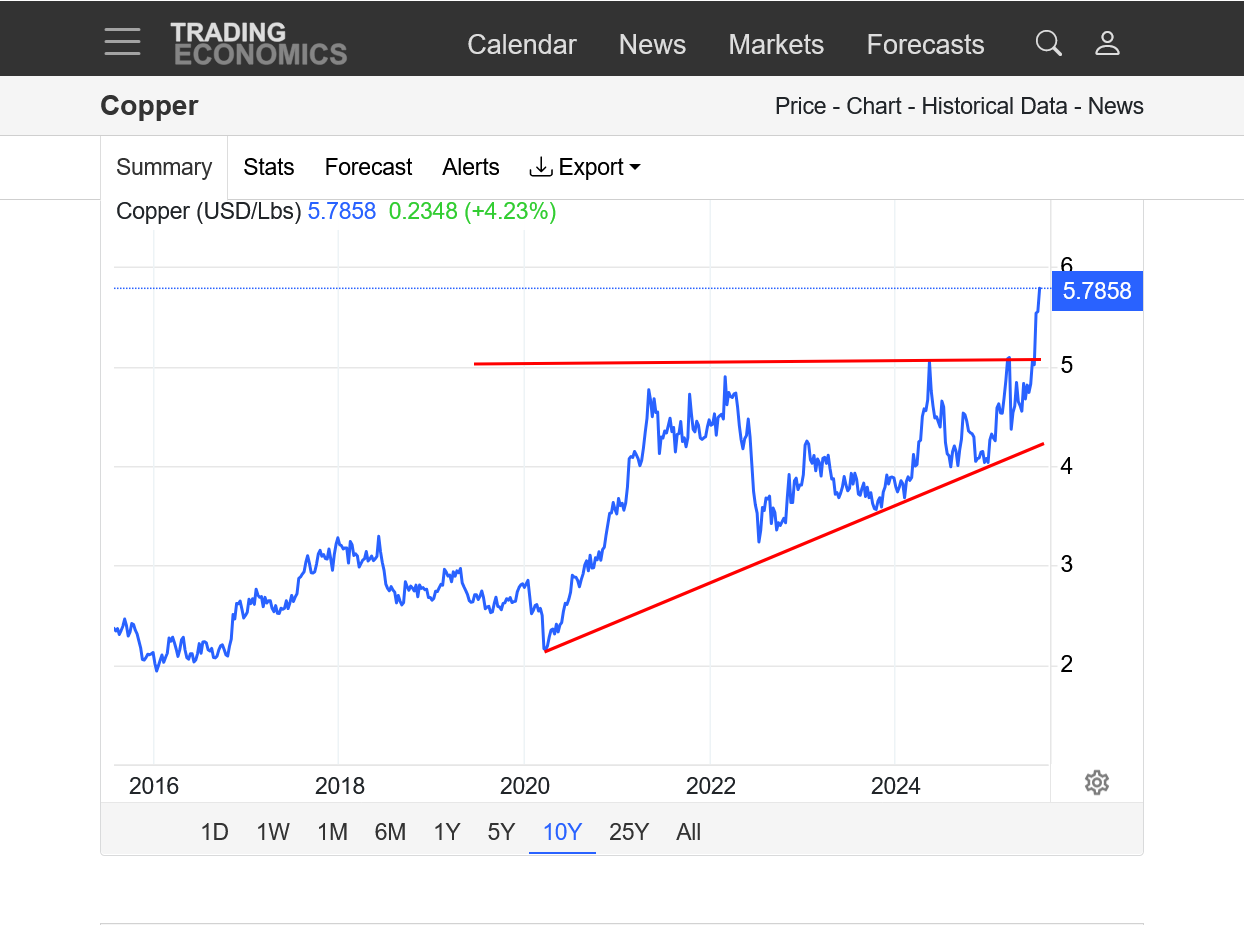
5. 10 years-Price is 2.5 times what it was a decade ago. Steepening slope of the up trending line. Major breakout today, well above previous highs. Probably hit tons of buy stops.
+++++++++++++++++
https://www.copperweld.com/blog/what-does-5-lb-copper-mean-for-the-building-wire-market
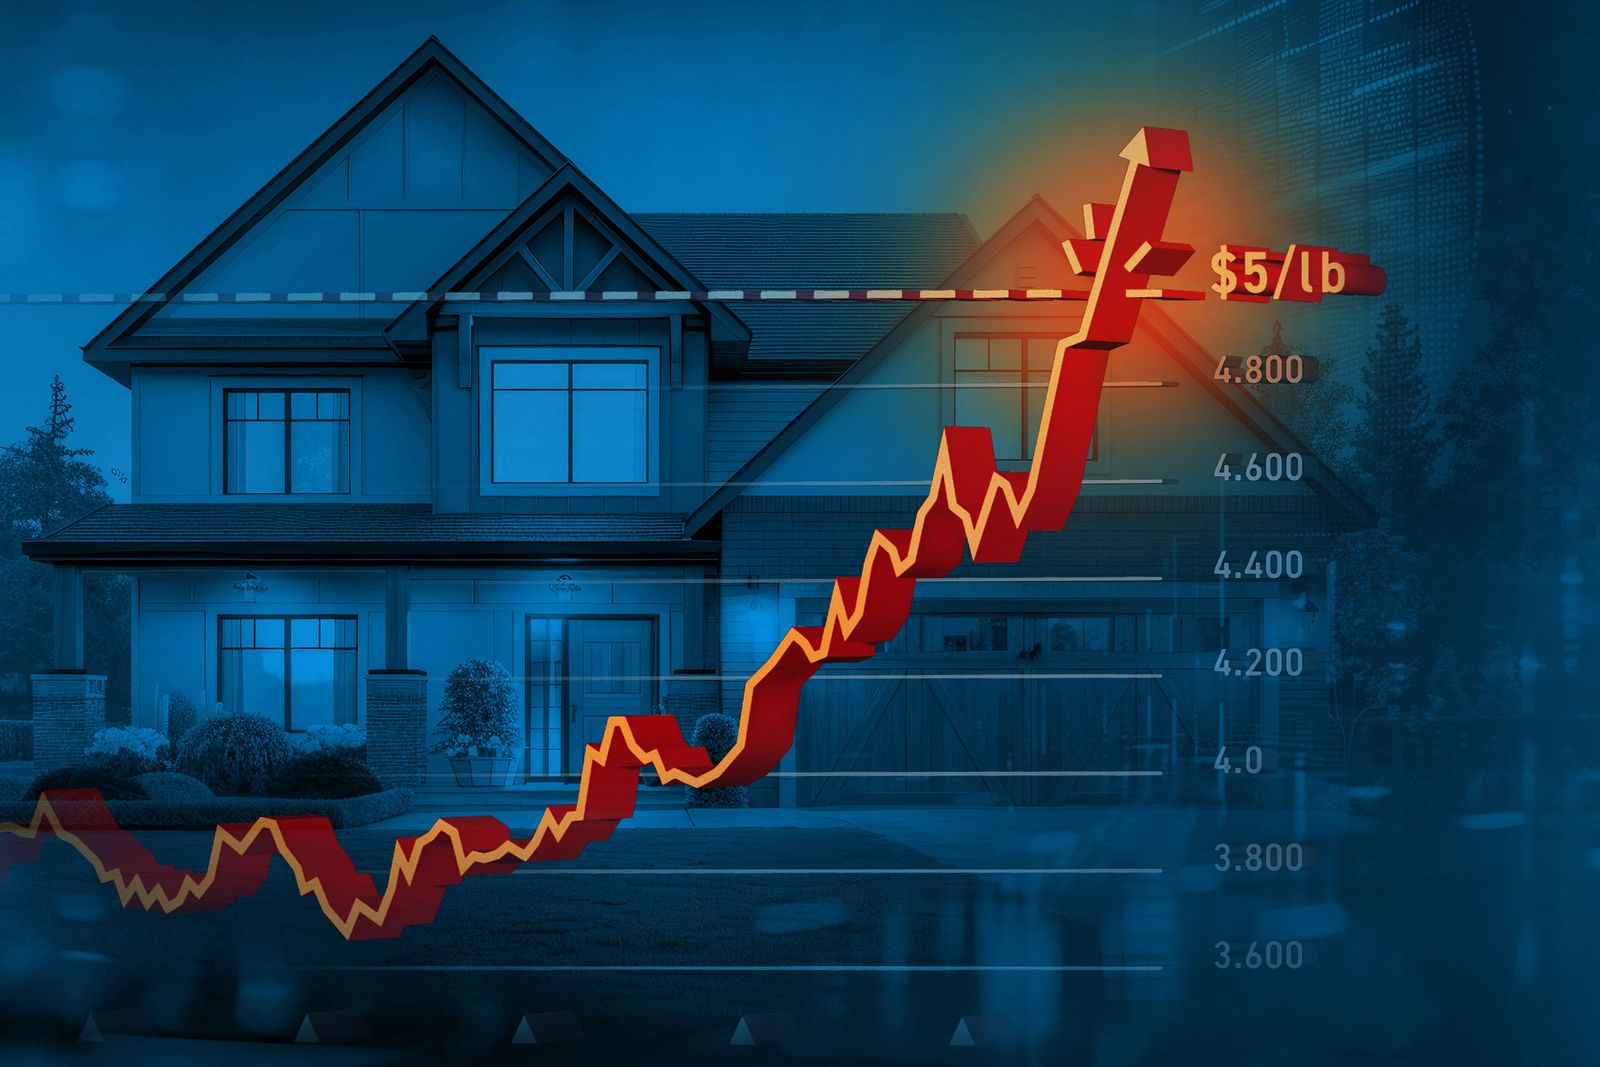
As a result of these factors, the U.S. Department of Energy classified copper as a “Critical Material” in their 2023 report.3 This classification is reserved for a substance that the Secretary of Energy designates as “a high risk of supply chain disruption; and serves an essential function in one or more energy technologies.”4
The greater a market’s reliance on a critical material, the greater its vulnerability to instability.
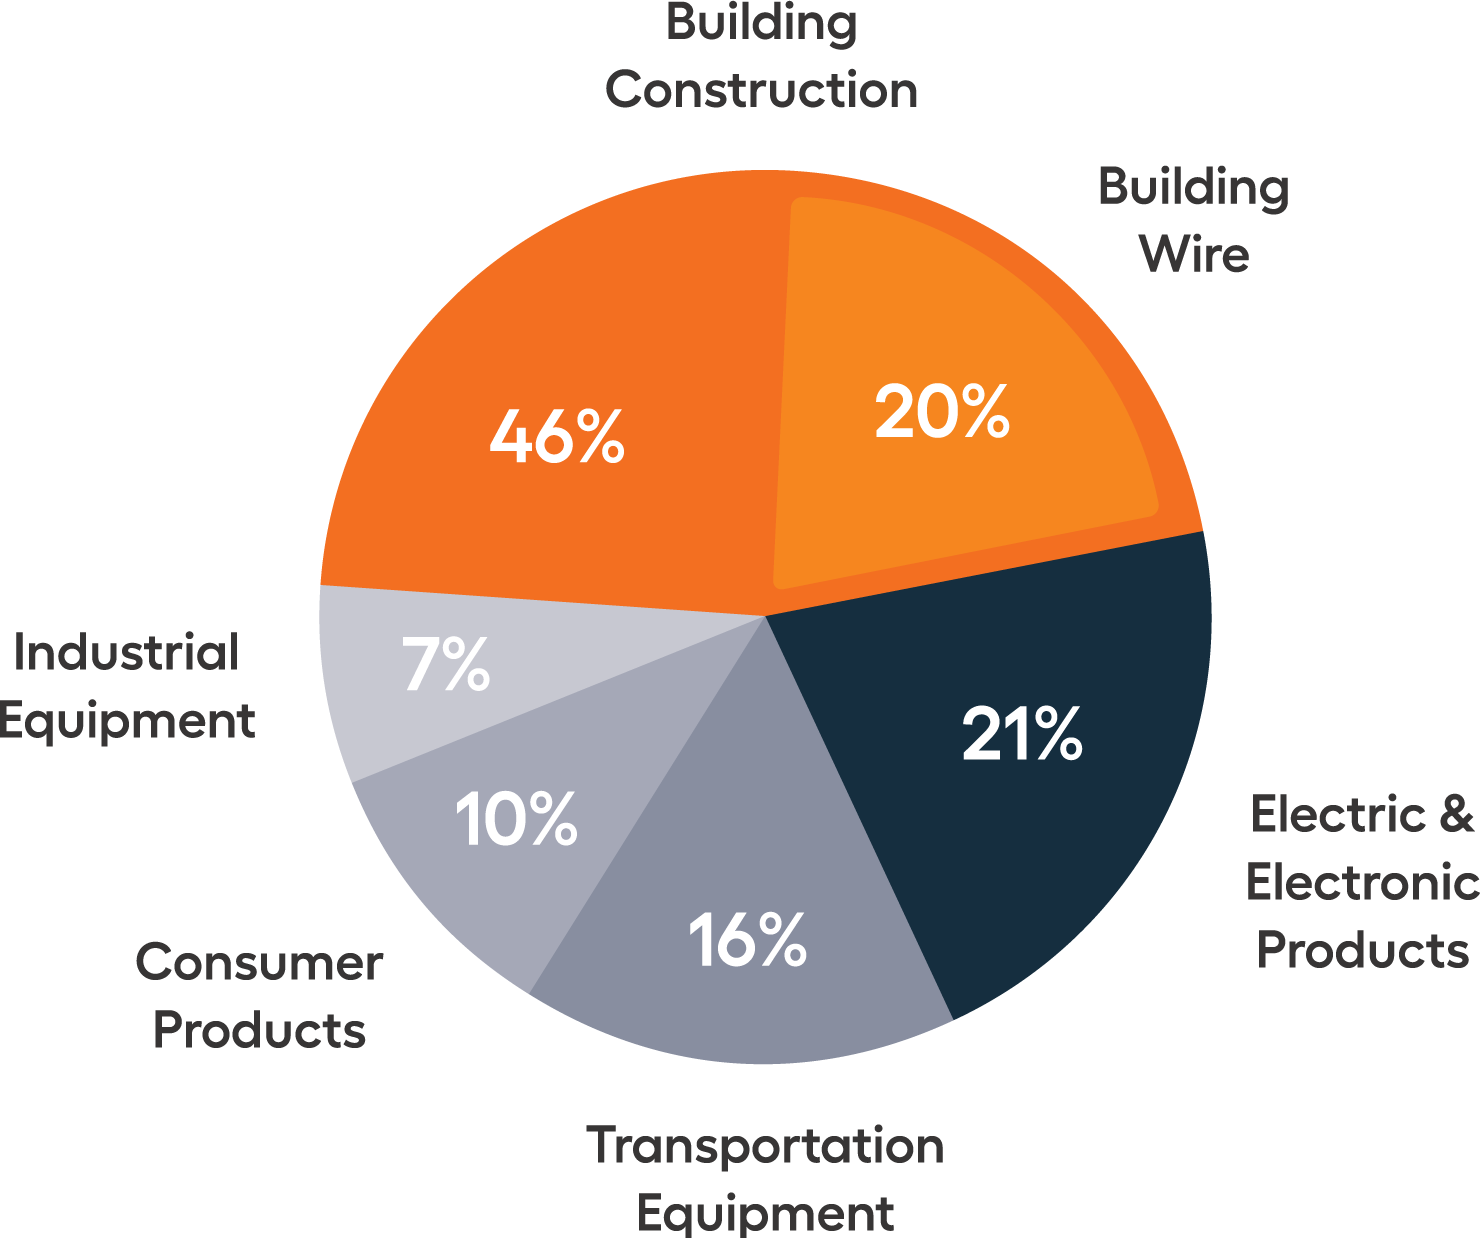
Few industries will feel the impact of record-setting copper price increases like the construction industry, which accounts for almost half (46%) of the nation’s copper supply. According to the United States Geological Survey (USGS), within the construction industry, building wire alone uses 20% of the total U.S. copper supply.5, 6
The price of copper has an outsized impact on the price of building wire.
Steep increases in building wire costs
Over the past few months, builders and electrical contractors who use solid-copper building wire have felt the financial and administrative fallout of record-setting building wire costs. When copper prices spike, building costs soar, requiring copper price approvals, re-estimations, construction delays, and slower cycle times. These factors devastate budgets, reduce profits, and frustrate relationships.
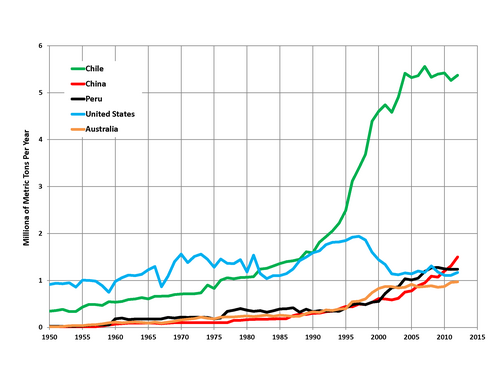
https://en.wikipedia.org/wiki/List_of_countries_by_copper_production
| Rank | Country/Region | 2024 Production (× 1000 tons) |
|---|---|---|
| 1 | 5,300 | |
| 2 | 3,300 | |
| 3 | 2,600 | |
| 4 | 1,800 | |
| 5 | 1,100 | |
| 6 | 1,100 | |
| 7 | 930 | |
| 8 | 800 | |
| 9 | 740 | |
| 10 | 700 |
How things have changed in a century+ !!!!!!!
| Rank | Country/region | Production (× 1000 tons)[2] |
|---|---|---|
| — | World | 723 |
| 1 | 399 | |
| 2 | 61 | |
| 3 | 50 | |
| 4 | 50 | |
| 5 | 42 | |
| 6 | 27 | |
| 7 | 21 | |
| 8 | 15 | |
Copper has continued strong in the early overnight trade.
https://tradingeconomics.com/commodity/copper
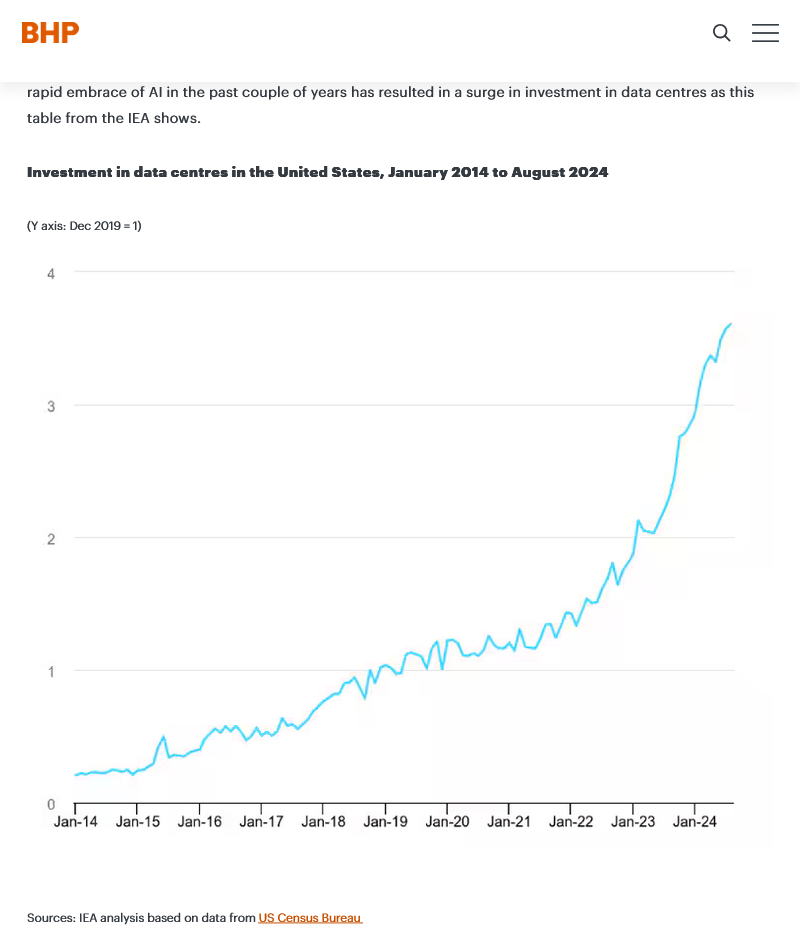
On the demand side it has been talked about (on another venue) the volume needed for these new data centers is large.
WONDERFUL point, cutworm!
++++++++++++++
Potential top(short term speculative buying exhaustion) from the knee jerk reaction to the latest Trump tariff news about copper.
This interpretation is VERY low for predictive value.
https://tradingeconomics.com/commodity/copper
Copper held its gains this week and is closing strong. This will put inflationary/upward pressure on prices in the United States as will all of Trumps wacko tariffs later this year.
1. 1 week
2. 10 years. Accelerating uptrend. Huge upside breakout to record high prices.
https://tradingeconomics.com/commodity/copper
The triangle in copper is about to end. Will it break up or down? The pennate formation will suggest higher prices, but we will see.
copper breaking to new highs
Holy Copper, cutworm it sure is!!!
https://tradingeconomics.com/commodity/copper
1. 1 month: July 8, Trump announces copper tariffs. Upside break out to new all time highs this week. Great observation, cutworm!
2. 10 years. Huge upside break out from a bullish, ascending wedge formation the past 5 years(since the COVID 2020 lows). This is very inflationary!
After a false break out copper is now 60 cents less than when the tariffs were announced and nearing the april 9 low. The last 2 days copper has fallen about $1.20
Edit : I do not trade copper
Holy Cow, cutworm!!
thanks for posting this!
I hadn’t looked this week But will,post the updated graph when back in my office.
Obviously tied to the deal with Europe.
Sorry for the delay.
1. 1 week: It looks like the news that hit copper, caused it to plunge just after noon on Wednesday
2. 1 year-Spike up from tariff news in early July with new all time highs. Then spike down on Wednesday from news and trading WELL BELOW the level before the bullish news. Significant major top in place from what looks like a panic buying exhaustion.
3. 10 years-still holding the uptrend line but getting close to testing it. With the charts signalling a MAJOR TOPIC and buying exhaustion, it's likely we could break below the long term uptrend channel.
Published · Updated
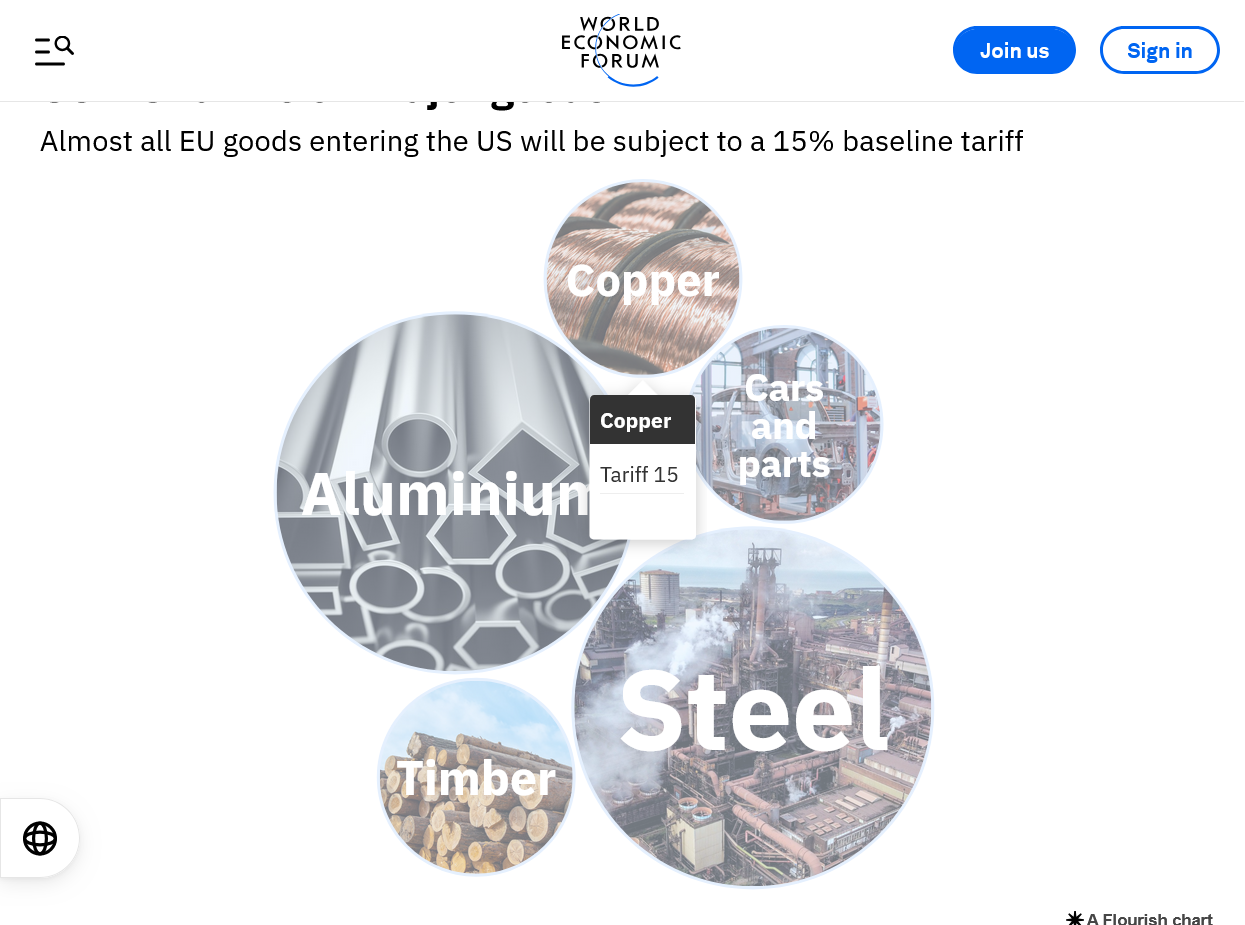
It appears that the sudden tariff adjustment/announced on copper falling from 50% to 15% was the trigger for the huge spike lower.
Does that match up with your observation, cutworm? Others?
+++++++++++++
These constant, random changes that President Trump pulls out of his arse, sometimes with no logical rhyme or reason is causing those in industries that need reliable information to make future plans that drive our economy.......to be uncertain and to hold off making commitments needed for future growth in our country.
Copper has been holding steady after the insane spike up from Trump tariffs, then a 20% drop in just 1 day, after he took them off some key suppliers. That drop represented a range, in just 1 day that was much greater than the range for any ENTIRE YEAR in history(except for 2022). In a matter of hours, we dropped more than the price from the high to the low of any year in history other than 2022!!!
https://tradingeconomics.com/commodity/copper
1. 1 year: Behold, the most incredible spike in copper history in 1 day on July 29/30!! Still hold the longer term uptrend but also at some previous resistance.
2. 10 years: Still in the long term uptrend. More than double the price of a decade ago. April 2022 had a similar spike lower but it took 3 months to play out, not 1 day.