Grains 7-27-25
54 responses | 0 likes
Started by metmike - July 27, 2025, 8:39 p.m.

Previous thread:


                USDA June 30, 2025           

                            93 responses |           

                Started by metmike - June 30, 2025, 12:14 p.m

https://www.marketforum.com/forum/topic/112905/


Beans gapped lower on the open because of  bearish weather. Corn is also lower! Neither of them can add to early losses. 

Comments
By metmike - July 28, 2025, 12:14 a.m.
Like Reply

Corn and Beans act like they don't want to go lower.

The HUUUGE risk for the bears in beans right now is if Trump announces some sort of trade deal with China.

I would be careful being short beans for anything but day trades.

If Trump announced a trade deal with China while the market is closed, it WILL open double digits higher.

30c+ higher is possible on the next open.  Maybe much more than that because hundreds of  traders would, all at once want out of their shorts (panic buying) with traders interested in selling, holding off until the spike/surge and buying subside. So the market would need to go to a price high enough to uncover enough fresh selling to match up with the enormous buying on the open. 

If the market opened 30c+ higher, traders that are holding short and suddenly under water,  could panic and want out at the market which could provide a spike to limit up even.  

At least with a day trade, you can have a trailing stop to limit the risk to Xc or whatever your risk tolerance is.


By tjc - July 28, 2025, 7:56 a.m.
Like Reply

I actually covered my SX short (1021 fill at close Friday) when beans started holding the 1016 level  around 9:30 pm. I then placed a buy at 1014 and went to bed.  Now long 1014.  stop 1009.5


Bitcoin next long!

By metmike - July 28, 2025, 8:19 a.m.
Like Reply

Thanks, tjc!

I don't see the weather as being powerful enough (for me) to drive prices.

If we'd been going up a lot from bullish weather, I would be looking for a short based on this overall bearish forecast and the crop getting closer to being made.

Since we're closer to the lows, like you I would usually be looking to go long but the weather is currently too bearish. Even though it will be getting drier in several places in August, it's not hot enough and soil moisture is wonderful in most places right now.

++++++++++++++++

At this time of year, the week 1 forecast with this much rain, will usually trump everything else.

7 Day Total precipitation below:

http://www.wpc.ncep.noaa.govcdx /qpf/p168i.gif?1530796126

http://www.wpc.ncep.noaa.gov/qpf/p168i.gif?1530796126


Soil moisture is as good as it gets in the United States/Cornbelt in late July!  The dryness in NE/IA has been wiped out!

Last 7 days rain below:

Static map

              Previous 7 days:

            https://www.marketforum.com/forum/topic/83844/#83853

Soilmoisture anomaly:

These maps sometimes take a day to catch up to incorporate the latest data(the bottom map is only updated once a week).


https://www.cpc.ncep.noaa.gov/products/Soilmst_Monitoring/US/Soilmst/Soilmst.shtml#


Daily Soil Moisture Pecentile

After a very cool period, week 2 will start heating up again but NO DOME and more rains coming!

https://www.marketforum.com/forum/topic/83844/#83852


All the weather here:

https://www.marketforum.com/forum/topic/83844/


By metmike - July 28, 2025, 8:47 a.m.
Like Reply

These were the CDDs from the last 0z European Ensemble model for just the Midwest. Below average for a week(below normal temps) heating up in week 2 but with good rains.


August 11th, 500 mb map.

NO THREAT from the dome with northwest flow around the periphery and perturbations in the northwest flow(vorticity in yellow) tracking around the periphery of the heat ridge into the Cornbelt.

The northern stream which is bringing the very cool weather this week has retreated back into Canada.

By metmike - July 28, 2025, 4:38 p.m.
Like Reply

Weather remains BEARISH!

Karen Braun@kannbwx

US corn conditions fall 1 point as expected, but soybeans rise 2 points instead of the predicted 1pt decline. Spring wheat & cotton conditions also fell on the week. Don't forget: USDA has US spring wheat yield close to the year-ago levels (49% ge now vs 74% ge yr ago).

Bears could gap lower on the open tonight with the improvement compared to expectations.(3% better).

This was after a big drop last week, that followed a big improvement the week before. Not sure why the market would have expected a decline with that great weather last week, especially in IL.

+++++++++++


US soybean conditions rise 2 pts on the week to 70% good/excellent. Improvements across top states - including a 5pt jump in top producer Illinois - offset various declines. 70% g/e is the week's best rating since 2020

US corn conditions fall 1 pt on the week based on declines in Minnesota and a few other states. But the I-states each improved by 1 pt. Top grower Iowa's corn crop is now 87% good/excellent, the best score for any week since 1994.

Image
Grains 7-27-25
0 likes
By metmike - July 28, 2025, 6:22 p.m.
Like Reply

Eric was in with his excellent weather presentation:

July 28, 2025: DAMAGING WINDS | Heatwave Ends Soon | Tropics Dominate August (MJO vs Hurricanes)...

https://www.youtube.com/watch?v=RRgkVHKu5yw


By metmike - July 29, 2025, 11:06 a.m.
Like Reply

Matt is in with the weather today:

July 29, 2025: IA/MN Derecho | More Severe Today | Cooldown Coming | Comparing Augusts 2014 & 2016

https://www.youtube.com/watch?v=Xbuylfyb_SU&t=7s

By metmike - July 30, 2025, 9:23 a.m.
Like Reply

Same bearish forecast, like a broken record here on the morning of 7-30-25

1.  This was the just out 6z GEFS for total precip thru 384 hours. Light blue is at least 2" of rain the next 2 weeks. The southwest parts of the Cornbelt get the least rain but even there, it's CLOSE TO average. The I states have 2" or more which is a bit ABOVE average. Temps warm back up in week 2 but no dome threat.


2. There were the CDDs from the last 0z(purple line on the right) European Ensemble model. Cool week 1, then heating up in week 2. Not quite as hot on this last run in week 2.


3. Upper level, 500 mb chart from the last 0z EE on August 14th.  Heat ridge/dome in the southwest with ridging into the C/S Plains. Perturbations around the periphery of the ridge, tracking in northwest flow into the Midwest and triggering several chances for shwrs and t'shwrs that continue in week 2  and keeping the ridge from expanding. 

To be bullish, that heat ridge/dome would need to shift northeast, at least 500 miles from its current forecast position on the models.


By metmike - July 30, 2025, 10:19 a.m.
Like Reply

If not for Trump's tariffs completely shutting down all of our soybean exports to our #1 soybean trading partner, China for numerous months, beans would be at least 50c higher. Maybe $1 higher?

China's leader is a very sharp and stable guy that isn't going to be intimated by President Trump. 

He's watching things fall apart with Trumps tariffs and personal life and like he usually does is using his brain and good judgment to do what's best for China. In 2025, that has meant buying all of China's beans from South America, even paying higher prices than our beans in the US. 

If Trump keeps extending his deadlines with China for a few more months, the United States, which has already lost sales of alot of ag. products will completely miss out on locking in sales of new crop this Fall. 

The great weather and promise for a big crop is already putting pressure on prices. 

NOBODY can do much about the weather. We should be glad it's going to gift us with more robust new crop supplies. As usual, that means lower prices than we have when the weather is bad and the crop is smaller.

However, OUR PRESIDENT has 100% control of our trading policies with China and he is hanging the US farmer out to dry. The export market is a key determinant for demand of our products. Exports to China has been intentionally shut down for reasons that are counterproductive. 

This is a lose-lose situation!  Hopefully, something will change soon before our producers lose even more money. 

A sudden deal with China, although not able to get back lost sales so far could spike beans by 50c in a day.

Considering all the negatives, it's amazing beans and corn won't go any lower. They continue to act pretty resilient considering how bearish the weather forecast is and how good the current crop is. 

When a market can't go any lower on bearish news.......its often a subtle sign of underlying bullishness.

However, another thought is that traders are afraid to pile on the new shorts because if Trump suddenly makes a deal with China, all those new shorts will get crushed badly. 

Maybe we'll see a  reaction after the August 1st deadline passes and he mover the goal posts again.

This really is NOT a good trading environment for anybody. So much uncertainty and pain for US producers. 


By metmike - July 31, 2025, 10:38 a.m.
Like Reply

Rain amounts have dropped off in a big way on the latest 6z GEFS.

This could be a big enough change to turn the C and S back up!

Let me assess this better and report back later today!

By metmike - July 31, 2025, 10:56 a.m.
Like Reply

The last 0z European Ensemble model is not quite as dry but does have the same idea with a pretty big drier than average pocket, centered over IA, extending a bit south and all the way north/northeast to Canada.

The problem is that its WET to the west of that and at least average rains to the east.

To REALLY be bullish, we need to incorporate more drier than normal terrain but this is DEFINITELY A BIG START.

I feel that if this dry area expands, the lows will be in. 

The next week will be very cool in the Midwest, so any stress on the crops will take a long time to develop and not happen until mid August. This is actually what happened last year, with a  flash DROUGHT developing in the ECB.

It's LATE in the growing season but kernel fill for corn is still going on for another month and August is a KEY time frame for beans to fill pods. The 2024 pods in many ECB states were small compared to average from the flash drought in late August/September. 

Bullish weather in August does not generate nearly the buying from large specs that bullish weather in June/July or earlier does. The market knows that XX% of the crop is already made. So the impact is not nearly as great. Every day is a day closer to harvest and new crop supplies too, with typical seasonal pressure as we approach that time frame. 

The other HUGE wild card is the tariff deadline with China coming up tomorrow.  A deal could spike the beans 50c+ immediately. No deal, like has been the case the 4 pat months means more ZERO exports of beans to China, the main buyer of our beans. No deal thru the harvest will continue to kill sales at the most important time of year.
it’s hard to be bullish beans against ZERO exports to China.


The CDDs on the last 0z EE were a whopping -7 CDDs. Quite a bit cooler, so temperatures were more bearish/cooler overnight, especially in the week 2 period that will be heating up.


Grains 7-27-25
0 likes
By metmike - Aug. 1, 2025, 8:54 a.m.
Like Reply

The forecast rains are leaning BULLISH now, especial on the European model! However, temps on the  last 6z GEFS cooled off alot late in week 2(and the GEFS has closer to average rains) and Trumps tariffs on China are mega bearish and  KILLING BEAN PRICES. 

'

7 Day Total precipitation below:

http://www.wpc.ncep.noaa.govcdx /qpf/p168i.gif?1530796126

http://www.wpc.ncep.noaa.gov/qpf/p168i.gif?1530796126


This was rain departure from normal  for the next 2 week on the last 0z European Ensemble model:


These were the rains on the last 6z GEFS model for the same time frame used above. Not AS dry but IA is the epicenter of the slightly drier than average tendency in the Central Cornbelt. 

++++++++++++++++

These were the CDDs from just the Midwest from that last 0Z EE model above. +5 CCDs.........so HOTTER than the previous 12z run, all from more week 2 heat.  This is why the forecast that includes the drier forecast on the EE model is bullish on that model.  The greatest heat, however is also where some rains will hit in the far northwest belt.


Here's the last 500 mb map from that last 0z EE run. The dome in still to far southwest to be a threat and the Midwest continues in northwest flow with chances for perturbations coming around the periphery of the heat ridge trigger rains in the Cornbelt.

However, in August, historically northwest flow DRIES UP compared to the WETTER June/July analogs. Soils are wet enough right now so that they will still help to add more rain to weather systems coming thru. It will be hard to hurt the crop with this much soil moisture, now that we are in August.  That is, without the heat ridge/dome shifting at least another 600+ miles northeast or the rains completely shutting down. 


https://www.cpc.ncep.noaa.gov/products/Soilmst_Monitoring/US/Soilmst/Soilmst.shtml#

By metmike - Aug. 1, 2025, 4:43 p.m.
Like Reply

Low skill weeks 3-4 which are the last 2 weeks in August. Still important for pod fill on beans and late corn kernel fill. Temps especially are important for filling corn kernels. Rain is especially important for pod fill.

With ample soil moisture, much higher than most years to start August, it will be hard to hurt this crop with the forecast below. All it will do is get us that much closer to the crop being made and harvested, starting in September.

https://www.cpc.ncep.noaa.gov/products/predictions/WK34/

+++++++++++++

Regardless of that unreliable forecast above, I'm leaning towards some drier trends for the next 2 weeks.

1. This was the last 12z European Ensemble model for rainfall anomalies the next 2 weeks. Drier than average thru much of the belt. Wetter than average in the far northwest. Keep in mind that August averages drop off from June/July so there will be net drying for, 70-80% of the crop. 

2. These were temps for days 5-15. By mid August we'll have a lot of places that need a drink with top soil shortages expanding. Below the topsoil, the entire moisture profile is recharged most places so losses might only be shaving a few bushels off the top. Temps above average will increase drying rates, however and deplete soil moisture faster and plant requirements more. 

3. 500mb map for August 16th: The dome/upper level ridge still needs to shift farther northeast. This is still a northwest flow into the Midwest situation with 1 HUGE potential difference. Instead of taking the green, above average rains southeast from the Northern Plains, the models DRY UP most of the rains from systems coming around the periphery of the upper level ridge and diving into the Midwest. 

This is actually a seasonal thing in August where northwest flow into the Midwest is often DRY compared to northwest flow in June/July. Perturbations in the flow are often weaker too. Some of this is related to soil moisture drying up, so our moist soils MIGHT offset that strong drier tendency, THIS year. 


By metmike - Aug. 2, 2025, 9:15 a.m.
Like Reply

Aug 1, 2025: Lots of Smoke | Drier & Cooler Midwest | Suppressed Tropical Atlantic | Don’t Trust...

https://www.youtube.com/watch?v=3qA2Gdtpdu4

++++++++++++++=


7 Day Total precipitation below:

http://www.wpc.ncep.noaa.govcdx /qpf/p168i.gif?1530796126

http://www.wpc.ncep.noaa.gov/qpf/p168i.gif?1530796126


1. These were the total 2 week rain departures from the last 0z European Ensemble model. This is modestly bullish in my opinion but there are some opposing bearish forces(soil moisture-China tariffs-seasonals still negative-negative technicals). Northwest flow in August usually dries out compared to June/July. With moist soils,  perturbations in the northwest flow might be more productive that a typical August????

2.  500 mb map for August 17th. Need that big upper level ridge to shift much farther northeast. 

3. Temp departure from Aug 7-17. Drying/evaporation rates will be elevated. Combined with below average rainfall, the  top soils will be pretty dried out later this month. This is modestly bullish!

By metmike - Aug. 2, 2025, 9:19 a.m.
Like Reply
By route66rebel - Aug. 4, 2025, 7:14 a.m.
Like Reply

Totally get your point  weather alone might not move markets, especially with good soil moisture. Still, staying on top of temps helps; check our 180 c to f oven temperature guide for quick conversions.

By metmike - Aug. 4, 2025, 9:46 a.m.
Like Reply

Hi route66rebel!
Welcome to MarketForum. I see you have a product that converts oven temperatures from Celsius to Fahrenheit.

Corn and soybeans grow in temperatures far lower than 180 Deg. C.  

We look forward to your comments about conditions in the ambient atmosphere that impact things that grow. 


Grains 7-27-25
0 likes
By metmike - Aug. 4, 2025, 9:54 a.m.
Like Reply

I continue to NOT be bearish because of  weather but uncertain on how much the modestly bullish weather can have to offset some bearish underlying impacts. 

1.  This was the last 2 week precip map from the last 0z European Ensemble model. It's actually NOT AS dry as 2 days ago, especially over key producer, IA. Not optimal for pod fill but soil moisture is still good at the moment(but it will dry out)

2. CDDs for just the Midwest have it heating up again, so there will be some modest HEAT FILL for corn but then temps trail off in week 2(though still  WELL above average). There will be some heat fill for corn.


By metmike - Aug. 4, 2025, 10:42 a.m.
Like Reply

Beans are trying to reverse up and have upside break out to the downtrend, made much worse from the loss of exports to China from Trumps tariffs.

https://tradingeconomics.com/commodity/soybeans

1. 1 week

2. 1 month

3. 1 year

4. 10 years


By metmike - Aug. 4, 2025, 2:05 p.m.
Like Reply

This is the reason for the beans strength today:

@kannbwx

US inspections data dropped a bit late this morning. Soybeans are the big story, coming in way above expectations. Mexico, Egypt & Europe led, but no China shipments. Wheat came in at the top end of expectations and corn remains on its above-average pace.

Image


This was soybeans' best week in four months. Definitely not petering out at the end of the MY. The corn number was modest relative to recent weeks but certainly strong in historical context. Wheat was strong as well last week.

ImageImageImage

+++++++++++++

metmike: The cure for low prices?

LOW prices which increases demand!

How long will this weak bounce off of lows last? Is it a low? Probably not, unless Trump opens trading back up with China, our #1 buyer of beans.

Corn is closing on contract lows today.

Wheat is closing NEAR the contract lows made today.

Beans closed off the highs.

The market must be anticipating another BEARISH crop condition which makes sense considering the weather recently. Seasonally, this time of year the crop rating slowly declines(with declining soil moisture and maturation)..

Just maintaining the same rating from the week before is bearish as it gets the crop 1 week closer to being made and to harvest, so at the very least that means more price risk premium bleeds out. 

+++++++++++++++

All the comprehensive weather here:

https://www.marketforum.com/forum/topic/83844/

RAINS THE PAST 7 DAYS:(this is a HUGE factor for the latest crop ratings)

https://www.wunderground.com/maps/precipitation/weekly


Thru 8-4-25


Thru 7-27-25

Static map


https://www.marketforum.com/forum/topic/83844/#83853


Soilmoisture anomaly:

These maps sometimes take a day to catch up to incorporate the latest data(the bottom map is only updated once a week).
https://www.cpc.ncep.noaa.gov/products/Soilmst_Monitoring/US/Soilmst/Soilmst.shtml#


Daily Soil Moisture Pecentile

DROUGHT MONITOR

https://droughtmonitor.unl.edu/

Drought area in the Cornbelt has been almost completely eliminated!!!


This makes it almost impossible to seriously hurt the growing crops at this stage in maturity. Last year was an exception, however because of the flash drought that happened in August/September.

This DID hurt pod fill SIGNIFICANTLY but incredibly, the USDA didn't recognize  that until the JANUARY 2025 report, almost 3 months AFTER the crop was harvested. Disgraceful!

FLASH BACK/FLASH DROUGHT......1 year ago/2024:

Dryness has spread in the central USA over the last eight weeks. Some 66% of the Midwest (the most since mid-March) is now abnormally dry versus 13% in mid-July.

Image

        USDA January 10, 2025/grains            

                            Started by metmike - Jan. 10, 2025, 11:38 a.m.    

        https://www.marketforum.com/forum/topic/109451/#109481


                : USDA January 10, 2025                     

                By metmike - Jan. 10, 2025, noon           

 EXTREMELY BULLISH!!!!!!!!

++++++++++++++++++++++++++               

                USDA January 10, 2025                        

                By metmike - Jan. 10, 2025, 12:45 p.m.       

By metmike - Aug. 4, 2025, 3:29 p.m.
Like Reply

1. This was the just out 12z European Ensemble model for 2 week anomalies.  This is DRY but NOT as dry as last year but has the potential to turn into a flash drought in many places if it amplifies. But just the opposite happened since Friday!

2. The top map is MUCH WETTER in key state IA compared to 3 days ago, 8-1-25.  But the top, last map takes away rains in many other, NON Cornbelt places. Some of that is from rains that fell already the past 3 days. However

Map from 3 days ago below:

+++++++++++

3pm: The last 12z GEFS model has a much different idea for total 2 week rains.

Active northwest flow in the Midwest around the periphery of heat ridges is often wet in June/July but seasonally dries up in August. The GEFS rain profile below suggests it will stay active, where the EE at the top DOES dry it up in IA. 

I can spend all day analyzing this but it's not going to increase the forecast skill because the skill is limited to the models and they disagree a great deal and have UNDER forecast rains much of the Summer.  

There is no rain suppressing dome. 

By metmike - Aug. 4, 2025, 4:13 p.m.
Like Reply

Karen Braun@kannbwx

Corn and cotton conditions are steady on the week, beans and spring wheat drop by 1 point. Spring wheat harvest has begun, and winter wheat harvest is wrapping up. More than half of the US soybean crop is now setting pods, and cotton bolls are just opening.

Image

No surprises. We have a huge crop in the ground getting closer to being made, then harvested. 


By metmike - Aug. 4, 2025, 9:08 p.m.
Like Reply

Good crop ratings and 2 week forecasts that have been starting to add more rain again caused corn to gap lower tonight after closing on the lows(so any sort of lower open would be a gap lower).

Beans down too but holding the earlier lows, after the better than expected export inspections.

1. This was the 2 week rain map from the just out 18z GEFS model.  

2. The European Ensemble model has been much drier, especially in the Eastern Cornbelt. This again was that last 12z EE forecast for 2 weeks for comparison. Wow! The Upper Midwest and NW Cornbelt is actually WETTER on the EE model. 

+++++++++++++++++++++=

The last 2 runs of the GEFS also took away 10 CDDs. COOLER. The last 18z run is in purple on the right. 

By metmike - Aug. 5, 2025, 6:35 a.m.
Like Reply

The over night guidance was MUCH hotter! GEFS still,has good rains but the EE is still drier than average in the central and eastern belt.

Could be a gap and crapselling exhaustion low for corn?
Beans may have put in their low early on Monday.


7am: The 6z GEFS in purple came out LESS hot in week 2 that the previous 0 run-tan  but still hotter than previous runs. This is for just the Midwest.


By cutworm - Aug. 5, 2025, 9:05 a.m.
Like Reply

USDA report day is Aug 12

Grains 7-27-25
0 likes
By metmike - Aug. 5, 2025, 12:59 p.m.
Like Reply

Thanks, cutworm!

The grains were unable to get any traction after the overnight bounce from the HOTTER 0z runs. 

Still too much rain on the latest 6z GEFS(which backed off on the heat) which is the much wetter model(average rains) with good soil moisture and great crop conditions. 


This was the drier EE. Rainfall anomalies for 2 weeks. With the heat cranking up, things will be getting pretty dry by the end of August with this pattern. ........if the drier EE is correct.


This was the last 500 mb map on August 20 from that run. Looks to me like the northwest flow with perturbations could be trying to dry up as it usually does in August, compared to June/July. The heat ridge has also expanded farther northeast into the Cornbelt. 


By metmike - Aug. 5, 2025, 9:06 p.m.
Like Reply

1. This is the rain anomaly day map from the European Ensemble Weeklies which goes from today thru September 20th(46 days).

2. This was the temperature anomaly map. 


3. Rains the next week will still be robust in some key areas, especially the northwest half of the belt. IL/IN/OH not so. 

7 Day Total precipitation below:

http://www.wpc.ncep.noaa.govcdx /qpf/p168i.gif?1530796126

http://www.wpc.ncep.noaa.gov/qpf/p168i.gif?1530796126


However, it's after that point when I think the pattern continues to get drier and drier. With the heat, I'm thinking there will be areas that develop a flash drought by the end of August into September. Probably not AS bad as last year/2004 which was VERY BAD at the end of the growing season. However bad ENOUGH to cause modest heat fill for corn and mediocre late filling for soybean pods.

It NOT likely to show up in crop ratings. Crop ratings don't tell us what the kernels or pods are like, which is key to yields. If the plants looks green and healthy from the road, the ratings are high. 

That will continue for August. 

By metmike - Aug. 6, 2025, 12:58 a.m.
Like Reply

This was the last 35 day (to Sept. 9) rain anomaly from the GEFS model.

It's flipped the EE pattern.  The GEFS is WET in the ECB and dry in the WCB/Plains.


By cutworm - Aug. 6, 2025, 12:22 p.m.
Like Reply

https://farmdocdaily.illinois.edu/2023/10/the-relative-impact-of-crop-weather-variables-on-the-us-average-yield-of-corn.html

The same computations as in Figure 3 were made for each of the crop weather variables included in the model.  The results are presented in Figure 4.  Not surprisingly, July precipitation is easily the most important variable influencing the U.S. average yield of corn through time.  The second most important variable is July temperature with a range of 9.9 bushels per acre.  Some may be surprised by the importance of late planting, which has a range of 7.7 bushels.  While the impact of each percentage point increase in late planting is small, the variability of late planting year-to-year is quite large, as shown earlier in Table 2.  Hence, the wide range of late planting year-to-year accounts for its relatively large impact.  August temperature and precipitation along with April precipitation form the next group of variables, with ranges between 4.0 and 4.8 bushels.  All of the remaining crop weather variables have ranges less than two bushels.  In sum, the “big three” for determining the U.S. average yield of corn are July precipitation, July temperature, and late planting, with July precipitation taking the lead.

Implications

There is never a shortage of discussion about the impacts of growing season weather on the U.S. average yield of corn.  This year is a great example with a wide range of conditions across space and time.  While there is a general understanding of the importance of different weather variables on corn yield, there is less understanding about the relative magnitude of such impacts.  Here, we use a crop weather model to estimate the relative impacts of important weather variables on the U.S. average yield of corn.  The crop weather regression model uses data for 1980 through 2022 to relate the U.S. average corn yield to a time trend, the percentage of the crop planted late, and an array of weather variables.  We then consider a one-standard deviation range in impact for each of the crop weather variables to standardize for differences in the variation of each variable.  The analysis shows that July precipitation is easily the most important variable influencing the U.S. average yield of corn through time.  About two-thirds of the time, the impact of July precipitation on the U.S. average yield of corn is in a range of nearly 13 bushels per acre.  The second most important variable is July temperature and the third most important is late planting.  The bottom-line is that July precipitation truly is the “golden number” for U.S. corn yields.

By metmike - Aug. 6, 2025, 1:52 p.m.
Like Reply

cutworm, 

Outstanding post and outstanding study.

Some things that jump out at me before making a closer analysis.

1. On trading:  The crop is getting closer to being made every day after its in the ground. When May starts the market is extra sensitive to weather because there is May-June-July-Aug weather ahead to impact yields. A drought that starts in May can last for X # of months with the HIGHEST potential of cumulative damage. A drought that starts in August has a month left and most of the crop has been made. SPECULATORS will get less potential bang for their buck and HARVEST IS LOOMING. This mentality actually kicks in when we start July and the market starts taking out risk premium in chunks as the crop has less and less days left for weather to hurt it. 

2. This study does not appear to take soil moisture into account, although late planting does indirectly (too much early in the year). Soil moisture is important in August. Typically, as the growing season proceeds, soil moisture is drawn down, making August rains more important, even though they too dry up. The weather this year is LESS sensitive to rain because the crop has stored moisture in the ground to make up for dry weather. The STARTING CONDITIONS to each month are a key to how important weather will be that coming month. If we were dry right now with a dry forecast, August weather would play a bigger role for determining yields. 

3. Just from observation of the real world. Heat fill will do more damage and cool temps increase yields more in August than rains. This study has them about equal. Maybe because heat fill and lack of rain often happen at the same time. For the best yields, a very cool dry August is better than intense heat and wet weather.  I'll give you a powerful example to make my point using 2009 weather(cool-dry) vs 2010 weather(hot-wet) where the 2009 corn yields blew away those of 2010. 

                Re: Heat Fill for Corn            

                            By metmike - July 14, 2023, 3:01 p.m.            

4. 2024 was a good example of how dry August weather did impact corn yields. Bean yields were impacted much more of course because of pod filling. The USDA didn't even acknowledge it until january 2025 and all at once, months after the crop was harvested.

5.   Speculators are often looking at the harvest around the corner more than crop finishing weather in August but there is a small positive seasonal from the day of and just after the August crop report to early September that used to be known as "dialing in the risk of an early frost/freeze-or the frost premium rally" BEFORE climate change reduced that risk. It also can be from a temporary selling exhaustion in good crop years when the market runs out of sellers, who are getting short in June/July/early August on a constant increase in crop size estimates and bearish news that can no longer make the market go lower anymore. This often culminates with a sell the rumor, buy the fact price reaction to the August USDA report.  Sometimes with a huge spike lower from sell stops and panic/emotional orders of longs crying uncle that marks a peak and selling exhaustion that quickly reverts to the mentality of the "cure for low prices=low prices". Commercials see value at those cheap prices and increase coverage of their needs. Export sales may pick up. Speculators see more risk to reward shorting at prices this low when all the bearish news has been dialed in.


By metmike - Aug. 6, 2025, 3:02 p.m.
Like Reply

Corn had an interesting (BULLISH) reversal up today in the new crop December, especially that closed ON the highs (unch on the day=$402) after spiking below $4 then reversing up. I will speculate that major heat fill for kernels in the August forecast could be seen as bullish. 

This was a reversal up hammer candlestick with no body at the top because of the close ON the high and a long shadow below it. Candlestick John will really like this link/post. 

Hammer Candlestick: Formation and 7 Trading Strategies

https://www.xs.com/en/blog/hammer-candlestick/

hammer-candlestick

  • Small Real Body: The real body of the candle is small and located at the upper end of the trading range. This indicates that the opening and closing prices are close to each other.
  • Long Lower Shadow: The lower shadow (or wick) is typically at least twice the length of the real body.
    This long lower shadow shows that prices were driven down significantly during the , but strong buying pressure pushed the price back up.
  • Little to No Upper Shadow: There is usually little to no upper shadow, indicating that the price did not move significantly above the opening and closing levels.

+++++++++++++++++++++++++++++++++

The price charts below are for September, the front month which was not AS strong as the December, which is the new crop still in the ground, impacted by August weather.

1. 1 day-reversal up from spike lower, unch close on the stronger December contract

2. 1 week-reversal up but still much lower weekly prices this week vs last week

3. 1 month-reversal up is a tiny blip in a powerful downtrend that is still intact

4. 1 year-well below previous support and lowest price of the year

5. 10 years-lowest price since late 2020(COVID year). However, we're in a zone with some good support that should make it increasingly difficult to maintain prices this low for long(with so much demand).


 https://tradingeconomics.com/commodity/corn

By metmike - Aug. 7, 2025, 12:06 p.m.
Like Reply

Corn is confirming the BULLISH hammer candlestick signal from yesterday. This is the front month, September graphed below.

December is +4.75 at 406. This is the main month/new crop in the ground that is still being impacted by August weather. We spiked below $4 on Wednesday, hit lots of sell stops then found solid buying/support from traders that see this as value, risks higher than rewards being short and bullish heat coming for kernel fill in August and very oversold conditions.

How long will this last?  If the forecast would keep getting drier, the lows will likely be in for August(new lows in early harvest/Oct??)

The USDA August 12 crop report will be HUGE. cutworm tipped us off about that earlier in the week. Some of this could be short covering ahead of the report??

https://tradingeconomics.com/commodity/corn


By metmike - Aug. 7, 2025, 12:14 p.m.
Like Reply

It's tough to see on the charts below, but I mentioned the positive seasonal in August that used to be stronger several decades ago when we had elevated chances for early freeze damage, before the climate optimum with warmer temperatures kicked in.

This is usually a dead cat bounce, with new lows in early Oct from harvest pressure. 

Great site for seasonals!

https://equityclock.com/seasonality/

https://equityclock.com/charts/


https://charts.equityclock.com/corn-futures-c-seasonal-chart


https://charts.equityclock.com/soybeans-futures-s-seasonal-chart

By metmike - Aug. 7, 2025, 2 p.m.
Like Reply

Beans have also been showing a bottoming formation too THIS MONTH! This is the front month, September. 

Potential upside break out!

For sure the very steep down trend channel has been interrupted. This could just be a bear flag which is a continuation chart pattern. 

1 month graph below. 

https://tradingeconomics.com/commodity/soybeans

By metmike - Aug. 7, 2025, 3:21 p.m.
Like Reply

Eric was in with his awesome weather!

Aug 7, 2025: 3-Day Severe Storm Threat | Heat Spreads East | Tropics Continue To Show Development...

https://www.youtube.com/watch?v=iDKf7LMwgEk

+++++++++++++++++

 World , Vegetation Health Index (VHI): Current Week and One Year Ago

VHI of current year

https://www.star.nesdis.noaa.gov/smcd/emb/vci/VH/vh_browseVH.php


https://glam1.gsfc.nasa.gov/


I plotted 2025, 2024, 2023 and the last major drought year 2012 below. 2025, in red is a new record high for vegetative health in the United States. 

https://glam1.gsfc.nasa.gov/


China, below is also well into record high territory for vegetative health right now as the global climate optimum continues thanks to the increase in CO2!


By metmike - Aug. 8, 2025, 12:20 p.m.
Like Reply

The overnight 0z EE model was not as hot or as dry as the previous, several runs.

By metmike - Aug. 8, 2025, 4:53 p.m.
Like Reply

This is the area that is going to be vulnerable for a flash drought later this month that we've mentioned this month. 

There is tremendous risk of having a position ahead of and for the release of the USDA report on Tuesday but once we get past that, if the forecast continues to be this hot/dry, it should be pretty supportive for prices for the rest of August. Interestingly, this is similar to the forecast for the 2nd half of August into September in 2024............and we put in a low.


August 12, 2024 low in corn from the flash drought late in the growing season.

https://tradingeconomics.com/commodity/corn

+++++++++++++++++++

August 12, 2024 low in beans from the flash drought late in the growing season:

https://tradingeconomics.com/commodity/soybeans


August 12 USDA report bearish for soybeans

 August 12, 2024

https://ocj.com/2024/08/august-12-usda-report-bearish-for-soybeans/

+++++++++++++++++++

When the August report dials in some huge crops during years of high production, it often puts in a temporary low(sell the rumor-buy the fact), especially if the forecast is similar to last August and potentially THIS August. 

By metmike - Aug. 9, 2025, 3:45 p.m.
Like Reply

Automated forecasts on the Weekends. This is Saturday's week 2 precip. This is the area that may have the flash drought later this month.


However, week 1 rains in these wetter areas will protect them, even if it turns completely dry in week 2 in those areas. 

It's IL/IN/OH that are may be in trouble later this month into early September with the potential flash drought. 

7 Day Total precipitation below:

http://www.wpc.ncep.noaa.govcdx /qpf/p168i.gif?1530796126

http://www.wpc.ncep.noaa.gov/qpf/p168i.gif?1530796126


By metmike - Aug. 10, 2025, 9 p.m.
Like Reply

The latest models have introduced a mind boggling amount of cooling compared to the heat the models have been so emphatic about for the month of August.

This was the last run of the last 12z  European Ensemble in purple on the right for just the Midwest. A change of -21 CDDs. I can't remember this much cooling between runs in August!

A couple of days in week 2 are actually BELOW average now! This is especially bearish for corn because it slows the rate of maturity and adds many more days for the plants to fill kernels with sugars/energy.


The forecast is still turning drier and drier but taking out this much heat flips it to bearish now. 

The latest NWS extended automated temperature guidance(6-10/8-14 days) did NOT capture this big cooling. 


This is NOT enough rain in the 7 day forecast. Most of the Midwest will have net drying the next week, with some major heat thru week one. Some spots (that have missed rains so far this month, could be on the verge of flash drought status in pretty quick order)

7 Day Total precipitation below:

http://www.wpc.ncep.noaa.govcdx /qpf/p168i.gif?1530796126

http://www.wpc.ncep.noaa.gov/qpf/p168i.gif?1530796126


Total 2 week rains below from that last 12z EE run.  The EE model is driest.


Total week 2 rains from the last 6z GEFS model below. This model is not as dry in most places, other than MN/WI, where the EE is wet. 

By metmike - Aug. 11, 2025, 1:44 a.m.
Like Reply

Some sort of news hit the grains, especially the beans just before 10:30pm CDT.

We gained 20c in less than an hour. Not sure why.

Anybody else know?

By cutworm - Aug. 11, 2025, 7:35 a.m.
Like Reply

https://www.youtube.com/watch?v=zbmB6wliyHA

Trump on truth social 

China is worried about its shortage of soybeans. Our great farmers produce the most robust soybeans. I hope China will quickly quadruple its soybean orders. This is also a way of substantially reducing China’s Trade Deficit with the USA. Rapid service will be provided. Thank you President XI.


By metmike - Aug. 11, 2025, 8:55 a.m.
Like Reply

Thanks very much, cutworm!

That's  exactly what I suspected but couldn't find anything at the time. 

A person needs to be following Truth Social to get the latest market impacting Trump Tirade.

Trump pushes China to quadruple soybean orders ahead of truce tariff expiration

https://thehill.com/business/5445836-trump-china-trade-deficit/

++++++++++++++++++++

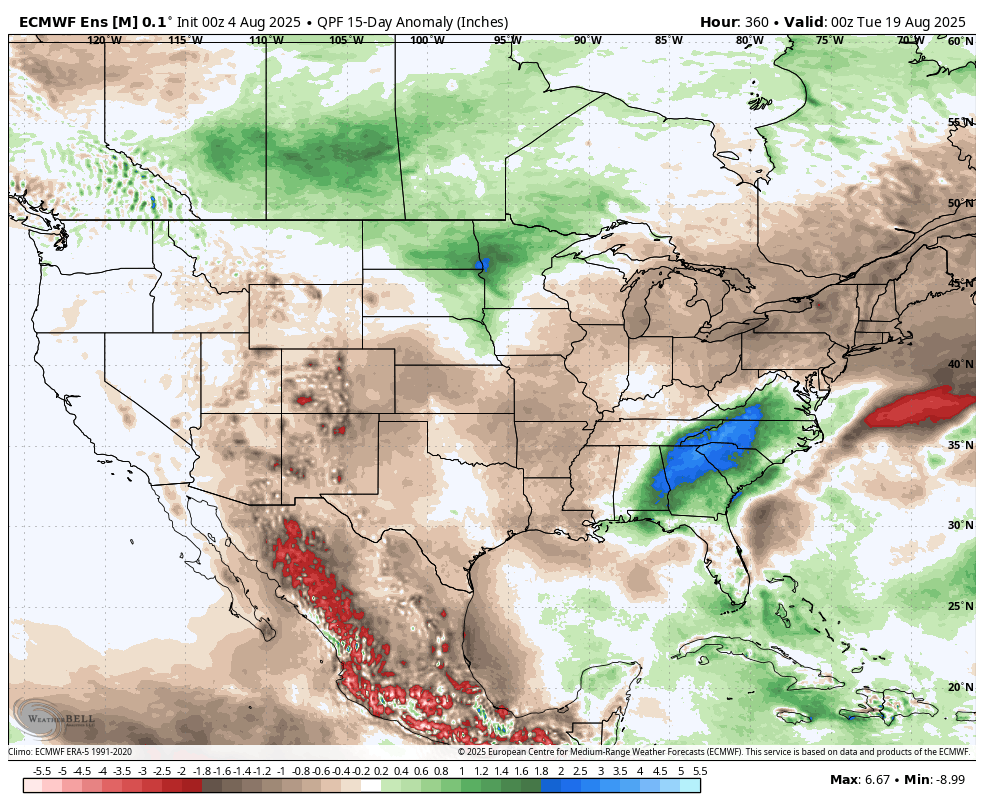
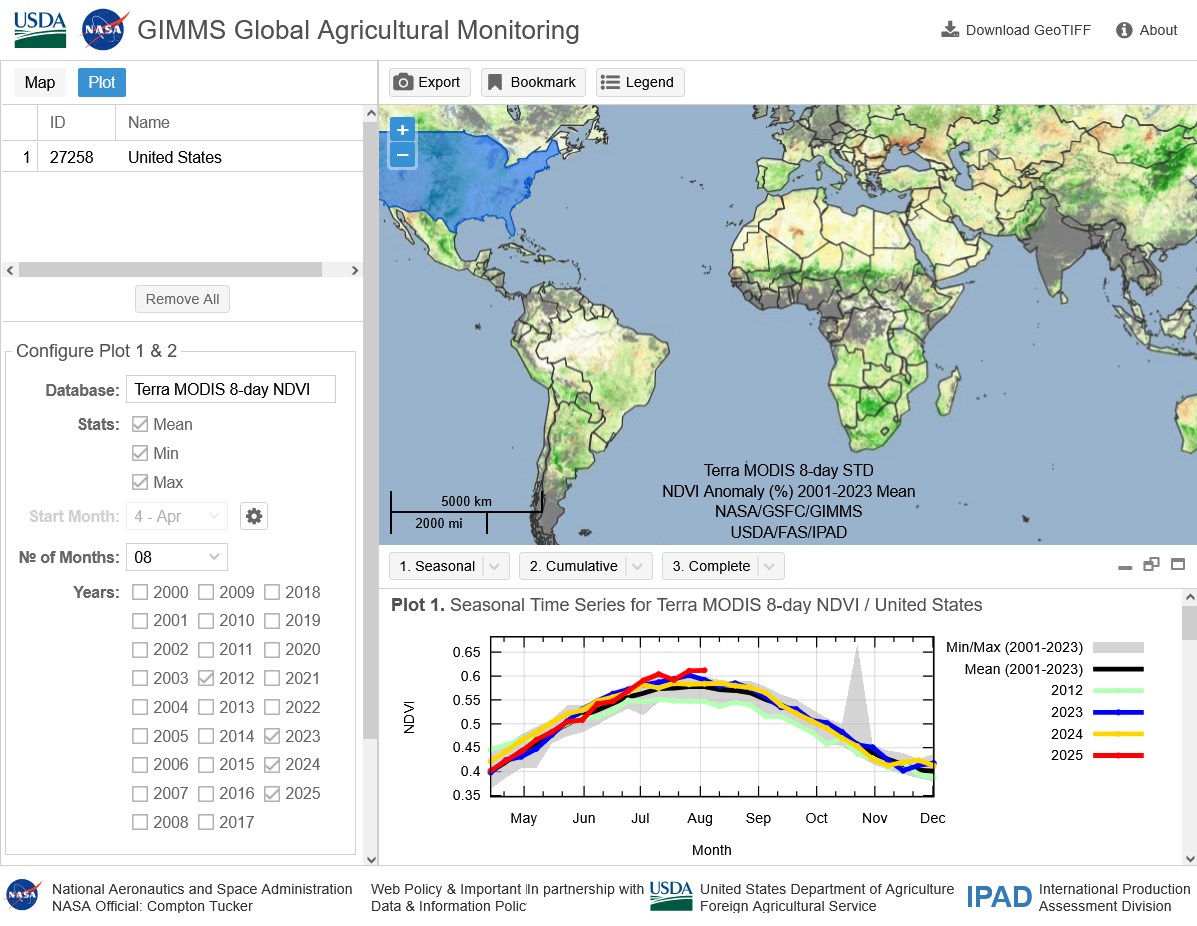
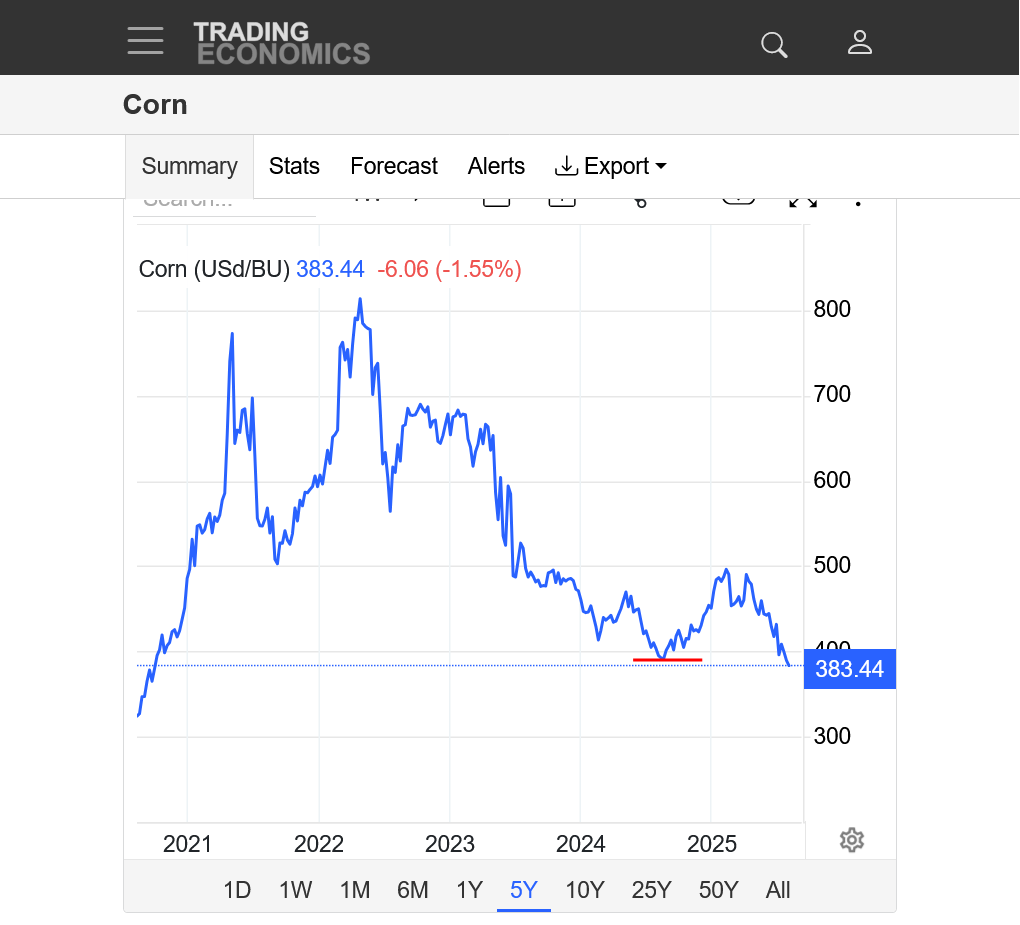
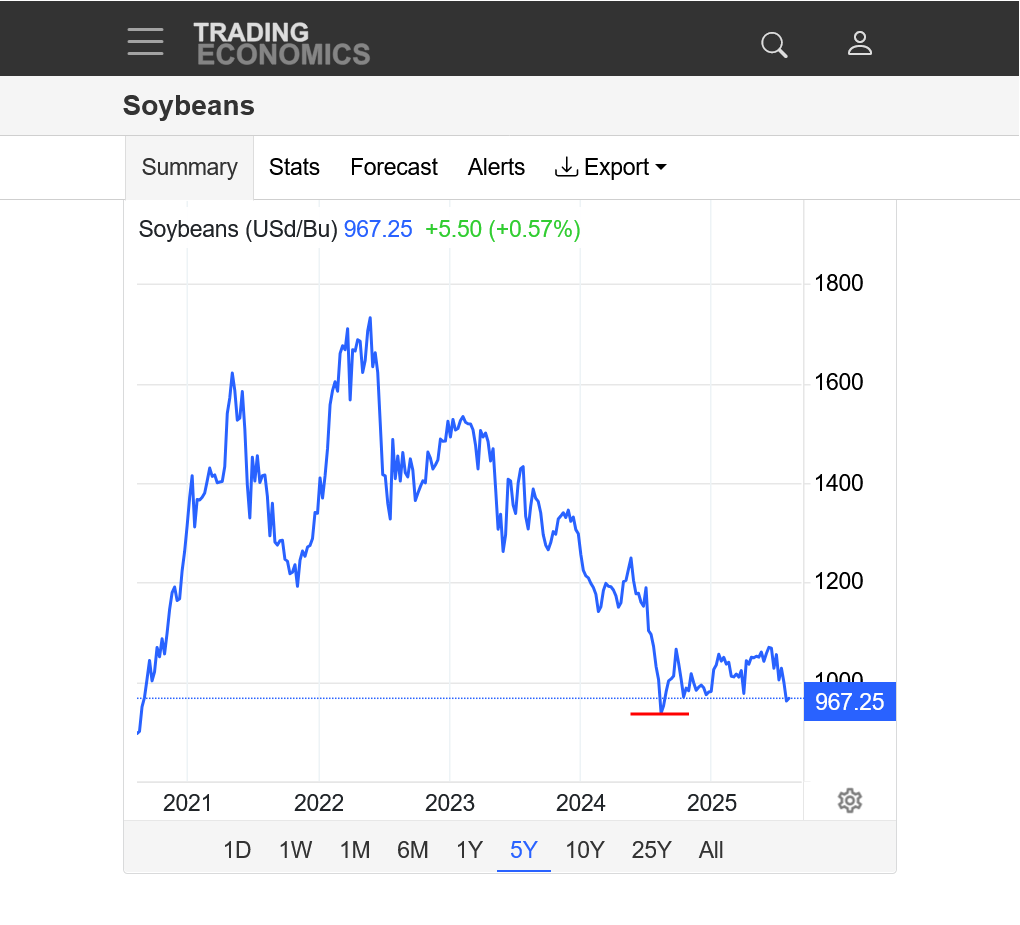
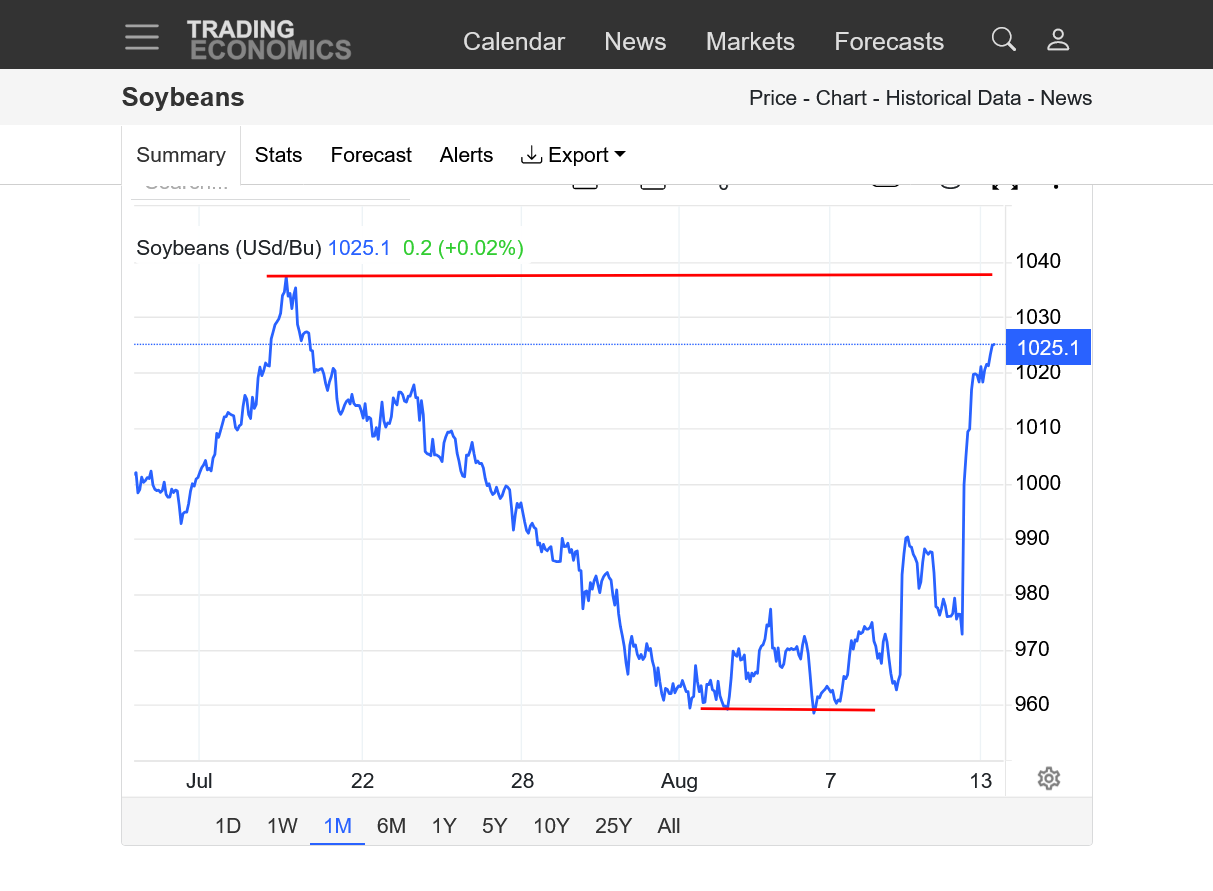
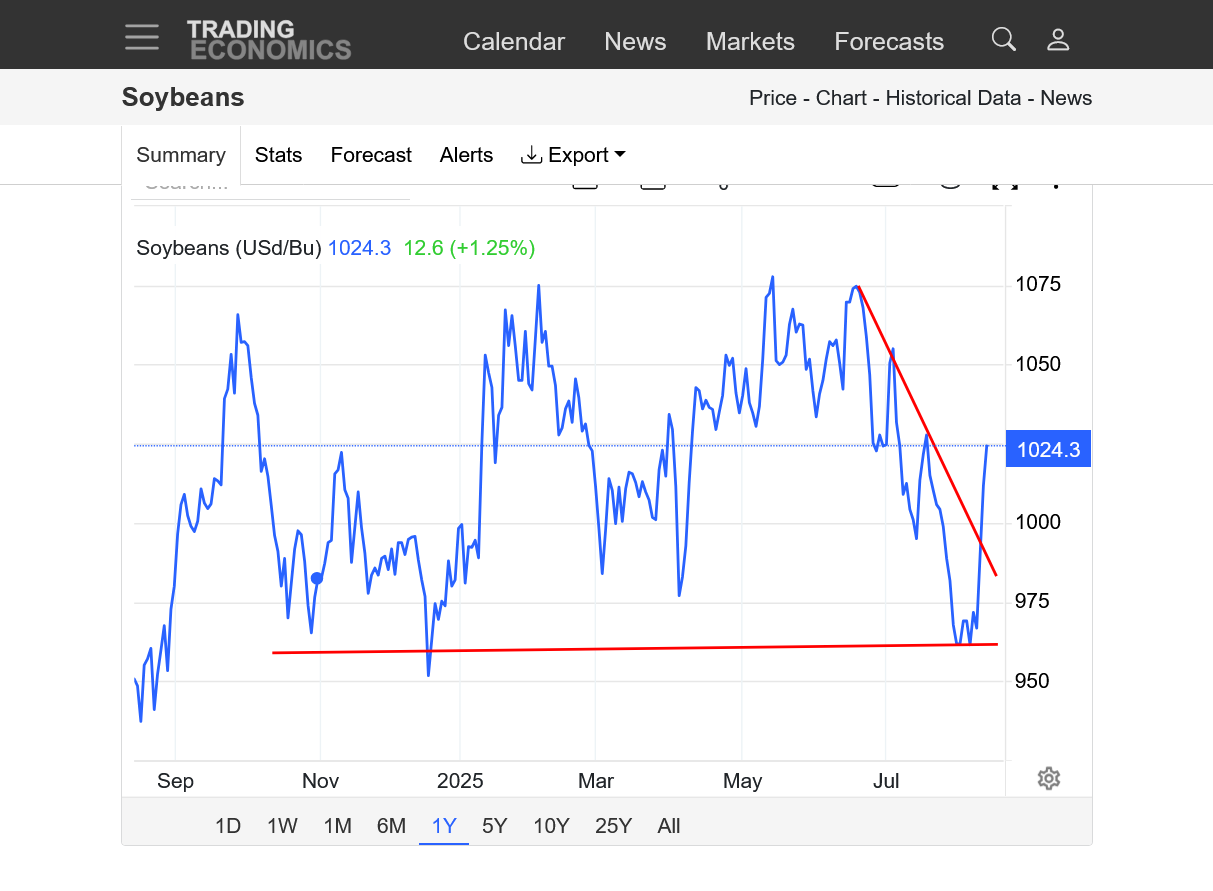
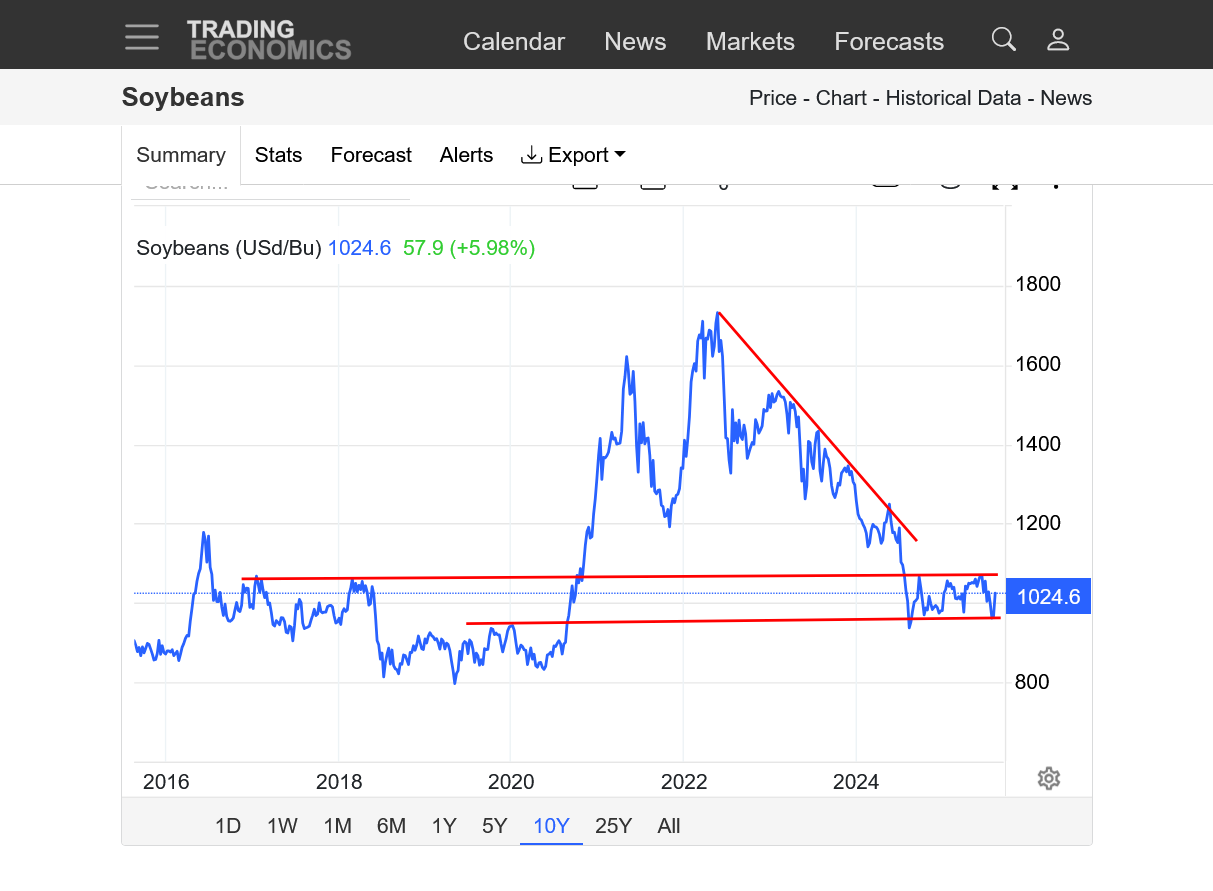
Ironic that as the damage mounts from Trump's disastrous tariffs policies, he KNOWS that this is why China(our number 1 buyer)  has bought 0.....ZERO soybeans for many months because of them.

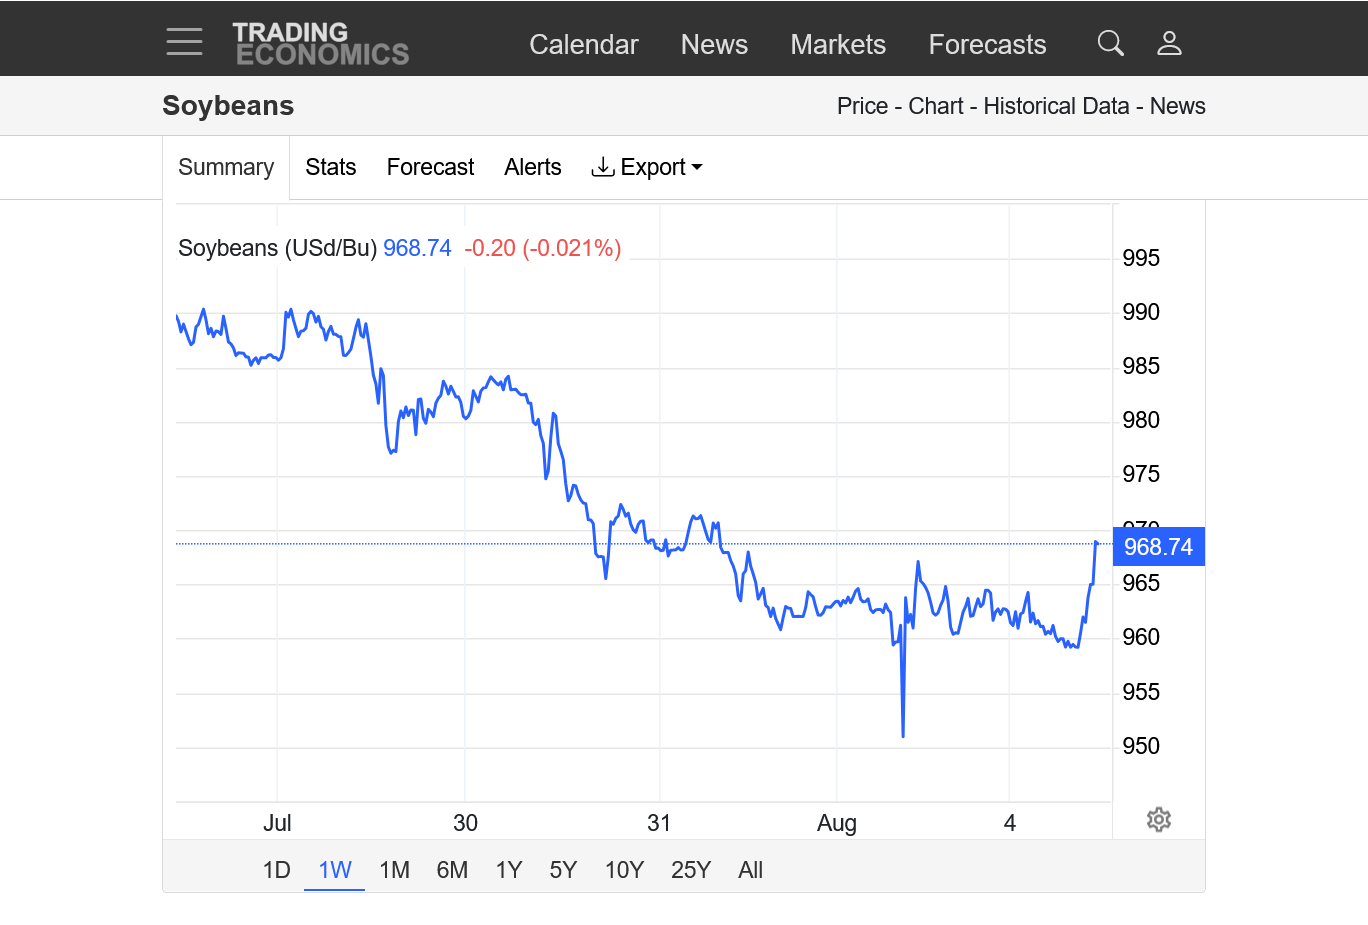
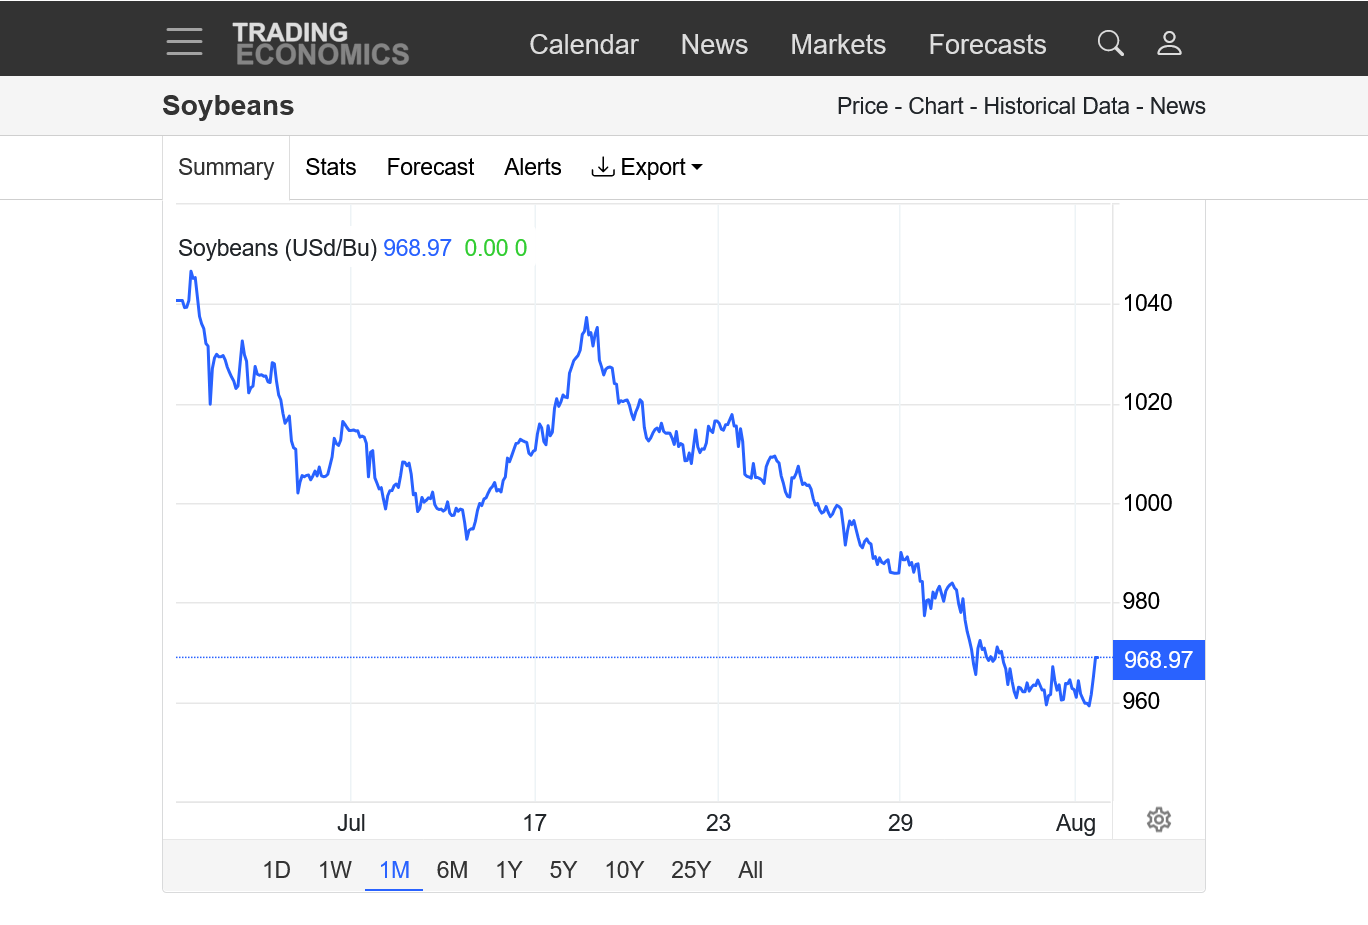
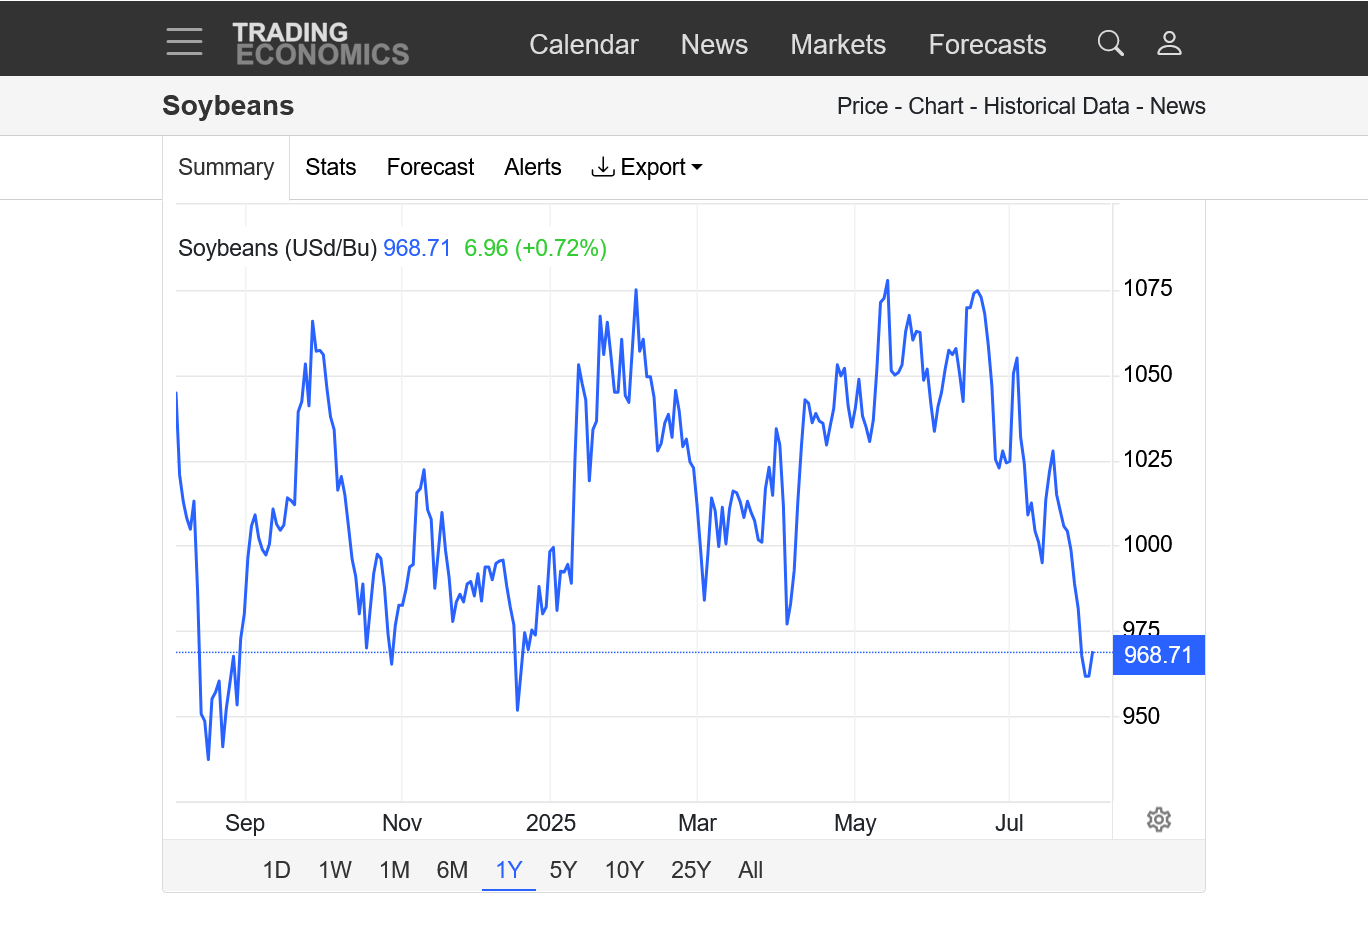
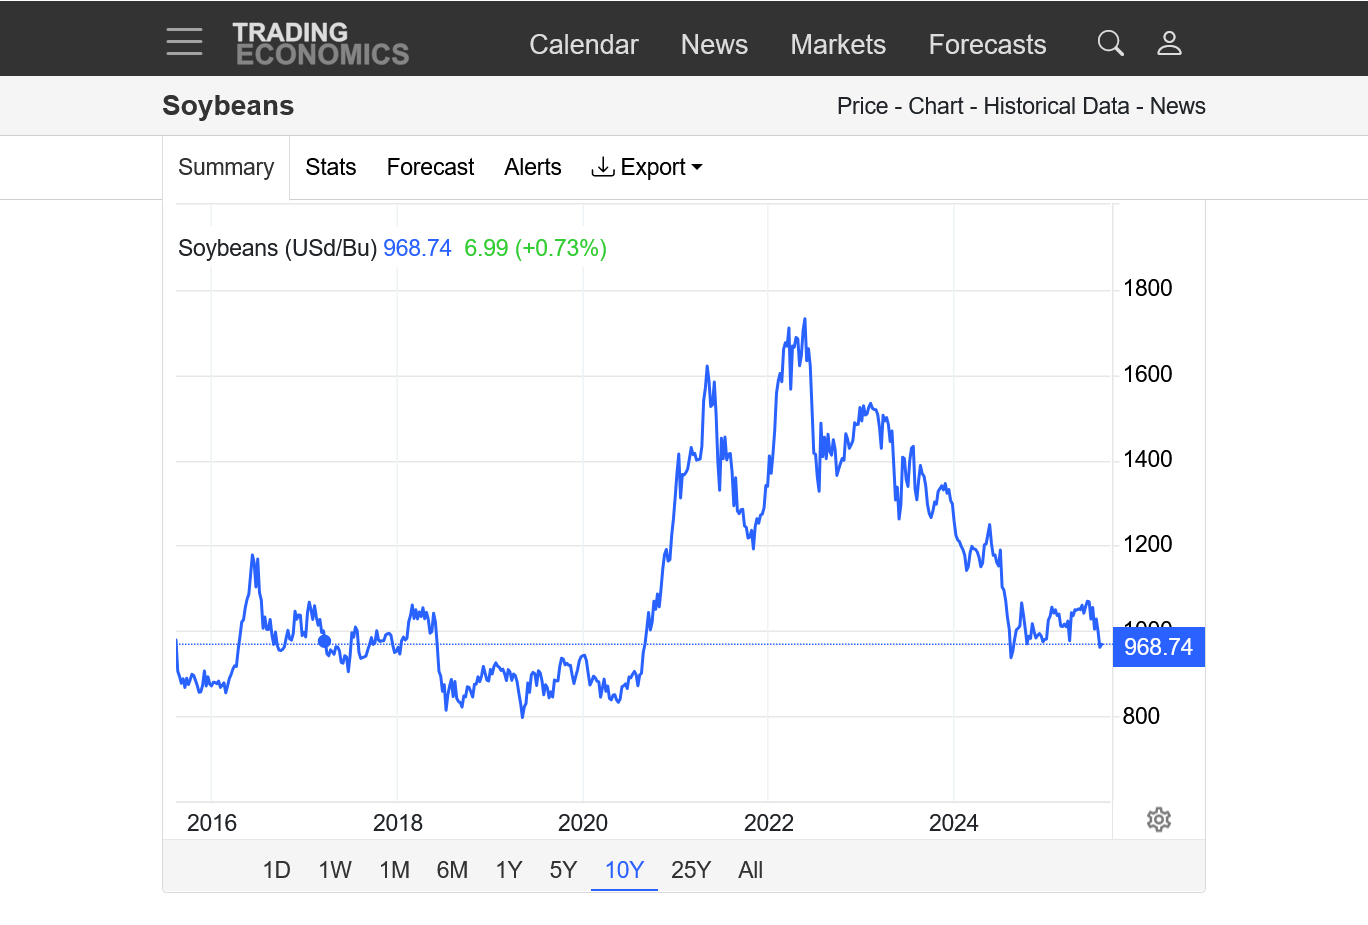
We can't get those sales back, man!  They went to South America and China was even willing to pay as much as $1/bushel MORE for them. Our soybeans are this cheap BECAUSE OF TRUMP on top of the huge crop/production.

So he jawbones and as always, pretends he's for the US farmer with his American last, Trump first policies.

You want to be for US producers that depend on foreign trade and exports?

Encourage free trade and INCREASE incentives to boost that from both sides, instead of doing the 100%, diametrically opposed, polar opposite by stifling trade from both sides. Encouraging our long lived trading partners with relationships backed by trust to NO LONGER TRUST US. No longer be able to count on anything because Trump constantly moves the goal posts and penalties using rationale that makes no sense and always harms the trading relationship. Mostly because he has decided that collecting the tariffs is a great way to collect money for the government. 

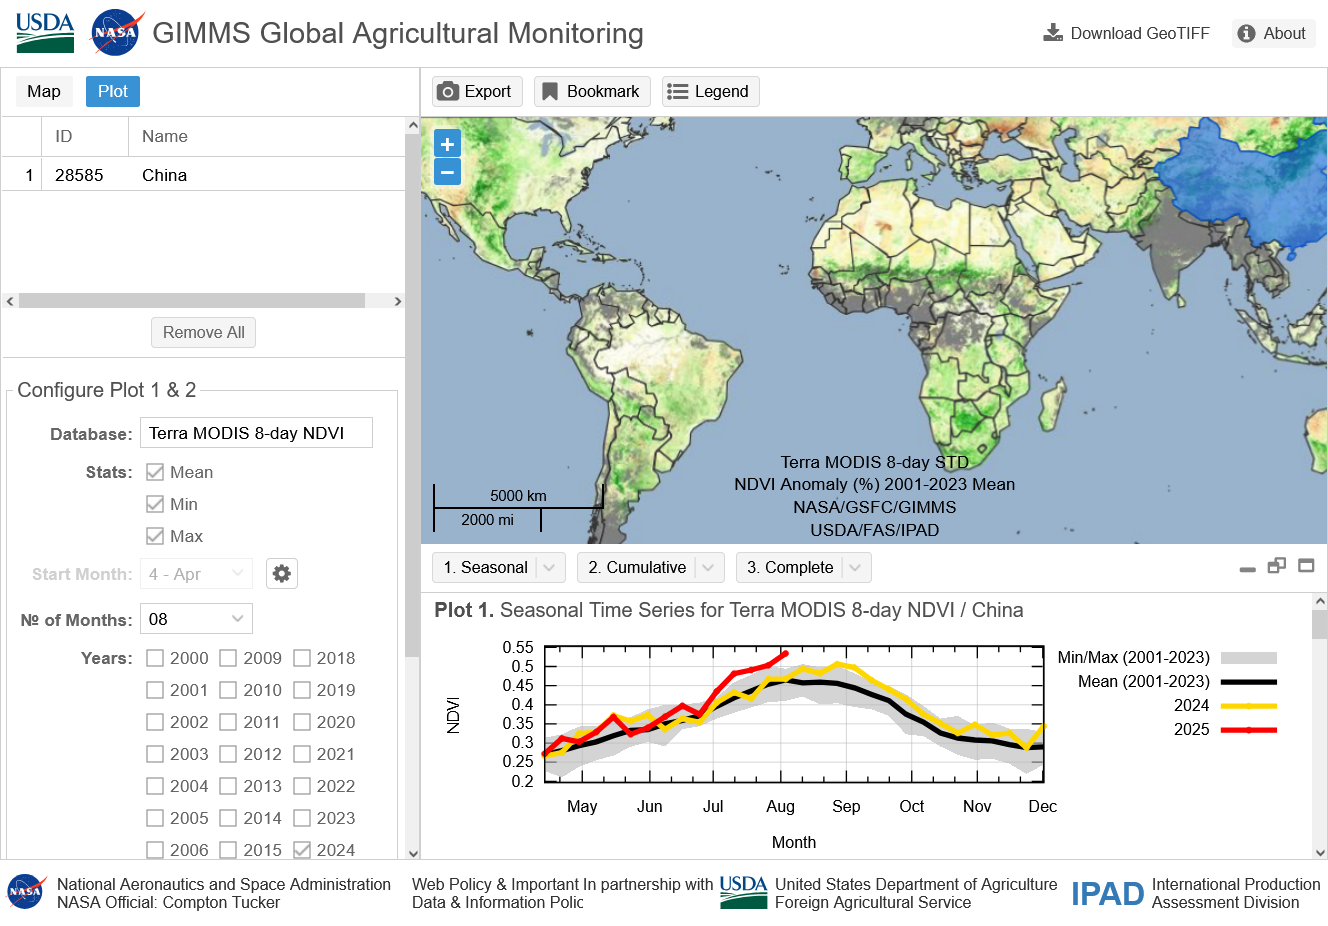
Our trading partners are being forced to REPLACE US as sources for their products(soybeans are just 1 good example)

At the same time, our consumers and US companies are punished because, Ironically its the US companies that are the ones that pay the tariff.  When a foreign country has a tariff on them, they don't pay, IT'S OUR PEOPLE THAT PAY. US companies pay the tariff and pass it on to US consumers. 

So US companies MAKE LESS MONEY. US consumers face higher inflation. Not maybe, just how bad?

US consumers, especially lower income consumers PAY MORE MONEY. It's only starting to impact our market/economy. It's already hurt soybean farmers. 

While that government collects tariffs and Trump pretends that it isn't a massive tax, that is most impactful on the lower income brackets. The extremely meager gains from wimpy agreements caused by the tariffs are a drop in the bucket compared to the mounting damage, which could really hit the fan later this year.

The magnitude of the damage is speculative at this point and based on Trump's latest decisions to move the goal posts and roil the markets again  but make no mistake, Donald Trump is completely unable to comprehend the basic principles and massive benefits of free trading between countries, FOR BOTH SIDES!!!! especially those that are not as rich as the United States.

He is supposed to be for less government and for free markets but his ruinous tariffs policies have maximized government intention to interfere with free market global trading on a scale not seen before during out life time.

He wants to capture tariff money FOR THE US GOVERNMENT and punish everybody else from both sides of the trading. 

And the longer this persists, the more permanent some of the losses will be as importers AND exporters find other markets/countries to sell their products and find other markets/countries to buy their products TO REPLACE THE UNITED STATES. 

Even if Trump rescinded all of his counter productive tariff nonsense tomorrow, there has been X amount of damage.

Ironically it comes from the guy claiming this:


.Trump: The Art of the Deal


Here in 2025, for leaders of all countries and most organizations that rely on trust and rational thinking,   if one wants  to use the actions of our new president, they can use President Trump's actions and words as  the quintessential example of exactly what NOT TO DO to make deals. 

I could type another few pages on why he is doing it exactly wrong but will stop here. 

By metmike - Aug. 11, 2025, 9:50 a.m.
Like Reply

The USDA report is out tomorrow and that is a huge deal for positioning of the trade. 


By Jim_M - Aug. 11, 2025, 10:14 a.m.
Like Reply

It’s my understanding that China hasn’t ordered beans from us in weeks, if not months.  Sell it.   I doubt China is worried about any shortage of beans either.  I am a supporter of Trump but most of the time his bloviating is an opportunity to short what ever market he is talking about at the time.   Robust or not, there are plenty of beans and more coming.  

By metmike - Aug. 11, 2025, 10:35 a.m.
Like Reply

Great to read you and great point, Jim!!!


                 Grains 7-27-25                        

                By metmike - Aug. 7, 2025, 3:21 p.m.            

China, below is also well into record high territory for vegetative health right now as the global climate optimum continues thanks to the increase in CO2!

https://www.star.nesdis.noaa.gov/smcd/emb/vci/VH/vh_browseVH.php

https://glam1.gsfc.nasa.gov/


By metmike - Aug. 11, 2025, 4:07 p.m.
Like Reply

The NWS cooled off the 8-14 day and took out rain, as we've been expecting

https://www.marketforum.com/forum/topic/83844/#83852

By metmike - Aug. 12, 2025, 8:56 a.m.
Like Reply


2 week rain anomalies from the last 0z European Ensemble model:


COOLER temps again!

-8.5 CDDs for the Midwest on this last run:


USDA report at 11am CDT!

By metmike - Aug. 13, 2025, 7:31 a.m.
Like Reply

The weather forecast is still similar. A widespread, much drier regime will be dominating for at least the next 2 weeks. probably longer.  Temps, however have cooled off the last few days.

I still think that we will be having some areas in a flash drought by early September.

These were the 2 week rain anomalies from the last 0z European Ensemble model:


These were the temp anomalies the last 10 days of that 2 week forecast. Not AS hot for many areas compared to the same forecast earlier this month but still above average in the southern growing areas. So the lack of rain will deplete soil moisture across most of the belt.

By metmike - Aug. 13, 2025, 8:17 a.m.
Like Reply

Very likely a major bottom is in for the soybeans, especially with a dry forecast for the next month and following a very bullish USDA report yesterday because of the shocking cut in soybean acres planted.

This is the front month, September below.

1. 1 month-double bottom

2. 1 year-bottom. Now breaking the steep downtrend channel from great weather and an increase in crop size/supply the past month+

3. 10 years-Bottom right at major support. Still sideways pattern in 2025 but with a strong bullish bias right now. 

https://tradingeconomics.com/commodity/soybeans


By metmike - Aug. 13, 2025, 8:27 a.m.
Like Reply

This is a week old!

COT Report: SOYBEANS - CHICAGO BOARD OF TRADE

Futures Only Positions as of 2025-08-05

https://www.tradingster.com/cot/legacy-futures/005602


COT Report: CORN - CHICAGO BOARD OF TRADE

Futures Only Positions as of 2025-08-05

https://www.tradingster.com/cot/legacy-futures/002602

+++++++++++

All the markets:


https://www.cftc.gov/MarketReports/CommitmentsofTraders/index.htm

By metmike - Aug. 13, 2025, 6:09 p.m.
Like Reply

NWS cooled off the week 2 forecast a bit more today. Still a large area of dry weather (mostly Eastern Cornbelt) that is not nearly large enough in my opinion.


15 day rainfall anomalies from the last 12z European Ensemble model.

Not sure where the NWS thinks average rains above will come from in this pattern(other than the far Upper Midwest, which is wet looking. 

However, the last 12z run of the EE is suggesting a huge potential pattern change at the end of week 2.

The upper level ridge, instead of maintaining the center in the Rockies to the Plains as predicted the past several days shifts the heat ridge MUCH farther east.

1. 500mb solution for 2 weeks from early Monday

2. Last 500 mb solution for 2 weeks

3. However, the last 500 mb solution from the GEFS has NOT changed. 

These 2 models are mind boggling different at the end of 2 weeks. The GEFS has TROUGHING in the Southeast, while the last EE model builds a strong Bermuda Ridge there, with the upper level troughing in southeast Canada.


By metmike - Aug. 14, 2025, 10:23 a.m.
Like Reply

The upper level ridge shifting to the east and being strong in the south introduces much more Gulf moisture and rain opportunities later this month at the start of week 3 for many places in the Midwest. Late week 2 and week 3 carry an even higher than usual amount of uncertainty right now. 

This was 360 hours on the last 0z European Ensemble model.


This was the last 6z GEFS for the same time. HUGE difference for the location of the heat ridge!


Regardless of whether rains pick up again at the end of the month, the next 10+ days look pretty dry everywhere except the far Upper Midwest.

These were total rains the next 10 days from the last 6z GEFS model. The green colors are basically .5" or less, when at least 1-1.5 inches is average for this period. 

By metmike - Aug. 14, 2025, 3:32 p.m.
Like Reply

NWS is catching up/showing the week 2 forecast that the market had earlier this week.  However, the latest models are  heating it up again late in the week 2 forecast period. That could increase rains late in August with the potential for  deep Gulf moisture returning. 

Let's use this last 12z European Ensemble model and 5 day periods of rainfall anomolies coming up to demonstrate the potential increase in rains late in the period.

1. Days 1-5-mostly dry belt-wide except the far north.

2. Days 6-10-Eastern Cornbelt has a slightly better chance of rains but still pretty dry most places

3. Days 11-15: Returning GOM moisture increasing rain chances. Even some green above average in the southern Cornbelt(LOW confidence of that much rain) but I'm reducing the chances of flash drought as we start September. Again, with the better rain chances will come a return of hot/humid air at the very end of the month....with moderate confidence. 

By metmike - Aug. 15, 2025, 1:37 p.m.
Like Reply

Still not much rain in most of the belt the next 10 days(exception is the far Upper Midwest).

10 day totals  from the last 6z GEFS(heavy in the far north areas:


However, the European Ensemble model continues to greatly boost rains late in week 2.

1. Rainfall anomaly days 1-10

2. This is the rainfall anomaly for days 11-15 from that model:

3. The heat will really start picking up late in week 2. This was the last 500 mb map from the EE model.

4. CDDs for just the Midwest. Note the strong upward trajectory for the last 4 data points. This is the new pattern that will feature much more heat in week 3.