NG is ~-1% vs Friday.
Thanks very much for starting the new thread, Larry!
Been busy catching up on outdoor projects.
The previous thread is here:
6-29-25 Natural Gas
69 responses |
Started by metmike - June 29, 2025, 4:45 p.m.
https://www.marketforum.com/forum/topic/112895/
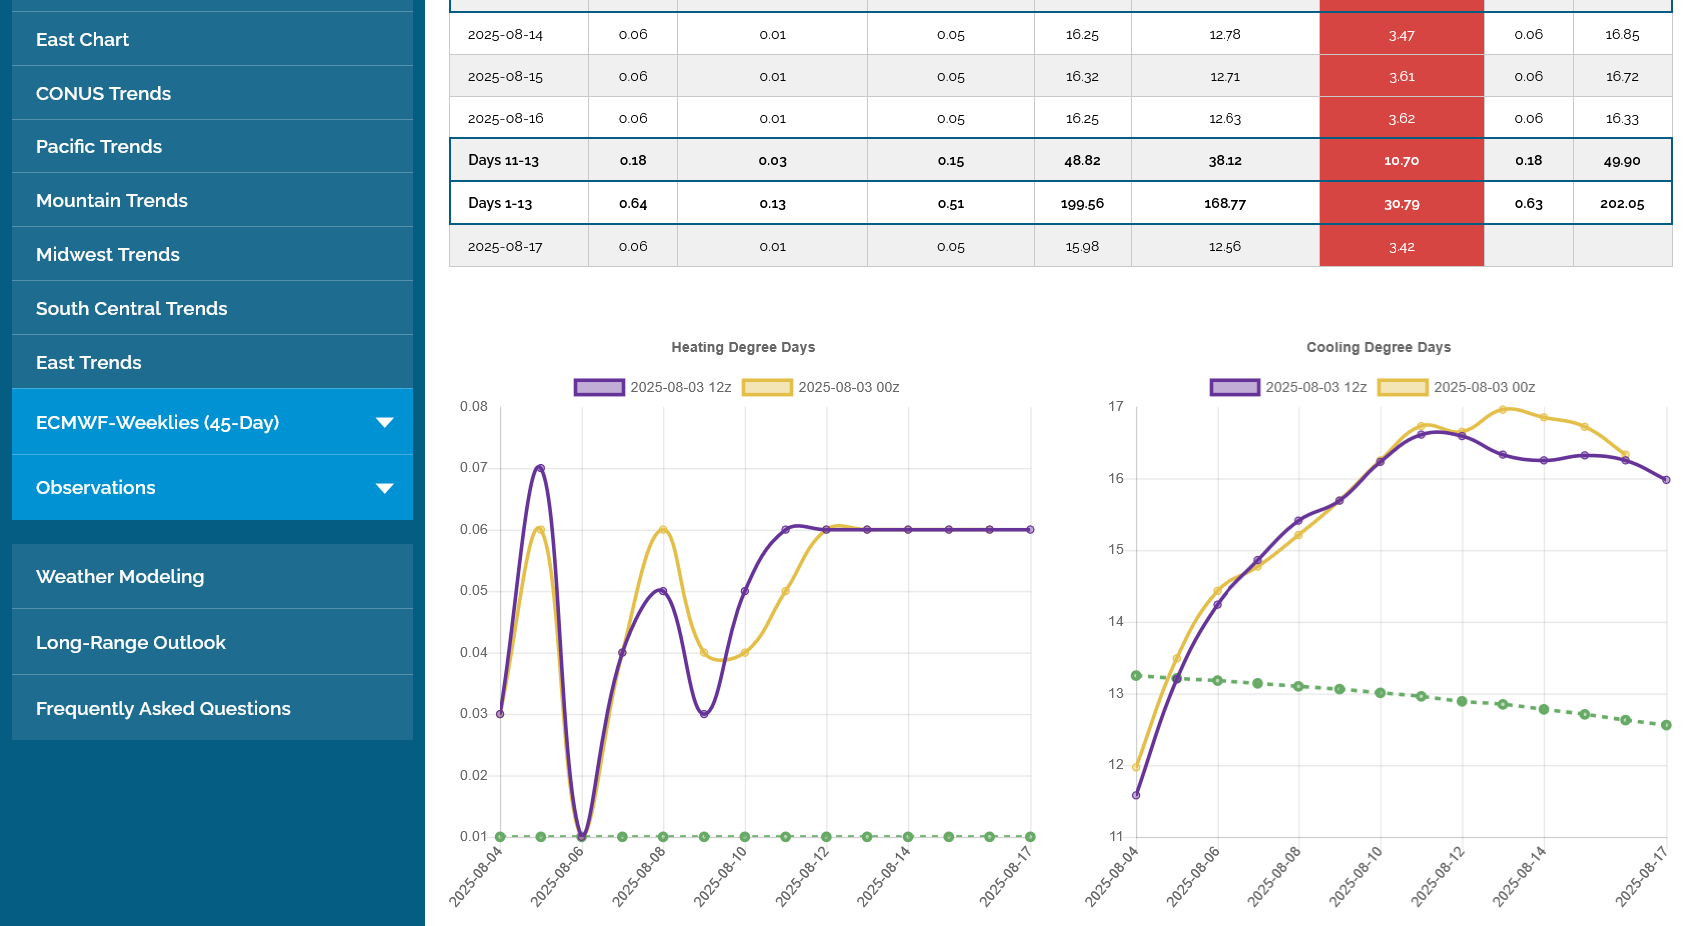
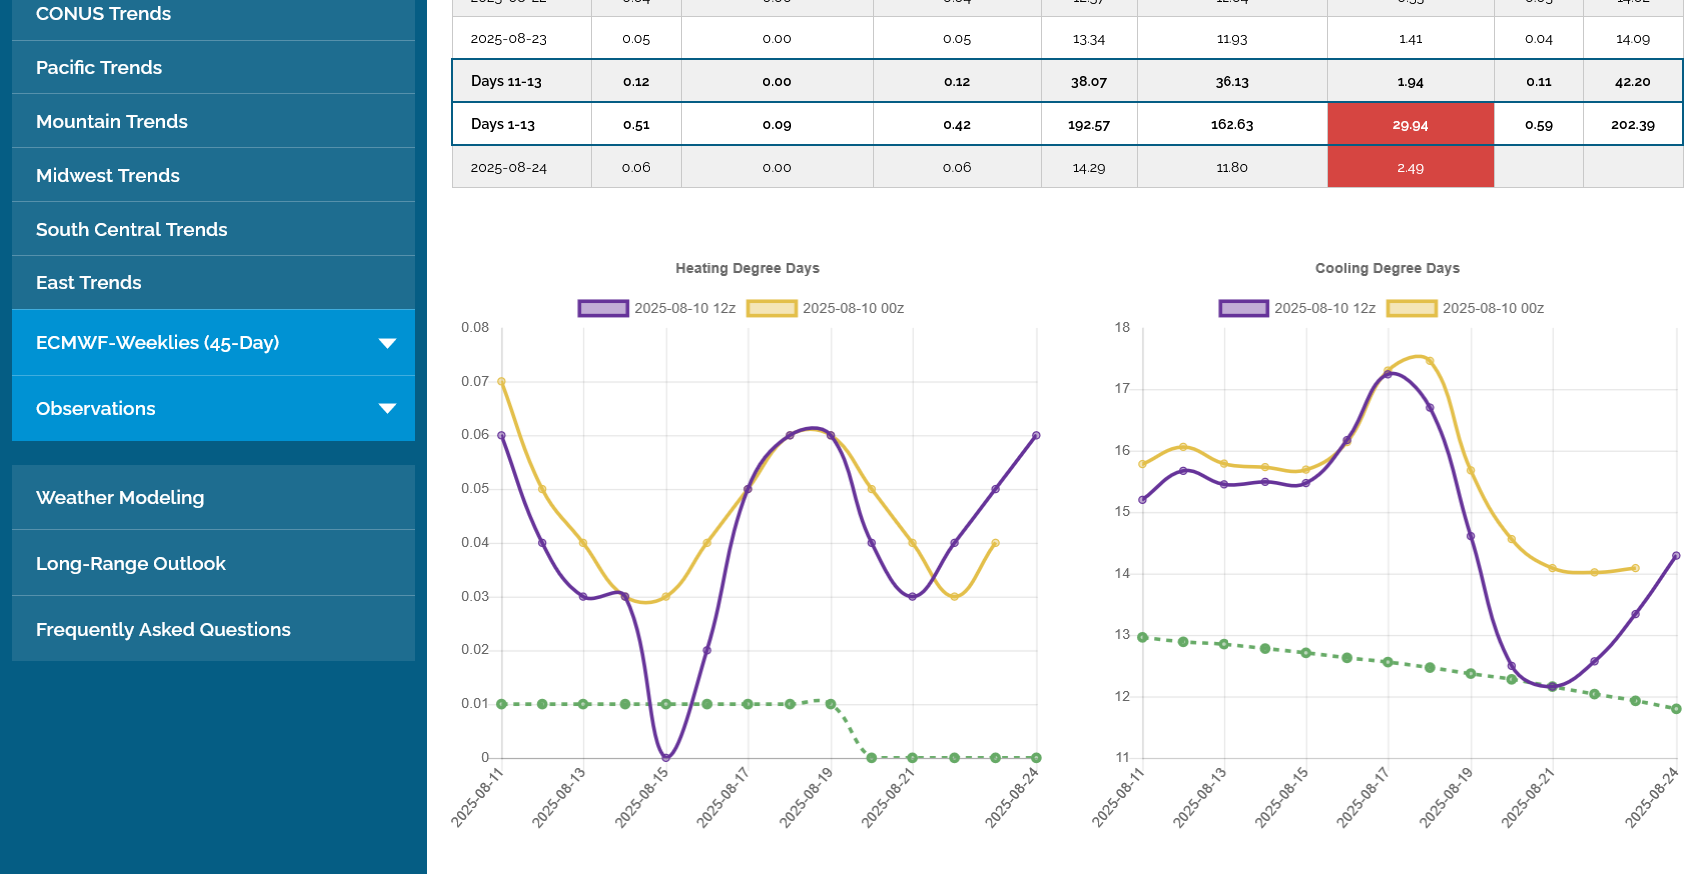
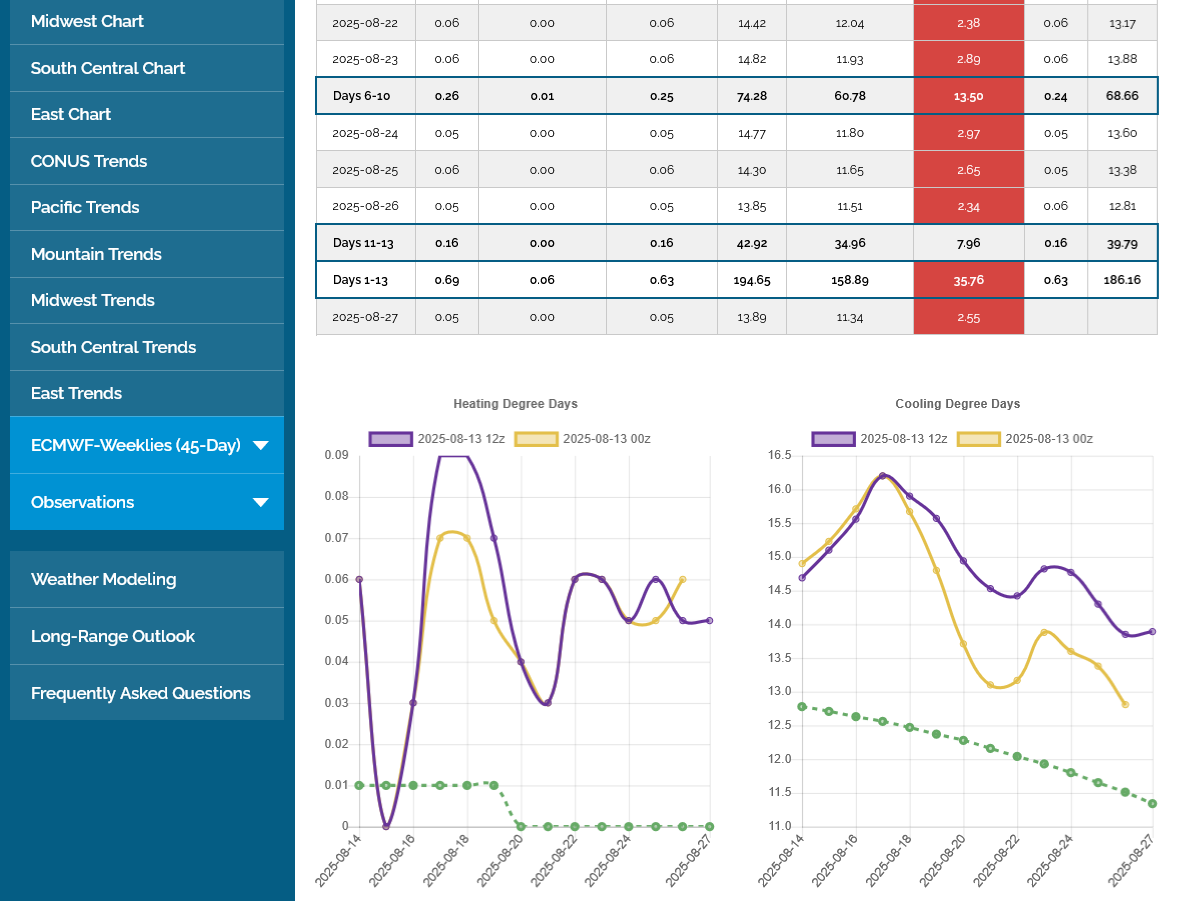
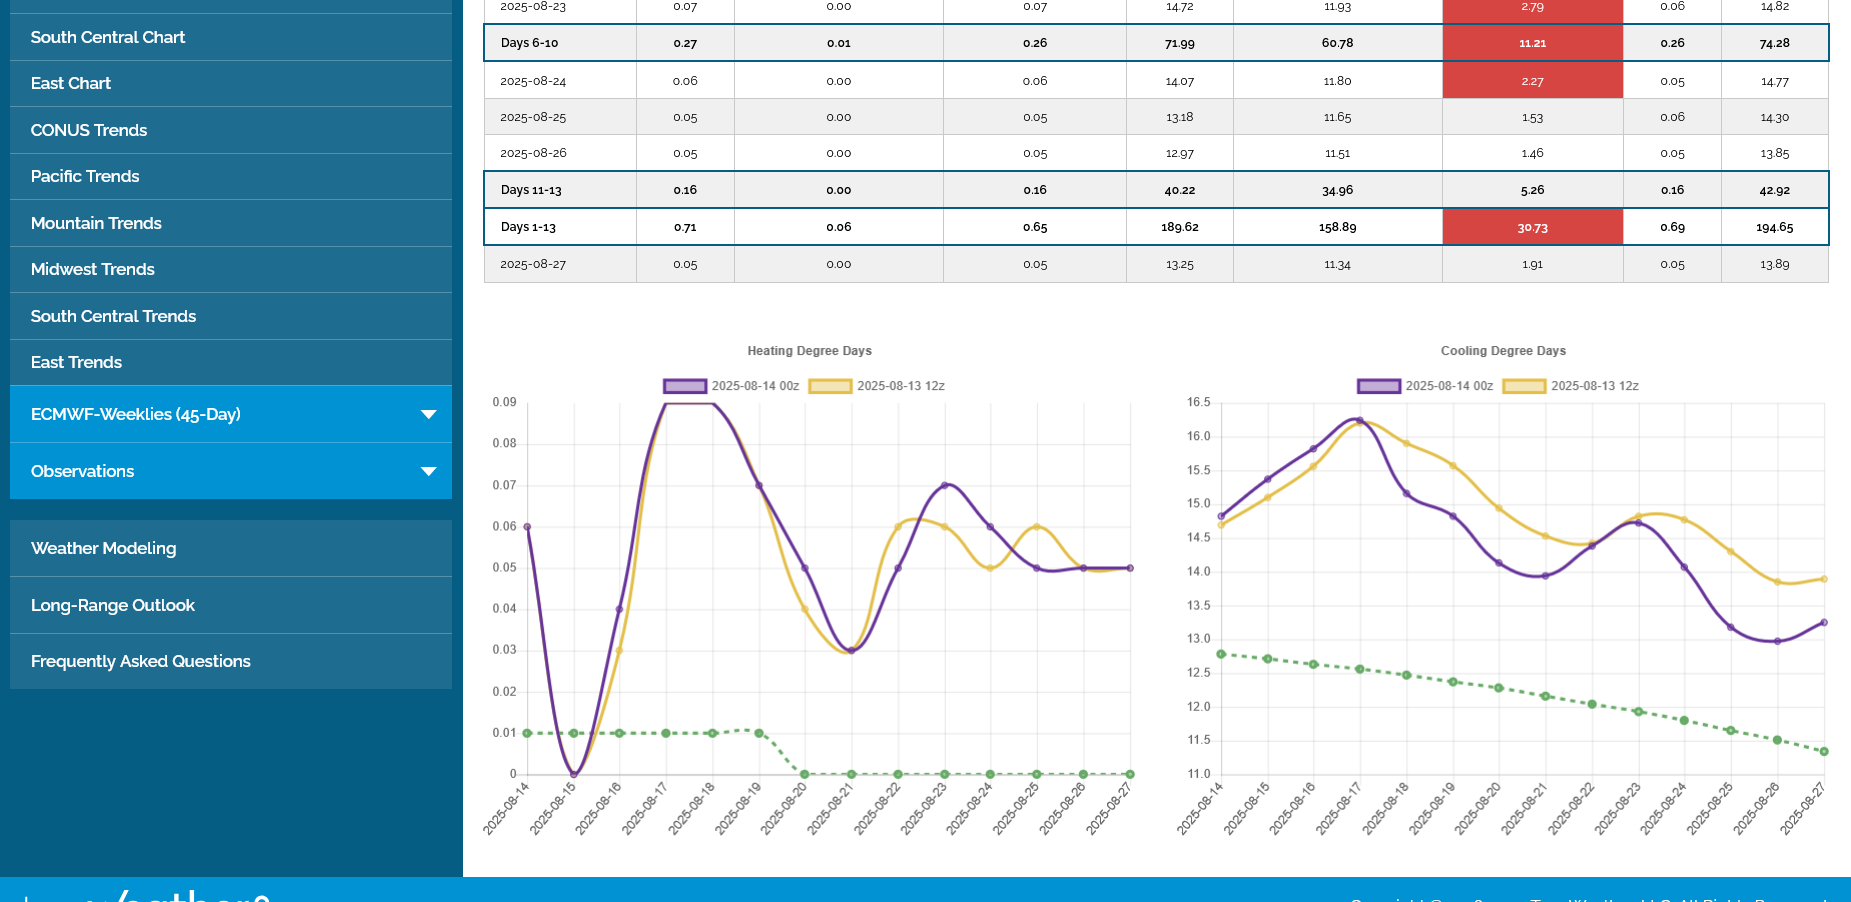
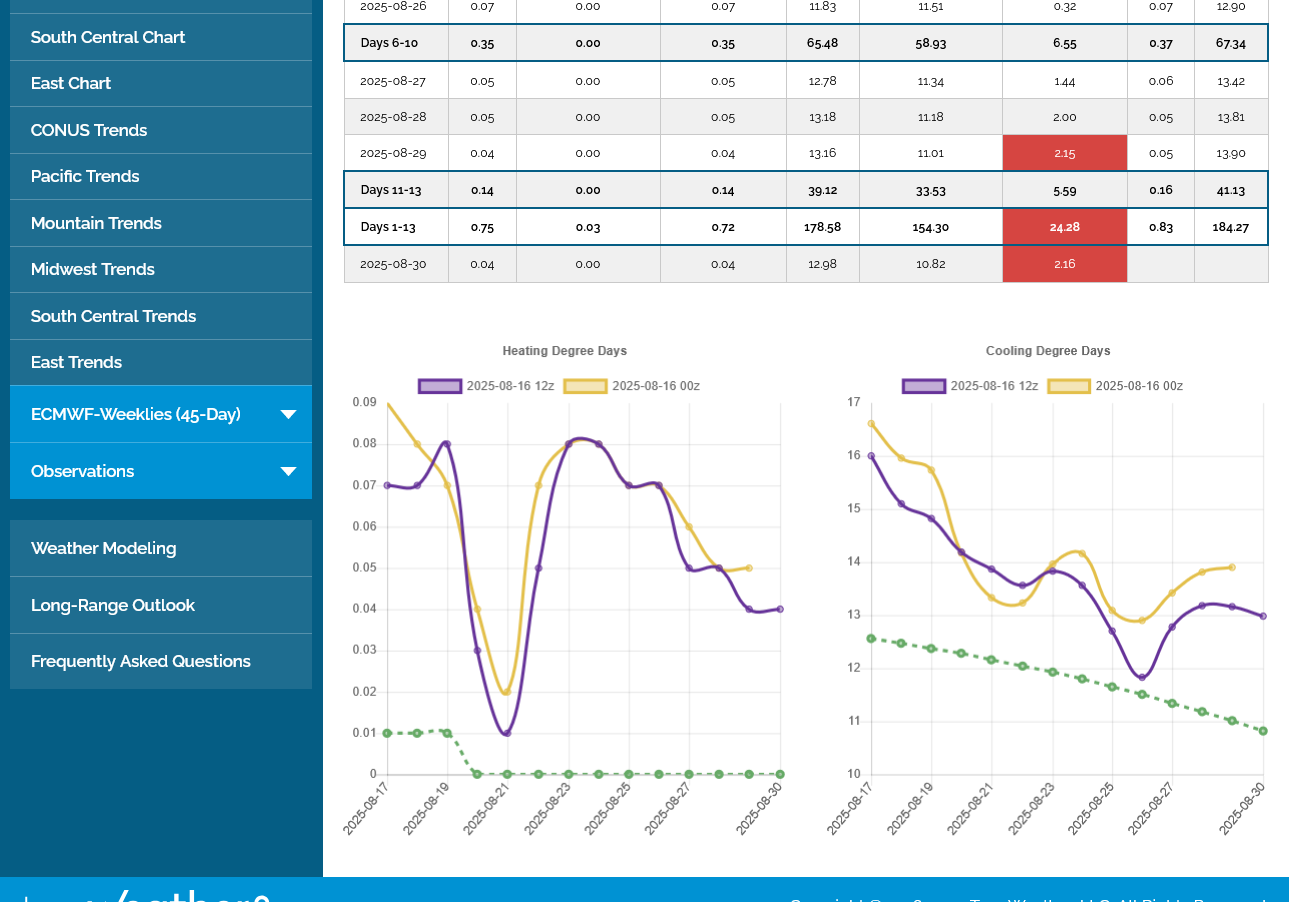
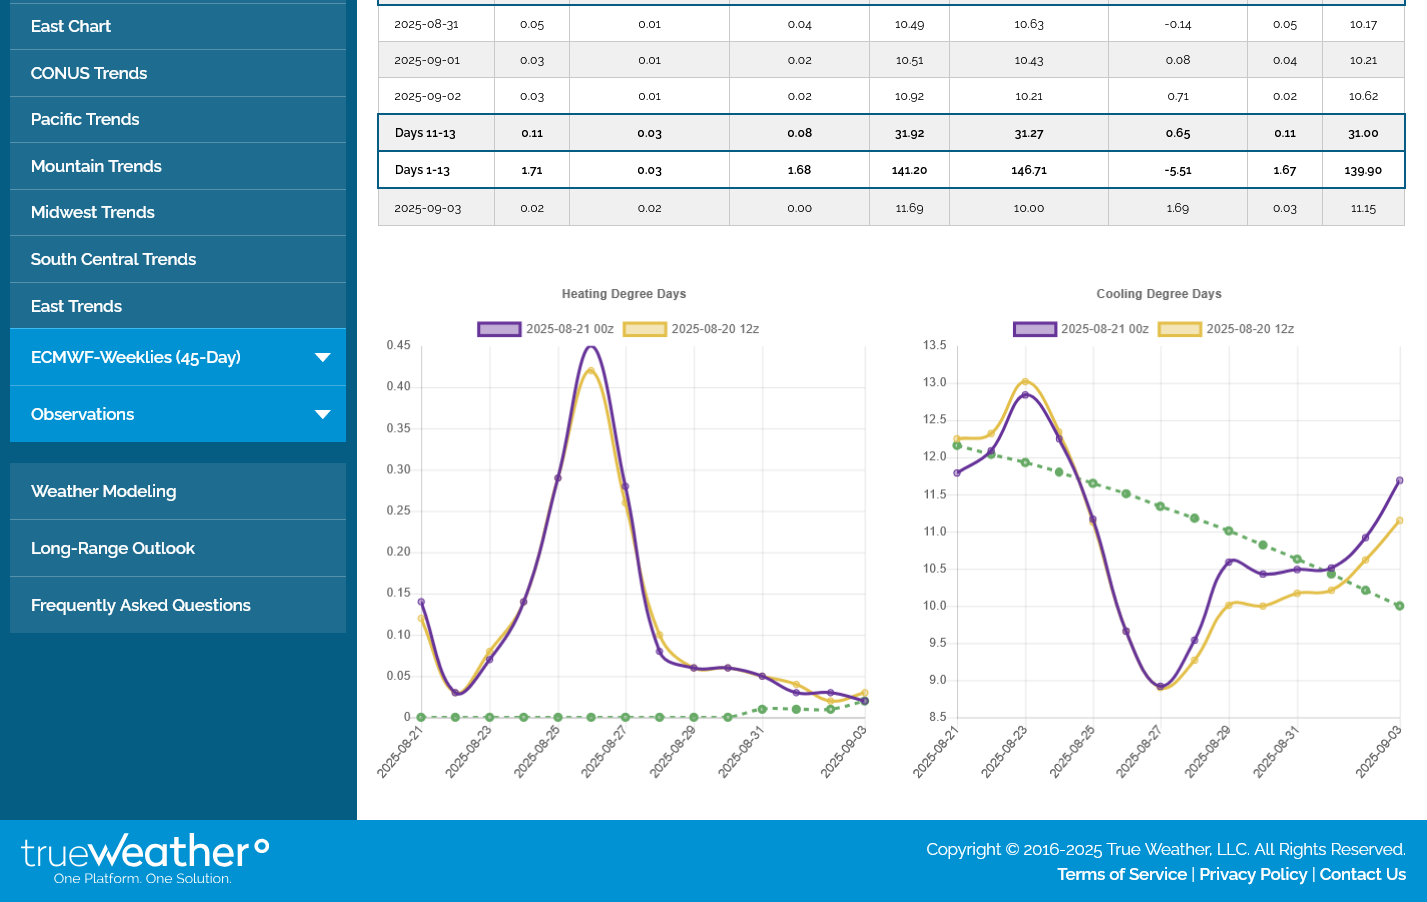
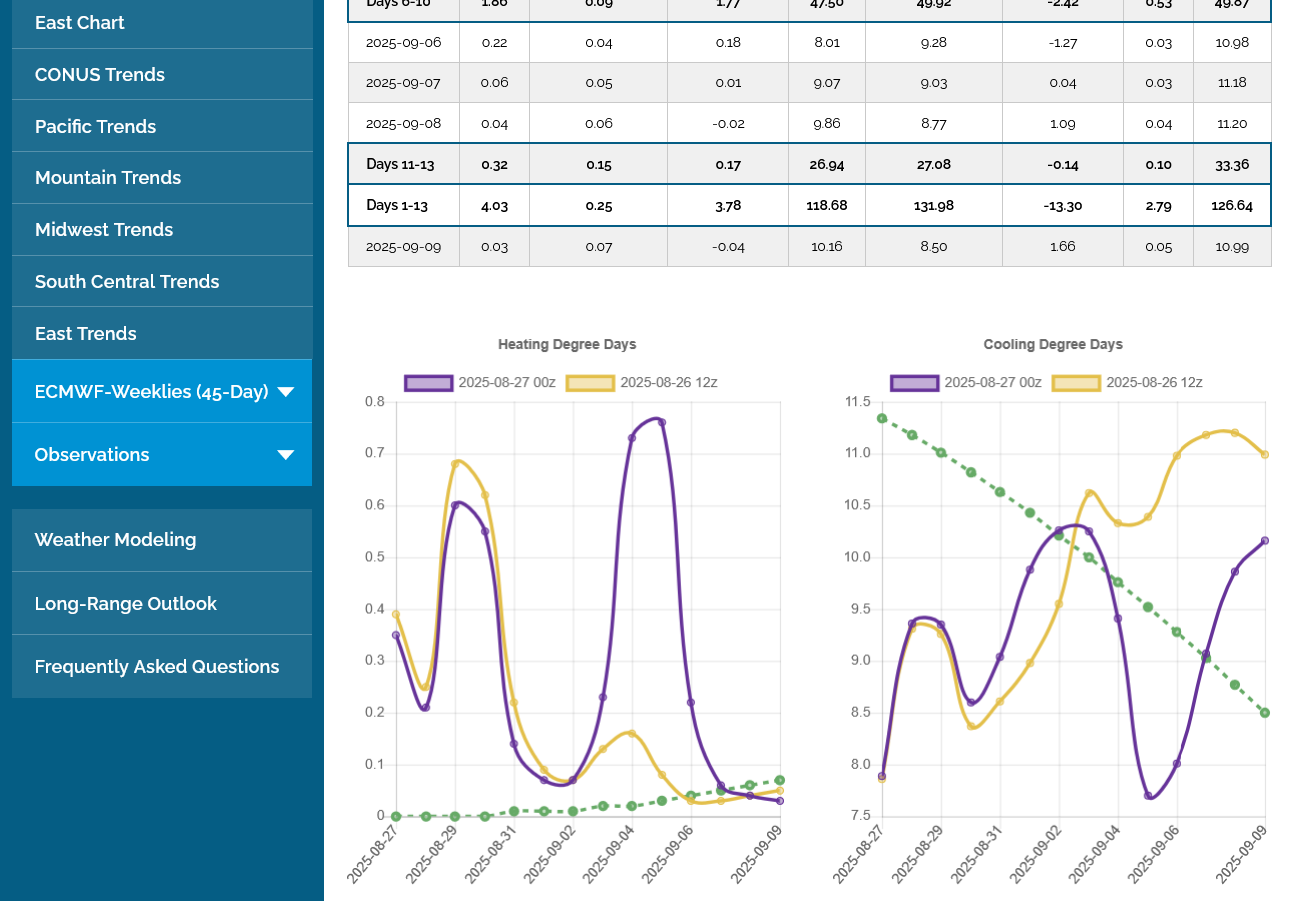
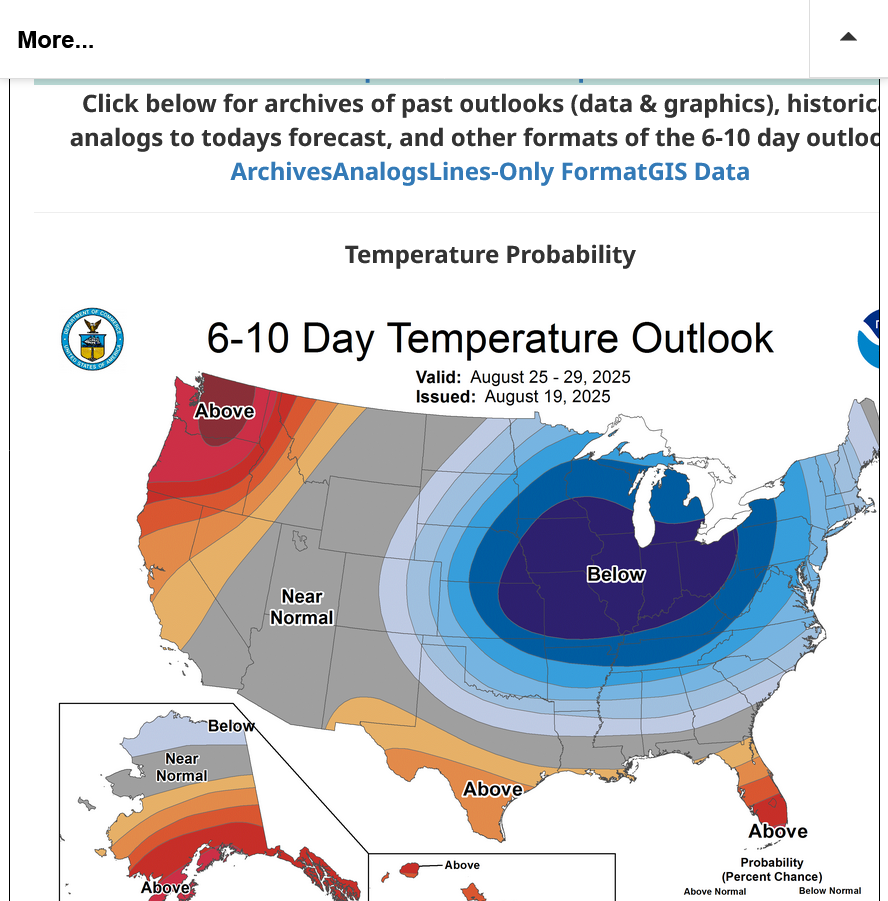
Latest 12z European Ensemble. The 0z will be updated shortly.
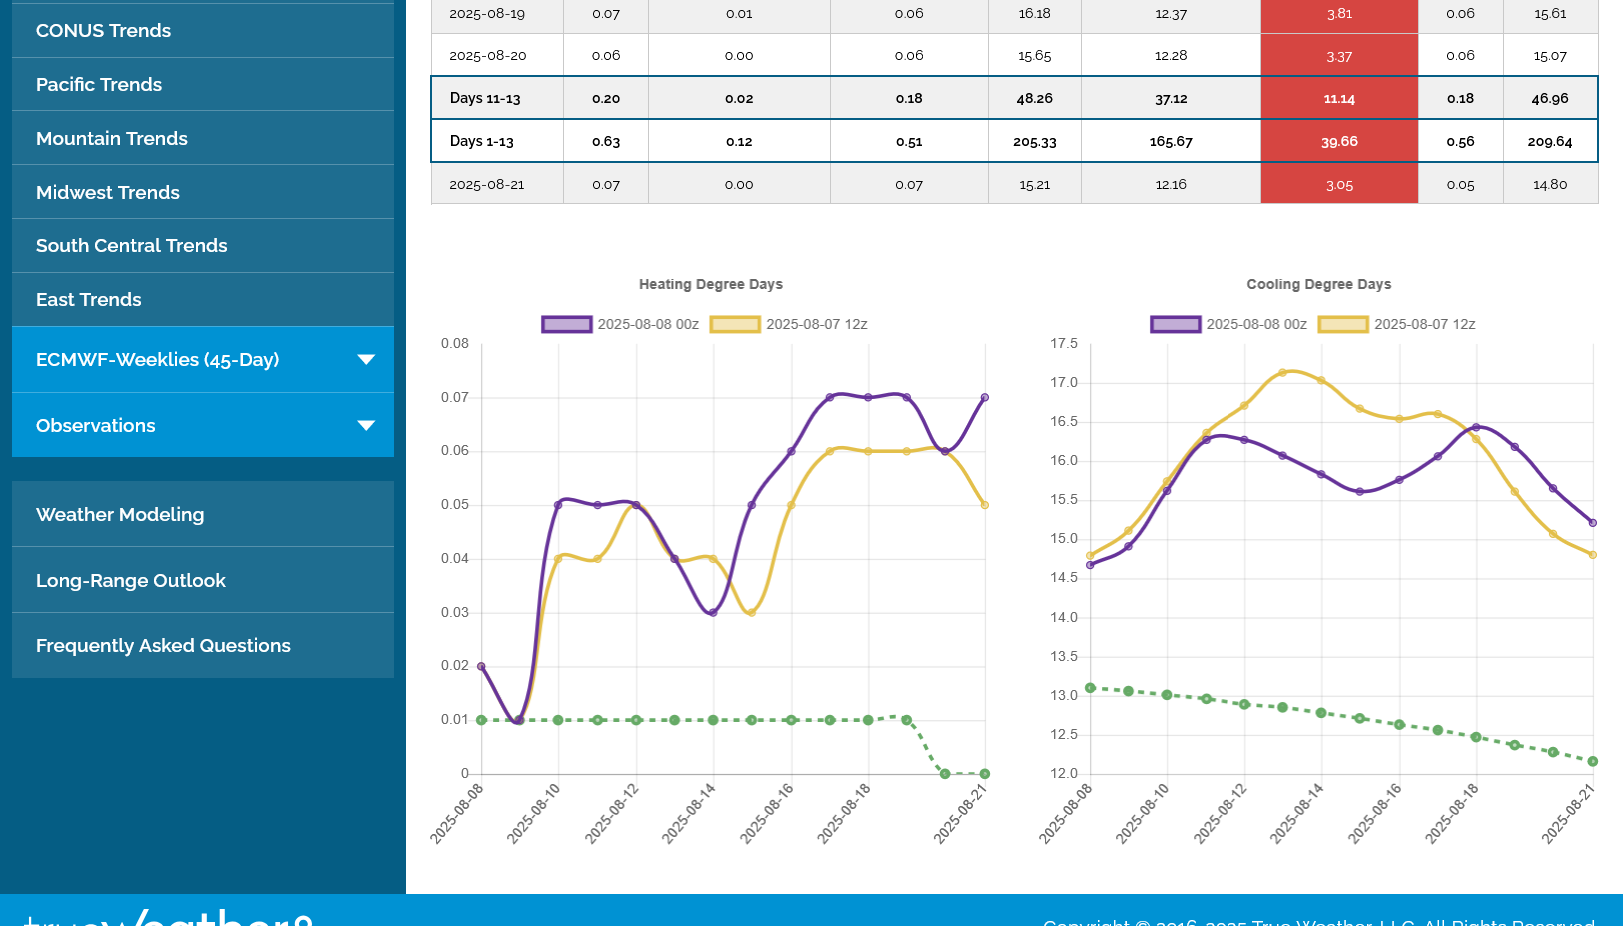
Decent heat coming up in August with slight cooling late in the period but staying WELL above average. I'm a bit surprised with that forecast that we're not higher here.
The week 3+ forecasts also keep the heat coming compared to average all the way into mid-September. So we should see well above average demand for cooling from burning natural gas to generate electricity but the market doesn't care this evening.
This is similar to last weeks forecast so it the market seems to have baked it in already. We'll see what the models show overnight, then around 6am, when the big funds jump in with crazy algorithms, the volatility will jump much higher.
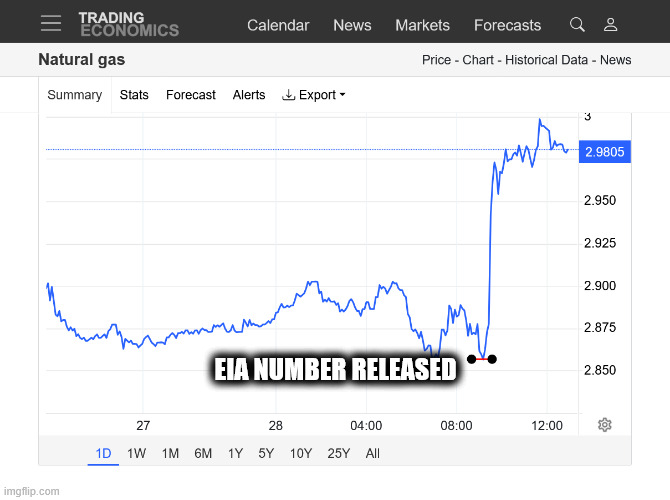
These were the temps for the next EIA, natural gas storage report released every Thursday at 9:30am CDT.
Very impressive positive anomalies(East/Southeast) considering it was just 1 week after the hottest week of the year SEASONALLY. Add in extremely high dew points in the many high populations centers and the next storage report should be VERY bullish compared to normal. The market knew this a couple of weeks ago when the price spiked higher, so the EIA number will be compared to market expectations.
https://www.cpc.ncep.noaa.gov/products/tanal/temp_analyses.php

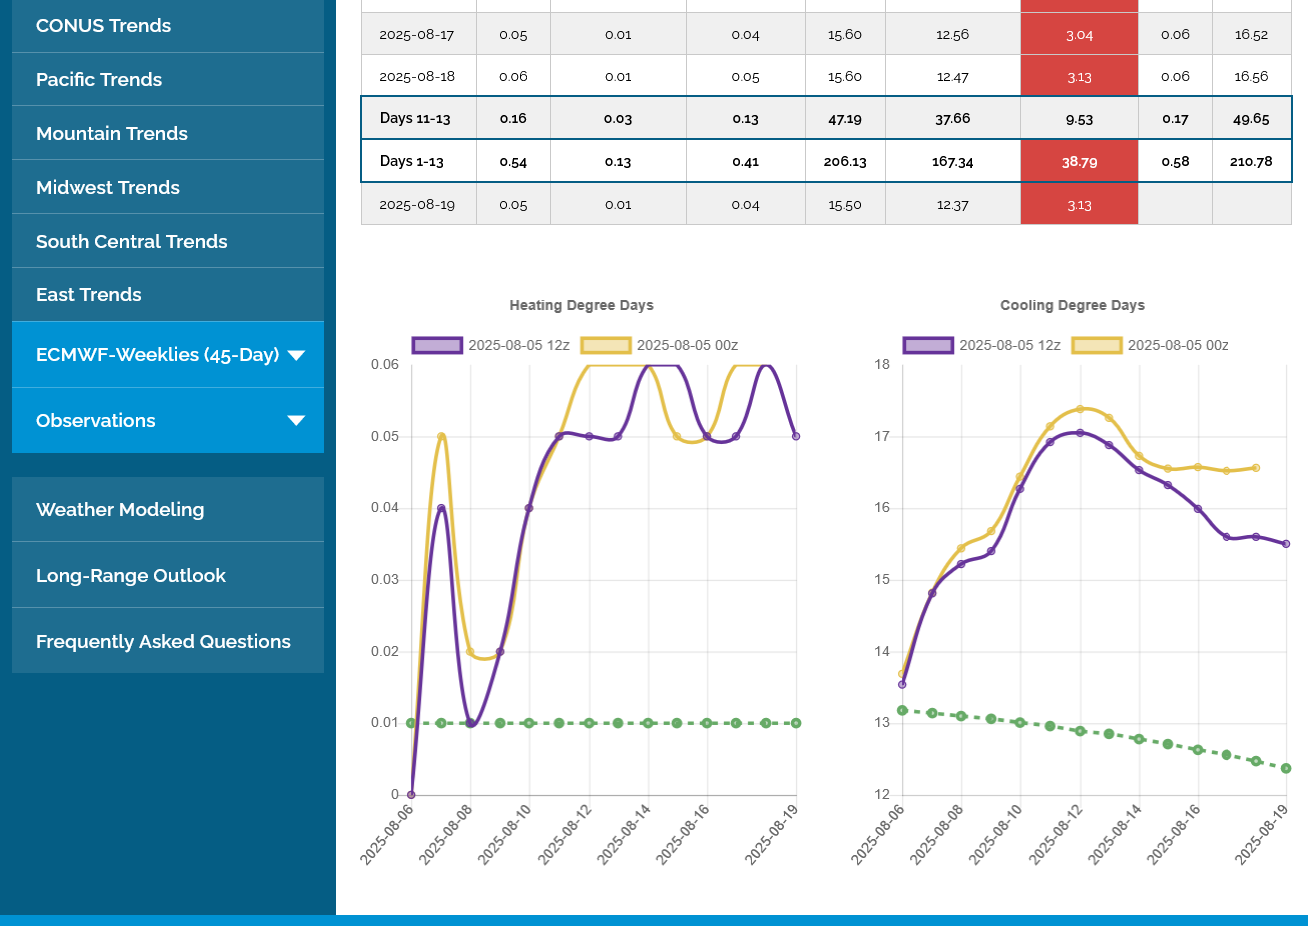
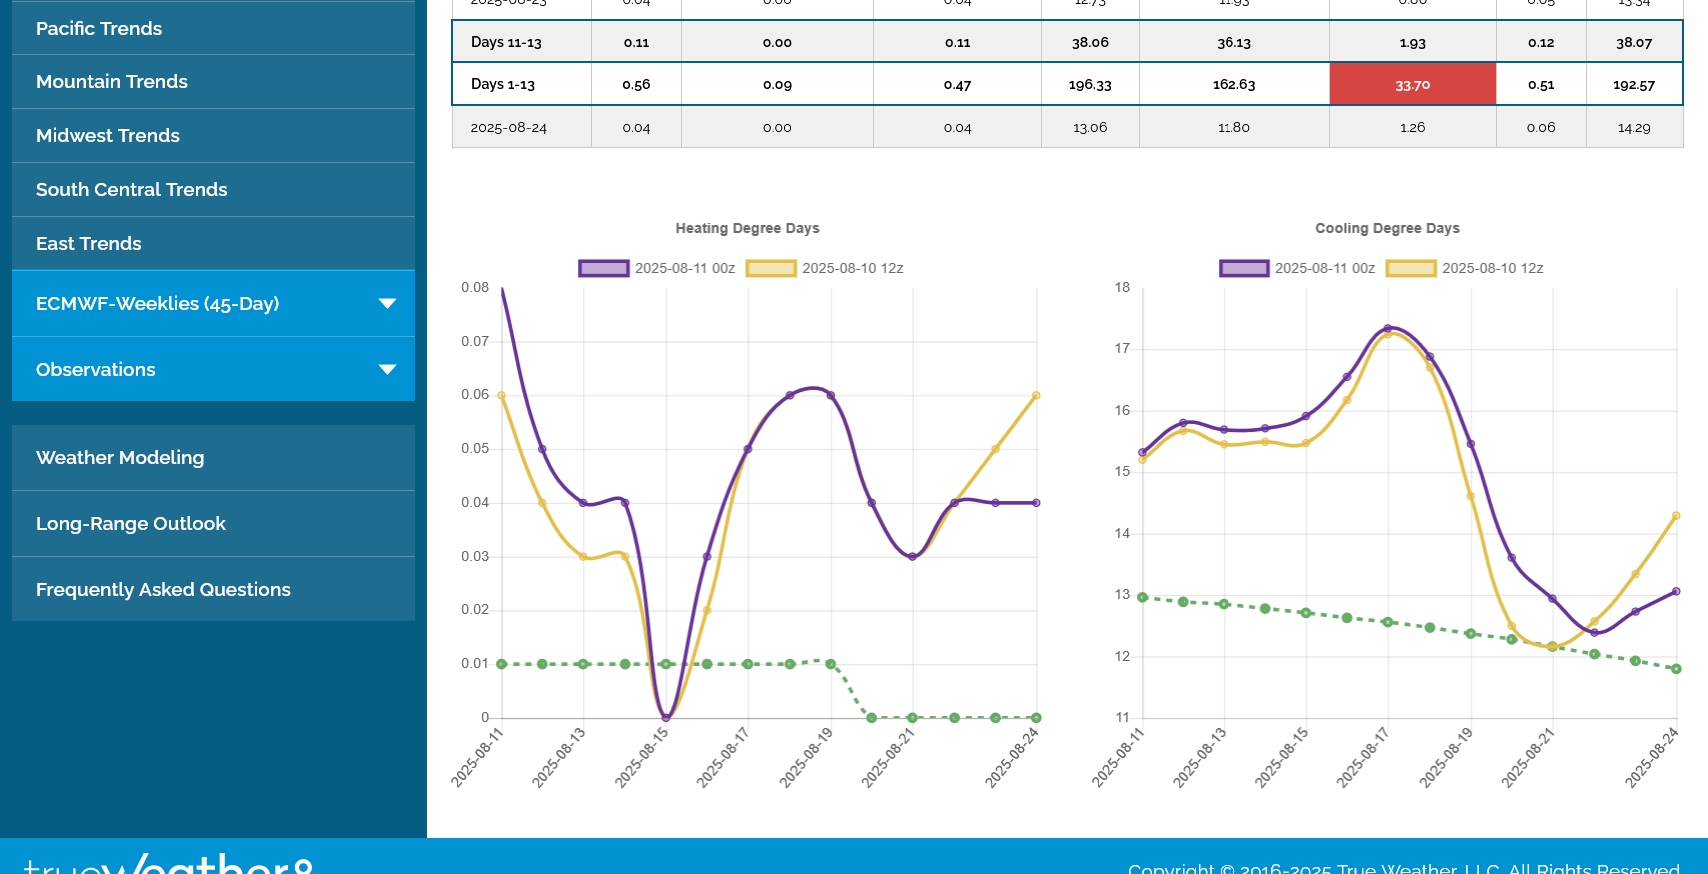
Not much change on the last 0z European Ensemble model(purple/right) compared to the previous 12z model.
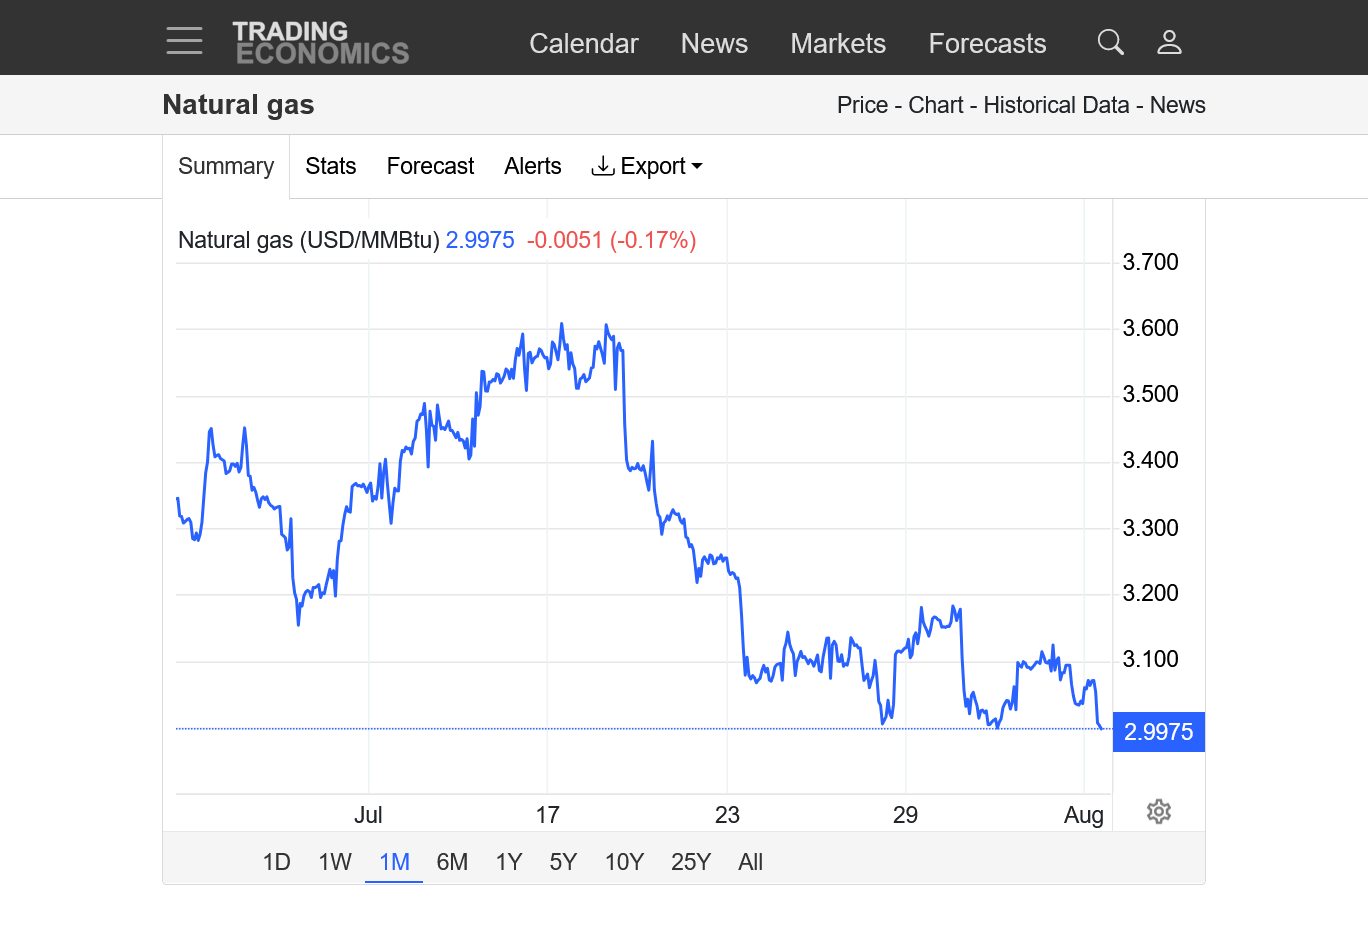
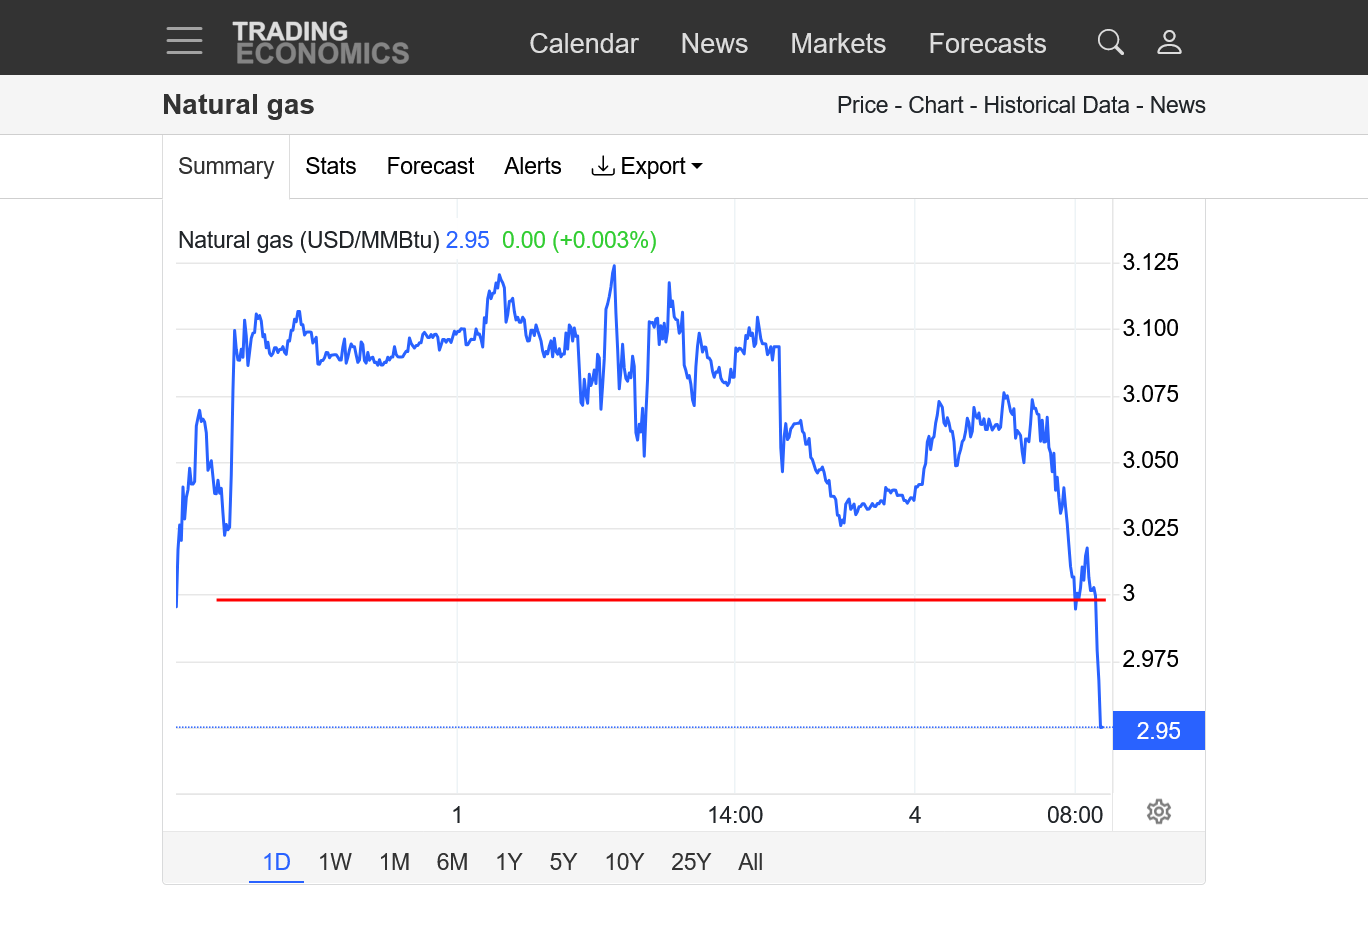
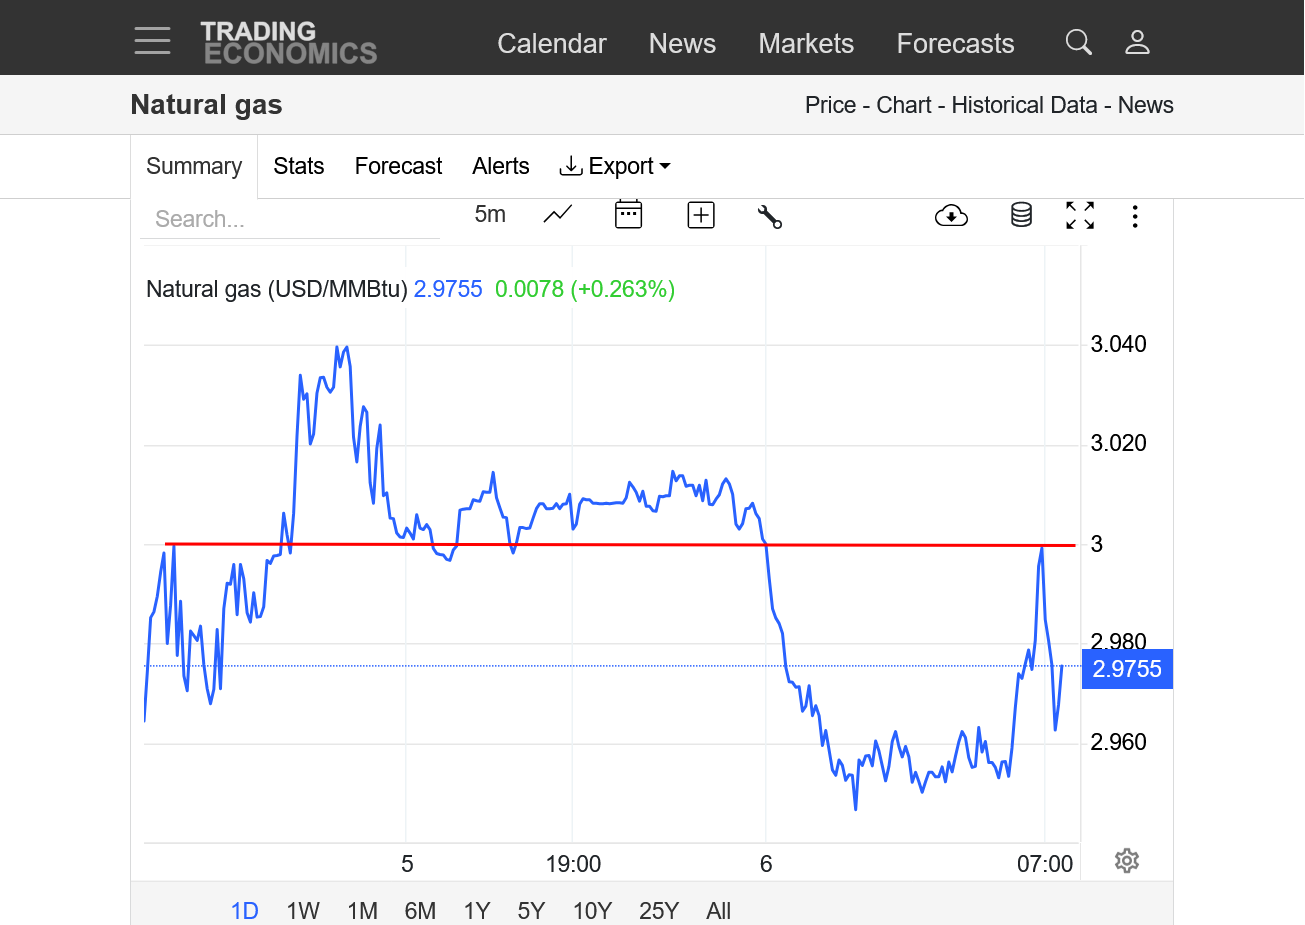
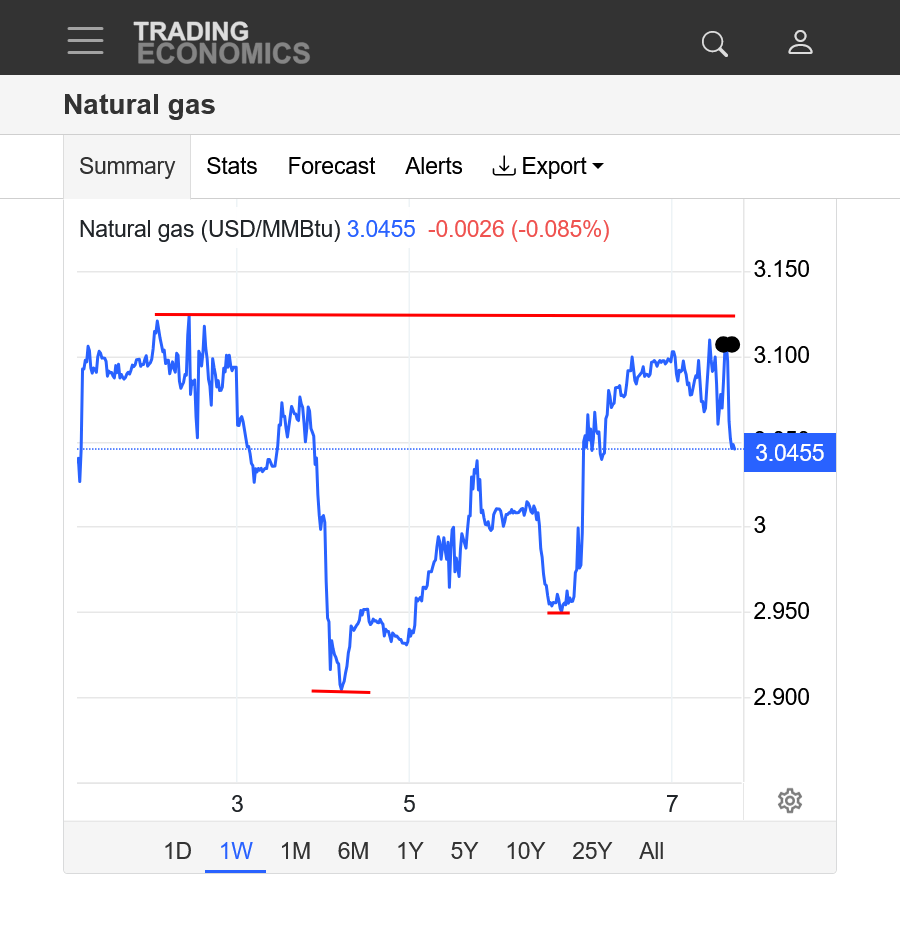
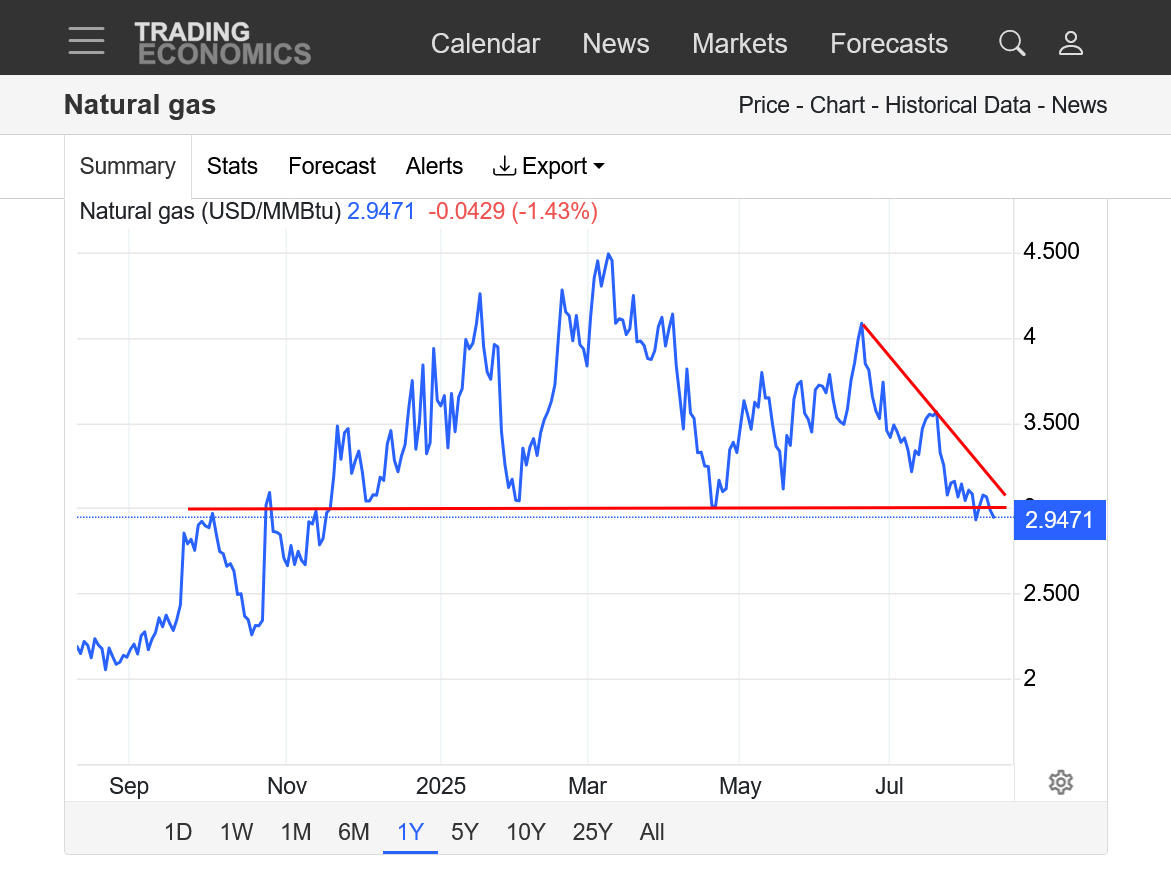
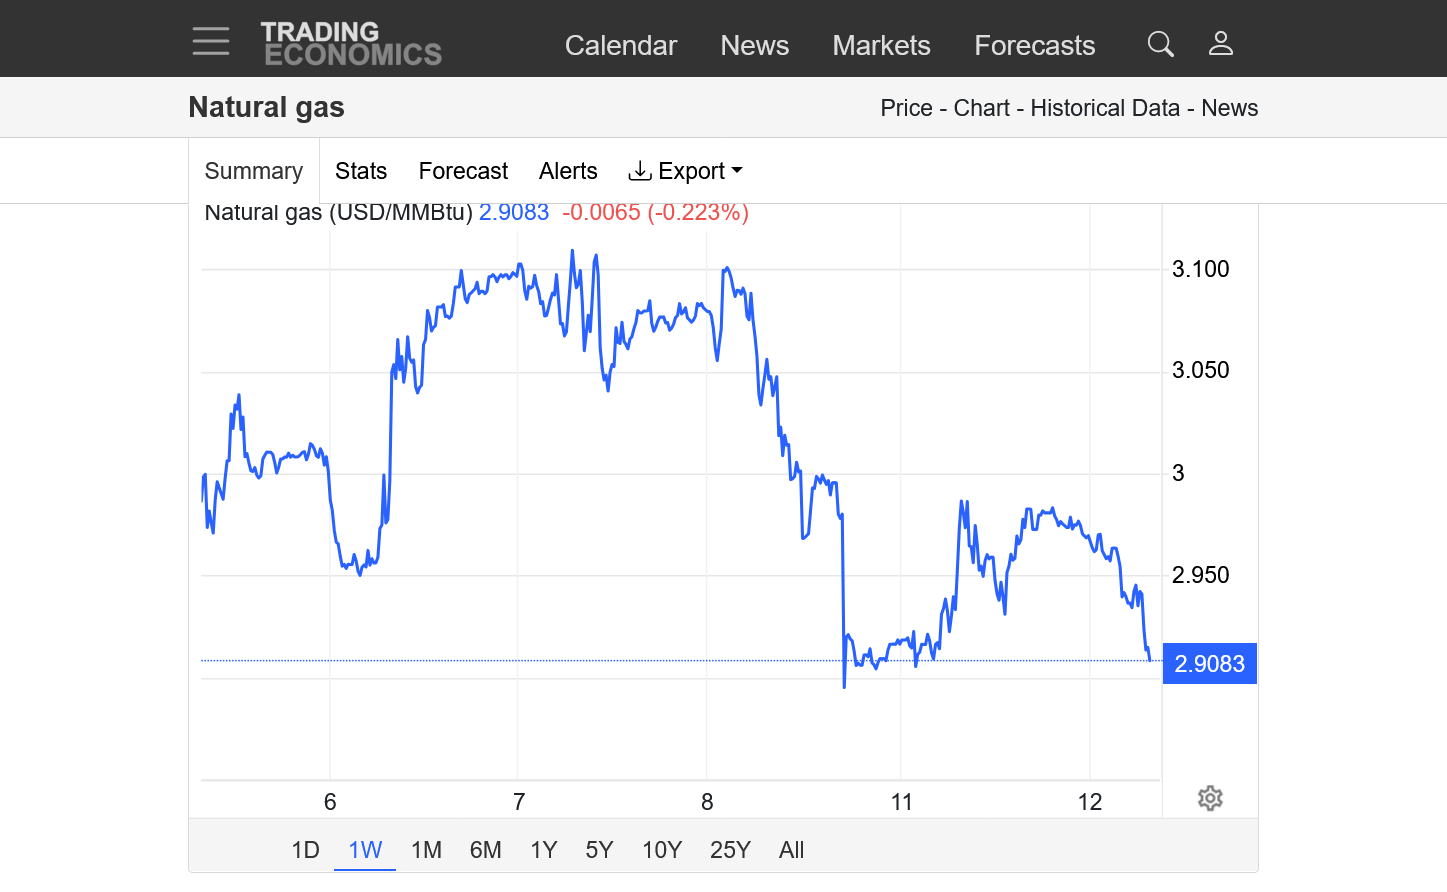
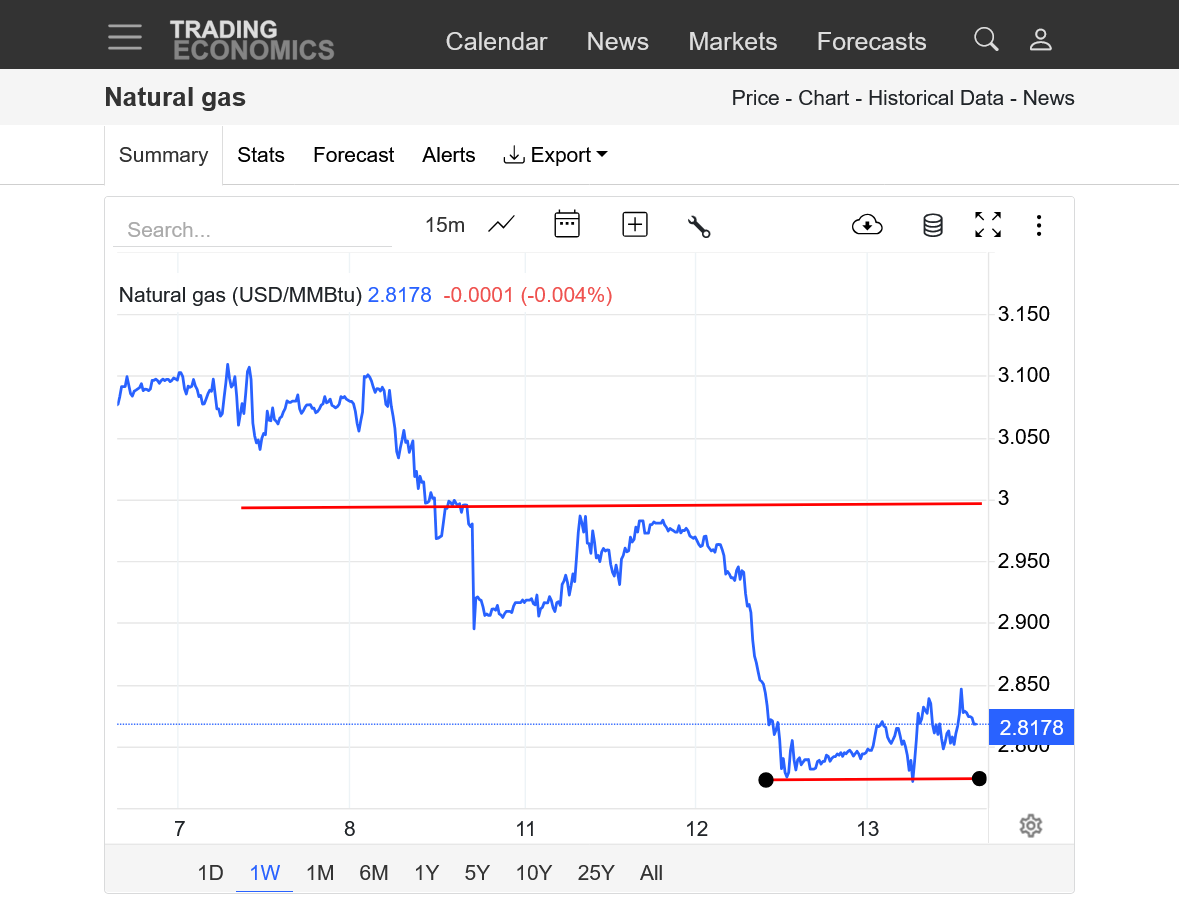
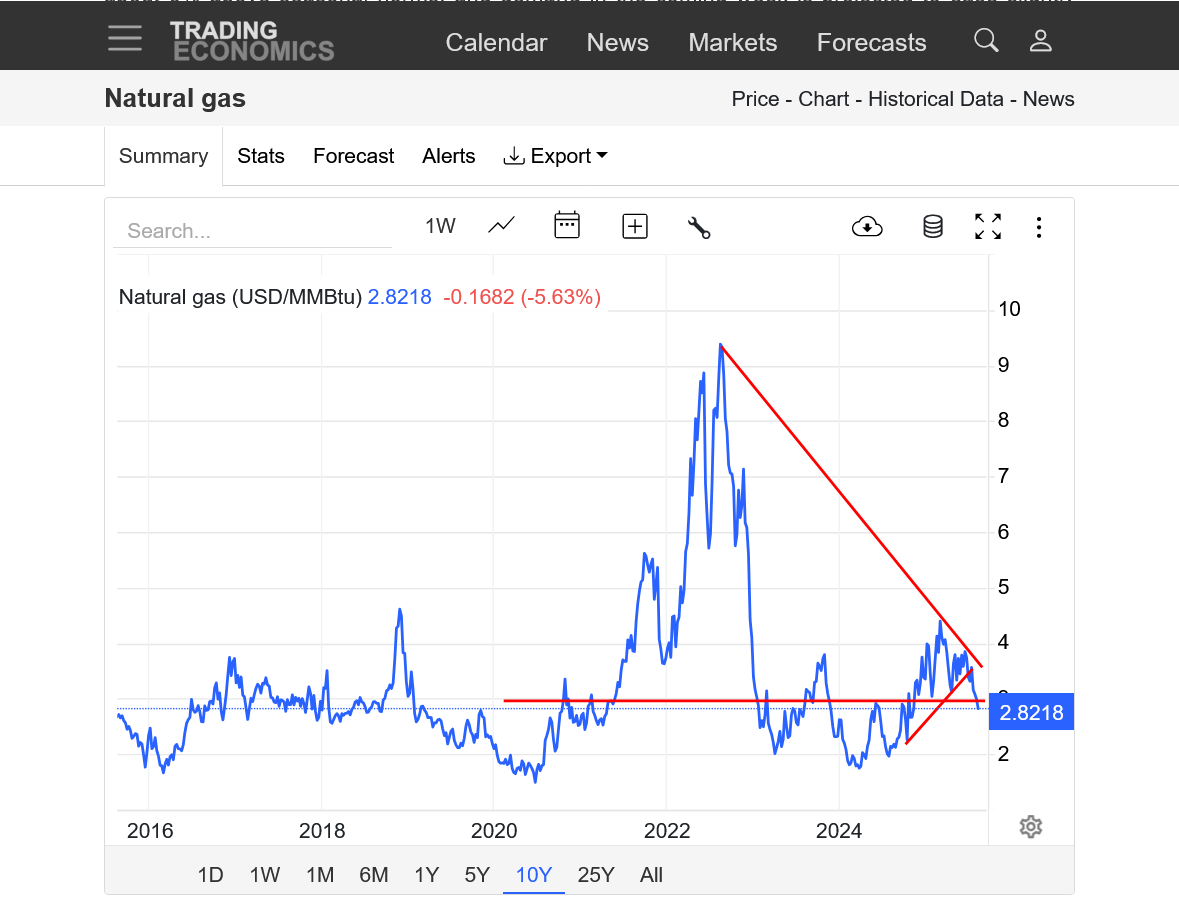
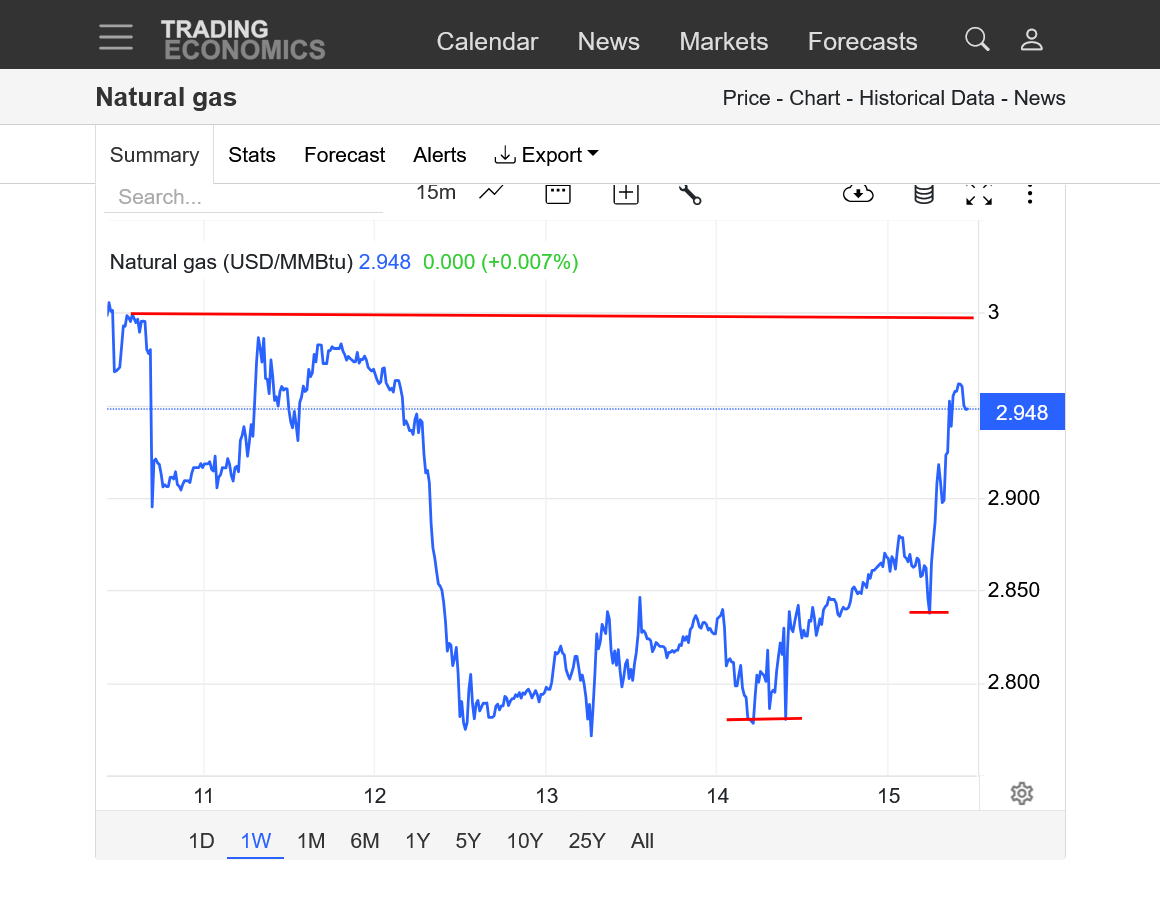
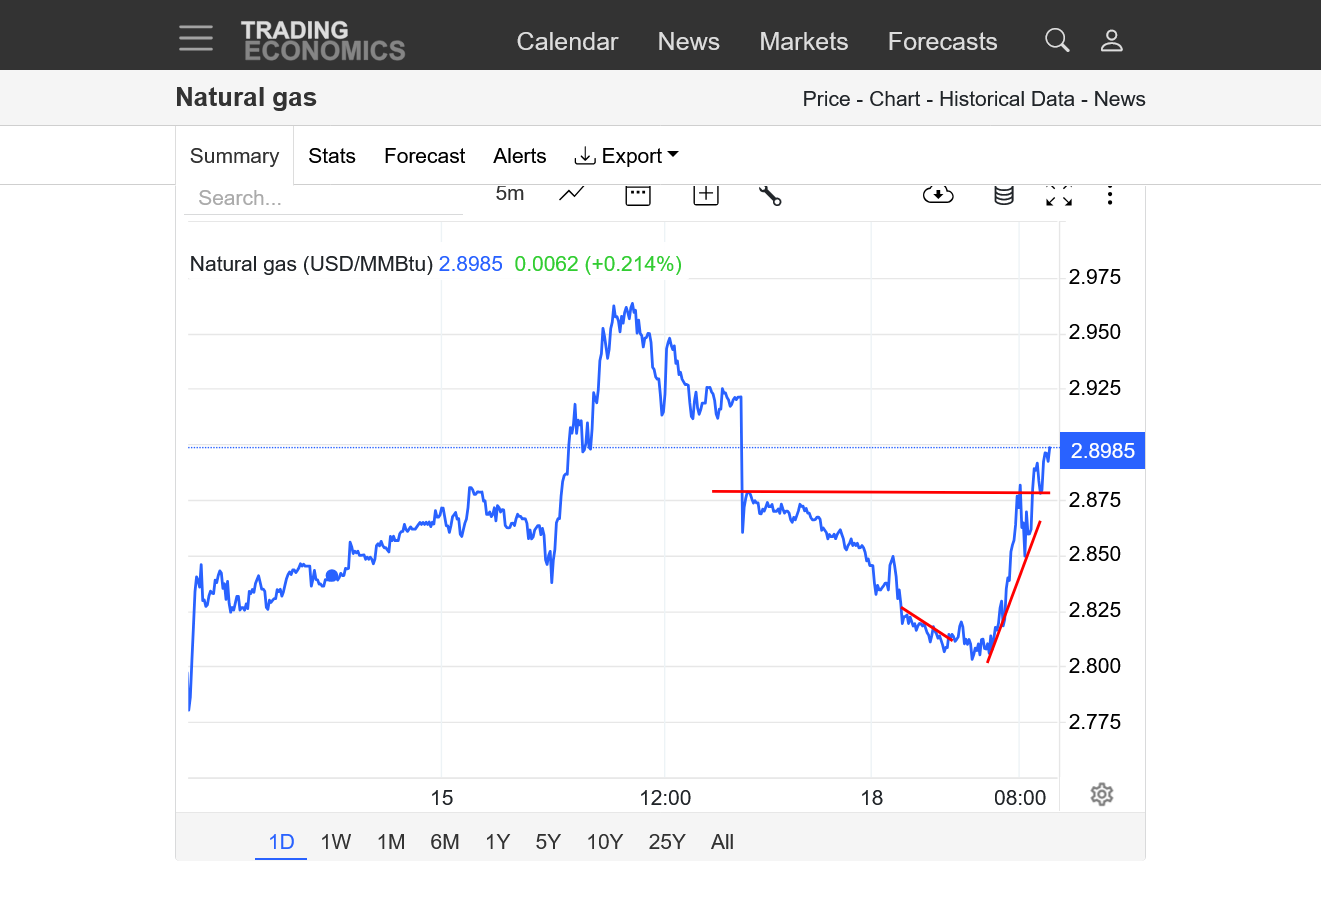
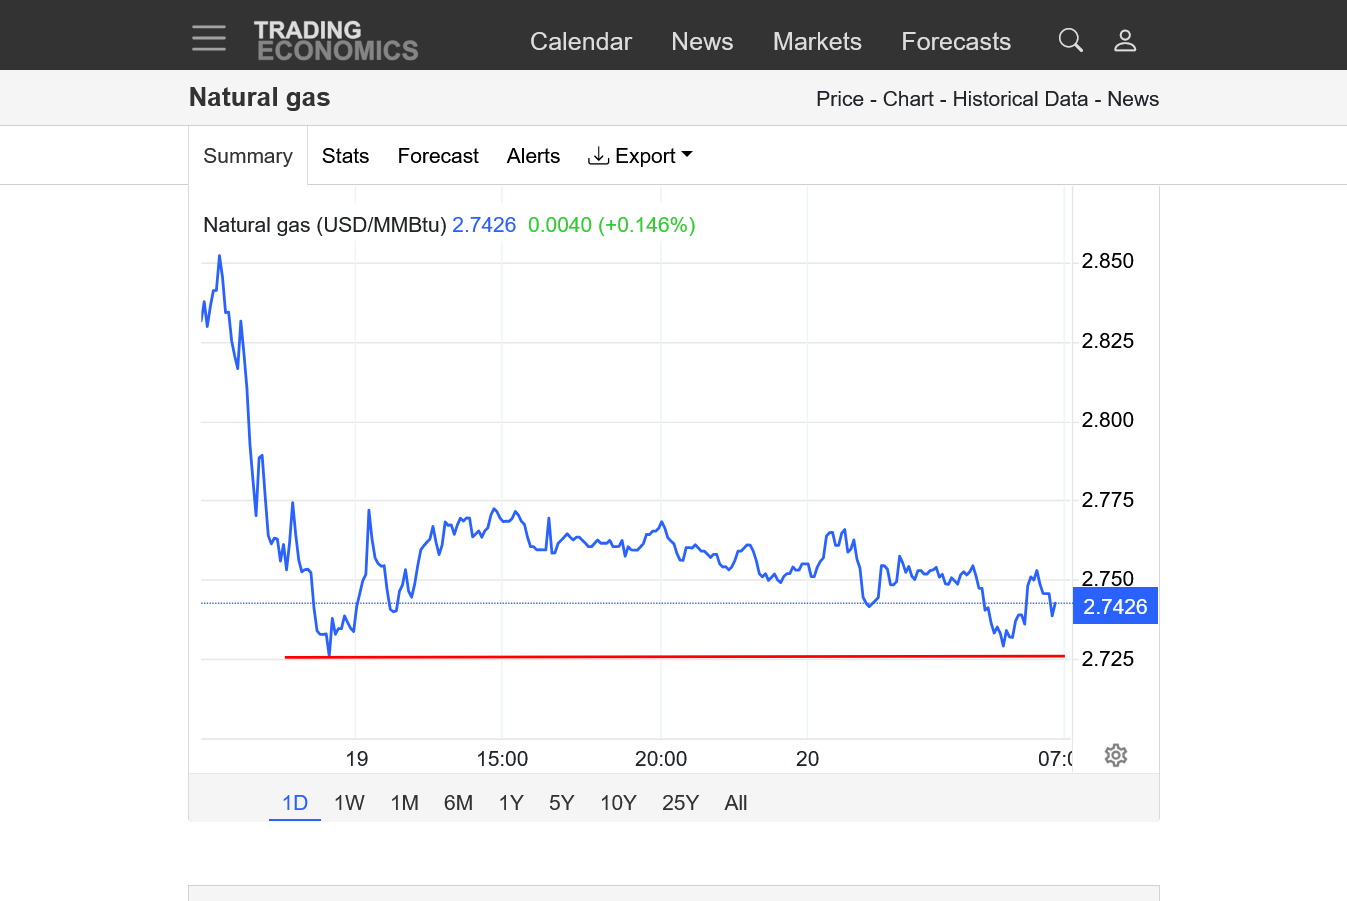
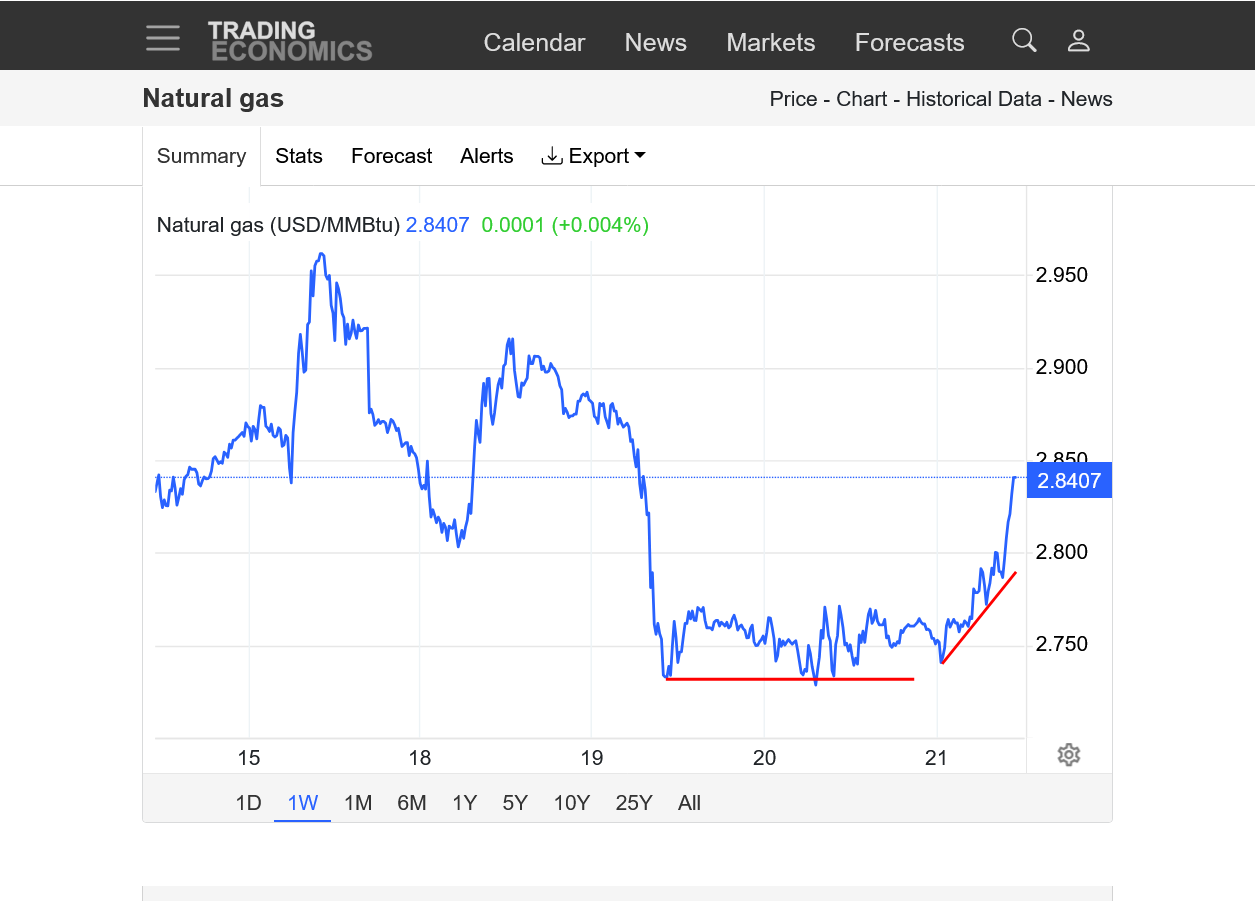
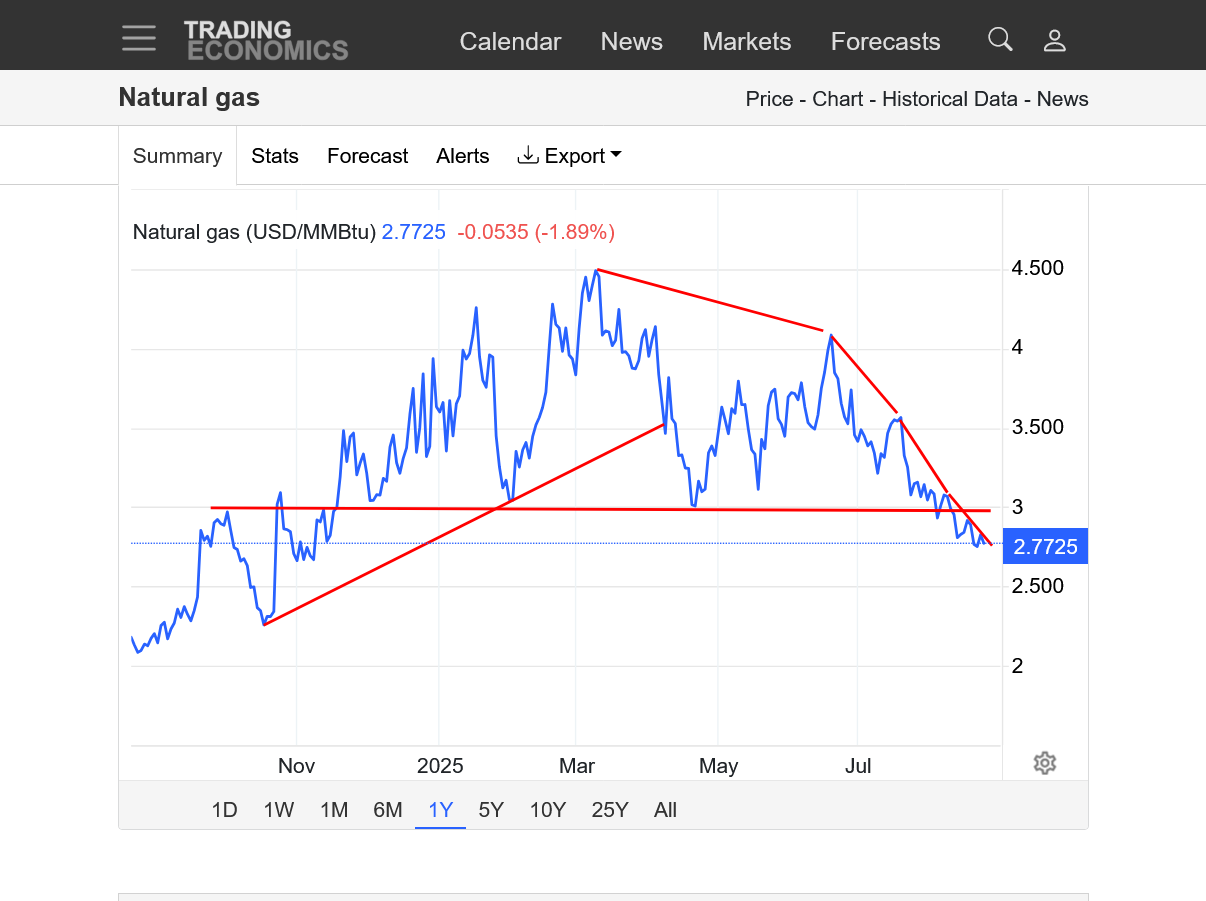
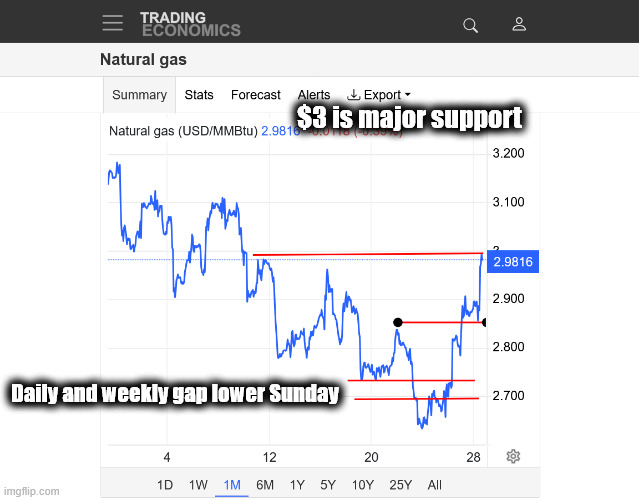
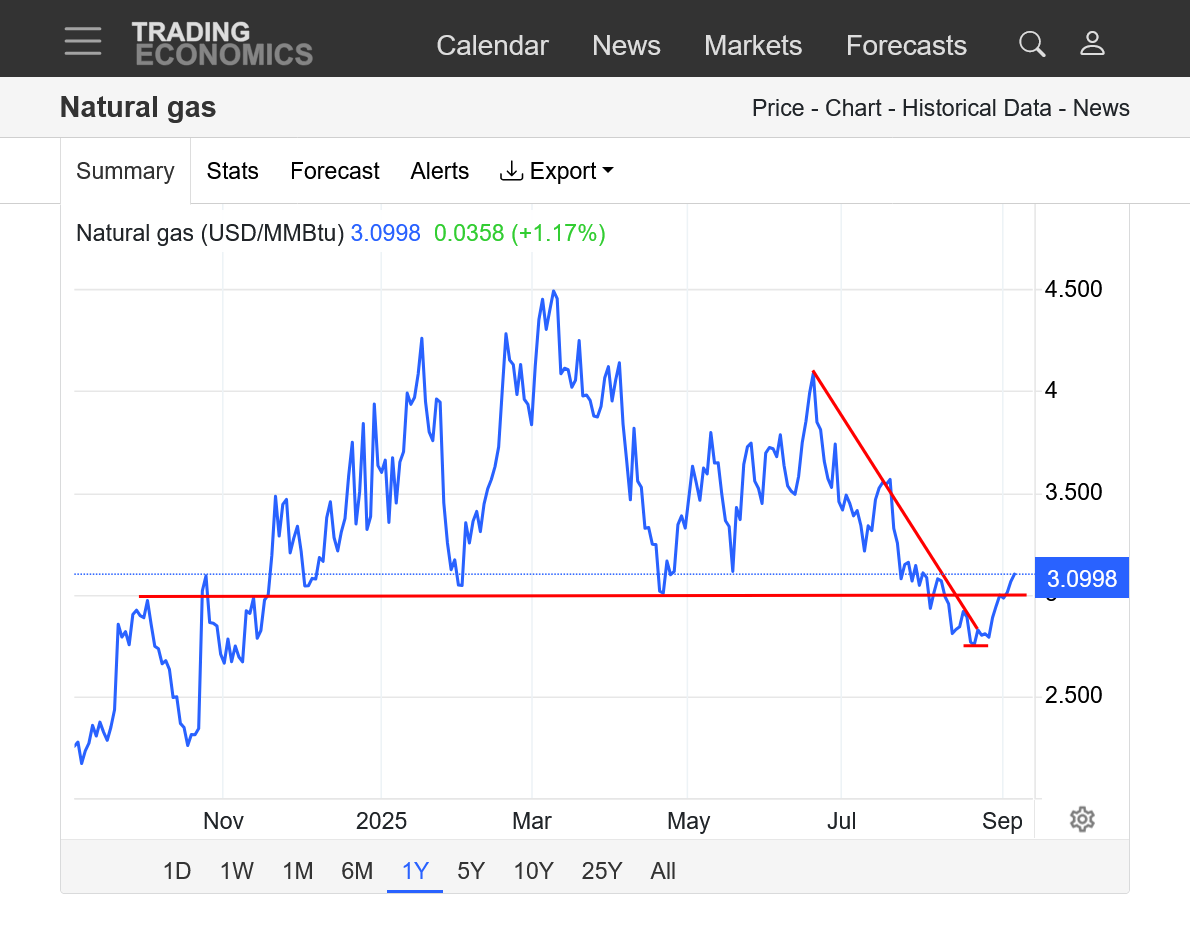
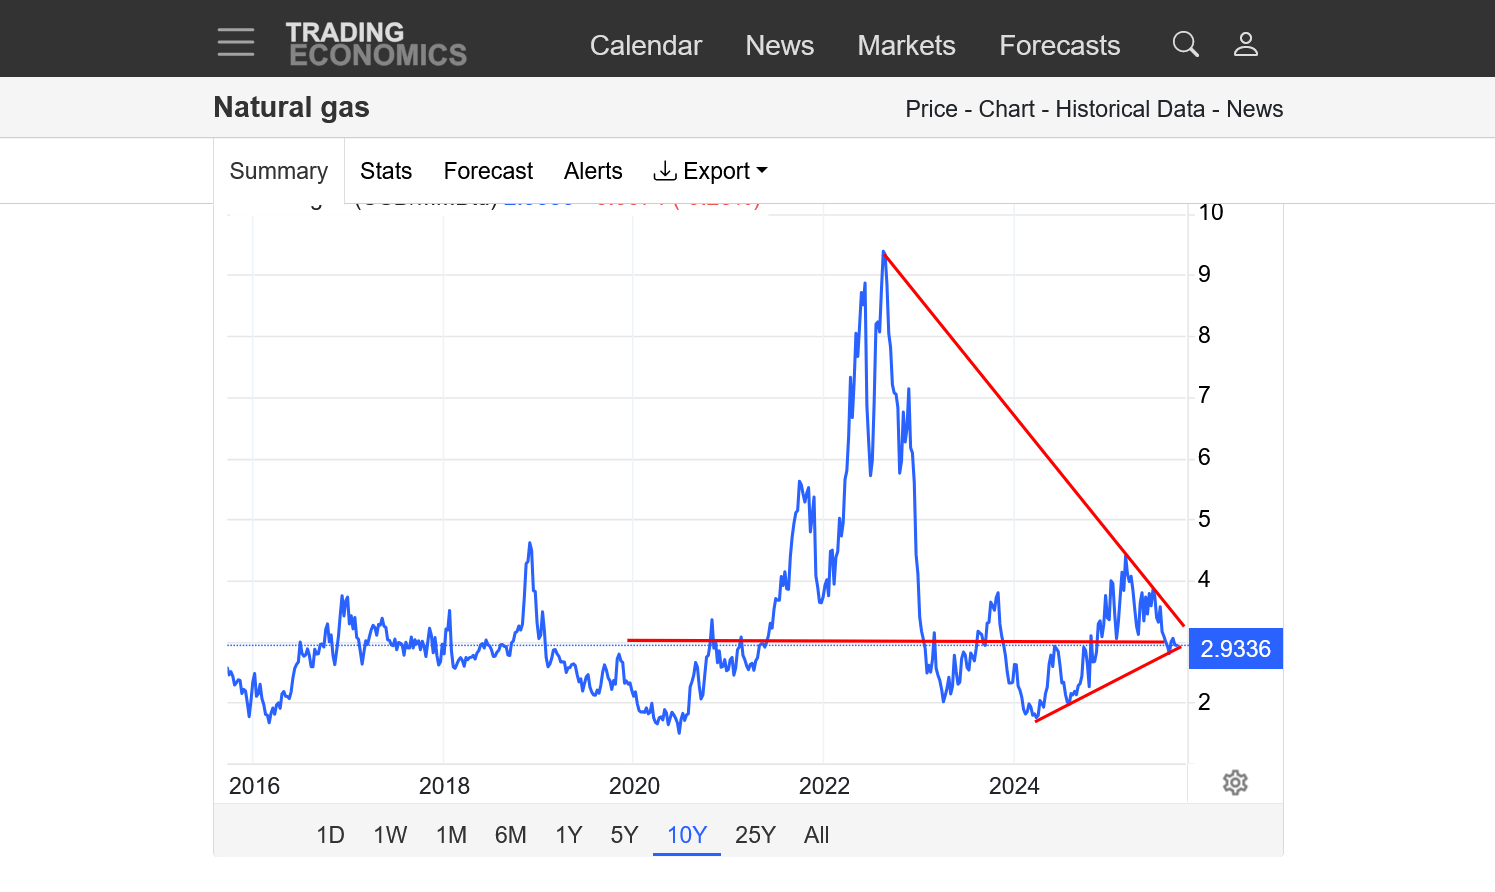
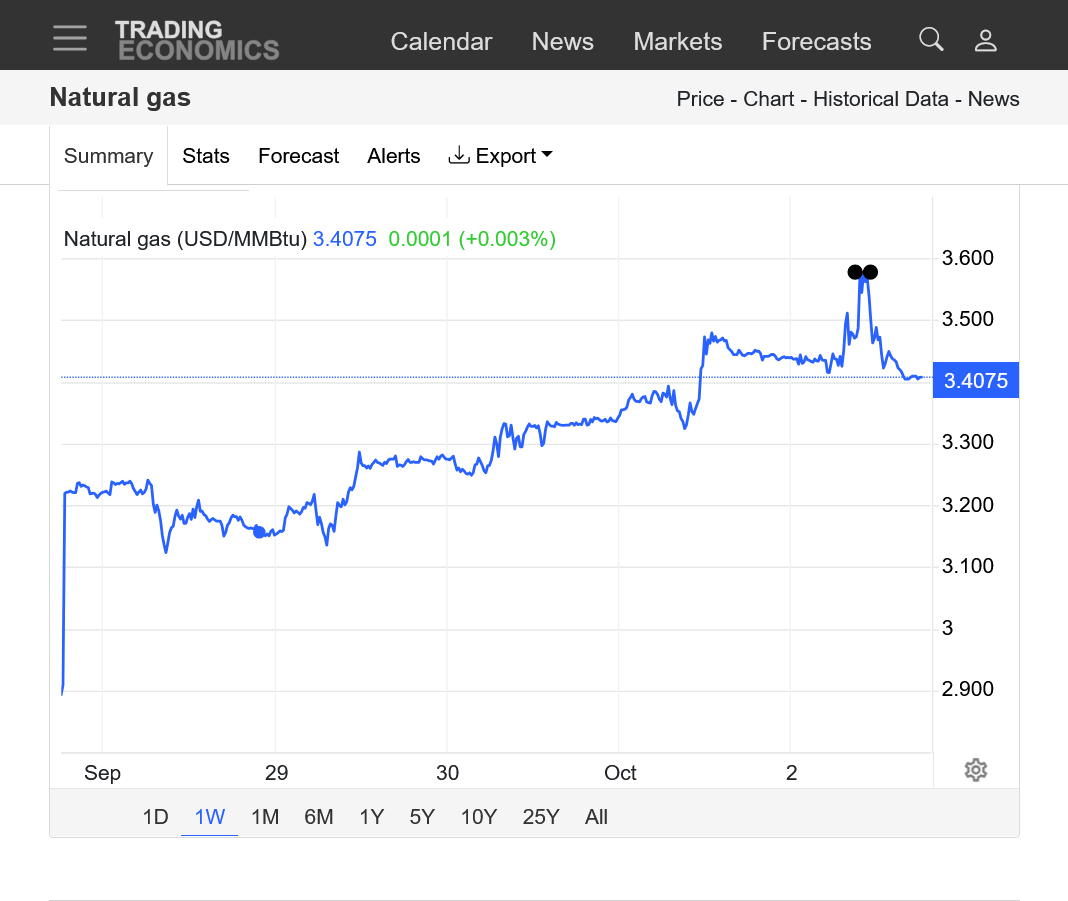
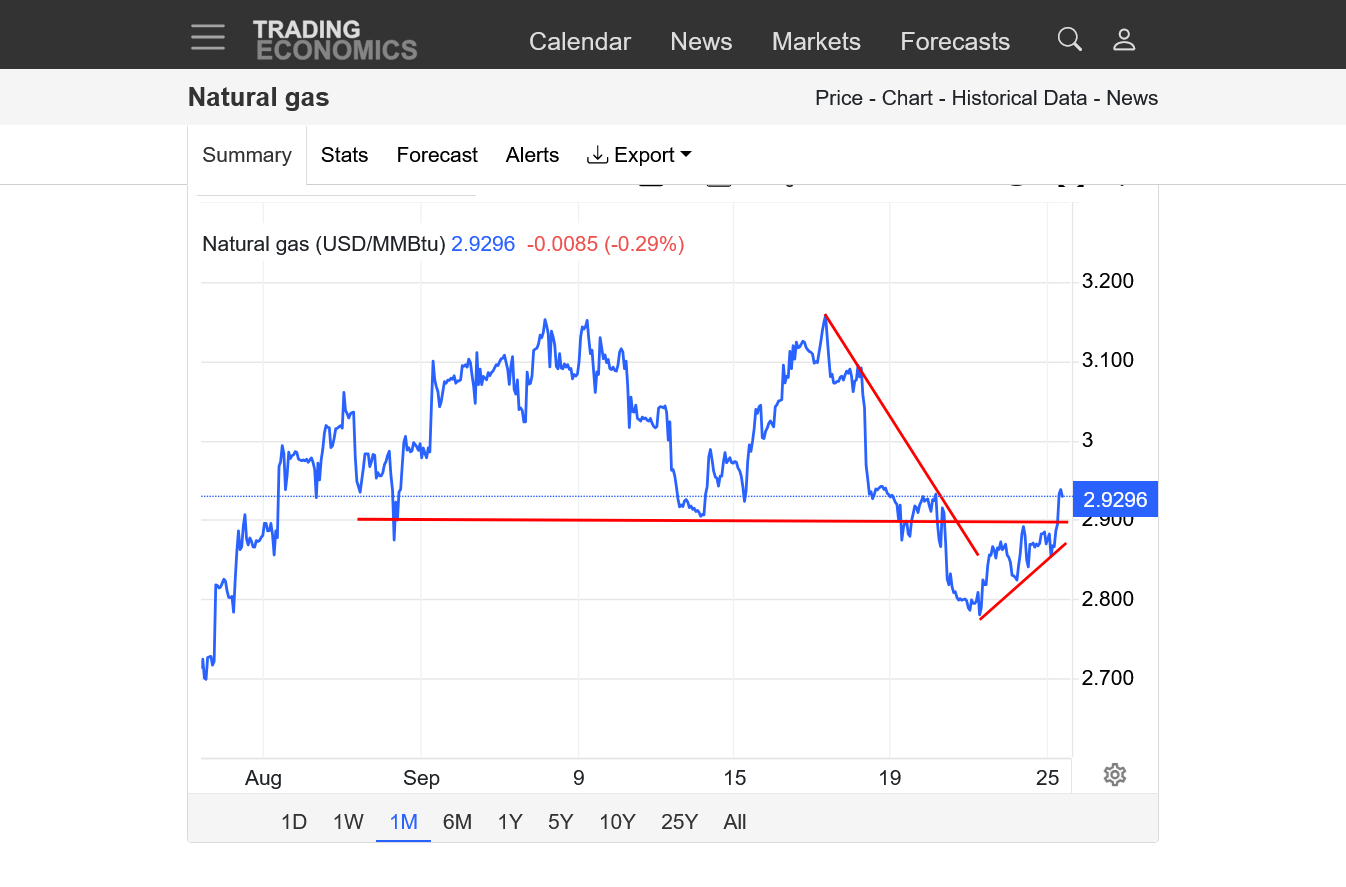
NG is struggling to hold key $3 support, despite the bullish temps for the month of August. Not a good sign for the bulls.
As mentioned, natural gas is struggling to hold $3 support, in spite of bullish temperatures coming in August and positive seasonals. This is a very bad sign!
https://tradingeconomics.com/commodity/natural-gas
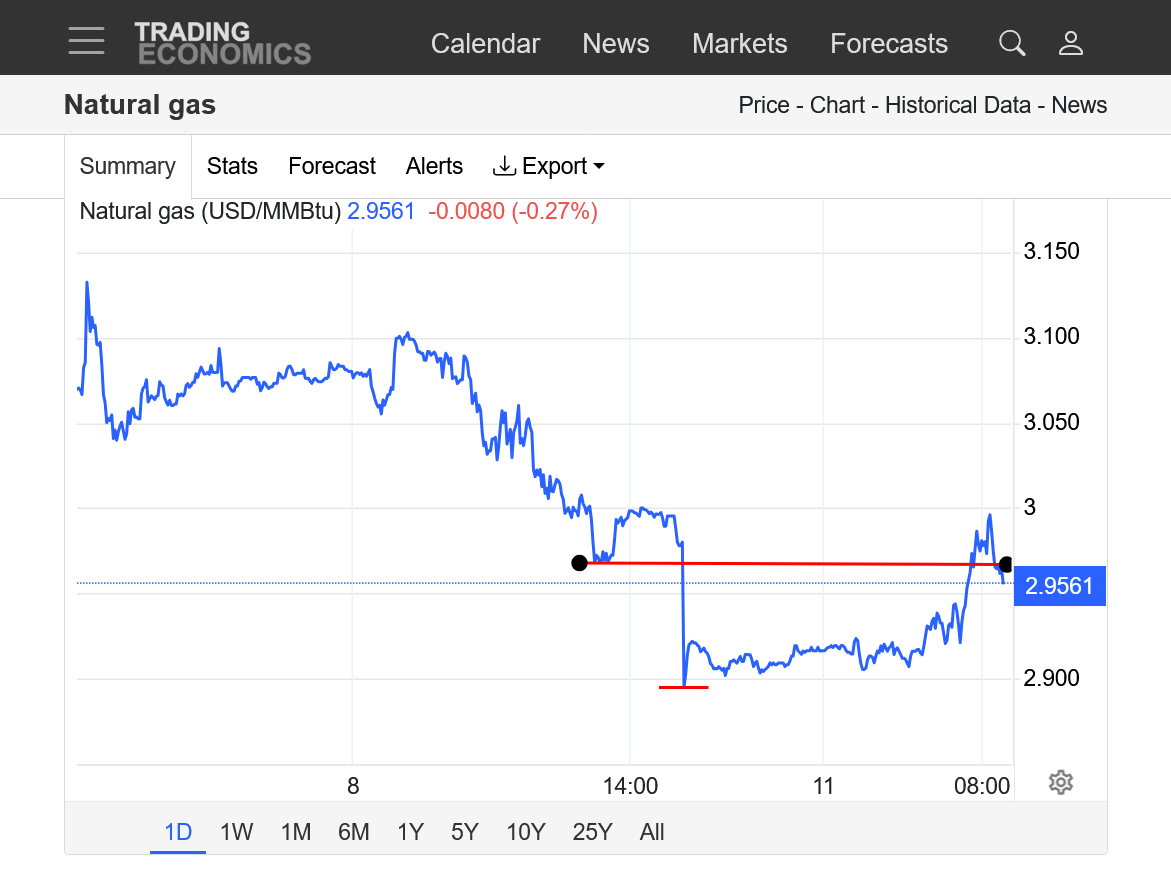
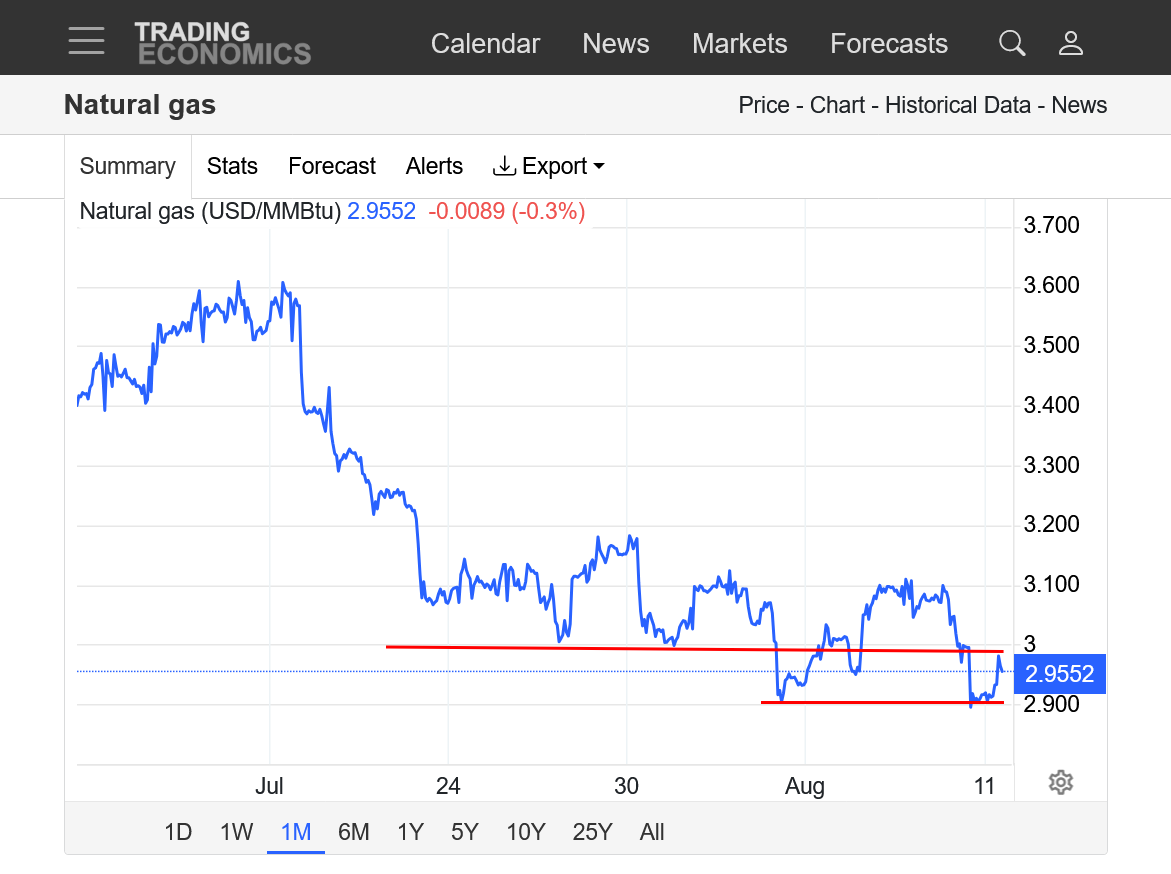
1. 1 day-as is typical at 6am. The big traders came in and caused the modest strength overnight to GET CRUSHED BY SELLING.
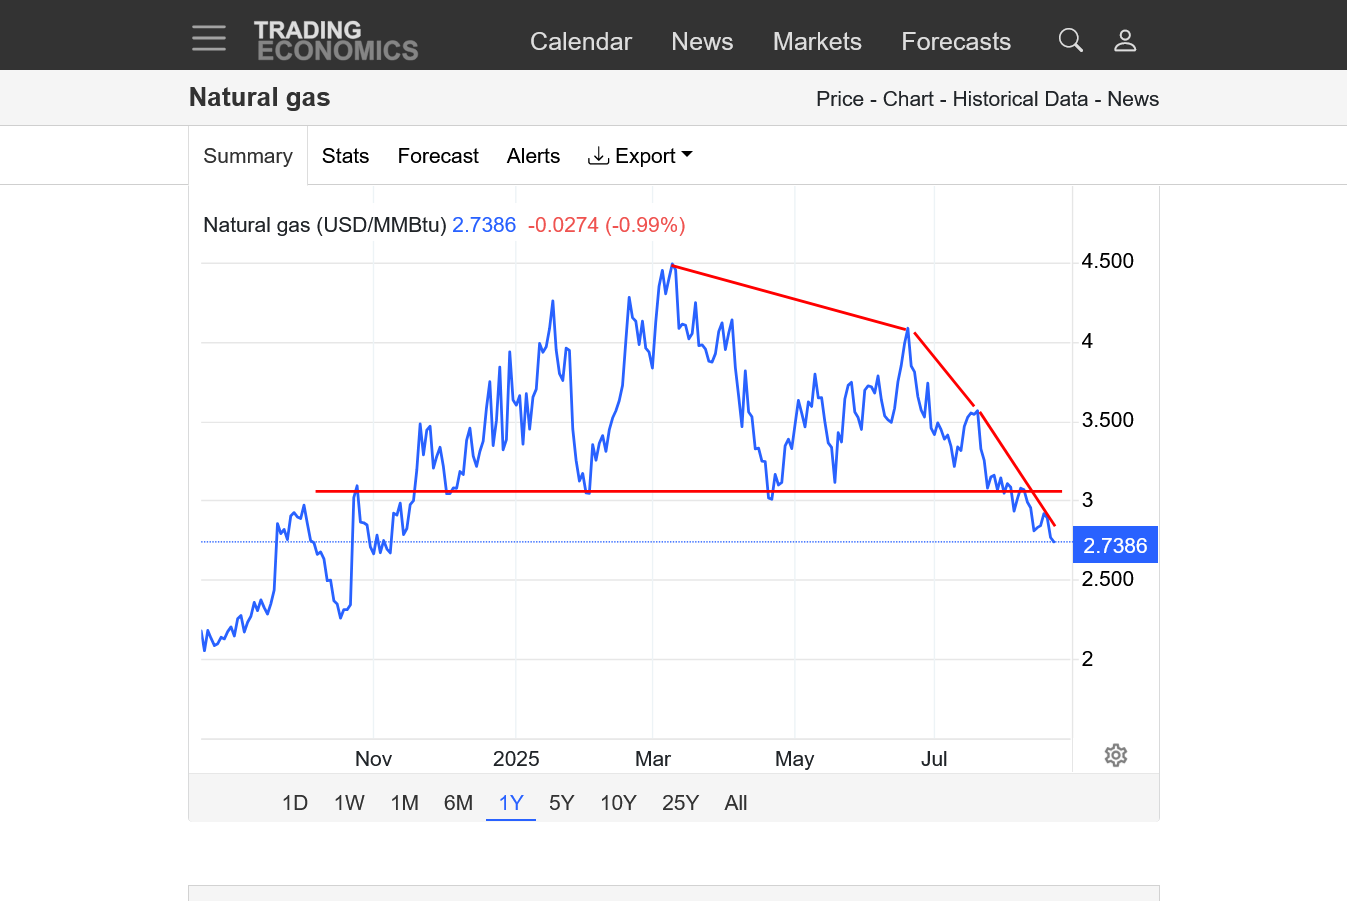
2. 1 week-$3 is a key area of strong support-not holding up well with bullish August weather
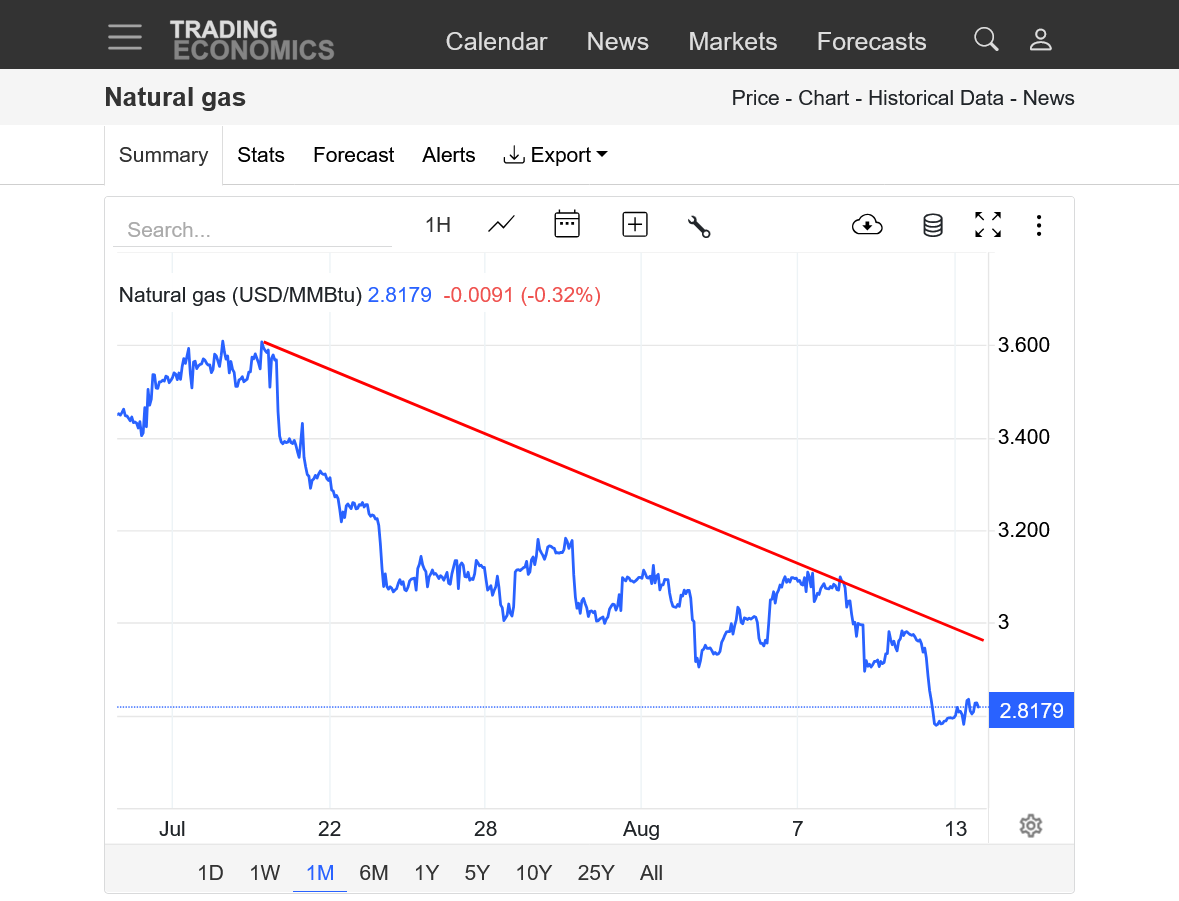
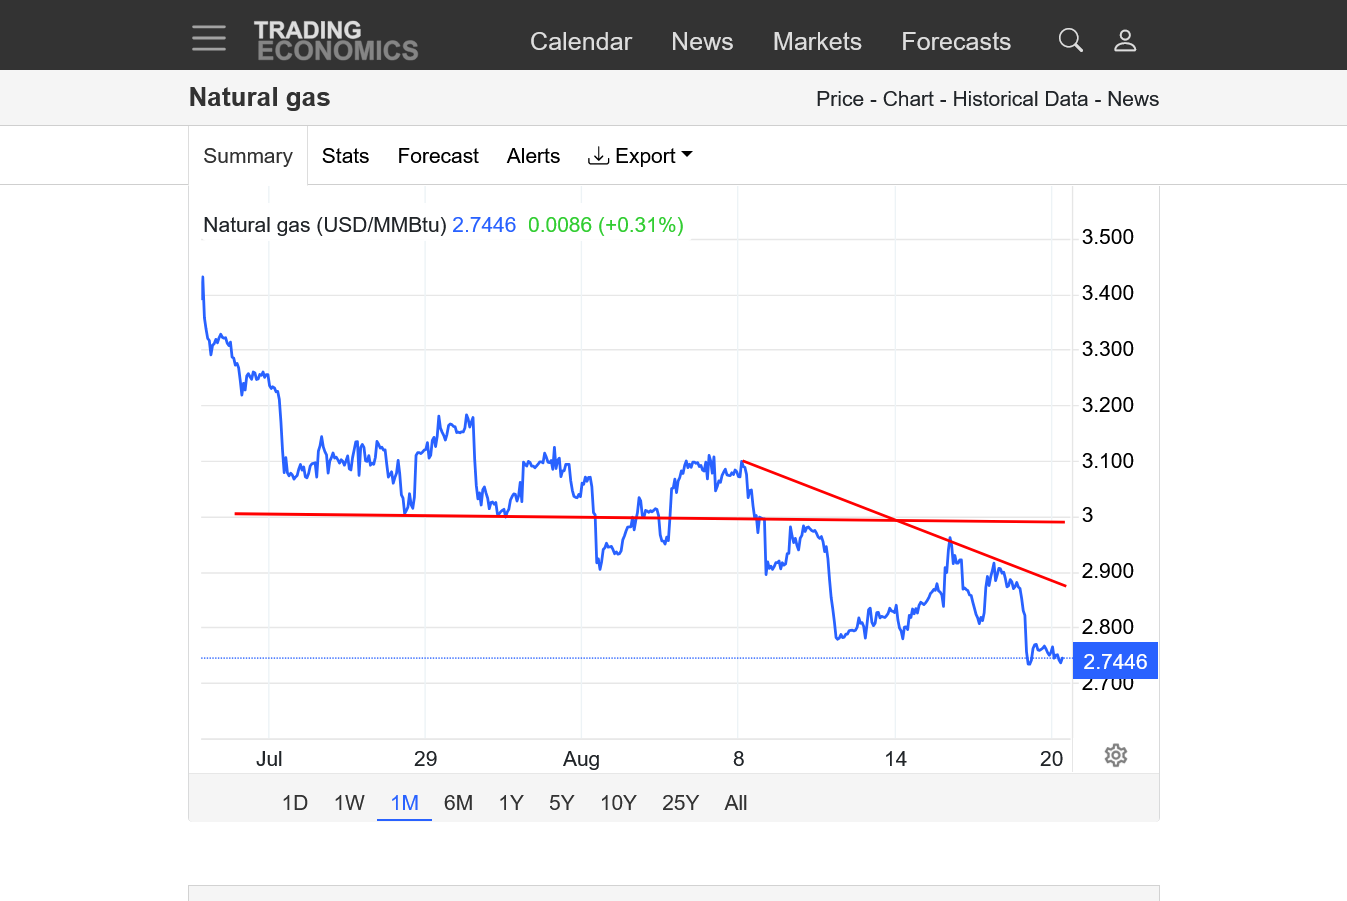
3. 1 month-$3 is a key area of strong support
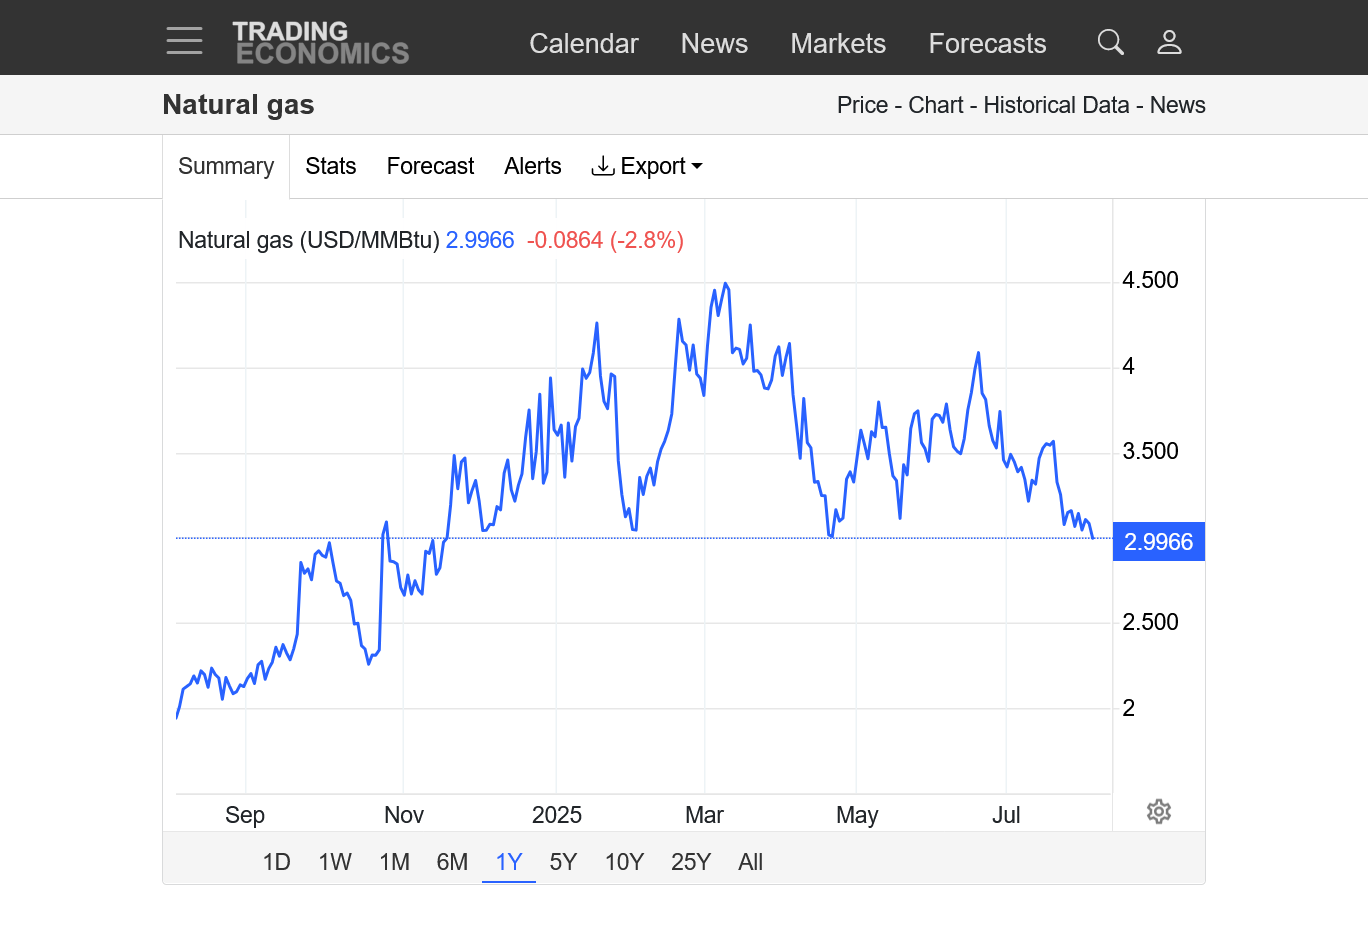
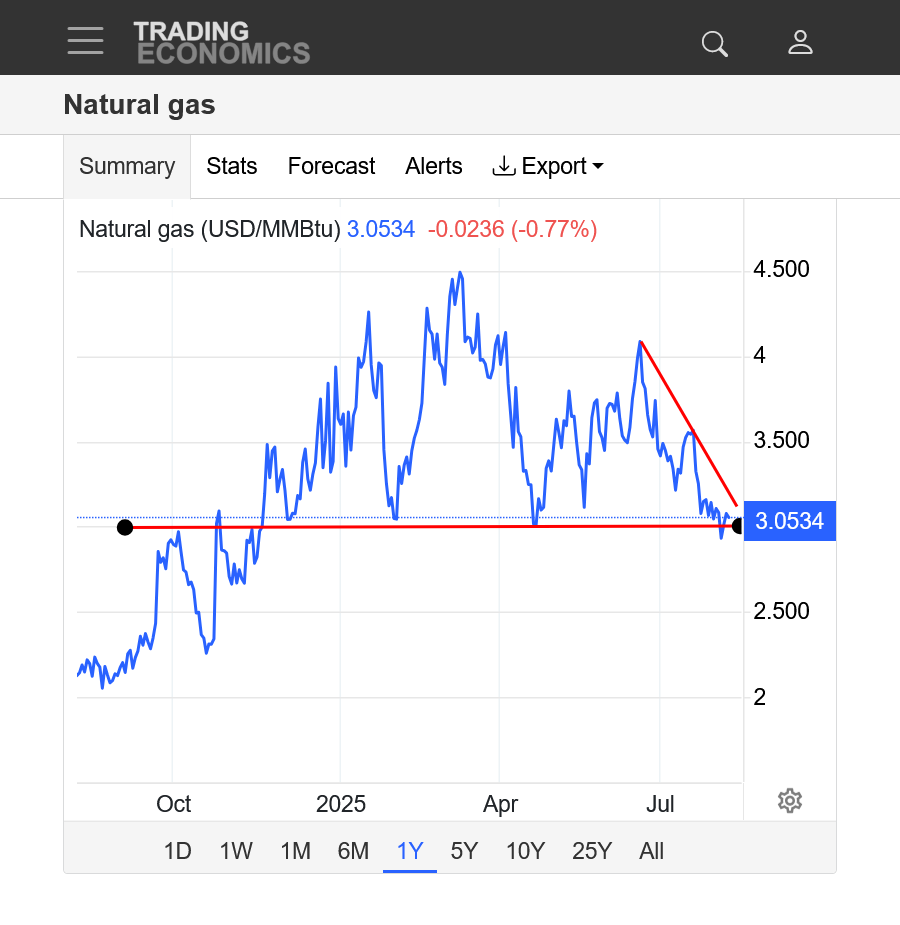
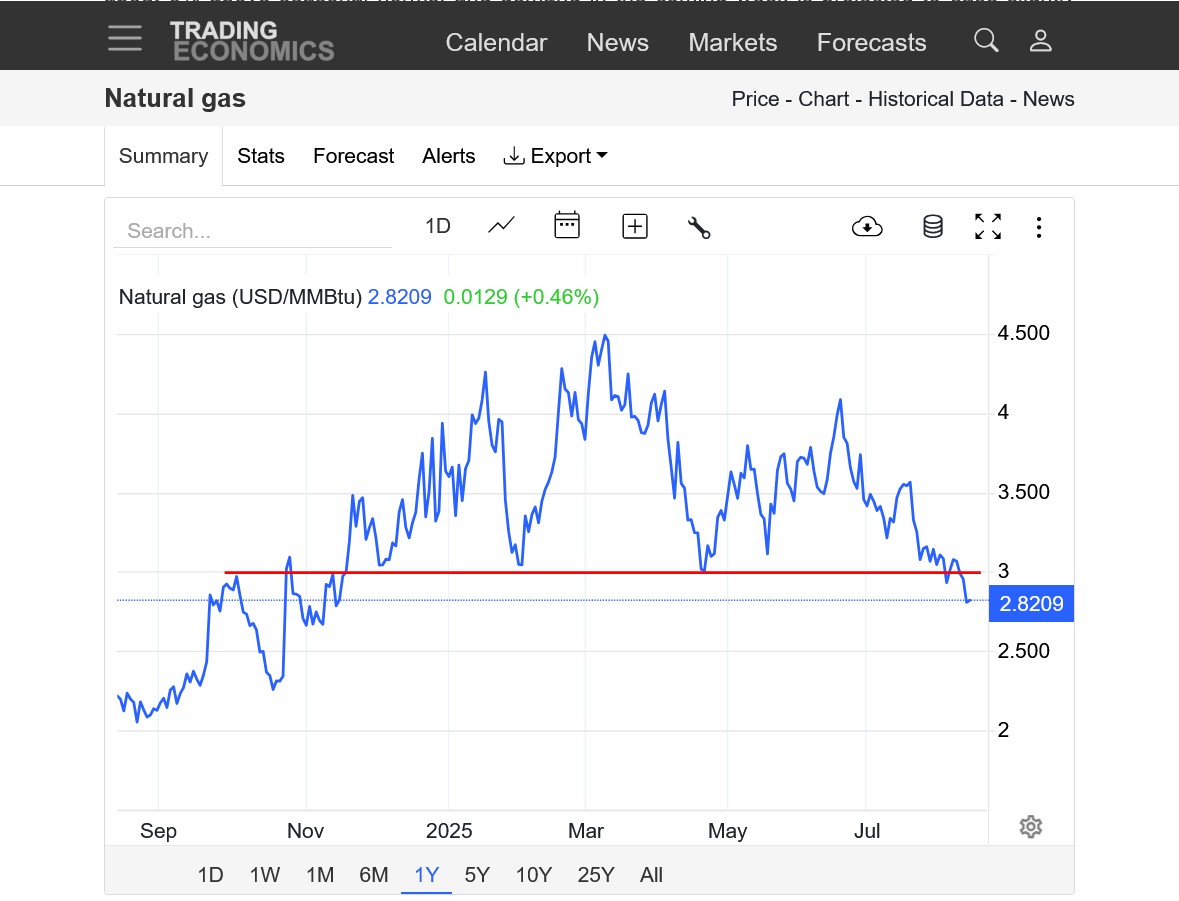
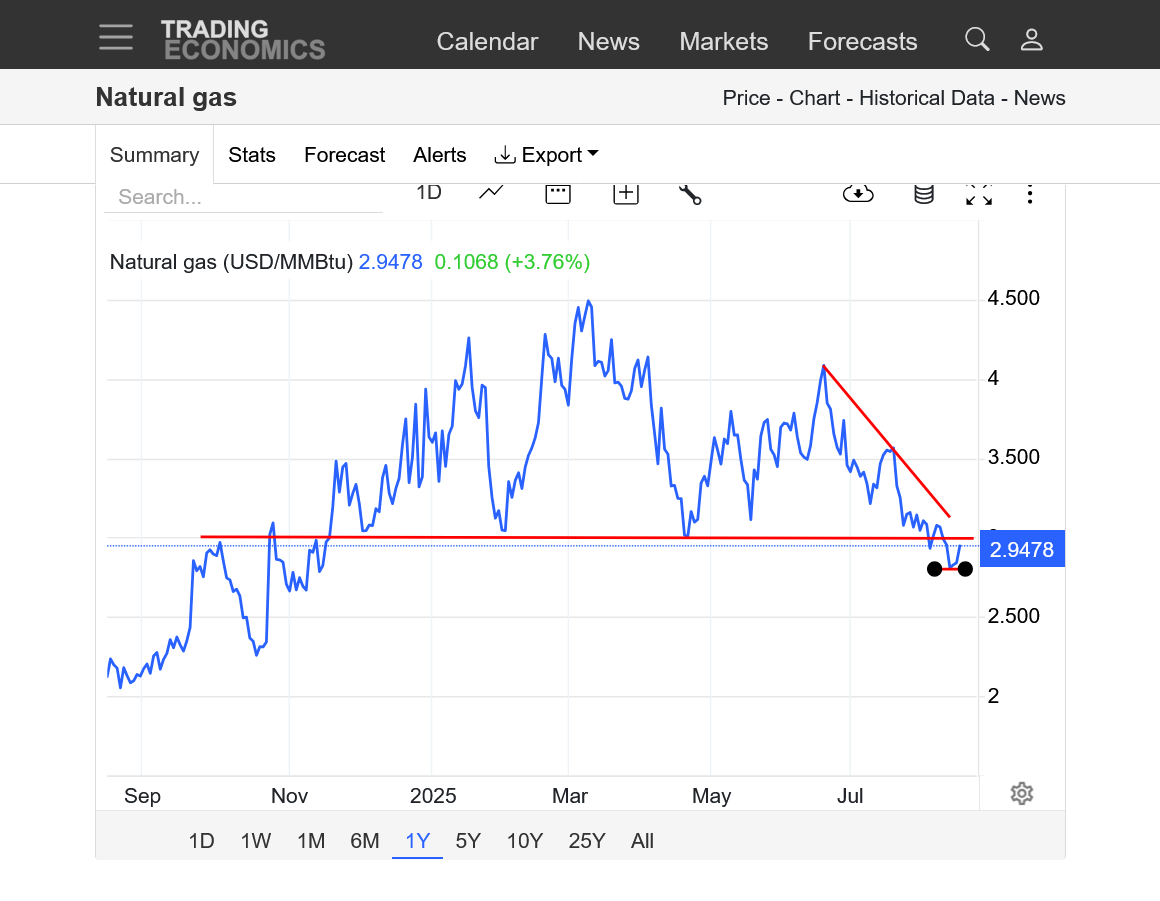
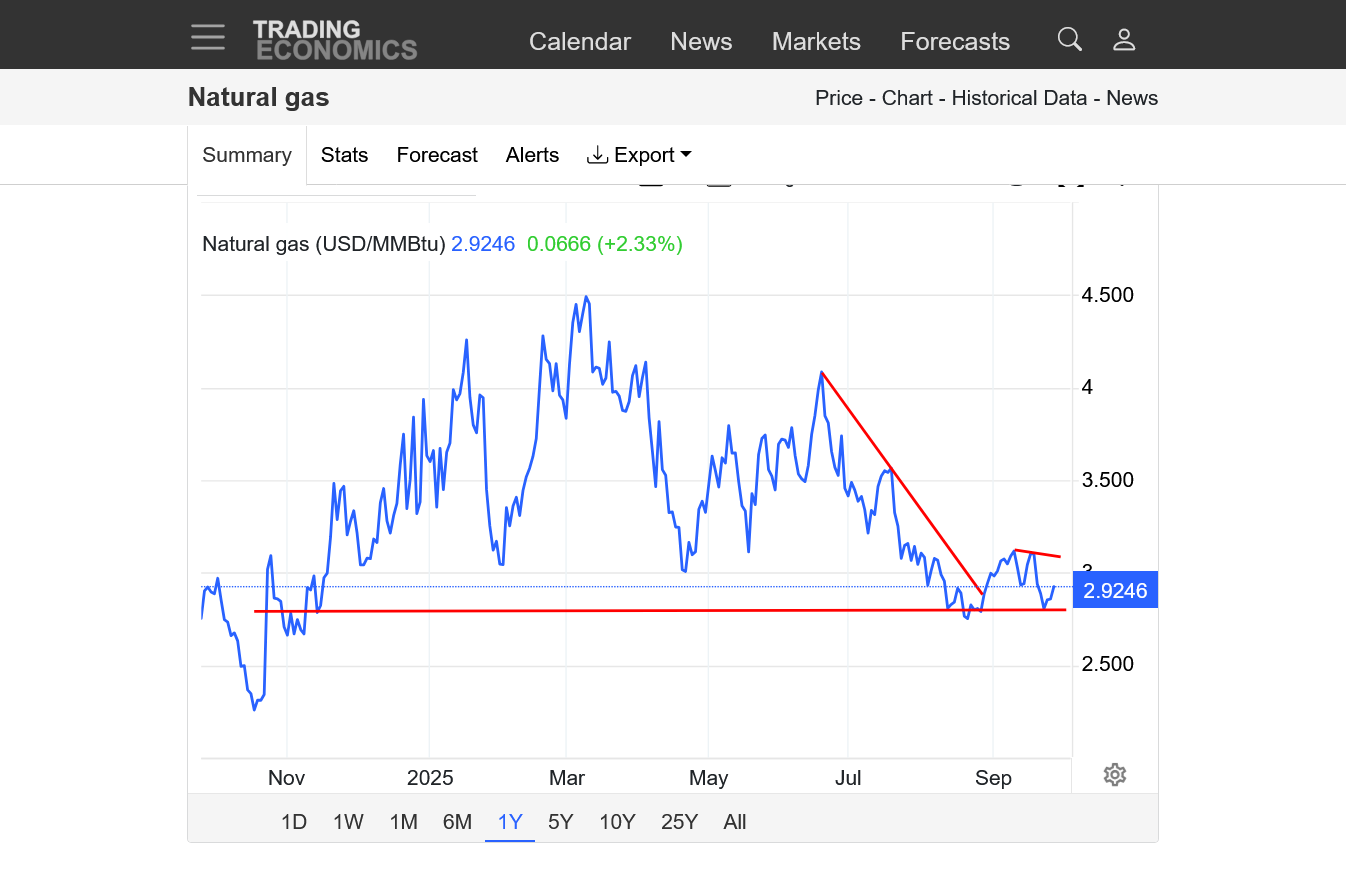
4. 1 year-$3 is a key area of strong support
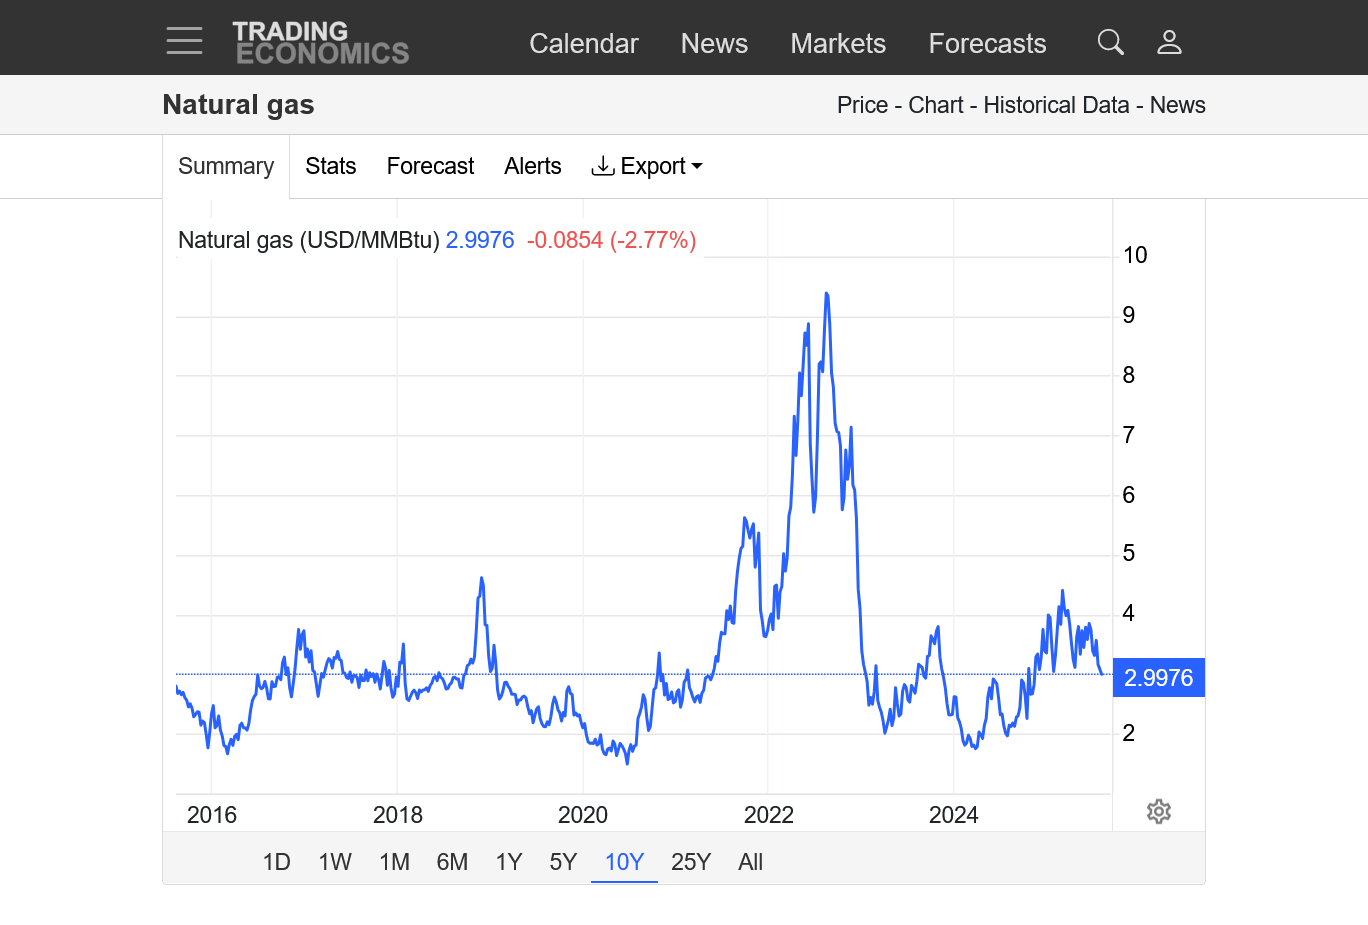
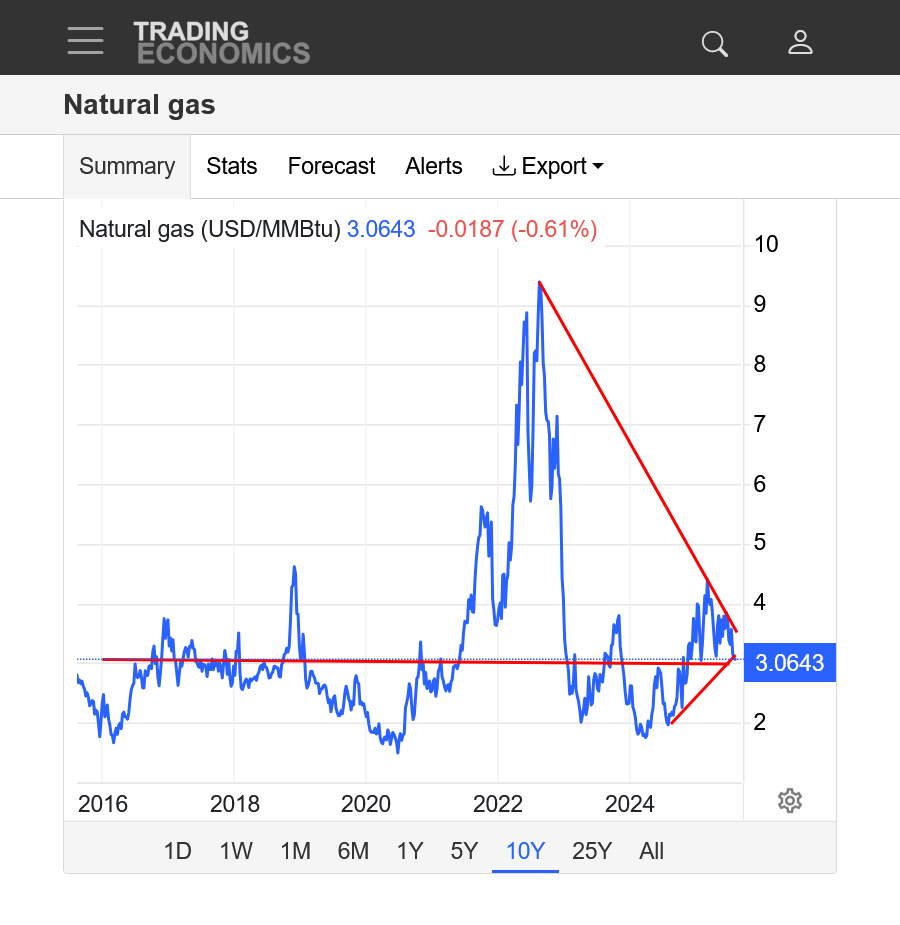
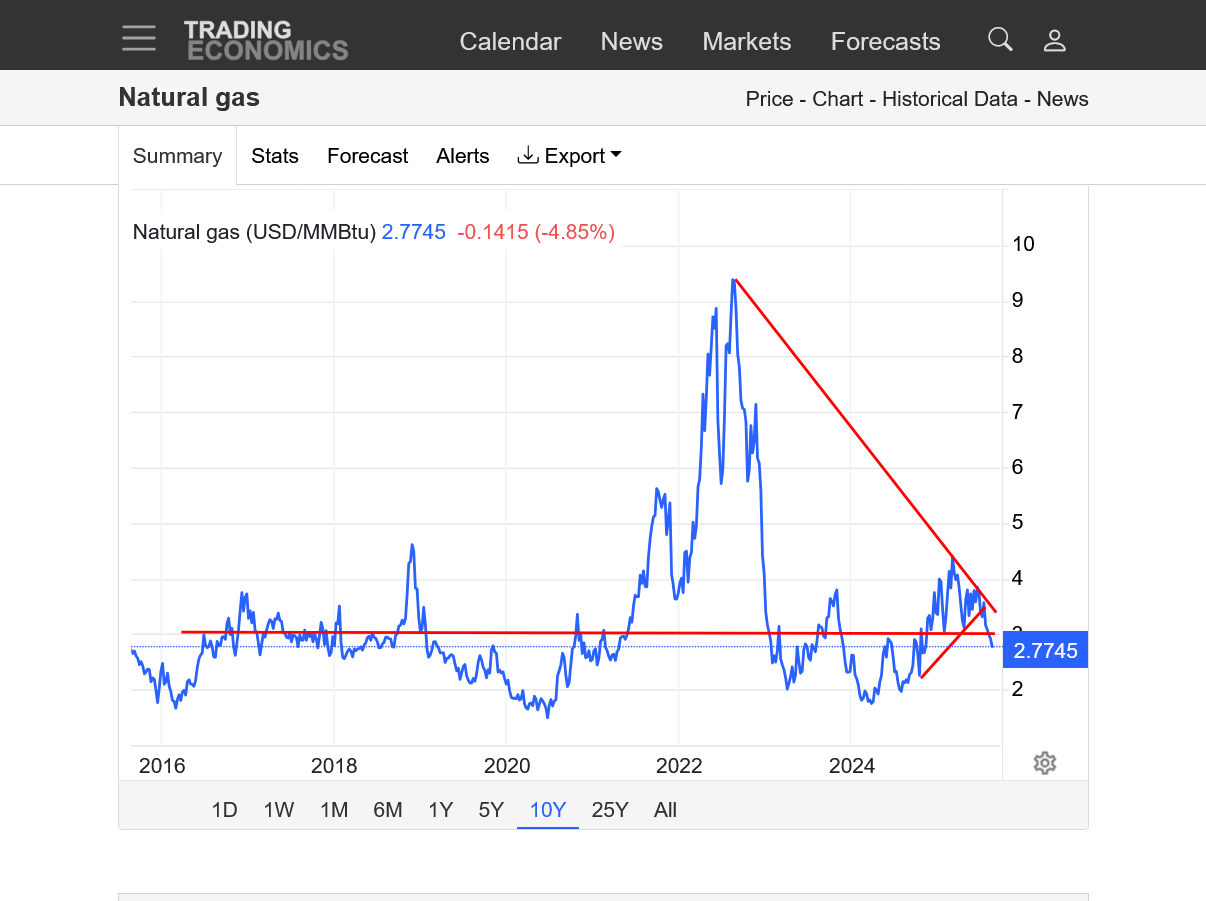
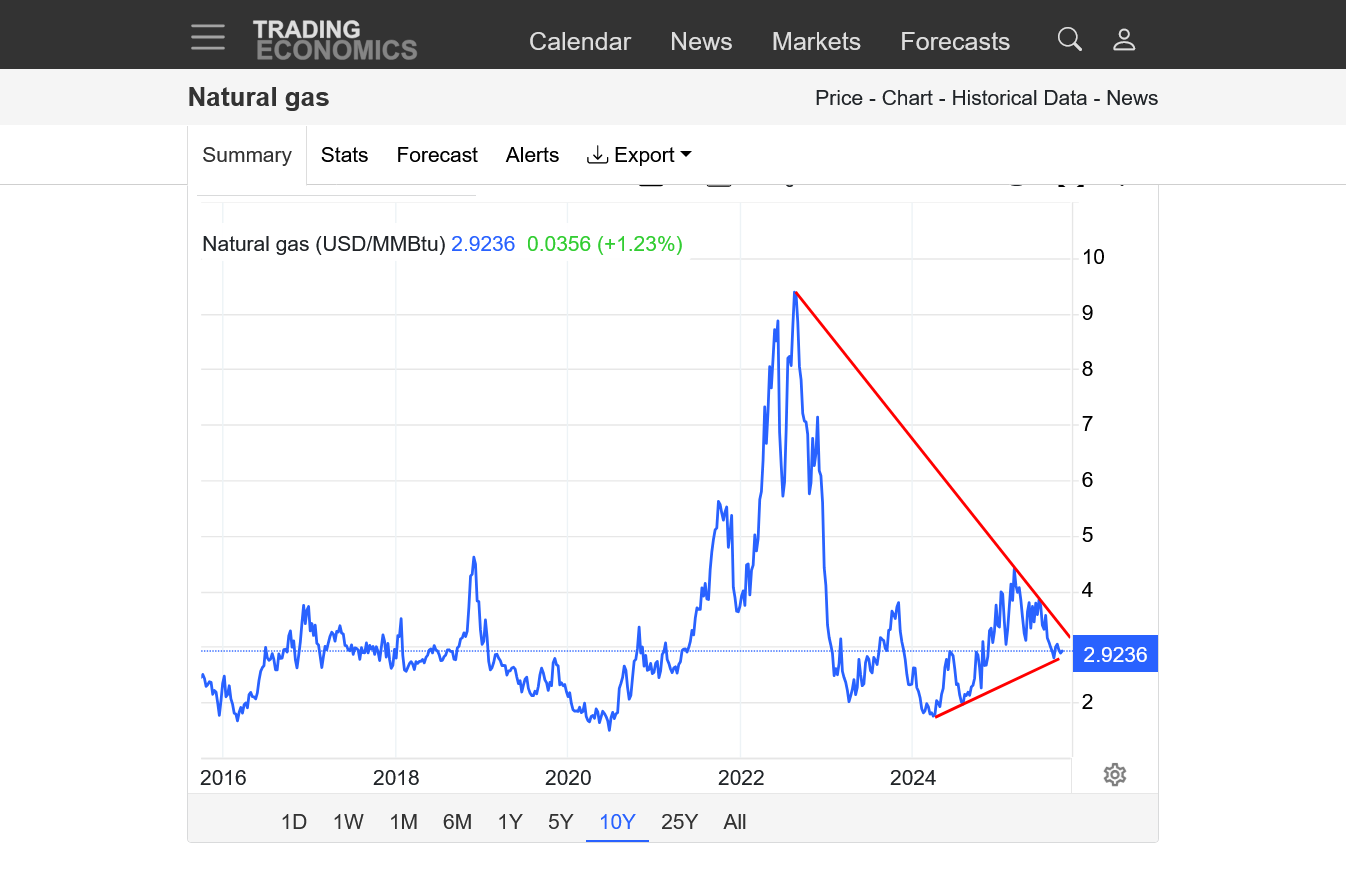
5. 10 years
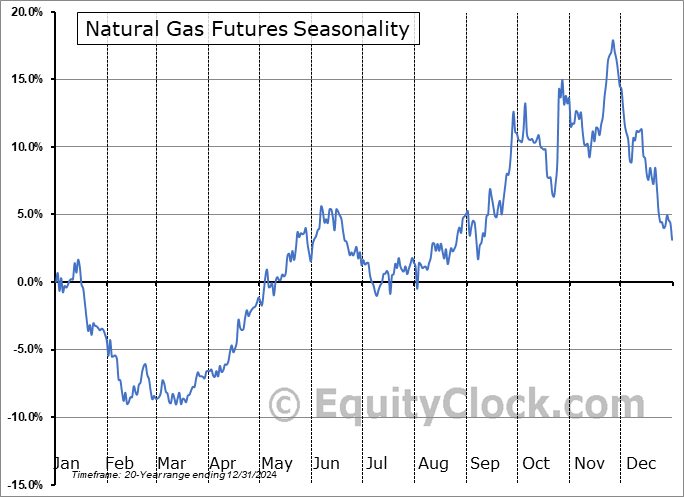
Great site for seasonals!
They are fairly bullish thru September. With heat returning to the forecast, my WEATHER bias is to the upside but weather is NOT they key price determining factor to start this week.
A contracting economy, however reduces industrial demand. Also, some demand for natural gas in the Summer to burn to generate electricity for cooling/AC use has being replaced with wind and solar.
Also, production has increased a bit and last Thursday's EIA was SOLIDLY BEARISH!
https://equityclock.com/seasonality/
https://equityclock.com/charts/
https://charts.equityclock.com/natural-gas-futures-ng-seasonal-chart
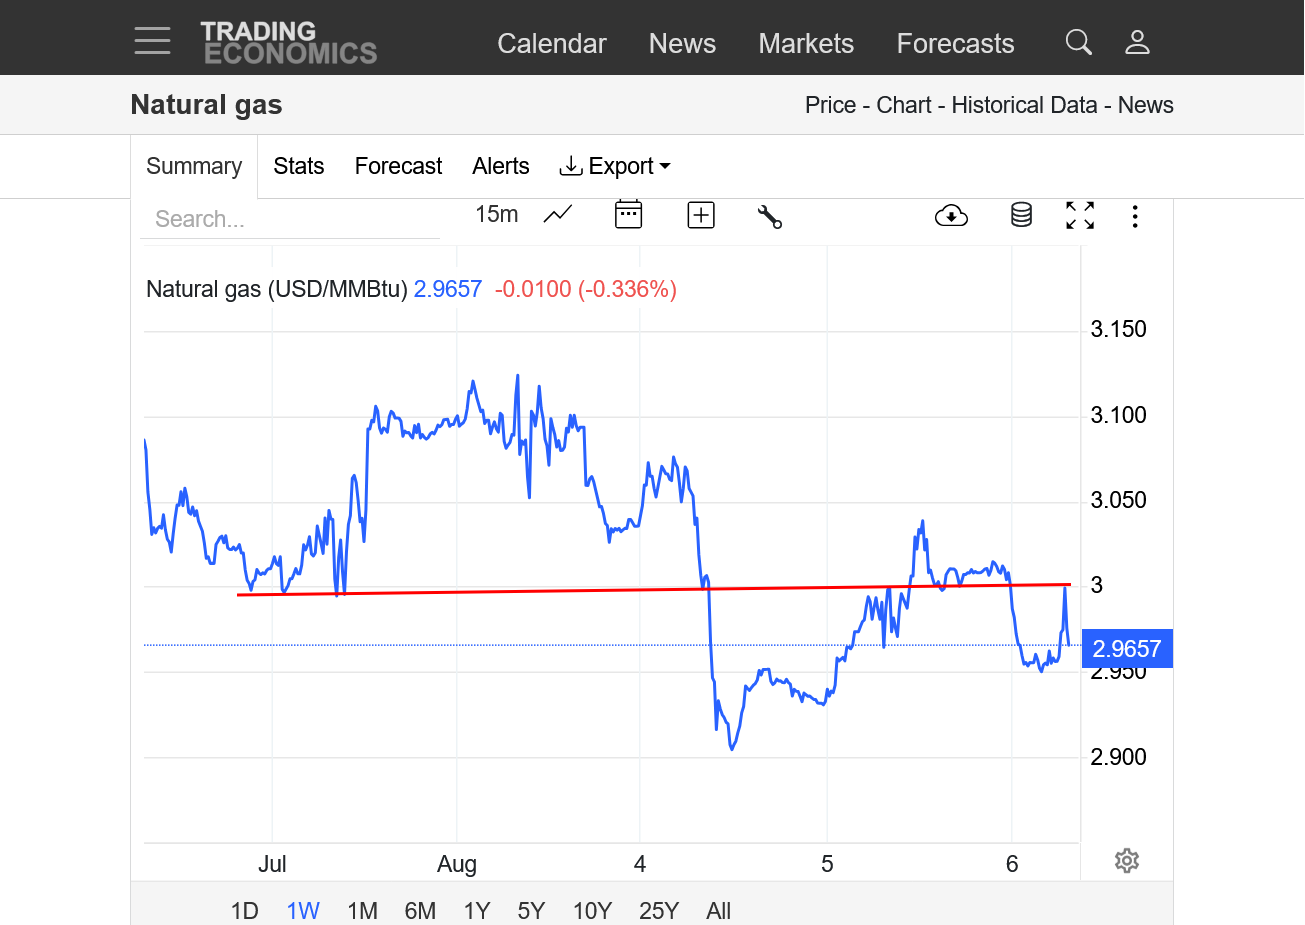
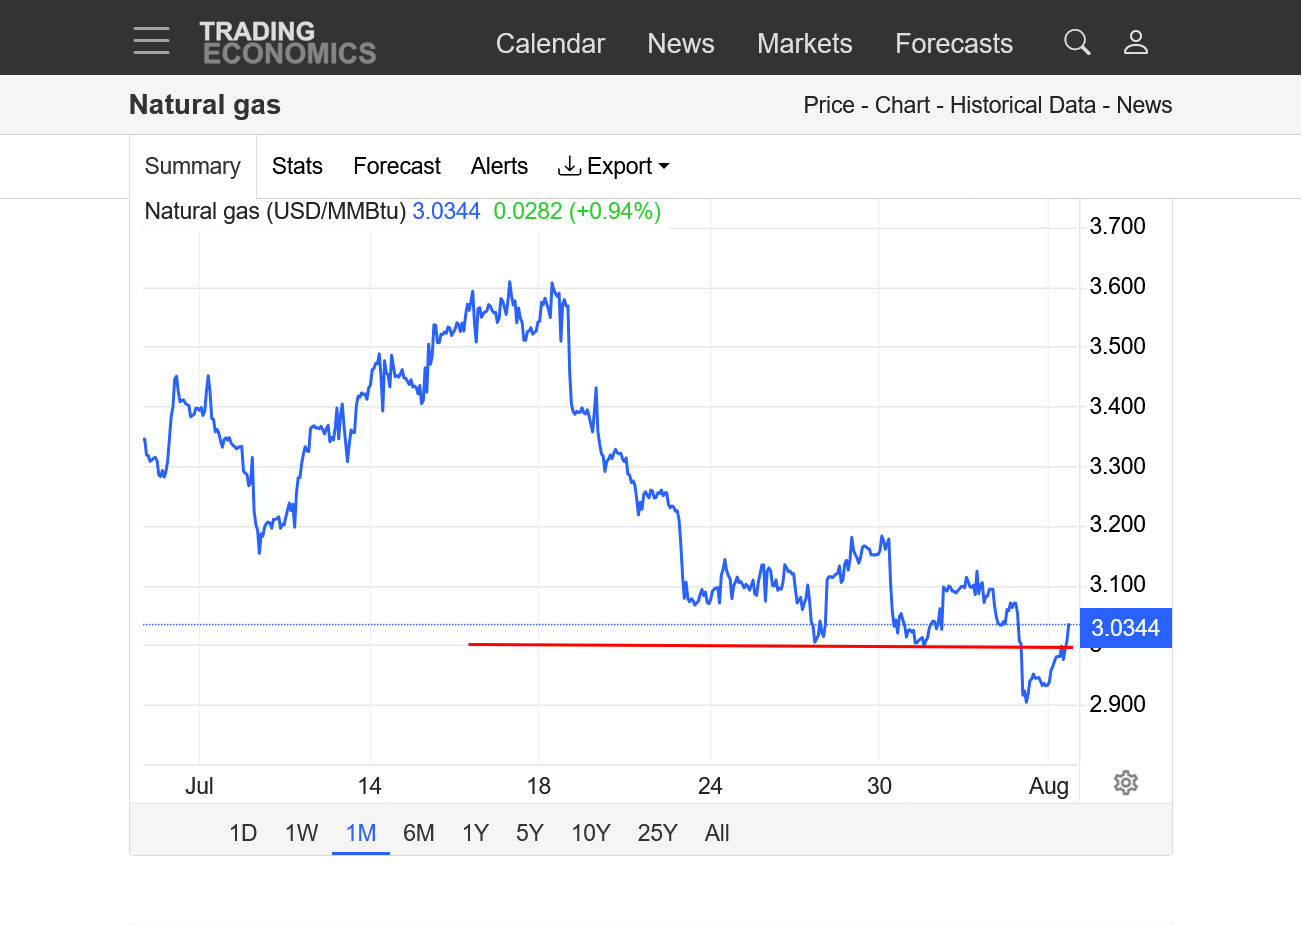
Not surprisingly, with the market NOT reacting to bullish August heat and the large specs pounding ng at 6am when they entered the day trading session, NG has collapsed lower in the last few minutes, likely hitting tons of SELL STOPS under last weeks lows and under MAJOR-MEGA support that goes back years.
https://tradingeconomics.com/commodity/natural-gas
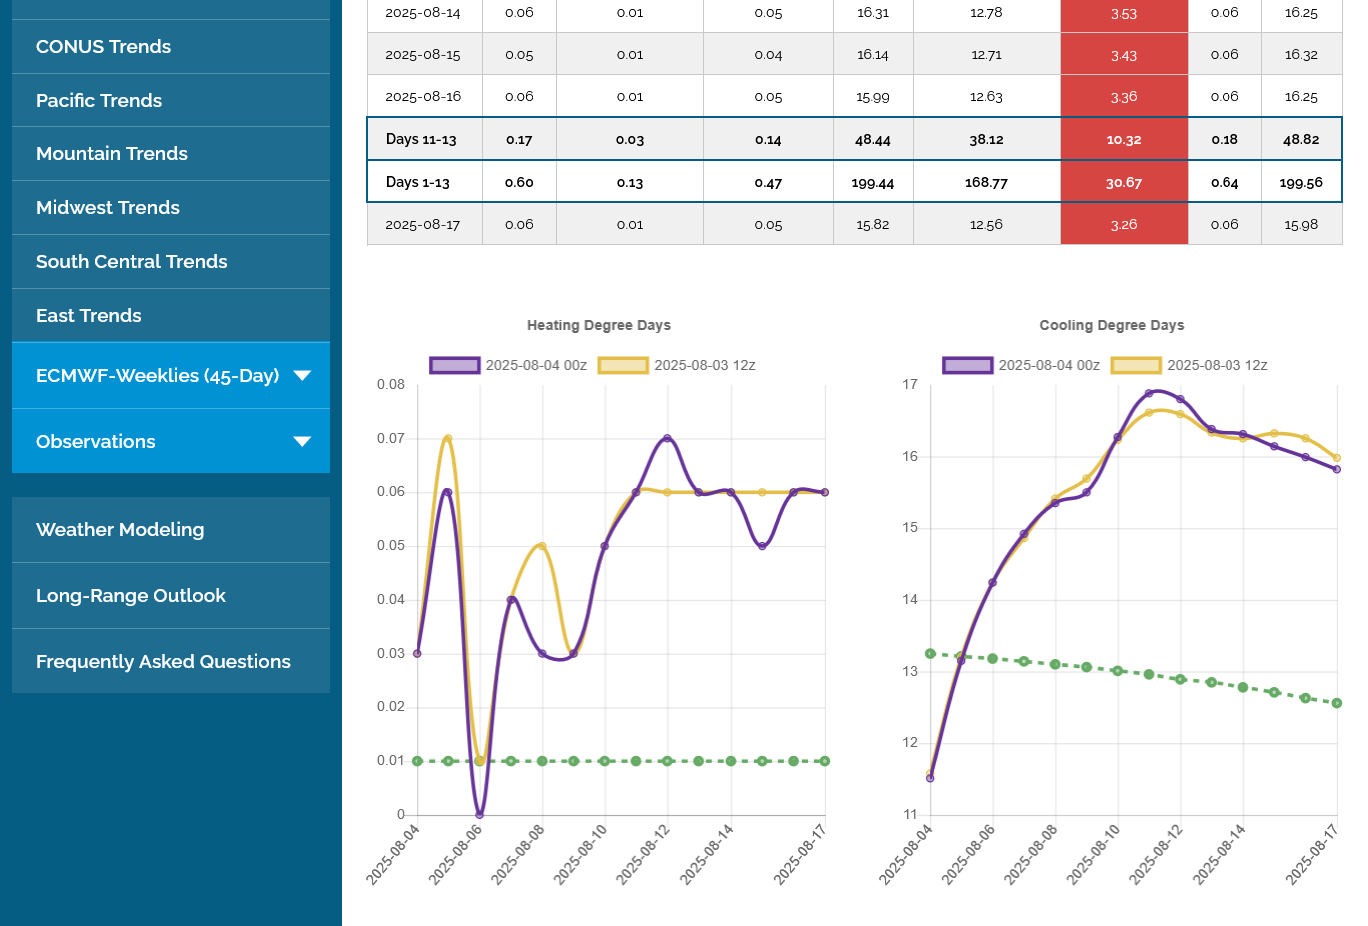
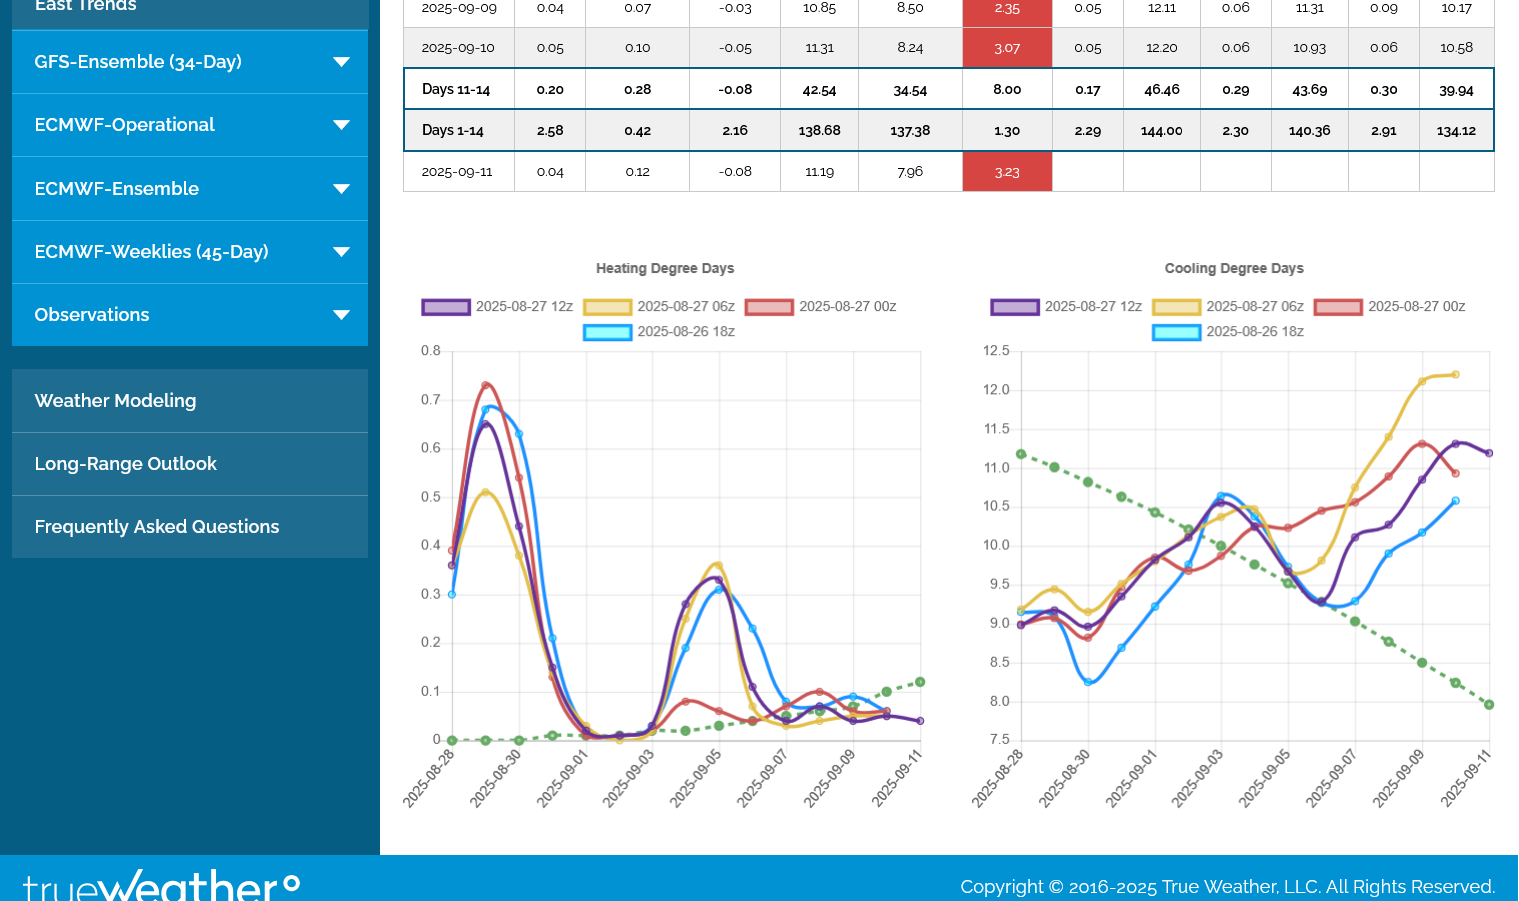
The 0z guidance was MUCH hotter.
The lows are likely in. EE +4 HDDS, GEFS +5 HDDS.
Yesterday may have been a washout and fake out. We will see if the new guidance confirms. We need to get back above $3!
This was the last 0z EE for CDDS in purple on the right. 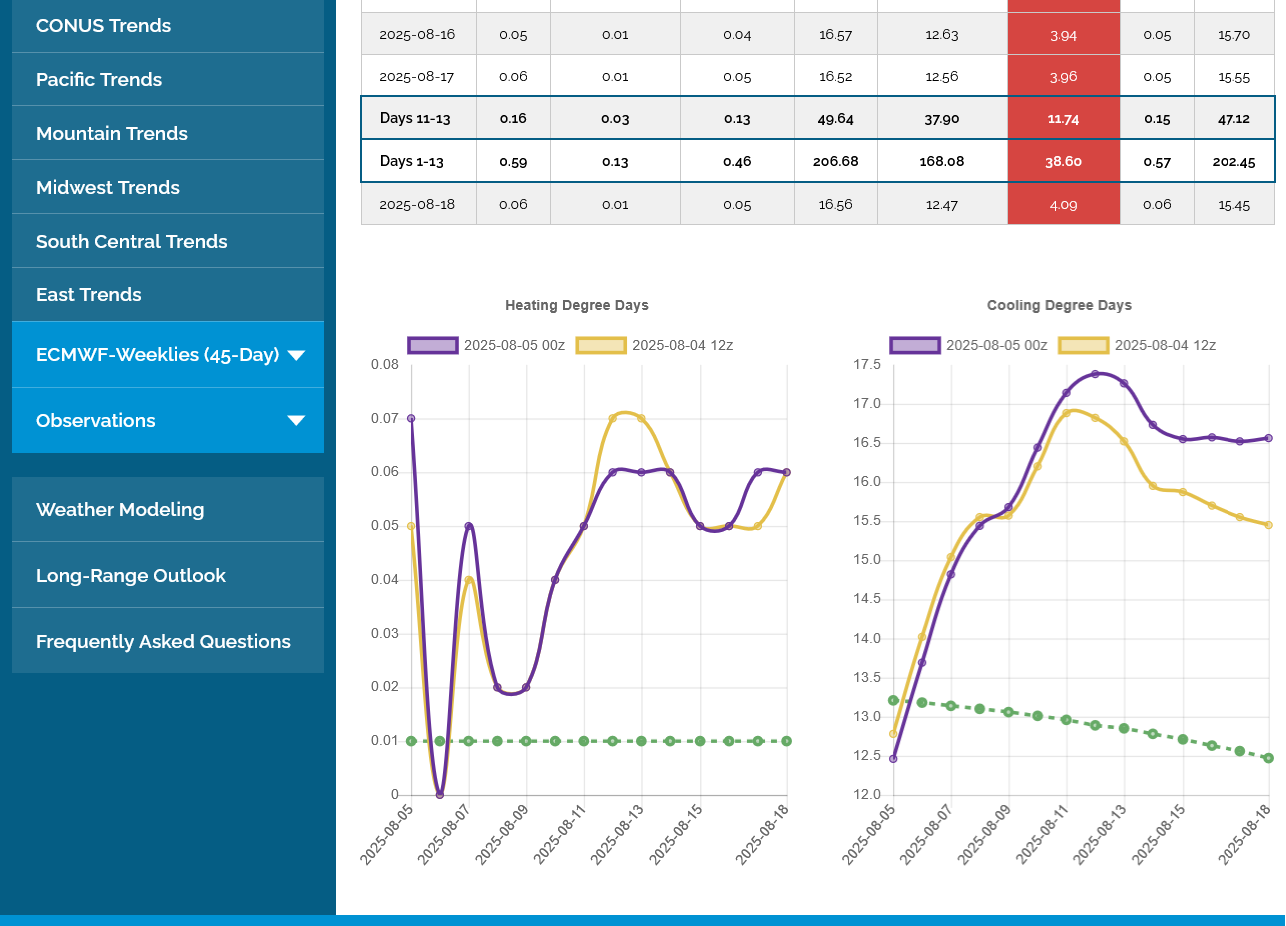
This last 6z GEFS was not quite as hot but is still hotter than previous guidance. We spiked above $3 briefly but couldn't hold. If the forecasts keep this added heat in, the lows are likely in. If not, then that was just a retest of huge broken support at $3 and now it's resistance?
The last 12z actually took out a bunch of the additional heat, so we closed a bit off the highs and right at $3.
Models continue cooler. Another -7HDDS on this last 0z GEGS!
Maybe the lows are not in because now temps are cooler than when we made the lows….but still HOTTER THAN AVERAGE.
Alot going on with this 1 week chart.
Starting from the left. We tested $3 after the bearish EIA last Thursday and it held.
We started Sunday Night on the weak side, then collapsed lower on Monday, well below $3 with a major downside break out thru long lived very strong $3 support.
Monday Night, the models turned MUCH HOTTER and we spiked back above $3, closing at that level on Tueday.
0Z models turned cooler over night and we went back below $3.
This last 06 GEFS was a bit hotter again and we spiked back up to test $3, which is not resistance.
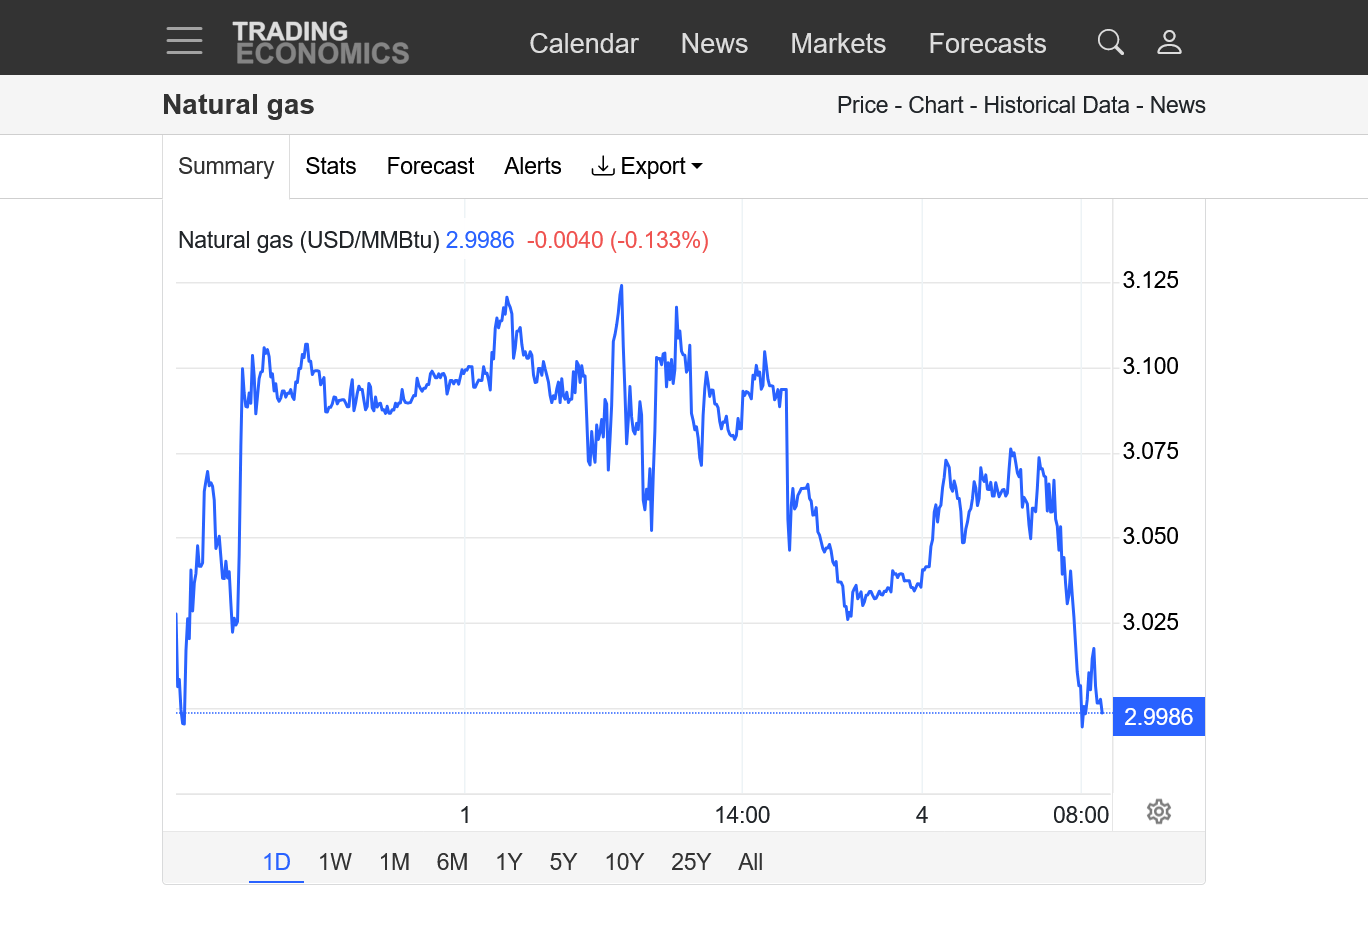
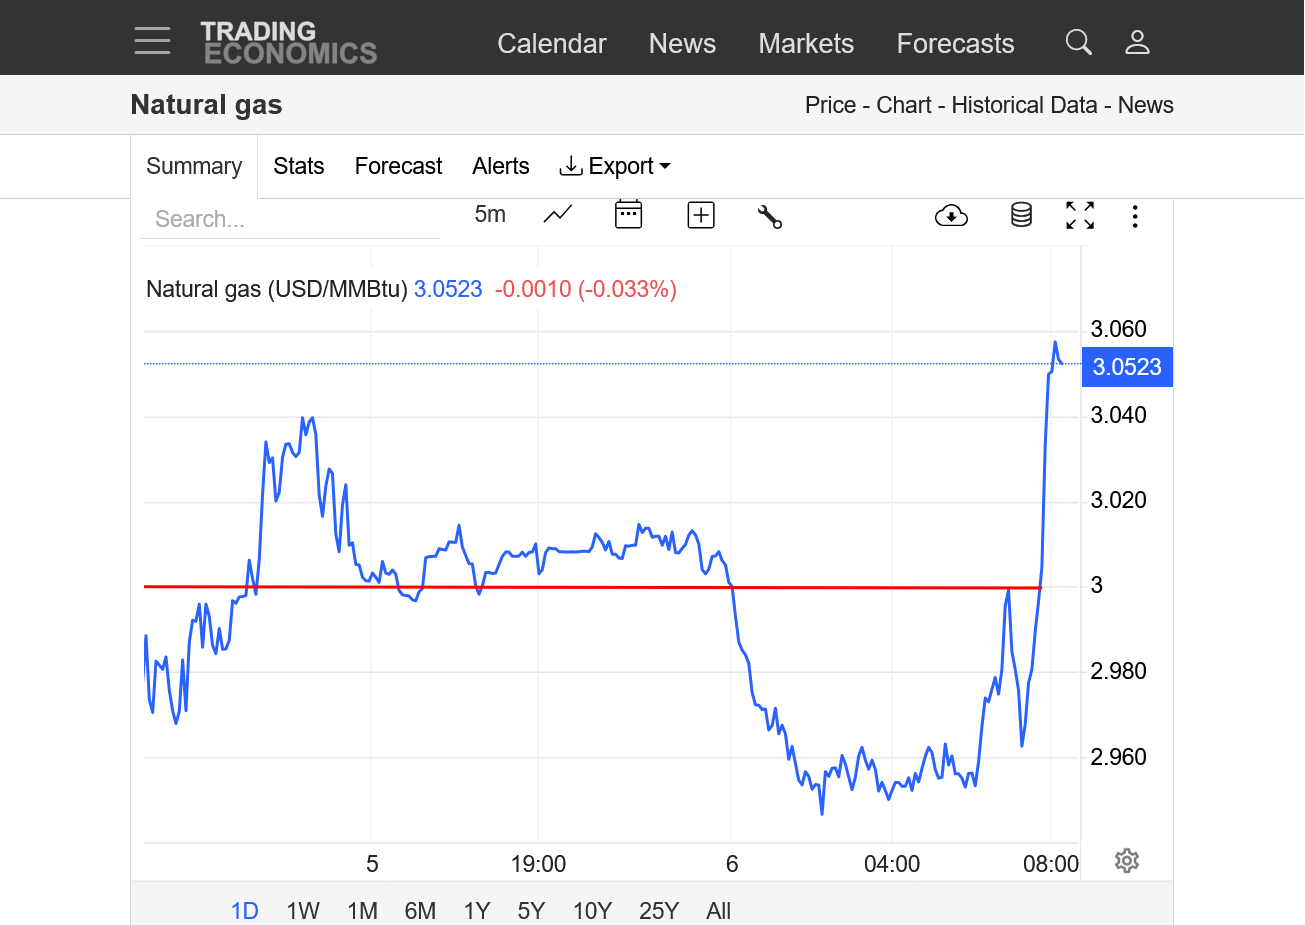
2. This is the chart for the past 24 hours. You can see the big plunge overnight from the much cooler 0z GEFS, then a retest of $3 just now from the hotter 6z GEFS. I'm leaning to the bullish side from the hotter weather coming up compared to average but the market seems to only want to trade above $3 when the forecast is even HOTTER than this.
A few minutes after that last post, we spiked MUCH higher. This makes more sense to me based on the hotter than average temps coming up!
The lows are in assessment from earlier this week is confirmed!
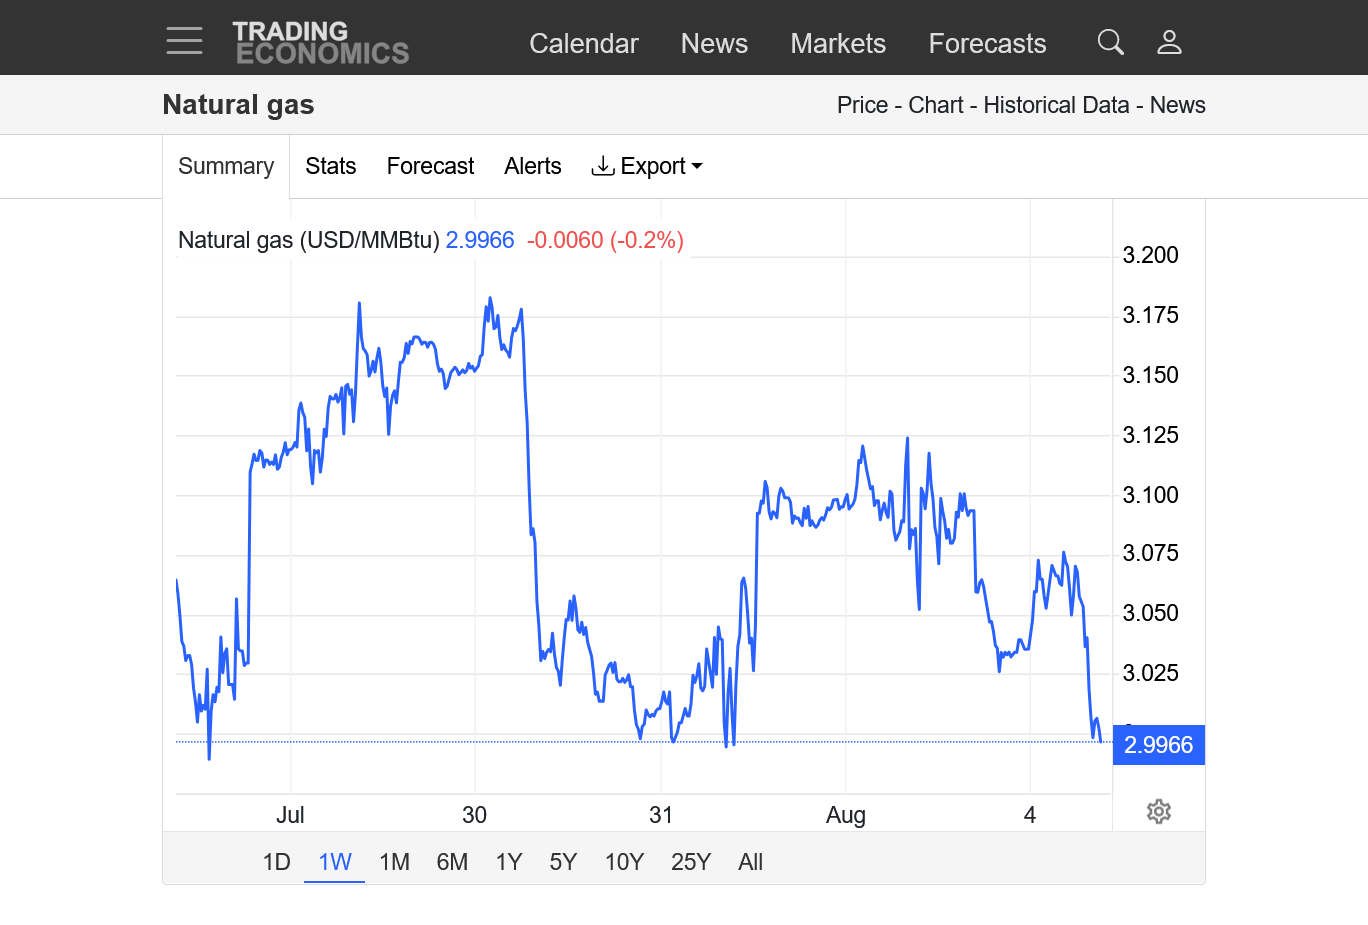
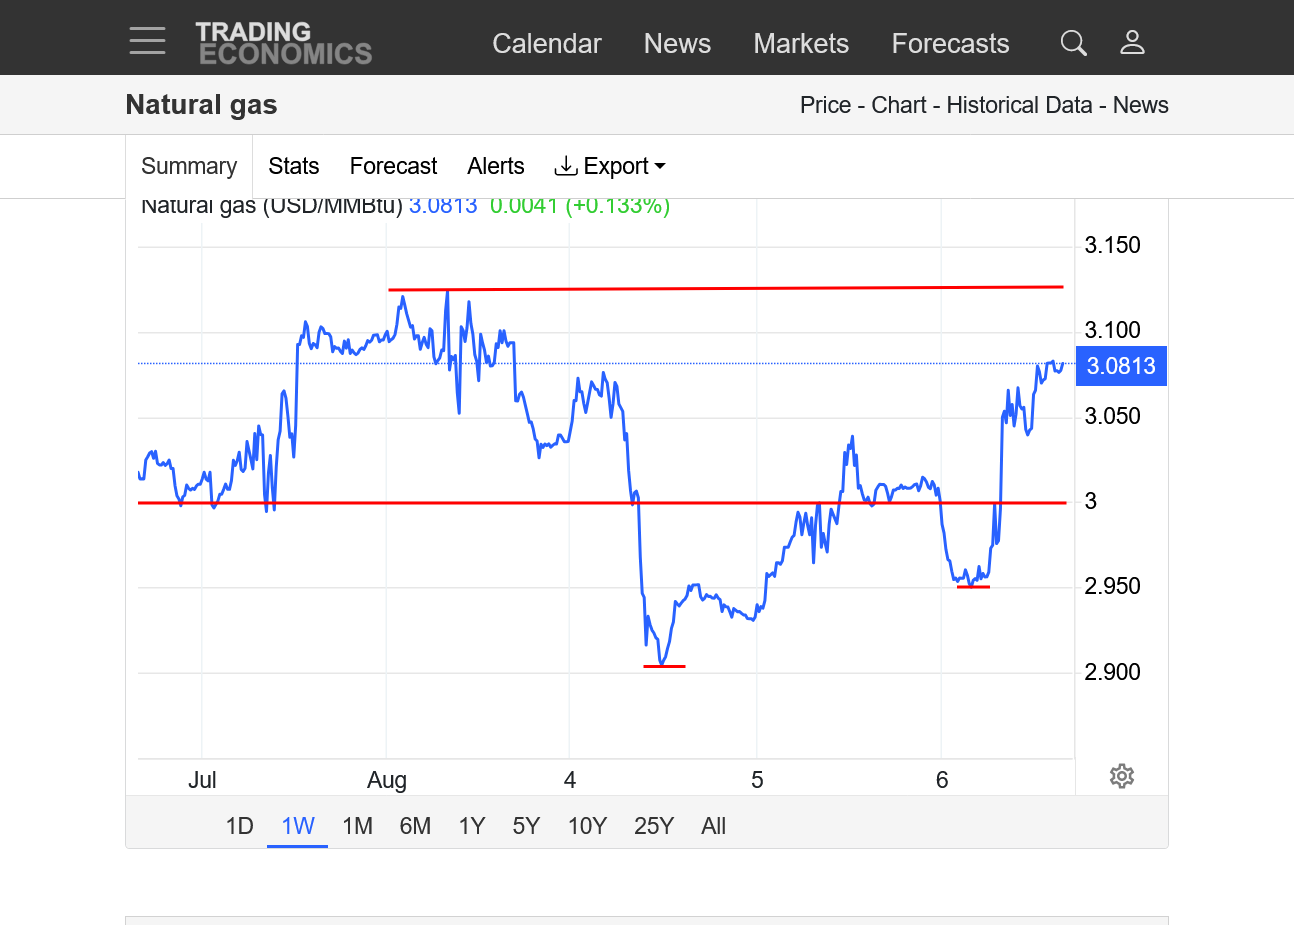
This is the 1 week chart.
1. Mondays spike low at the bottom and FAKE downside break out below $3. Despite a bullish/hot forecast.
2. Tuesdays big bounce back above $3 and close at $3.
3. Early Wednesday's 0z GEFS was less hot (and reversed with 6z guidance) and we tested the downside again at 2.95 but quickly recovered to well above $3 and now are at the highs from Sunday Evening. The upcoming, widespread heat for the rest of August looks very likely and is BULLISH!
4. Friday's highs are the top line.
https://tradingeconomics.com/commodity/natural-gas
Previous thread on this:
By metmike - Aug. 4, 2025, 1:27 a.m.
These were the temps for the next EIA, natural gas storage report released every Thursday at 9:30am CDT.
Very impressive positive anomalies(East/Southeast) considering it was just 1 week after the hottest week of the year SEASONALLY. Add in extremely high dew points in the many high populations centers and the next storage report should be VERY bullish compared to normal. The market knew this a couple of weeks ago when the price spiked higher, so the EIA number will be compared to market expectations.
https://www.cpc.ncep.noaa.gov/products/tanal/temp_analyses.php
++++++++++++++++++++++
Thursday's update:
Very bullish number(as expected). The South Central region had A DRAW DOWN of 17 Bcf!!!
![]()
for week ending August 1, 2025 | Released: August 7, 2025 at 10:30 a.m. | Next Release: August 14, 2025
| Working gas in underground storage, Lower 48 states Summary text CSV JSN | |||||||||||||||||||||||||
|---|---|---|---|---|---|---|---|---|---|---|---|---|---|---|---|---|---|---|---|---|---|---|---|---|---|
| Historical Comparisons | |||||||||||||||||||||||||
| Stocks billion cubic feet (Bcf) | Year ago (08/01/24) | 5-year average (2020-24) | |||||||||||||||||||||||
| Region | 08/01/25 | 07/25/25 | net change | implied flow | Bcf | % change | Bcf | % change | |||||||||||||||||
| East | 656 | 651 | 5 | 5 | 718 | -8.6 | 659 | -0.5 | |||||||||||||||||
| Midwest | 775 | 765 | 10 | 10 | 852 | -9.0 | 770 | 0.6 | |||||||||||||||||
| Mountain | 249 | 243 | 6 | 6 | 256 | -2.7 | 197 | 26.4 | |||||||||||||||||
| Pacific | 305 | 302 | 3 | 3 | 289 | 5.5 | 265 | 15.1 | |||||||||||||||||
| South Central | 1,145 | 1,162 | -17 | -17 | 1,153 | -0.7 | 1,066 | 7.4 | |||||||||||||||||
| Salt | 296 | 316 | -20 | -20 | 301 | -1.7 | 274 | 8.0 | |||||||||||||||||
| Nonsalt | 849 | 846 | 3 | 3 | 851 | -0.2 | 792 | 7.2 | |||||||||||||||||
| Total | 3,130 | 3,123 | 7 | 7 | 3,267 | -4.2 | 2,957 | 5.9 | |||||||||||||||||
| Totals may not equal sum of components because of independent rounding. | |||||||||||||||||||||||||
Working gas in storage was 3,130 Bcf as of Friday, August 1, 2025, according to EIA estimates. This represents a net increase of 7 Bcf from the previous week. Stocks were 137 Bcf less than last year at this time and 173 Bcf above the five-year average of 2,957 Bcf. At 3,130 Bcf, total working gas is within the five-year historical range.
For information on sampling error in this report, see Estimated Measures of Sampling Variability table below.

Note: The shaded area indicates the range between the historical minimum and maximum values for the weekly series from 2020 through 2024. The dashed vertical lines indicate current and year-ago weekly periods.
++++++++++++++++++++++
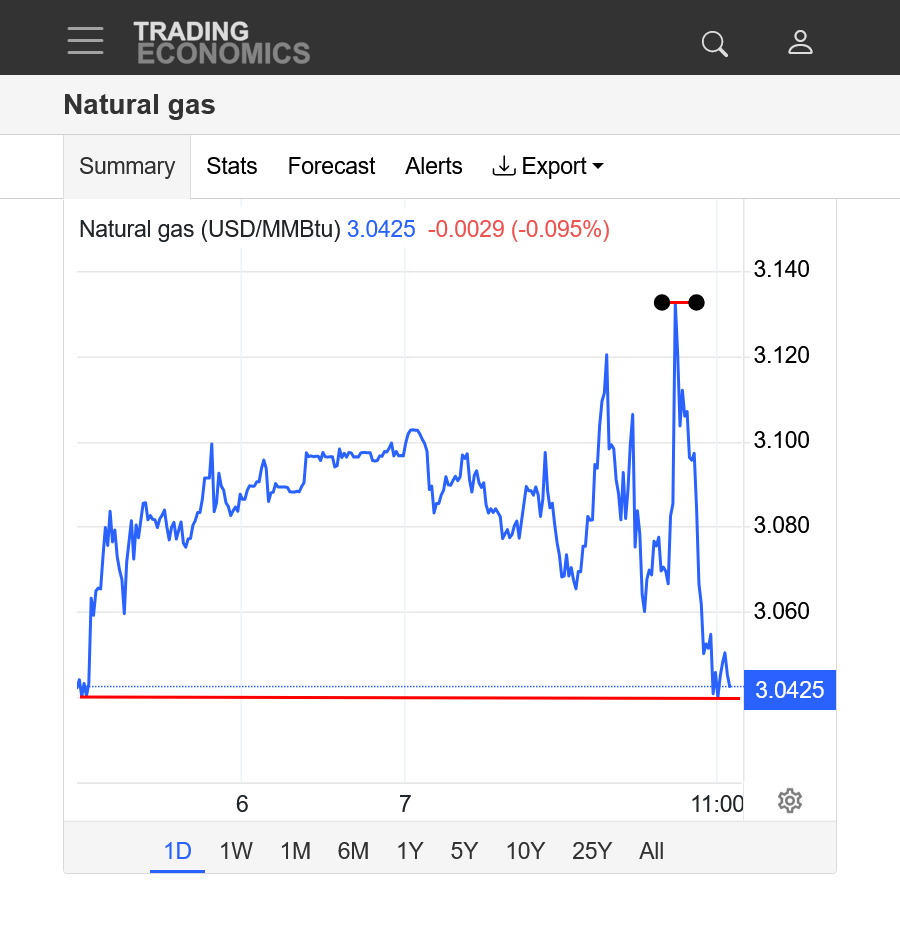
NG had an immediate spike higher on the release of the very bullish EIA report at 9:30 am.........and that resulted in heavy selling pressure since then the past 2 hours.
BUY THE RUMOR, SELL THE FACT!
https://tradingeconomics.com/commodity/natural-gas
1. 1 day-spike high from EIA report
2. 1 week- left bottom=lows on Monday, then the forecasts turned hotter Monday Night.
center bottom=lows Wednesday after GEF came out with an outlier cooler solution
top right=spike high from EIA report
top red line=highs from last Friday. We need to close above that to confirm the lows are in.
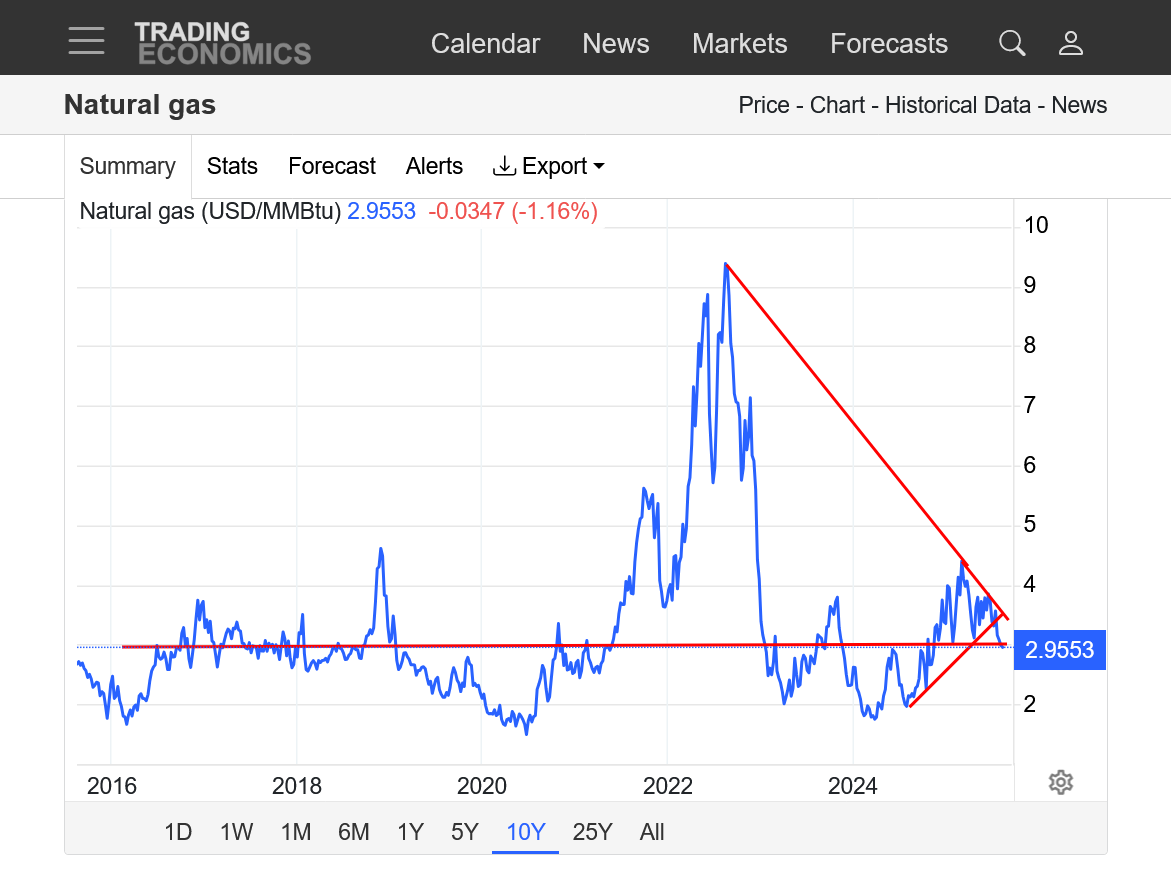
3. 1 year- $3 support held. Descending wedge.
4. 10 years-$3 support held. Descending wedge? Or a longer term symmetrical wedge?(higher lower-lower highs)
Take it with a grain of salt. Very cold weather coming up to start the heating season according to this guy.
The last overnight EE model was -4CDDs to the bearish side.
This last 12z GEFS was a whopping -6 CDDs. Prices have been under pressure overnight and today from the more bearish temps in the updated forecasts.
However, they are still fairly hot compared to average so NG is not acting well. Only when the heat increases does it go higher with a downside bias this week. Prices are closing lower this week and just under the SUPER DUPER significant $3 level,
Price action the last 2 days……since the reversal up earlier this week has negated most of the impact of the bottoming formation. At the very least we should expected a close today above $3 support.
However, its natural gas and we have 2 days for the often fickle weather models to change a lot and make anything I’m stating now worthless!
MUCH cooler temps!
Huge gap lower, more to come when back on the computer.
I just started working on a project converting 400 hours of our home videos, starting in 1985 to hard drive and it's very time consuming.
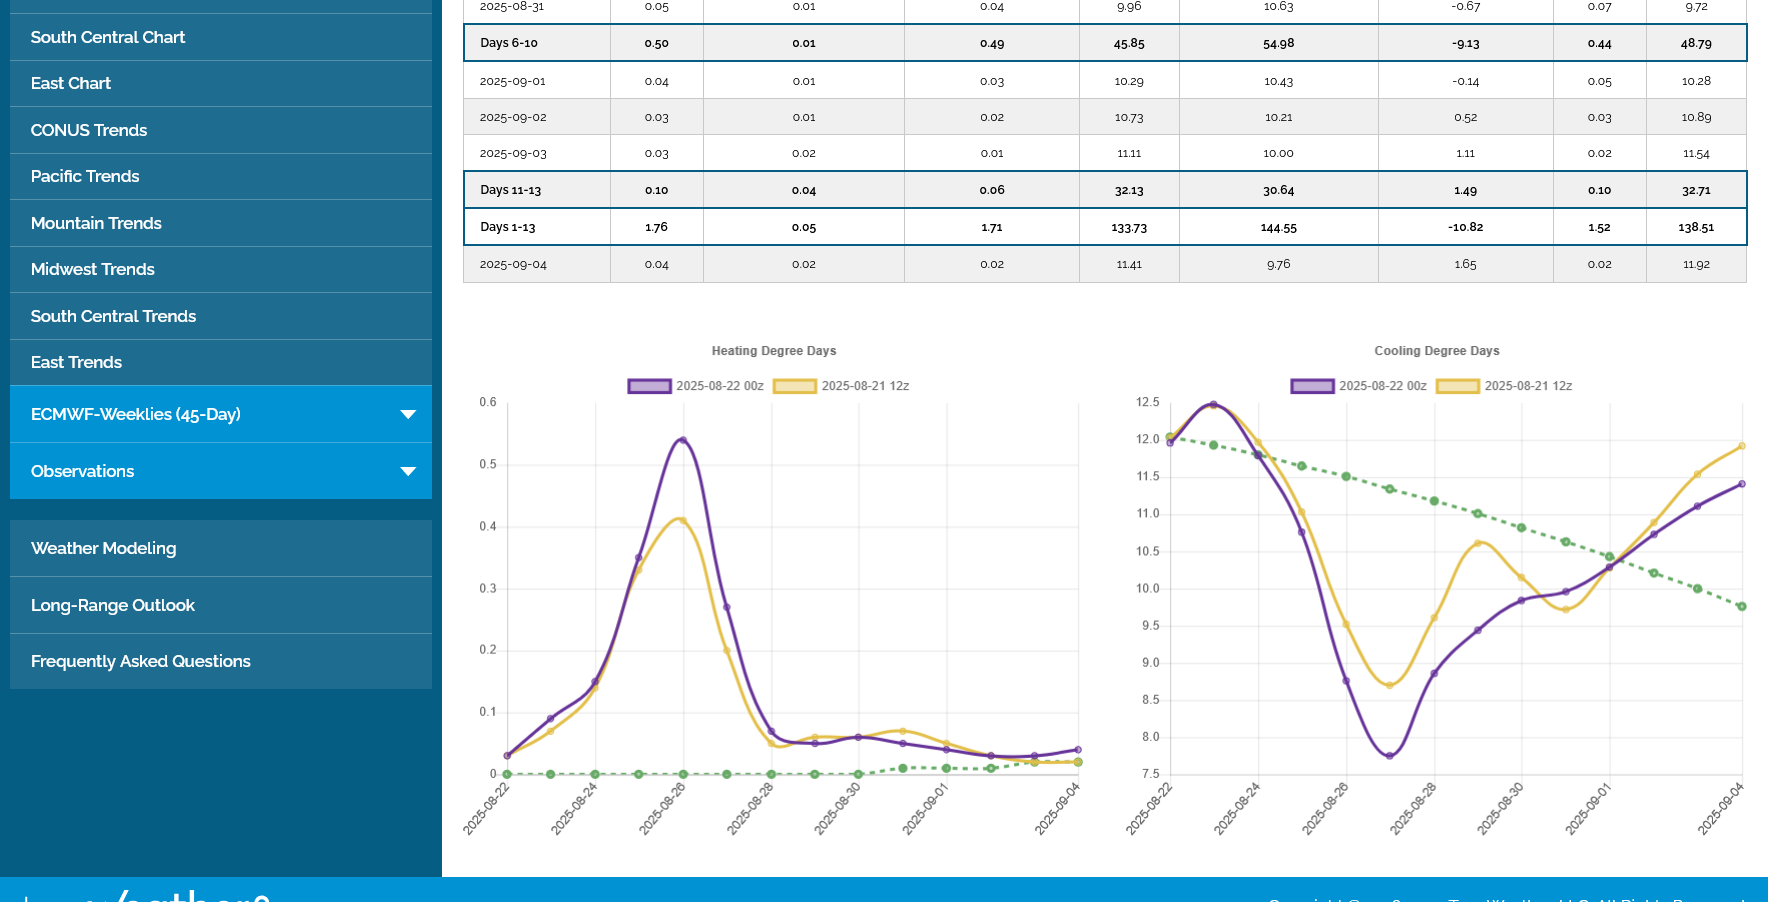
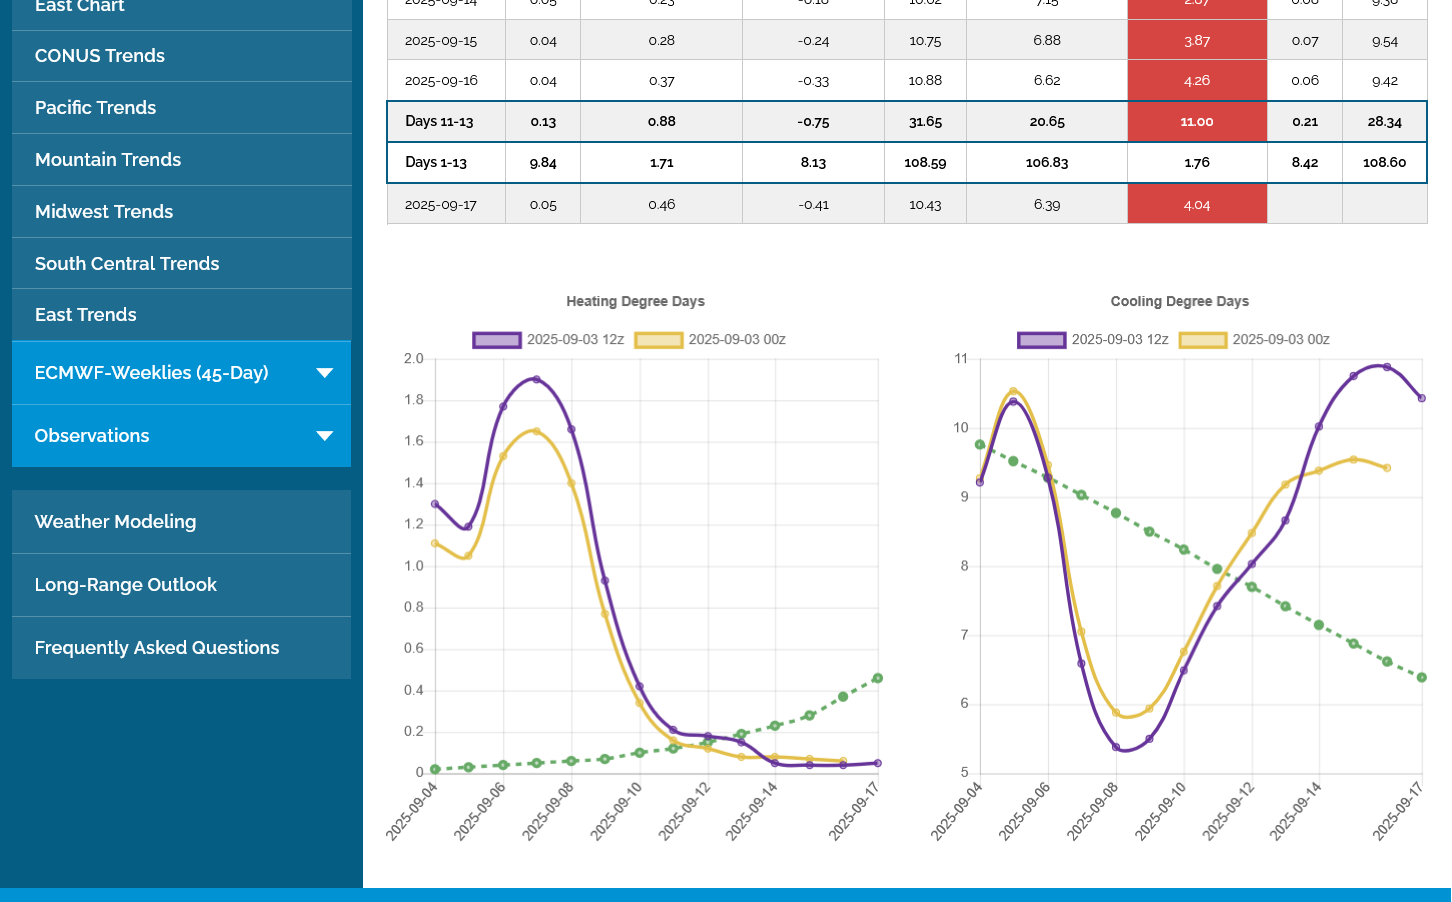
The last 12z European Ensemble model, in purple/right was an incredible -10 CDDs compared to the previous 0z run.
We've been trading a HOT August for weeks and now temps plunge close to average in week 2 on this latest run.
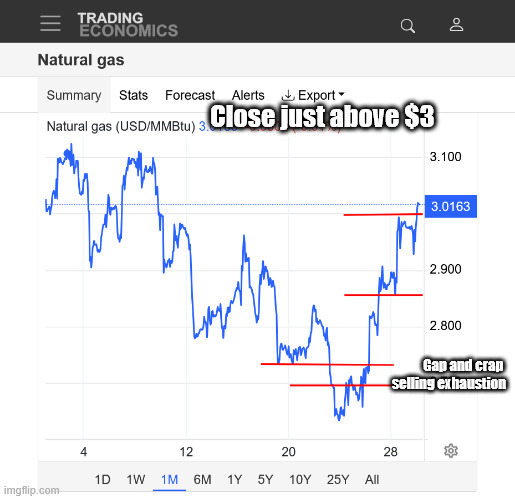
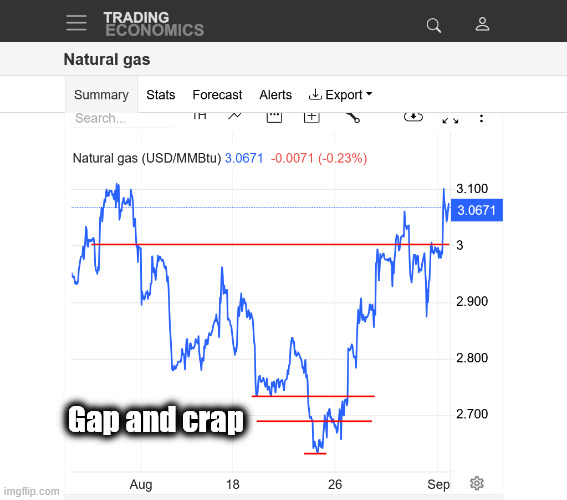
We added back +4 CDDs on the last 0z EE which helped us to climb back to unch, fill the gap lower and put in a gap and crap signature on the charts, which is a selling exhaustion. Regardless, there is still much less heat today than last week in this forecast, so I'm NOT bullish from weather.
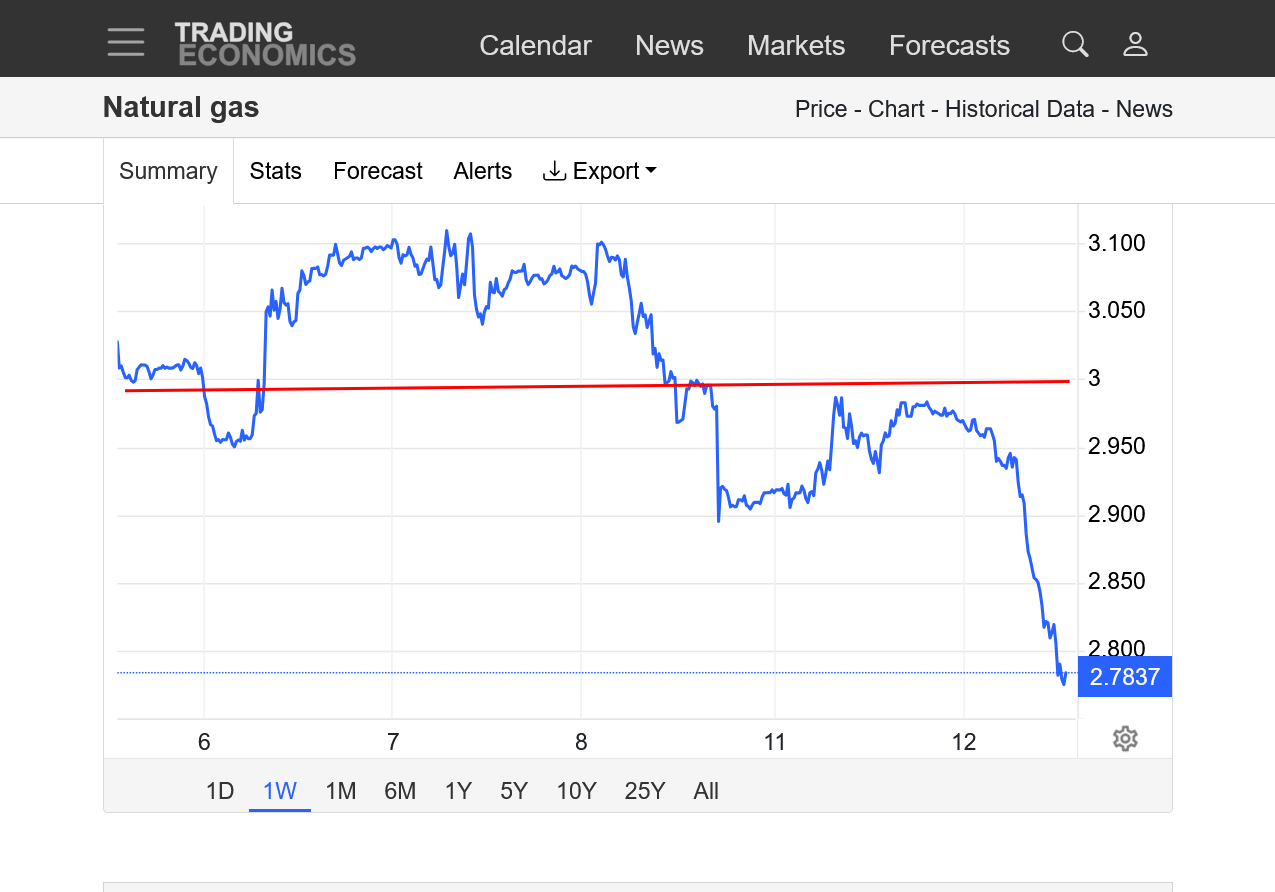
$3, which was extremely strong support before this time frame is now strong resistance. It seems unlikely that we will continue to sell off, however if Trumps policies start tanking the economy, then the loss of industrial demand for ng could add an additional negative and cause ng prices to go lower at a time of year when they usually go up(ahead of Winter).
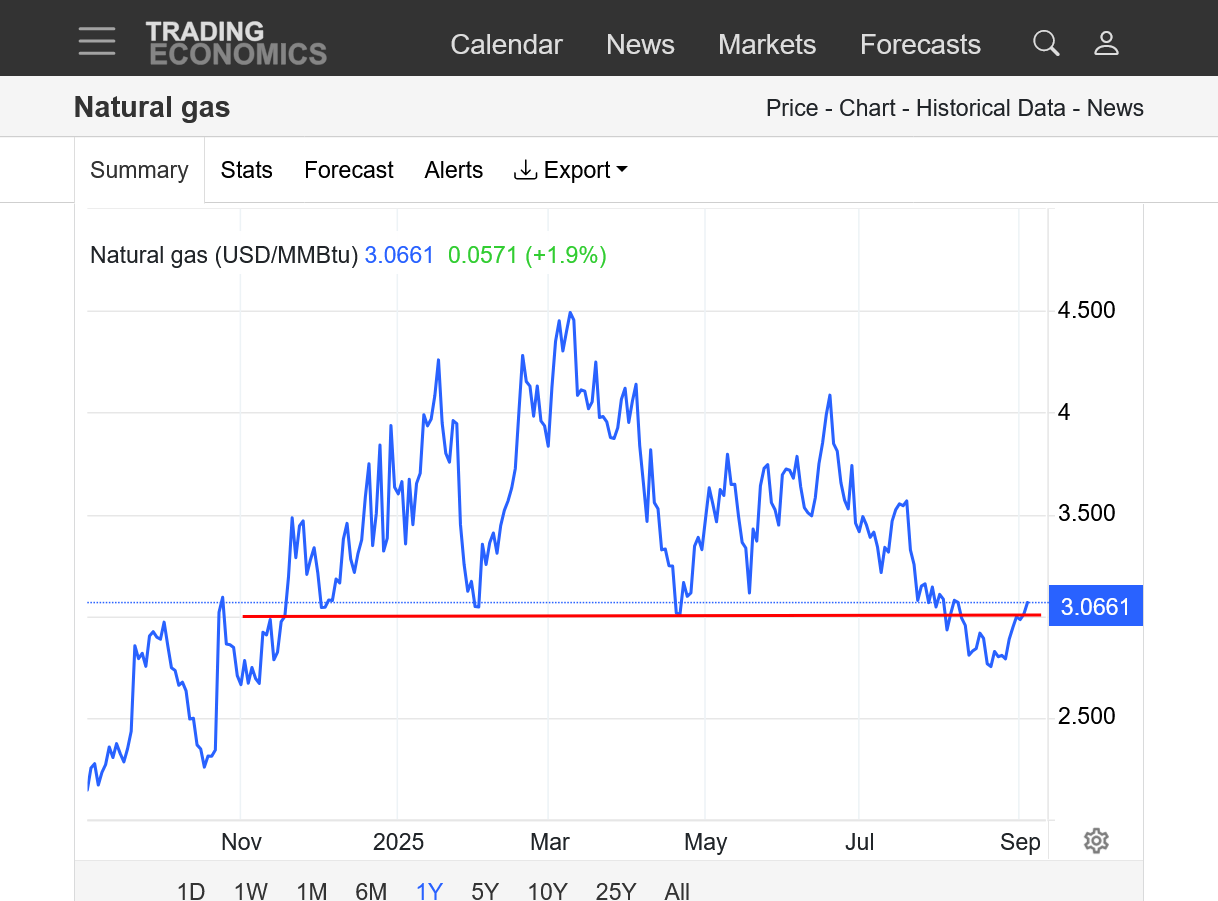
https://tradingeconomics.com/commodity/natural-gas
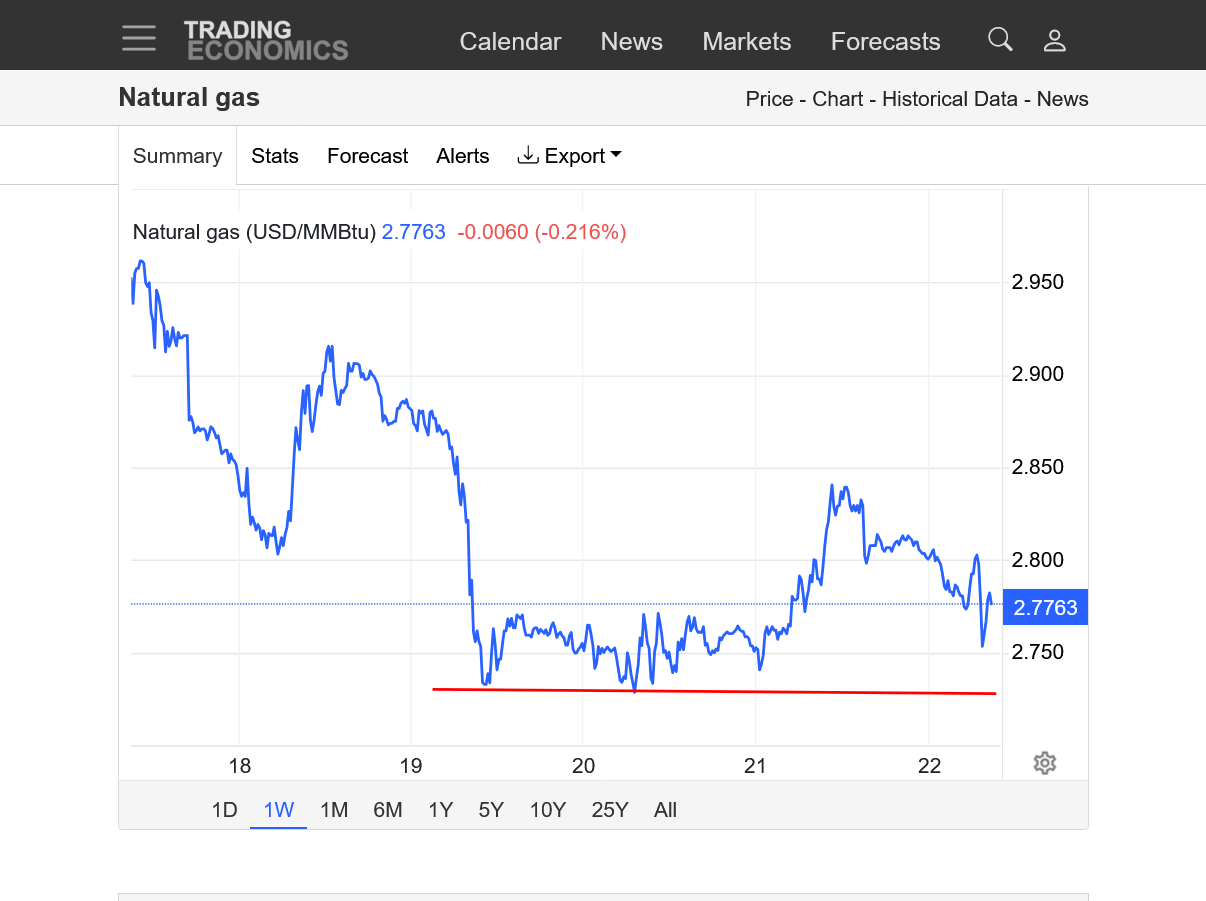
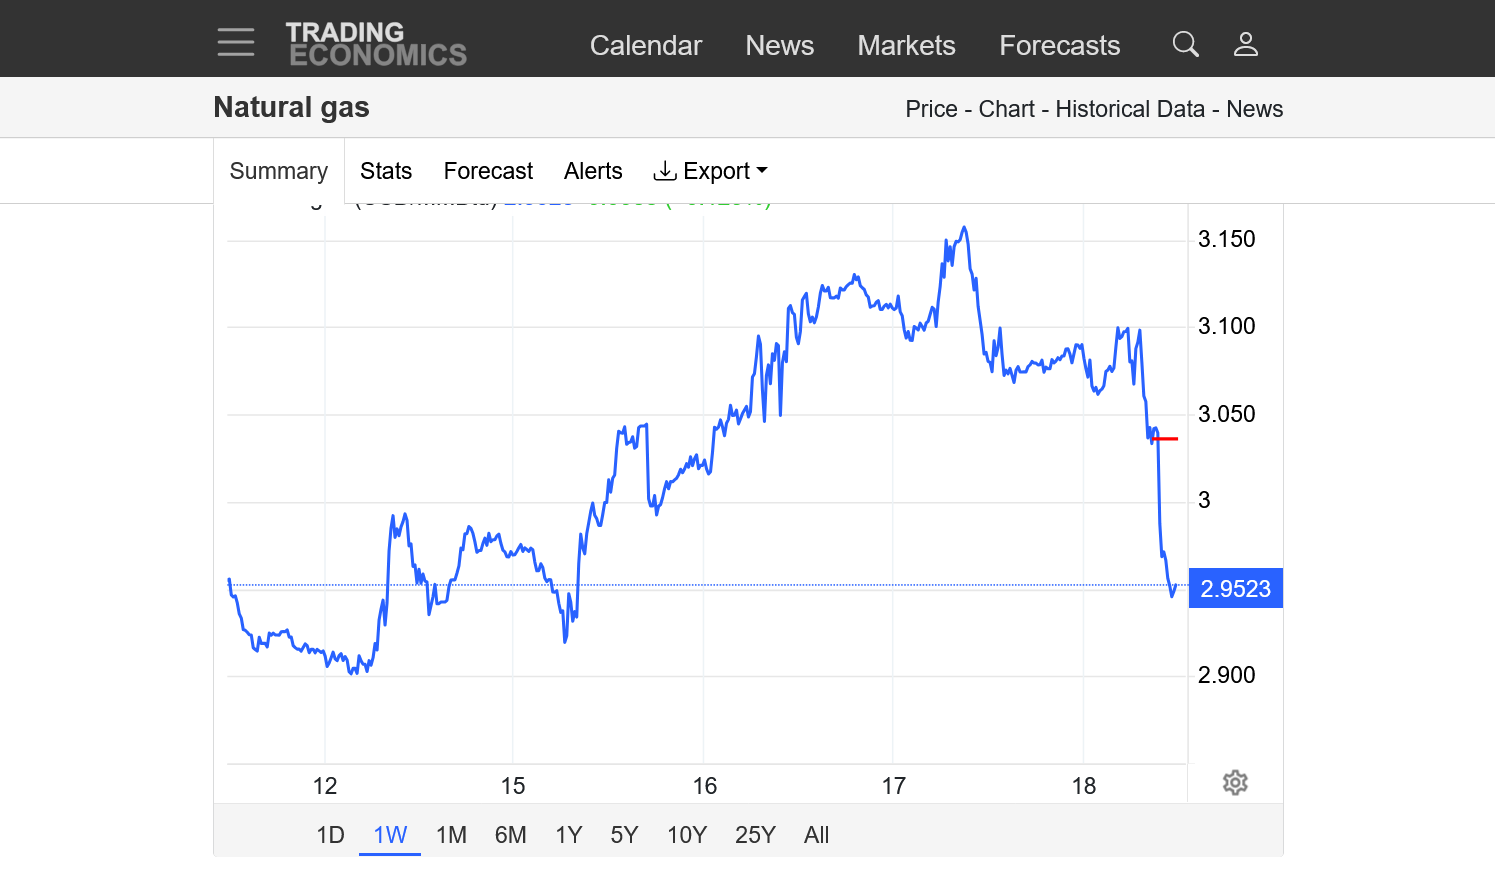
1. 1 day: 2.9 low was just after the open and bottom of the gap lower. Top red line was the top of the gap which got filled but no follow thru with $3 holding, now we'r'e back into the gap.
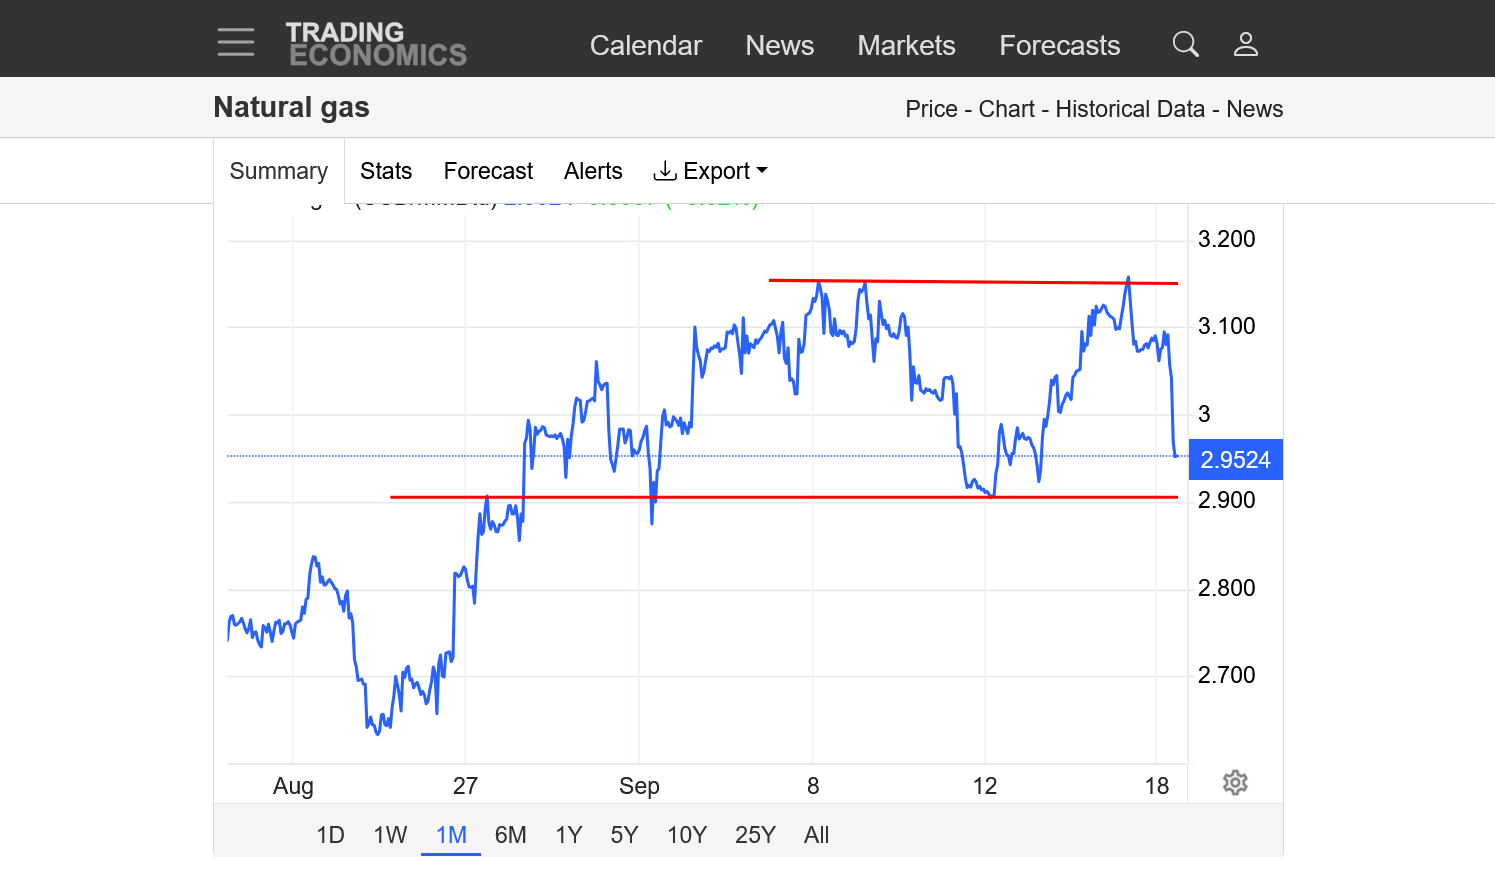
2. 1 month: Double bottom around 2.9 or just a retest of $3 this morning? Clearly a down trending channel.
3. 1 year: Downside break out below $3 and below the descending triangle formation this Summer.
4. 10 years: Downside break out below a symmetrical triangle which is the interpretation until we at least close solidly above $3 again.
5. Price charts can be extremely useful for predicting where markets are going but they only tell us what those markets did. They can't predict news. They CAN predict weather because they often react in tune with the latest weather forecasts. However, they are just as fickle as the changes in the weather forecasts.
The last 12z EE model was a bit cooler and continues the trend of much cooler compared to previous forecasts for August.
Another -6 CDDs on the last 0z EE so natural gas sold off overnight. We're down at the lows.
https://tradingeconomics.com/commodity/natural-gas
1. 1 week
NG crashing lower!!! -$1,700/contract. The last 12z model runs were even cooler compared to the previous guidance.
1 week below.
https://tradingeconomics.com/commodity/natural-gas
The last oz EE was +6 CDDs, though the last GEFS was the same as its previous run. We tried to rally earlier but have struggled so far tonight.
The changes were for INDIVIDUAL DAYS with the same pattern and DOWNWARD trajectory compared to the previous 12z run.
Temps for tomorrow's EIA at 9:30 am. Much cooler 7 day temps last week vs the previous report!
https://www.cpc.ncep.noaa.gov/products/tanal/temp_analyses.php
This was the previous 7 days that went into last weeks BULLISH +7 Bcf injection.
Re: Re: Re: Re: Re: Re: NG 8/4/25+
By metmike - Aug. 7, 2025, 12:24 p.m.

7am: This last 6z GEFS (purple/right) was COOLER in week 2 than the previous runs.

The last 12z European Ensemble model(purple-right) was a whopping +8 CDDs vs the previous 0z run from 12 hours earlier. NG spiked to the highs but settled back a bit with ZERO follow thru. The bears are in solid control here with the major downside break out below key support of $3 looking ominous technically. I'm surprised at the bearishness/weakness. Could be a slowing economy will be cutting industrial demand? The EIA tomorrow with a much bigger injection expected could be a factor too.
https://tradingeconomics.com/commodity/natural-gas
1. 1 week- Plunging lower, downside break out. Double bottom today??
2. 1 month-solid downtrend. -$7,000/contract
3. 1 year-downside break out below $3! Lowest price of 2025
4. 10 years-downside break out below $3! Break out below symmetrical triangle(lower highs/higher lows but we just made a NEW LOWER low).
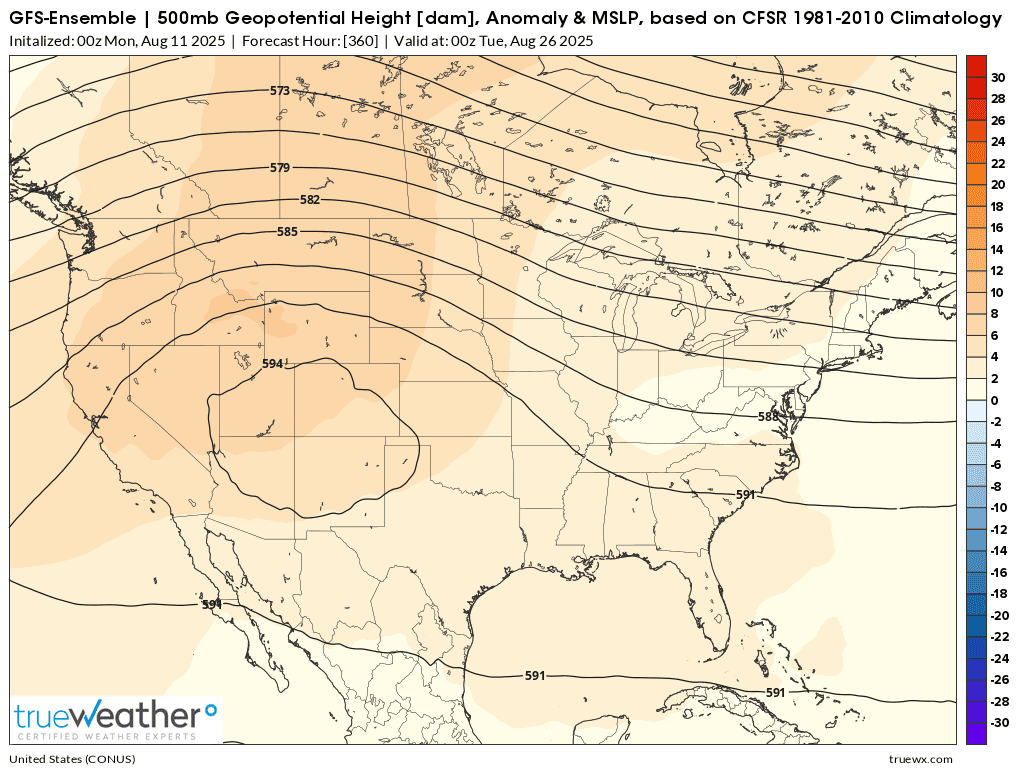
The last 12z run of the EE is suggesting a huge potential pattern change at the end of week 2, which is why it added so many CDDs in week 2.
The upper level ridge, instead of maintaining the center in the Rockies to the Plains as predicted the past several days shifts the heat ridge MUCH farther east.
1. 500mb solution for 2 weeks from early Monday
2. Last 500 mb solution for 2 weeks
3. However, the last 500 mb solution from the GEFS has NOT changed.
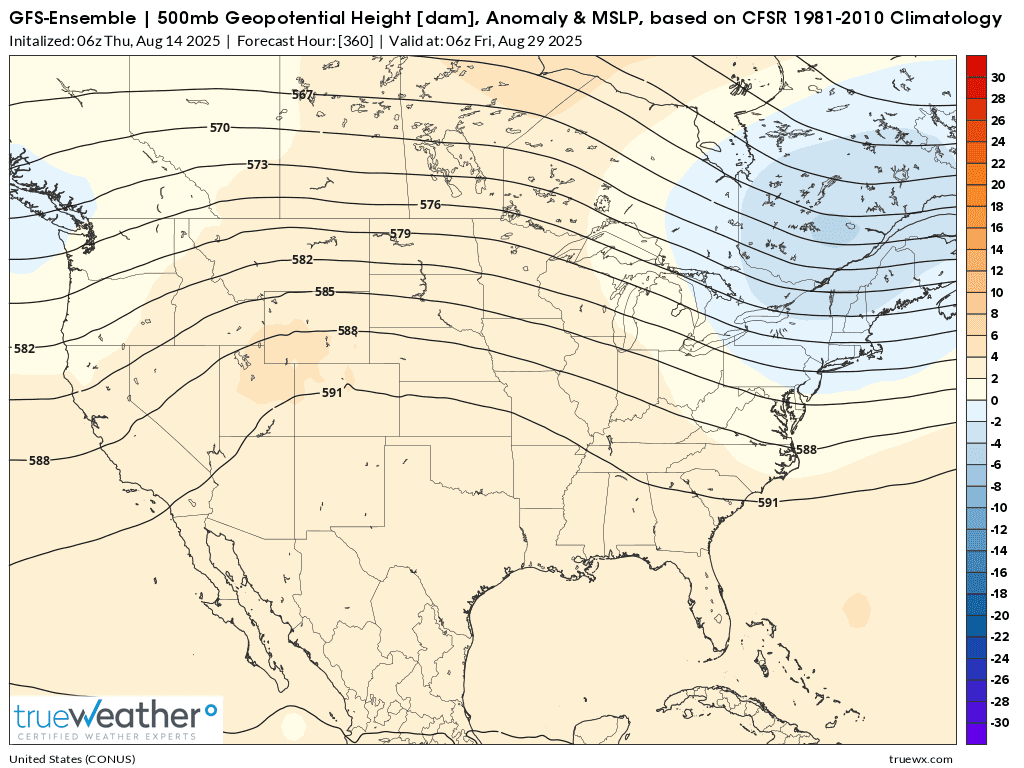
These 2 models are mind boggling different at the end of 2 weeks. The GEFS has TROUGHING in the Southeast, while the last EE model builds a strong Bermuda Ridge there, with the upper level troughing in southeast Canada.
The last 0z EE was another -6 CDDs(purple/right), so nat gas has been under a bit of pressure since that came out.
+56 Bcf! The market was near the highs but spiked down ~$400/contract immediately after the release.
![]()
for week ending August 8, 2025 | Released: August 14, 2025 at 10:30 a.m. | Next Release: August 21, 2025
| Working gas in underground storage, Lower 48 states Summary text CSV JSN | |||||||||||||||||||||||||
|---|---|---|---|---|---|---|---|---|---|---|---|---|---|---|---|---|---|---|---|---|---|---|---|---|---|
| Historical Comparisons | |||||||||||||||||||||||||
| Stocks billion cubic feet (Bcf) | Year ago (08/08/24) | 5-year average (2020-24) | |||||||||||||||||||||||
| Region | 08/08/25 | 08/01/25 | net change | implied flow | Bcf | % change | Bcf | % change | |||||||||||||||||
| East | 677 | 656 | 21 | 21 | 722 | -6.2 | 674 | 0.4 | |||||||||||||||||
| Midwest | 796 | 775 | 21 | 21 | 867 | -8.2 | 790 | 0.8 | |||||||||||||||||
| Mountain | 253 | 249 | 4 | 4 | 260 | -2.7 | 200 | 26.5 | |||||||||||||||||
| Pacific | 305 | 305 | 0 | 0 | 287 | 6.3 | 266 | 14.7 | |||||||||||||||||
| South Central | 1,154 | 1,145 | 9 | 9 | 1,129 | 2.2 | 1,060 | 8.9 | |||||||||||||||||
| Salt | 295 | 296 | -1 | -1 | 288 | 2.4 | 268 | 10.1 | |||||||||||||||||
| Nonsalt | 859 | 849 | 10 | 10 | 841 | 2.1 | 792 | 8.5 | |||||||||||||||||
| Total | 3,186 | 3,130 | 56 | 56 | 3,265 | -2.4 | 2,990 | 6.6 | |||||||||||||||||
| Totals may not equal sum of components because of independent rounding. | |||||||||||||||||||||||||
Working gas in storage was 3,186 Bcf as of Friday, August 8, 2025, according to EIA estimates. This represents a net increase of 56 Bcf from the previous week. Stocks were 79 Bcf less than last year at this time and 196 Bcf above the five-year average of 2,990 Bcf. At 3,186 Bcf, total working gas is within the five-year historical range.
For information on sampling error in this report, see Estimated Measures of Sampling Variability table below.
Note: The shaded area indicates the range between the historical minimum and maximum values for the weekly series from 2020 through 2024. The dashed vertical lines indicate current and year-ago weekly periods
++++++++++++++++++++
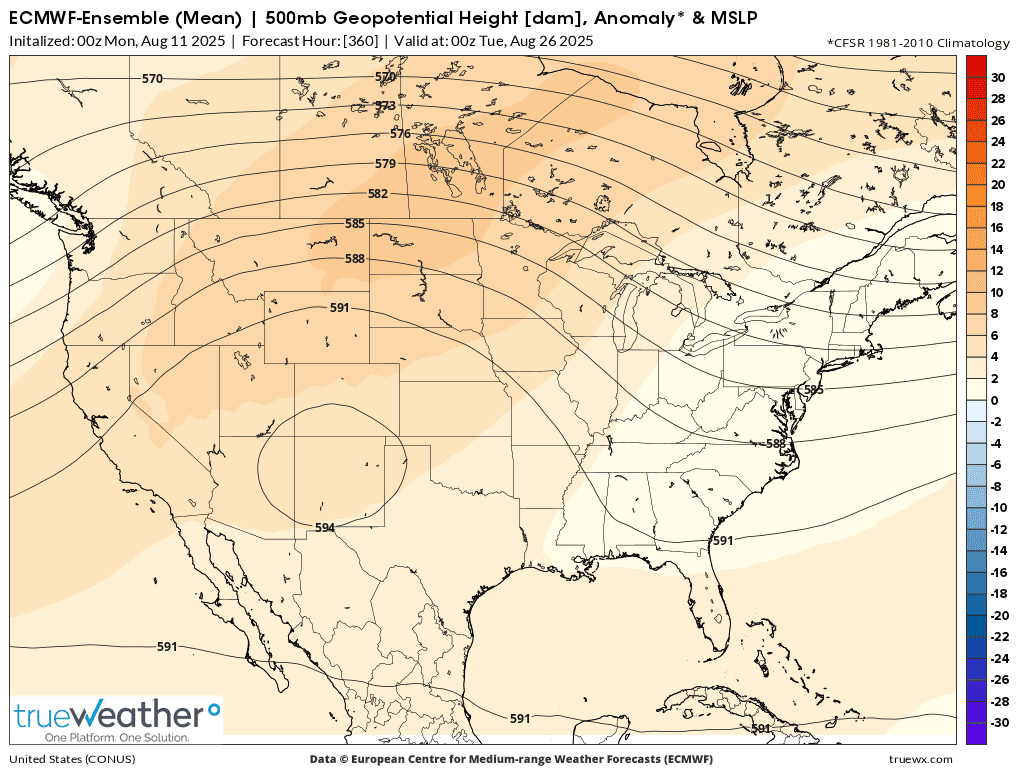
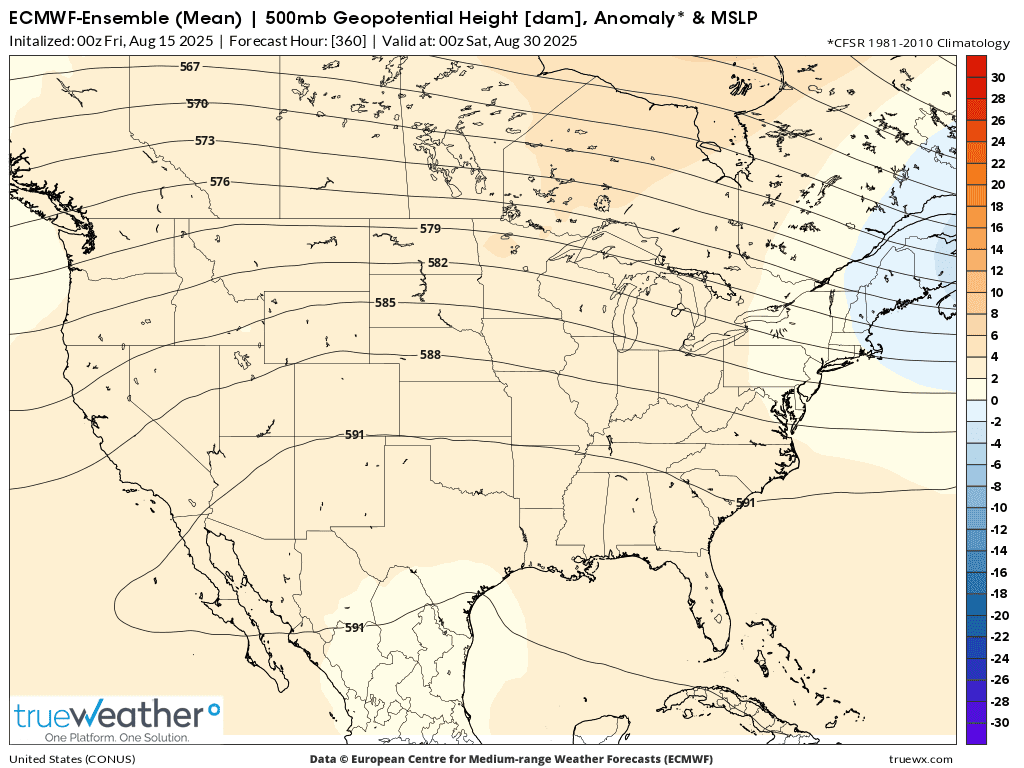
The upper level ridge shifting to the east and being strong in the south on the latest EE runs, introduces much more potential heat for late August in the high population centers. Late week 2 and week 3 carry an even higher than usual amount of uncertainty right now.
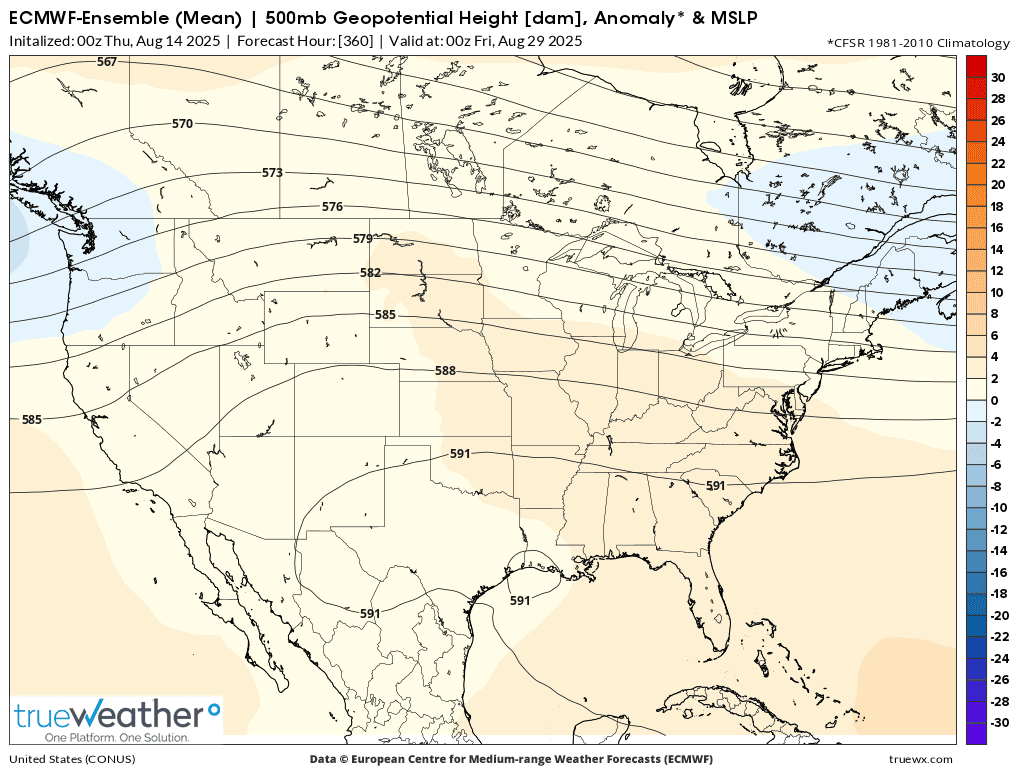
This was 360 hours on the last 0z European Ensemble model.
This was the last 6z GEFS for the same time. HUGE difference for the location of the heat ridge! Heat in the Rockies and Plains where not as many people live and use air conditioners for cooling that require electricity, much of which is generated by burning natural gas.
The last 6z GEFS came out hotter and as is very typical when the big traders enter the market around 6am(with their trading algorithms) , the market had its most significant move.
1. The last run was in purple on the right. Note the steep UPward trajectory at the end of 2 weeks for the last 4 runs, strongly suggesting increasing heat in week 3. The market IS trading the weather that far out as that is the least known and least dialed into the price and the MOST new information is gushing in for that period.
2. 1 week chart: Major spike low/triple bottom after the bearish EIA report. Spike down, then reversal at 6am this morning(warmer 6z GEFS). $3 RESISTANCE above.
3. 1 year chart: Downtrend this Summer with downside breakout below MAJOR support at $3. However this could be a FAKE (technical) downside break out that was nothing more than a market response to COOLING temperatures. Now that temperatures are heating up again, we could get some bullish traction.
4. Last 500 mb map on the 0z European Ensemble model. Continues to BUILD the upper level ridge much farther east than earlier this week. So more heat in the south and east, where more people live vs the Rockies and Plains, where less people live compared to the heat ridge much farther west. Still some lingering upper level troughing in the Northeast and uncertainty at this time frame. However, the longer range(week 3+) forecasts all suggest the heat pouring in during September which may be bullish enough for us to trade back above $3(previous support, now resistance).
The last 12z GEFS was a whopping -12 CDDs compared to the previous 6z run and has cooling not heating up at the end of 2 weeks.
This seems very reasonable, considering the heat ridge building strongly across the south late in week 2.
Last European Ensemble mean forecast had cooled off -6 CDDs(purple/right) with the latest models not quite as hot to start off week 3.
The models have been blindsided by the northern stream this month. The current heat was supposed to define the entire month.
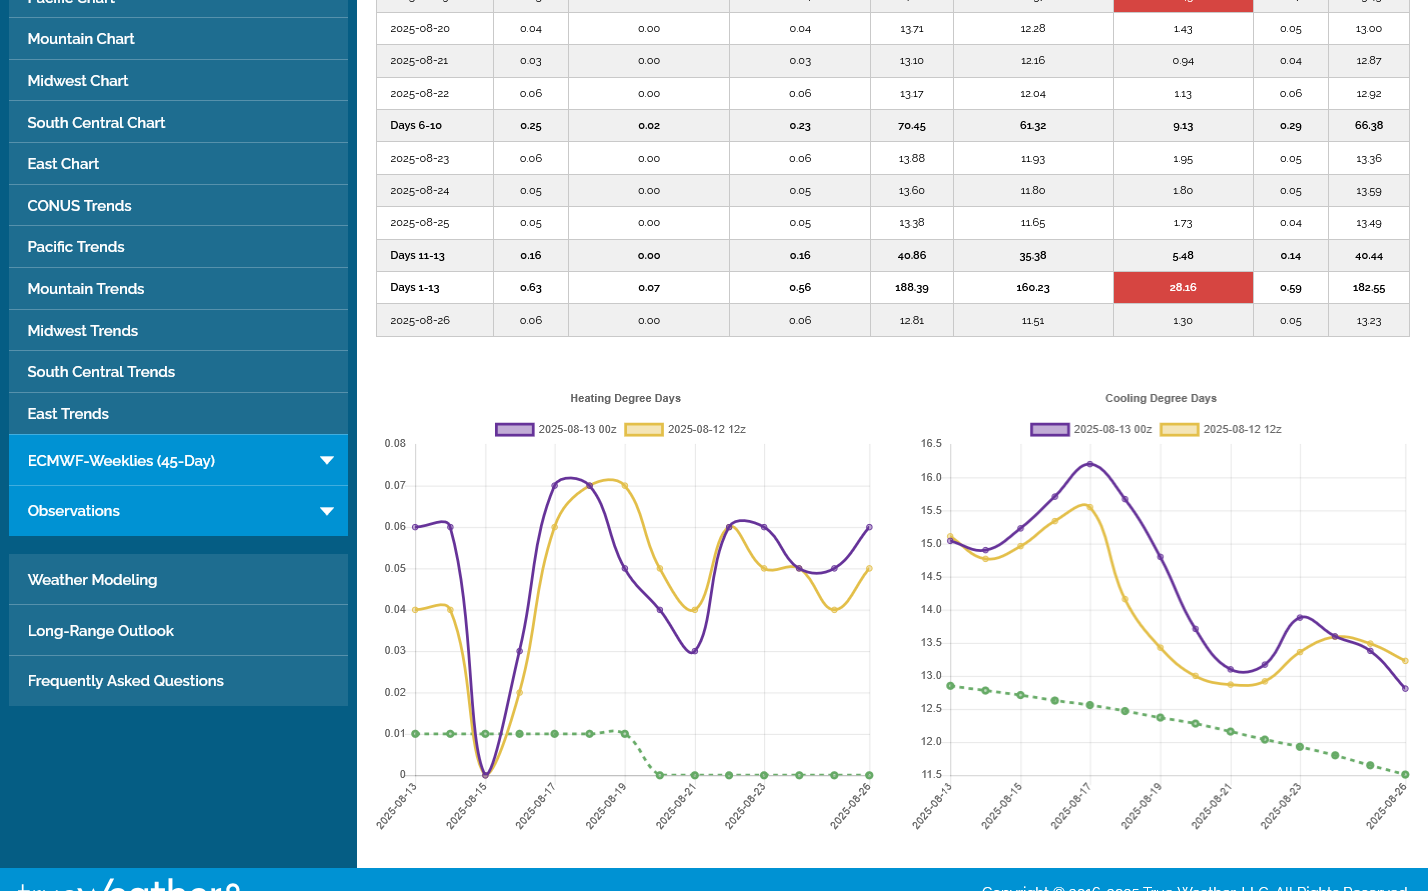
1. These were the CDDs for the next 2 weeks from 9 days ago. This pattern was expected to continue:
By metmike - Aug. 8, 2025, 12:14 p.m.
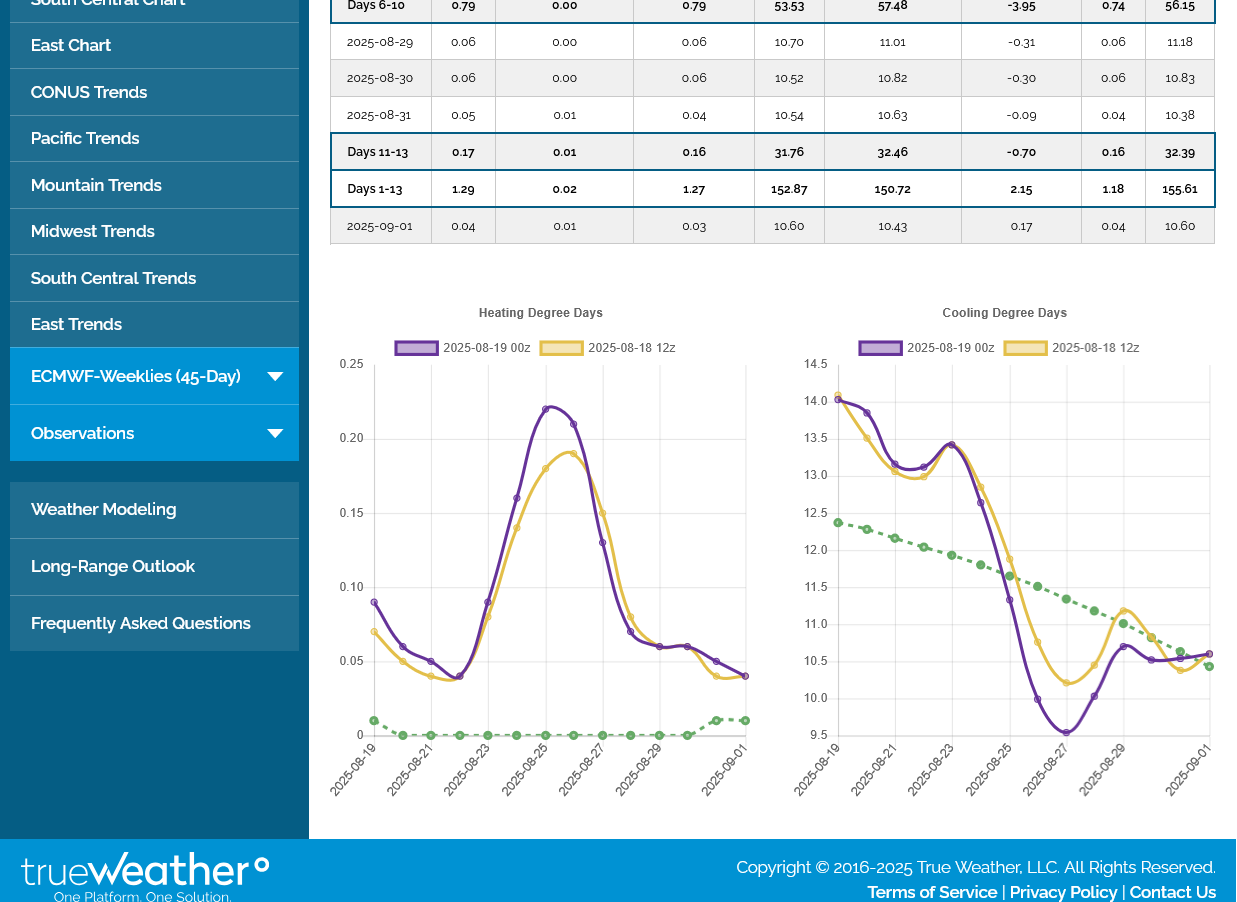
The last overnight EE model was -4CDDs to the bearish side(right/purple)
2. I used the last 4 runs of the cooler model, here on 8-17-25 GEFS for the 2nd graph below. The last one, 12z run is in purple on the right. The plunge lower to BELOW average temperatures for a week is profound compared to early month expectations. We MAY start heating up again at the end of the month but the trend recently has been to add cooling from the models dialing in northern stream influence they didn't see earlier this month.

NG WILL open lower tonight!
5pm: We are around $500/contract lower.
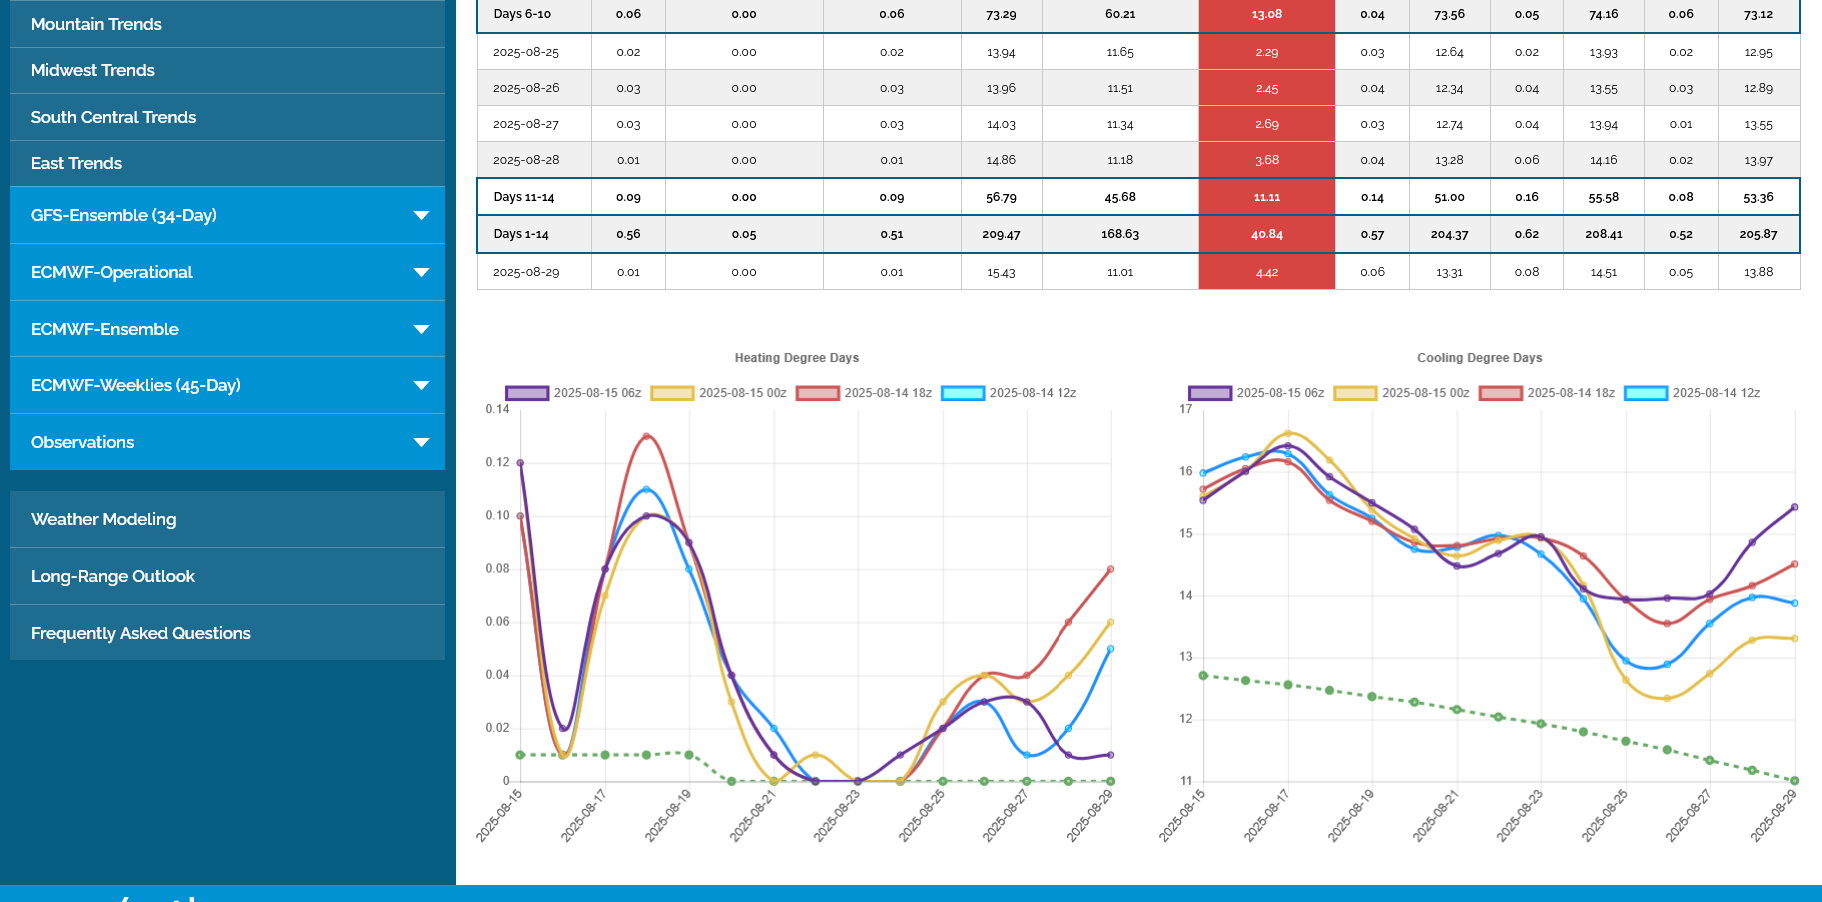
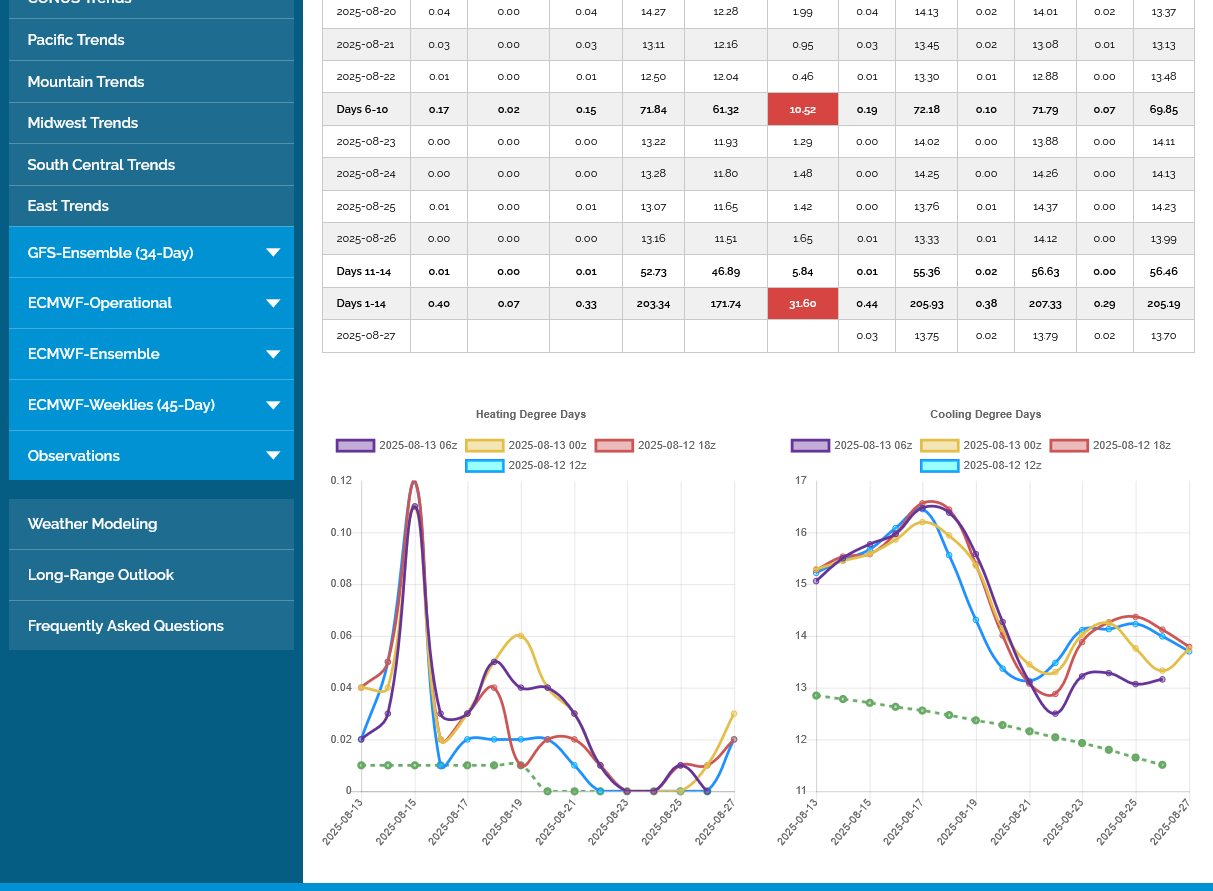
1. The CDD chart on the right was the GEFS solutions from just 4 days ago, 8-13-25. 203 total CDDs with much of the huge drop lower already dialed in.
2. This was that last 12z GEFS in purple (180 CDDs) and previous 3 runs. The steep upward trajectory for the last 5 data points will quickly heat us up again and probably why NG may still get some support here. In other words, the changes from last week are more FROM INDIVIDUAL COOLER DAYS but not from a pattern change.

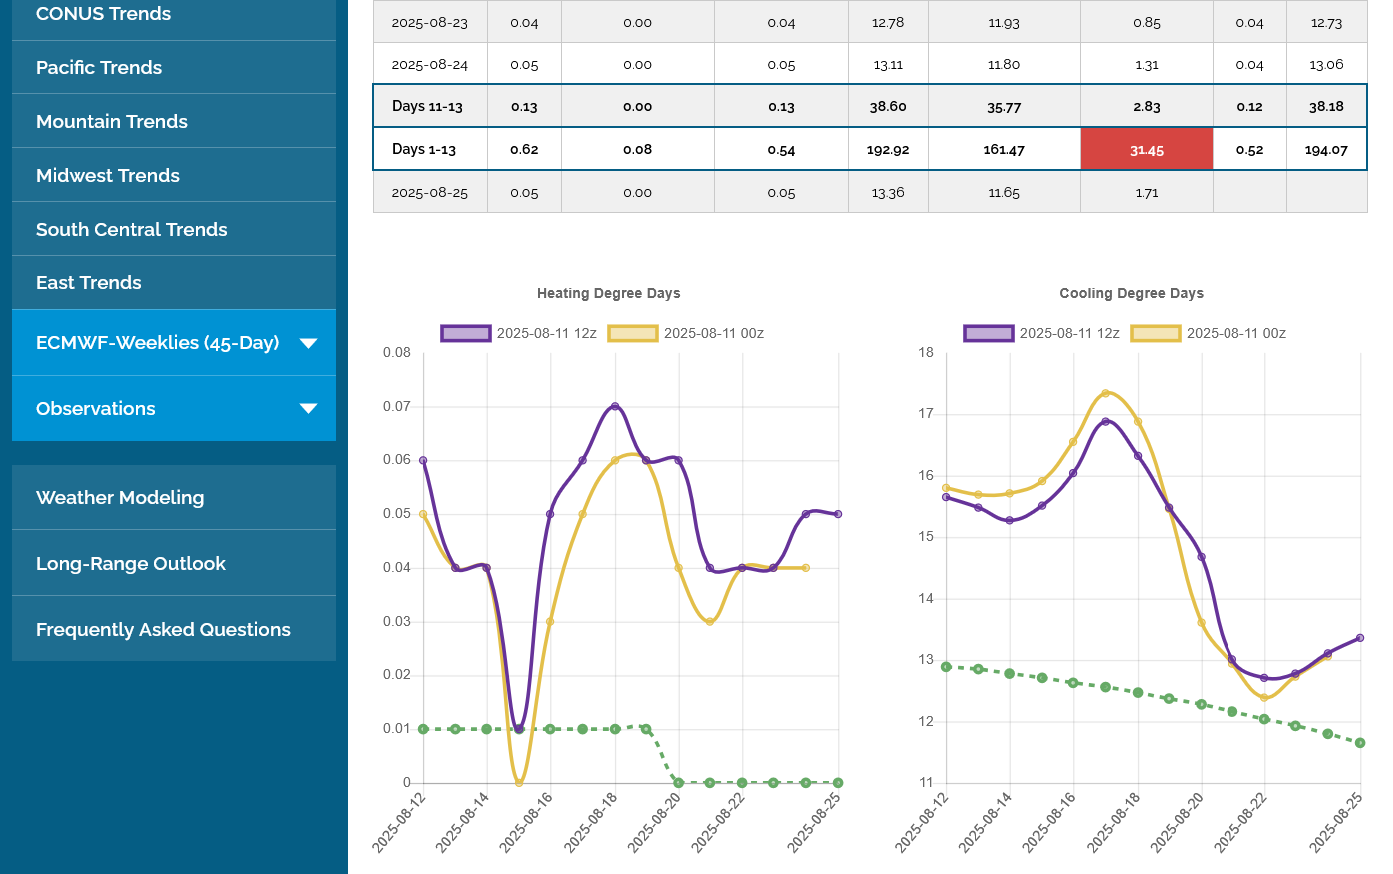
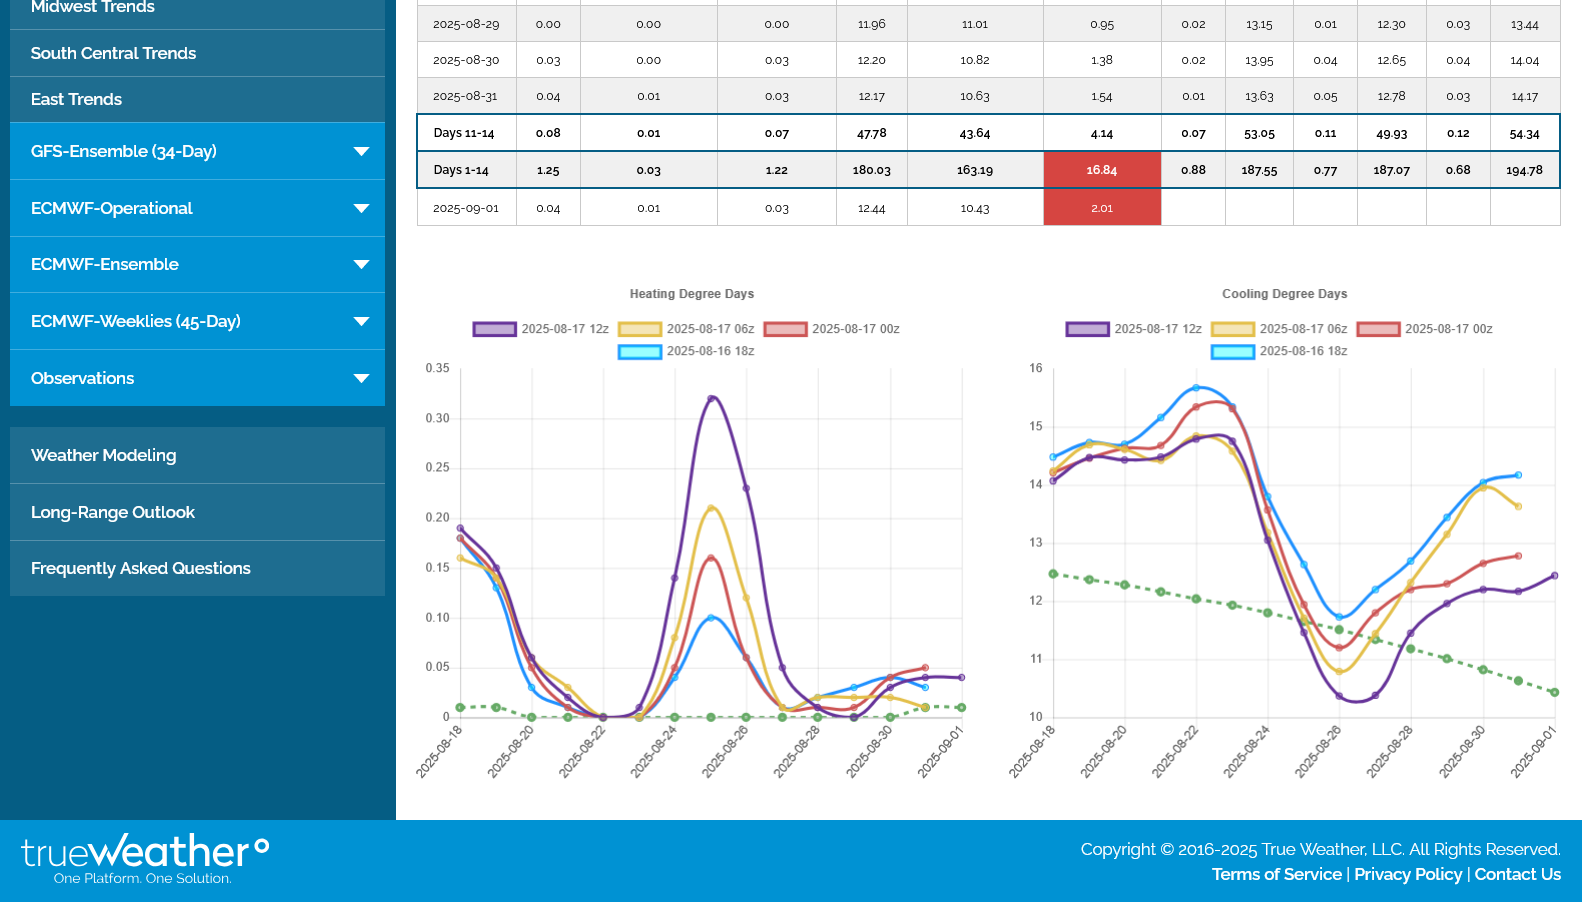
The last 0z European Ensemble mean came out a whopping -7 CDDs cooler after midnight(purple right side-previous run from 12 hours earlier in tan) and we continued under pressure until that magical mystery 6am time frame, when the big money and their algorithms (and other ideas) jump in.
We rallied $1,000/contract after that.
We should note below that the configuration of the lines on the right are exactly the same but with a big shift down in week 2. This tells us that the additional cooling was entirely from much cooler individual days IN THE SAME PATTERN and not from a pattern change. The overall trajectory is the same, with the exception of the shift down in the middle of the graph because of an additional, much stronger NORTHERN STREAM blast of cooler air. The models have been UNDER forecasting the northern stream this month with most updates getting cooler than the previous forecast.
1. 1 day: Top line was the opening price on Sunday Evening.
2. Accelerated down slope line was after the COOLER EE(from above) came out.
3. Up slope line started just after 6am when day session traders take over
4. We are currently ABOVE the open from Sunday Evening. Still slightly lower than the close on Friday but closer to the highs for the session and almost completely shrugging off the MUCH cooler updates since Friday.
5. As you can see from the CDD chart. The temperatures will be fairly close to average after this current heat wave in the south ends. With the CDDs having peaked a month ago, it gets harder and harder for temperature forecasts to generate speculative buying and selling with time. Extreme temps can still do it or extreme changes in temps. Temps close to average are not good for weather trades.
Goodness gracious!!!
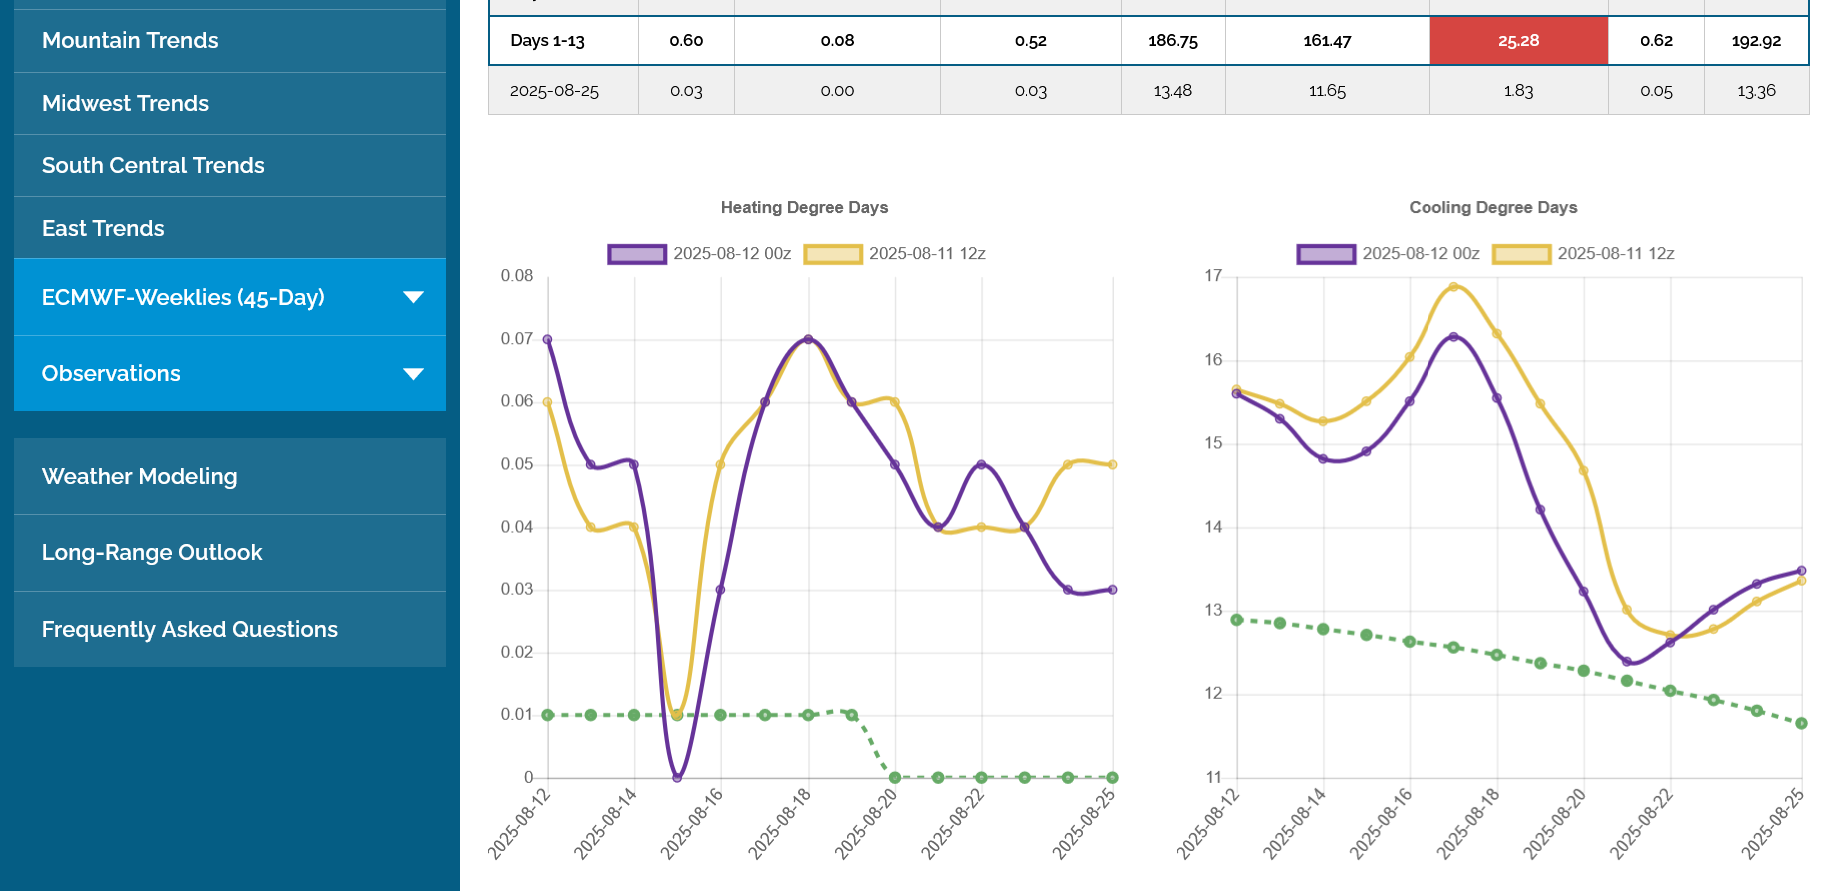
1. The last 0z European Ensemble mean was another -3 CDDs cooler compared to the previous run 12 hours earlier!
2. The last 6z GEFS, in purple/right was -7 CDDs cooler than the previous run 6 hours earlier!
3. Note what the cooler weather models did to prices overnight.
1. Another -4 CDDs on this last 0z European Ensemble mean model in purple/right compared to the previous 12z run 12 hours earlier! This is a 2 week forecast.
2. This is what the same forecast for the next 2 weeks(which have passed) looked like 2 weeks ago. The latest forecast are for NEW days, that were weeks 3-4 back then but its a display of how BEARISH the weather forecast updates have been for these new days as they've gotten cooler and cooler and cooler from the models picking up on a much stronger northern stream than anticipated.
2 week forecast on 8-5-25. The last run or the EE in purple was even HOTTER that day. Note how far above the climatological average in green the CDDs were. There were +63 CDDs compared to the last one above.

https://tradingeconomics.com/commodity/natural-gas
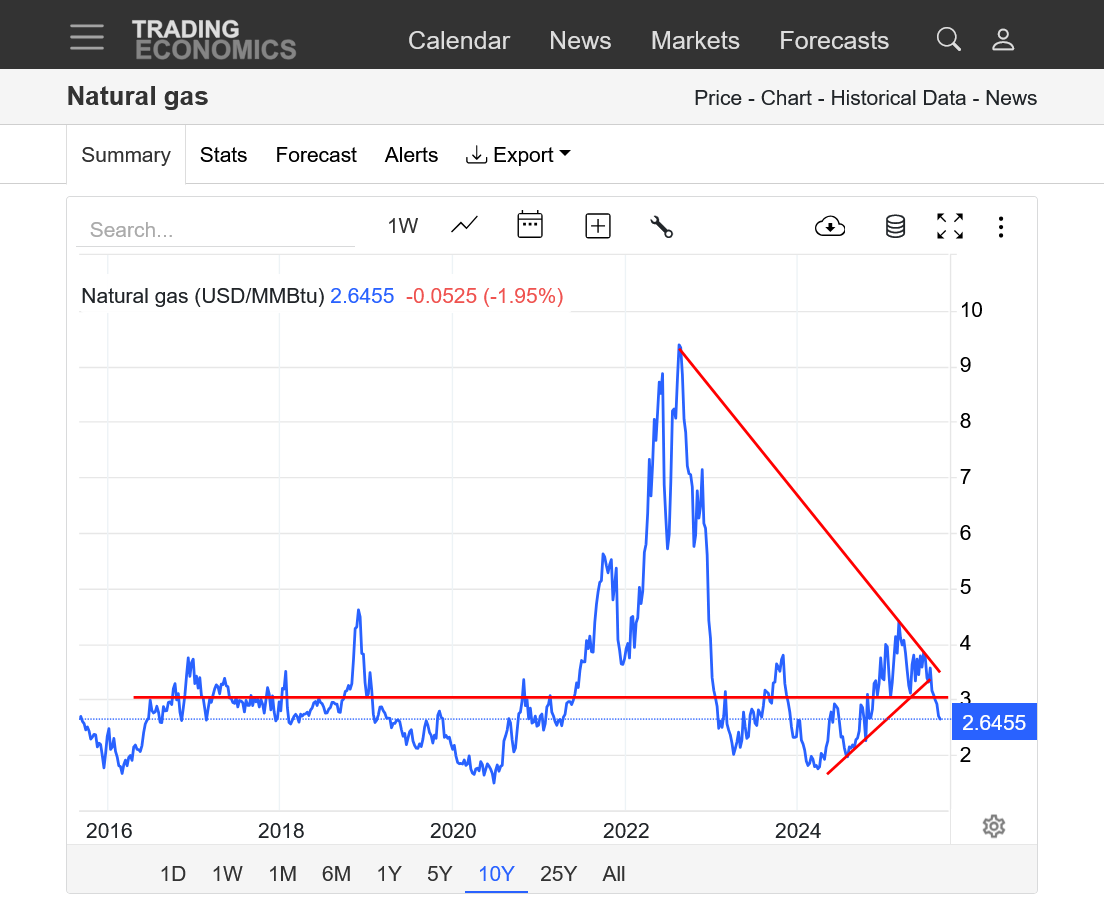
1. 10 years: Downside break out below the symmetrical triangle(higher lows and lower highs). Downside break out below key $3 support.
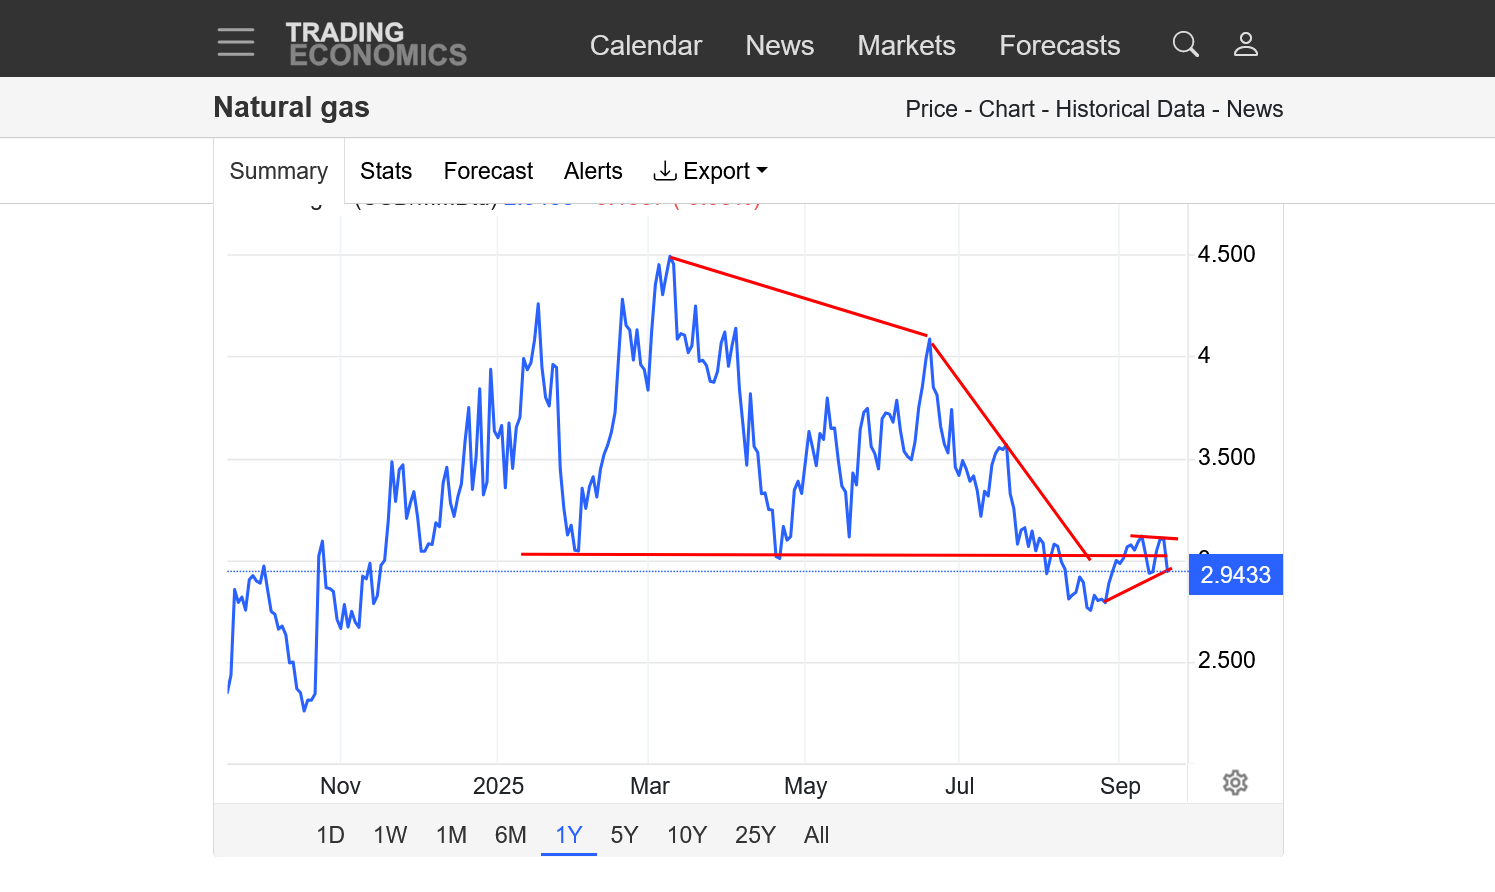
2. 1 year: Downside break out below $3 support. Accelerating down trend after the March high(that came from a cold Winter which resulted in big draw downs in storage)
3. 1 month: Downtrend from cooling weather forecasts. Less cooling need from AC that uses electricity generated from burning natural gas. Break out below major $3 support.
4. 1 day: Still above yesterday's spike low from yesterdays much cooler forecast(for the moment).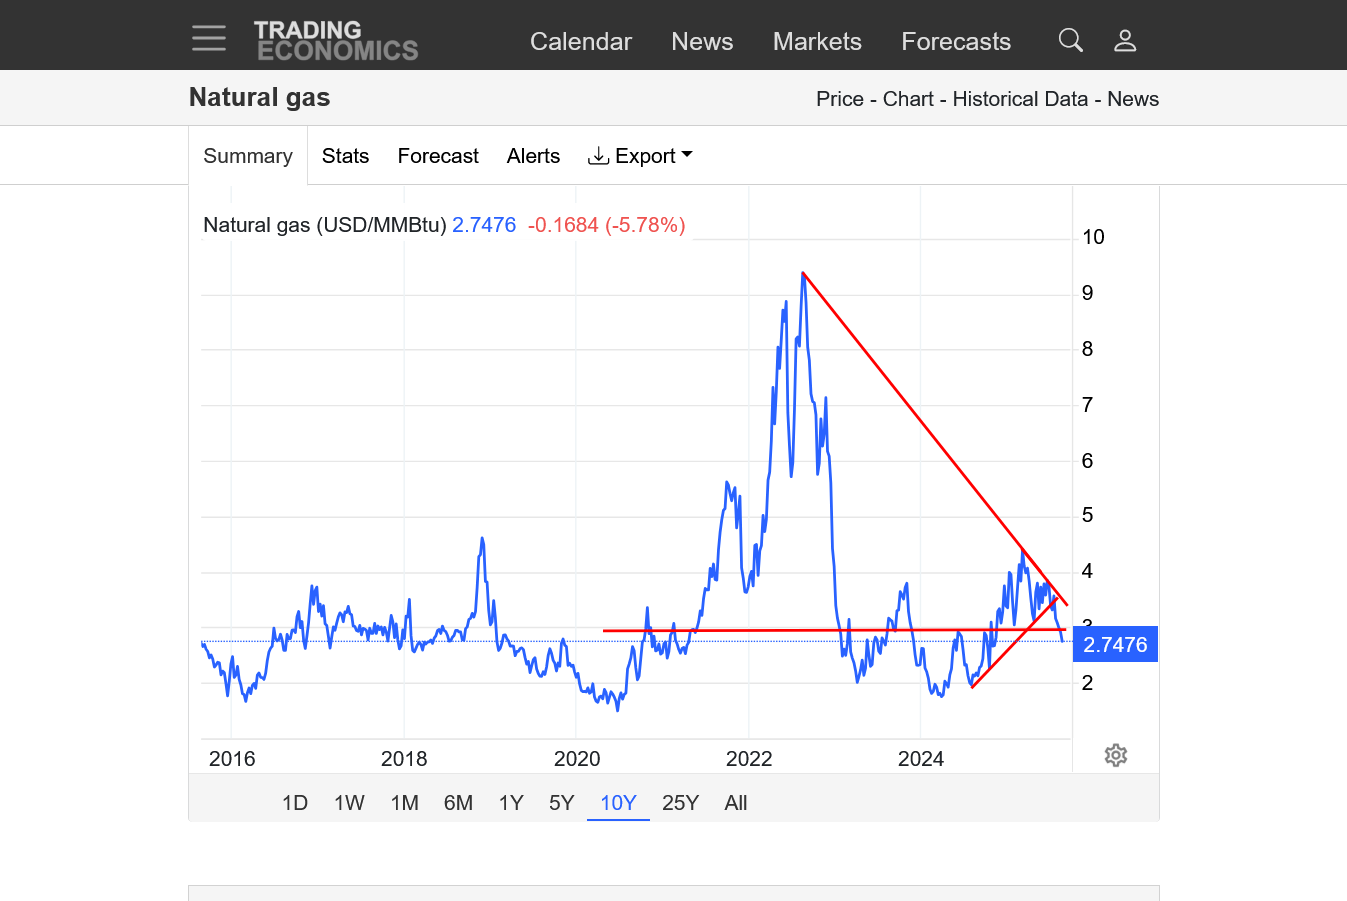
These were the 7 day temps for tomorrows, 9:30 am EIA number: Heat in the far West/Southwest and also S.Midwest to Northeast.
https://www.cpc.ncep.noaa.gov/products/tanal/temp_analyses.php
The last models runs are showing the potential for a NEW PATTERN towards the end of week 2.
A new trough, somewhere from the West Coast, towards the Plains that pumps up an upper level ridge downstream, to the east and south.
This was the just out 12z Canadian Ensemble model(mean) for September 5th. This is a much wetter pattern than the next 10 days that will be dry. It will turn MUCH warmer after day 10 too. This will blow out/completely replace the northern stream and see heat building in the south, possibly points north of that.
https://weather.gc.ca/ensemble/charts_e.html?Hour=384&Day=0&RunTime=12&Type=gz
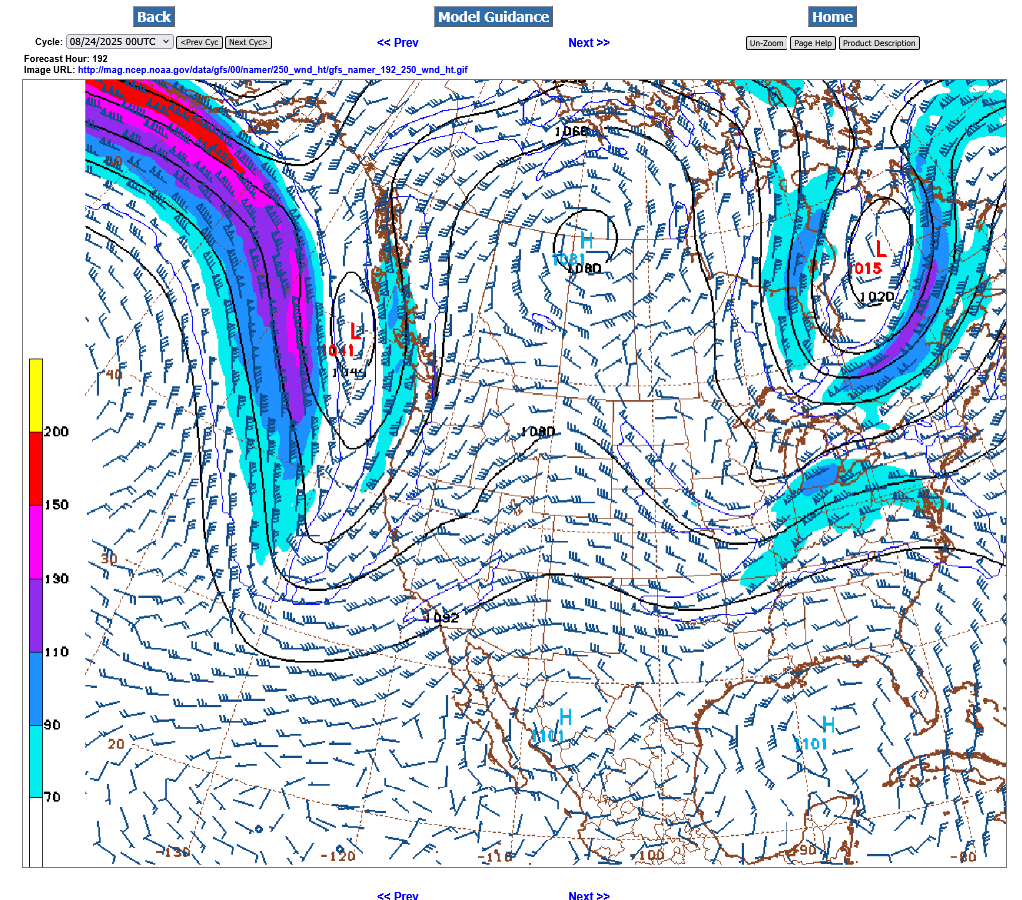
This is the 250 mb chart for September 2nd(around 34,000 feet up-300 hours from now). The jet max in the center/red is around 200 mph! This is from the last 12z GFS operational model.
It's coming for sure with powerful downstream impacts as it approaches even though the magnitude of the jet stream winds will weaken with the approach.
BULLISH! +13 BCF. The South Central and Pacific regions saw draw downs but it's the Midwest region that is -8.2% compared to last year and right at the 5 year average.
![]()
for week ending August 15, 2025 | Released: August 21, 2025 at 10:30 a.m. | Next Release: August 28, 2025
| Working gas in underground storage, Lower 48 states Summary text CSV JSN | |||||||||||||||||||||||||
|---|---|---|---|---|---|---|---|---|---|---|---|---|---|---|---|---|---|---|---|---|---|---|---|---|---|
| Historical Comparisons | |||||||||||||||||||||||||
| Stocks billion cubic feet (Bcf) | Year ago (08/15/24) | 5-year average (2020-24) | |||||||||||||||||||||||
| Region | 08/15/25 | 08/08/25 | net change | implied flow | Bcf | % change | Bcf | % change | |||||||||||||||||
| East | 690 | 677 | 13 | 13 | 733 | -5.9 | 689 | 0.1 | |||||||||||||||||
| Midwest | 812 | 796 | 16 | 16 | 885 | -8.2 | 812 | 0.0 | |||||||||||||||||
| Mountain | 255 | 253 | 2 | 2 | 263 | -3.0 | 203 | 25.6 | |||||||||||||||||
| Pacific | 301 | 305 | -4 | -4 | 288 | 4.5 | 265 | 13.6 | |||||||||||||||||
| South Central | 1,141 | 1,154 | -13 | -13 | 1,125 | 1.4 | 1,055 | 8.2 | |||||||||||||||||
| Salt | 282 | 295 | -13 | -13 | 281 | 0.4 | 261 | 8.0 | |||||||||||||||||
| Nonsalt | 859 | 859 | 0 | 0 | 844 | 1.8 | 795 | 8.1 | |||||||||||||||||
| Total | 3,199 | 3,186 | 13 | 13 | 3,294 | -2.9 | 3,025 | 5.8 | |||||||||||||||||
| Totals may not equal sum of components because of independent rounding. | |||||||||||||||||||||||||
Working gas in storage was 3,199 Bcf as of Friday, August 15, 2025, according to EIA estimates. This represents a net increase of 13 Bcf from the previous week. Stocks were 95 Bcf less than last year at this time and 174 Bcf above the five-year average of 3,025 Bcf. At 3,199 Bcf, total working gas is within the five-year historical range.
For information on sampling error in this report, see Estimated Measures of Sampling Variability table below.
Note: The shaded area indicates the range between the historical minimum and maximum values for the weekly series from 2020 through 2024. The dashed vertical lines indicate current and year-ago weekly periods.
+++++++++++++++++
The last 0z EE model was +2 CDDs vs the previous 12z run from 12 hours earlier with a pronounced up trajectory late in the period. The lows are likely in, especially with the bullish EIA number.
1 week below:
The last 0z European Ensemble model was -5 CDDs cooler and put pressure on prices overnight as we're almost back down to the lows.
The next week to 10 days will feature extremely cool/bearish temperatures for late August/start of September before things heat up again towards the end of 2 weeks.
1. 1 week. Bottom?? or ready to make new lows
2. 1 year-downside break out below $3. Note the uptrend from last Winters cold and the MAJOR top in March, followed by lower prices and a STEEPENING of the downslope line.
3. 10 years: Major downside breakout below a symmetrical wedge (lower highs and higher lows)
https://tradingeconomics.com/commodity/natural-gas
The heat returns in September but it's getting late in the year for CDDs to be the main driver of prices.
The weak economy could also be reducing industrial demand a bit here too.
https://www.cpc.ncep.noaa.gov/products/predictions/WK34/gifs/WK34temp.gif
September natural gas futures sank to a new nine-month low on Friday as unseasonably cool weather crushed demand outlooks, overwhelming Thursday’s bullish storage report and a late week rebound in LNG exports.
+++++++++++++++++++++
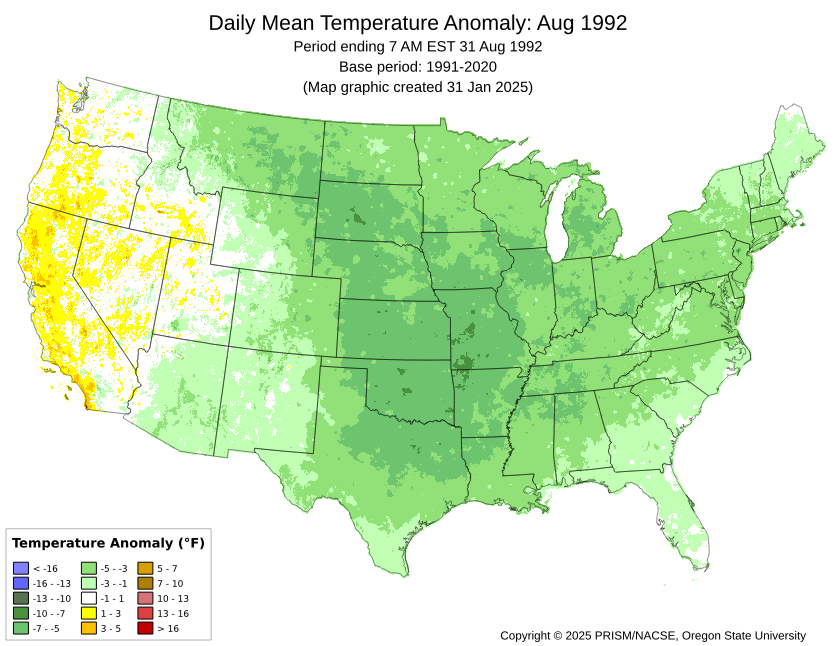
We'll see where the month ends up(August 2025) and of course we are only talking about the last week in August this year from the above article but I'm betting August 1992 was cooler overall for the United States than any August since I've been a meteorologist (1981).
1992 was my first year trading and I was still chief meteorologist for WEHT-TV in Evansville, IN so I had double the reason to remember it vividly!
https://prism.oregonstate.edu/comparisons/anomalies.php
The first 21 days this August.
https://www.cpc.ncep.noaa.gov/products/tanal/temp_analyses.php
This jet stream forecast for a week from now from the 0z GFS operational model shows the strong winds coming out of the Pacific which will define a new week 2 pattern. There is tremendous uncertainty of the downstream impacts in early September.
Will they blow out the unusually strong and UNDER forecast northern stream? Or will there continue to be cool surprises from the tenacious northern stream and upper level low in southeast Canada?
+++++++++++
Temps for this next EIA number at 9:30 am Thursday, 8-28-25. Heat was widespread but not many people line in the N.Plains. The injection should be pretty small for late August.
The week after that, 9-4-25 will feature a huge injection from the well below average CDDs this week. The week after that 9-11-25 will also be a very big number compared to average in late August/early September.
https://www.cpc.ncep.noaa.gov/products/tanal/temp_analyses.php
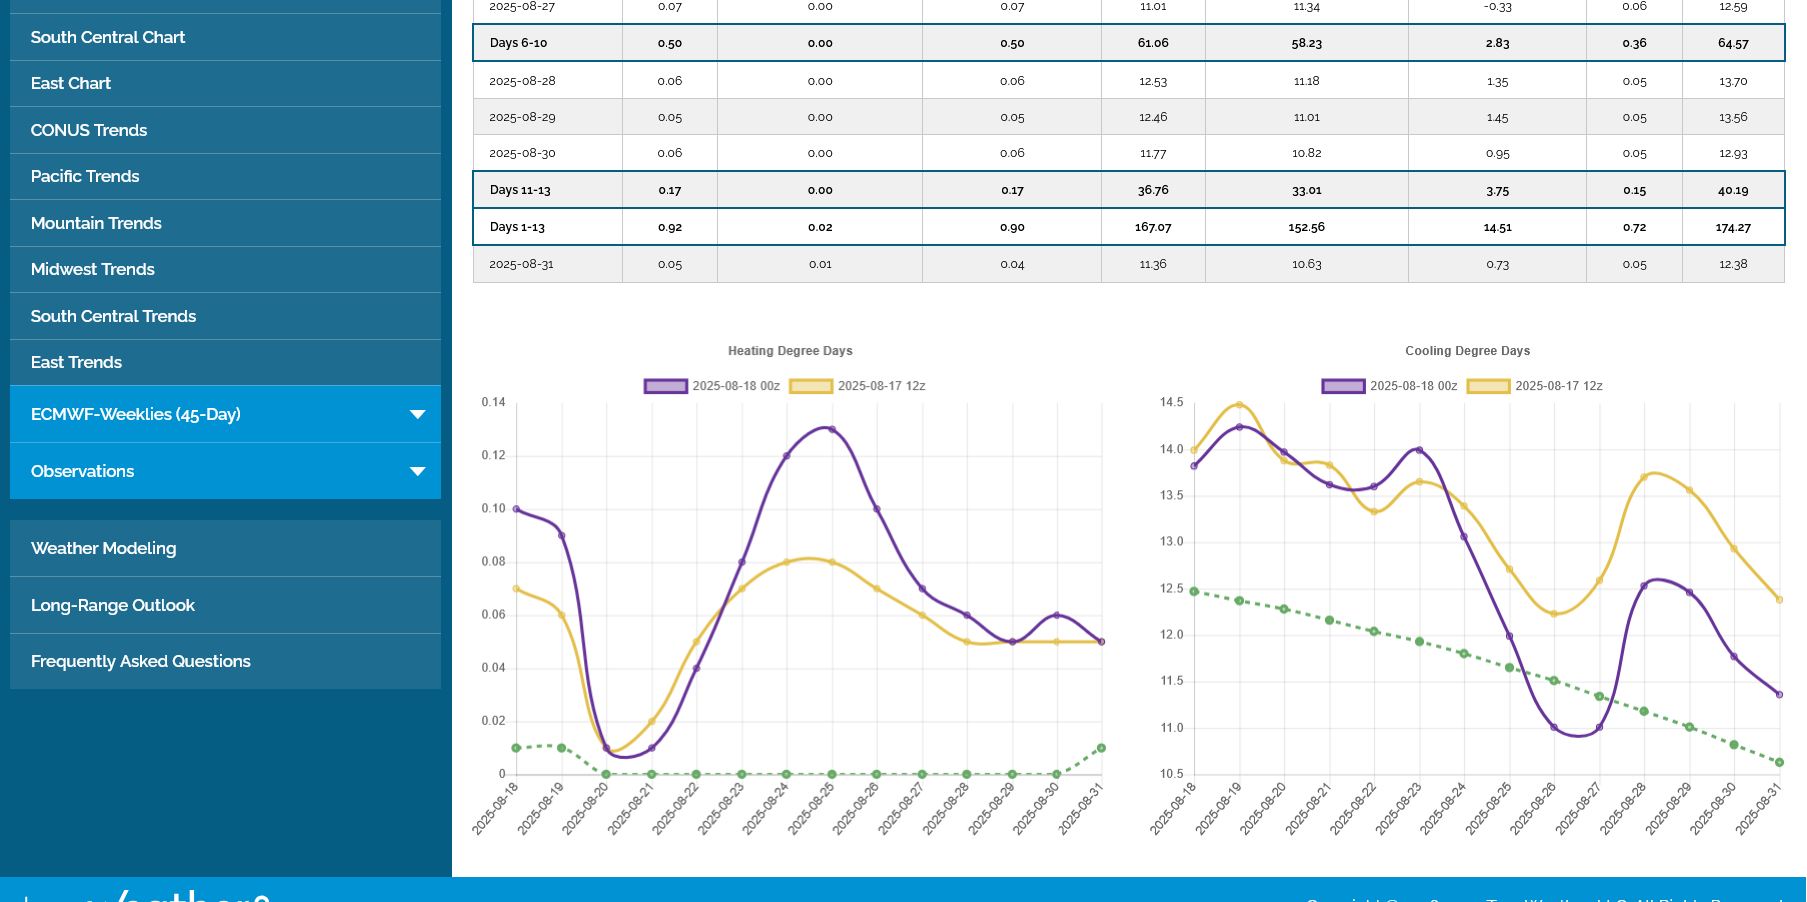
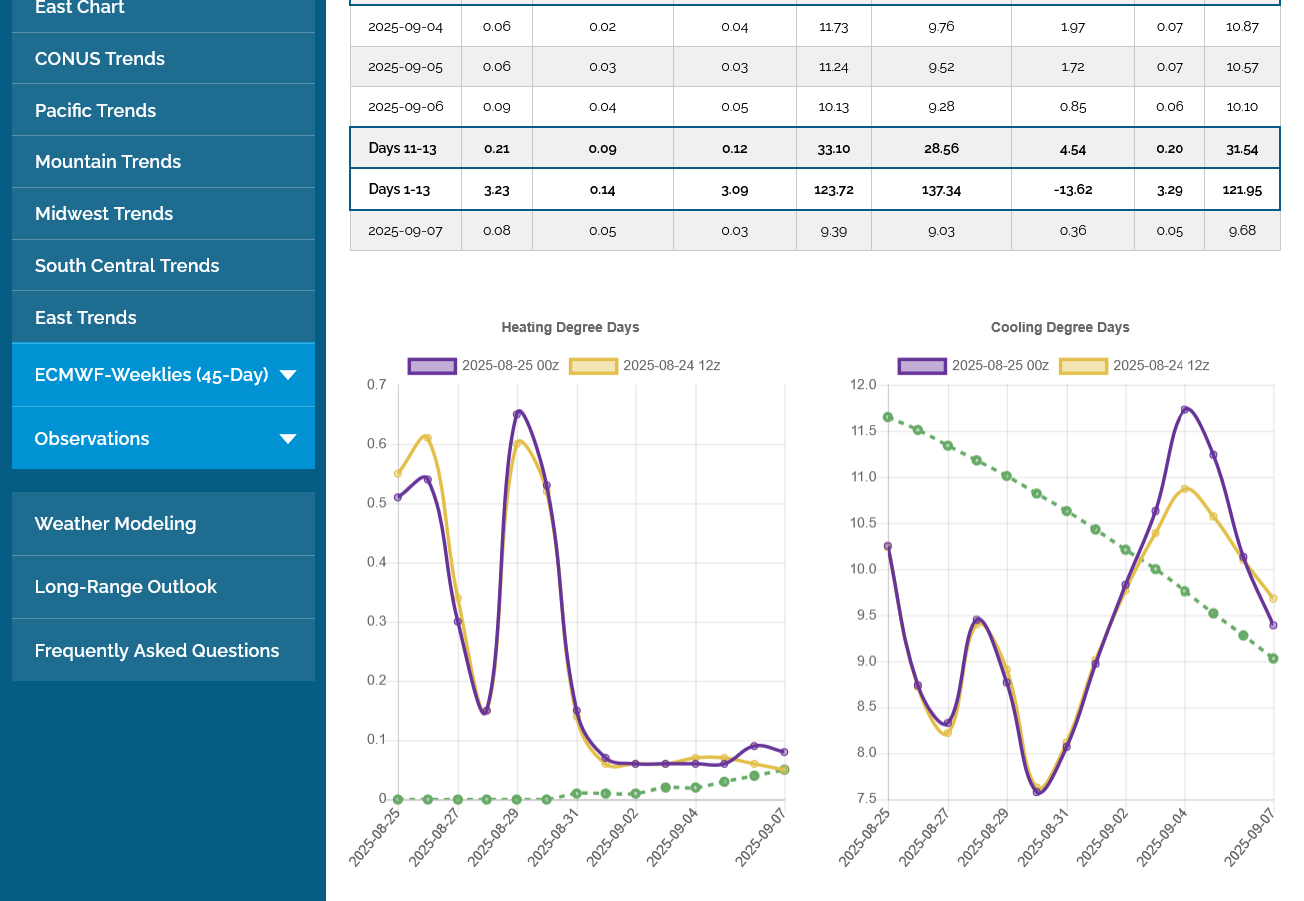
The last 12z European Ensemble mean model was a whopping -7 CDDs vs the previous 0z run from 12 hours earlier.
The models continue to have a hard time handling the northern stream influence, with many forecast updates this month being cooler than the previous ones for the same periods. The EE is actually the best performing model much of the time.
Regardless of the cooler individual days in this run, the pattern change that features temps warming to above average again in September still looks good.........just not excessive heat. Not the green dashed line to the right on the CDD chart. It's falling pretty fast!
The main CDD season is over in September, even though anomalous heat in September can still have some short term impact on speculative buying.
Weather traders will start looking at HDDs in October, when anomalous, widespread cold waves can start to have a short term impact on speculative buying.
Very mild weather that maximizes the size of injections will be bearish too.
November is when bread and butter type weather trading set ups using temperature forecasts resumes.
Modest gap lower for September ng. -$500/contract in the first few minutes.
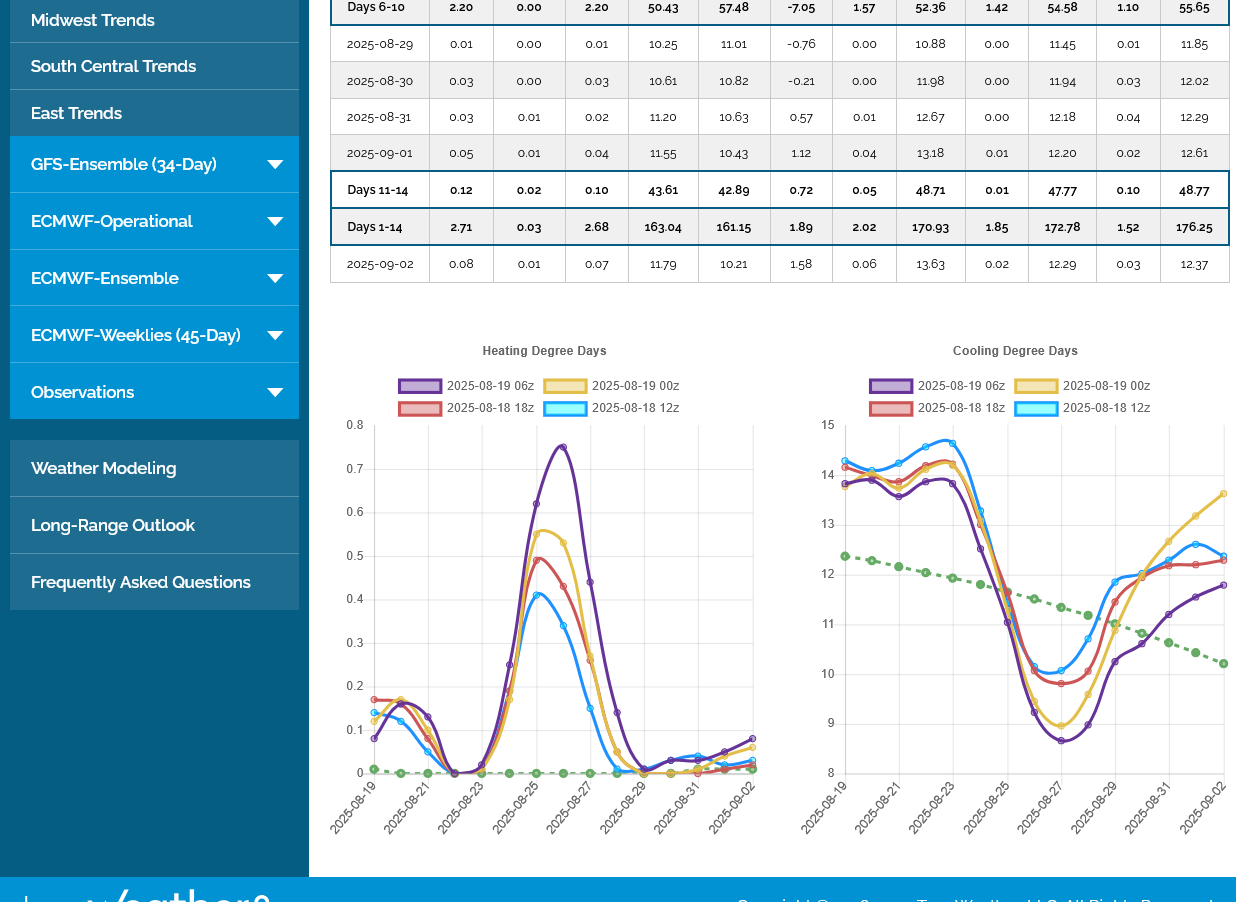
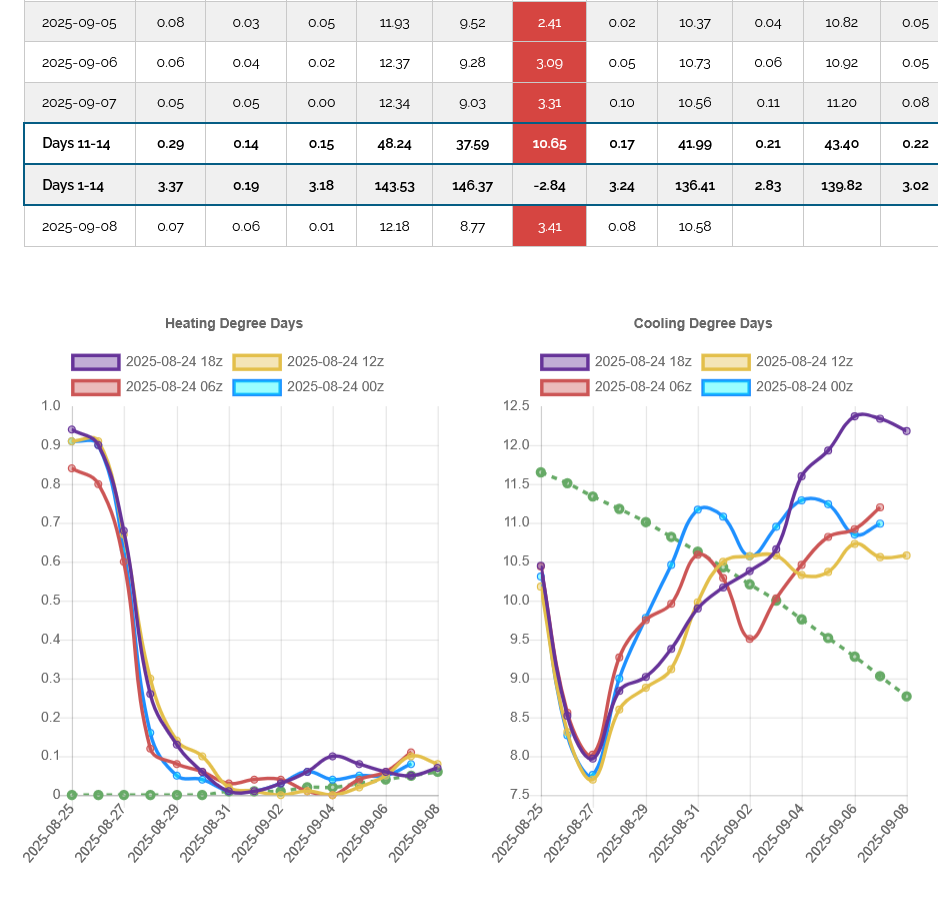
9pm: This last 18z GEFS was +7 CDDs. All from the last 5 data points on the graph below(purple/right) which is the end of week 2. Pretty bullish if the market cared, the EE confirms the same thing overnight and if this were not for September days that are well past the main CDD trading season.
We had a tiny bounce on this when it was coming out but are back below at or just below the open and the gap lower is wide open.
Will it be a down side, break away gap or will it be an exhaustion gap? If the gap is filled, by trading back above Friday's lows, then it's a gap and crap exhaustion gap.
I will wild guess that it's an exhaustion gap and if models consistently ADD more CDDs from this point on during this week, that the low is in.
1. 1 week:Top line is the low from Friday. Bottom line is the high tonight. Between them is the gap lower.
2. 1 year: Break out below $3. Break out lower from the symmetrical triangle(higher lows/lower highs). Uptrend last Winter from the very cold temps on the left. Major top in March.
3. 10 years: Break out below $3. Break out lower from the symmetrical triangle(higher lows/lower highs). Major top in 2022.
https://tradingeconomics.com/commodity/natural-gas
Some of the guidance is getting cooler again at the end of 2 weeks. Some is warmer. The EE below is cooler at the end, even with it's +2 CDDS(from 2 warmer days in week 2 before the cooling).
NG has been trading in a very narrow range since the open. Very uncharacteristic, as the market is uncertain. The gap lower is still open.
7am: The last 6Z GEFS and most of its recent runs have a different, much warmer solution at the end of week 2. The contrast probably explains some of the uncertainty for ng traders and the tight range so far.
As wild guessed, we closed the gap lower and now the chart formation is a gap and crap, selling exhaustion. Considering the fairly long lived move down, the weather pattern change and the seasonals being strongly up here, this is a valid but low confidence signal because September CDDs are usually not a big price driver. Also, we are only closing slightly above the gap. The gap and crap signal didn't inspire a great deal of follow up buying.
We initially closed the gap, then retested the downside quickly but came back to just above the gap. Ideally, we would have seen a much higher close but the chart pattern is a potential reversal up........depending on the next few days of trading.
1. 1 week. The long red line was the top of the gap/Friday's lows. We are a tad above that. If weather models turned cooler again overnight, it wouldn't surprise me if we go lower but the risk to being short here is much greater than being long.
+3 CDDs on this last 12z run of the European Ensemble model in purple compared to the previous 0z run, 12 hours earlier.
The last 0z European Ensemble in purple was a whopping -8 CDDs vs the previous, 12z run from 12 hours earlier. However, NG is up sharply, with the expiration of the front month, September causing some typical wild gyrations. This time to the upside.
I totally missed something on the previous thread from not watching everything related to NG that close this week.
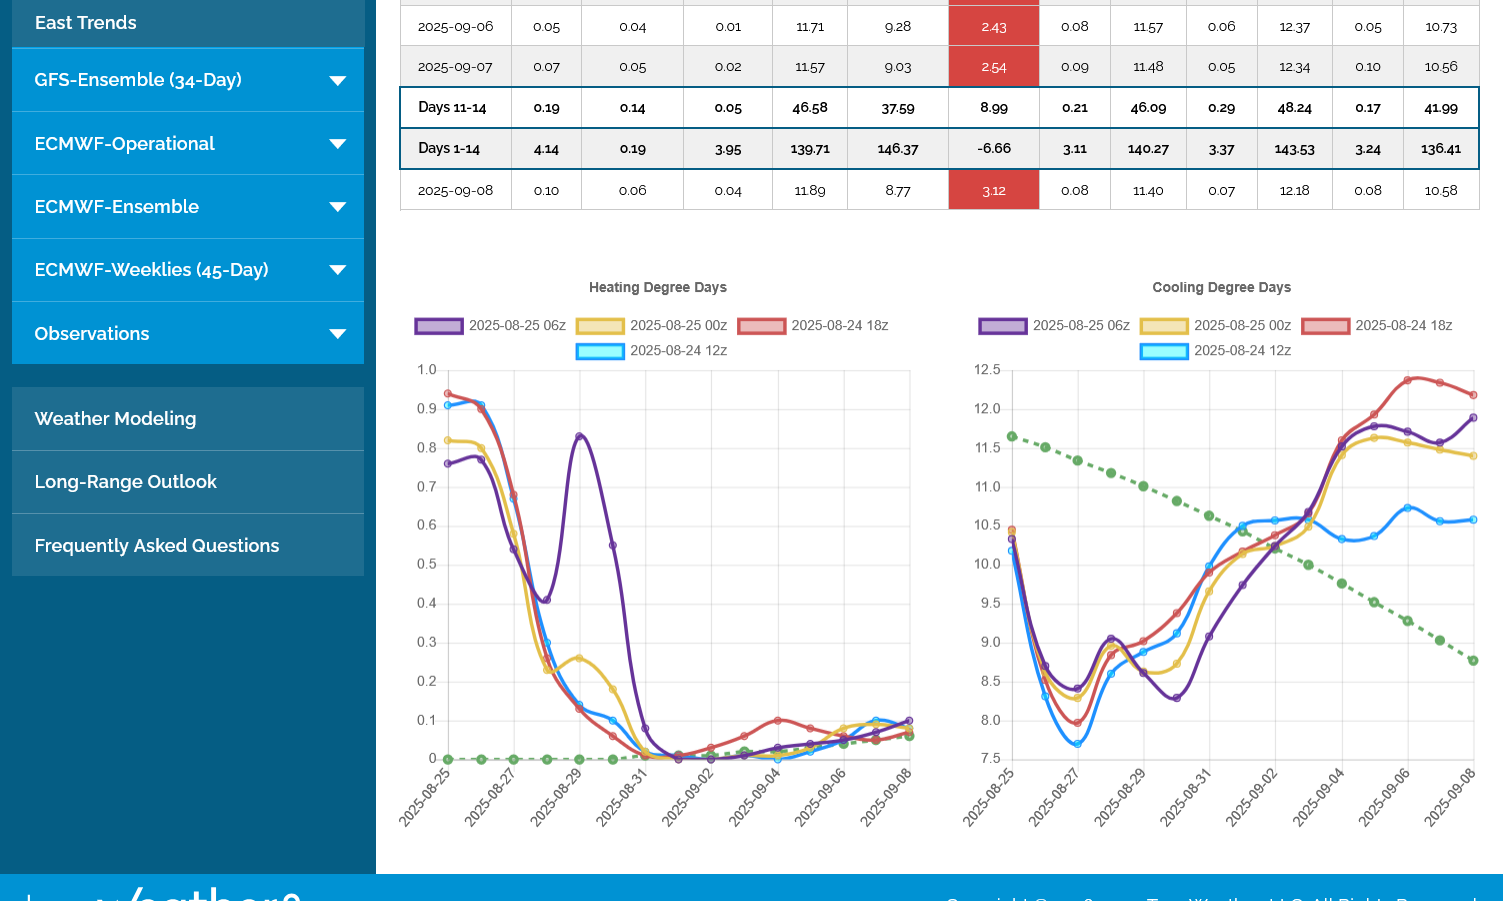
The spike higher in price happened because the 6z GEFS came out MUCH warmer. It's the yellow color on the graph below. This was 6 hours after the much cooler EE pressured prices.
The purple color below is the just out 12z run of the GEFS. Not AS warm as the previous 6z but the trajectory is UP for the last 5 data points which is what the market cares about most because those are the ones that tell us the most about the new, MUCH warmer pattern in the 2nd half of week 2 and the start of week 3.
Note the contrast below with the rapidly FALLING dashed green line which is from the seasonal cooling that, on average is kicking in quickly. The AVERAGE, however comes from every year, which includes some years with extremes to the upside and downside. Looks like September may turn into 1 of those much warmer than average years with the CDDs at the end of the period being more like late August instead of mid-September.
This would mean LOWER injections in September compared to average. September typically features some increasingly HUGE injections into early October, when CDDS start to ramp up. CDDs in the Winter use up MUCH more electricity generated from burning natural gas. Solar radiation is weaker too so less electricity from that source but wind power tends to be higher.
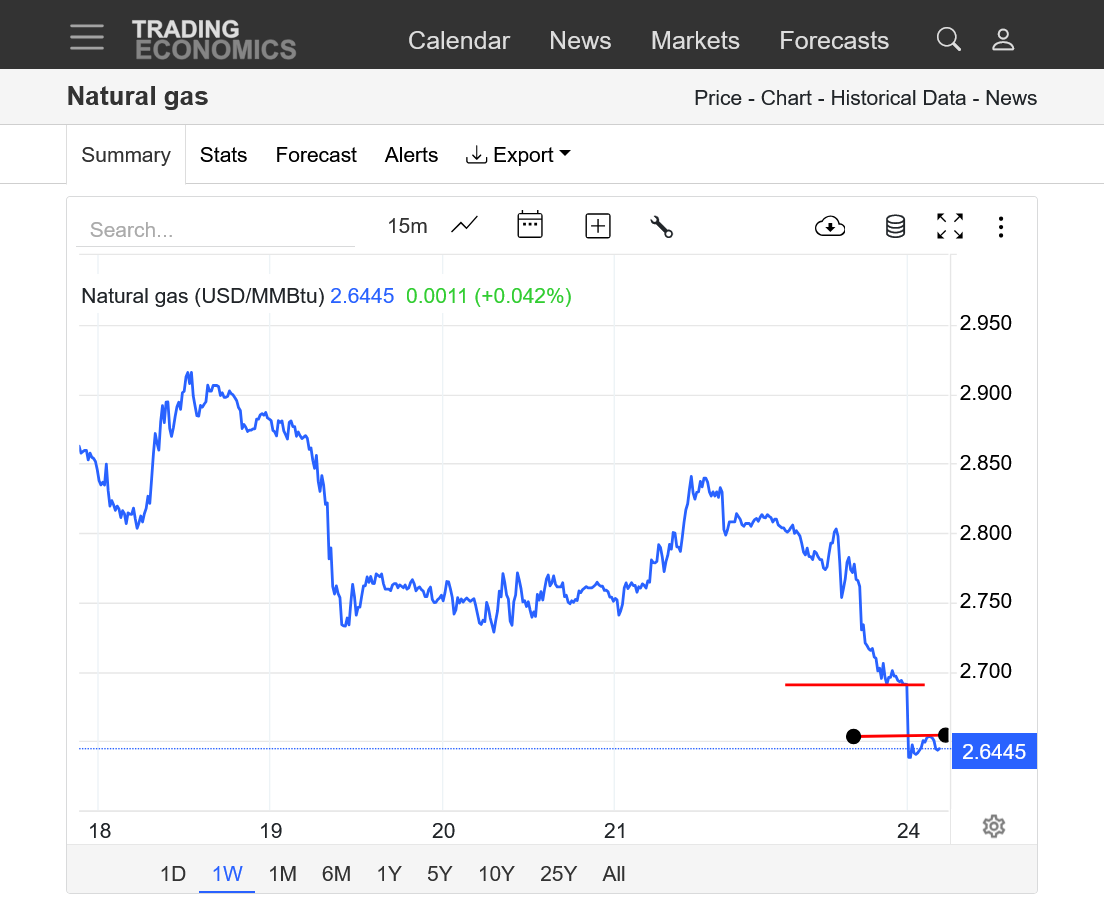
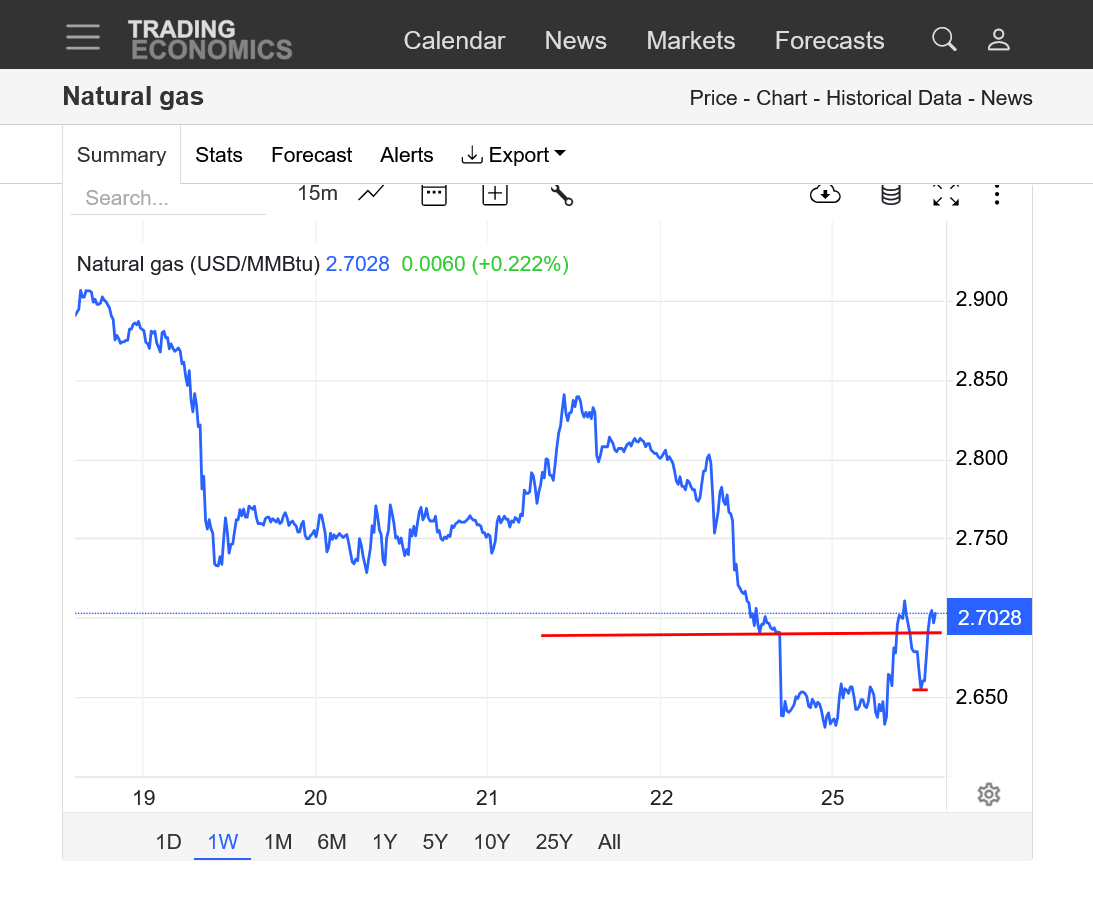
https://tradingeconomics.com/commodity/natural-gas
The 2 red lines on the left show the gap lower to start the week. As described previously, when that was filled, it served as a gap and crap selling exhaustion formation, which is bullish.
The next 2 lines were this product rolling from the September front month to the October price(which was higher) at the start of trading Tuesday evening. The line with the balls was at 6am, this morning. This defines the lows today after the 0z EE model had come out much cooler after midnight and the 6z GEFS model, in yellow above came out MUCH warmer resulting in the huge spike up! 6am is also the time the huge traders come in with their algorithms and there is often a spike up or down when they enter the market.
The EIA was bullish as expected, +18 Bcf, from last weeks heat.
By metmike - Aug. 24, 2025, 1:41 p.m.
Note too the blue storage line has a lower up slope than the average, so this heat has eroded supplies vs the averages. The next 2 numbers, however will be robust/bearish:
![]() https://ir.eia.gov/ngs/ngs.html
https://ir.eia.gov/ngs/ngs.html
for week ending August 22, 2025 | Released: August 28, 2025 at 10:30 a.m. | Next Release: September 4, 2025
| Working gas in underground storage, Lower 48 states Summary text CSV JSN | |||||||||||||||||||||||||
|---|---|---|---|---|---|---|---|---|---|---|---|---|---|---|---|---|---|---|---|---|---|---|---|---|---|
| Historical Comparisons | |||||||||||||||||||||||||
| Stocks billion cubic feet (Bcf) | Year ago (08/22/24) | 5-year average (2020-24) | |||||||||||||||||||||||
| Region | 08/22/25 | 08/15/25 | net change | implied flow | Bcf | % change | Bcf | % change | |||||||||||||||||
| East | 707 | 690 | 17 | 17 | 751 | -5.9 | 708 | -0.1 | |||||||||||||||||
| Midwest | 832 | 812 | 20 | 20 | 906 | -8.2 | 836 | -0.5 | |||||||||||||||||
| Mountain | 254 | 255 | -1 | -1 | 266 | -4.5 | 206 | 23.3 | |||||||||||||||||
| Pacific | 298 | 301 | -3 | -3 | 287 | 3.8 | 264 | 12.9 | |||||||||||||||||
| South Central | 1,125 | 1,141 | -16 | -16 | 1,120 | 0.4 | 1,048 | 7.3 | |||||||||||||||||
| Salt | 272 | 282 | -10 | -10 | 273 | -0.4 | 254 | 7.1 | |||||||||||||||||
| Nonsalt | 853 | 859 | -6 | -6 | 847 | 0.7 | 795 | 7.3 | |||||||||||||||||
| Total | 3,217 | 3,199 | 18 | 18 | 3,329 | -3.4 | 3,063 | 5.0 | |||||||||||||||||
| Totals may not equal sum of components because of independent rounding. | |||||||||||||||||||||||||
Working gas in storage was 3,217 Bcf as of Friday, August 22, 2025, according to EIA estimates. This represents a net increase of 18 Bcf from the previous week. Stocks were 112 Bcf less than last year at this time and 154 Bcf above the five-year average of 3,063 Bcf. At 3,217 Bcf, total working gas is within the five-year historical range.
For information on sampling error in this report, see Estimated Measures of Sampling Variability table below.
Note: The shaded area indicates the range between the historical minimum and maximum values for the weekly series from 2020 through 2024. The dashed vertical lines indicate current and year-ago weekly periods.
+++++++++++++++++
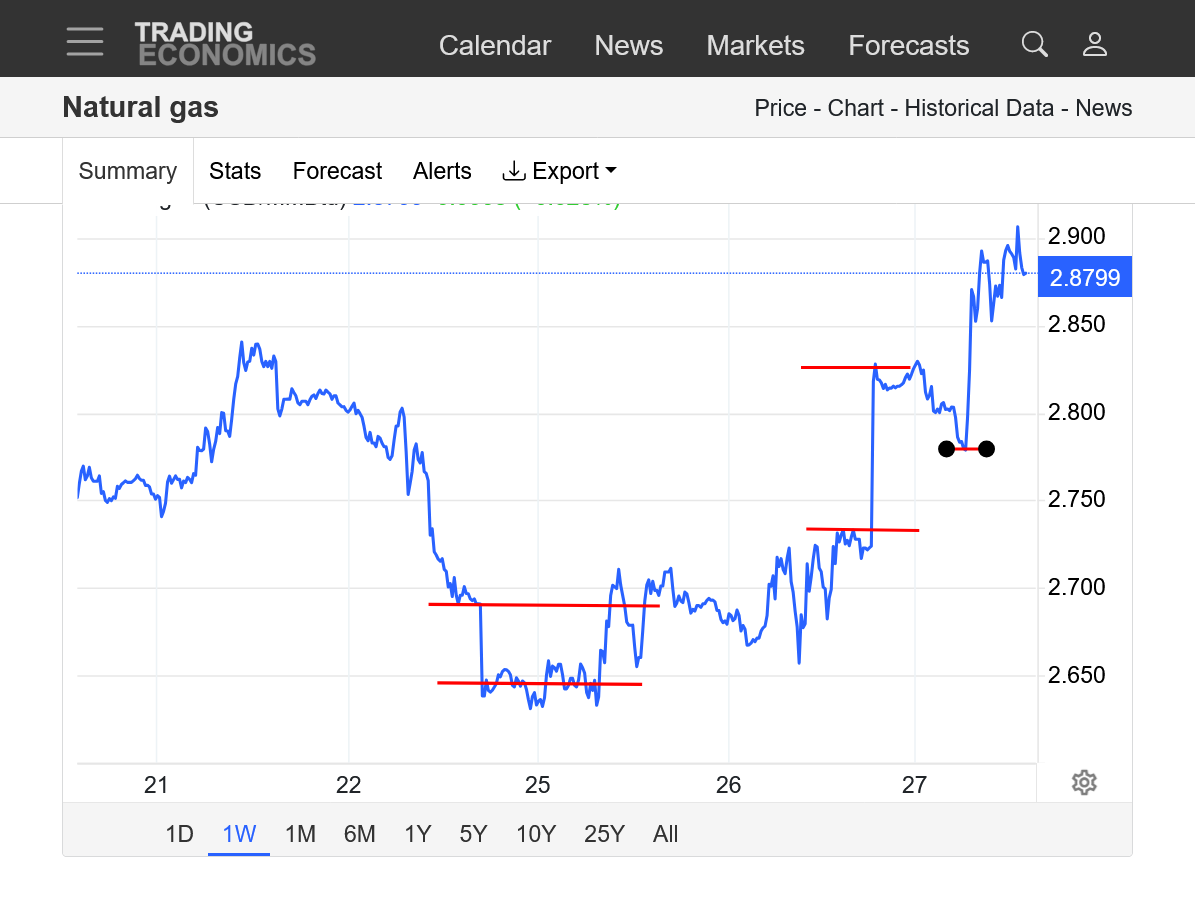
1. 1 month: The daily AND weekly gap lower on Sunday Night was clearly a profound chart formation with A TON of follow thru! When it was filled, it became a selling EXHAUSTION, gap and crap. We're already bumping up to $3 support, almost $3,000 from the lower open Sunday Night. The line with the black balls below was where ng was trading when the bullish EIA number was released at 9:30 am, 3 hours ago, with an immediate spike higher
Re: Re: Re: Re: Re: NG 8/4/25+
By metmike - Aug. 24, 2025, 6:05 p.m.
2. 1 day: EIA number released at 9:30 am, 3 hours ago.
https://tradingeconomics.com/commodity/natural-gas
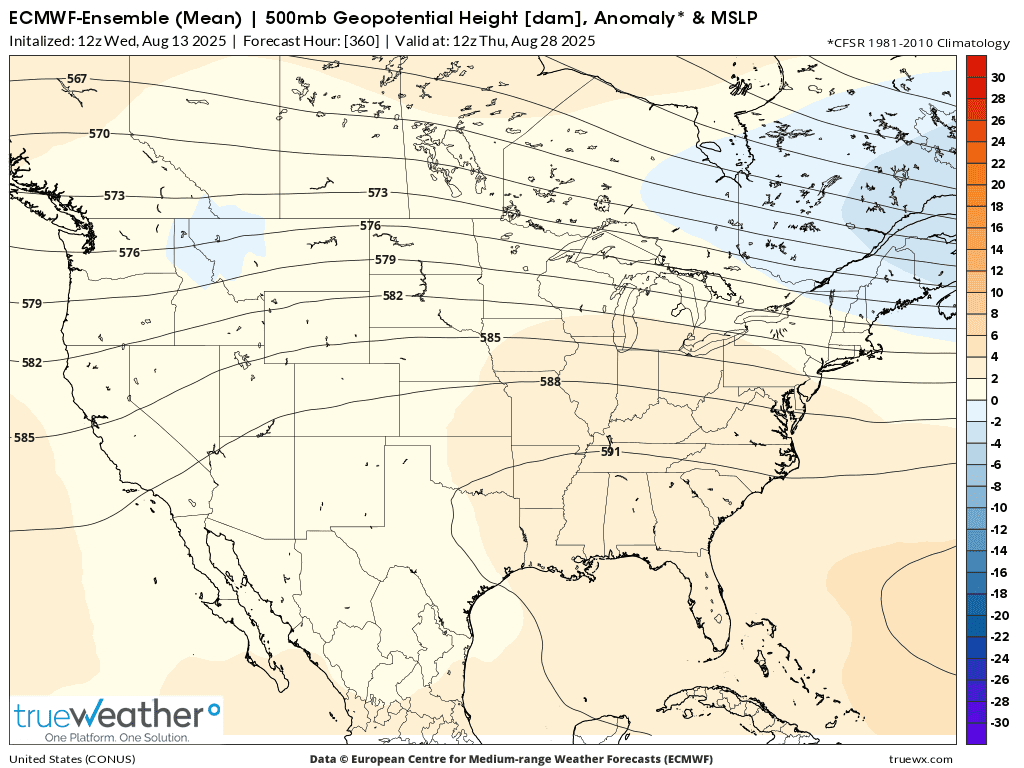
The 12z guidance was MUCH cooler than previous runs(again).
The last European Ensemble model is in purple below. -8+ CDDs compared to the previous run 12 hours earlier.
These forecast models have often been getting cooler and cooler this month compared to previous runs!!!
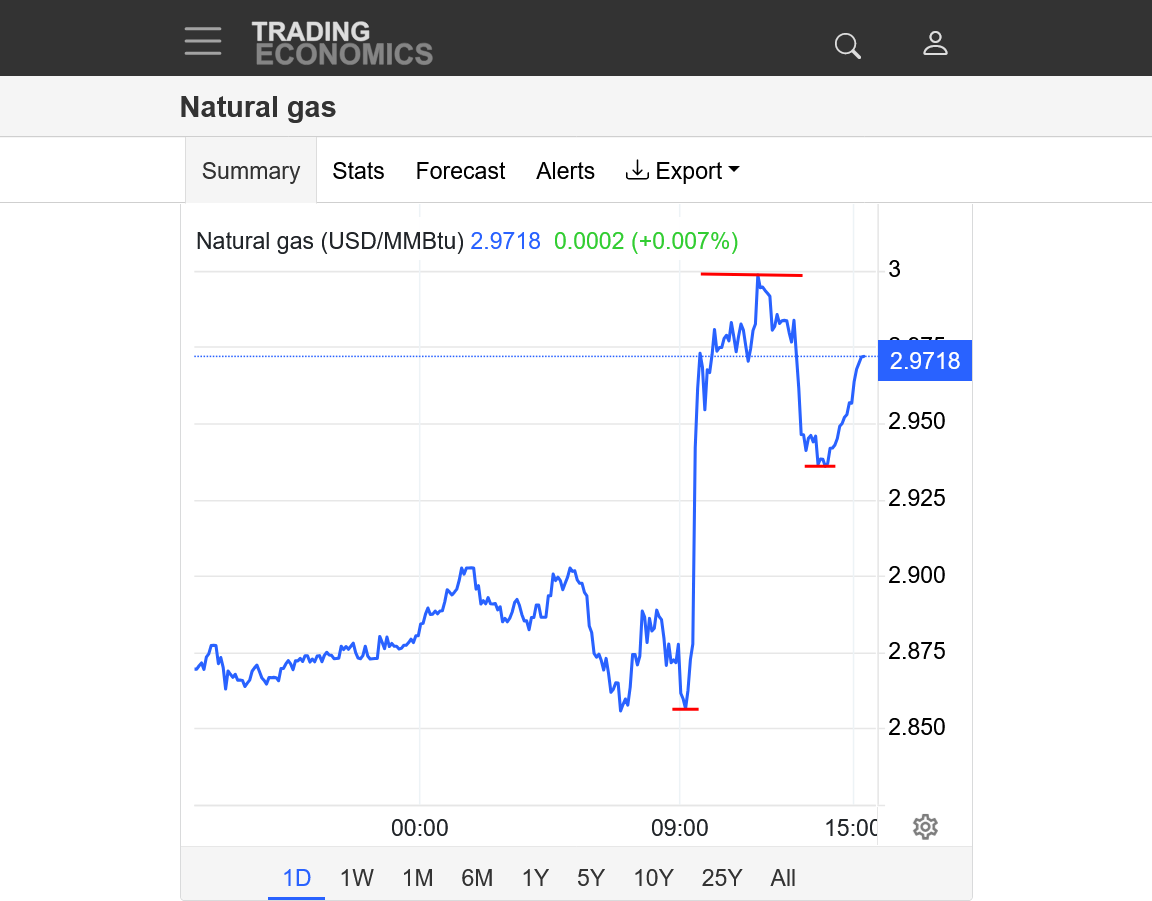
1 day: You can see below the huge spike higher from the very bullish EIA number, a correction lower from the cooler 12z models but now we're recovering back towards the highs again.
$3 resistance looks like it will give way when the forecasts add more heat.
Story of the Day
Confirmation of a lighter-than-expected storage build last week propelled October natural gas futures to a second-straight winning session in their Thursday debut at the front of the curve.
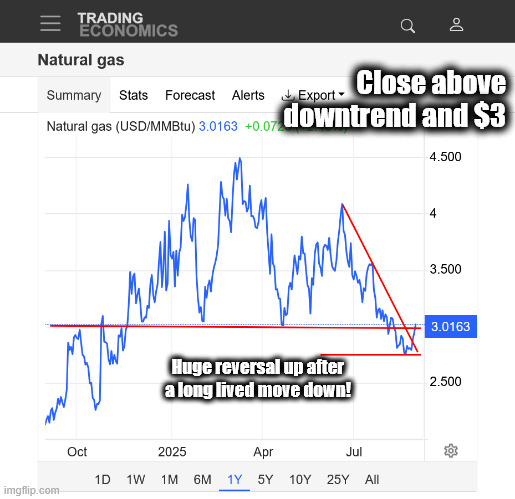
We‘re closing the week on the highs, above $3 as speculated previously. This is pretty bullish and could set us up for an upside break away gap higher on the open next week.
We started the week with a gap lower on the daily, weekly, monthly and yearly bar. When that was filled, it served as a MAJOR selling exhaustion formation at the bottom of a big move lower, where it's especially significant.
The market continued straight up all week after that with tiny interruptions/bull flag type formations
The middle red line was the price when the bullish EIA was released at 9:30am Thursday which launched us to a new price level from a tiny bull flag/wave/correction.
This was an extremely bullish week for natural gas WITHOUT much help from the weather.
https://tradingeconomics.com/commodity/natural-gas
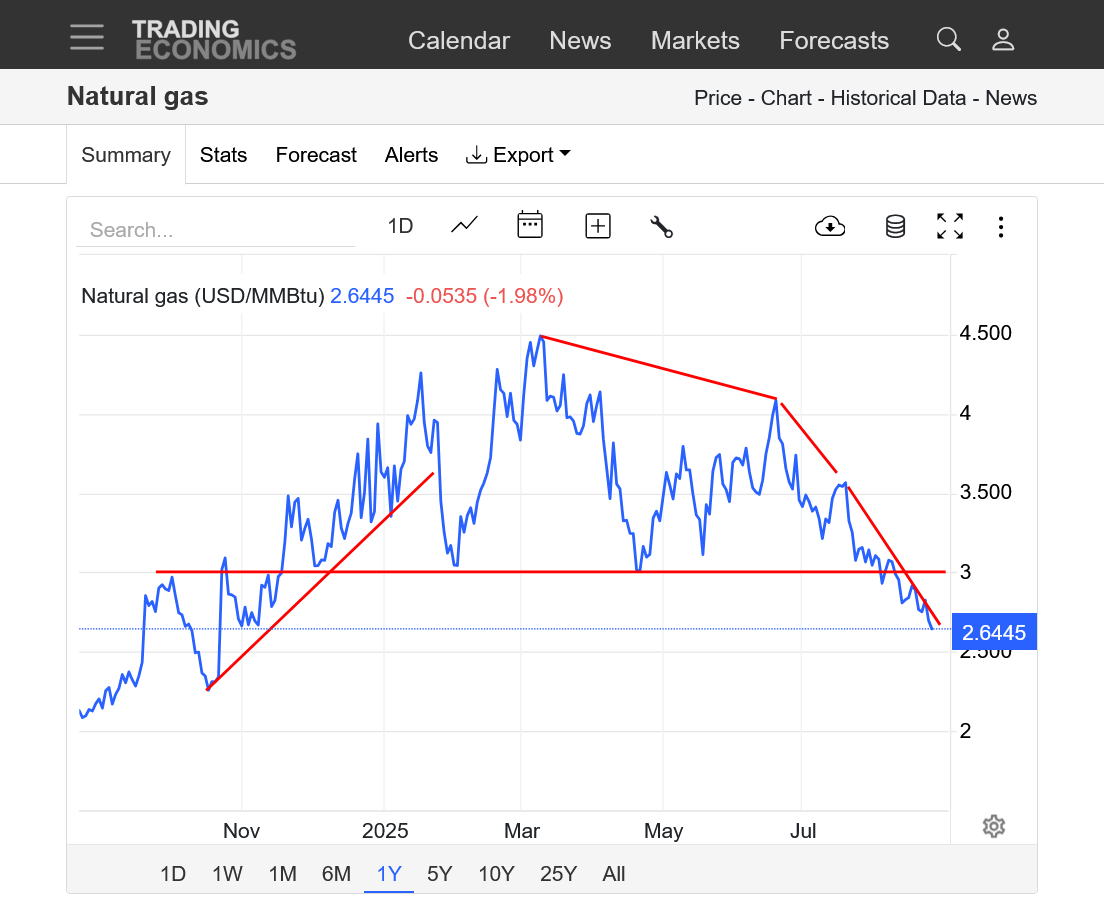
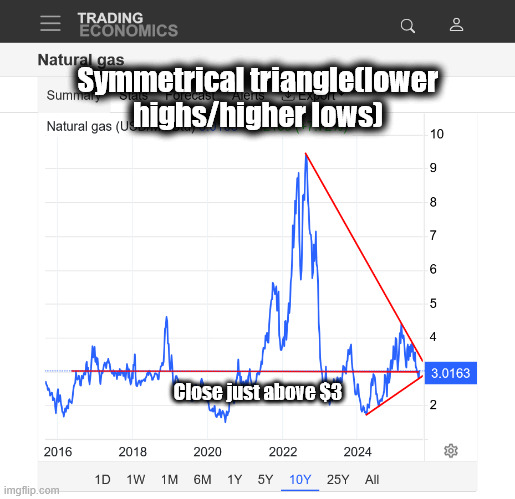
1. 1 month: Extremely bullish short term
2. 1 year: Potentially very bullish
3. 10 years: Still inside the symmetrical triangle even though the chart has flipped to bullish
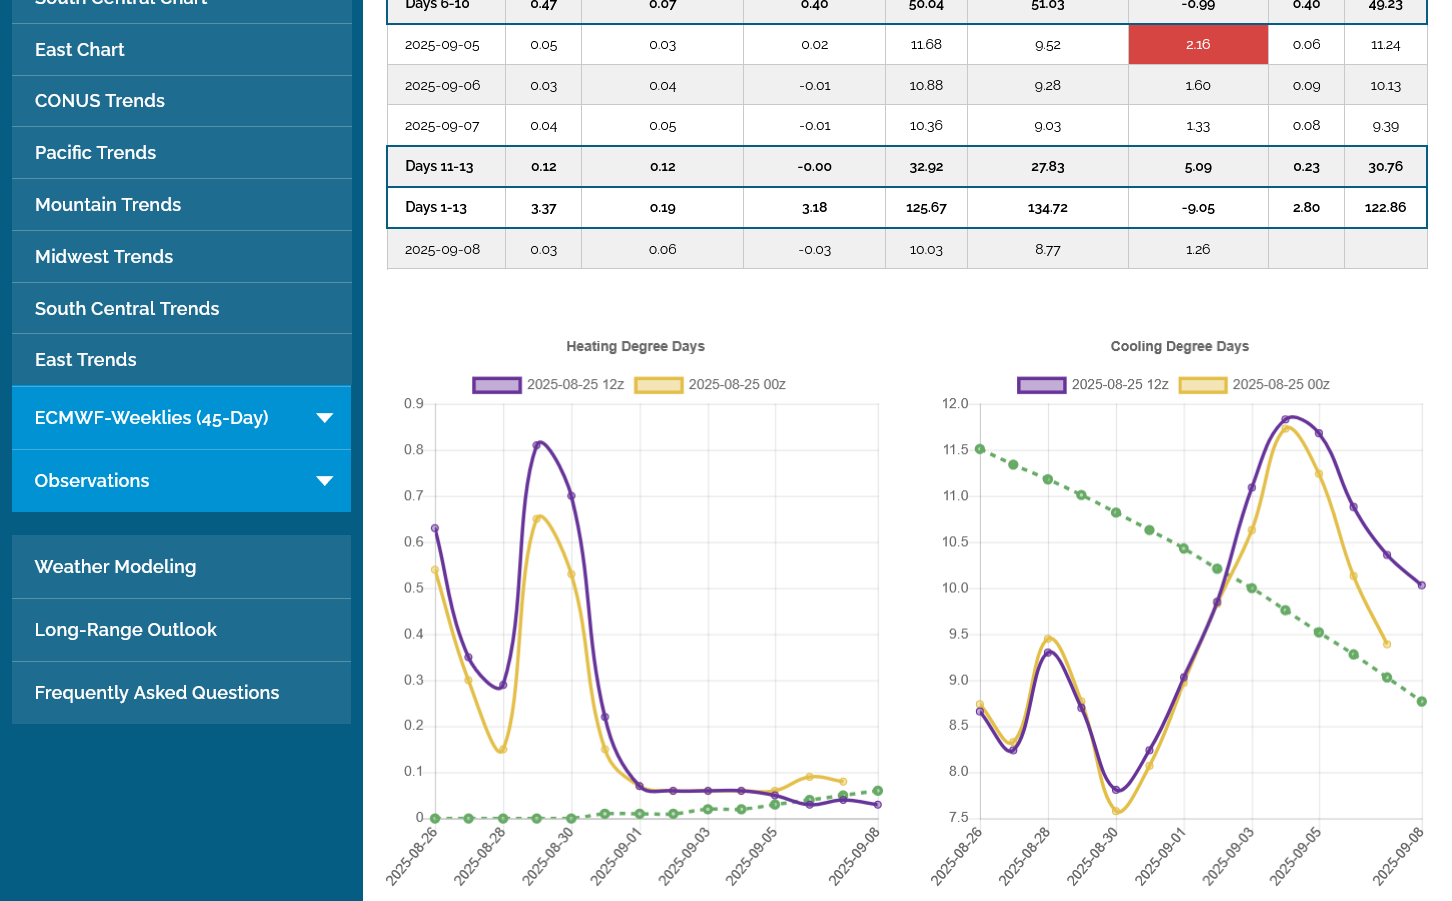
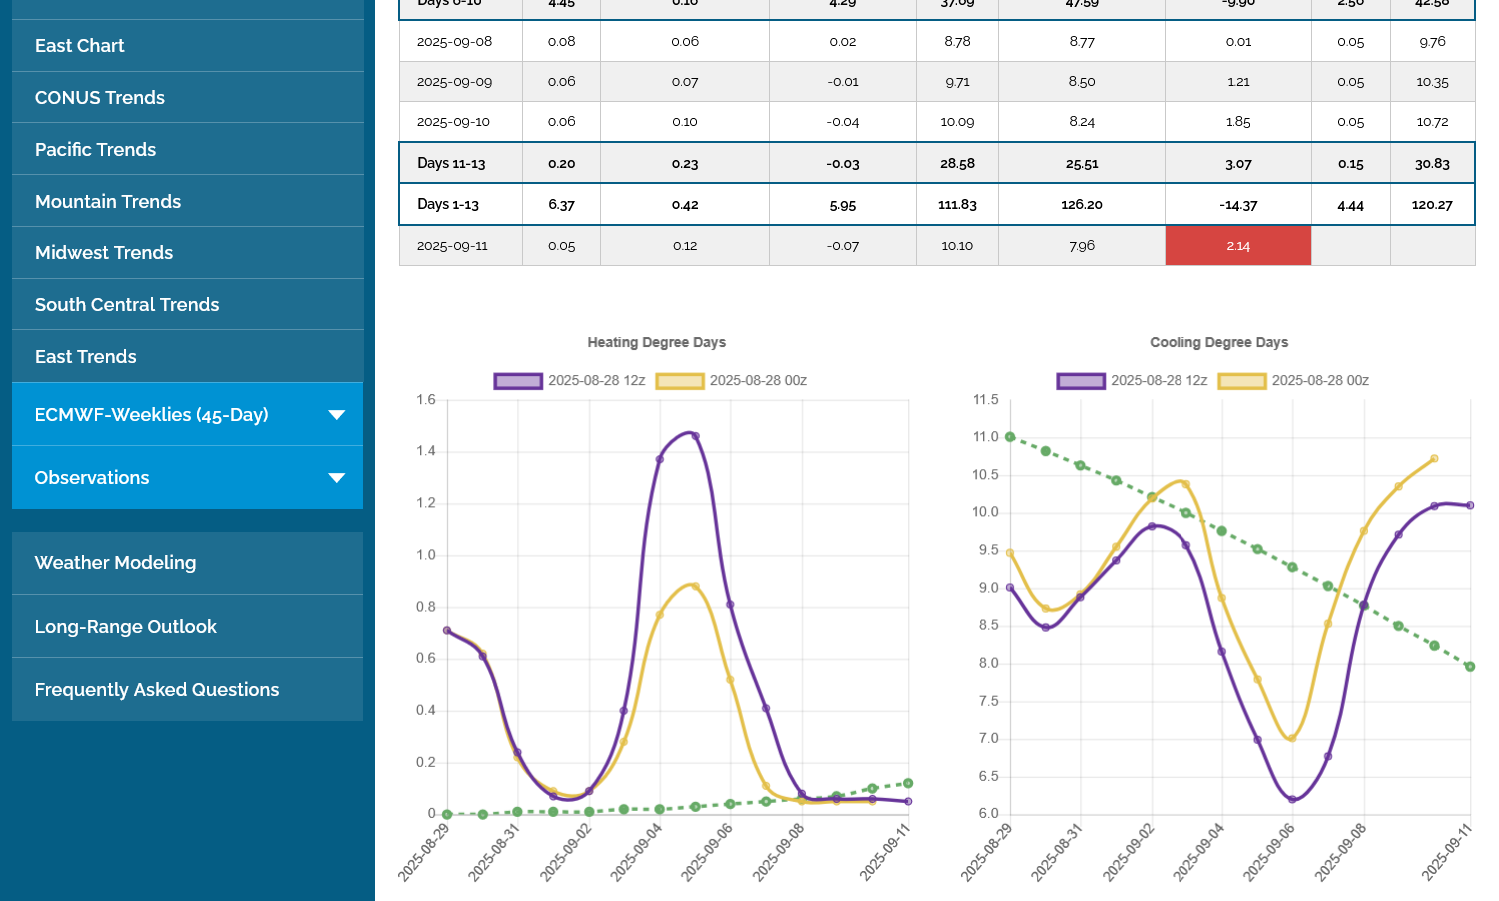
NG has been trading above $3, despite the last 0z European Ensemble model(purple/right) being -7 CDDs compared to the previous run 12 hours earlier(tan/right). This bearish solution did take us off the highs.
We should note that it’s so chilly that there are actually several,days with decent HDDs on the left for the Midwest and Northeast which is offsetting the bearish CCDs.

Horizontal red line=open Sunday Night
Down slope red line= after cooler 0z EE weather model, shown above came out
https://tradingeconomics.com/commodity/natural-gas
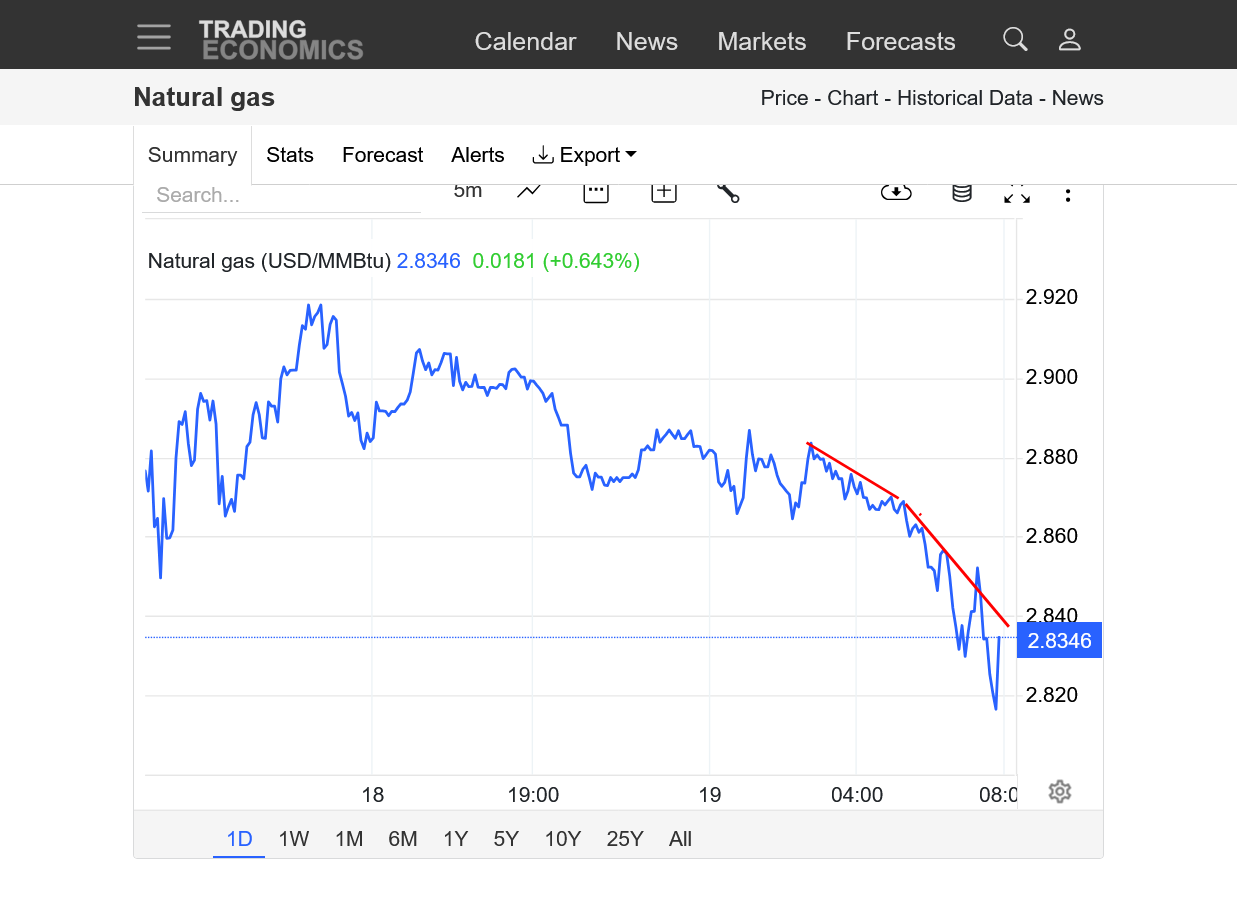
8am: Within a few minutes of that last post, NG plunged to new lows, more than $1,000/contract below the highs around midnight.
Noon: Right at 7am we had a massive selling at the market surge that caused the price to plunge straight down by $1,000/contract. This suggests a new group of (high volume daytime) traders, replacing the overnight (low volume) traders.
Volume since the open for the October contract below has only been 49,000, which is far less than average because of the holiday.
https://tradingeconomics.com/commodity/natural-gas
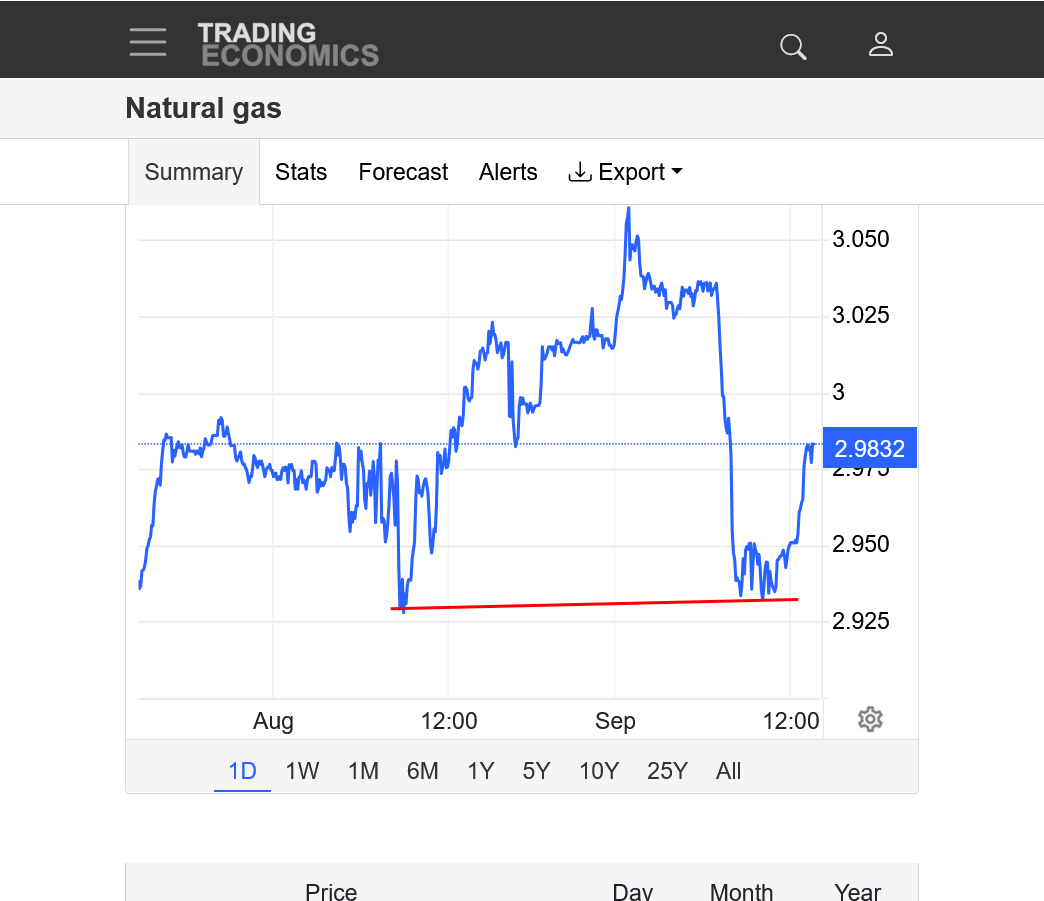
2pm: The market held support and closed just below $3. We closed early for Labor Day.
Incredibly cool for late August in the East last week for this Thursday's EIA storage report. Even a bit of heating and HDDs generated in the Upper Midwest.
We averaged -8 deg. F for the period and had 2 record cold mins. Pretty hard to do during this age of global warming. Winter is still pretty far off but if this is a pattern that repeats in 3+ months, the upcoming Winter will have some brutally cold, POLAR VORTEXES dropping into the northern US.
Same thing will happen late this week!
Unlike recent low/bullish numbers from this Summer's heat, this one should be robust, although the market traded this weeks ago.
https://www.cpc.ncep.noaa.gov/products/tanal/temp_analyses.php
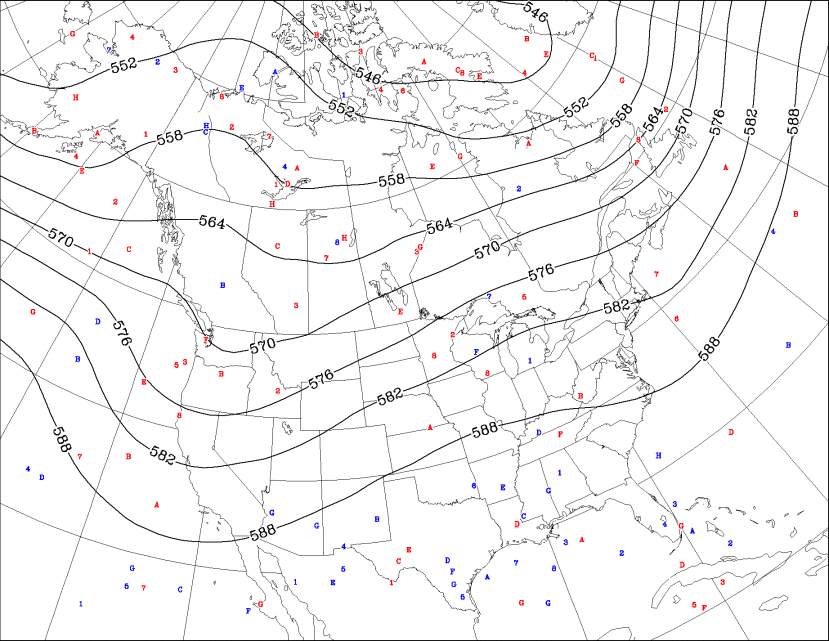
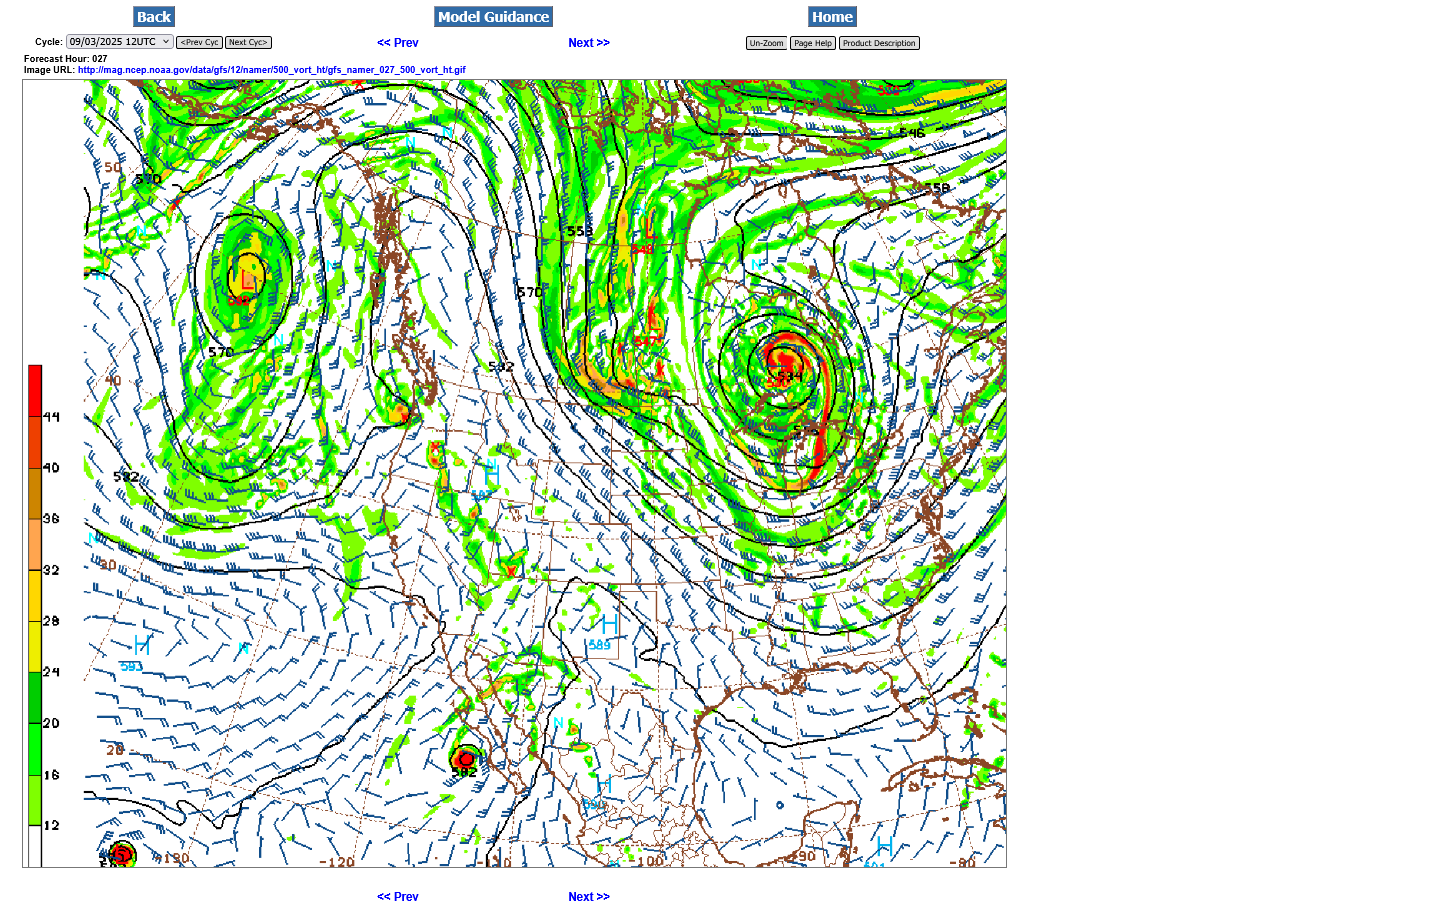
The map below is from the last 12z GFS operational model at 500 mb (18,00 feet) for Thursday morning. That deep low just north of Lake Superior is a huge piece of THE POLAR VORTEX!
We can see a huge kink in the lines, along the ND border with Canada from a strong perturbation/reinforcing wave with the colors representing powerful, positive vorticity(spin) associated with it. It's a strong reinforcement of this very chilly air that is rotating around the backside of the main/parent Low just north of Lake Superior.
This is more like a Winter pattern.
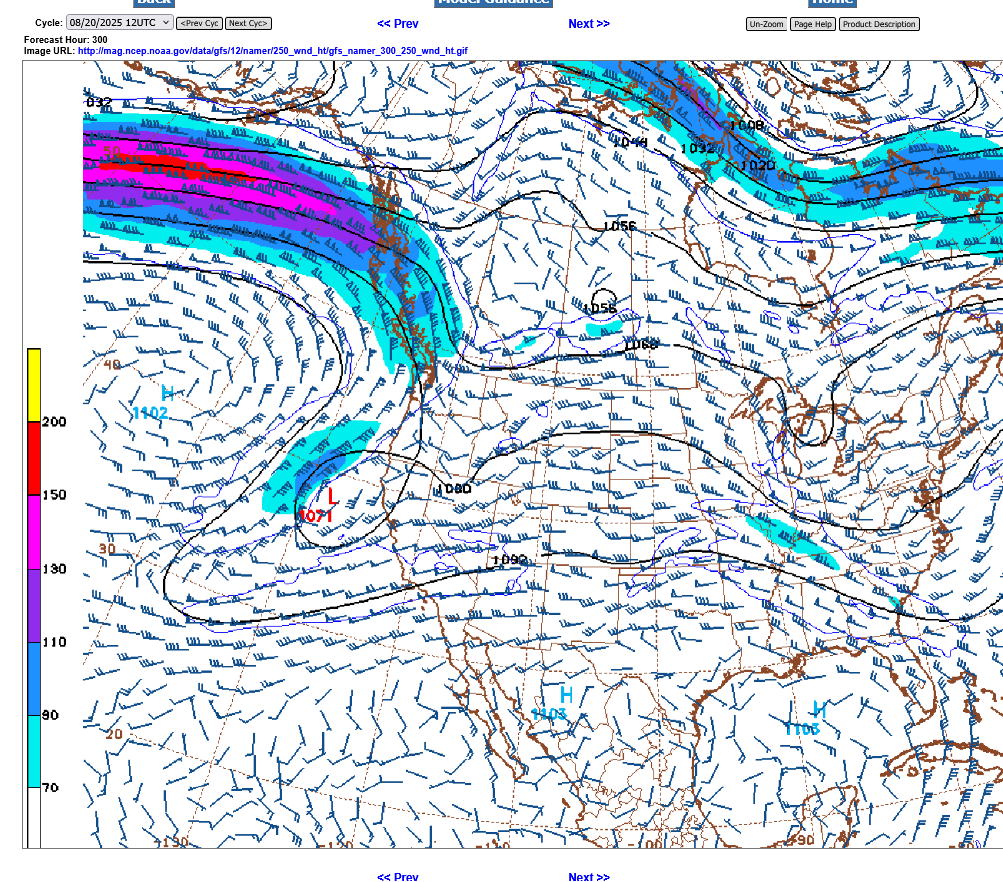
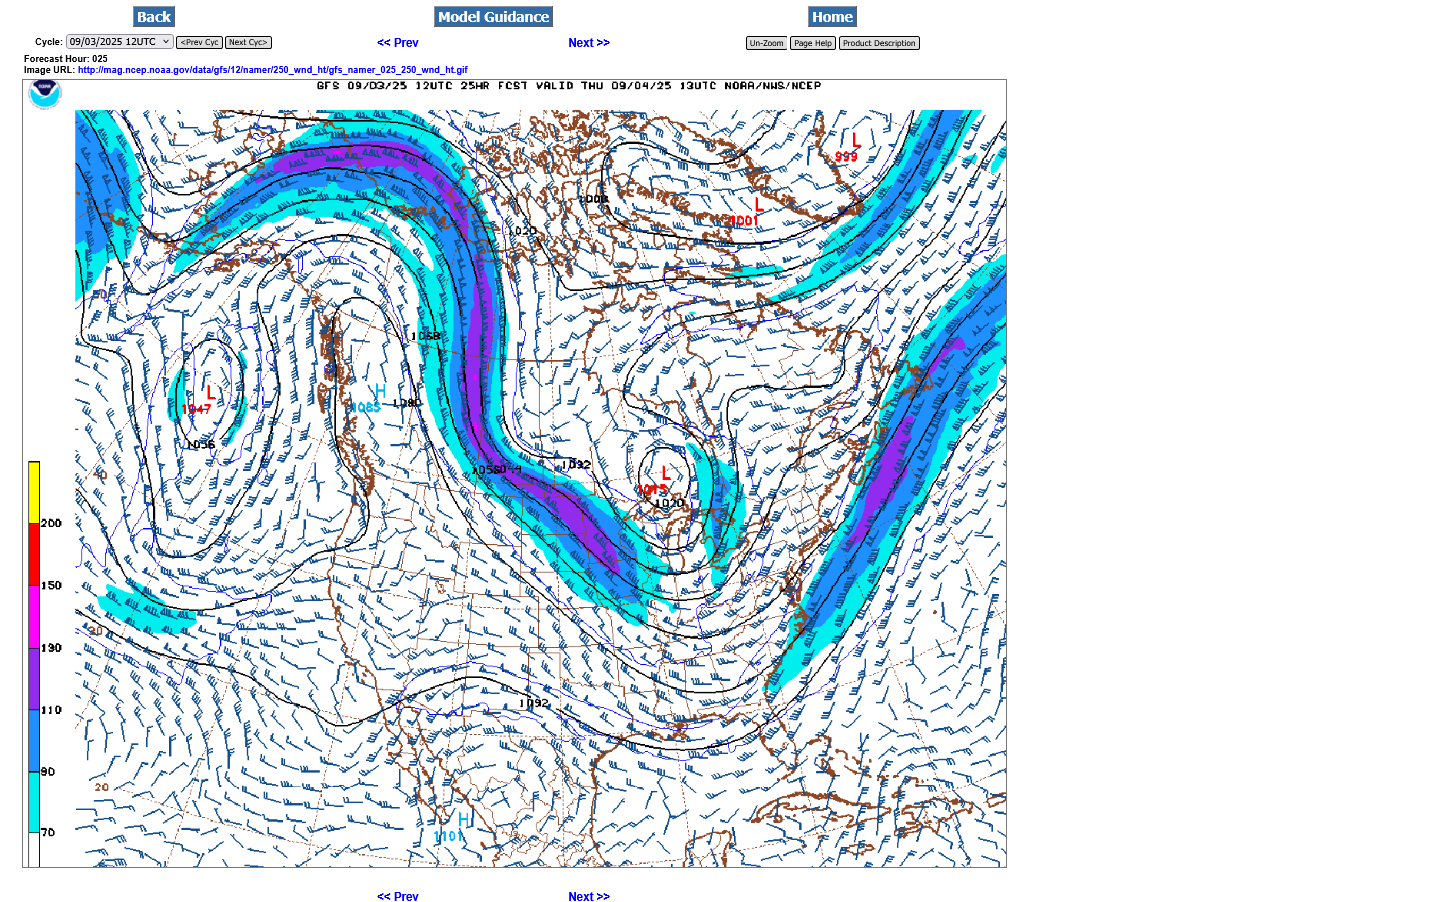
Here's the 250 jet stream(33,000 feet). Note it diving straight south/southeast, transporting air from much higher latitudes/the Arctic to the mid latitudes. The small pink color embedded within the jet stream represents a 150 mph jet streak!!
The piece of polar vortex at this level is also seen just north of Lake Superior.
A jet stream like this in 3+ months means brutally cold temps and a major Winter storm east of the trough line and/or associated with the lift from the jet stream dynamics. We can make out that kink in the isoheights that is northwest of the 500mb level, now much higher up, around the Alberta/ Saskatchewan border in Canada!
++++++++++++
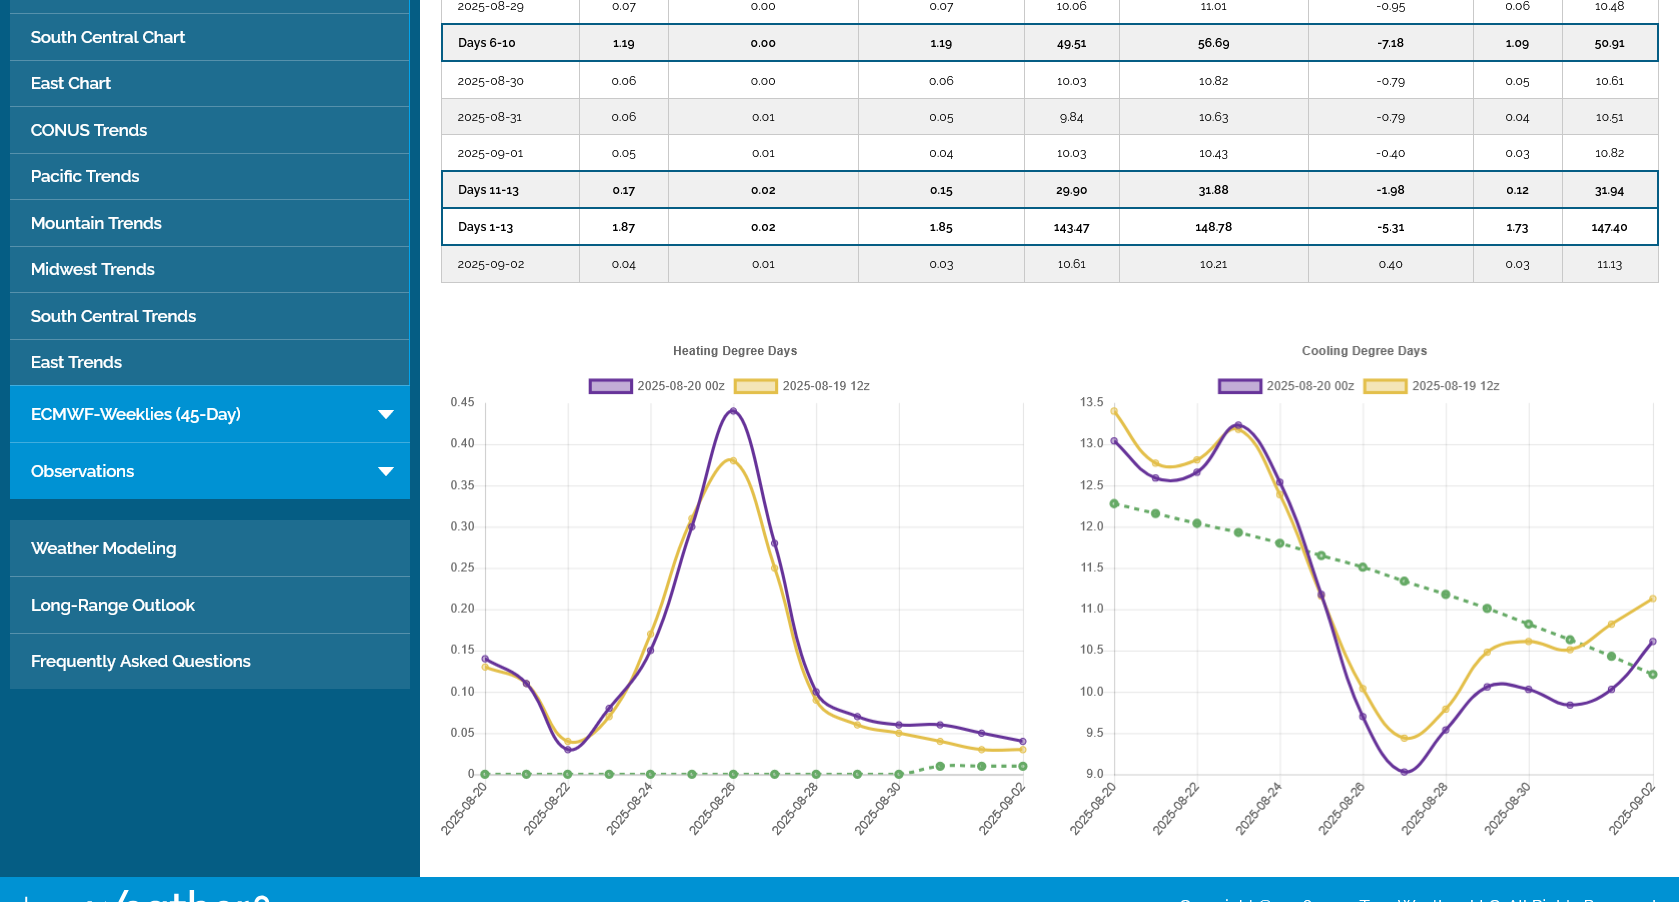
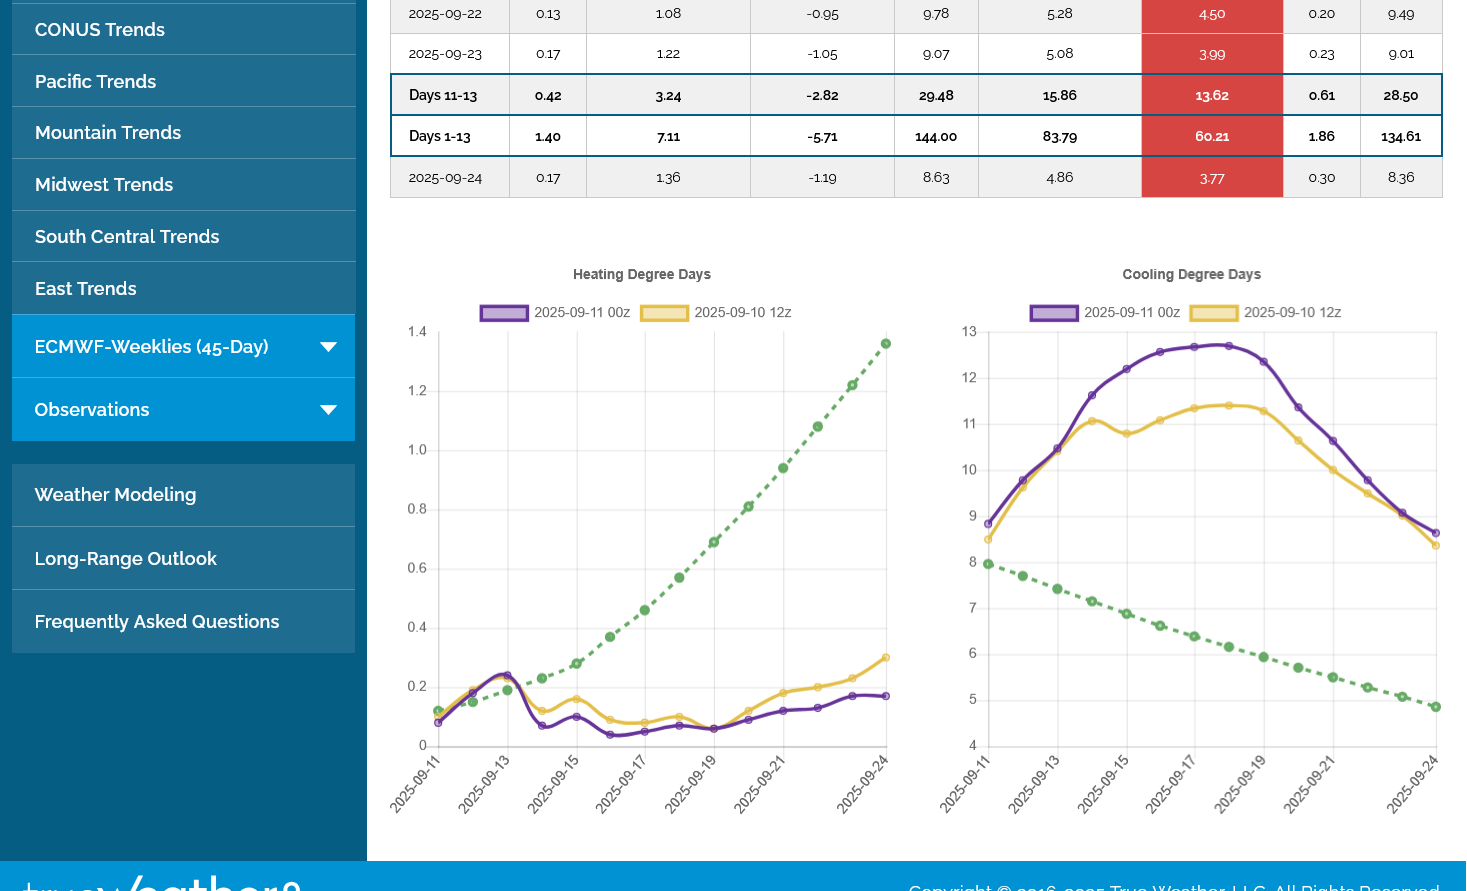
The last 12z European Enemble Mean CDDs in purple on the right are LESS/cooler thru day 10 but the last several data points are MUCH hotter, leading into week 3. Even before this, NG had already decided to go higher without the help of weather!
https://tradingeconomics.com/commodity/natural-gas
1. 1 month: MAJOR LOW as the market opened LAST week with a gap lower on the daily, weekly, monthly and yearly bar, then filled the gap because the selling was exhausted. Back above $3, +~$4,000/contract since then.
This source does not show gaps but the 2 red lines define it on the down/left side(where there was no trading-a gap). It was filled with active trading on the right............and we just kept going higher, when sellers pulled back and buyers placed market/aggressive orders.
2. 1 year. Back above key $3 level.
https://ir.eia.gov/ngs/ngs.html
+55 Bcf
![]()
for week ending August 29, 2025 | Released: September 4, 2025 at 10:30 a.m. | Next Release: September 11, 2025
| Working gas in underground storage, Lower 48 states Summary text CSV JSN | |||||||||||||||||||||||||
|---|---|---|---|---|---|---|---|---|---|---|---|---|---|---|---|---|---|---|---|---|---|---|---|---|---|
| Historical Comparisons | |||||||||||||||||||||||||
| Stocks billion cubic feet (Bcf) | Year ago (08/29/24) | 5-year average (2020-24) | |||||||||||||||||||||||
| Region | 08/29/25 | 08/22/25 | net change | implied flow | Bcf | % change | Bcf | % change | |||||||||||||||||
| East | 735 | 707 | 28 | 28 | 760 | -3.3 | 724 | 1.5 | |||||||||||||||||
| Midwest | 860 | 832 | 28 | 28 | 920 | -6.5 | 859 | 0.1 | |||||||||||||||||
| Mountain | 254 | 254 | 0 | 0 | 269 | -5.6 | 209 | 21.5 | |||||||||||||||||
| Pacific | 294 | 298 | -4 | -4 | 289 | 1.7 | 265 | 10.9 | |||||||||||||||||
| South Central | 1,129 | 1,125 | 4 | 4 | 1,107 | 2.0 | 1,041 | 8.5 | |||||||||||||||||
| Salt | 273 | 272 | 1 | 1 | 268 | 1.9 | 248 | 10.1 | |||||||||||||||||
| Nonsalt | 856 | 853 | 3 | 3 | 839 | 2.0 | 794 | 7.8 | |||||||||||||||||
| Total | 3,272 | 3,217 | 55 | 55 | 3,345 | -2.2 | 3,099 | 5.6 | |||||||||||||||||
| Totals may not equal sum of components because of independent rounding. | |||||||||||||||||||||||||
Working gas in storage was 3,272 Bcf as of Friday, August 29, 2025, according to EIA estimates. This represents a net increase of 55 Bcf from the previous week. Stocks were 73 Bcf less than last year at this time and 173 Bcf above the five-year average of 3,099 Bcf. At 3,272 Bcf, total working gas is within the five-year historical range.
For information on sampling error in this report, see Estimated Measures of Sampling Variability table below.
Note: The shaded area indicates the range between the historical minimum and maximum values for the weekly series from 2020 through 2024. The dashed vertical lines indicate current and year-ago weekly periods.
++++++++++++++++
https://tradingeconomics.com/commodity/natural-gas
1. 1 day: Spike down then back up after the release of the EIA data
2. 1 year: Major bottom(with the gap and crap formation/reversal up described previously). Solidly above $3. Also breaking the downtrend channel from since we hit our June/Summer highs.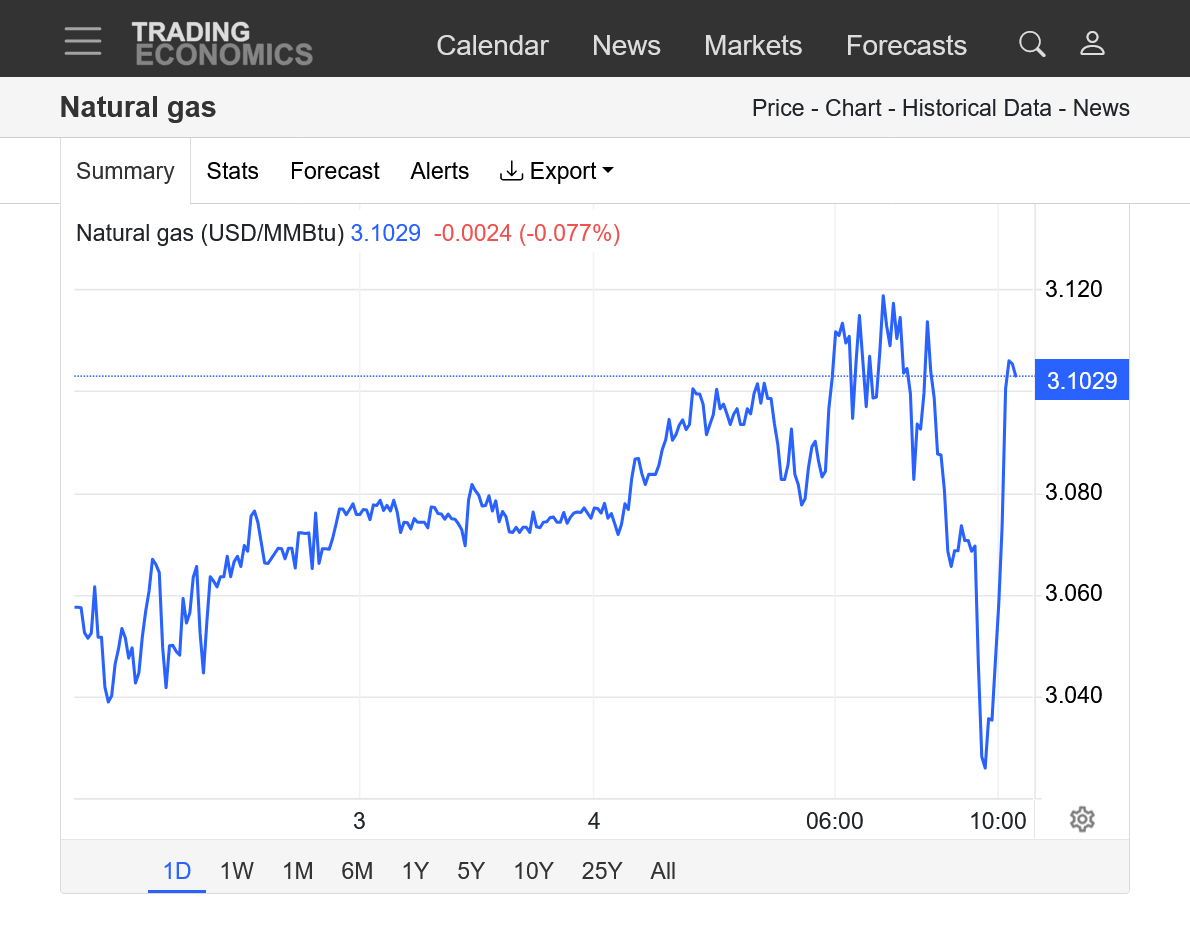
++++++++++++
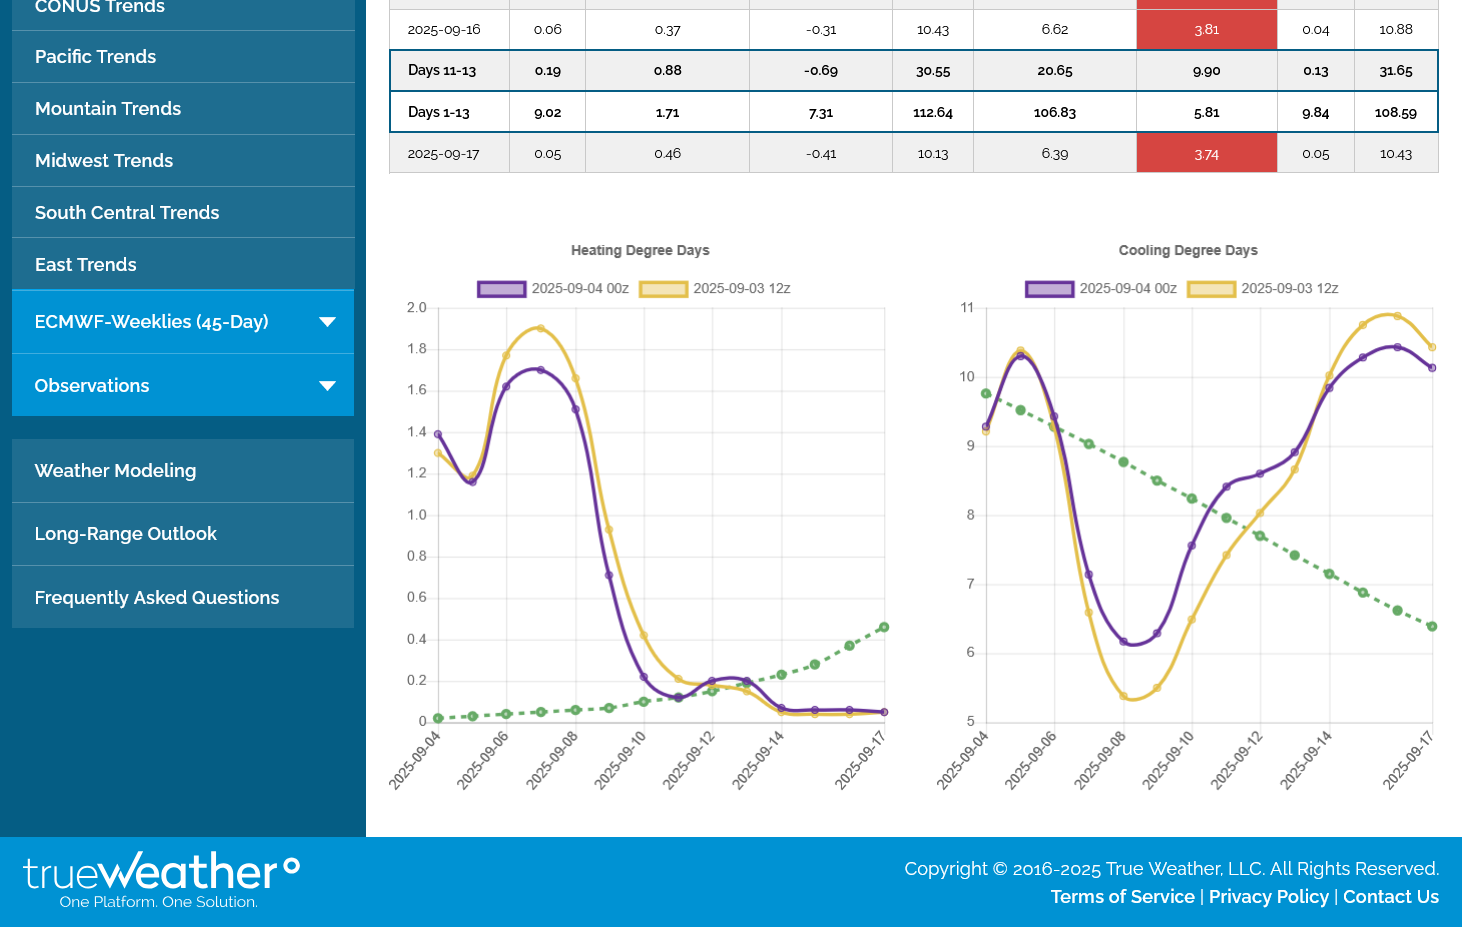
+4 CDDs on the 0z EE model in purple compared to the previous run BUT LOOK AT THE TRAJECTORY of week 2, straight up at a time when CDDs, normally have their steepest drops of the season(dashed green line). So there will be unusually high cooling demand COMPARED TO AVERAGE in mid September. Regardless, September weather is usually not a powerful force for price determination in the natural gas market and this is just 1 bullish part of why prices have bottomed and are now +$3 again.
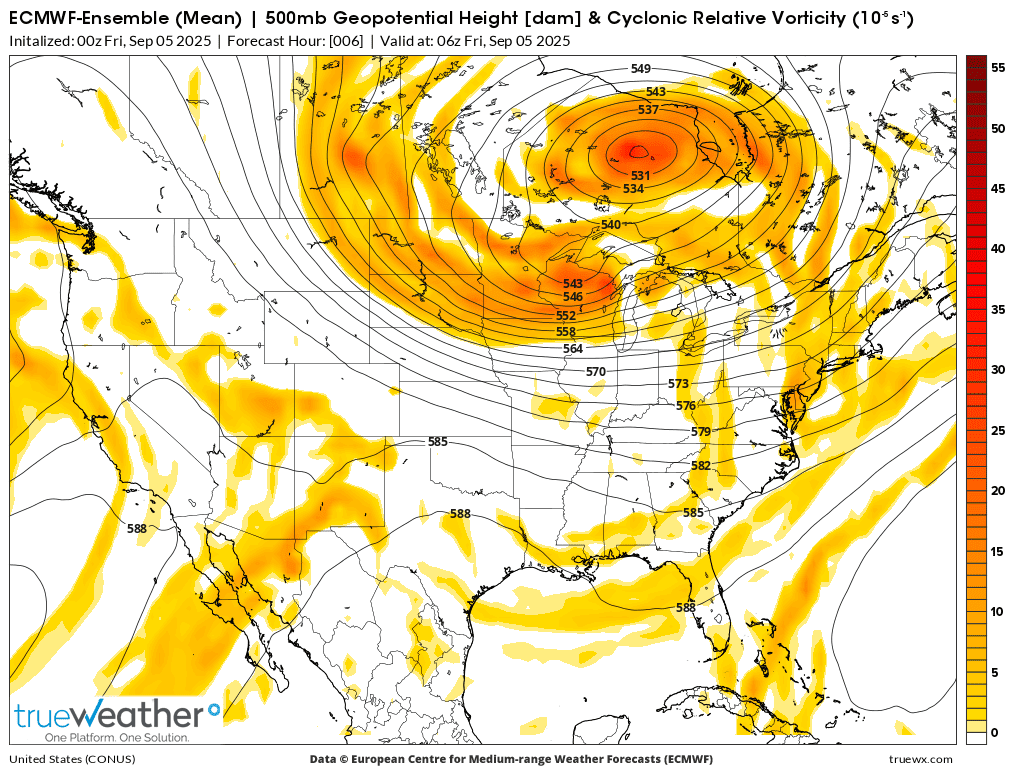
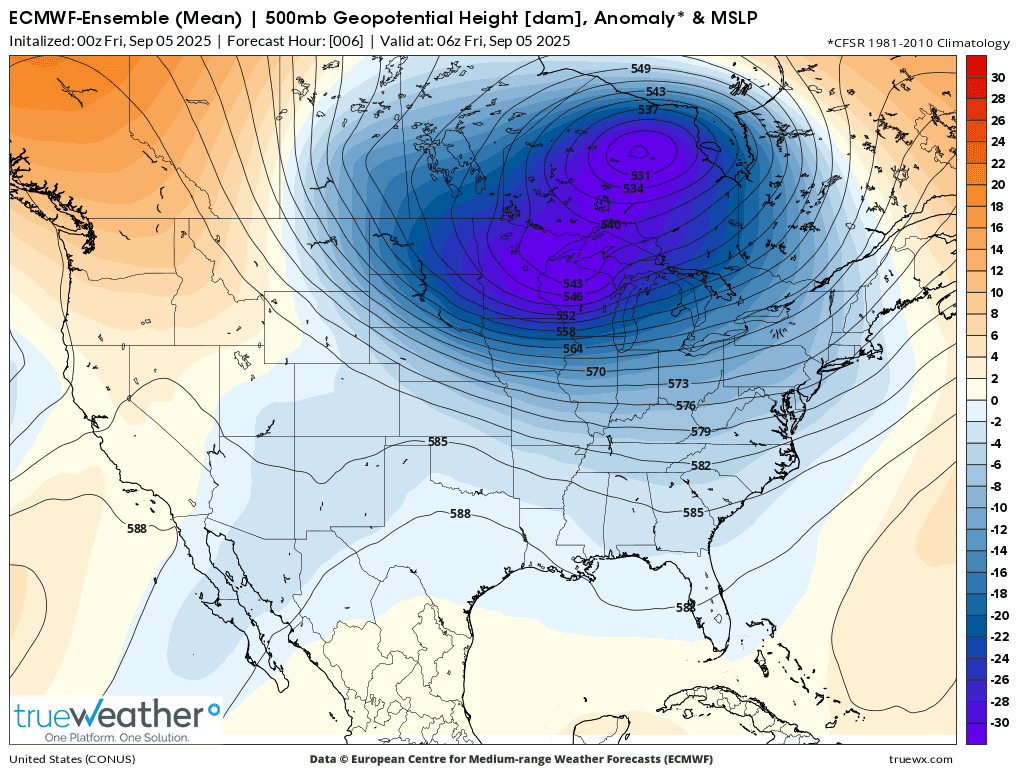
Here's the European Ensemble model at 500 mb.
1. Vorticity/spin. Spokes of vorticity rotating around the backside of the DEEP Low(north of Lake Superior) are a reinforcement of this near record ARCTIC cold.
2. Departure from average for September 5th. This is a COLD SEASON pattern with the polar vortex displaced extremely far south!
+++++++++++++++++++++++++++
3. GEFS 850 temperature departures. A huge chunk/blob of Arctic air has been displaced/transported far southward!
4. Same map. Forecast for 10 days.
Current temp anomalies GEFS
Day 10 temp anomalies below GEFS-complete opposite of the current temps above
https://www.cpc.ncep.noaa.gov/products/predictions/threats/temp_probhazards_d8_14_contours.png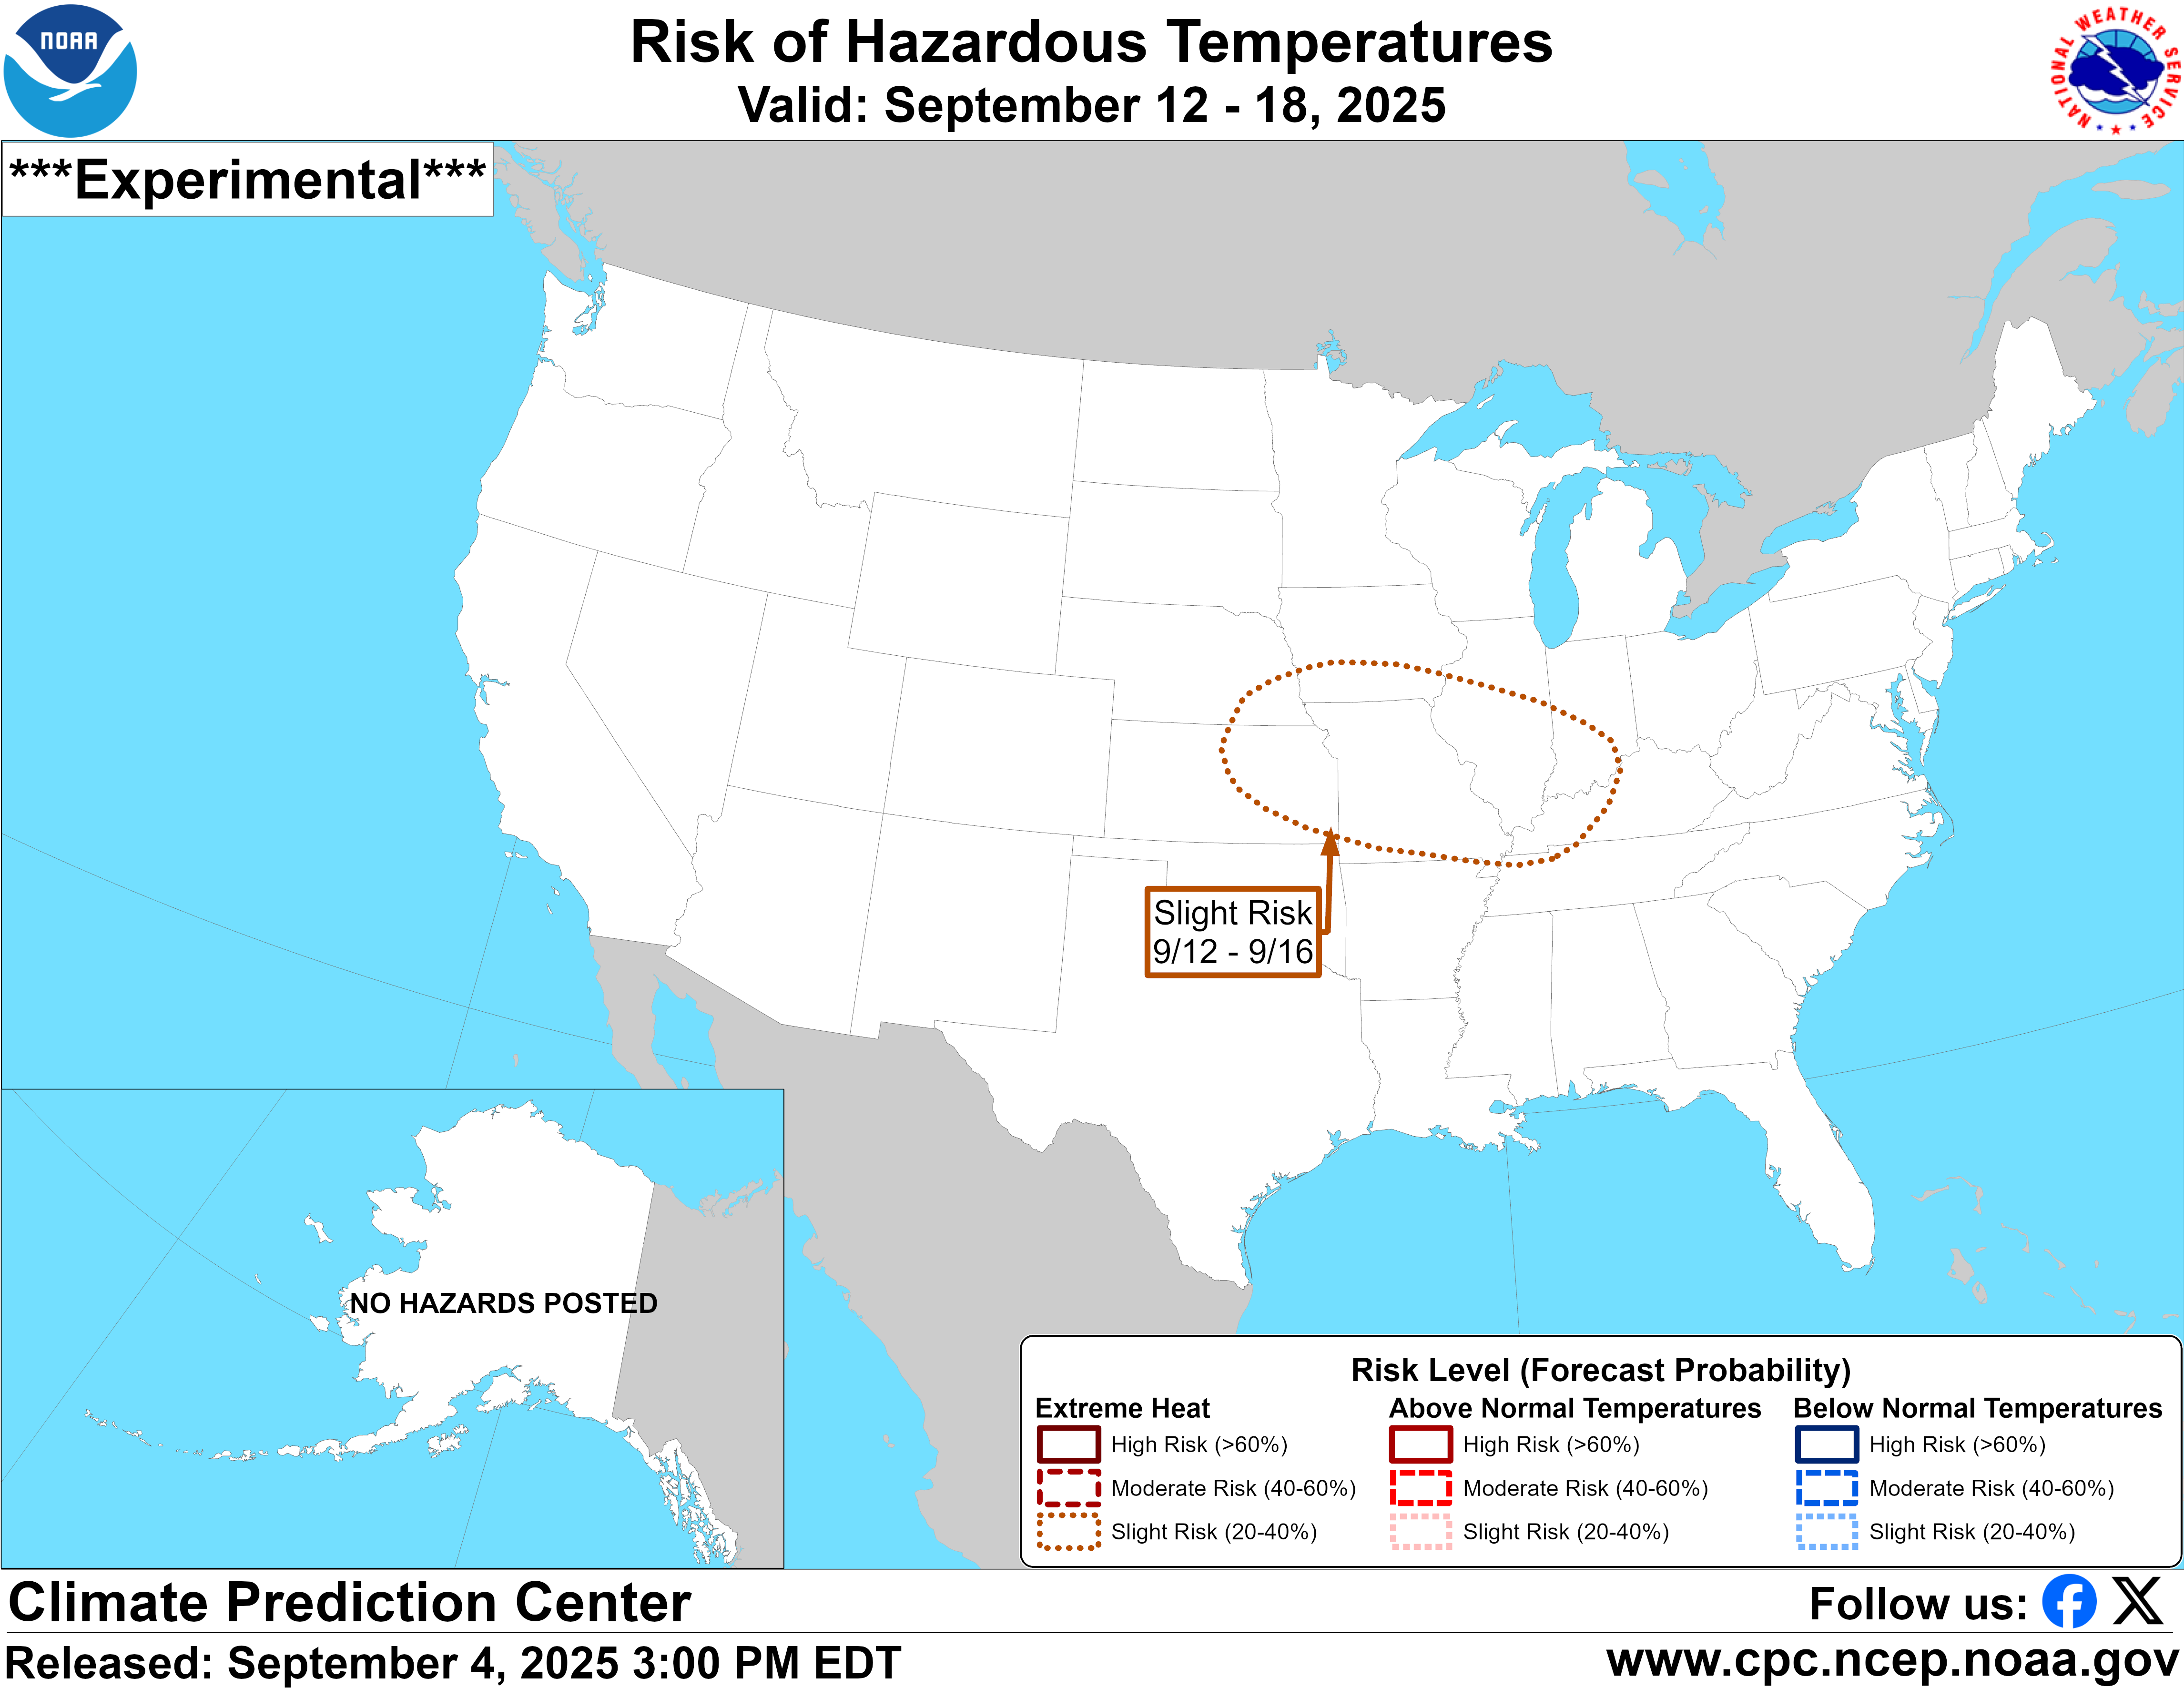
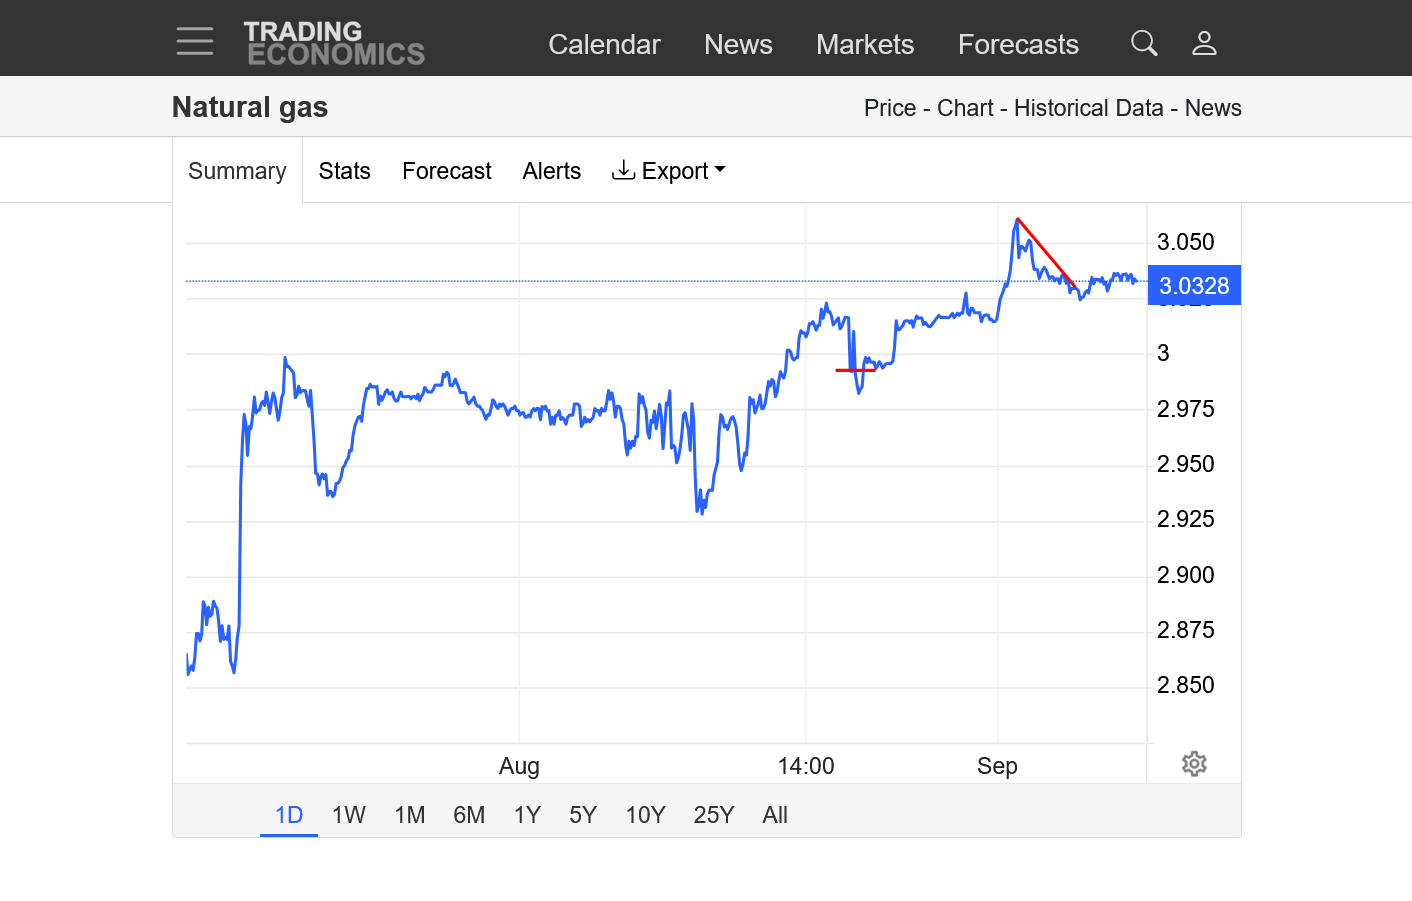
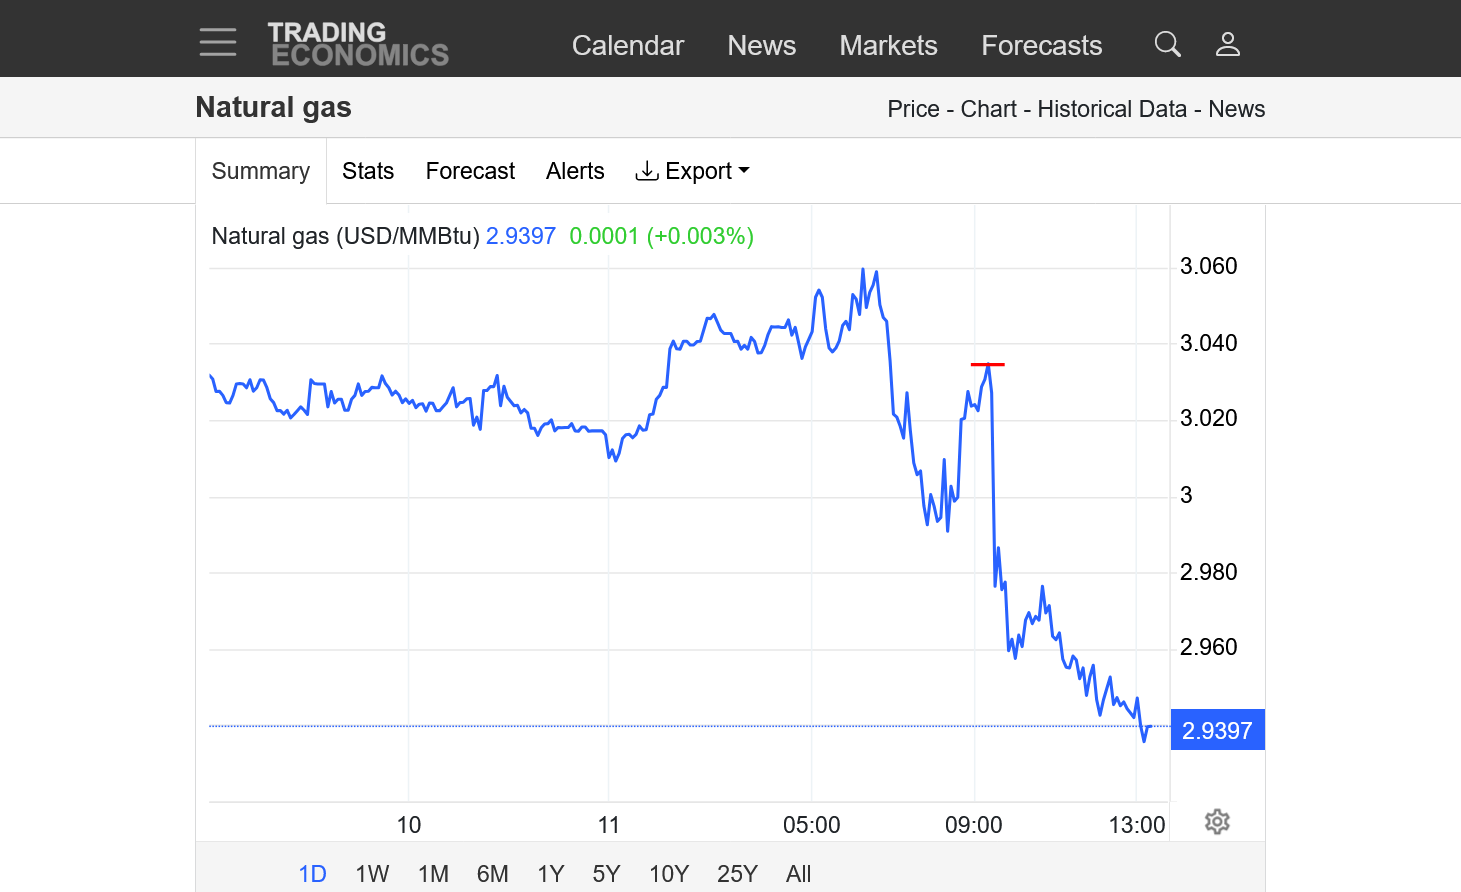
Late season heat wave gave natural gas a spike up in prices early today with a close $1,000/contract off the highs.

The last 12z European Ensemble run in purple/right not AS bullish as the previous solution from 12 hours earlier (-6.5 CDDs) but we can see how much above the average CDDs will be the next 2 weeks.
The dashed green line is plunging as this is the period of time when seasonal CDDs, historically have their biggest drop. This is also why we are getting close to the period when we often see the biggest injections because both CDDs AND HDDs are usually not very much. The green line on the left for increasing HDDs is deceptive because the scale amplifies them X 10 compared to the scale on the right (so that we can see them better).
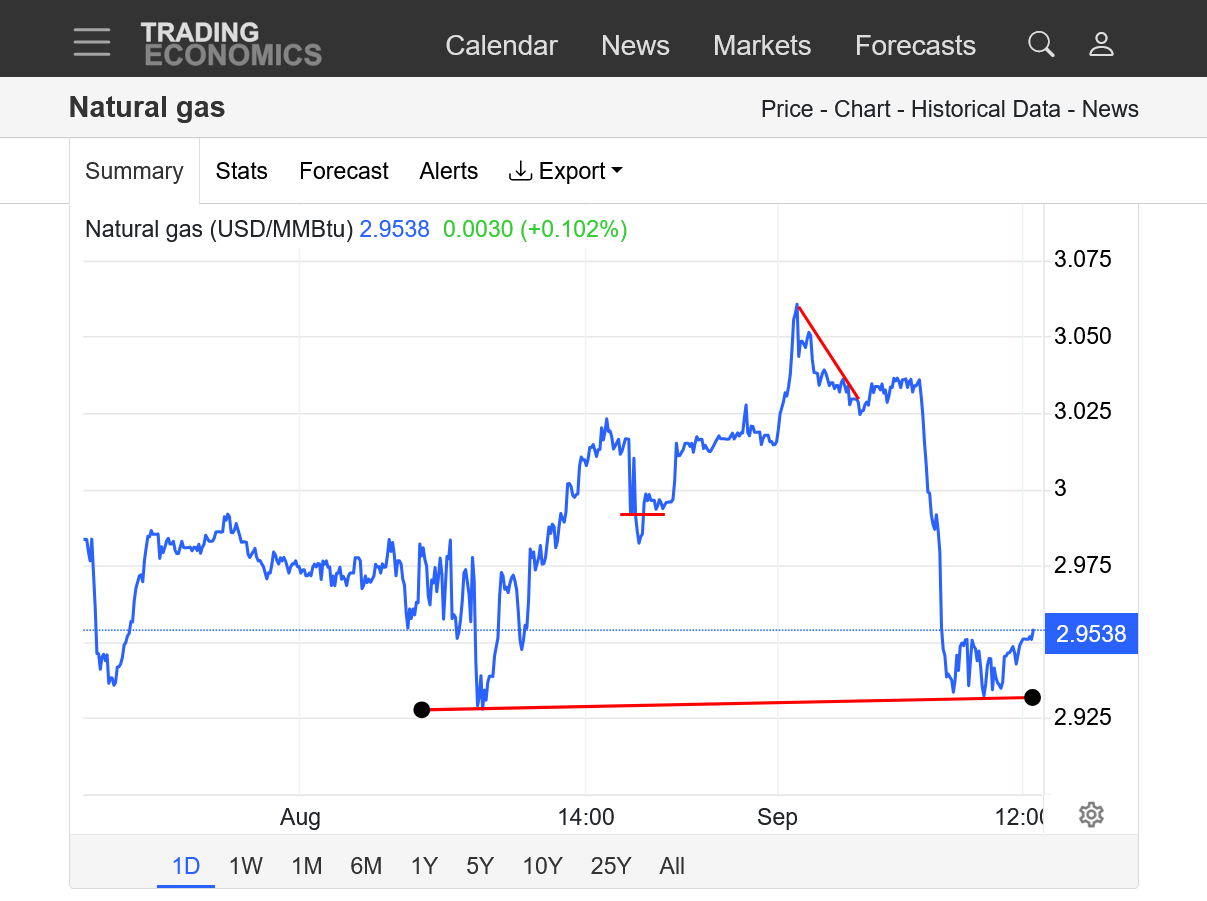
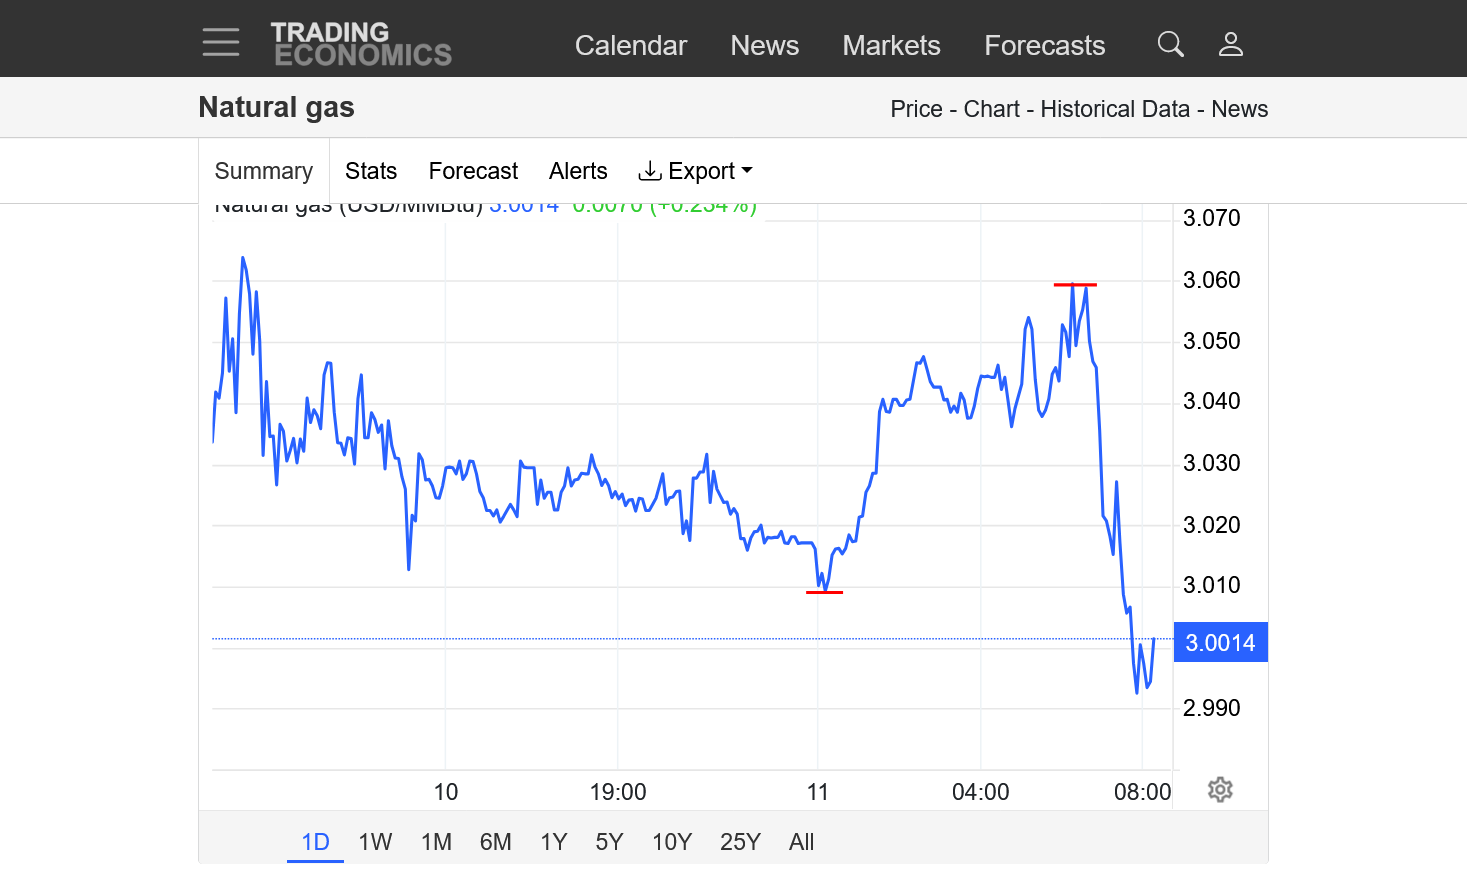
The overnight, 0z European Ensemble model(purple/right) had a whopping +9 CDDs vs the 12 run from 12 hours earlier. This caused modestly higher prices for several hours with small type overnight traders.
Shortly after 6am, when the huge traders typically show up, they aggressively sold NG, which is now around $3. Evidence that this big heat wave was fully dialed into prices last week!
1. Low put in just before the 0z guidance came in much warmer, which rallied prices overnight.
2. Price peaked just after 6am this morning, now we're right at $3.
++++++++++++++
Temperatures last week were next record cool in the East, with a lot of high population density centers. Hot in the West, especially Northwest. Should be a robust injection at 9:30 am form the EIA.
https://www.cpc.ncep.noaa.gov/products/tanal/temp_analyses.php
![]()
https://ir.eia.gov/ngs/ngs.html
for week ending September 5, 2025 | Released: September 11, 2025 at 10:30 a.m. | Next Release: September 18, 2025
| Working gas in underground storage, Lower 48 states Summary text CSV JSN | |||||||||||||||||||||||||
|---|---|---|---|---|---|---|---|---|---|---|---|---|---|---|---|---|---|---|---|---|---|---|---|---|---|
| Historical Comparisons | |||||||||||||||||||||||||
| Stocks billion cubic feet (Bcf) | Year ago (09/05/24) | 5-year average (2020-24) | |||||||||||||||||||||||
| Region | 09/05/25 | 08/29/25 | net change | implied flow | Bcf | % change | Bcf | % change | |||||||||||||||||
| East | 757 | 735 | 22 | 22 | 777 | -2.6 | 743 | 1.9 | |||||||||||||||||
| Midwest | 890 | 860 | 30 | 30 | 946 | -5.9 | 888 | 0.2 | |||||||||||||||||
| Mountain | 257 | 254 | 3 | 3 | 273 | -5.9 | 213 | 20.7 | |||||||||||||||||
| Pacific | 293 | 294 | -1 | -1 | 286 | 2.4 | 266 | 10.2 | |||||||||||||||||
| South Central | 1,145 | 1,129 | 16 | 16 | 1,099 | 4.2 | 1,046 | 9.5 | |||||||||||||||||
| Salt | 282 | 273 | 9 | 9 | 266 | 6.0 | 248 | 13.7 | |||||||||||||||||
| Nonsalt | 863 | 856 | 7 | 7 | 833 | 3.6 | 798 | 8.1 | |||||||||||||||||
| Total | 3,343 | 3,272 | 71 | 71 | 3,381 | -1.1 | 3,155 | 6.0 | |||||||||||||||||
| Totals may not equal sum of components because of independent rounding. | |||||||||||||||||||||||||
Working gas in storage was 3,343 Bcf as of Friday, September 5, 2025, according to EIA estimates. This represents a net increase of 71 Bcf from the previous week. Stocks were 38 Bcf less than last year at this time and 188 Bcf above the five-year average of 3,155 Bcf. At 3,343 Bcf, total working gas is within the five-year historical range.
For information on sampling error in this report, see Estimated Measures of Sampling Variability table below.
Note: The shaded area indicates the range between the historical minimum and maximum values for the weekly series from 2020 through 2024. The dashed vertical lines indicate current and year-ago weekly periods.
+++++++++++++++++++
NG spiked lower on the release, seen below with the red line(that was more than expected-but we suspected a high number was coming out) and has been under pressure since then! Now -$850 $900/contract lower compared to the close yesterday. Amount in storage, seen above is still ABOVE the 5 year average but is slightly below last year, 2024.
https://tradingeconomics.com/commodity/natural-gas
Heat in the center of the country last week. Cool in the Southeast.
I apologize for using the WRONG temperature anomaly map previously. The correct one is below related to the EXTREMELY anomalous cool pattern the first half of September(and record quiet tropics at the same time).
This would cause a massive storage injection/bearish!
https://www.cpc.ncep.noaa.gov/products/tanal/temp_analyses.php
This must be a record large injection for early September!! + 90 Bcf.
https://ir.eia.gov/ngs/ngs.html
![]()
for week ending September 12, 2025 | Released: September 18, 2025 at 10:30 a.m. | Next Release: September 25, 2025
| Working gas in underground storage, Lower 48 states Summary text CSV JSN | |||||||||||||||||||||||||
|---|---|---|---|---|---|---|---|---|---|---|---|---|---|---|---|---|---|---|---|---|---|---|---|---|---|
| Historical Comparisons | |||||||||||||||||||||||||
| Stocks billion cubic feet (Bcf) | Year ago (09/12/24) | 5-year average (2020-24) | |||||||||||||||||||||||
| Region | 09/12/25 | 09/05/25 | net change | implied flow | Bcf | % change | Bcf | % change | |||||||||||||||||
| East | 781 | 757 | 24 | 24 | 799 | -2.3 | 765 | 2.1 | |||||||||||||||||
| Midwest | 920 | 890 | 30 | 30 | 970 | -5.2 | 917 | 0.3 | |||||||||||||||||
| Mountain | 261 | 257 | 4 | 4 | 275 | -5.1 | 216 | 20.8 | |||||||||||||||||
| Pacific | 297 | 293 | 4 | 4 | 283 | 4.9 | 266 | 11.7 | |||||||||||||||||
| South Central | 1,174 | 1,145 | 29 | 29 | 1,109 | 5.9 | 1,065 | 10.2 | |||||||||||||||||
| Salt | 294 | 282 | 12 | 12 | 270 | 8.9 | 255 | 15.3 | |||||||||||||||||
| Nonsalt | 879 | 863 | 16 | 16 | 839 | 4.8 | 810 | 8.5 | |||||||||||||||||
| Total | 3,433 | 3,343 | 90 | 90 | 3,437 | -0.1 | 3,229 | 6.3 | |||||||||||||||||
| Totals may not equal sum of components because of independent rounding. | |||||||||||||||||||||||||
Working gas in storage was 3,433 Bcf as of Friday, September 12, 2025, according to EIA estimates. This represents a net increase of 90 Bcf from the previous week. Stocks were 4 Bcf less than last year at this time and 204 Bcf above the five-year average of 3,229 Bcf. At 3,433 Bcf, total working gas is within the five-year historical range.
For information on sampling error in this report, see Estimated Measures of Sampling Variability table below.
Note: The shaded area indicates the range between the historical minimum and maximum values for the weekly series from 2020 through 2024. The dashed vertical lines indicate current and year-ago weekly periods.
https://tradingeconomics.com/commodity/natural-gas
1. 1 week: The red line was the price when the EIA report was released.
2. 1 month: Approaching support after topping yesterday morning at 7am.
3. 1 year: Spike high from cold early this year, then a downtrend. Potential bear flag recently? Below key $3 support with this plunge lower.
4. 10 years: Potential symmetrical triangle??? Just below $3 support.
Some major heat in the middle of the country last week. Last of the coolness in the far Southeast.
https://www.cpc.ncep.noaa.gov/products/tanal/temp_analyses.php
![]()
for week ending September 19, 2025 | Released: September 25, 2025 at 10:30 a.m. | Next Release: October 2, 2025
| Working gas in underground storage, Lower 48 states Summary text CSV JSN | |||||||||||||||||||||||||
|---|---|---|---|---|---|---|---|---|---|---|---|---|---|---|---|---|---|---|---|---|---|---|---|---|---|
| Historical Comparisons | |||||||||||||||||||||||||
| Stocks billion cubic feet (Bcf) | Year ago (09/19/24) | 5-year average (2020-24) | |||||||||||||||||||||||
| Region | 09/19/25 | 09/12/25 | net change | implied flow | Bcf | % change | Bcf | % change | |||||||||||||||||
| East | 807 | 781 | 26 | 26 | 816 | -1.1 | 788 | 2.4 | |||||||||||||||||
| Midwest | 945 | 920 | 25 | 25 | 990 | -4.5 | 945 | 0.0 | |||||||||||||||||
| Mountain | 266 | 261 | 5 | 5 | 278 | -4.3 | 221 | 20.4 | |||||||||||||||||
| Pacific | 300 | 297 | 3 | 3 | 288 | 4.2 | 270 | 11.1 | |||||||||||||||||
| South Central | 1,190 | 1,174 | 16 | 16 | 1,113 | 6.9 | 1,081 | 10.1 | |||||||||||||||||
| Salt | 299 | 294 | 5 | 5 | 265 | 12.8 | 259 | 15.4 | |||||||||||||||||
| Nonsalt | 890 | 879 | 11 | 11 | 848 | 5.0 | 822 | 8.3 | |||||||||||||||||
| Total | 3,508 | 3,433 | 75 | 75 | 3,486 | 0.6 | 3,305 | 6.1 | |||||||||||||||||
| Totals may not equal sum of components because of independent rounding. | |||||||||||||||||||||||||
Working gas in storage was 3,508 Bcf as of Friday, September 19, 2025, according to EIA estimates. This represents a net increase of 75 Bcf from the previous week. Stocks were 22 Bcf higher than last year at this time and 203 Bcf above the five-year average of 3,305 Bcf. At 3,508 Bcf, total working gas is within the five-year historical range.
For information on sampling error in this report, see Estimated Measures of Sampling Variability table below.
Note: The shaded area indicates the range between the historical minimum and maximum values for the weekly series from 2020 through 2024. The dashed vertical lines indicate current and year-ago weekly periods.
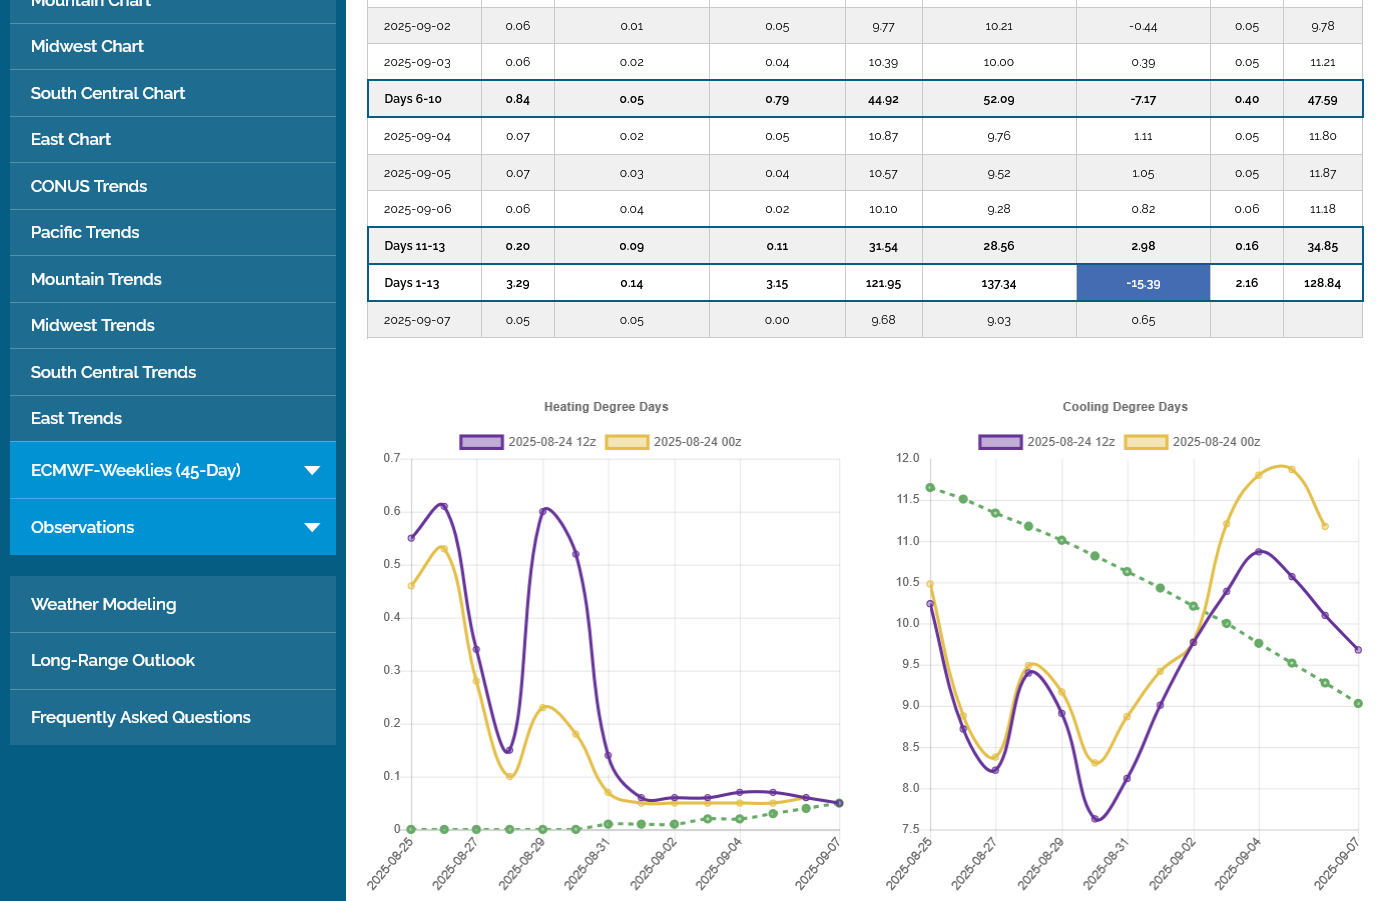
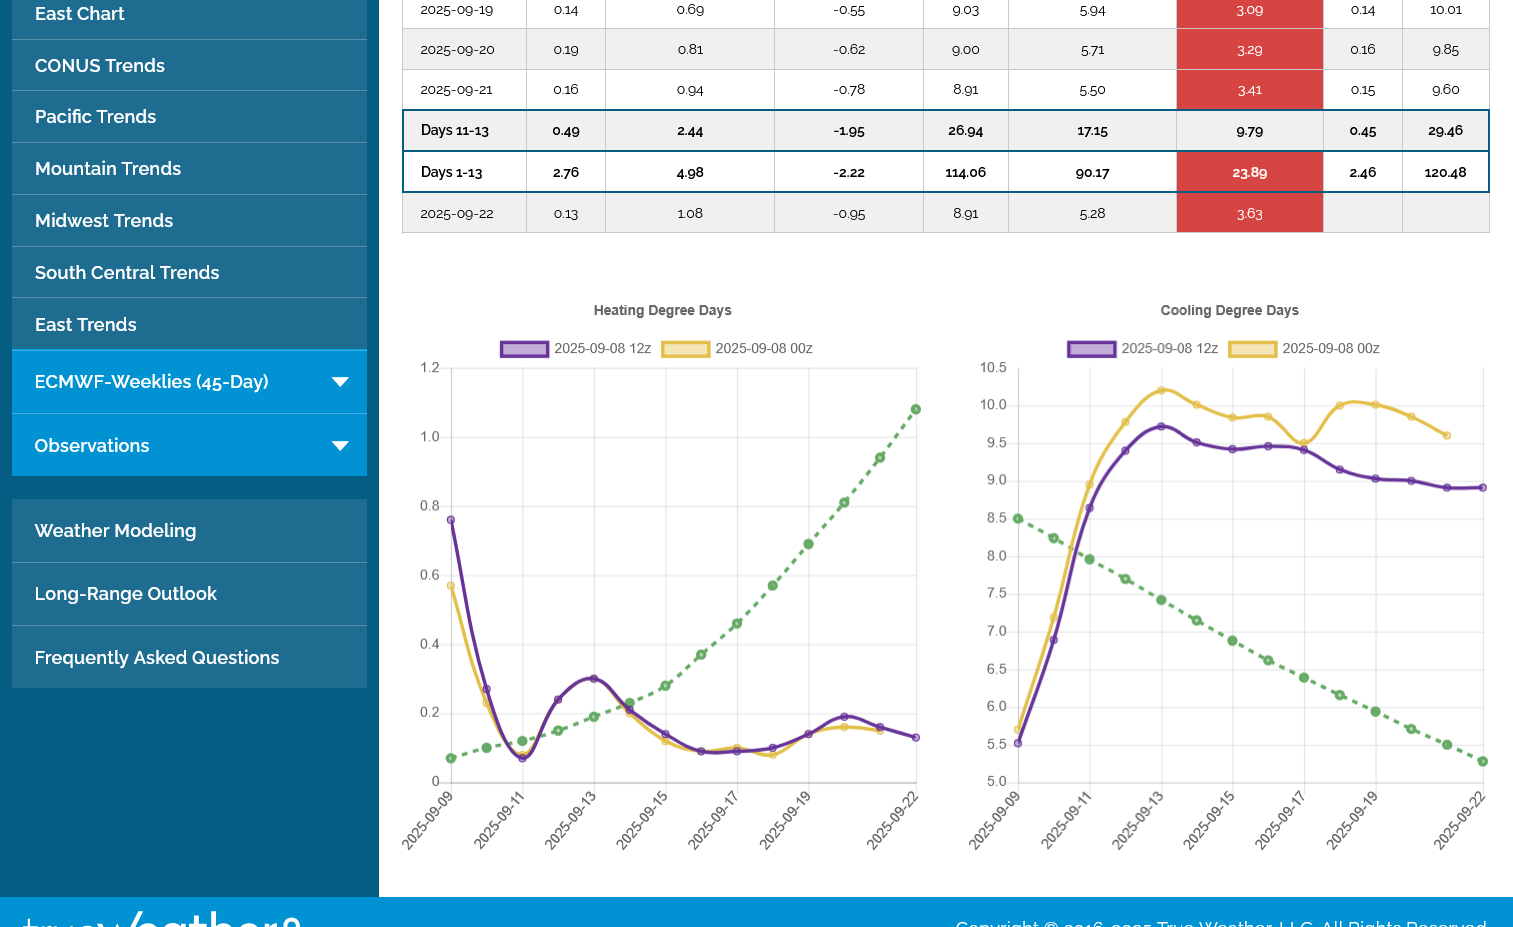
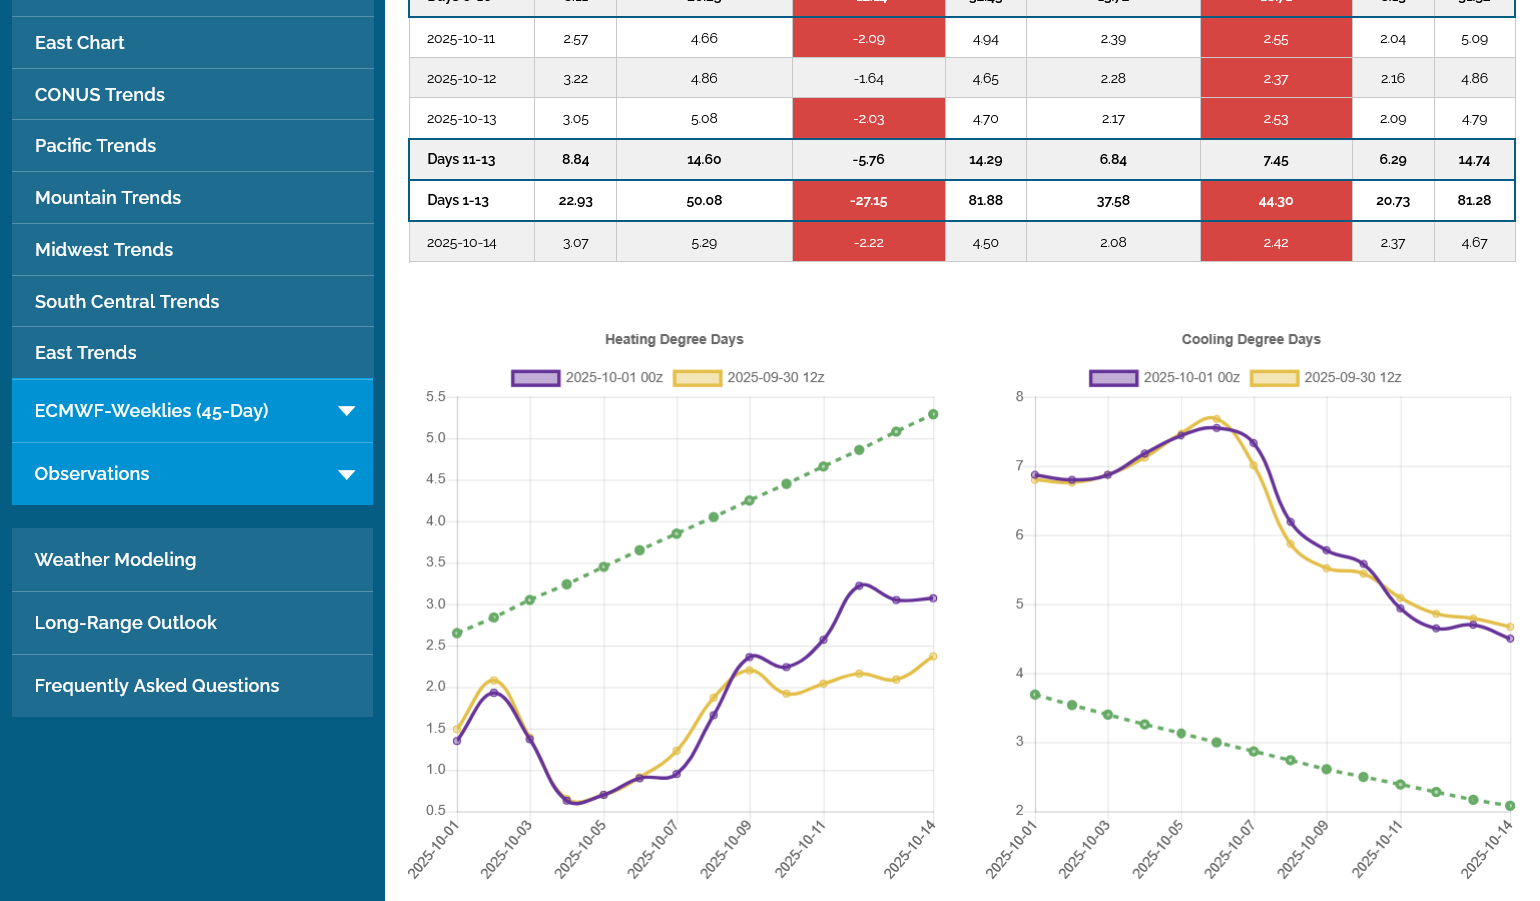
Unusually warm weather and anomalously high CDDs(for this time of year) but also anomalously LOW HDDS.
HDDs seasonally pass up CDDs on October 4th based on historical averages seen in green below on the last 0z European Ensemble mean model. Heat in October, usually turns bearish by reducing HDDs
This year, however HDDs will not be passing up CDDs until late October.
Not sure how much this weeks huge rally is following the unseasonable warmth since HDDs on the left, pass up CDDs on the right seasonally on October 4th, 3 days from now.
This was the last European Model Ensemble average below. +17 CDDs which is BULLISH because of the warmth but -27 CDDs vs average which is even MORE BEARISH because of the same warmth.
The total DD's are -10 compared to average.
+++++++++++++++
This is a time of year when ng futures move higher towards a seasonal peak ahead of Winter as the market dials in cold weather risk premium and storage fills up with extra buying.
https://charts.equityclock.com/natural-gas-futures-ng-seasonal-chart
++++++++++++====
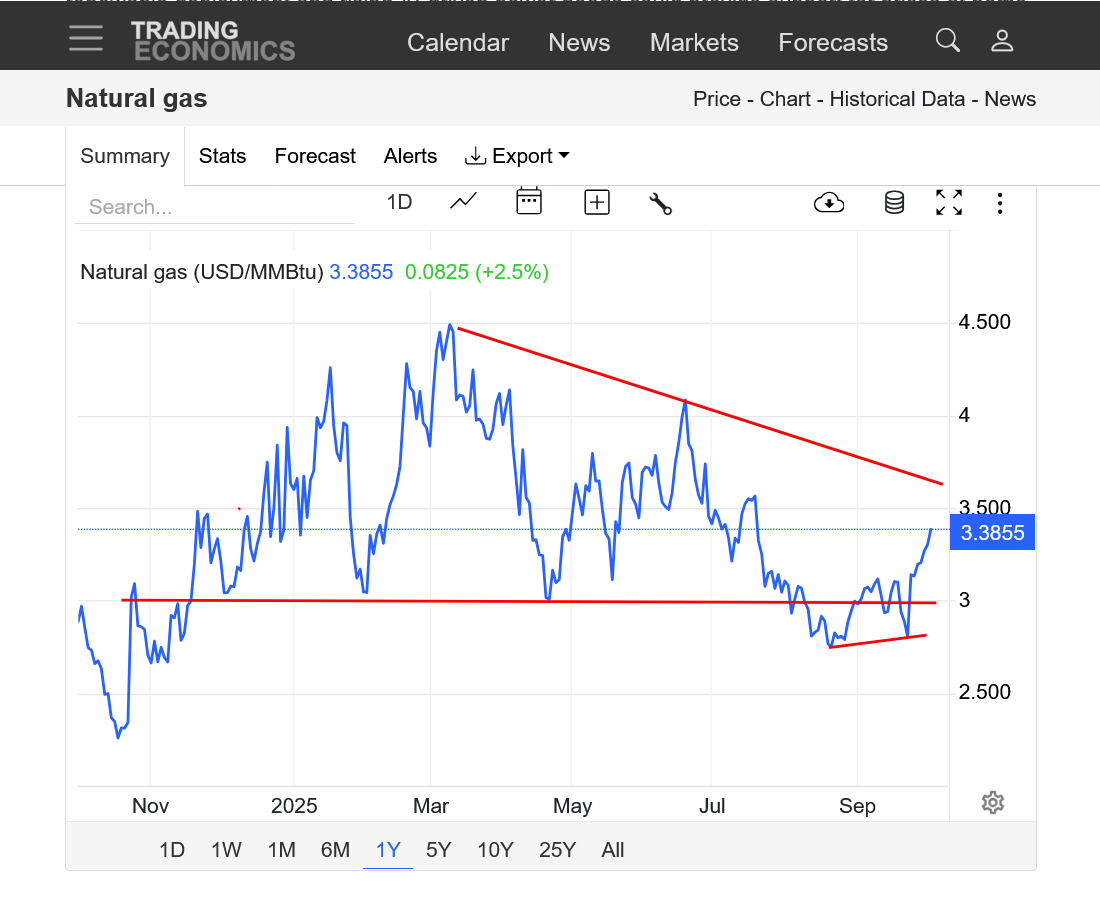
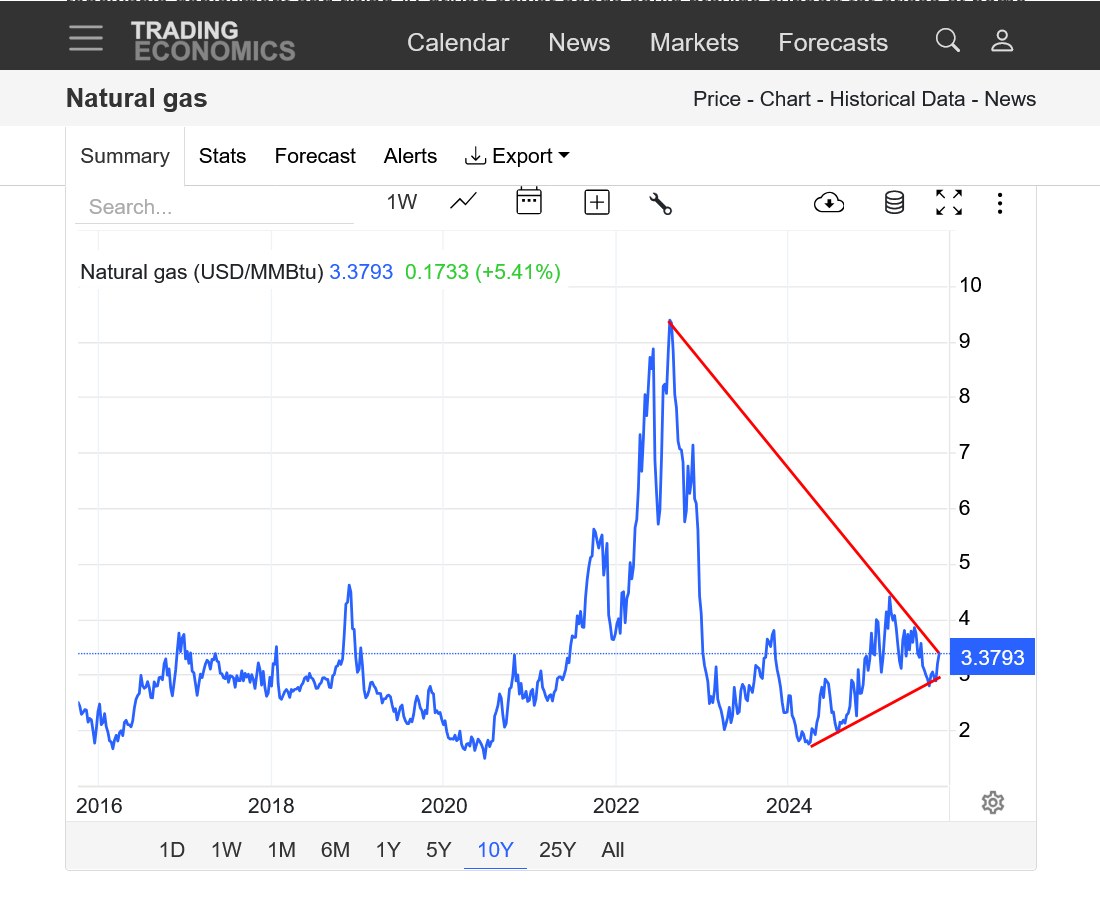
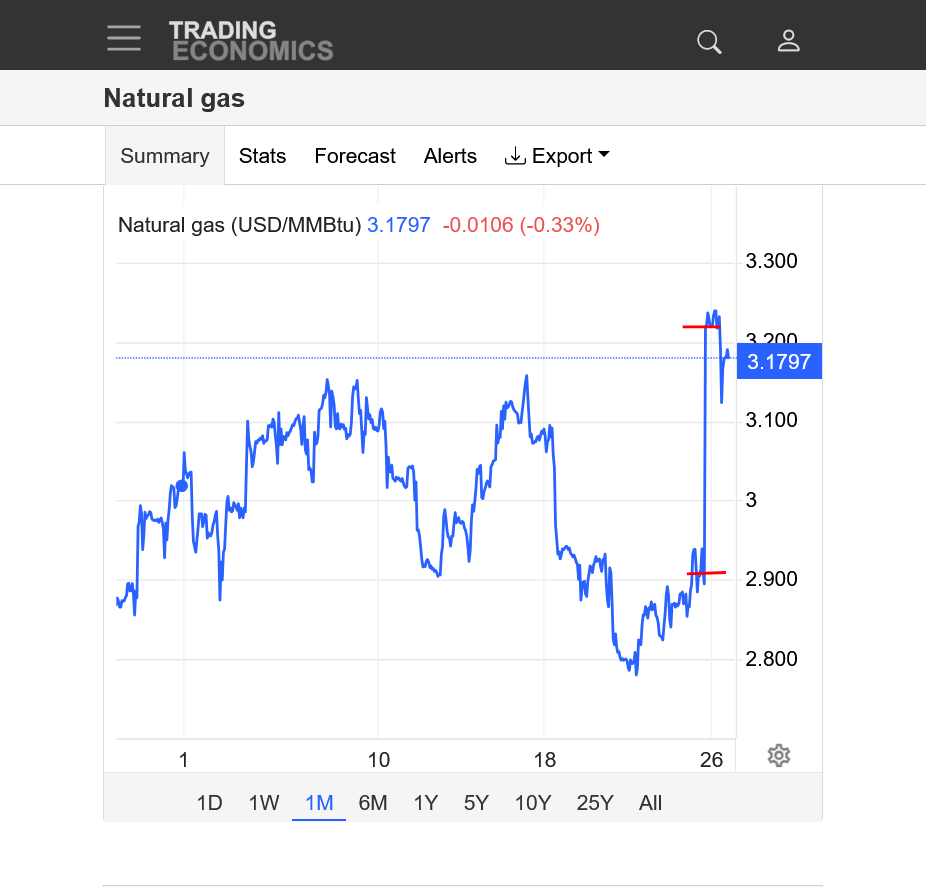
https://tradingeconomics.com/commodity/natural-gas
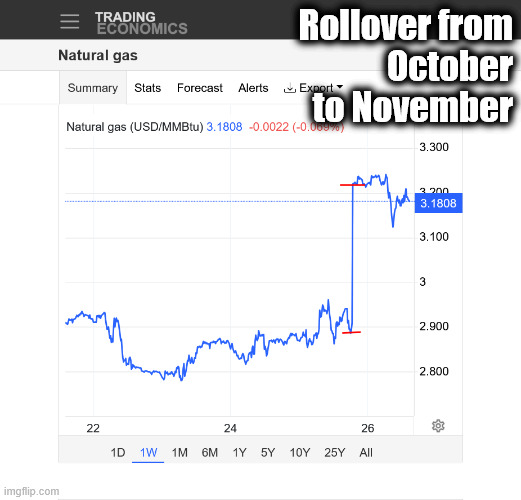
1. 1 week-spike up last week was the rollover from October to higher priced November!
2. 1 year-early Sept. bottom, after the huge sell off from unusually cool late Summer.
3. 10 years. Symmetrical wedge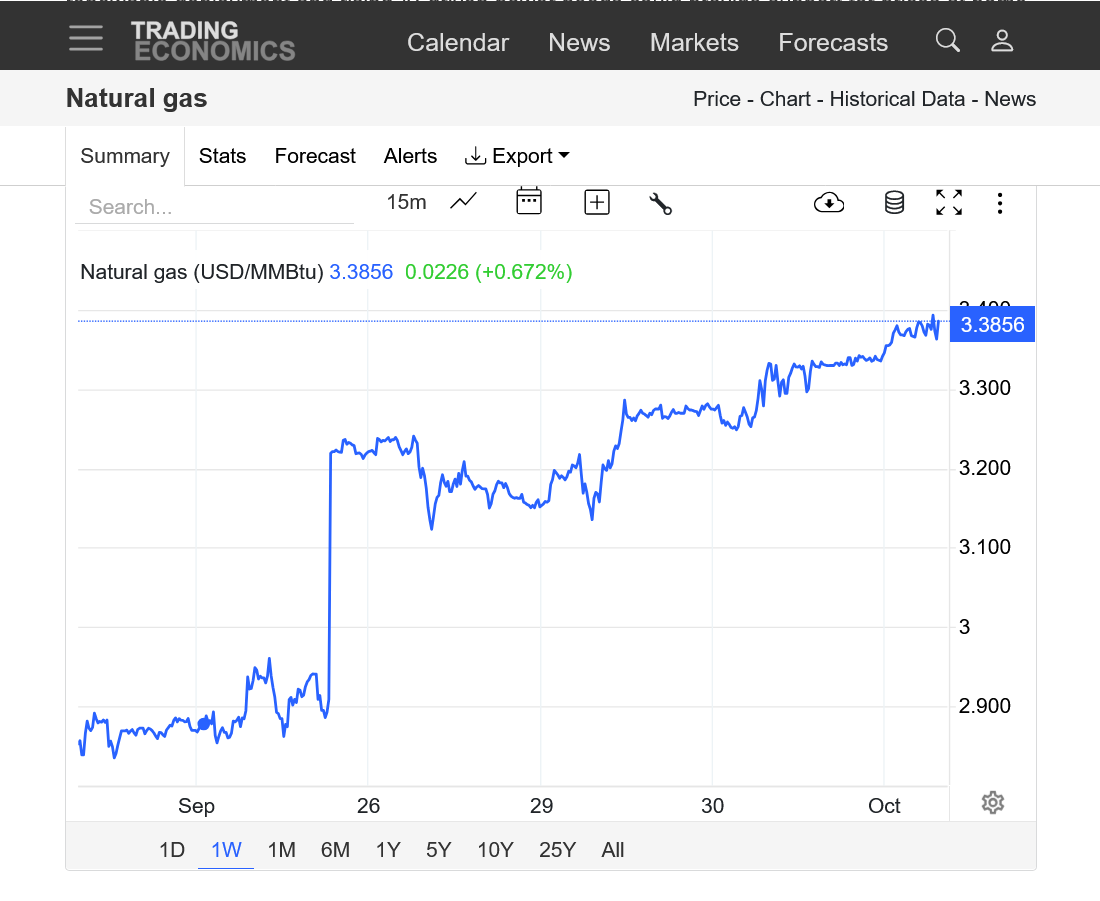
A late season heat wave for much of the country last week caused this mornings EIA storage report to be BULLISH with an injection smaller than even the bottom of the estimated range!
+53 Bcf
https://www.cpc.ncep.noaa.gov/products/tanal/temp_analyses.php
![]()
for week ending September 26, 2025 | Released: October 2, 2025 at 10:30 a.m. | Next Release: October 9, 2025
| Working gas in underground storage, Lower 48 states Summary text CSV JSN | |||||||||||||||||||||||||
|---|---|---|---|---|---|---|---|---|---|---|---|---|---|---|---|---|---|---|---|---|---|---|---|---|---|
| Historical Comparisons | |||||||||||||||||||||||||
| Stocks billion cubic feet (Bcf) | Year ago (09/26/24) | 5-year average (2020-24) | |||||||||||||||||||||||
| Region | 09/26/25 | 09/19/25 | net change | implied flow | Bcf | % change | Bcf | % change | |||||||||||||||||
| East | 832 | 807 | 25 | 25 | 842 | -1.2 | 815 | 2.1 | |||||||||||||||||
| Midwest | 972 | 945 | 27 | 27 | 1,009 | -3.7 | 973 | -0.1 | |||||||||||||||||
| Mountain | 269 | 266 | 3 | 3 | 282 | -4.6 | 227 | 18.5 | |||||||||||||||||
| Pacific | 302 | 300 | 2 | 2 | 293 | 3.1 | 275 | 9.8 | |||||||||||||||||
| South Central | 1,186 | 1,190 | -4 | -4 | 1,113 | 6.6 | 1,101 | 7.7 | |||||||||||||||||
| Salt | 292 | 299 | -7 | -7 | 261 | 11.9 | 267 | 9.4 | |||||||||||||||||
| Nonsalt | 894 | 890 | 4 | 4 | 852 | 4.9 | 834 | 7.2 | |||||||||||||||||
| Total | 3,561 | 3,508 | 53 | 53 | 3,540 | 0.6 | 3,390 | 5.0 | |||||||||||||||||
| Totals may not equal sum of components because of independent rounding. | |||||||||||||||||||||||||
Working gas in storage was 3,561 Bcf as of Friday, September 26, 2025, according to EIA estimates. This represents a net increase of 53 Bcf from the previous week. Stocks were 21 Bcf higher than last year at this time and 171 Bcf above the five-year average of 3,390 Bcf. At 3,561 Bcf, total working gas is within the five-year historical range.
For information on sampling error in this report, see Estimated Measures of Sampling Variability table below.
Note: The shaded area indicates the range between the historical minimum and maximum values for the weekly series from 2020 through 2024. The dashed vertical lines indicate current and year-ago weekly periods.
+++++++++++++++
After a huge week long rally(the blip up on the left was the October contract rolling over to November) the bullish EIA saw a spike up and small daily reversal down bar.
Buy the (bullish) rumor, sell the news type action!
https://tradingeconomics.com/commodity/natural-gas
Near record warmth in the NorthCentral US last week where HDDs are normally higher than CDDs so the warmth there was bearish.
Plenty of warmth to go around in other places except a bit cool West/Southwest compared to average.
https://www.cpc.ncep.noaa.gov/products/tanal/temp_analyses.php
The EIA number was robust and close to estimates at 80 Bcf.
