https://www.nhc.noaa.gov/graphics_at5.shtml?start#contents
https://www.nhc.noaa.gov/gtwo.php?basin=atlc&basin=atlc&fdays=7
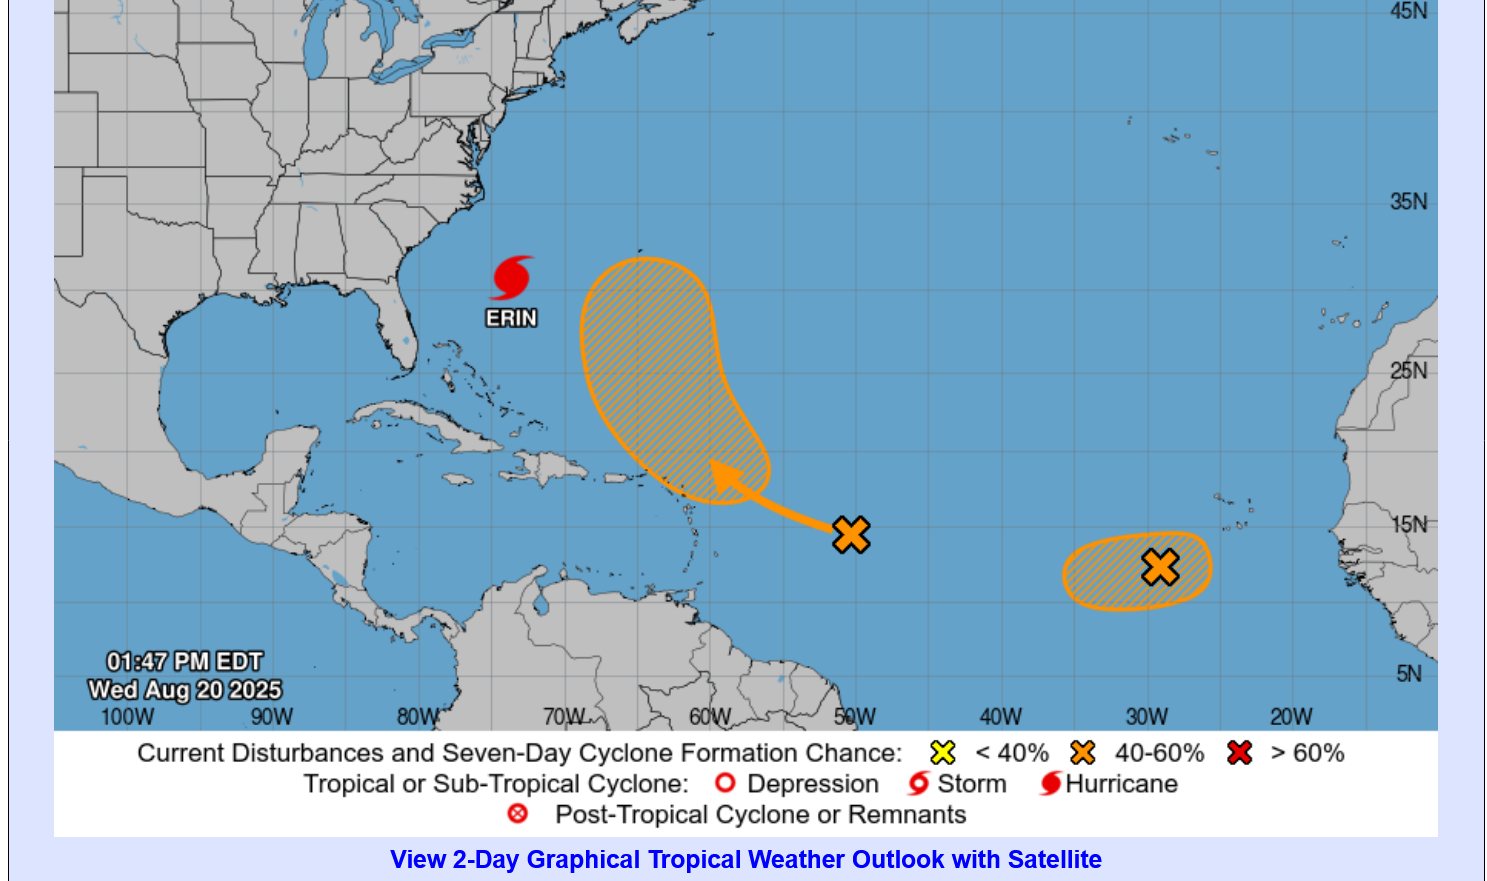
50% of a cyclone developing next week from the wave off the coast of Africa.
 |
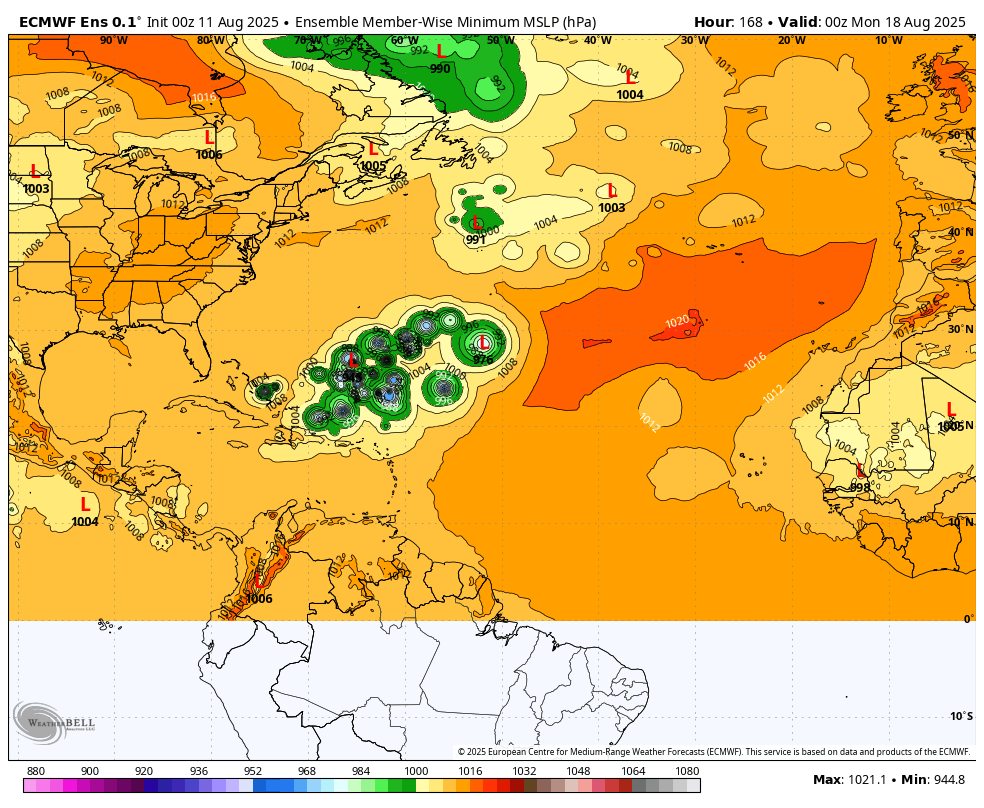
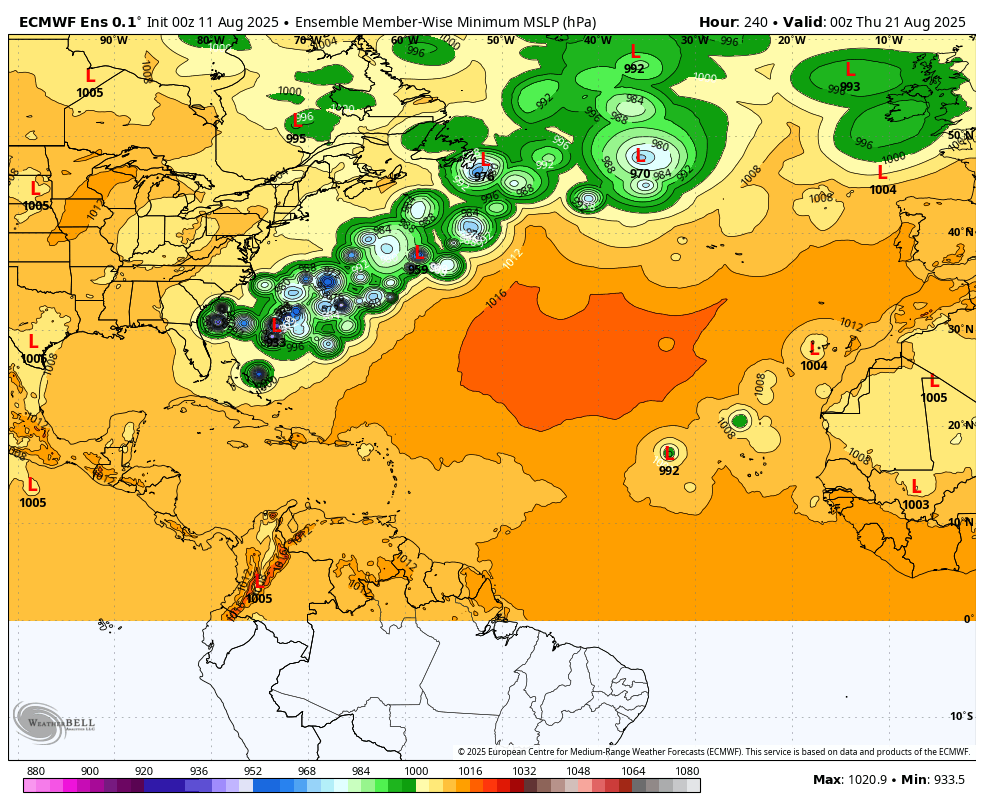
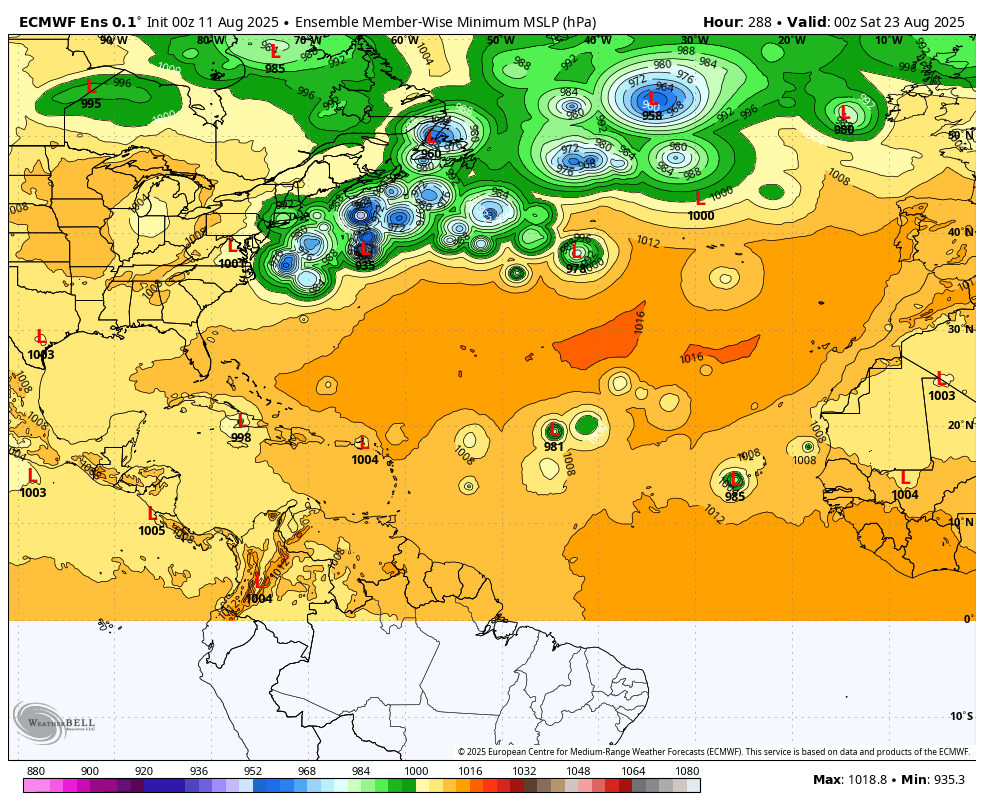
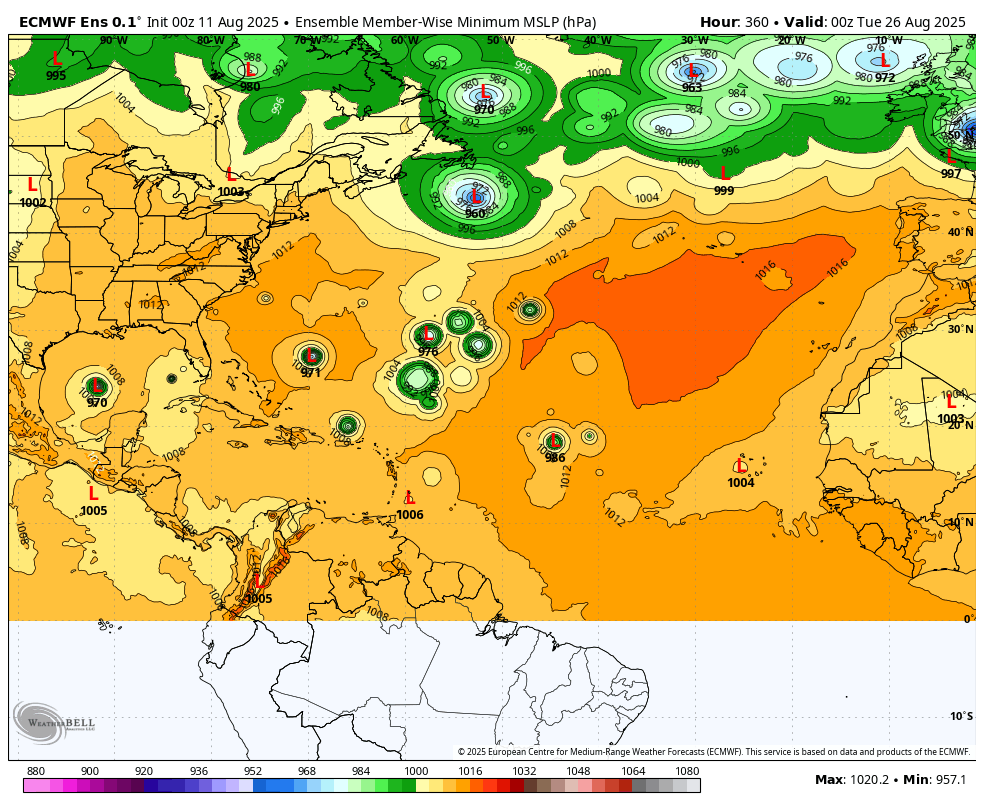
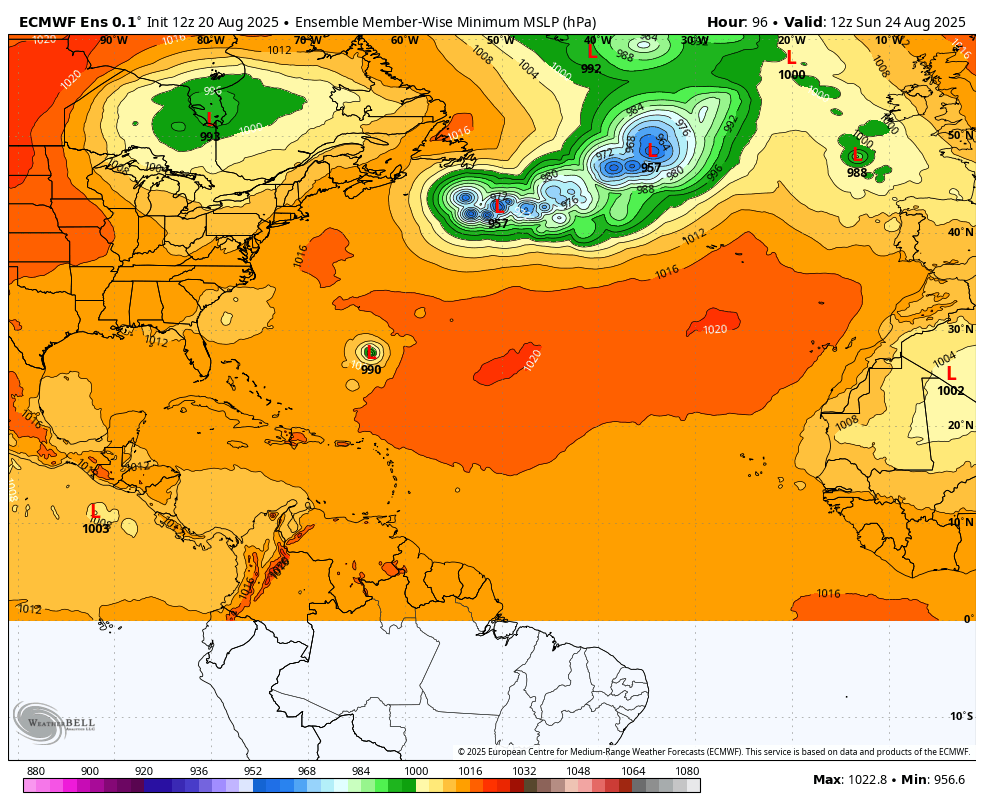
These were the individual European Ensemble solutions from the last 0z solution.
1. Day 7
2. Day 10
3. Day 12
4. Day 15
Thanks, Mike!
At this point, it is a higher threat to Bermuda than to the US. But it’s still early. Regardless, this is projected to become a large ACE producer.
Thanks, Larry!
Pretty strong system when it matures, even though the track, as of now is unlikely to hit the US mainland.
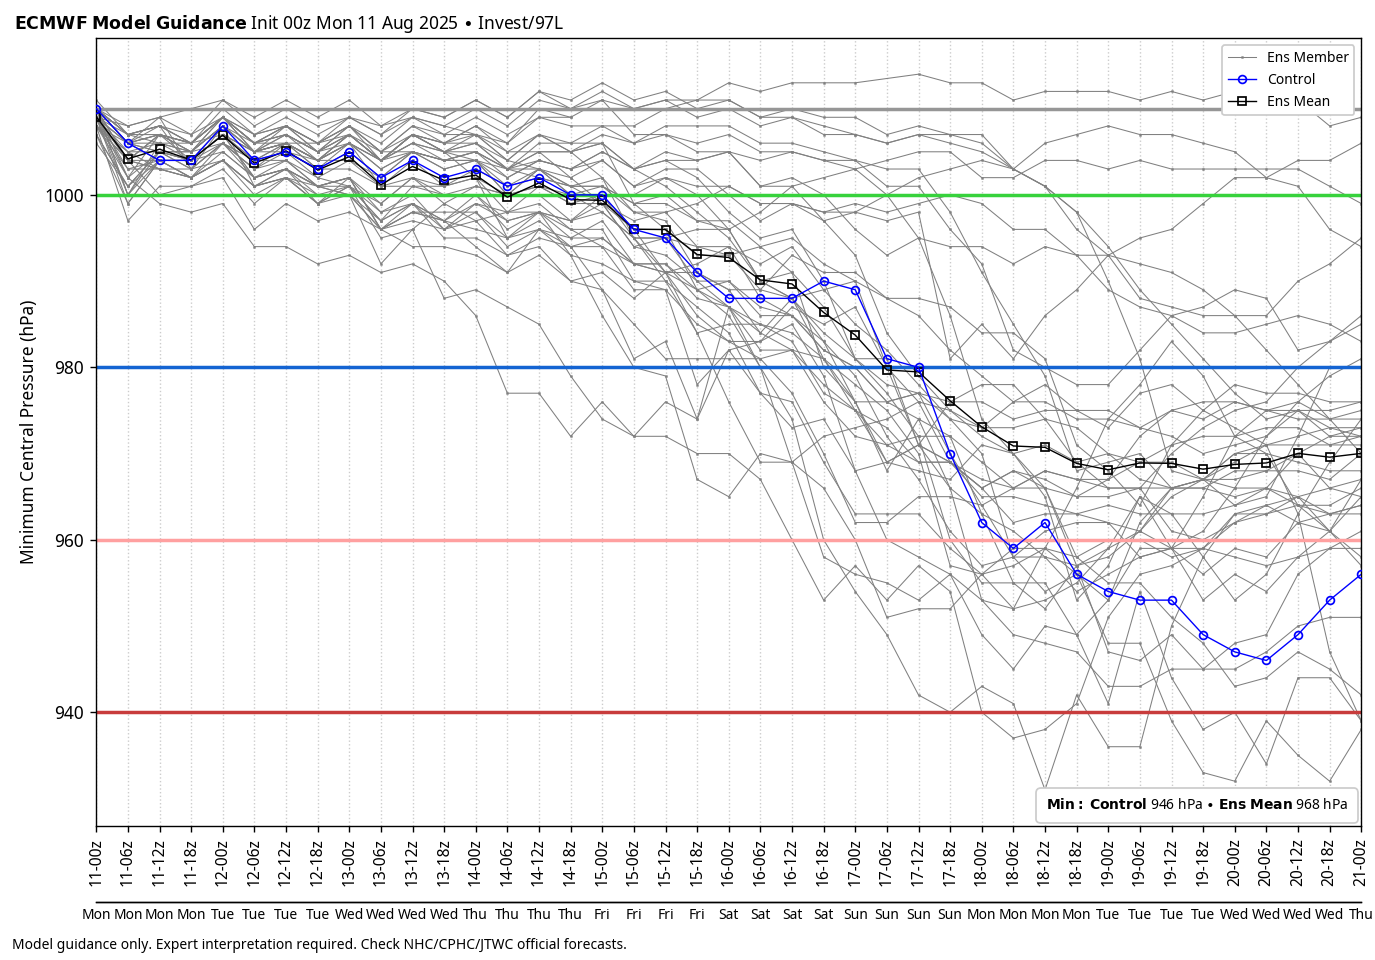
Here's the latest. Low threat to US East Coast but possible. Top winds 115 mph in 5 days.
https://www.nhc.noaa.gov/graphics_at5.shtml?start#contents
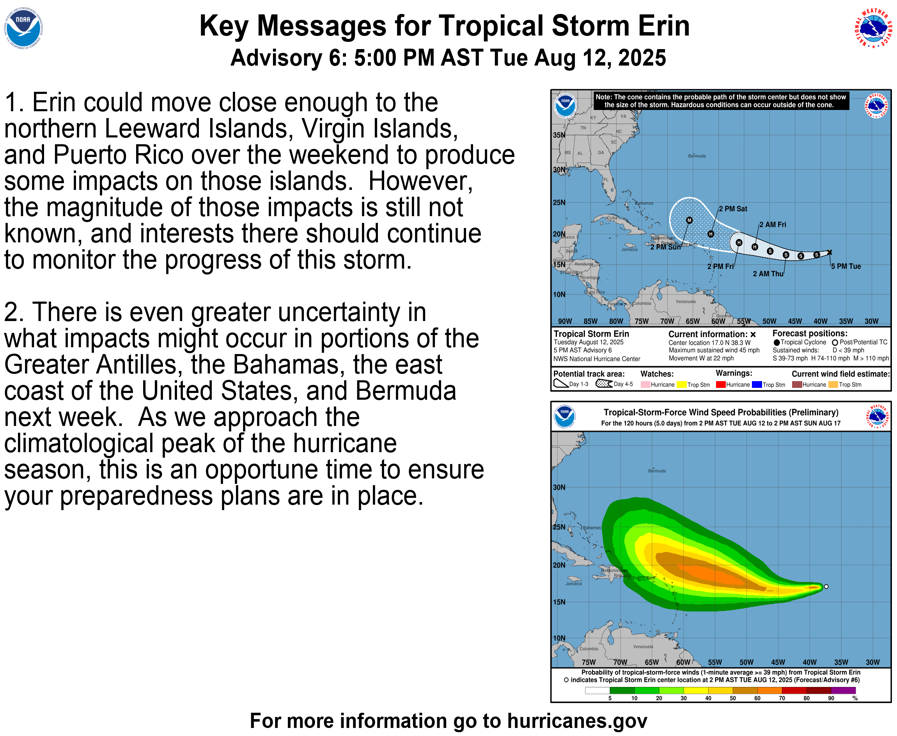
Thanks, Mike. I’m currently at 90% chance of no U.S. center landfall/10% chance of center landfall with a higher chance when considering significant effects from non-landfall that isn’t too far offshore.
Much appreciated, Larry!
This was the SLP map with individual solutions for day 6 of the last run of the European Model ensemble model. It lines up well with your assessment!
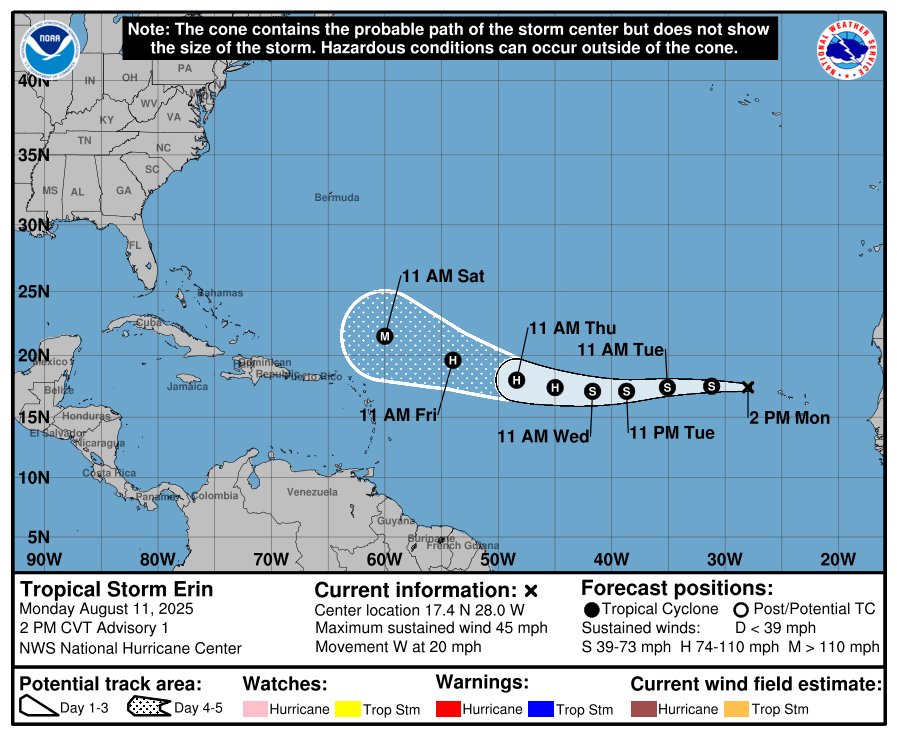
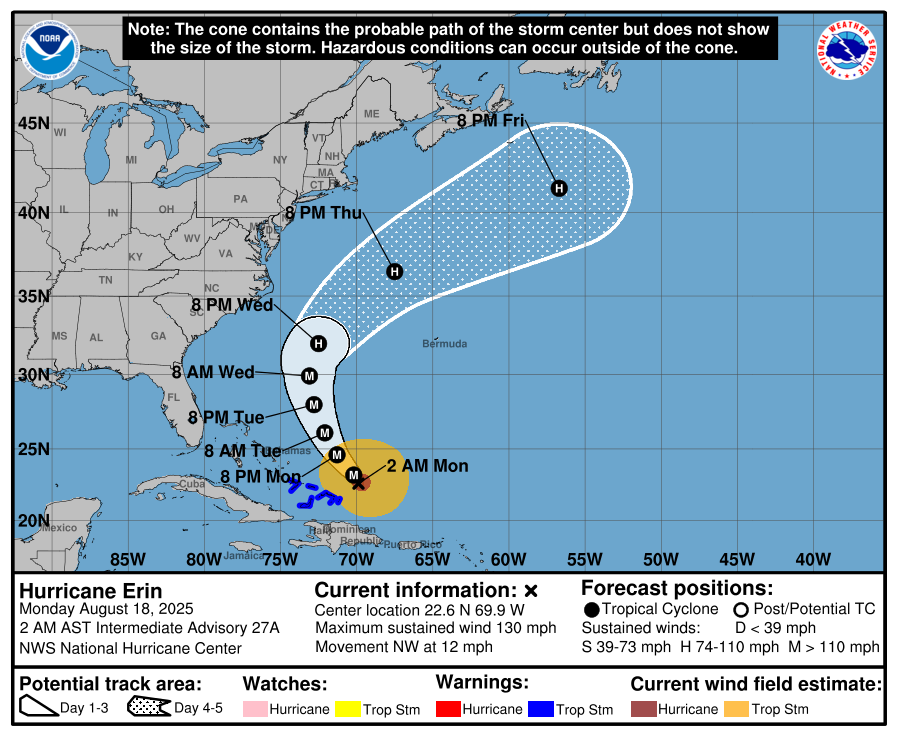
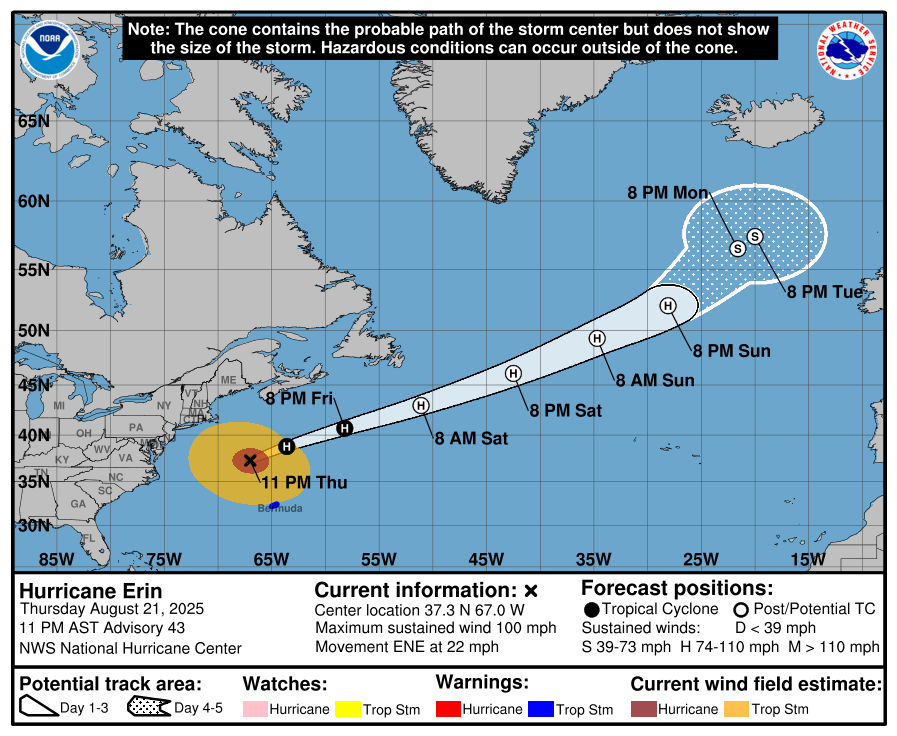
Erin has become the first hurricane of the Atlantic season. It’s forecasted to become a MH but with no hit or even close miss of the US. The E Bahamas, Bermuda and Canada are at more risk.
Thanks very much, Larry!!
Peaks winds at 145 mph in 72 hours but as you know, a brief period of rapid intensification, not forecast well by models could cause it to spike higher than that.
https://www.nhc.noaa.gov/text/refresh/MIATCDAT5+shtml/152043.shtml?
++++++++++++
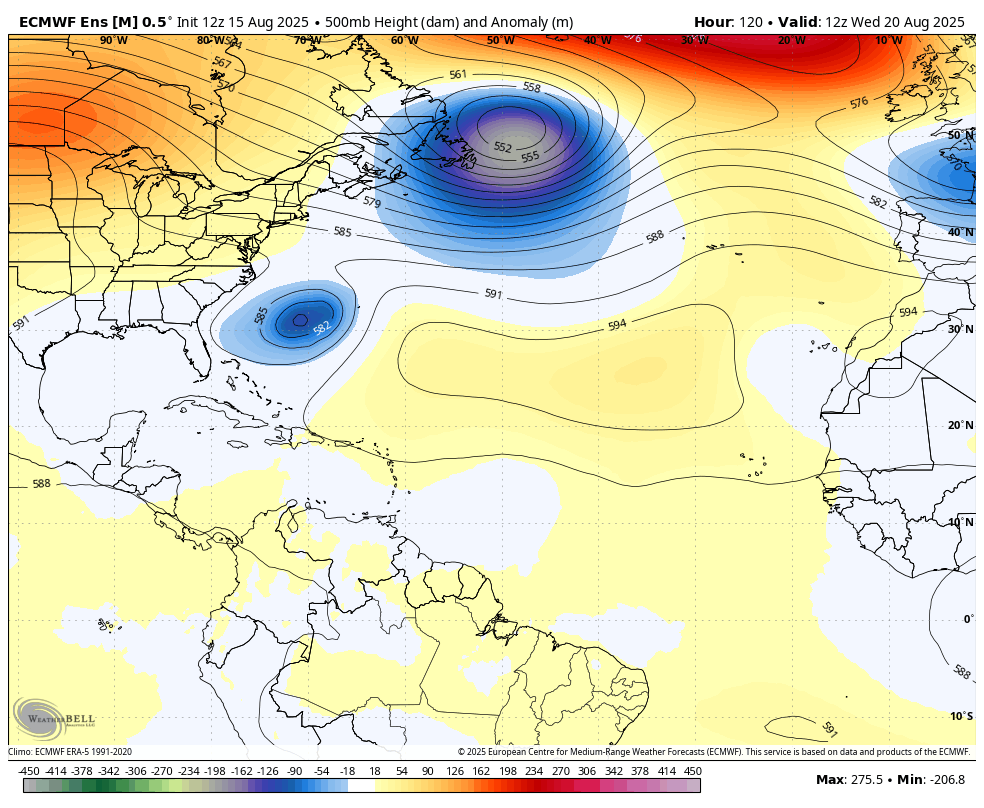
1. 500 mb map(midpoint of the atmosphere-around 18,000 feet up) at 120 hours from the EE mean.
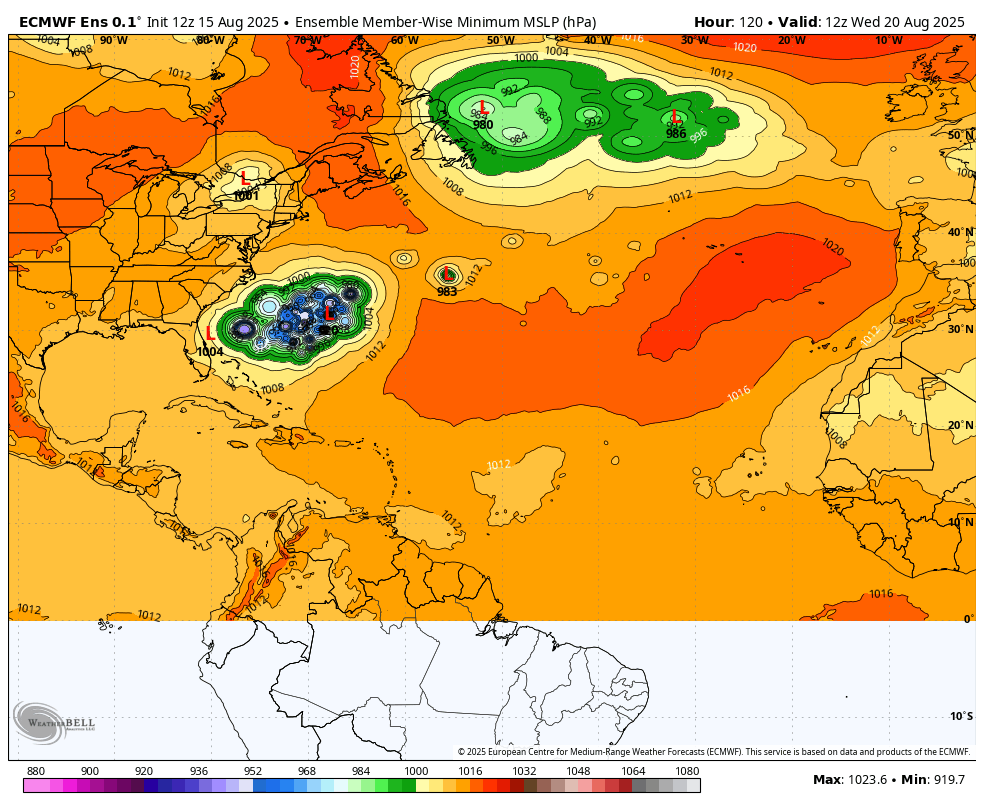
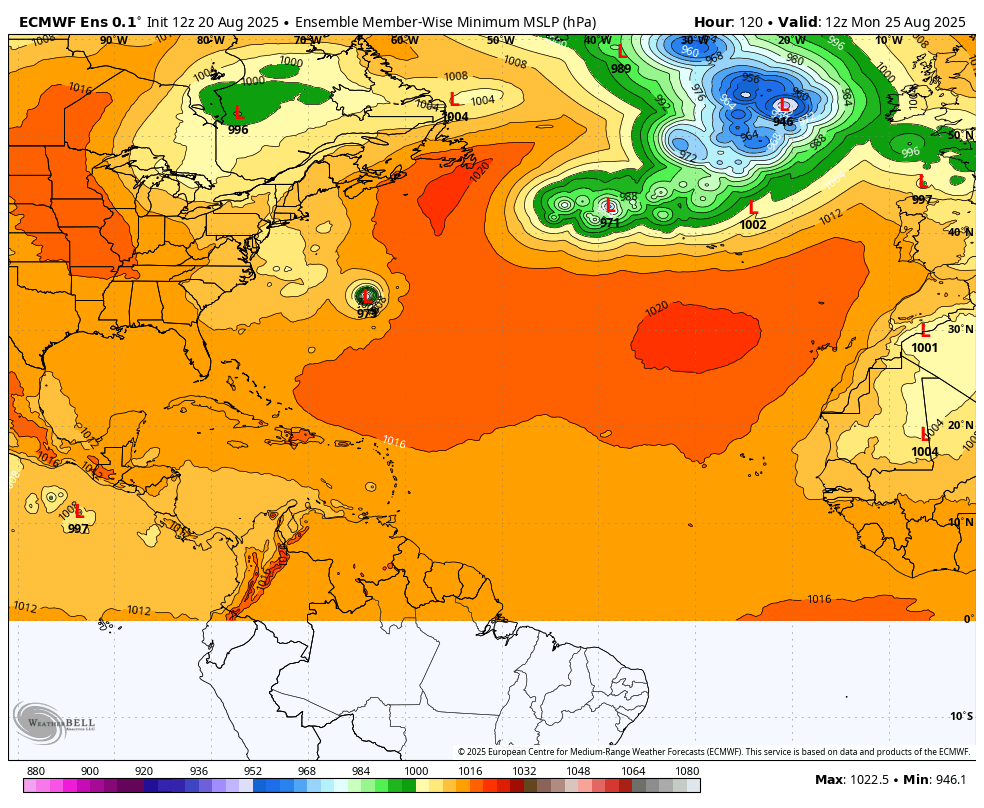
2. SLP from the individual European Ensemble solutions at 120 hours.
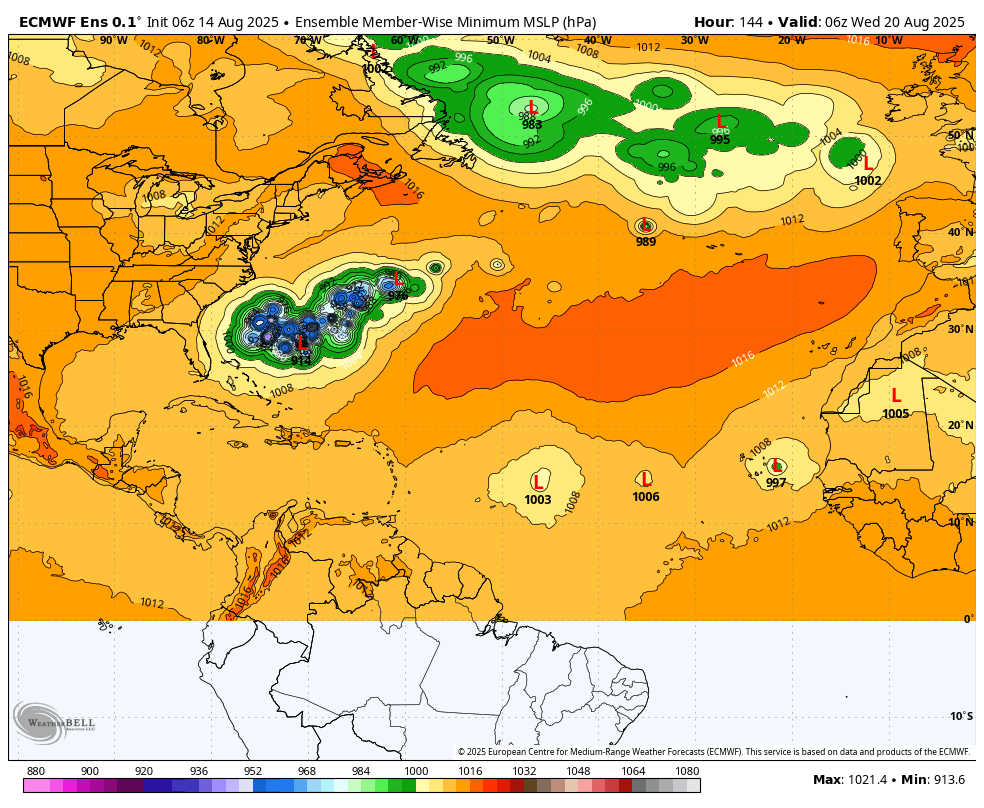
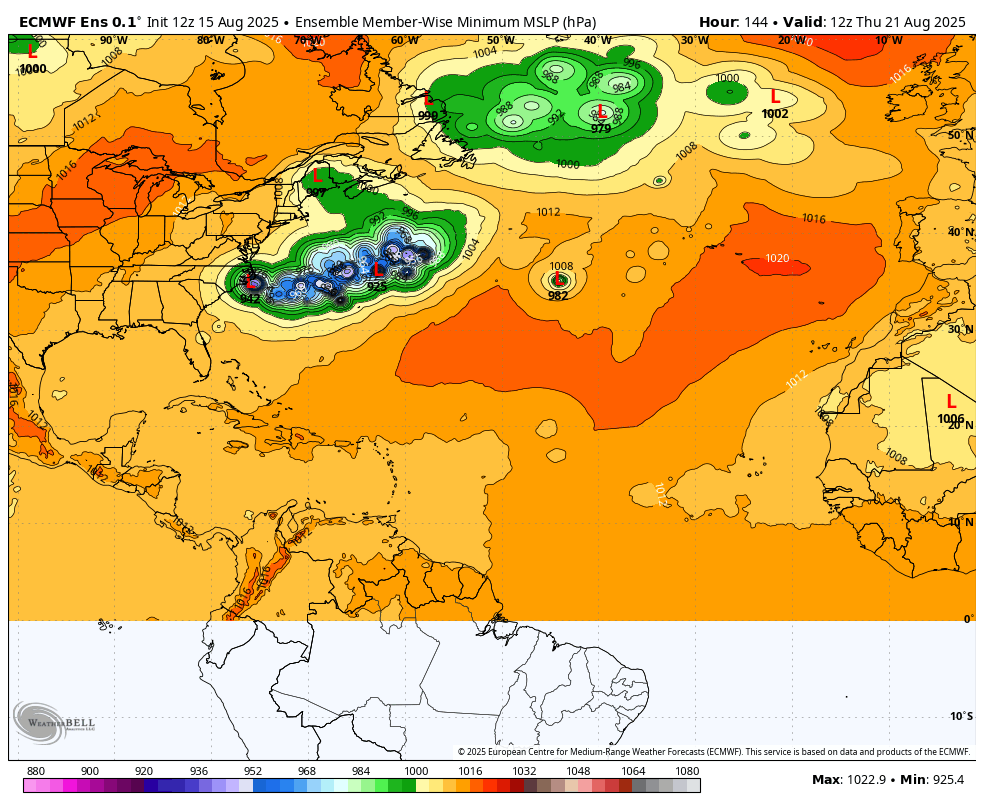
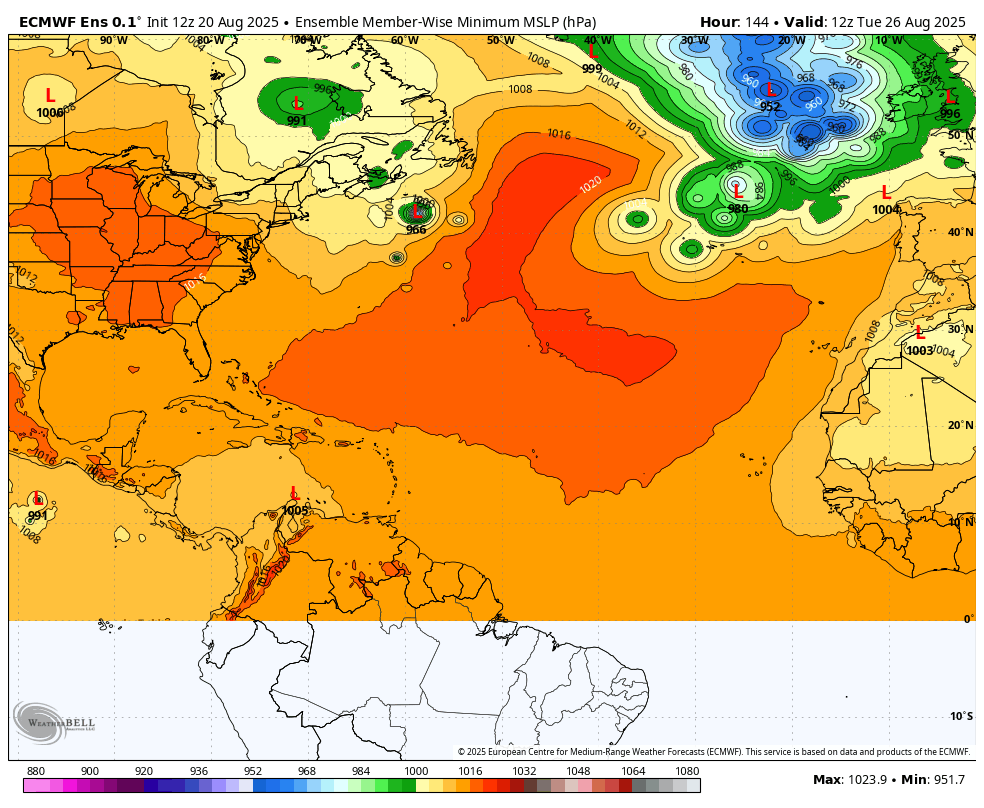
3. Same thing at 144 hours
Now cat 5!
WOW! That was fast but with rapid intensification not forecast well by the models, especially over warm water it's always a distinct possibility!
At 155 mph from rapid intensification which should end or is ending now. Peak forecast of 165 mph.
Not much threat to the US East Coast, other than what huge waves cause. Erin, though weakening in speed will grow enormously in size to double or even triple the current size. One reason that it strengthened so fast the last 24 hours is its current smaller size.
It's interesting that the ACE index does not use size for the calculation(which would have been almost impossible to calculate in hurricanes before the Hurricane Hunters and satellite era).
We were having a great discussion on ACE earlier this month before Erin interrupted by becoming a reality which always trumps forecasts and theories or speculation.
2025 NATL Tropical Season
18 responses |
Started by WxFollower - Aug. 3, 2025, 12:08 p.m.
https://en.wikipedia.org/wiki/Accumulated_cyclone_energy
| Season | TS | HU | MH | ACE |
|---|---|---|---|---|
| 1933 | 20 | 11 | 6 | 258.57 |
| 2005 | 28 | 15 | 7 | 245.3 |
| 1893 | 12 | 10 | 5 | 231.15 |
| 1926 | 11 | 8 | 6 | 229.56 |
| 1995 | 19 | 11 | 5 | 227.10 |
| 2004 | 15 | 9 | 6 | 226.88 |
| 2017 | 17 | 10 | 6 | 224.88 |
| 1950 | 16 | 11 | 6 | 211.28 |
| 1961 | 12 | 8 | 5 | 188.9 |
| 1998 | 14 | 10 | 3 | 181.76 |
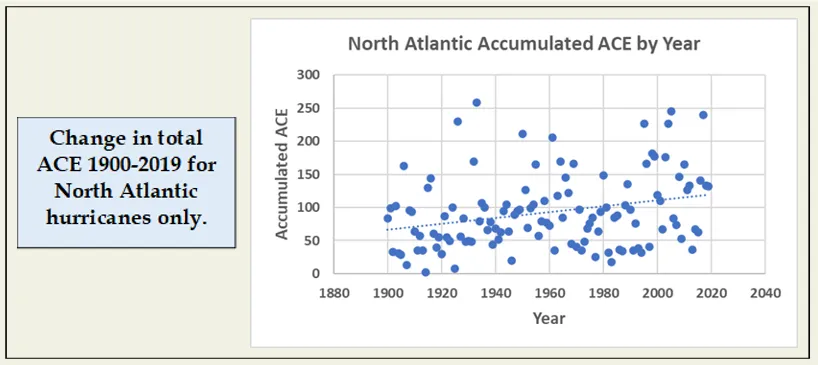
I have found the fact that 7 out of the top 10 ACE seasons occurring BEFORE the year 2000 to be very intriguing as the last 25 years have the warmest water in the tropical Atlantic basin.
I have always felt that its because hurricanes act as a natural mechanism to re-balance the heat distribution on the planet.
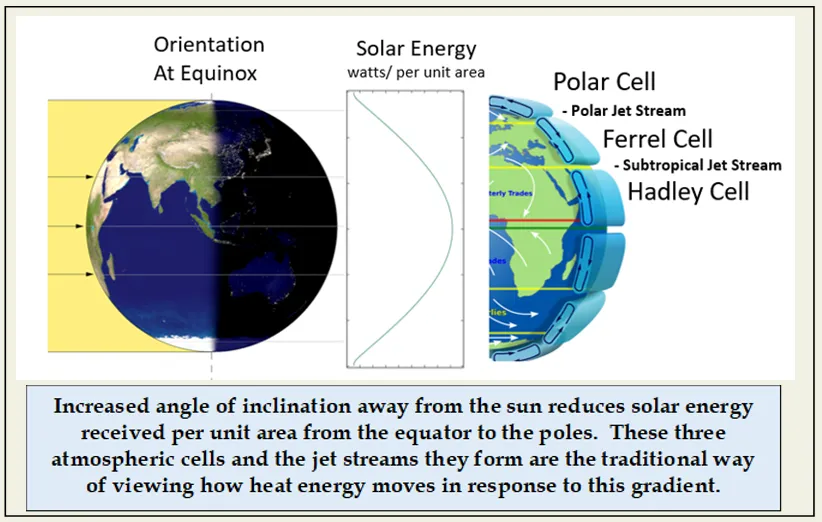
Because of the higher sun angle and solar heating, the tropics are much warmer than the higher latitudes. This results in a steep temperature/heat gradient from warm to cold going south to north. Increasing CO2 impacts the coldest(driest) places MUCH more than warmer places. This is because the radiation absorption bands for CO2 and H2O overlap and where there is already alot of water vapor(warm/humid places) those bands are near saturation from existing H2O, so adding CO2 can't cause more absorption to something that's already saturated. This part is rock solid, well tested science to explain why the Arctic and high latitudes are warming so fast( not me speculating).
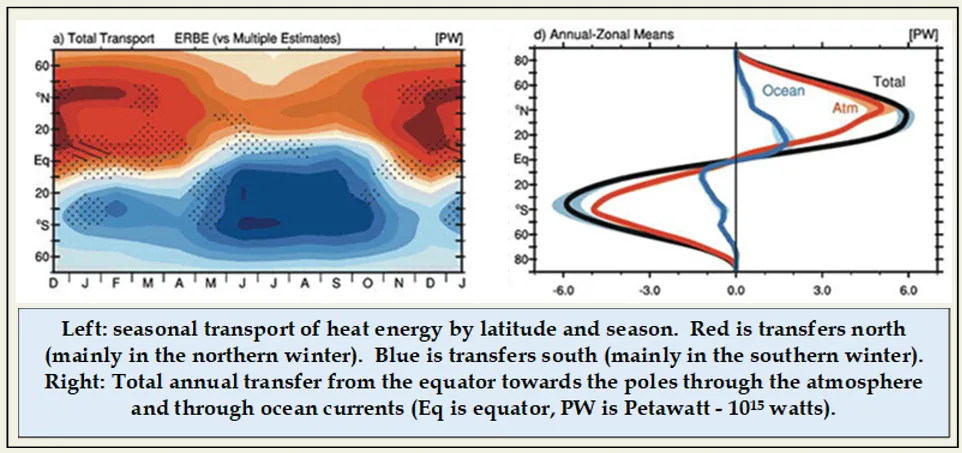
So climate change, warming the coldest places by a much greater magnitude is doing some of the work of hurricanes by shrinking the difference in heat between low latitudes and high latitudes. As a result, hurricanes in this era of warmer oceans in the tropics don't need to redistribute as much heat by transporting it north, pushing it into the deep oceans or exhausting it into the stratosphere.
I wanted this to stand alone in a post as its the best discussion on this topic that I know of. I love the illustrations/graphs!
I believe that CO2 warming of the highest latitudes by a much greater magnitude(coldest places) is doing some of the work that hurricanes do with their redistributing/balancing of planetary heat by taking it away from the warmest places. This is reducing the need for nature to use hurricanes for this purpose and is at least one explanation for why hurricanes have not increased in a way that one would expect from just the increase in ocean temperatures alone.
The biggest flaw in comparing data in 2025 (or recent decades) with historical data is that before the satellite era and especially before Hurricane Hunters we don't have comprehensive data on hurricanes away from land which was most of them, most of the time.
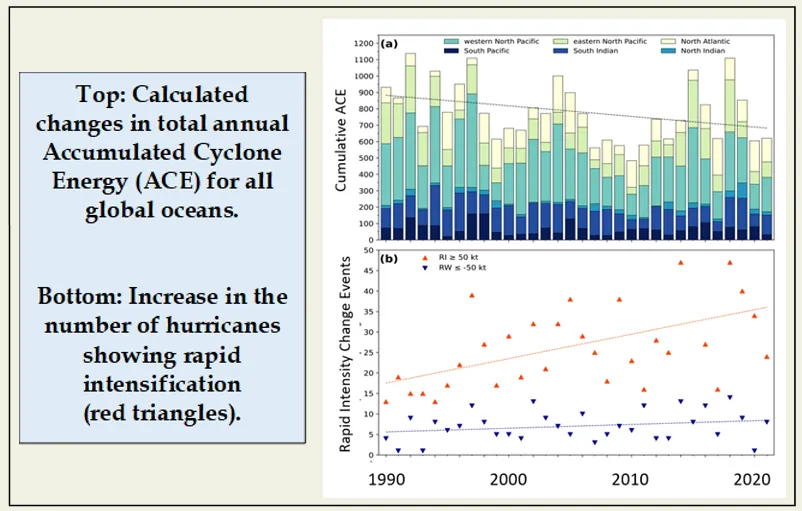
One thing for certain. The warmer water is causing more rapid intensification with solid evidence of that the past few decades. However, past rapid intensification events were all in a part of the ocean that we couldn't observe a century ago.
https://lessheatmorelight.substack.com/p/hurricanes-and-the-global-energy
An earlier essay was something of an ode to the power and beauty of hurricanes. This one asks some more analytical questions: What role do these powerful heat engines play in redistributing energy within the climate system, and is that role changing as the planet warms?
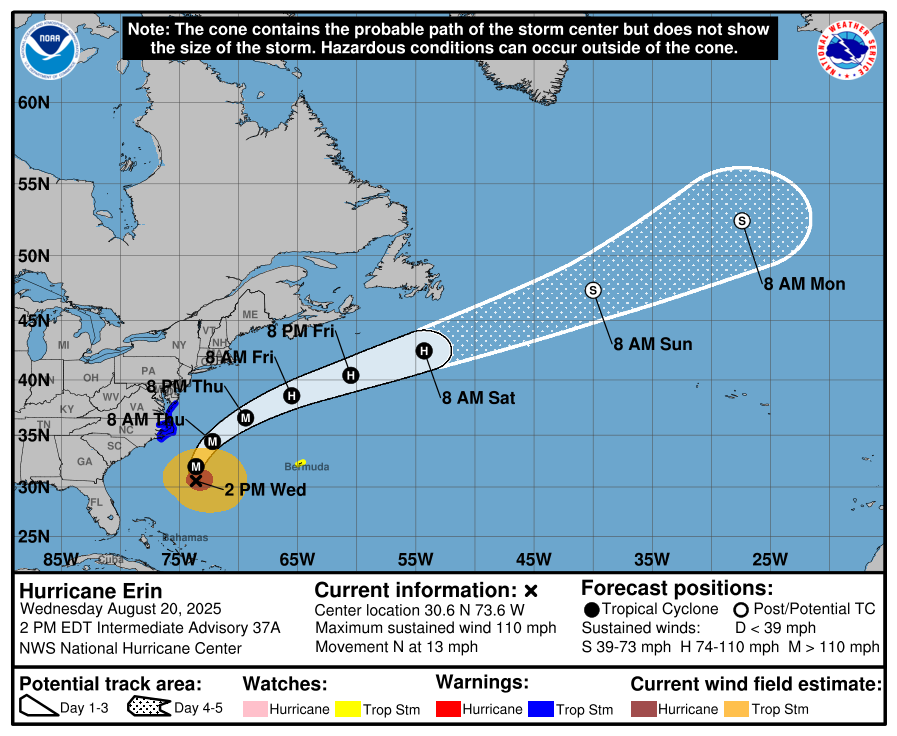
This is a good track to minimize damage/negative impacts!
The eyewall replacement weakened it a bit but that's over and now it will bump back up to 145 mph the next 12 hours, then slowly weaken the rest of the week as it gradually turns farther and farther to the right.
https://www.nhc.noaa.gov/text/refresh/MIATCDAT5+shtml/180255.shtml?
https://www.nhc.noaa.gov/refresh/graphics_at5+shtml/180534.shtml?cone#contents
https://www.nhc.noaa.gov/text/refresh/MIATCDAT5+shtml/180255.shtml?
Erin is increasing in size now. This has been expected.
Tracking a hurricane, trying to contemplate the enormity and appreciating the physical laws/process can be a very profound experience when put into perspective.
The NHC says that Erin's storm size is in the 80th percentile of major hurricanes which means 80% of major hurricanes were this size or smaller.
Based on an evaluation of storm sizes of major hurricanes over the past couple of decades in the subtropics, Erin is around the 80th percentile. Erin's wind field is expected to keep growing over the next few days. The expanding wind field will result in rough ocean conditions over much of the western Atlantic. It should be noted that the 34- and 50-kt wind speed probabilities beyond 36 hours in the text and graphical products are likely underestimating the risk of those winds occurring. This is because the forecast wind field of Erin is considerably larger than average compared to the wind field used to derive the wind speed probability product.
+++++++++++
Erin may strengthen a bit today from 110 to 120 mph while still over warm water and low wind shear as eyes shift westward towards the next 2 potential tropical systems.
https://www.nhc.noaa.gov/text/refresh/MIATCDAT5+shtml/180255.shtml?
https://www.nhc.noaa.gov/refresh/graphics_at5+shtml/180534.shtml?cone#contents
https://www.nhc.noaa.gov/gtwo.php?basin=atlc&basin=atlc&fdays=7
Awesome satellite loops of Erin!
The best ones are longer plays. Each image is spaced 5 minutes apart and the farthest we can go back is 240 images. With 12 images/hour that means going back 20 hours, which includes last night so we need to pick an IR band to see the hurricane in the dark.
Like this choice, which is the upper level water vapor loop:
https://www.star.nesdis.noaa.gov/GOES/conus_band.php?sat=G19&band=08&length=240&dim=1
Going back just 8 hours (12 X 8 =96 images) will provide some great visible loops. That is as of 3pm CDT.
https://www.star.nesdis.noaa.gov/GOES/conus_band.php?sat=G19&band=02&length=96&dim=1
You can mess around with it to try out different bands and time frames.
This is one of my favorites. It's based on CO2 longwave emissions in a narrow band of emissions. I copied the very last of the 240 images below. It's visible day and night because those emissions happen 24 hours a day.
Band 16 - 13.3 µm - CO₂ Longwave - IR - 20 Aug 2025 - 0316 UTC
https://www.star.nesdis.noaa.gov/GOES/conus_band.php?sat=G19&band=16&length=240&dim=1
Band 16 - 13.3 µm - CO₂ Longwave - IR - 20 Aug 2025 - 2001 UTC

Surface Low Pressure for Days 4-5-6 solutions of all the European model ensembles.
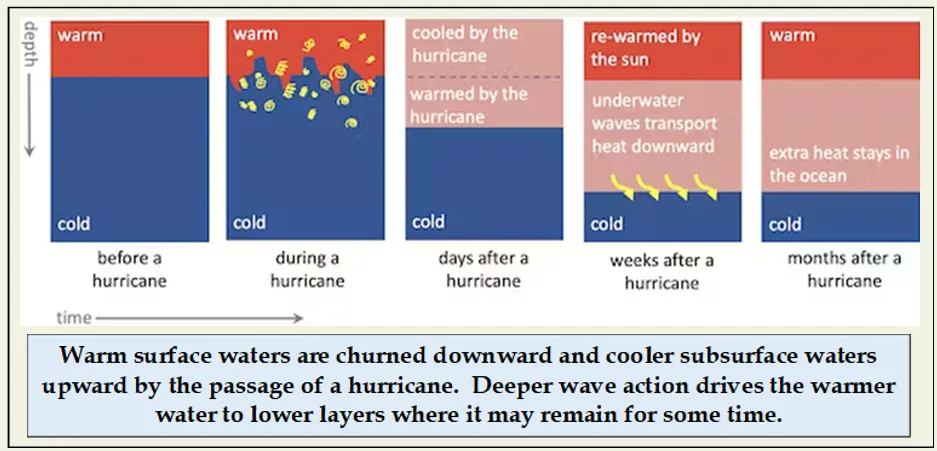
The wake of Erin will have cooler water(from the turbulence mixing cooler water at depth to the surface) that could limit strengthening of any tropical systems that take a similar path for the next week.
++++++
https://www.nature.com/articles/s41612-025-01029-5
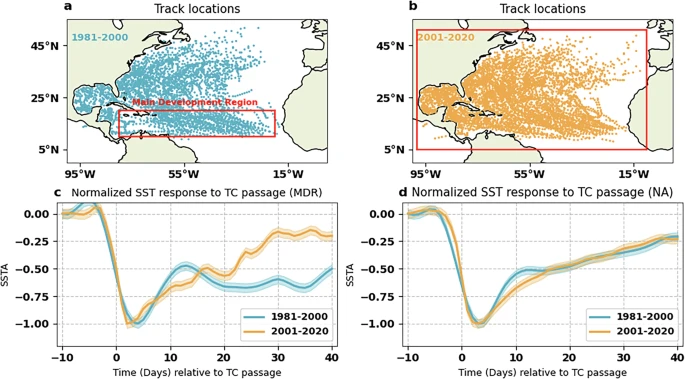
Ocean temperature critically impacts TC intensity and thus TC risk and forecast accuracy, and the recovery of SST after the passage of a TC impacts regional and global weather and climate. In this study, we show that in recent decades, TC-induced SST cooling has been recovering faster in the MDR of the tropical Atlantic Ocean. The more rapid SST recovery is most prominent during the 15–30 day period after the passage of a TC. Interestingly, no significant changes were observed when the entire North Atlantic was considered. Our results show that the shorter recovery time of TC cold wakes is associated with a weakening of the trade winds in the tropical Atlantic Ocean, in line with the theoretical results of ref. 16. Results from different reanalysis products confirm that at least in the MDR, surface winds have been weakening during the study period, which favors the faster recovery of TC cold wakes. In contrast, changes in solar radiation are insignificant and may not contribute significantly. One of the important implications of faster cold wake recovery is the potential enhancement of a subsequent TC’s intensification. We found that the impact of faster dissipation of cold wakes on TC intensification is about 9% of the influence from long-term ocean warming over the period 1981–2020. The weakening of the trade winds is also present in the multi-model ensemble mean of the CMIP6 historical simulations. This reduction in winds is projected to continue in the future (2015–2100) under a high-emission scenario.
The evidence presented in this study suggests that the dominant driver of the shorter recovery time of TC cold wakes is the large-scale reduction in wind speed. In addition to the reduced wind speeds, it is possible that mesoscale eddies and upper-ocean stratification interact in complex ways to influence the cold wakes and its recovery. Therefore, the accurate prediction of TCs depend on the precise simulation of all these features and their interactions. There are other processes such as ocean baroclinic instability that may also help to warm the sea surface after TC passage45,53. In this study, we adopted a method that defines a fixed distance from the TC center to compute the cold wake region. Therefore, the cold wake boundary may not be well quantified. In the regions where mesoscale activities are observed, cold wakes are likely to travel considerable distances from their points of origin, and consequently their effects on regional heat budgets and on preconditioning the ocean’s response to subsequent storms may extend well beyond the immediate vicinity of the TC track42,54. These processes may further affect the cold wakes and complicate the recovery processes, but are not addressed in this study.
In the context of global warming, TC characteristics such as intensity, translation speed and frequency are expected to change34,55,56, but how these changes may affect the climate system is an area of active research. Using numerical experiments, studies have shown that in a warmer climate, the TC-induced cooling will be greater as TCs strengthen, and this could act as a buffer against future TC intensification36,40. However, the possible changes in the recovery time of cold wakes and the potential impacts on climate system have not been explored. In this study, we have demonstrated the sensitivity of cold wake recovery to changes in wind, which might be largely governed by changes in the large scale circulation such as the subtropical high or the heterogeneous sea surface warming of the ocean50,51,52. The findings from our study shed light on the complex relationship between TCs and the upper-ocean, with important implications for the changing background environmental conditions in a warming climate.
Headed out to sea and becoming extratropical!
https://www.nhc.noaa.gov/text/refresh/MIATCDAT5+shtml/180255.shtml?
https://www.nhc.noaa.gov/refresh/graphics_at5+shtml/180534.shtml?cone#contents
What is the difference between a tropical cyclone, an extra-tropical cyclone, and a typhoon?
We got a break with the hurricane staying so far off the East Coast and mainly just causing huge waves and some high water issues/erosion.
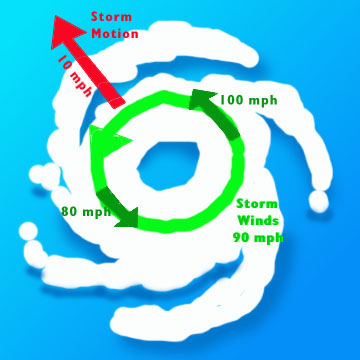
One reason the winds were not higher off the East Coast is the fact that it was on the favorable LEFT side of the hurricane, where the speed of its movement SUBTRACTS from the winds experienced along its path. Although this would mainly impact locations that are experiencing the hurricane making landfall or getting close to landfall as depicted below.
This is why we refer to the right side of hurricanes as the "dirty side"
This is where the circulation piles up the water to maximize the storm surge.
This is where the speed of the hurricane ADDs to the surface winds.

Here's another graphic depicting that principle:
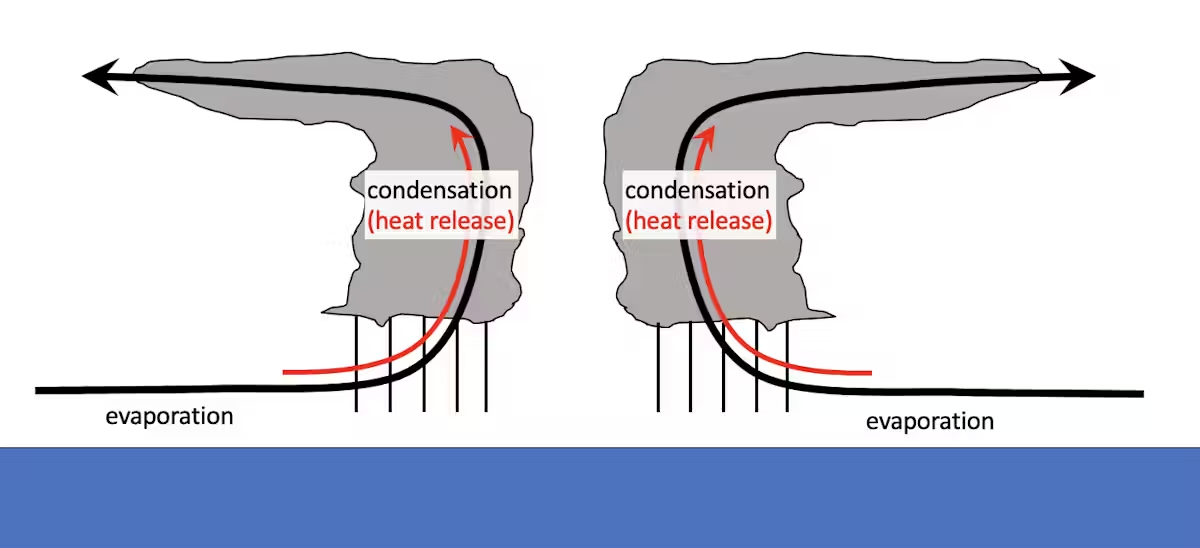
The temperature of both the ocean and atmosphere are critical to hurricane development.
Hurricanes are powered by the release of heat when water that evaporates from the ocean’s surface condenses into the storm’s rain.
A warmer ocean produces more evaporation, which means more water is available to the atmosphere. A warmer atmosphere can hold more water, which allows more rain. More rain means more heat is released, and more heat released means stronger winds.
+++++++++++++
metmike: An increase in temperature of 1 Deg. C (almost 2 Deg. F) allows the atmosphere to hold 7% more moisture. Which would equate to a potential for 7% heaver rains. 10.0 inches of rain can become 10.7 inches of rain, all other things being equal.
What about peak winds?
Scientists also have high confidence that wind speeds will increase in a warming climate and that the proportion of storms that intensify into powerful Category 4 or 5 storms will increase. Similar to rainfall rates, increases in intensity are based on the physics of extreme rainfall events.
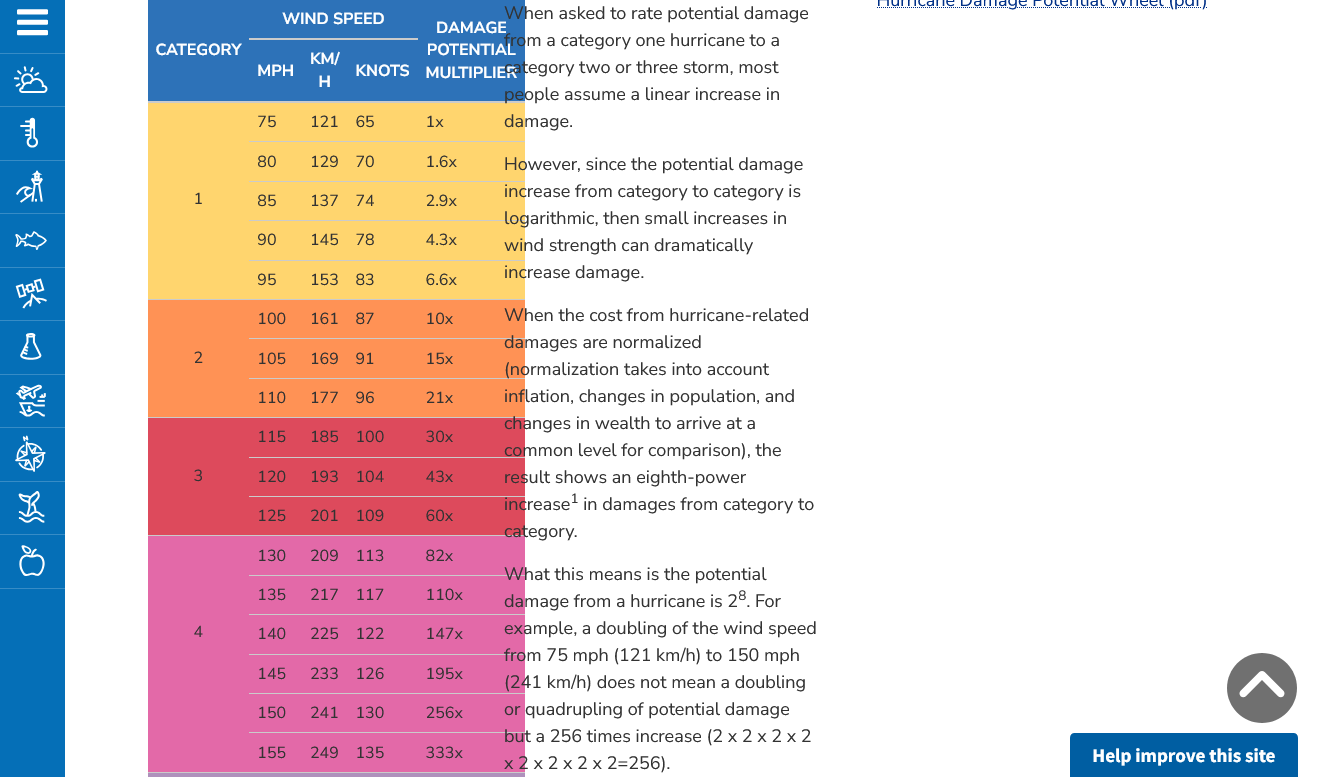
Damage is exponentially related to wind speed, so more intense storms can have a bigger impact on lives and economies. The damage potential from a Category 4 storm with 150 mph winds, like Ian at landfall, is roughly 256 times that of a category 1 storm with 75 mph winds.
+++++++++++
metmike: This means that an increase in wind speed of 10 mph, increases damage on an EXPONENTIAL/LOGARITHMIC SCALE and isn't added to the damage, the same way that more moisture equates to more rain using a LINEAR SCALE!
For instance, The added 10 mph, from 100 mph winds to 110 mph winds will DOUBLE the damage potential!!
Here's how that works:
https://www.noaa.gov/jetstream/tc-potential
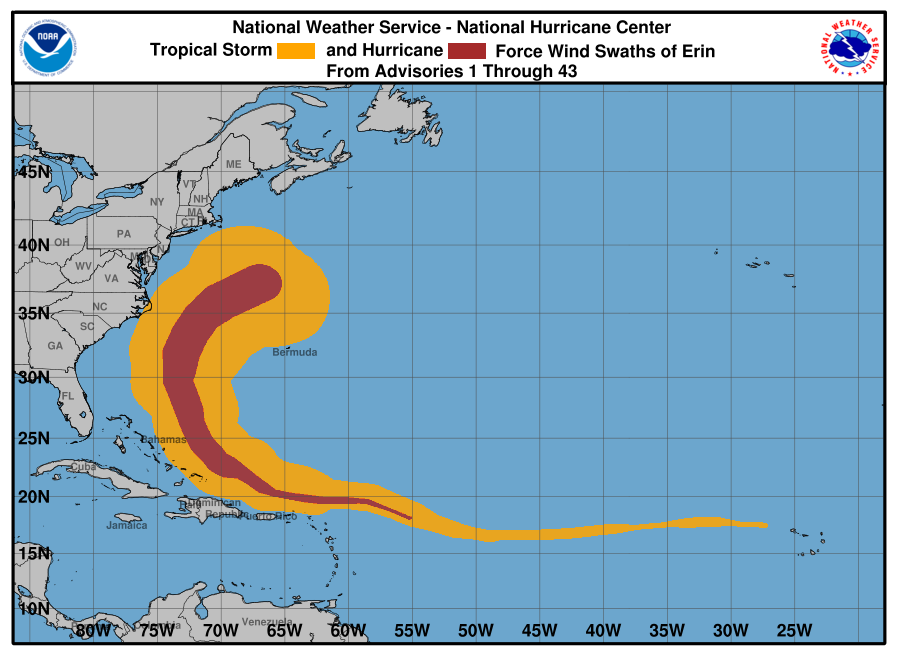
Note how much WIDER the tropical storm force wind field of Erin has expanded to even as peak winds right now are down to 100 mph. Hurricane force winds have also expanded too even though we have dropped well below major hurricane strength in the center.
https://www.nhc.noaa.gov/refresh/graphics_at5+shtml/220232.shtml?swath#contents
This is the last forecast advisory from the NHC as Erin is no longer a tropical system. It's extratropical. However, winds will still be hurricane force for 2+ more days. In fact, it actually strengthens a bit more on Sunday, back up to 100 mph and cat. 2 strength from non tropical dynamics!
https://www.nhc.noaa.gov/text/refresh/MIATCDAT5+shtml/222032.shtml?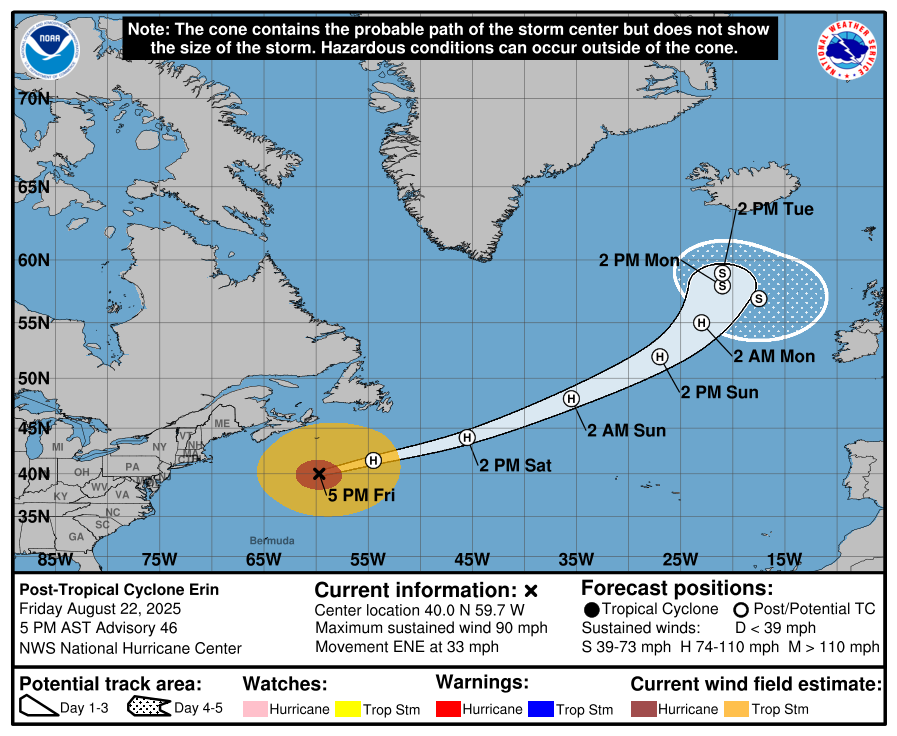
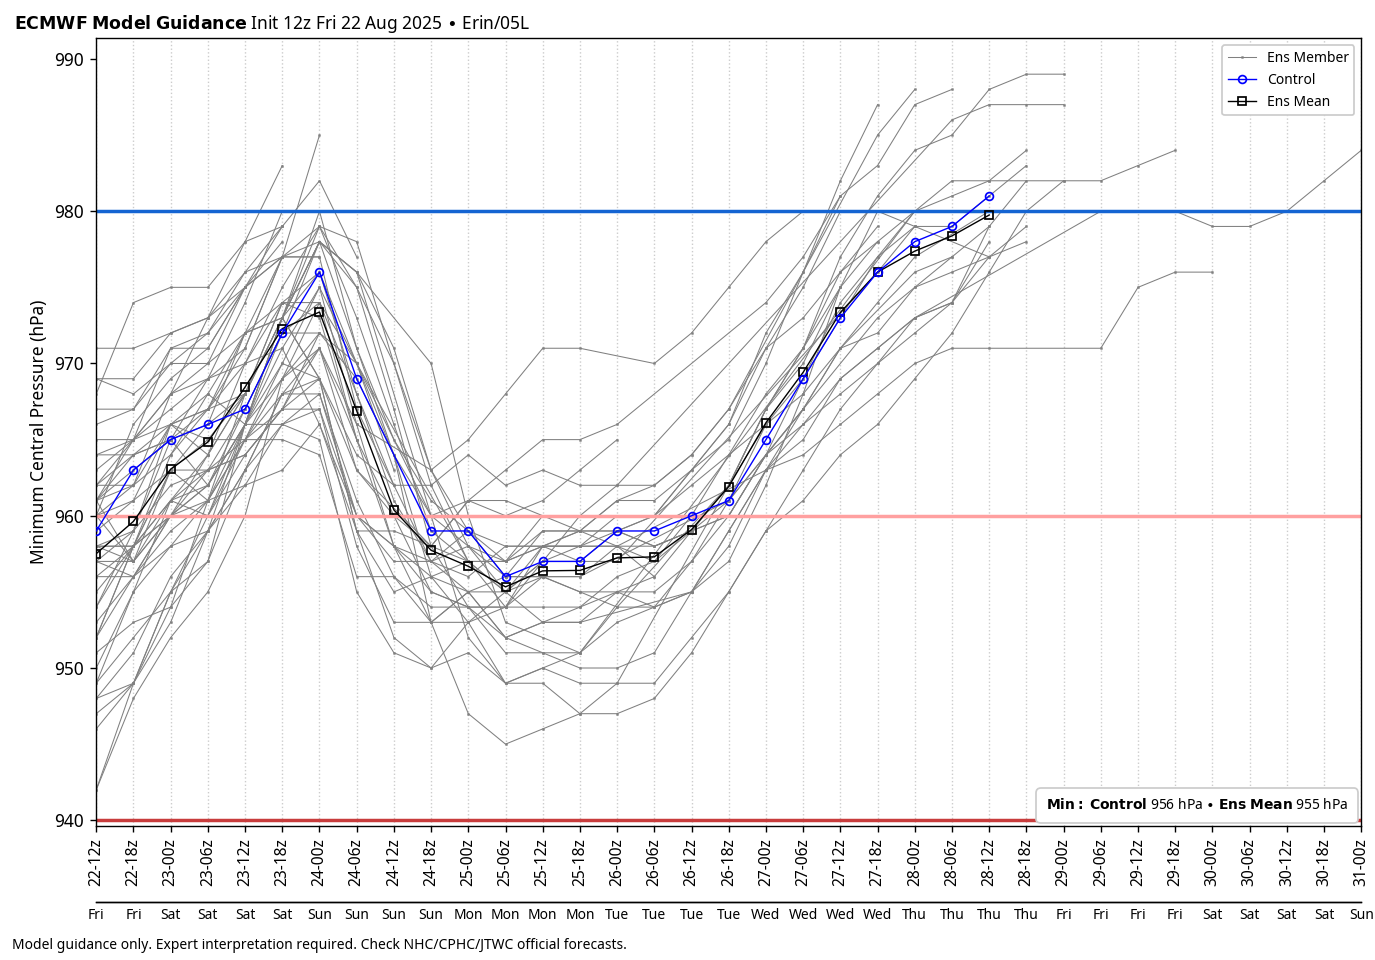
This was the surface low pressure forecast for the next 5 days from this mornings 12z European Ensemble model.
Rising pressures, with the system weakening, with falling pressure again as it strengthens again on Saturday and early Sunday. Then gradually weakening for good with slowly increasing SLP. Finally below 50 mph in 5 days.