I almost forgot about this very important crop tour!
More to come.
I salute those guys who volunteer to wonder thru corn fields in this heat but what Chip does with the numbers they gather is a disgrace. Got a lot of money I would wager after the Friday massage of the numbers as usual the tour will come in within a bu or 2 of usda......like every other year.
I read you loud and clear, mcfarm!
That is my impression too. I'm not sure how to explain it except that maybe they have a habit of looking for and highlighting below par ears that represent a tiny % of the field, because that's human nature.
In the field of scientific research, scientists are funded with an expectation/hope that they will discover new or powerful things.
If most studies were funded, then the results were described as "we found nothing new, everything was the same as previous research-you just wasted your money funding us!" Then you can bet that team won't get any more funding.
Pro Farmer, like you said are knowledgeable and generous in donating their time/experience to help communicate things that we didn't know about. I'm certain that the scouts are sincere/good people.
But they are LOOKING FOR PROBLEMS and flaws and NEW THINGS that we didn't know about to make their scouting worth more and to make their observations significant.
Honestly, I might do the same thing.
This is just a theory by me to explain this happening, almost every year based on science studies and data gathering that allows for some judgment calls in the interpretations.
By that, I compare data gathering of high temperatures with ZERO judgment. Whatever the thermometer showed is the exact number.
When it comes to corn yields, in mid August, they can't stick a yield-ometer into every ear and get 175 bu or 188 or 190 and even if they could, the % sampled would be minuscule. They have a great method to come fairly close but most of the kernels are still filling which presents tremendous uncertainty.
Karen is one of the Pro Farmer crop scouts. You can follow all her reports while she's in the field this week at her usual link:
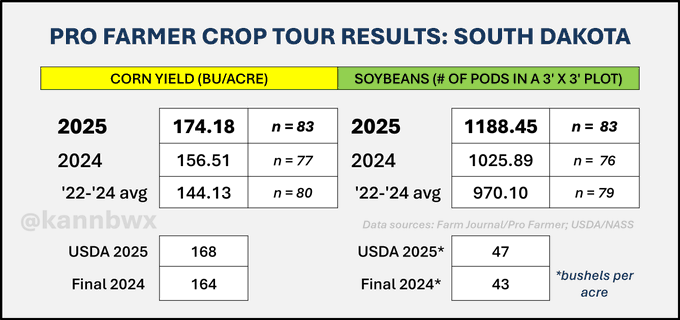
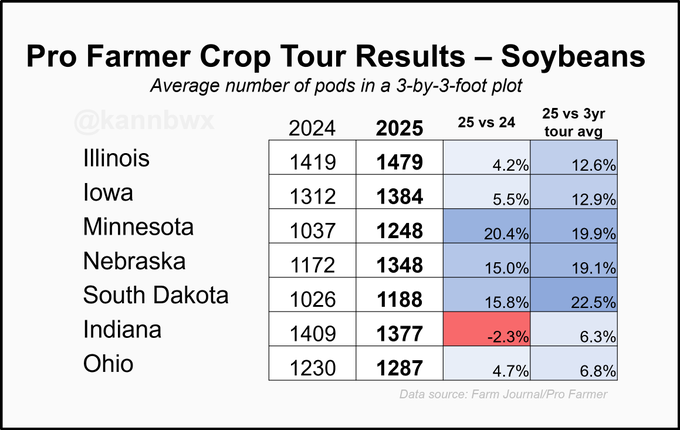
South Dakota corn yields on #pftour25 averaged 174.18 bu/acre, up 11% on the year but below 2020's tour record of 179.24. Pod counts at 1188.45 were up nearly 16% on the year, but were also below the 2020 tour average of 1250.86.
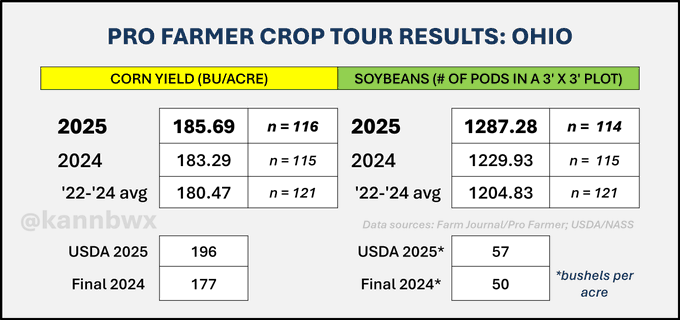
Average corn yields in Ohio were a #pftour25 record of 185.69 bu/acre, narrowly beating 2021's high of 185.06. Soybean pod counts of 1287.28 were up nearly 5% on the year, the tour's highest average for Ohio since 2014.
Here is the latest information about weather/other market related stuff.
Re: Re: Re: Re: August 12, 2025 USDA
By metmike - Aug. 19, 2025, 8:59 a.m.
Here is the latest comprehensive weather:
·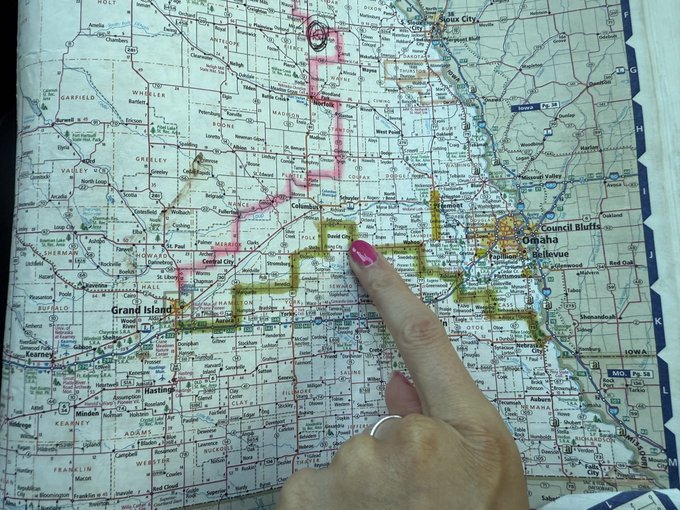
Nebraska #pftour25 day 2. Doing the first half of this route.
·
Nine stops in east central Nebraska on #pftour25. Mostly irrigated. Avg corn yield: 200 bu/acre That's down 3% from this same route last year, up 10% from 2023. Low ear counts. Avg soy pod counts: 1259 That's down 23% (!!) from last year & down 7% from 2023. Beans disappointed.
Four stops in Nebraska east of Grand Island. Average corn yield 208 bpa. That is up 1% from these same four stops last year and up 5% from 2023. Soybean pods in a 3x3' plot averaged 1247. That's down 21% from these same four stops last year and down 1% from 2023. #pftour25
USDA confirms the sale of 228,606 tonnes of U.S. soybeans for delivery to Mexico in 2025/26.
For information from ProFarmer, including details from the crop tour:

++++++++++++++
I'm thinking that tweets from the scouts during the day and summaries later in the day matter the most to traders much of the time this week!
you are correct MM. I have a close friend who does the tour every year. I trust his experience and judgment much more than the 8pm Friday night massaged numbers
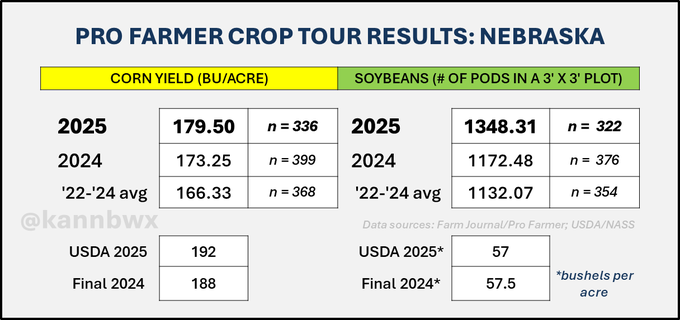
Nebraska corn samples on #pftour25 averaged to 179.5 bu/acre, up 3.6% from last year's tour but short of 2021's high (182.35). Pod counts for soybeans at 1348.31 are up sharply from a year ago and a tour best for Nebraska in over a decade.
·
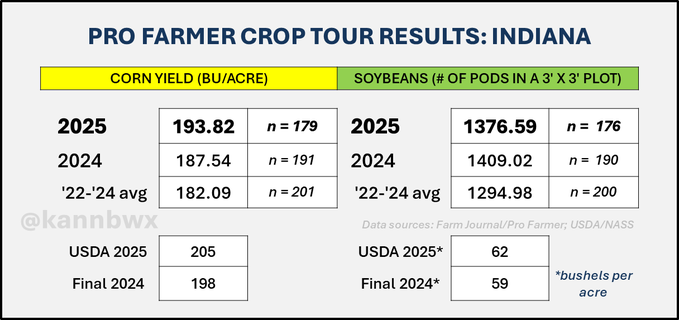
Average Indiana corn yield on #pftour25 comes in at 193.82 bu/acre, barely edging 2021's record (193.48). Pod counts in Indiana were down 2.3% from last year's tour but up 6.3% on the three-year tour average.
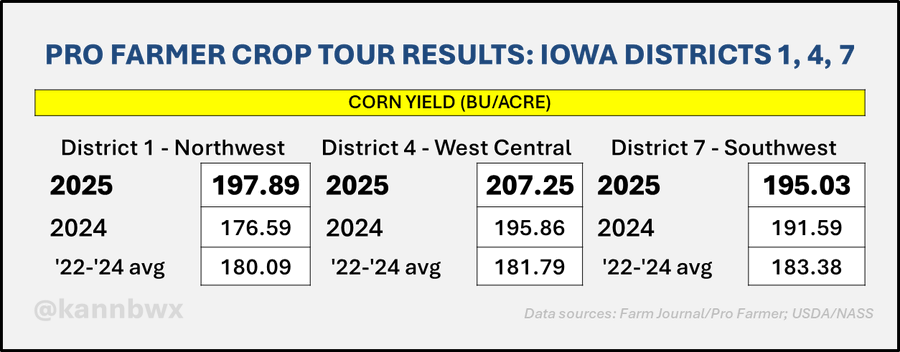
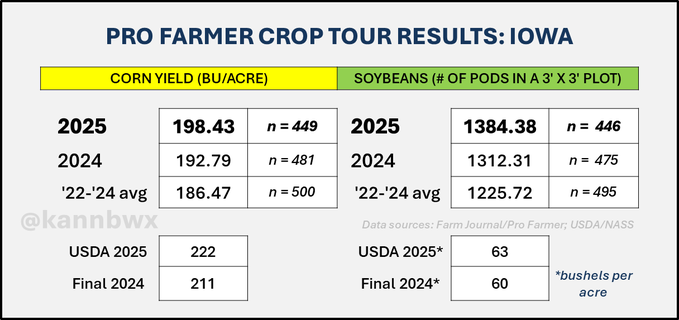
#Pftour25 results out of western Iowa suggest that record yield expectations could become reality. Average corn yields and soybean pod counts in all three western districts were the tour's highest in at least a decade.
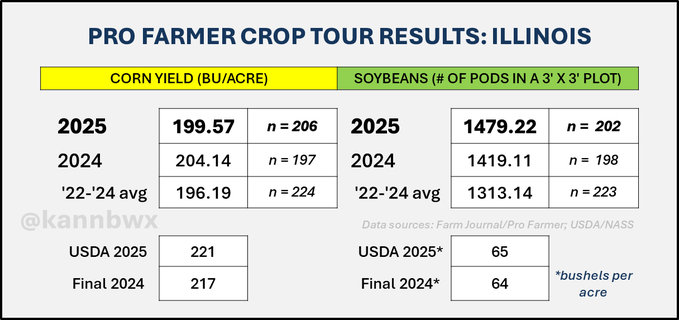
Corn yields in Illinois on #pftour25 averaged 199.57 bu/acre, down slightly on the year but a bit above the three-year average. Pod counts for soybeans were a tour record for Illinois at 1479.22 per 3x3' plot, up nearly 13% on the three-year tour average.
My route through southwest Minnesota on day 4 of #pftour25. Again, I've done this exact route for the past four years so I'm looking forward to seeing how today compares. What should I be expecting? I'm doing the first half to Winnebago.
Six stops in southwest Minnesota on #pftour25. 2025 averages shown below, including how they compare with the same six stops in prior years.
Corn = 204 bu/acre 2024 +31%
2023 +16%
2022 -8%
2021 -3%
Soybean pods = 1291 2024 +4%
2023 +24%
2022 0% 2021 -1%
#Pftour25 measures record yield potential for both corn and soybeans in Iowa. Corn tour samples averaged 198.43 bu/acre, up nearly 3% on last year's high. Soybean pod counts were also a tour record for Iowa, up 5.5% on the year.
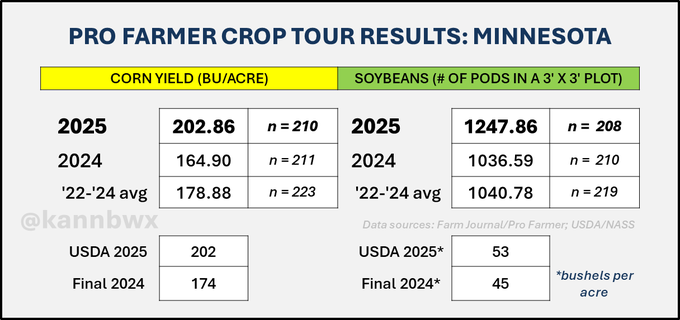
Minnesota corn yield samples on #pftour25 averaged a record 202.86 bu/acre, smashing the old record from 2020 by 4%. That's up 23% from last year's tour (USDA is up 16% YOY, by the way). Soy pod counts were up 20% from last year, the tour's highest MN pod count in over 20 years.
KaWith #pftour25 now in the books, here's a look at the state-level corn yields measured by tour scouts versus both what they found last year and on average over the last three years.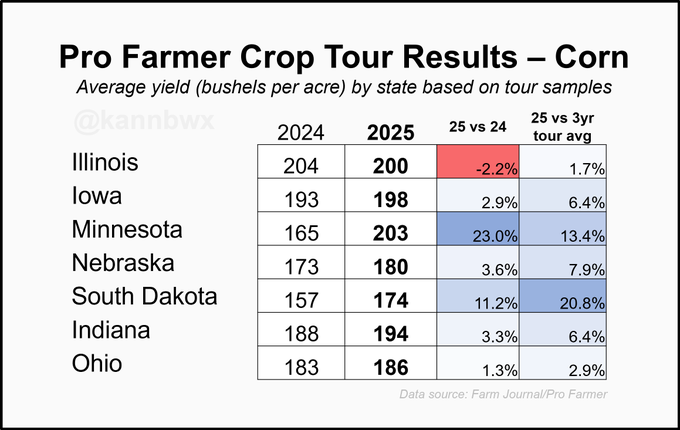
Summary of soybean pod counts by state from #pftour25. Indiana was down vs last year's tour, but everything else was higher. Huge improvements in the western belt this year versus last year and the 3yr tour average. The pods still need cooperative weather to reach potential.
Thanks to Karen for her wonderful site, stats/graphics and generosity sharing her gifts with the agricultural community!
Pro Farmer U.S. crop yield estimates:
Corn 182.7 bu/acre
Soybeans 53 bu/acre
For reference, 2025 estimates: USDA August: 188.8 / 53.6
2024 estimates: USDA August: 183.1 / 53.2
Pro Farmer August: 181.1 / 54.9 USDA Final: 179.3 / 50.7
++++++++++++++=
metmike: ProFarmer last year had the right idea by lowering the USDA corn yield.
However they INCREASED the USDA soybean yield by 1.7 and it ended up being a whopping -4.2 compared to the Pro Farmer August estimate.
+++++++++++++
We covered the flash drought at the end of last year's growing season, hurting late pod filling for beans the most.
By metmike - Aug. 4, 2025, 2:05 p.m.
All the comprehensive weather here:
https://www.marketforum.com/forum/topic/83844/
https://www.marketforum.com/forum/topic/83844/#83853
Soilmoisture anomaly:
These maps sometimes take a day to catch up to incorporate the latest data(the bottom map is only updated once a week).
https://www.cpc.ncep.noaa.gov/products/Soilmst_Monitoring/US/Soilmst/Soilmst.shtml#
![]()
DROUGHT MONITOR
https://droughtmonitor.unl.edu/
Drought area in the Cornbelt has been almost completely eliminated!!!
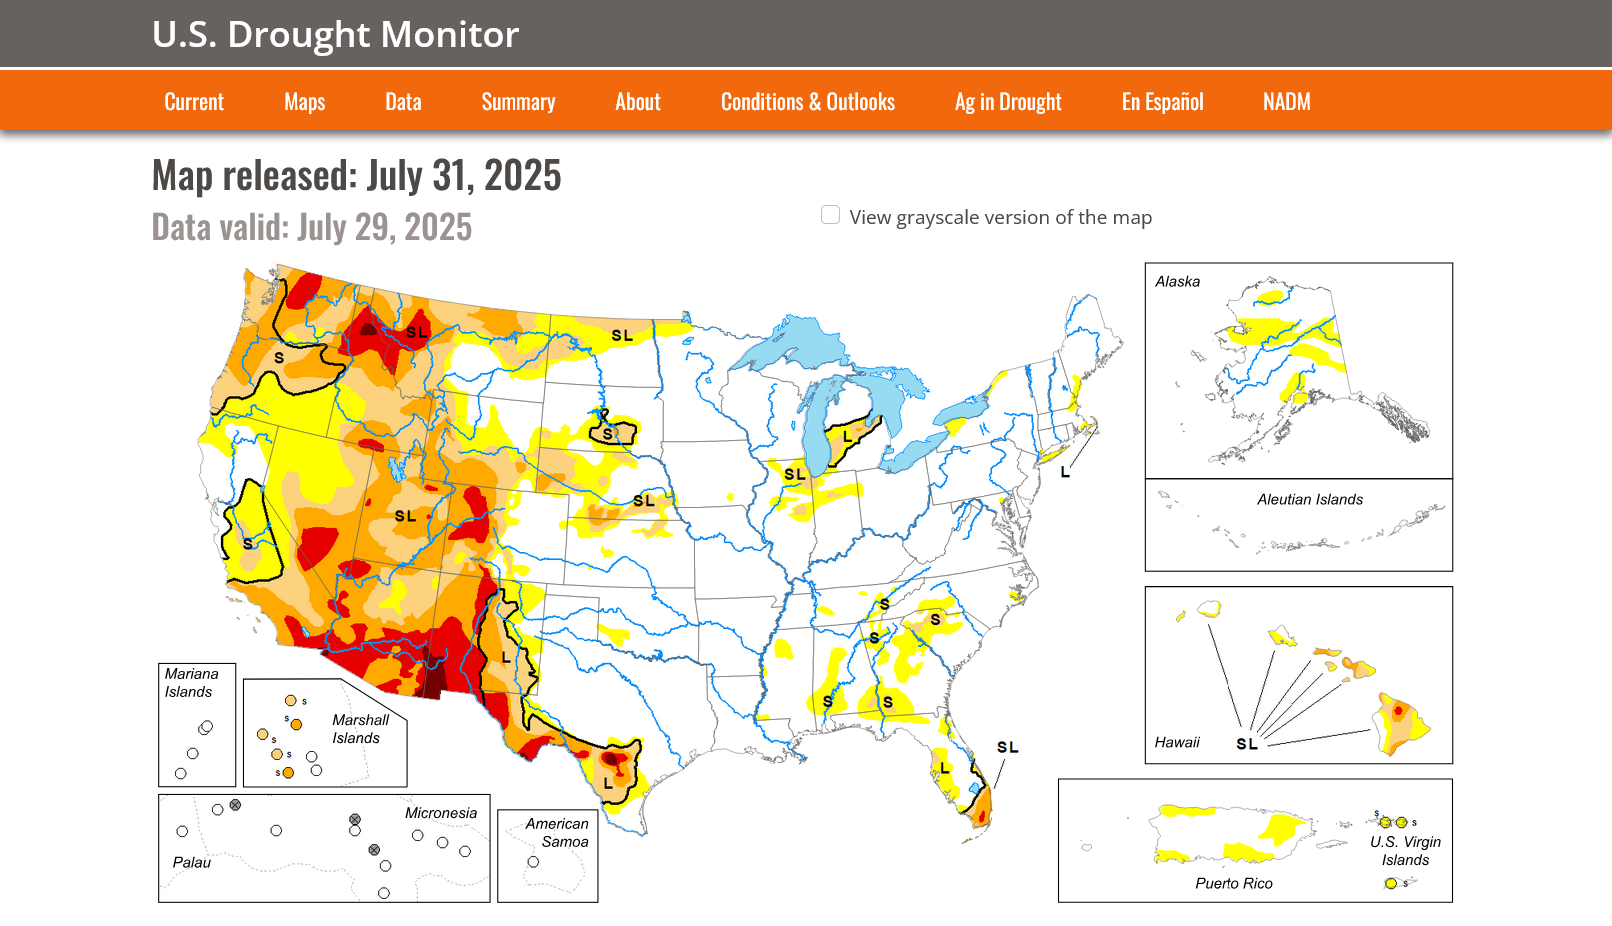
This makes it almost impossible to seriously hurt the growing crops at this stage in maturity. Last year was an exception, however because of the flash drought that happened in August/September.
This DID hurt pod fill SIGNIFICANTLY but incredibly, the USDA didn't recognize that until the JANUARY 2025 report, almost 3 months AFTER the crop was harvested. Disgraceful!
FLASH BACK/FLASH DROUGHT......1 year ago/2024:
Dryness has spread in the central USA over the last eight weeks. Some 66% of the Midwest (the most since mid-March) is now abnormally dry versus 13% in mid-July.
USDA January 10, 2025/grains
Started by metmike - Jan. 10, 2025, 11:38 a.m.
https://www.marketforum.com/forum/topic/109451/#109481
By metmike - Jan. 10, 2025, noon
EXTREMELY BULLISH!!!!!!!!
++++++++++++++++++++++++++
By metmike - Jan. 10, 2025, 12:45 p.m.