


 @kannbwx
Previous threads:
August 12, 2025 USDA
63 responses |
Started by metmike - Aug. 12, 2025, 2:12 p.m.
https://www.marketforum.com/forum/topic/113898/
+++++++++++++++++++==
Flash Drought/Heat/Weather updates
30 responses |
Started by metmike - Sept. 2, 2025, 9:39 a.m.
With a bearish report of more corn acres the market closed higher right at resistance of July 18 high.
Could traders be waking up to the lower yields from the drought in the eastern Midwest???
You may be right, cutworm!
Maybe they learned a lesson after last year???
More to come on Saturday but this one I had to share now:
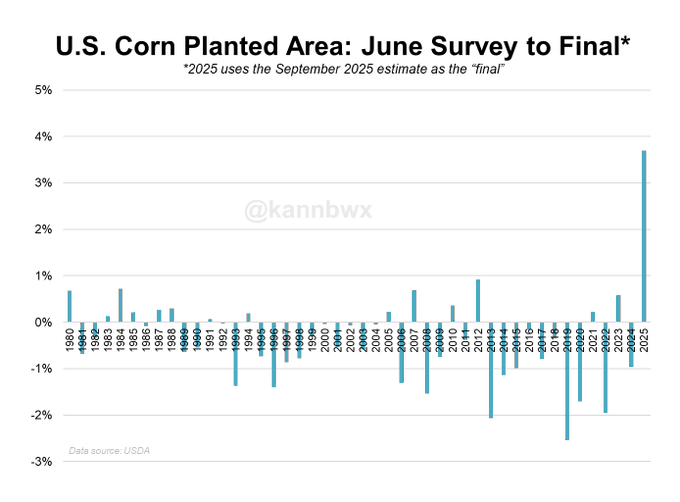
Chart of the day (week? month? year?) Not sure I really need to say much, the chart speaks for itself. I can't explain it and I'm not sure what it means going forward.
Conab boosted Brazil's 2024/25 corn and soybean crops on Thursday. The agency also reviewed and revised the past five years of soy crops, resulting in a 13.12 mmt increase in production overall. Despite the bigger corn crop, Conab didn't hike corn exports.
USDA increased Brazil's 24/25 corn crop to 135 mmt but left all other major South American crop estimates unchanged from last month.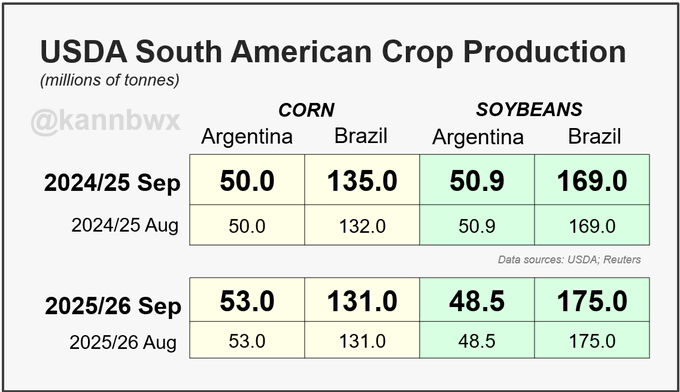
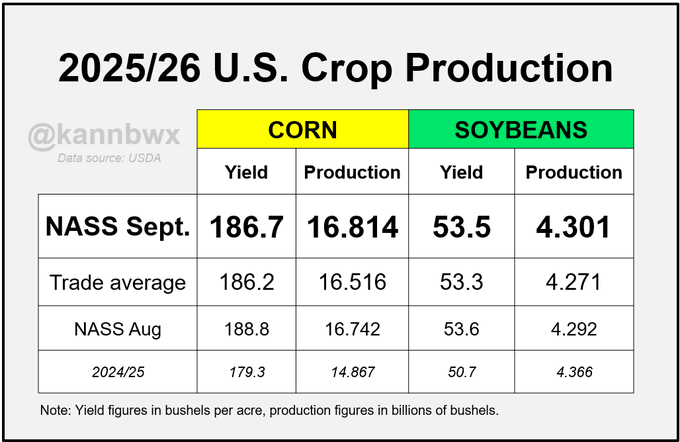
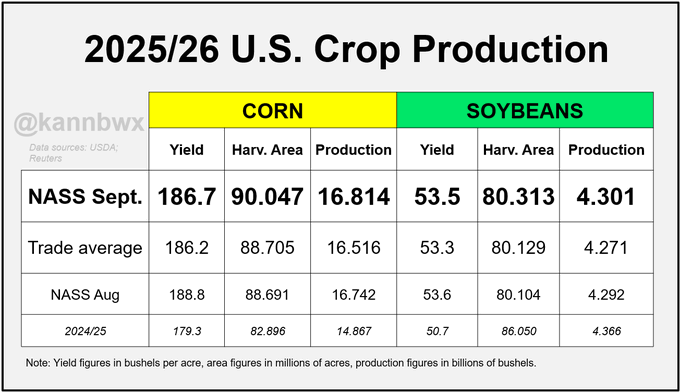
USDA reduced U.S. corn yield but hiked planted area by another 1.4M acres, so production went up. Bean plantings were up slightly as well.
U.S. corn production is now expected at a whopping 16.8 billion bushels (427 mmt) with harvested area above 90M acres. Bean yield came down a hair but area also increased there.
·
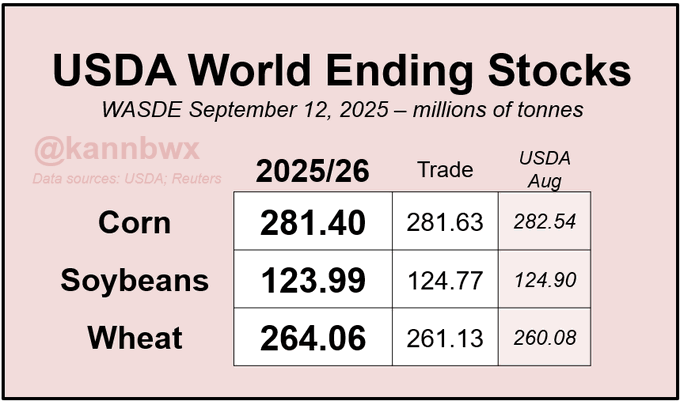
USDA increased 2025/26 world wheat stocks by much more than expected after harvest increases in Russia, Ukraine, Canada, Australia and the EU.
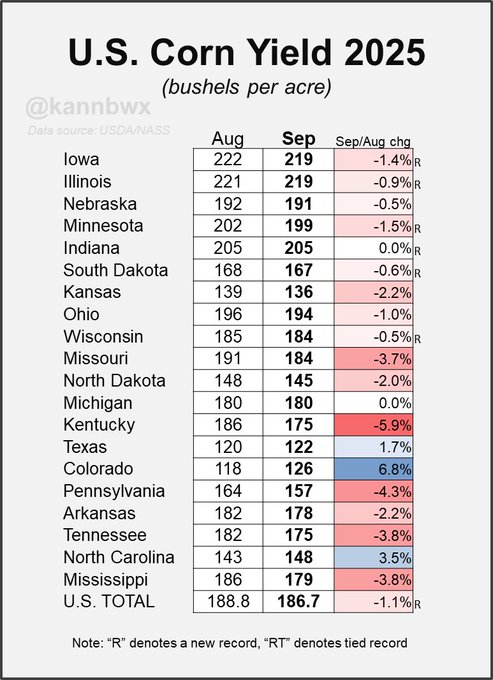
U.S. corn yield is expected at a record 186.7 bushels per acre, but most states are seen with lower yield potential versus a month ago.
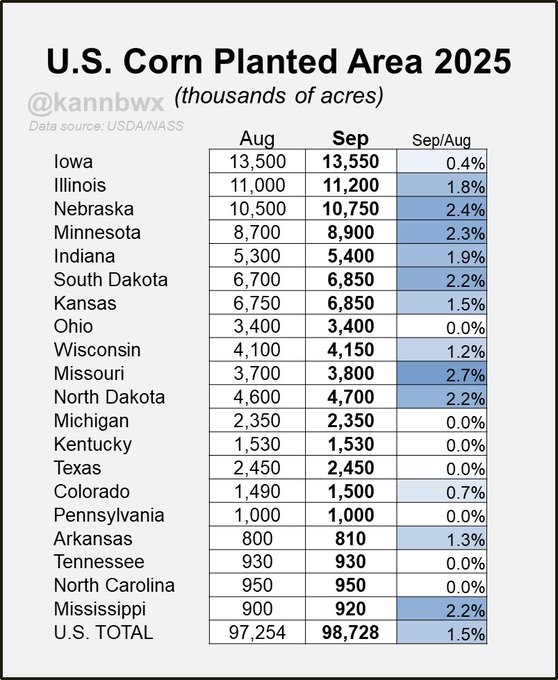
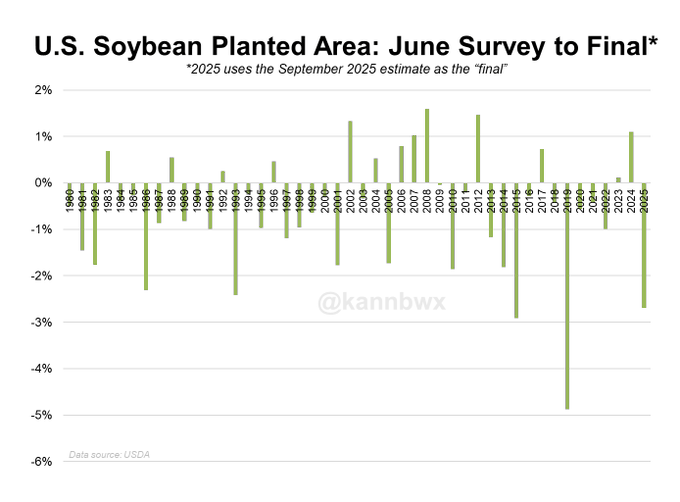
U.S. corn planted area increased by 1.5% from last month. The new figure - 98.73 million acres - is the largest planted area since 1936.
metmike: WOW!!!! WOW!!!!!!!!
The question we are all now asking. How did we find 3.5 million more corn acres since the June survey?
Chart of the day (week? month? year?) Not sure I really need to say much, the chart speaks for itself. I can't explain it and I'm not sure what it means going forward.
metmike: WOW!!!!!!!!!!!
+++++++++++++++++++
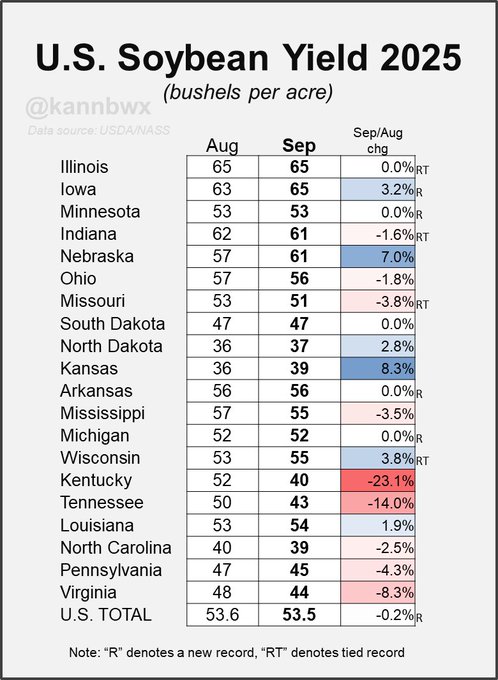
U.S. soybean yield is seen slightly lower than last month's forecast, but 53.5 bushels per acre would still easily beat 2016's record of 51.9.
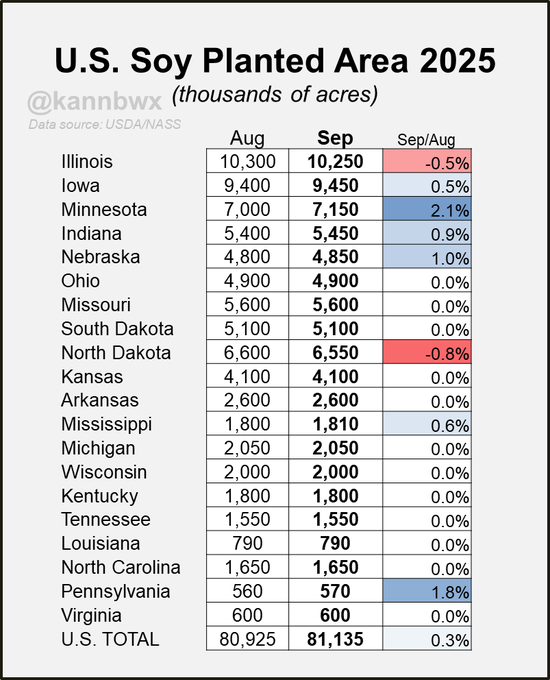
U.S. soybean planted area increased 0.3% from last month's estimate, including higher acres in Iowa, Minnesota, Nebraska and Indiana.
The anomaly would also be large for soybeans but not suspiciously large. 2019 can be explained by the spring flooding but 2015 was also in the mix - no planting problems then.
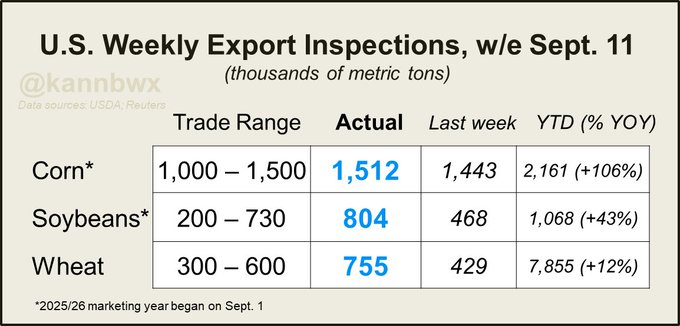
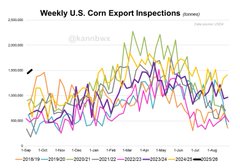
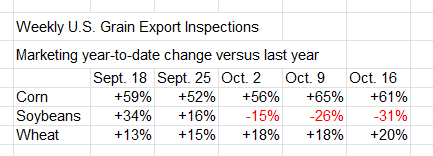
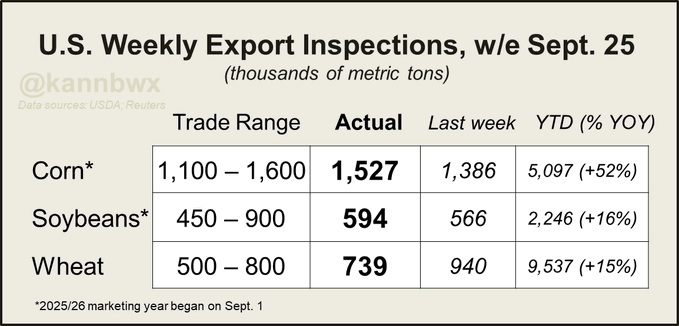
Last week's U.S. export inspections of corn, soybeans and wheat all topped trade expectations. No cargoes to China, but destinations were otherwise plentiful and diverse for all three crops.
Very strong start to 2025/26 for corn and very respectable one for beans as well. Problem with soybeans is that there aren't too many sales on the books. USDA's new 2025/26 U.S. soybean export target of 1.685 billion bushels is the agency's lowest September print since 2013.
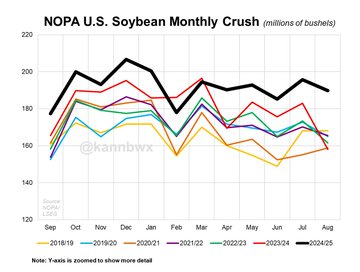
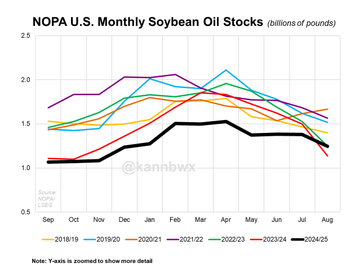
NOPA U.S. crush, August 2025:189.810 mln bu of soybeansAbove all trade guesses (avg was 182.86 mln)p 20% on the year, 13% above prior Aug record (2019)Soyoil stocks 1.245 bln lbsBelow avg trade guess of 1.298 blnUp 9.4% on the year
·
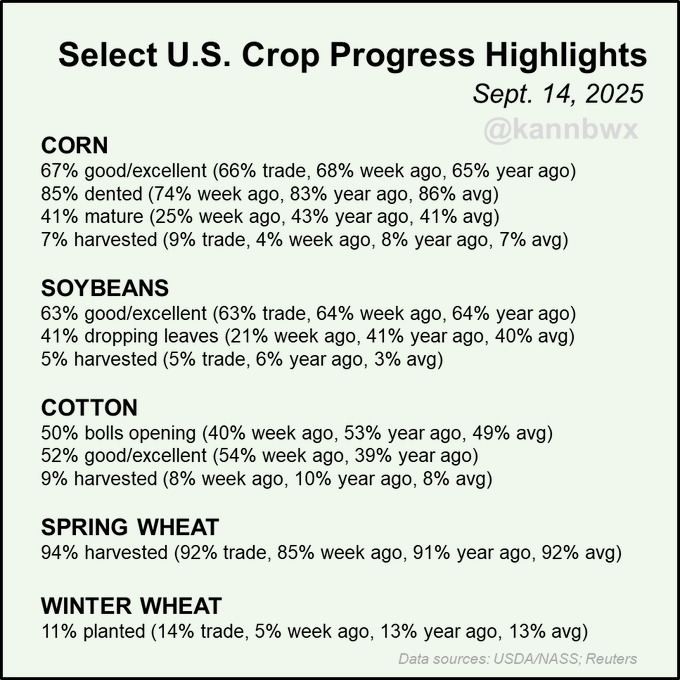
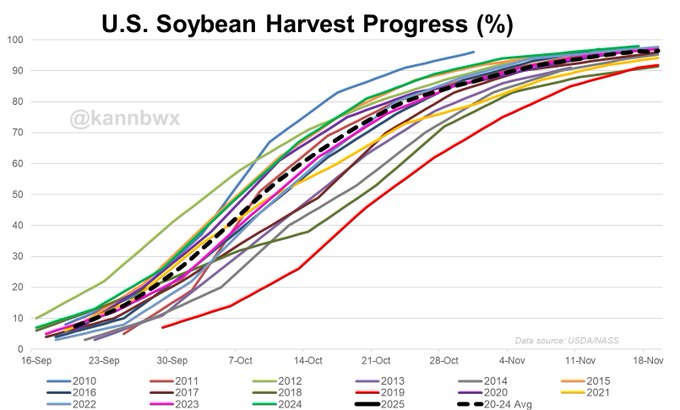
U.S. corn and soybean harvest is in the early stages and moving a hair slower than a year ago. Spring wheat harvest is just about finished, but winter wheat planting is going slower than expected.
Here's U.S. soybean harvest progress. By Sept. 30, just over 24% of beans have typically been cut. That jumps to 87% by Oct. 31.
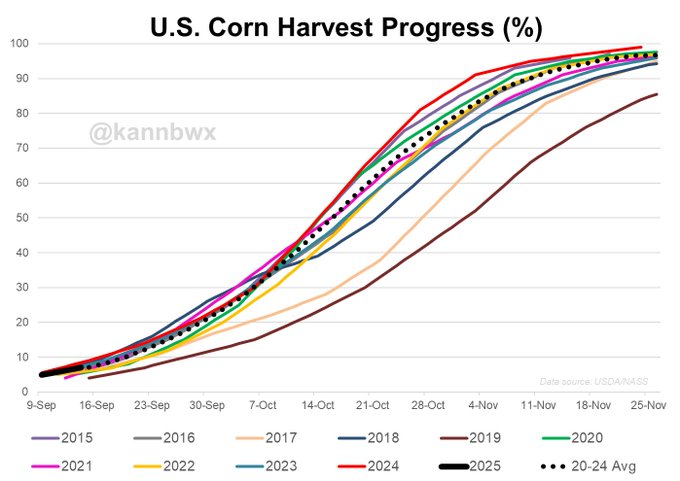
It's still early in the 2025 U.S. corn harvest, but this is how we might expect it to progress. Most years are pretty tightly packed along the average, there's not as much variation in harvest as there is in planting. By Sept. 30, corn is usually 21% harvested. Oct. 31 = 79%.
Matt was in with the weather this morning!
Eric was in on Wednesday for his wonderful analysis:
https://www.youtube.com/watch?v=bxdmIK5oJE8
Eric on Friday:
with all the griping about Trump this and Trump that I suppose its no wonder nobody reported grain exports for 25 are ahead of 24 even with the tariffs. True cotton and beans are slow but guess what? With China buying many of the SA supplies the rest of the world will come where? We can do 2 things at once.
We have had just 4/10ths of rain since aug 1st and the the crops are showing it. If you are lucky enough to be on deep productive prairie soils the early beans will be good,,,,not great. the later beans are hurt badly with small seed size, podded too far apart, only 1 or 2 beans in many pods, light test weight will be critical also.
Thanks, mcfarm!
I'm sure you're aware that the price of beans would be $1+ higher if not for Trump's tariffs on China...........which have changed half a dozen times.
I agree 100% with your points regarding the impact of the flash drought in August/September 2025, just like the same thing that happened in August/September 2024.........that only took until January 2025 for the USDA to report on .
FLASH BACK/FLASH DROUGHT......1 year ago/2024:
Dryness has spread in the central USA over the last eight weeks. Some 66% of the Midwest (the most since mid-March) is now abnormally dry versus 13% in mid-July.
USDA January 10, 2025/grains
Started by metmike - Jan. 10, 2025, 11:38 a.m.
https://www.marketforum.com/forum/topic/109451/#109481
By metmike - Jan. 10, 2025, noon
EXTREMELY BULLISH!!!!!!!!
++++++++++++++++++++++++++
By metmike - Jan. 10, 2025, 12:45 p.m.
+++++++++++++++++
Here's the discussion last August/September while that flash drought in 2024 was happening AND LOWERING YIELDS. cutworm was right on it too!
Beans
62 responses |
Started by baker - Aug. 8, 2024, 7:36 p.m.
https://www.marketforum.com/forum/topic/106521/
+++++++++++++++++++++++
By cutworm - Sept. 13, 2024, 7:22 a.m.
The drought here in the last 1/2 of August and September has come as beans were filling out. I expect that yield prospects here have declined 5,6,7 bushels here from what we were looking at in late July.
JMHO
+++++++++++++++++++++++++++++++++
By metmike - Sept. 1, 2025, 2:07 p.m.
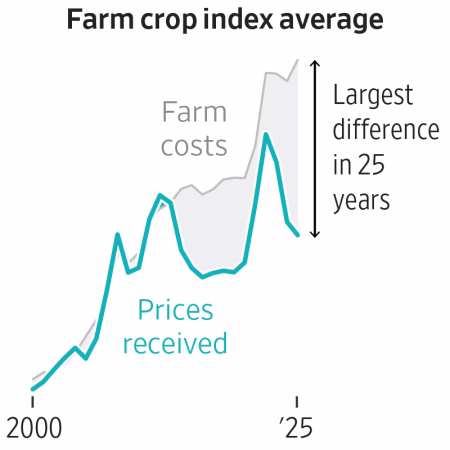
Corn and Soybeans Rule the American Farm. Why That’s a Growing Problem, in Charts
Farmers are expected to harvest one of the largest crops in history in the coming weeks, according to the U.S. Department of Agriculture. The harvest follows several years of bumper crops for farmers, fueling a glut that is driving down commodity prices. Weaker prices are crimping profits and farmers’ ability to stay afloat.
Technological advancements from the world’s largest seed and pesticide companies are expected to increase harvests in the coming years.
1. We keep hearing/reading about how climate change is causing adverse weather for agriculture and its going to keep getting worse.........even as it keeps getting better and better. CO2 is a beneficial gas and free atmospheric fertilizer on top of this being a climate OPTIMUM for life on earth, with PLANT LIFE, including crops benefiting the most.
https://www.marketforum.com/forum/topic/69258/
2. Trump's tariffs couldn't have come at a worse time. Soybeans are at least $1 cheaper because China, our #1 buyer has been buying ALL their beans from South America. Costs are going higher from inflation, which has also gotten worse because of Trumps tariffs.
We haven't seen a radar image like this in Evansville, IN for almost 2 MONTHS, with much more to come
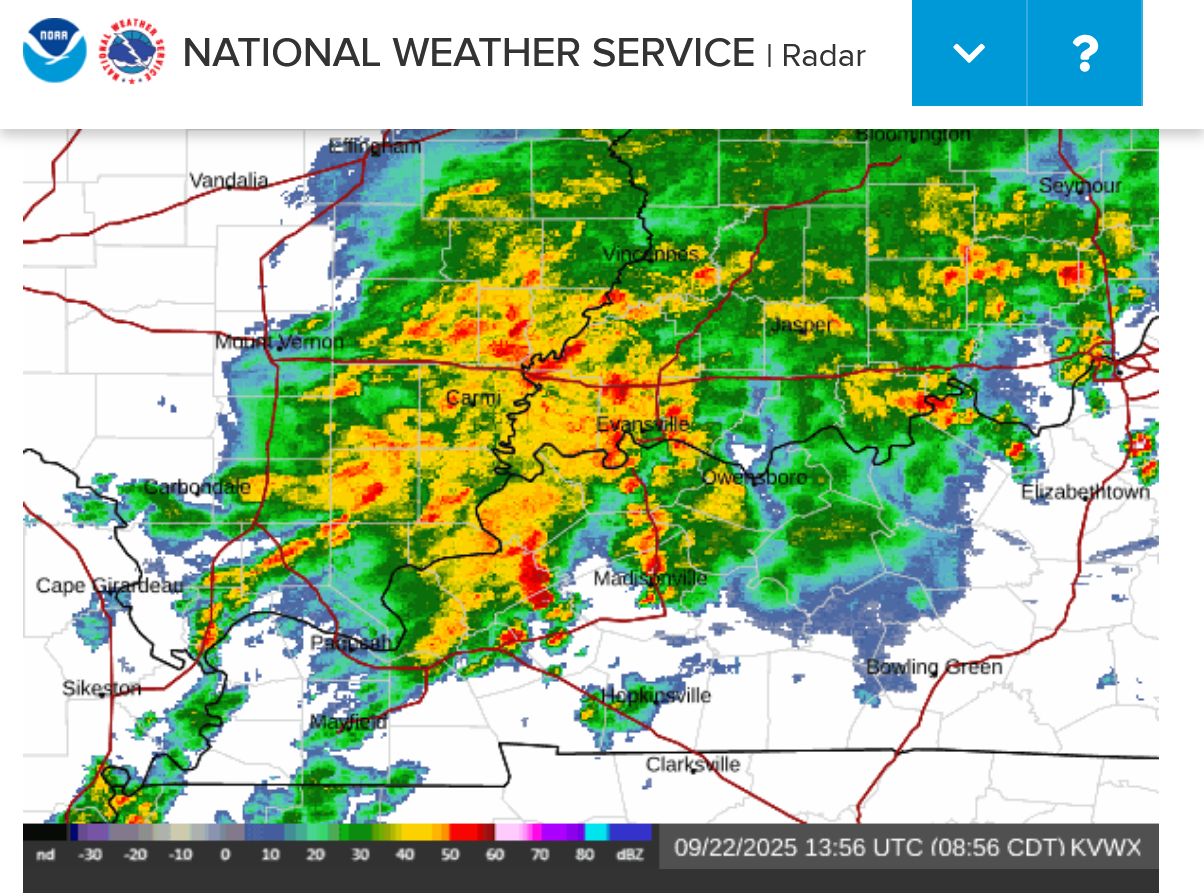
Local radar Super Resolution Base Reflectivity
2pm: 1.55 inches of glorious rain!!!
Well here are the numbers for 2024 and do not see anything reflected there that would of spurned beans to suddenly go up a dollar. Looks more like China wants to play hard ball and we should not fear that. We can compete and not let China infect SA in further than it already has. They are diving deep into the interior of that country with little push back.
mcfarm,
Thanks for the review of information from a year ago and before then!
This is the calendar that the rest of us and the markets are using:
Monday, September 22, 2025
++++++++++++++++++++++++++++++++==
The group below might know a thing or 10 about this topic!
Aug 20, 2025
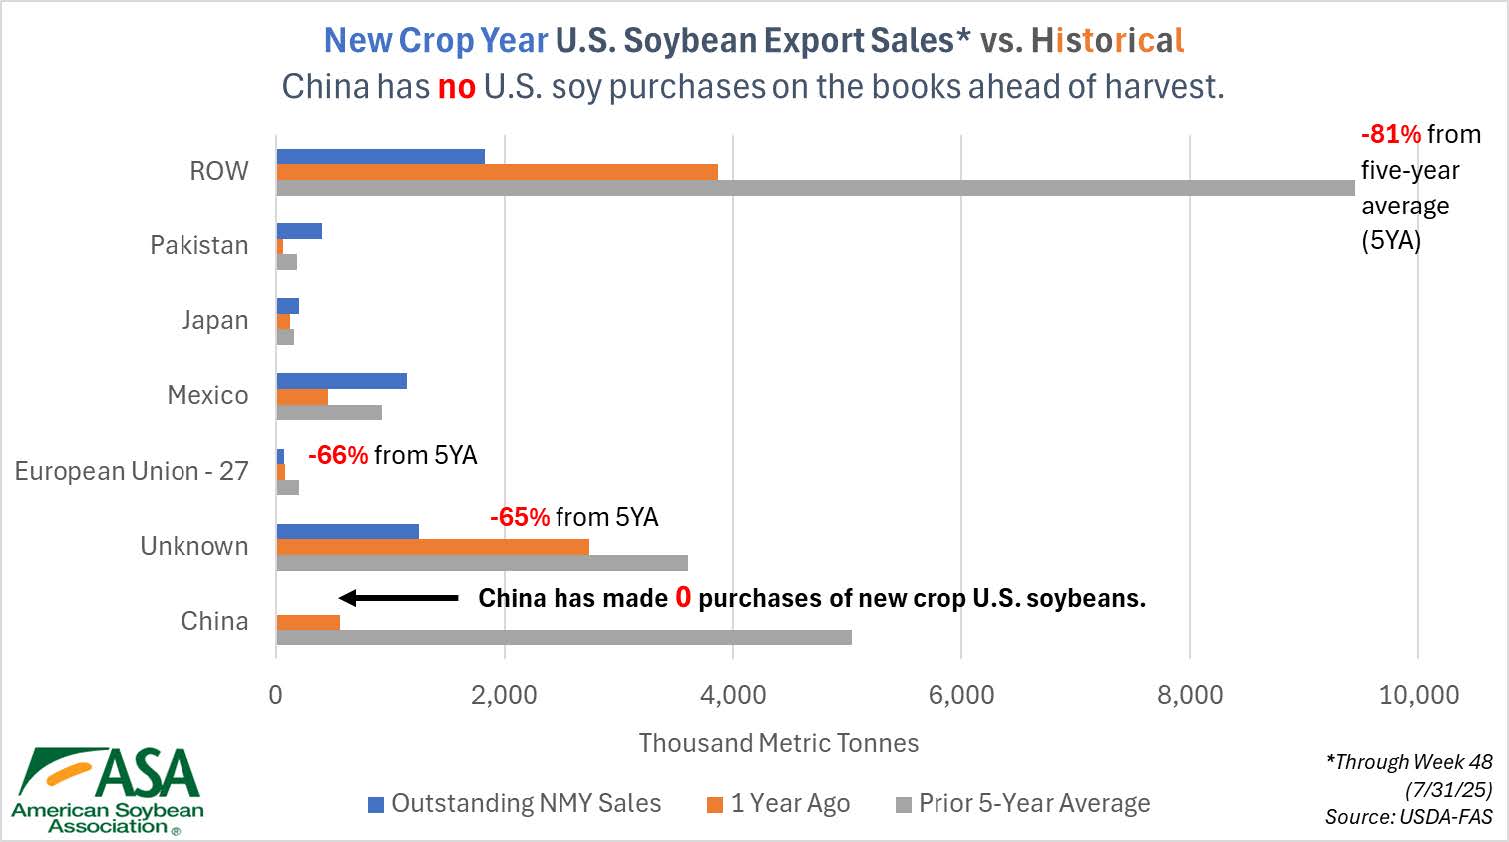
https://soygrowers.com/news-releases/soybeans-without-a-buyer-the-export-gap-hurting-u-s-farms/
Farmers can’t afford casual trade policies when China walks away from U.S. soy
By the American Soybean Association
China is the world’s largest soybean buyer, and the competition is nowhere close. Over the last five soybean marketing years, China has imported an average of 61% of the world’s traded soybean supplies, more than the rest of the world combined.
mcfarm,
Whether you want to completely deny it or not, the facts are the facts and this is just 1 example of hundreds that illustrate the massive damage that Trump's tariffs are doing to the US and rest of the world.........and it ain't even close. Free global markets and free trading benefit everybody on both sides!
It's an indisputable principle that people who actually understand this topic know.
It's just too bad that the most powerful man in the world and our president has no clue. Ironically, this is happening as he characterizes everybody that disagrees with him as stupid.
It's impossible for you to win a debate on this mcfarm because ALL THE AUTHENTIC FACTS contradict Trump's position and whatever Trump says, that is YOUR position.
Me? I just stick with the authentic facts, regardless of where they are coming from.
More delusional tariffs!
Started by metmike - Sept. 14, 2025, 5:51 p.m.
https://www.marketforum.com/forum/topic/114673/
++++++++++++++
I encourage you to continue to voice your (MAGA) opinions here. It helps us to understand your positions and why they exist.
If I disagree, I will always respect you and give you authentic facts/data/evidence for doing so.
Your Indiana friend,
metmike
Facts? I know some facts. Sub 10 dollar beans are a tough row right now. But do you have a clue about input costs and what they have done since the early days of covid. Yes nearly every input....seeds, fert ,chem. fuel, insecticides, fungicides, parts and equipment, rent etc have doubled to tripled just as crop prices have tanked with the record crops you talk about. And although I thank the various commodity groups for the data they too have increased their take of the farmers check even before the farmer gets to cash it. It is taken as the truck is weighed even before its dumped. Those guys do some good work I am sure but they do an awful lot of travel and dining in exotic locations, I will never see, on the farmers dime. Inputs have not adjusted for years. Only risen in fact for example MAP an blend of dry fert of 11%N 52% phosphate is now 300 dollars more than just last spring and the budget last spring did not show a break even.
Facts? I know some facts. Sub 10 dollar beans are a tough row right now. But do you have a clue about input costs and what they have done since the early days of covid. Yes nearly every input....seeds, fert ,chem. fuel, insecticides, fungicides, parts and equipment, rent etc have doubled to tripled just as crop prices have tanked with the record crops you talk about.
++++++++++
I hear you loud and clear, mcfarm!
That was my point in these posts:
Re: Re: Re: : USDA September 12, 2025/Grains
By metmike - Sept. 21, 2025, 7:48 p.m.
++++++++++++++++
By metmike - Sept. 1, 2025, 2:07 p.m.
Corn and Soybeans Rule the American Farm. Why That’s a Growing Problem, in Charts
+++++++++++++
By metmike - Sept. 1, 2025, 2:29 p.m.
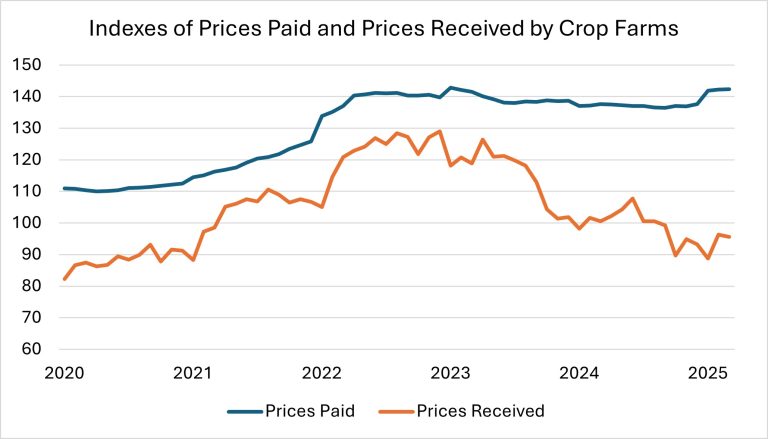
Fertilizer prices gain momentum amid strong demand and geopolitical tensions
Trade policies and sanctions are playing an increasingly significant role in reshaping global fertilizer markets.
After returning to pre-pandemic levels, fertilizer affordability has deteriorated. A recent surge in fertilizer prices—coupled with declining agricultural commodity prices—has made fertilizers less affordable for farmers. For instance, the affordability index for DAP (diammonium phosphate) has surpassed its early 2022 peak, while the indexes for urea and MOP (muriate of potash, or potassium chloride) have reversed their downward trends since the end of 2024.
+++++++++++++++++++++++==
https://www.worldstopexports.com/top-fertilizers-exports-by-country/
Below are the 30 countries that exported the highest dollar value worth of fertilizers during 2024.
+++++++++++++++++
https://uswheat.org/wheatletter/u-s-farmers-pinched-by-high-costs-and-low-prices/
+++++++++++++++
https://blogs.ifas.ufl.edu/nfrecsv/2025/05/14/farm-input-costs-rise-and-commodity-crop-prices-fall/
+++++++++++++++++++++++
The latest round of tariffs is likely to make agricultural production even more expensive and, potentially, limit access to goods not produced in the United States.
https://www.nytimes.com/2025/08/01/business/economy/tariffs-agriculture-costs-farmers-consumers.html
Eric's weather on Monday:
Matt was in with the weather on Tuesday morning:
Sep 23, 2025: Carolina Tropical Threat | Mid-South Rain & Storms | Pacific Chat | Where's the Frost?
https://www.youtube.com/watch?v=xxy5P8LdpJk
+++++++++++++++++
I remember this record low of 36 degrees, 30 years ago. It was a Saturday but I was margined out, long with a position on November Soybeans!!!
This was before the internet. Beans in this area were planted late and were still green. Same for much of IL, which is the state that harvests the most beans. A freeze would definitely hurt them.
I was monitoring temps with my own private weather service using a satellite dish on our roof, though that was pretty tough before the internet.
After seeing the above freezing lows around the area, my initial thought was........OH, OH! No freeze this weekend with early harvest in progress means a sharply lower open on Monday and my long position suffering a big loss!!!
Then I went outside to water our garden(it had been extremely dry) and no water came out.
What the heck? Turns out that the water in the hose that was ON THE GROUND was completely frozen.
Official thermometers are 6 feet above the ground. So that morning, we had an extreme inversion(typical of nights with clear skies, no wind and dry air and optimal radiation cooling at the surface) with temps on the ground, being 10 degrees colder than the NWS thermometers just 6 feet higher.
Same thing on Sunday morning. That intense, radiation freeze took away around 100 million bushels of production based on estimates.
So the beans opened HIGHER on Monday morning at 9:30 am. Before Project A(overnight trading).
Record low for Evansville today in 1995.
https://www.extremeweatherwatch.com/cities/evansville/record-low-by-day
| September 23 | 36 | 1995 |
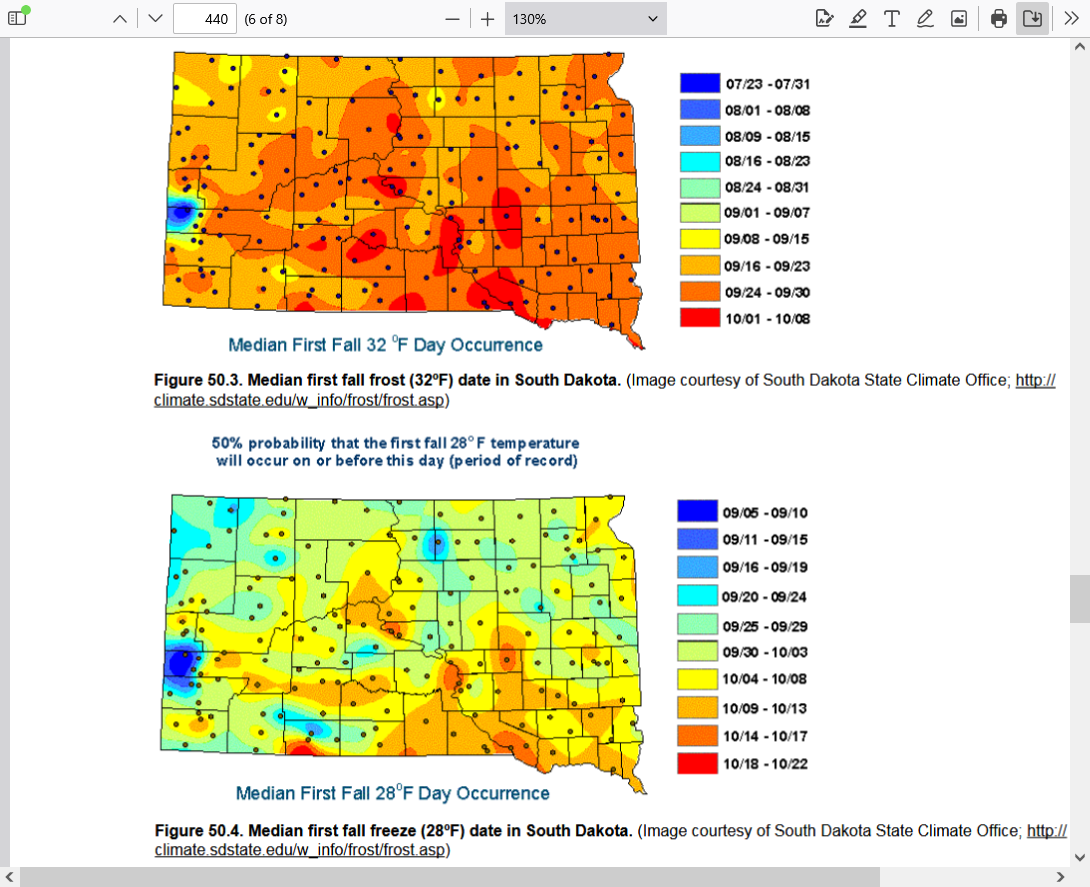
Freeze dates in the Midwest
by metmike - Aug. 22, 2023, 9:26 p.m
This article appeared in the NYT BEFORE the freeze damage on Sept. 23/24 1995. I bought beans near the close on Friday, Sept. 22, anticipating the freezes in the Central/Eastern Cornbelt.
The article was about less damage in the UPPER MIDWEST, previous to Sept. 23.
+++++++++++++++++
Earlier in the week, when the freeze potential first showed up on the maps, soybeans hit limit up(30c back then)
++++++++++++++++++++++++++
metmike: After the freeze damage, many of the immature beans, instead of leaves gradually going from green to yellow with natural maturity in sync with late pod filling, TURNED BLACK because of premature DEATH. Ending the pod filling!
Estimated losses were from 100-200 million bushels in IL/IN.
+++++++++++++++
cs-D WEEKLY
OUTLOOK
Cooperative
Exlension
Service
https://farmdoc.illinois.edu/assets/marketing/weekly/1995/1995-09-25.pdf
SEPTEMBER 25. 1995
SOYBEANS: HARVEST PRESSURE VERSUS SMALLER CROP EXPECTATIONS
The USDA will provide an updated estimate of the size of the 1995 crop on October 1 1 .
That report will reflect conditions as of the last week of September and should capture
information about seed size and reflect early yield results. That report, however, may not
fully reflect the effect ol lreeze damage. Potential yield of damaged crops will be nearly
impossible to judge.
The size of the soybean crop is especially critical this year. A smaller estimate could
change the supply/demand balance from one of surplus to one requiring some modost
rationing ofuse. That is, based on the cunent crop estimate soybean crush and exports
could remain at the record level of this past year without reducing year ending stocks
belor 275 million bushels. On the other hand, a 2-bushel reduction in the average yield
would reduce ending stocks below 200 million bushels, even with a 50 million bushel
reduc{ion in use as projected by the USDA.
https://sheboygan.extension.wisc.edu/files/2010/10/Soybean-Response-to-Freeze-Damage.pdf
Table 1. Soybean Response to Freeze Damage
Growth Stage Yield Reduction
R4 – Full Pod 70%-80%
R5 – Beginning Seed 50%-70%
R6 – Full Seed 15%-30%
R7 – Beginning Maturity 0%-5%
R8 – Full Maturity 0%
Source: Saliba et. At. Kansas State University, 1982
Specific damage characteristics will depend on stage of development
https://extension.sdstate.edu/sites/default/files/2020-03/S-0004-50-Soybean.pdf
+++++++++++++++++
Department of Agronomy Fall Freeze Damage in Summer Grain Crops
https://bookstore.ksre.ksu.edu/download/fall-freeze-damage-in-summer-grain-crops_MF2234
+++++++++++
https://fieldcropnews.com/2013/09/what-happens-to-soybeans-when-they-get-frosted/
https://www.youtube.com/watch?v=-u_G_gyJoVY
New website from Eric:
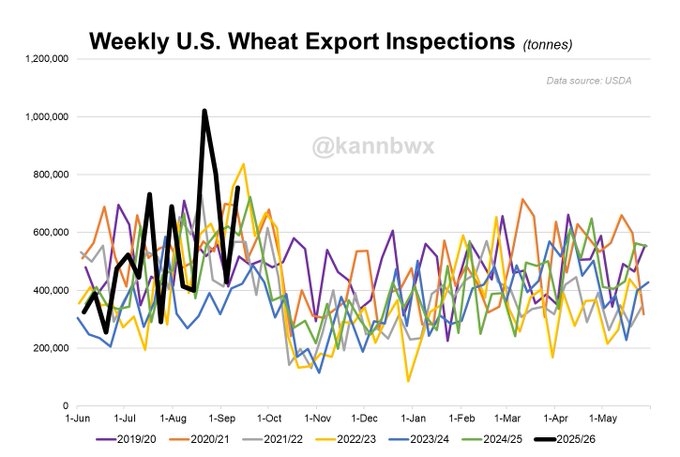
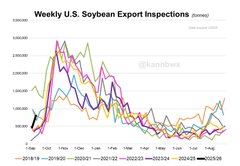
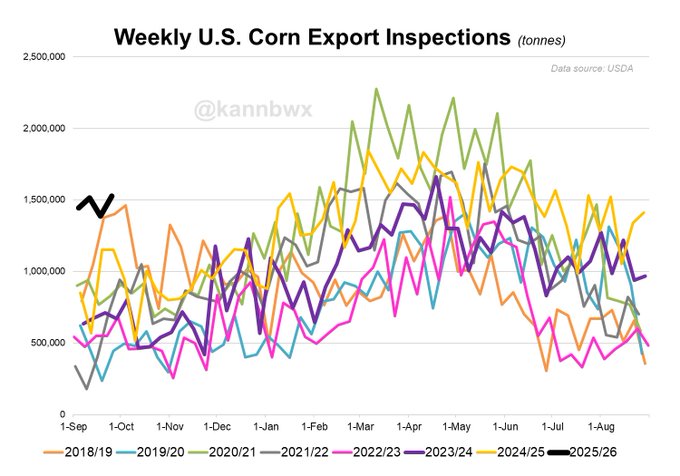
@kannbwxLast week's export inspections of U.S. corn and wheat landed near the top end of trade expectations, but soybeans were in the lower half.
Corn inspections are off to a record pace in 2025/26 (data goes back to 1982). Wheat is also humming along (the prior week's number was revised notably upward this week). Soybeans are approaching the danger zone. It's about to get very ugly I'm afraid.
Trump said on Thursday that U.S. farmers will receive some of the proceeds from tariff revenues. "Ultimately, the farmers are going to be making a fortune."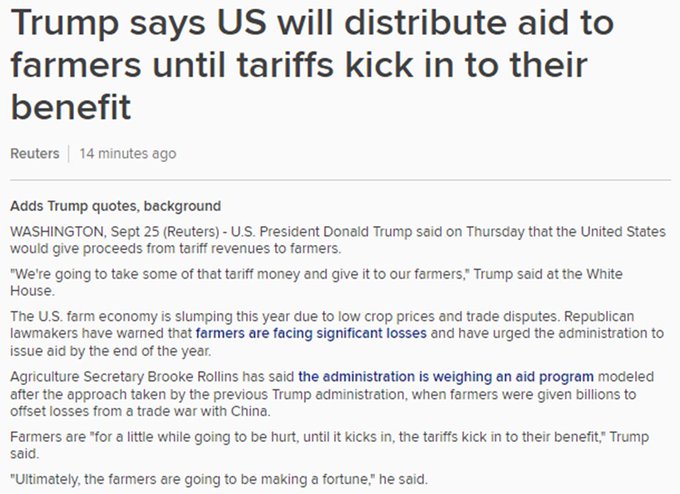
+++++++++++++=
So now, not only is there the enormous damage to US companies, US consumers and most countries on both sides of the damaged free trade(that includes permanent damage to the trading relationship and additional damage as the world isolates and replaces the US because they can't trust us anymore).........tariffs will cost the United States money to compensate farmers for their tariffs losses.
What about the inflationary input costs that are killing farmers? Corn exports are an all time record, even without China.
How about all the other US companies and consumers? Where will our aid come from? Or the rest of the world?
Answer: From the Supreme Court ruling Trump's EMERGENCY tariffs are illegal!
This solution by Trump is like a firefighter/arsonist starting a massive fire, then putting out part of it(while the VAST majority still rages) and wanting to be seen as a hero!
·
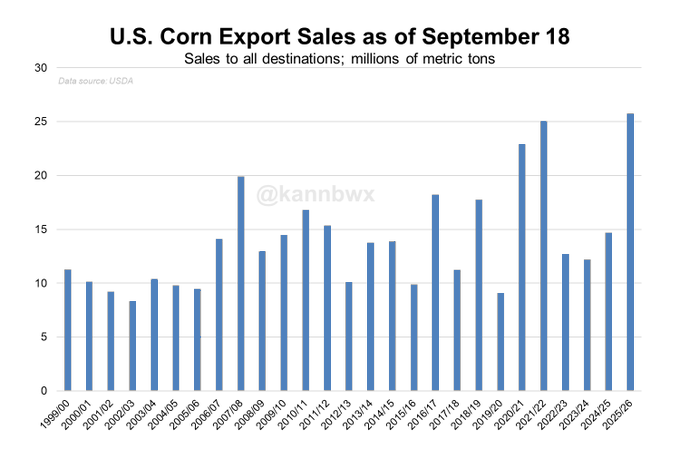
It's a record. As of Sept. 18, U.S. corn export sales for 2025/26 stood at 25.76 million metric tons (1.01 bln bu), the date's largest volume in modern record keeping. That surpasses Sept. 18, 2021, when China accounted for 48% of 2021/22 sales. None to China for this year.
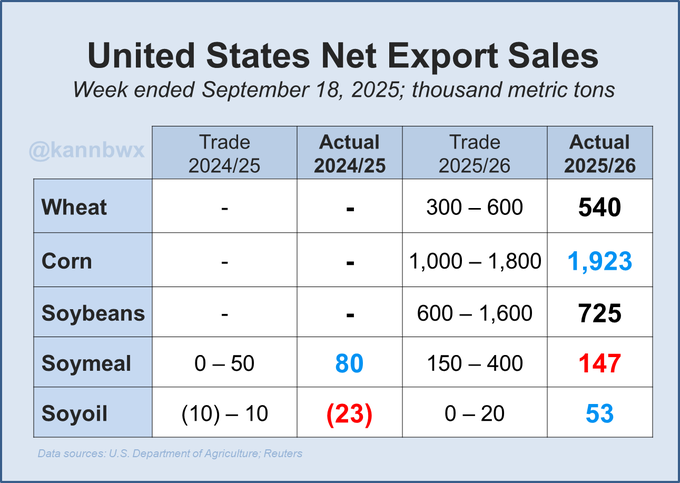
U.S. corn export sales last week exceeded all expectations and landed well above average for the week. Wheat sales were relatively strong but soybeans relatively weak. South Korea moved 22kt soyoil from old crop to new crop, and Venezuela also bought oil for 25/26.
U.S. corn and soybean harvests are ever so slightly behind the five-year average paces - but this week is largely wide open and bean progress should be strong. Cotton harvest is on schedule and winter wheat planting is slightly slower than normal / last year.
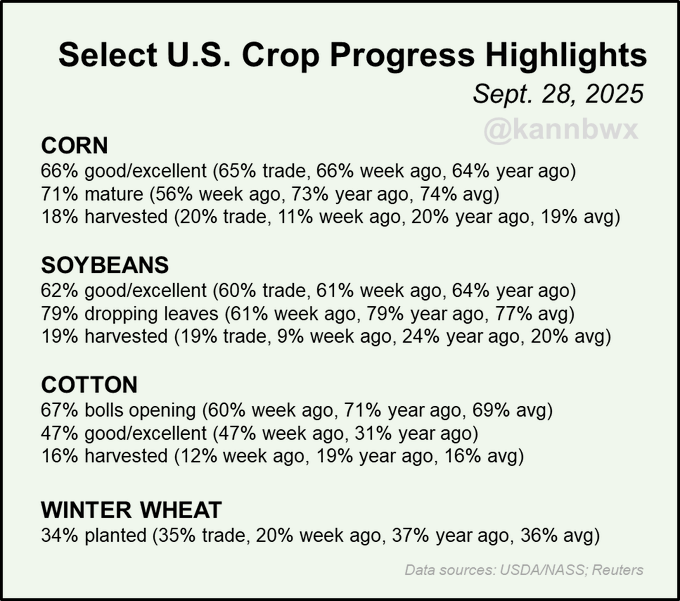
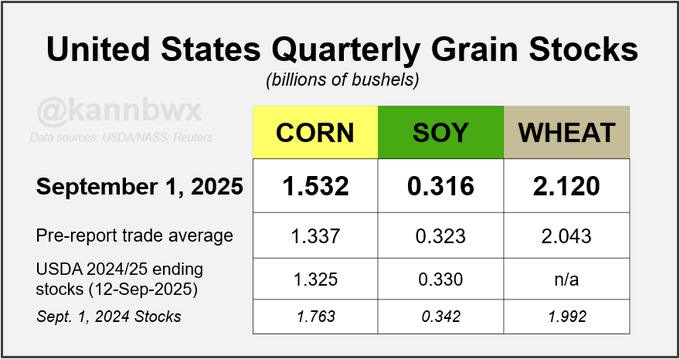
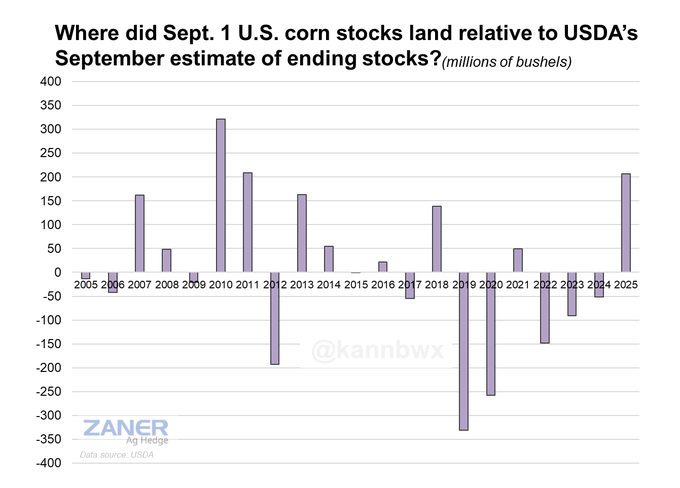
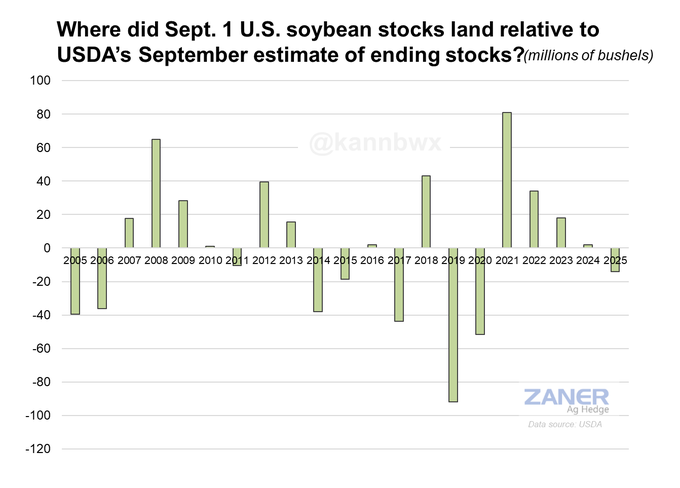
Sept. 1 U.S. corn stocks come in well above trade estimates, soybeans land slightly below. Wheat comes in heavier than expected.
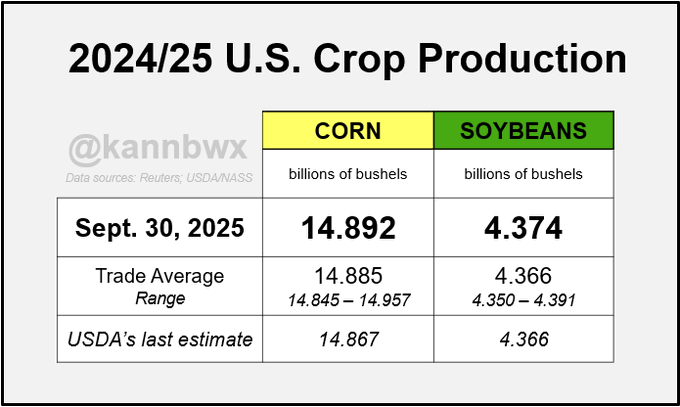
USDA made very modest increases to last year's U.S. corn and soybean crops. Yields (179.3 bu/acre and 50.7 bu/acre) remained unchanged.
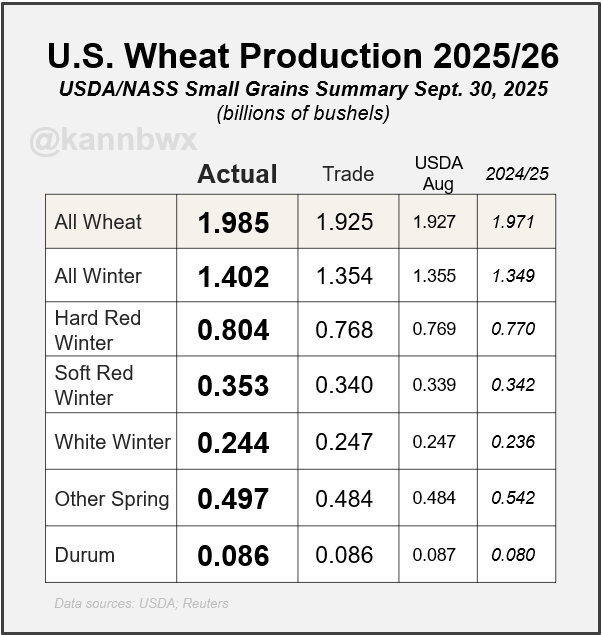
The 2025/26 U.S. wheat crop comes in above expectations, mainly driven by larger winter production. U.S. winter wheat output was up 3.9% from last year and spring wheat was down 8.3%.
2024/25 U.S. corn ending stocks = 1.532 billion bushels. That's 207 million more bushels than USDA estimated earlier this month, the biggest such deviation in 5 years. By %, it was USDA's biggest underestimation in ending stocks since 2012/13.
As for soybeans, 2024/25 ending stocks of 316 million bushels were 14 million below where USDA last estimated them, one of the smallest deviations in recent years. That carryout is down 7.6% on the year.
Weather is usually not a factor for grain prices in October with a few exceptions.
1. Long lasting, extremely wet weather that could delay harvest. just the opposite this year.
2. Extremely windy, widespread gusts above 50 mph that could called "lodging" which is broken corn stalks that are much harder to harvest.
3. Freezing temps can't do damage anymore.
4. This year, extremely dry weather may be an issue for the SRW crop for good germination and early establishment if the crop before it goes dormant in November/December. The unusually warm weather in October may have an impact but I'm not sure weather its bullish or bearish right now. It will allow the crop to put on more growth after being planted but it may dry soils out more, if we miss this early week rain.
Eric was in with the weather on Friday:
https://www.youtube.com/watch?v=Bk4qX2emvFo
+++++++++++++
This is just educational information for readers:
https://en.wikipedia.org/wiki/Lodging_(agriculture)
+++++++++++
Bob Nielsen, Extension Agronomist, and Deb Colville, Graduate Research Assistant
Department of Agronomy, Purdue University
https://www.extension.purdue.edu/extmedia/ay/ay-262.html
Harvest the affected areas first. Do not allow lodged fields to remain unharvested any longer than absolutely necessary. Think seriously about harvesting lodged areas earlier than normal, provided that the grain is physiologically mature.
Harvest the affected areas slower than usual. A ground speed of 2 mph is usually adequate for harvesting lodged corn. By harvesting at a slower speed, your ability to pick up lodged ears that would otherwise be missed will increase. Gathering-chain speeds and snapping-roll velocity should be correspondingly reduced to maintain the normal relationship with ground speed. Obviously, picker- or combine-snouts and gathering chains should be run as closely to the ground as possible to pick up downed corn.
Under severe stalk lodging conditions, harvest against the direction of the lodging. For example, if the corn plants are lodged toward the east, come into the field from the east. Harvesting the field from the west will only lodge the plants further, making it almost impossible to pick up the ears. Some farmers indicate that they adjust the gathering chains and the rolls inward as closely as possible, to adequately grip rotten stalks with no center core. These stalks collapse to a thickness of approximately 1/8 inch when squeezed
‘Just comical’: Farmer criticizes Trump’s tariff revenue plan | Morning in America
https://www.youtube.com/watch?v=115jpYZmAbY
+++++++++++++++
Everybody should listen to this!
What do farmers think about ....tariffs..shutdowns..
Thanks much, cutworm.
It amazes me that, even with it falling that 51% of farmers still believe that tariffs will strengthen the economy.
I showed a survey of economists on the tariffs thread.
0% of the dozens thought tariffs were beneficial to the economy in this survey conducted.
They should know better than anybody but even without their expert opinion, it boggles my mind that the crystal clear principle of the benefits of free trade between countries.........are not crystal clear to everybody.
Actually, the false narratives made by Trump and believed by others is the reason.
Corn Finally Wakes Up - Start of a Rally??
"Let the market be the market" 14 min in
Thanks, cuworm!
Before watching that, I was thinking the same thing!
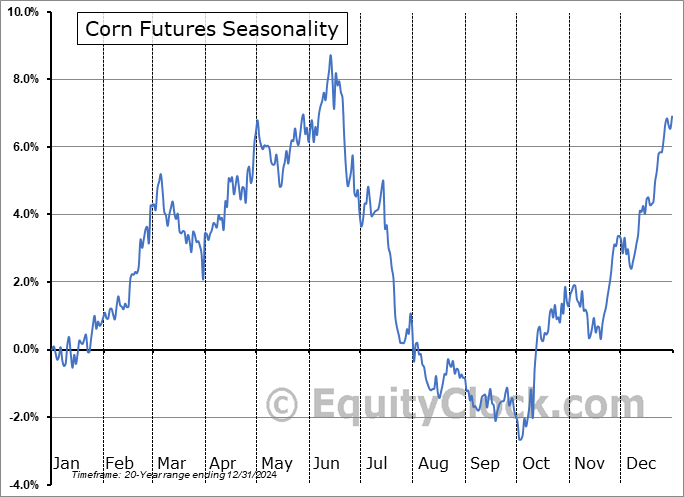
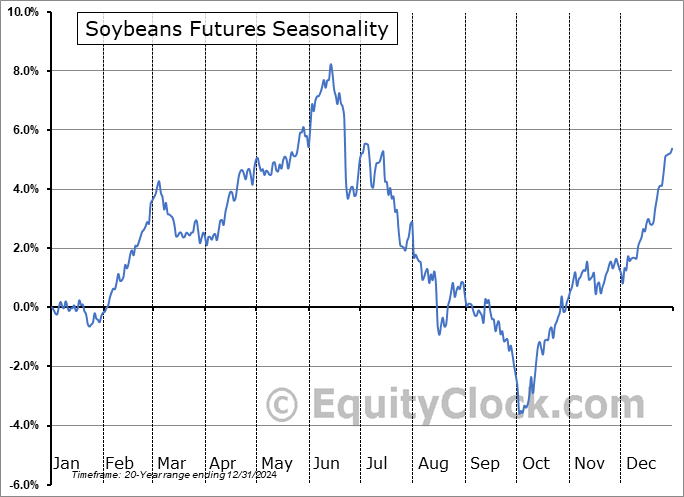
Corn fundamentals are pretty bullish, prices are holding and this is the historical time frame that has usually put in the harvest low! Same with beans that just tested $10 and have bounced.
https://tradingeconomics.com/united-states/stock-market
https://equityclock.com/seasonality/
https://equityclock.com/charts/
https://charts.equityclock.com/corn-futures-c-seasonal-chart
https://charts.equityclock.com/soybeans-futures-s-seasonal-chart
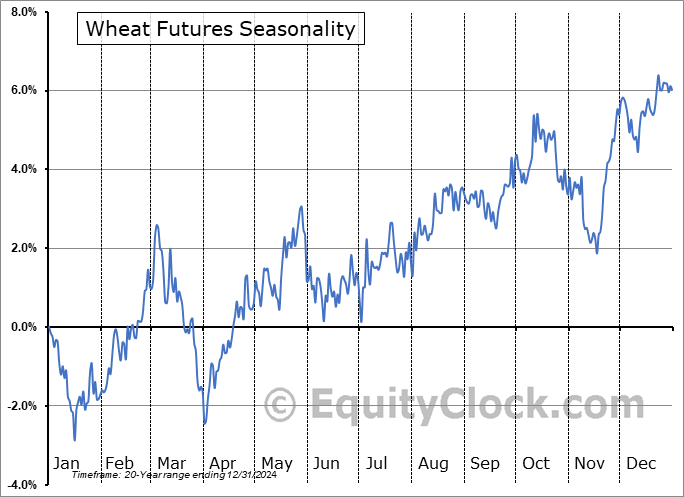
https://charts.equityclock.com/wheat-futures-w-seasonal-chart
Government shutdown = no USDA reports
++++++++++++++++++++++
Trump 2 tariffs have been even worse for our farmers!
Graphs/charts are wonderful at telling us profound things.
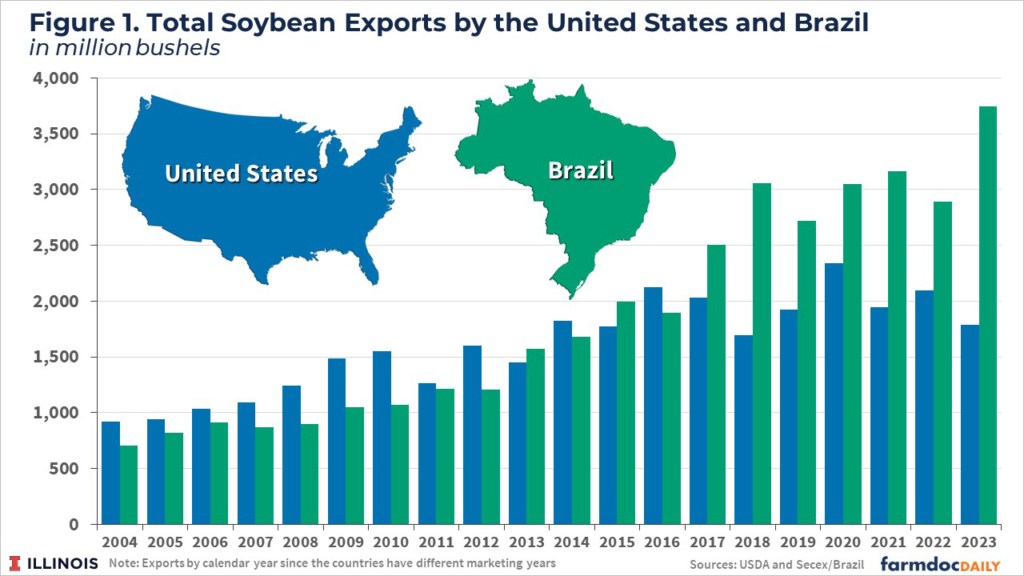
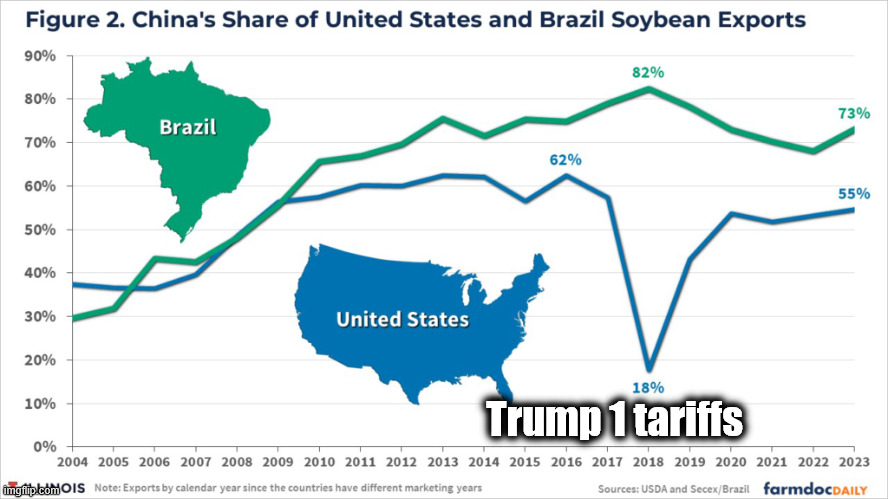
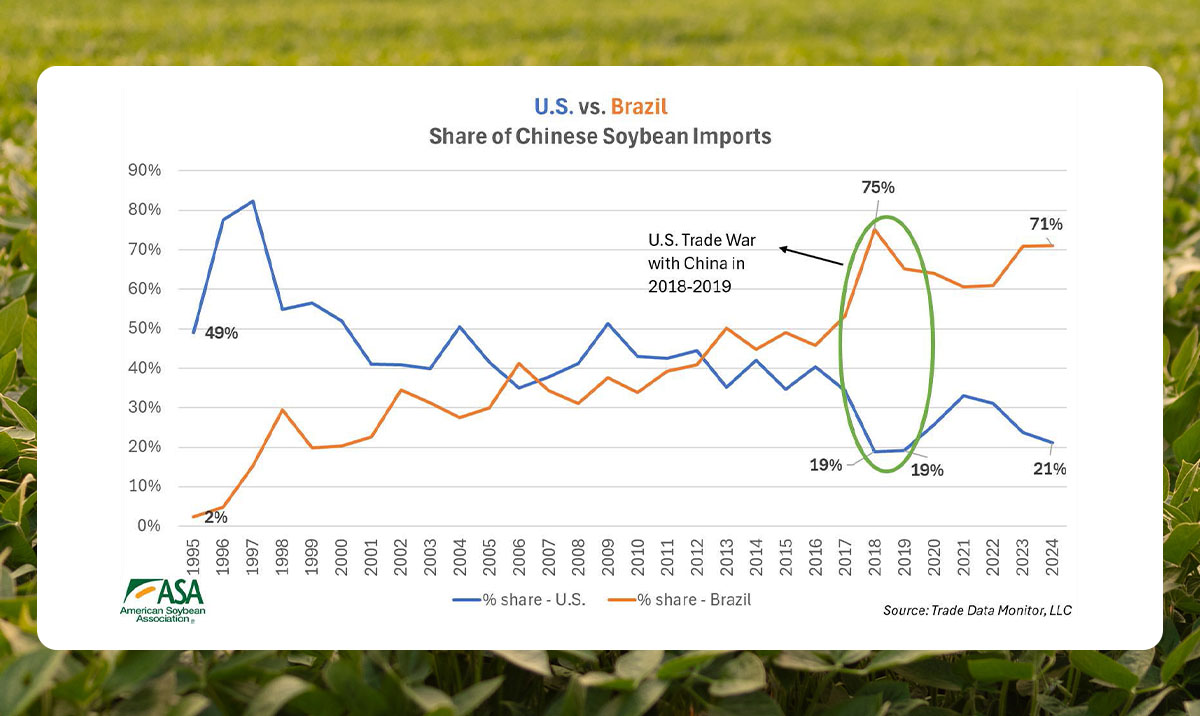
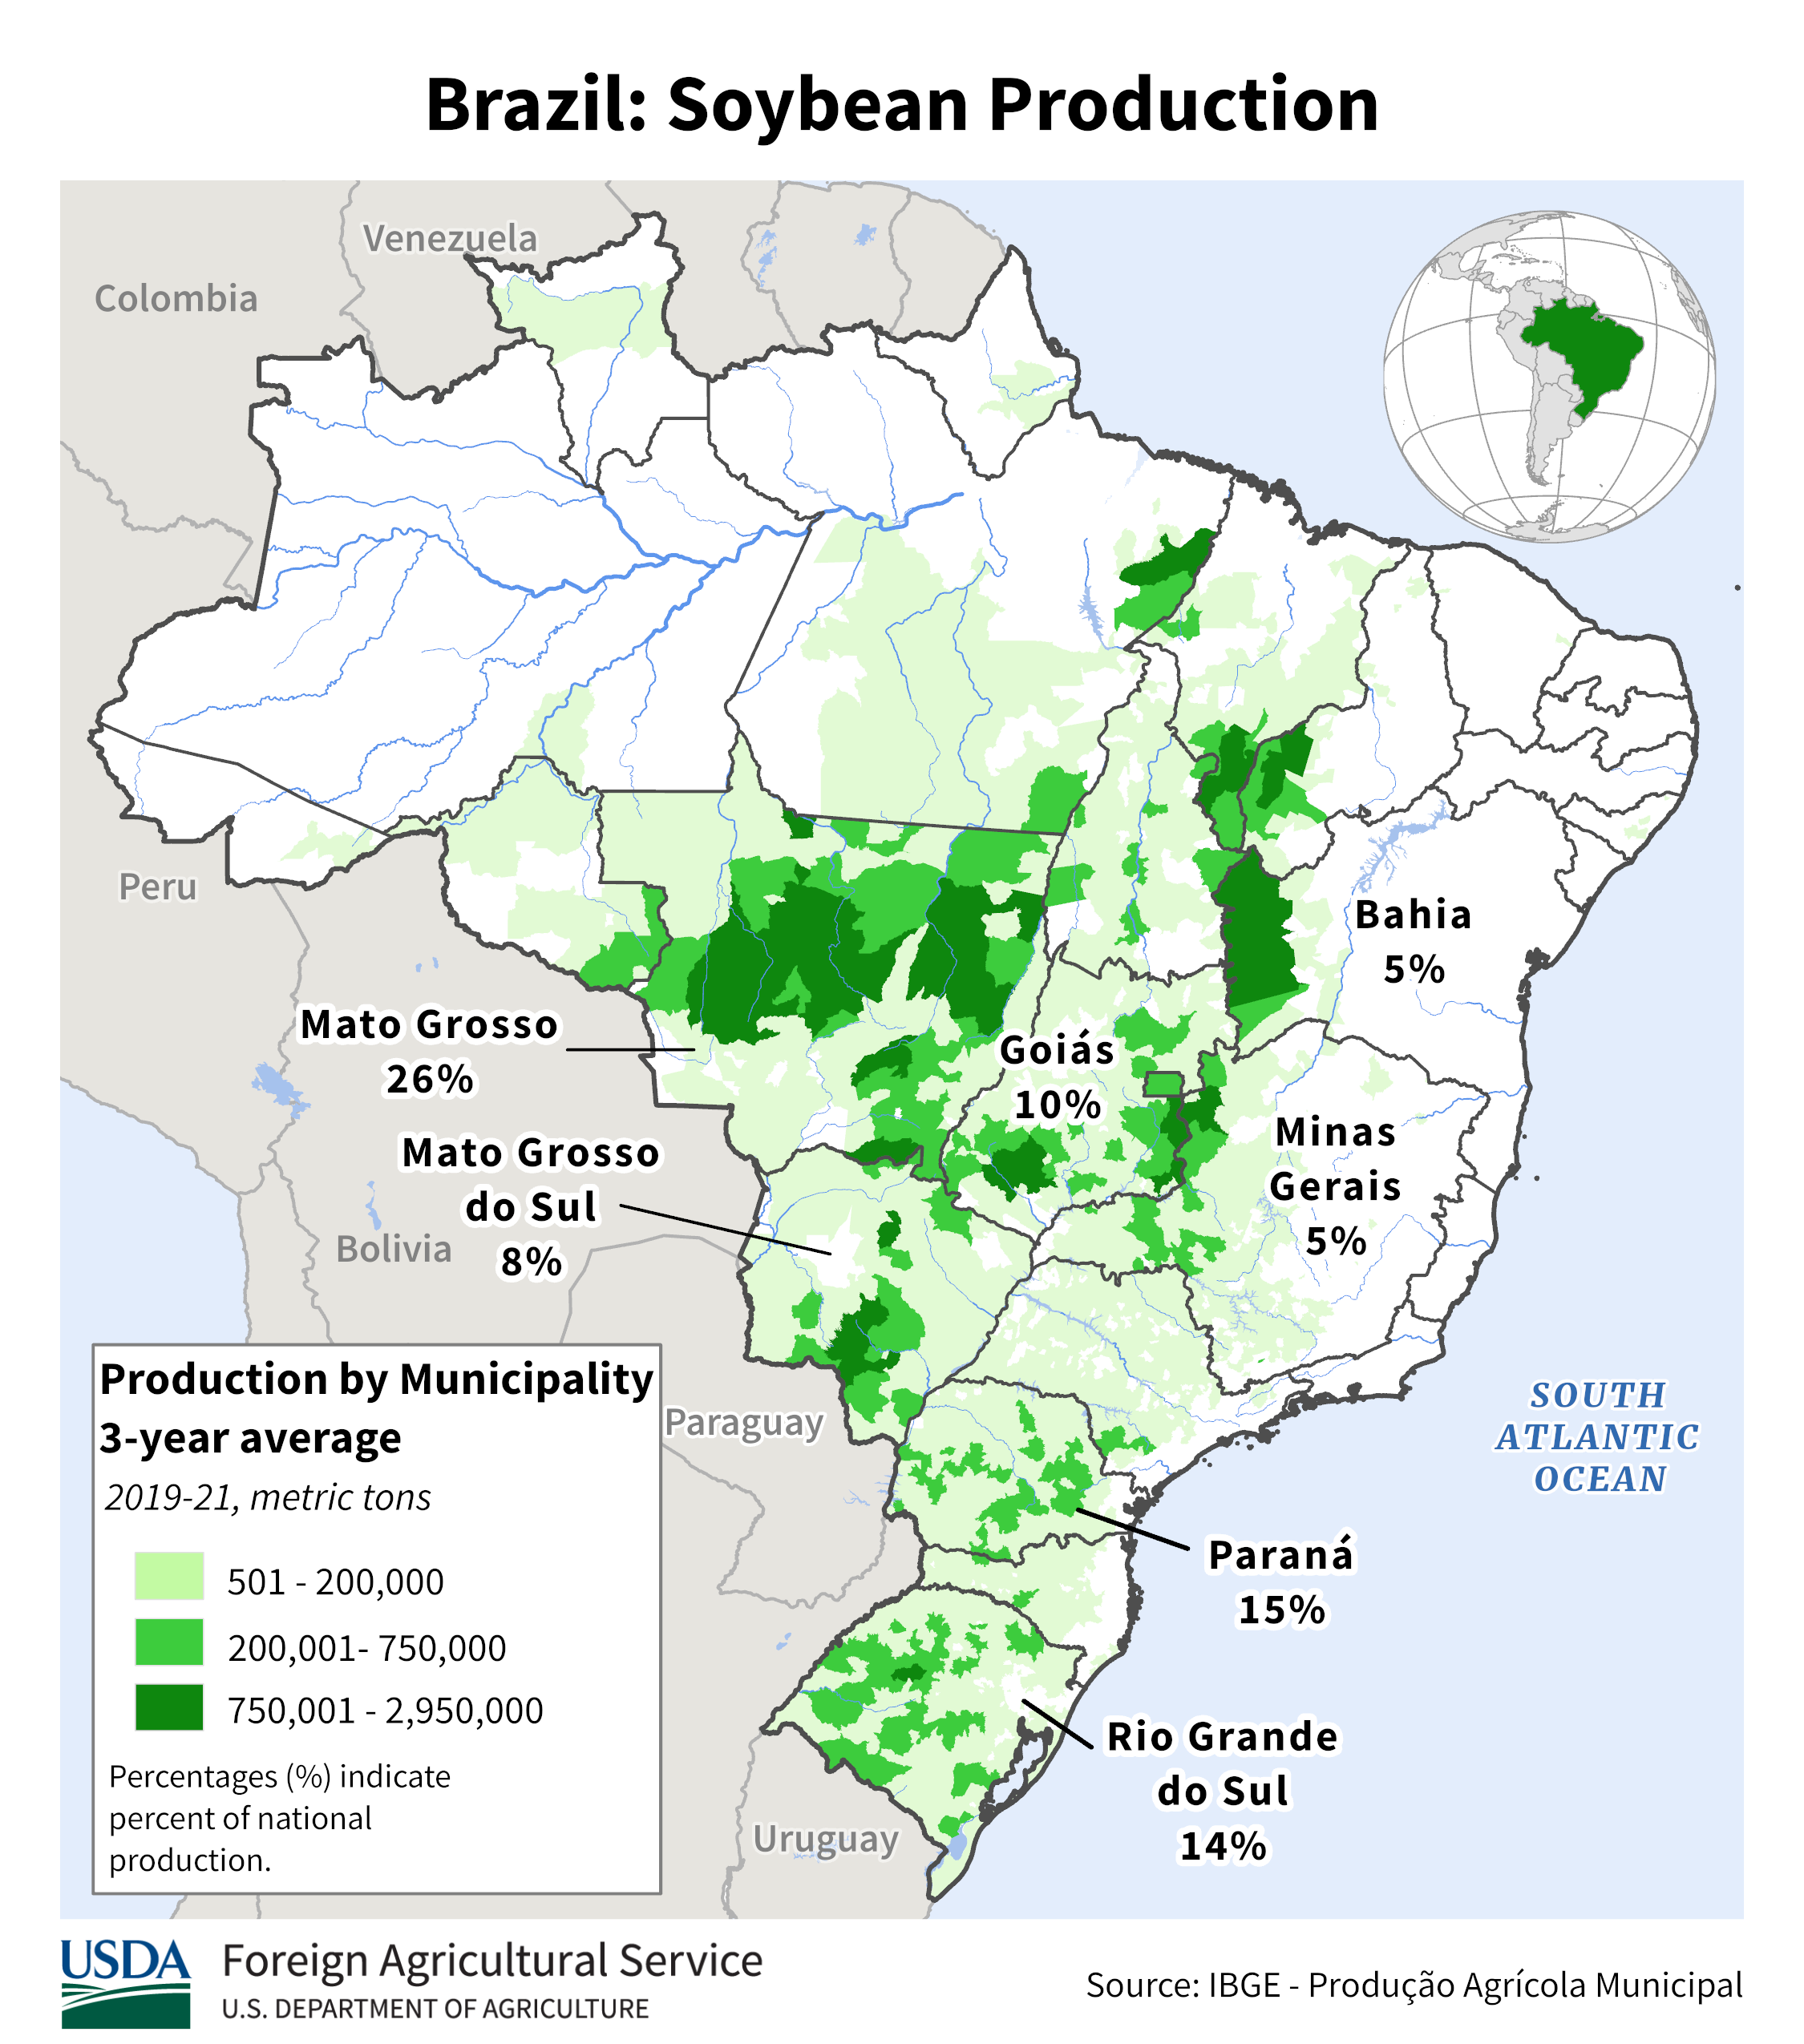
This one is very revealing about how tariffs can cause long term/permanent damage. When Trump imposed tariffs and had a trade war with China in his first term, it caused China to turn to Brazil to get their soybeans. Those lost sales and lost income for US farmers was lost forever.
They never came all the way back after they made those long term relationships with Brazil and Argentina to satisfy their entire needs.
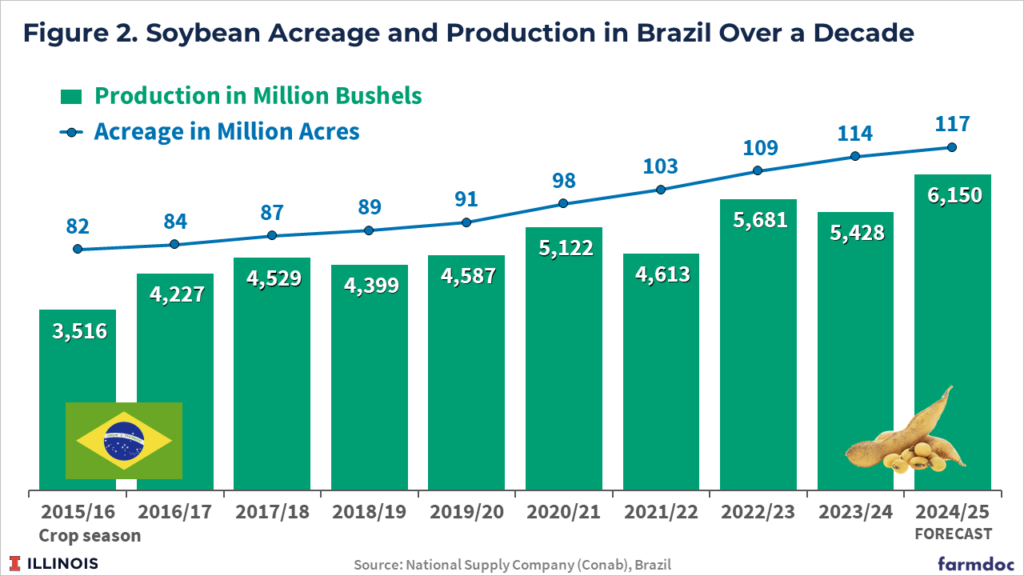
25 years ago, we would have had them over a barrel because Brazil didn't produce nearly the amount to replace us. Now, Brazil OUT PRODUCES the United States.
We can't change that or make the rules bend to our will. It's a global economy and other countries are catching up to us and we have to respect them and maintain free trade with them because it DOES benefit us as well as them.
This complete lack of comprehension of the indisputable principles of free trading between countries that always benefits both countries is jaw dropping ignorance for the most powerful person in the world.
++++++++++++++
https://www.fas.usda.gov/data/production/commodity/2222000
| Market | % of Global Production | Total Production (2024/2025, Metric Tons) |
|---|---|---|
| Brazil | 40% | 169 Million |
| United States | 28% | 118.84 Million |
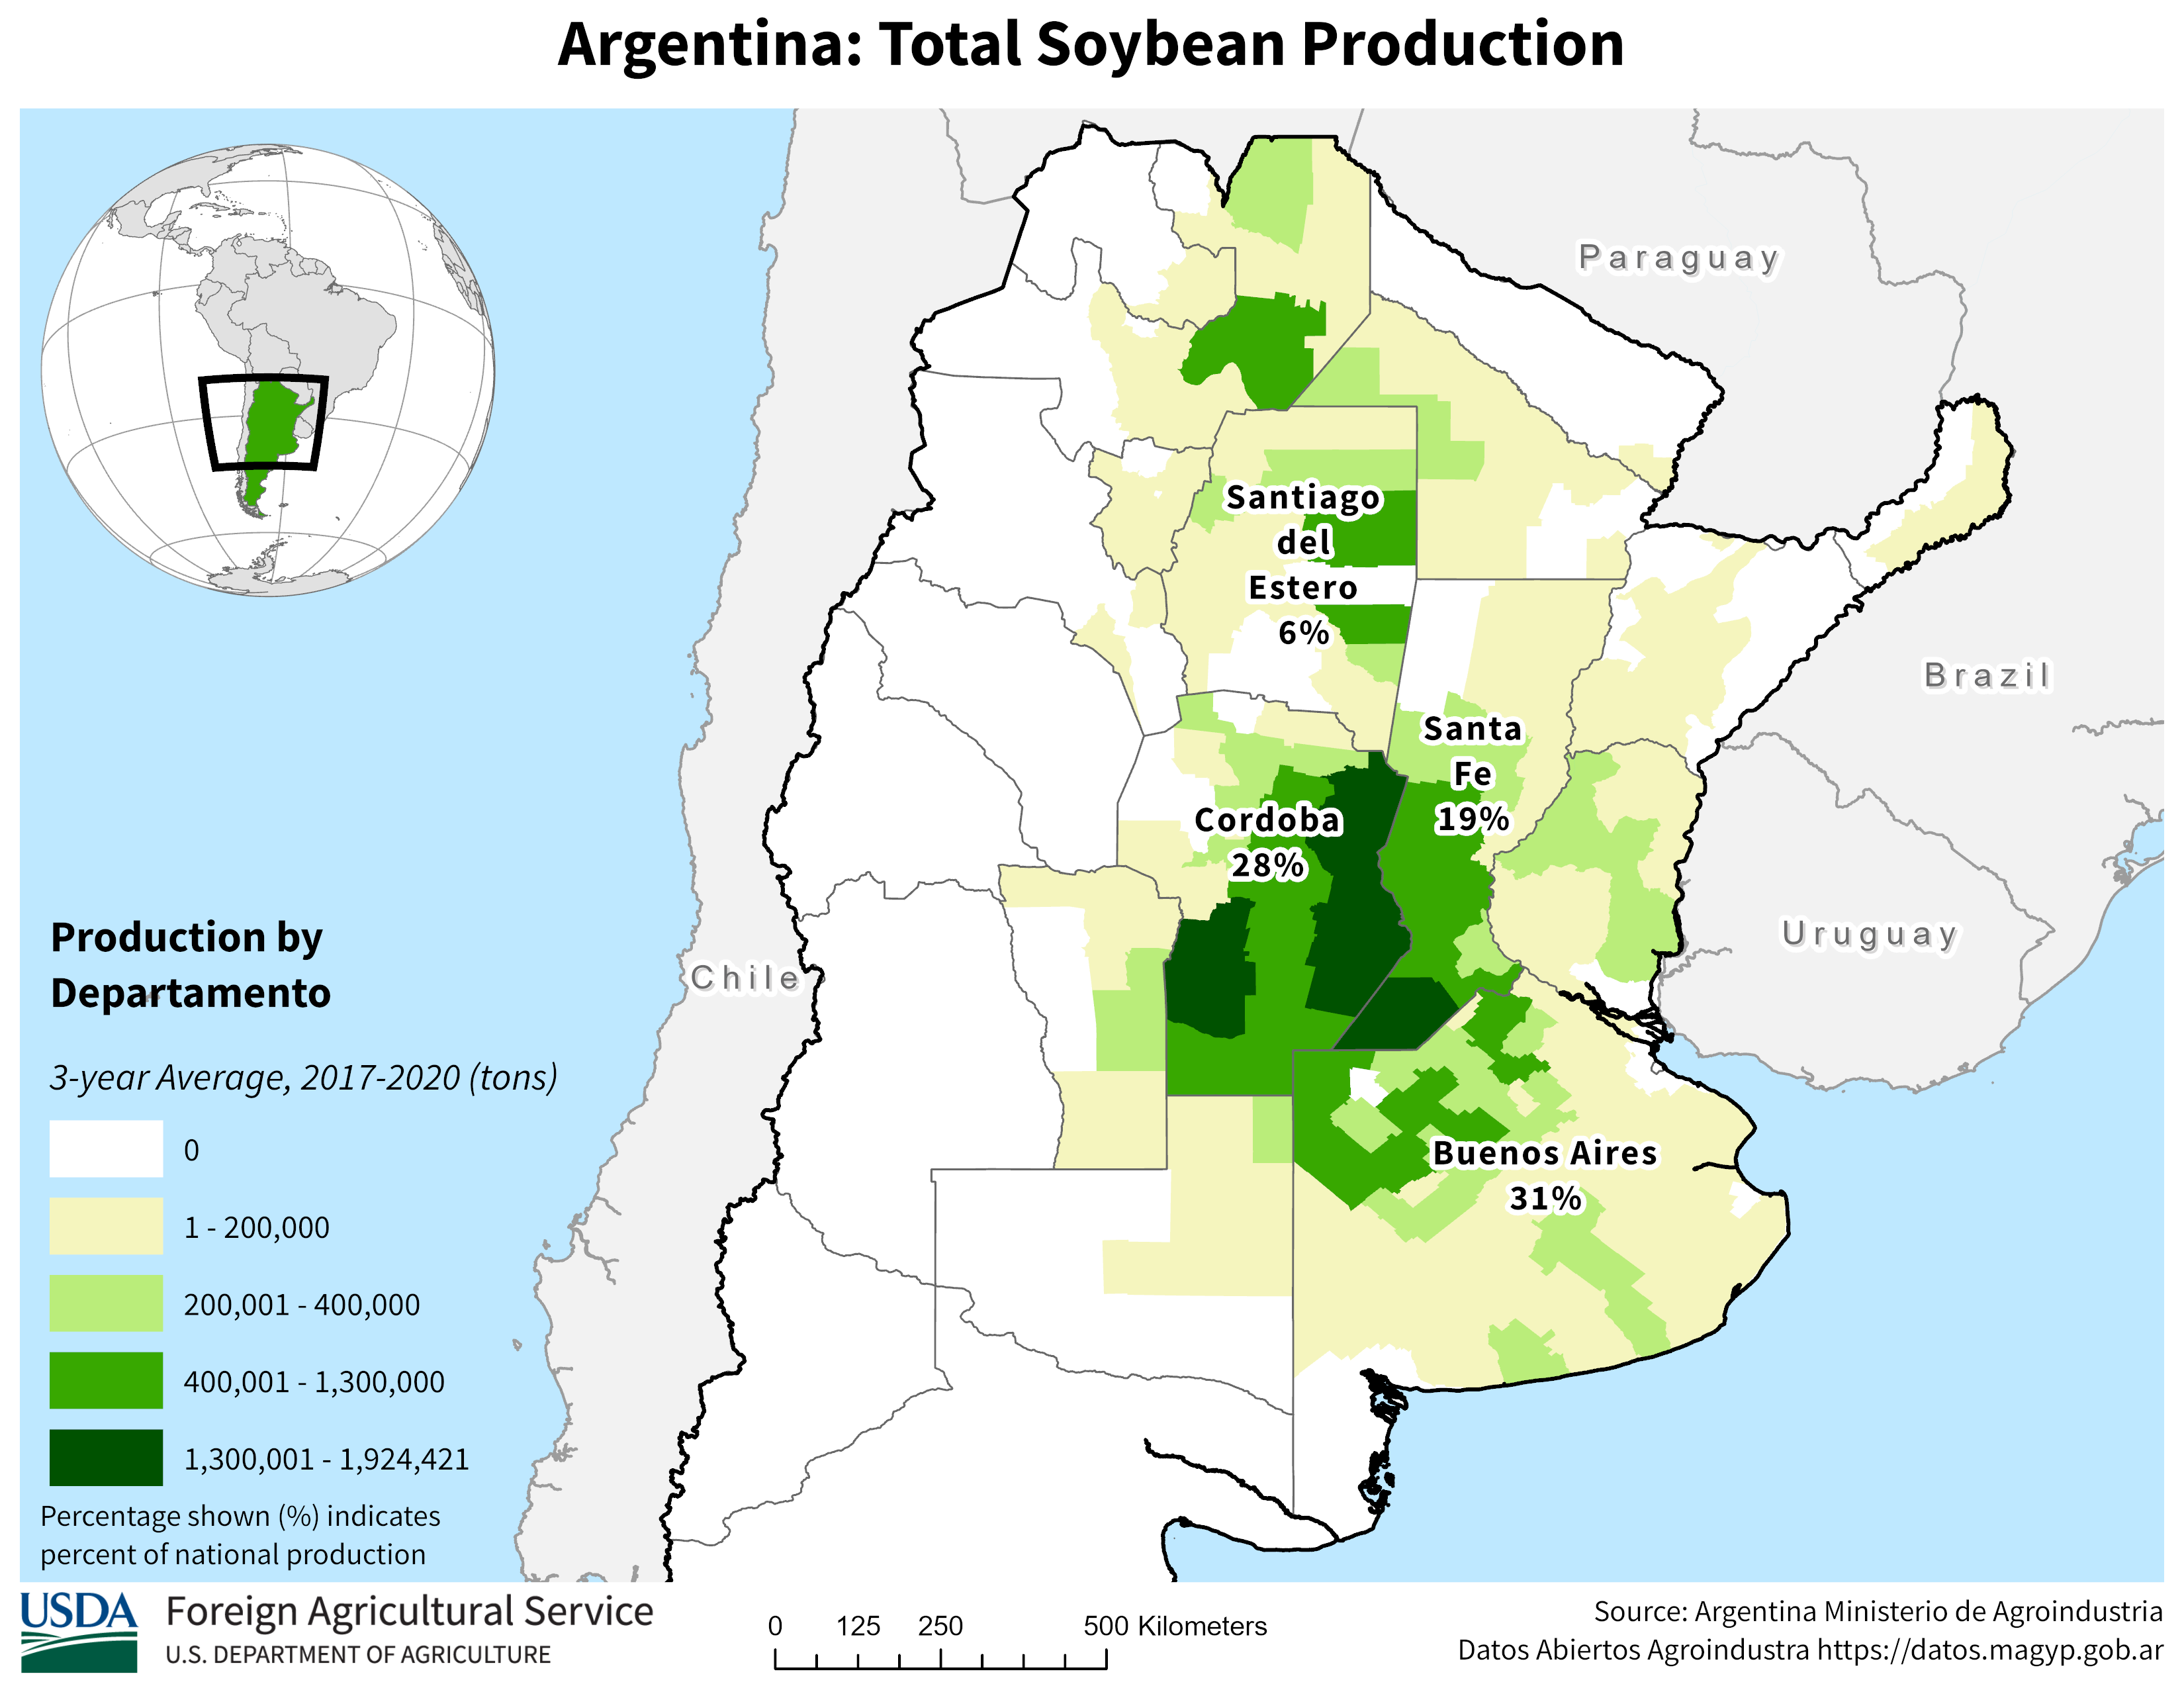
| Argentina | 12% | 50.9 Million |
| China | 5% | 20.65 Million |
| India | 3% | 12.58 Million |
| Paraguay | 2% | 10.2 Million |
| Canada | 2% | 7.57 Million |
| Russia | 2% | 7.05 Million |
| Ukraine | 2% | 7 Million |
| Uruguay | 0.99% | 4.2 Million |
++++++++++++
Trump has a political pal in Argentina (that is getting much of our soybean sales, thanks to Trumps tariffs on China) that he wants to support with $20,000,000,000 US TAX PAYER MONEY!!!
Re: Re: Re: Re: Re: Re: 25th Amendment-Hate vs LOVE!
By metmike - Oct. 14, 2025, 10:49 p.m.
FAQ: Why America just bailed out Argentina with a $20 billion lifeline
+++++++++++++
Donald Trump cares more about Donald Trump and his rich cronies AND EVEN CRONIES IN OTHER COUNTRIES than he does about Americans, especially American farmers.
How many farmers that voted for Trump wanted him to use their tax dollars to bail out Argentina for his political pal?
mcfarm? cutworm? Others? Who supports this bail out with our money?
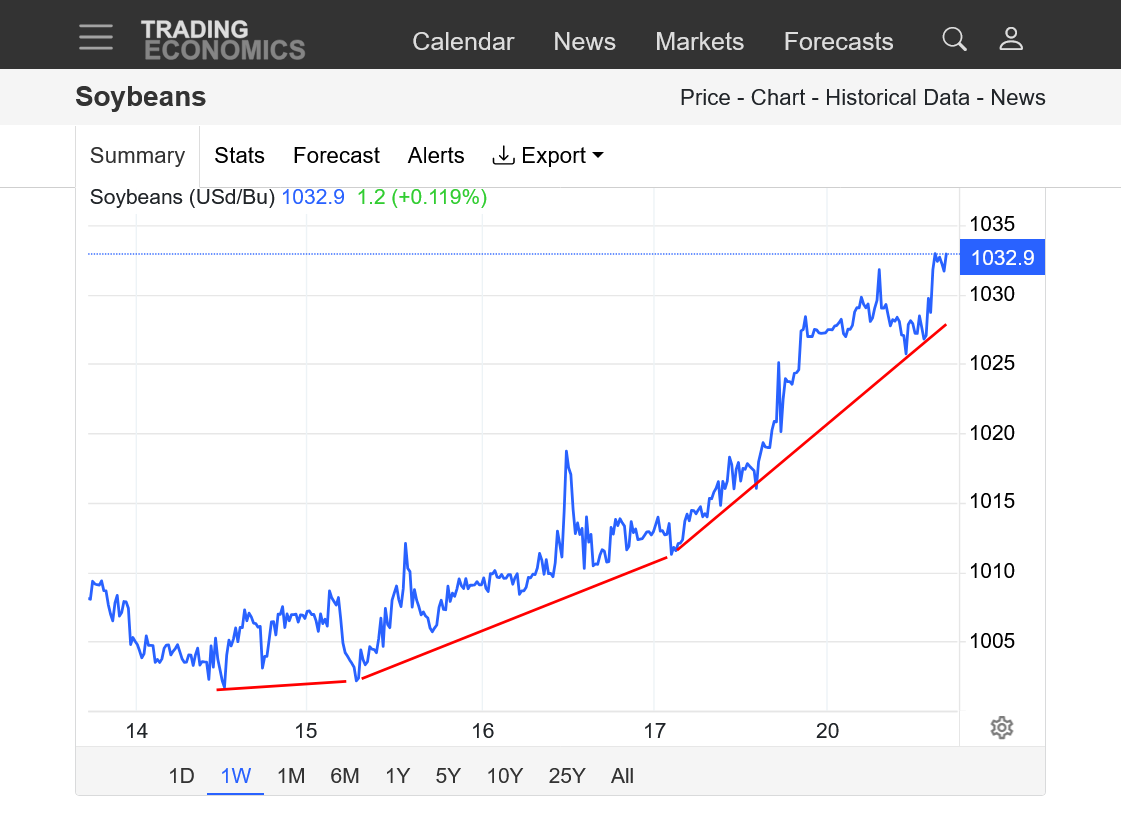
Sorry for not posting here earlier about some of my favorite markets that I actually trade. Been meaning to show a soybean chart because beans tend to bottom first during harvest with a sharper spike down and up than corn.
Part of this is that farmers harvest beans much faster. Also they can experience yield losses from pod shattering if they dry down too much in the field. In which case waiting for a rain is sometimes helpful.
There will be no crop progress report again today because of the government shutdown.
https://www.canr.msu.edu/news/harvest_considerations_for_overly_dry_soybeans
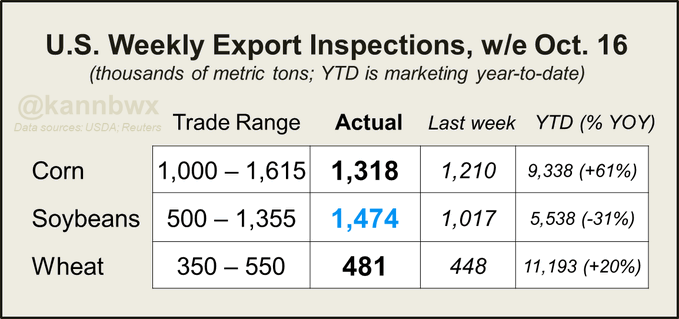
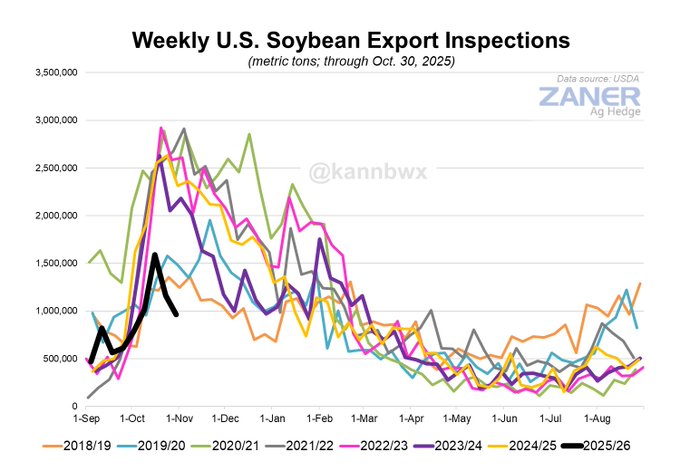
Export inspections for U.S. soybeans last week came in above the range of expectations despite no sales to China. However, they were 42% lighter than the same week last year. Corn inspections remain much stronger than usual for the time of year.
And even though bean inspections were better than expected, the gap with last year widens every week. Total inspections are now down 31% on the year after being up 16% in late Sept. Wheat inspections have accelerated versus last year and corn is keeping its huge advantage.
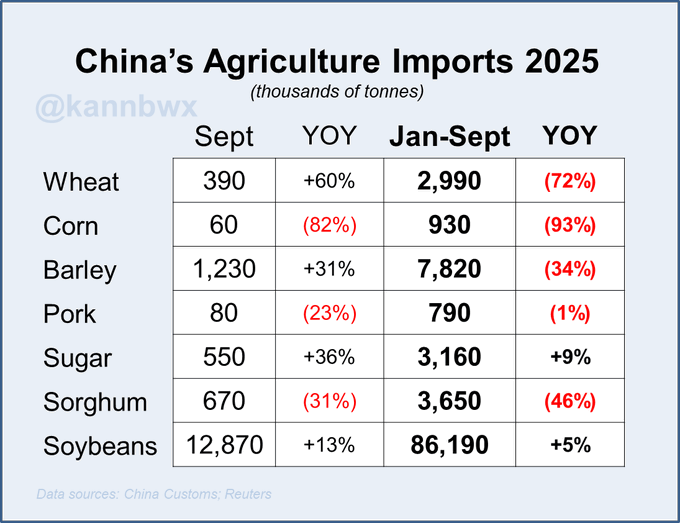
China imported no U.S. soybeans in September - the first time since Nov. 2018 - although the Sept arrivals were up 13% on the year and record high for the month. China took in more wheat & barley this Sept vs last, but year-to-date grain imports are down sharply year-on-year.
Trump said on Monday that he wants China to buy U.S. soybeans. He plans to meet Xi in South Korea at the end of the month and visit China in early 2026. These comments came ahead of bilateral talks in Washington between the U.S. and Australia.
Beans have put in some very bullish daily trading bars the past several days!
Very high odds that the harvest lows were put in at the end of September with a retest of $10 support last week that held rock solid!
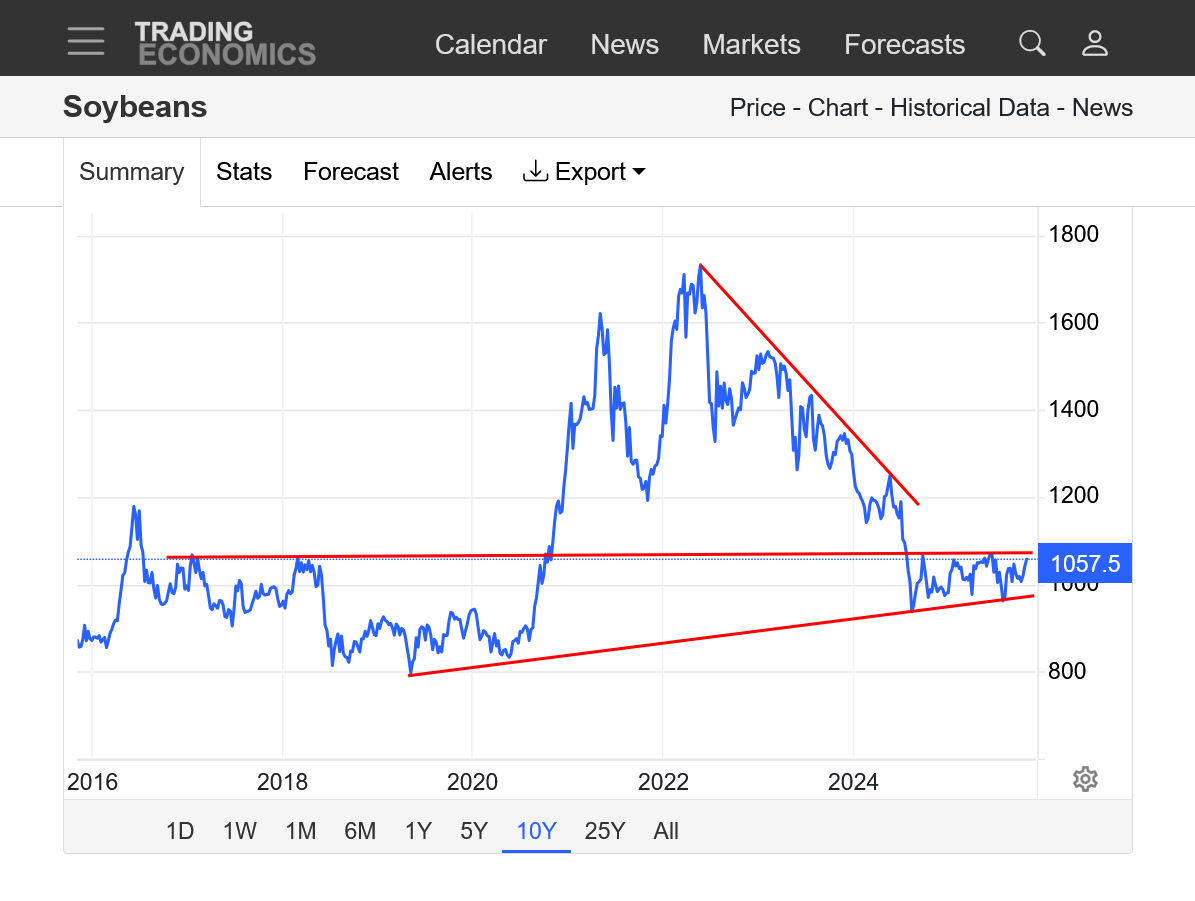
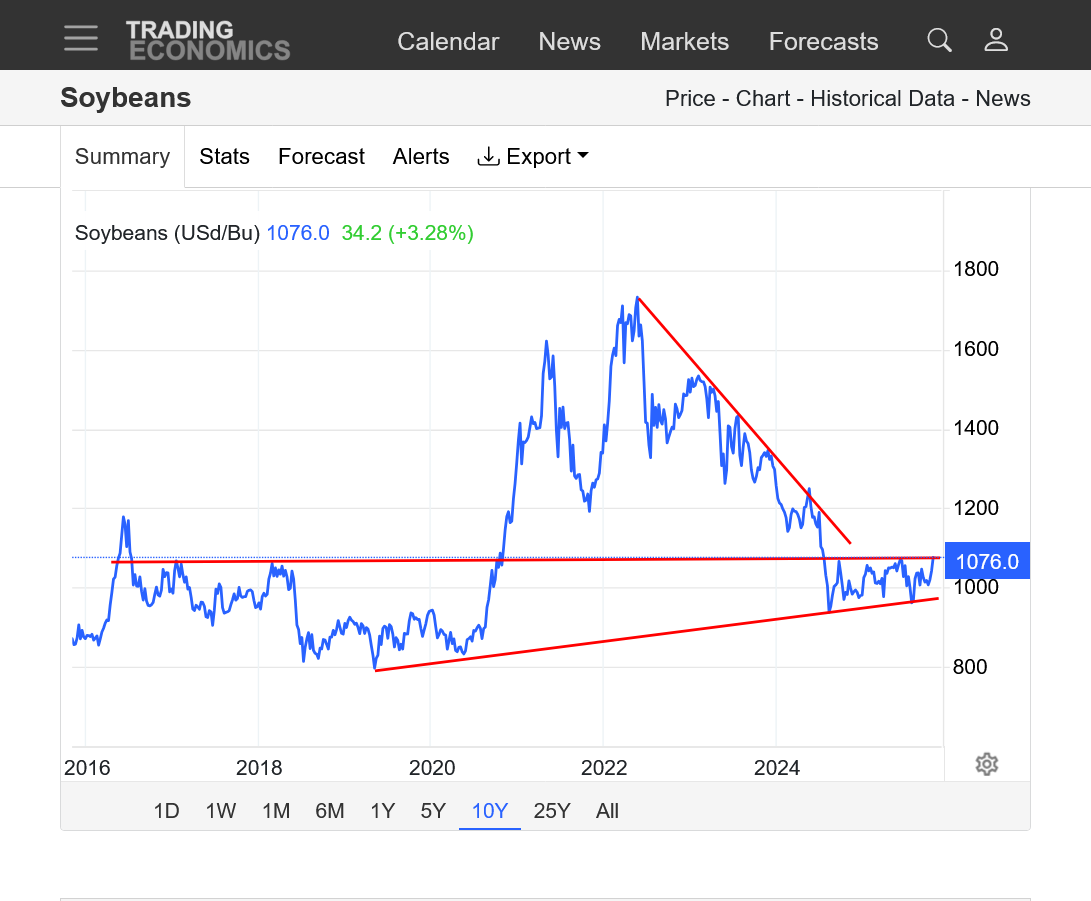
https://tradingeconomics.com/commodity/soybeans
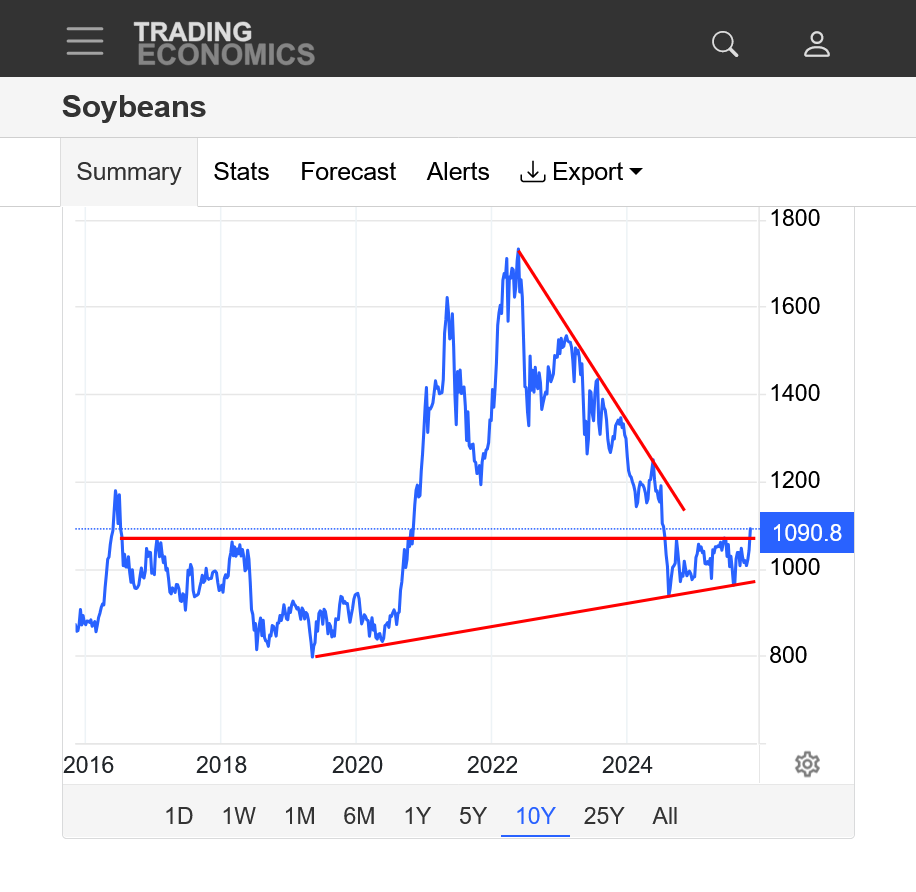
1. 10 years: I suspect the higher lows, in spite of bearish China news is bullish!
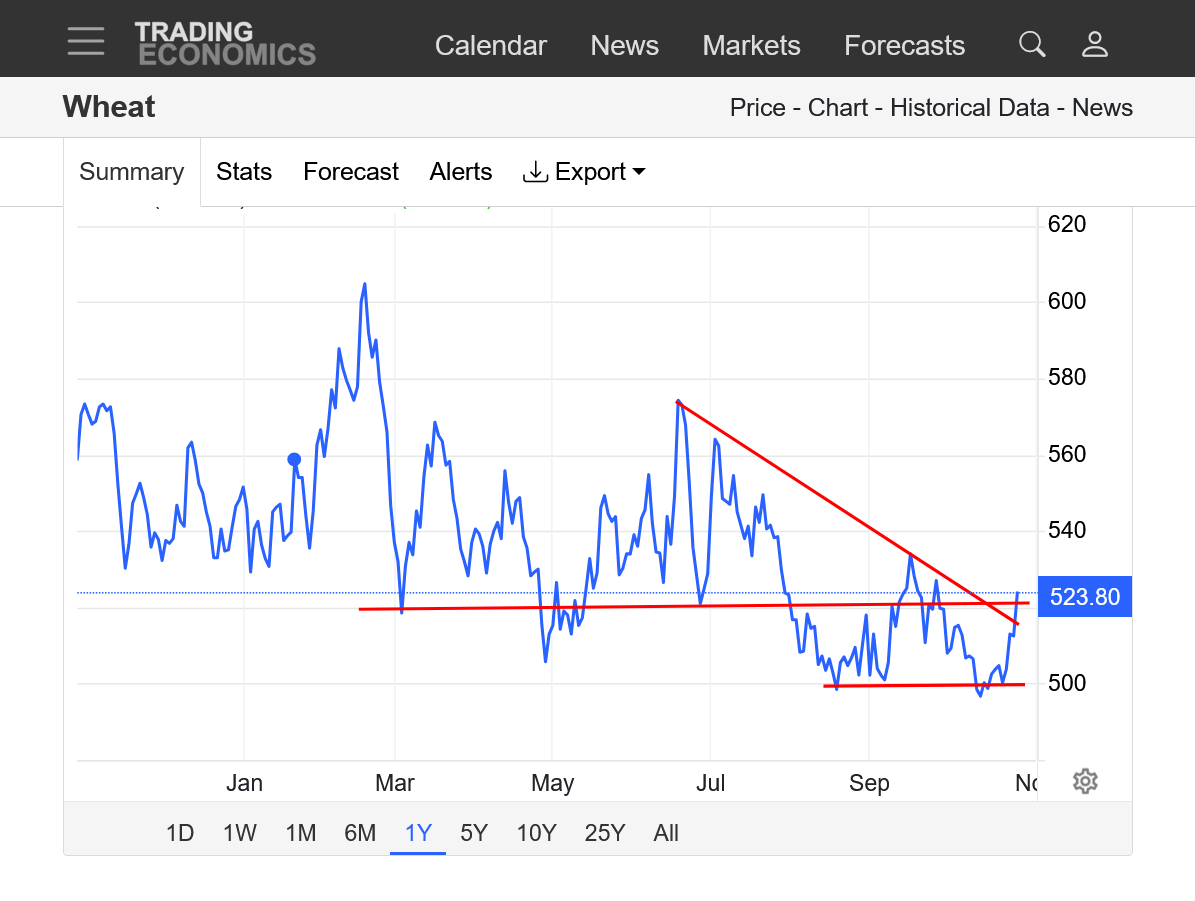
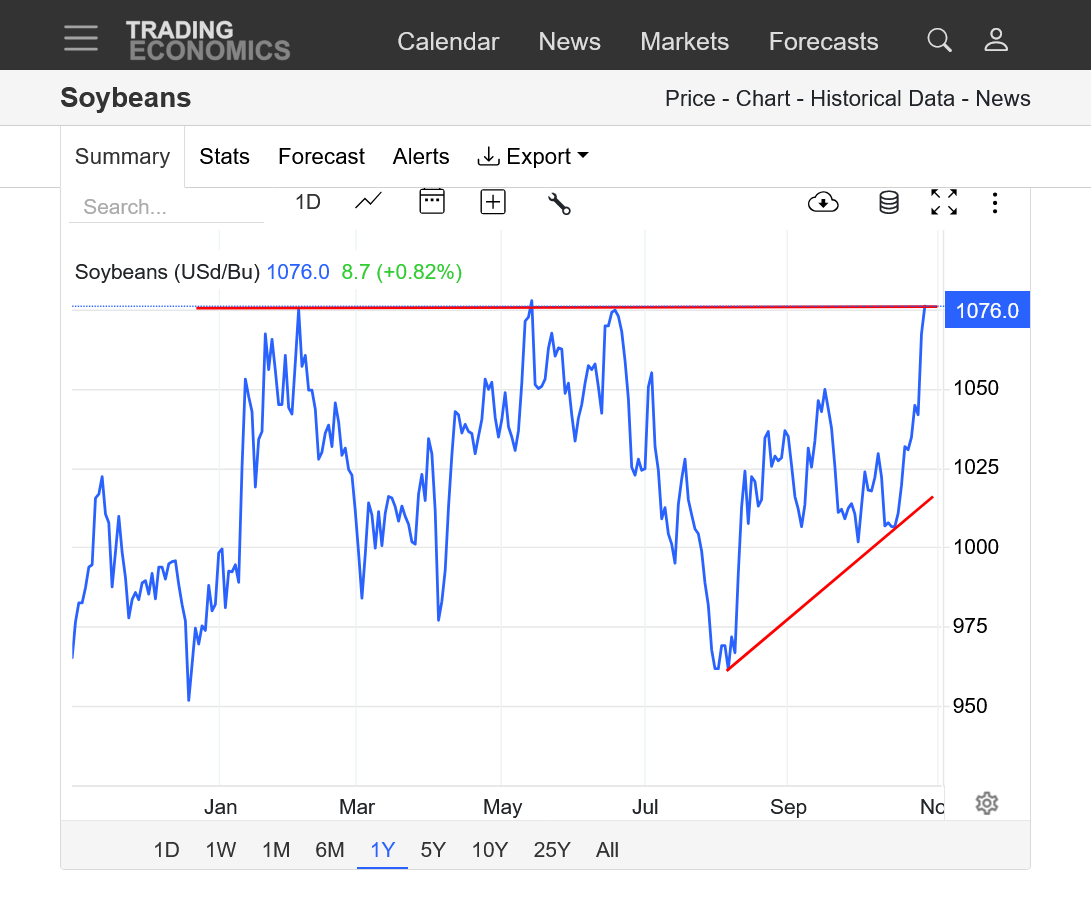
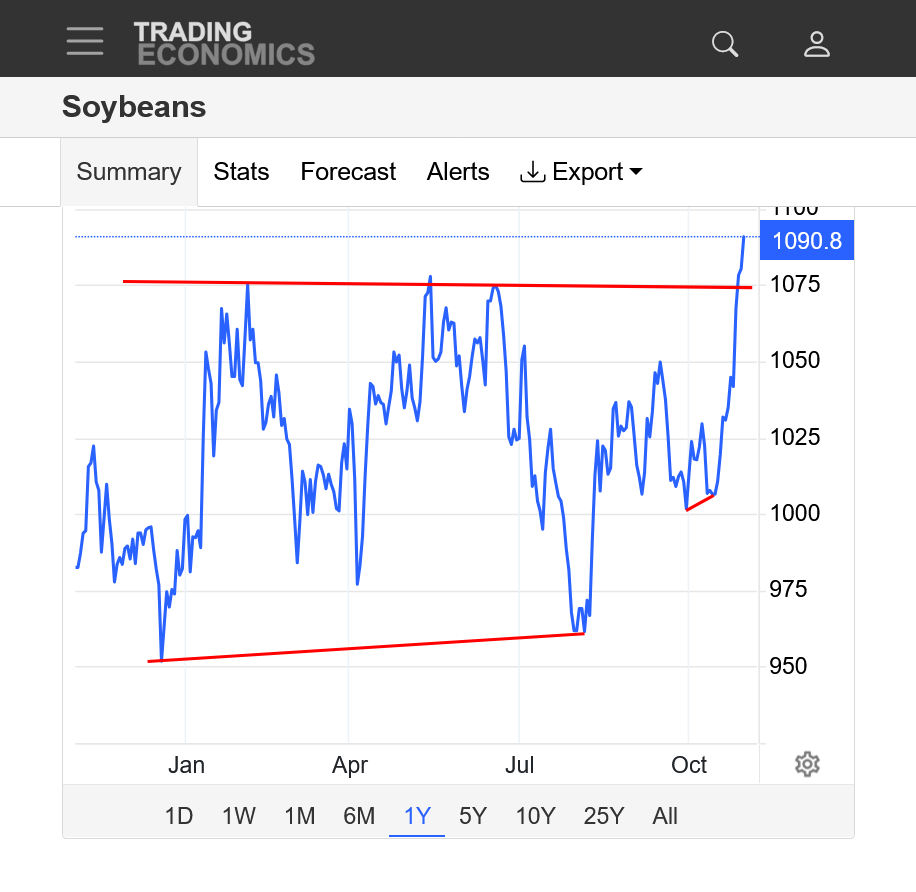
2. 1 year
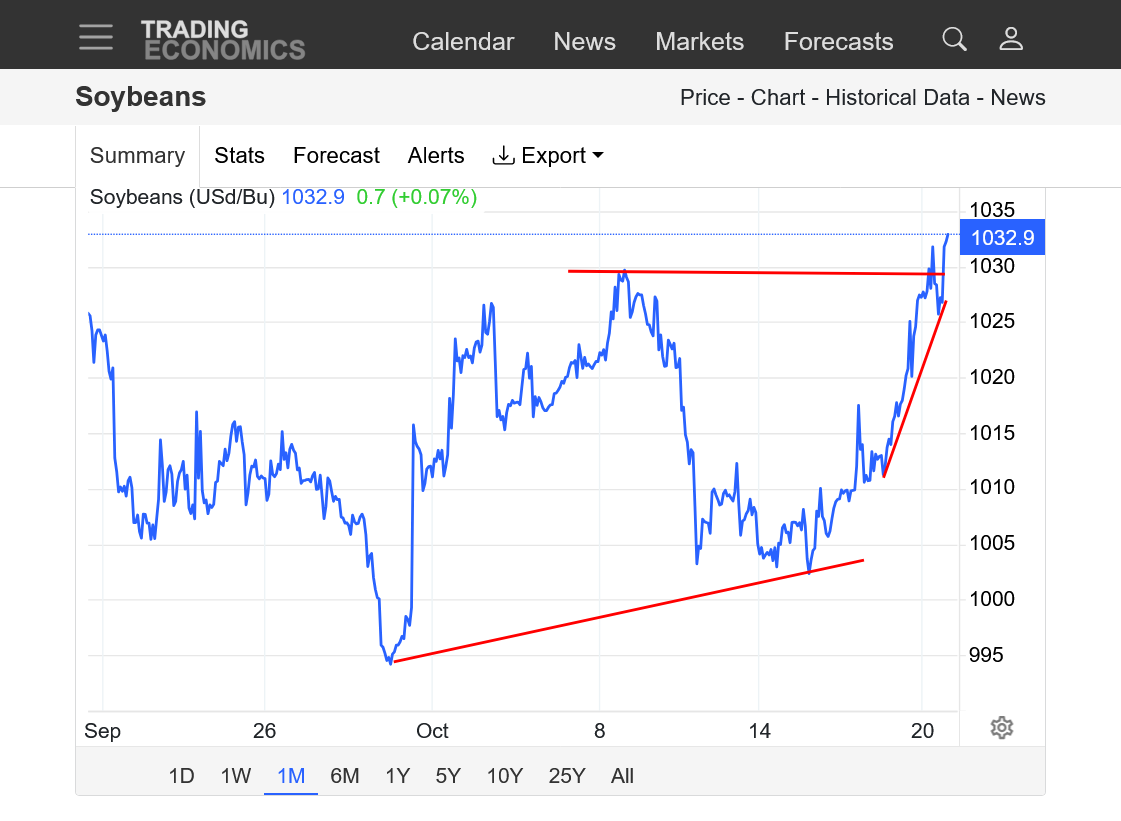
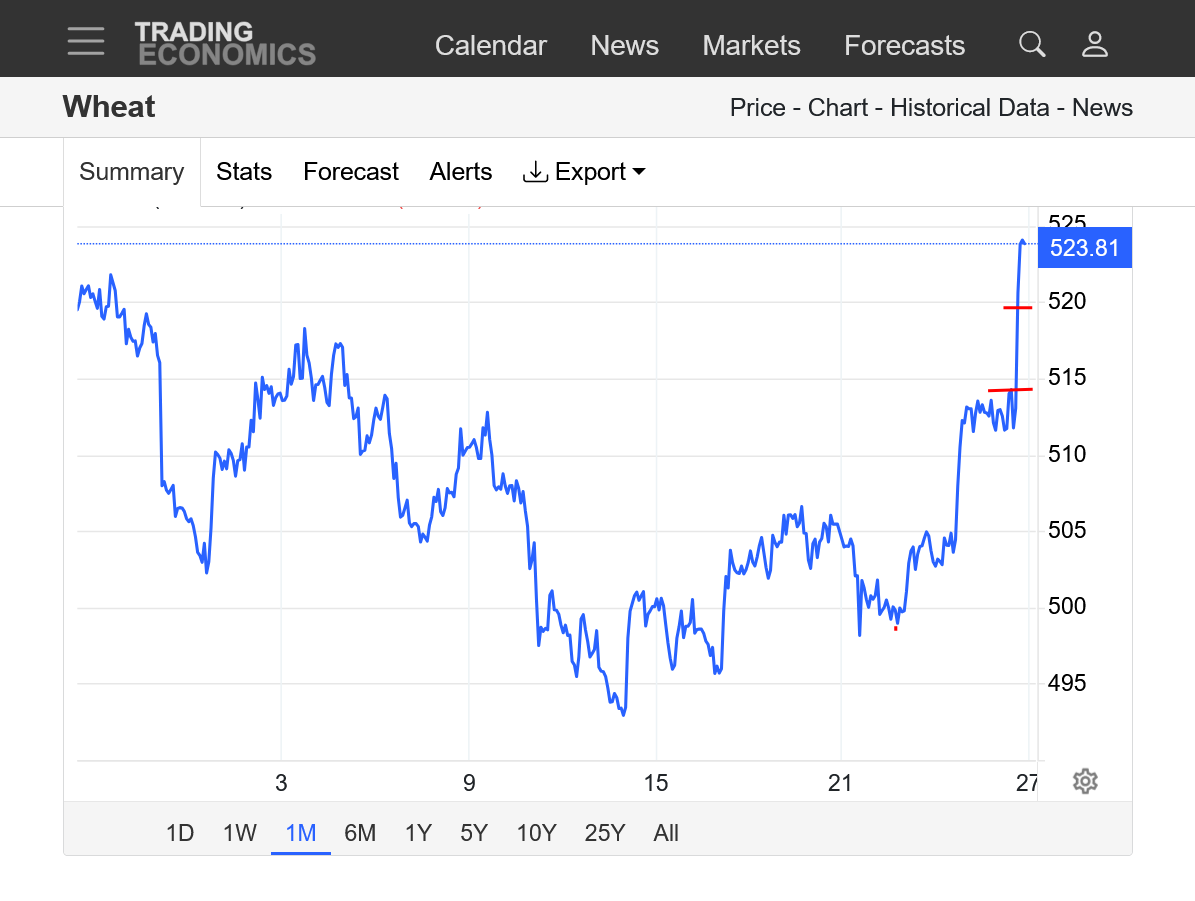
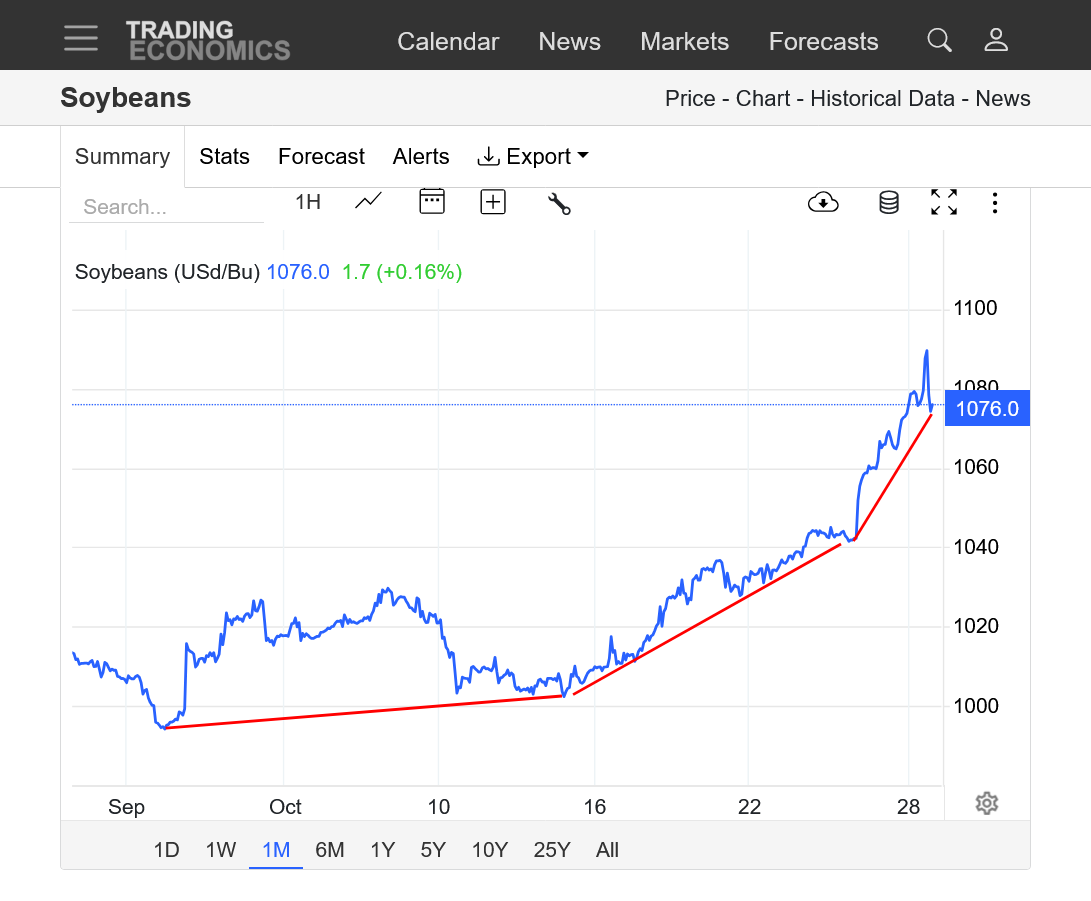
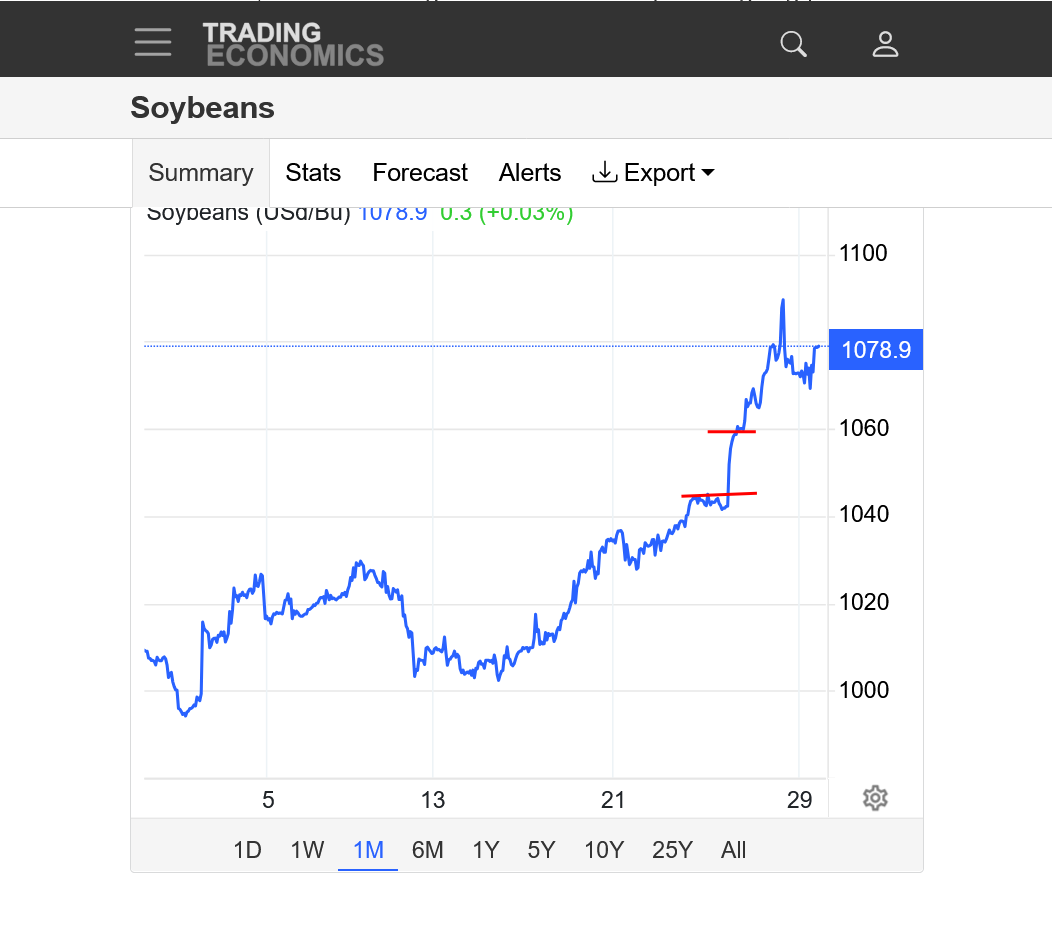
3. 1 month: Harvest low at the end of Sept BELOW $10! Retest last week that held ABOVE $10!
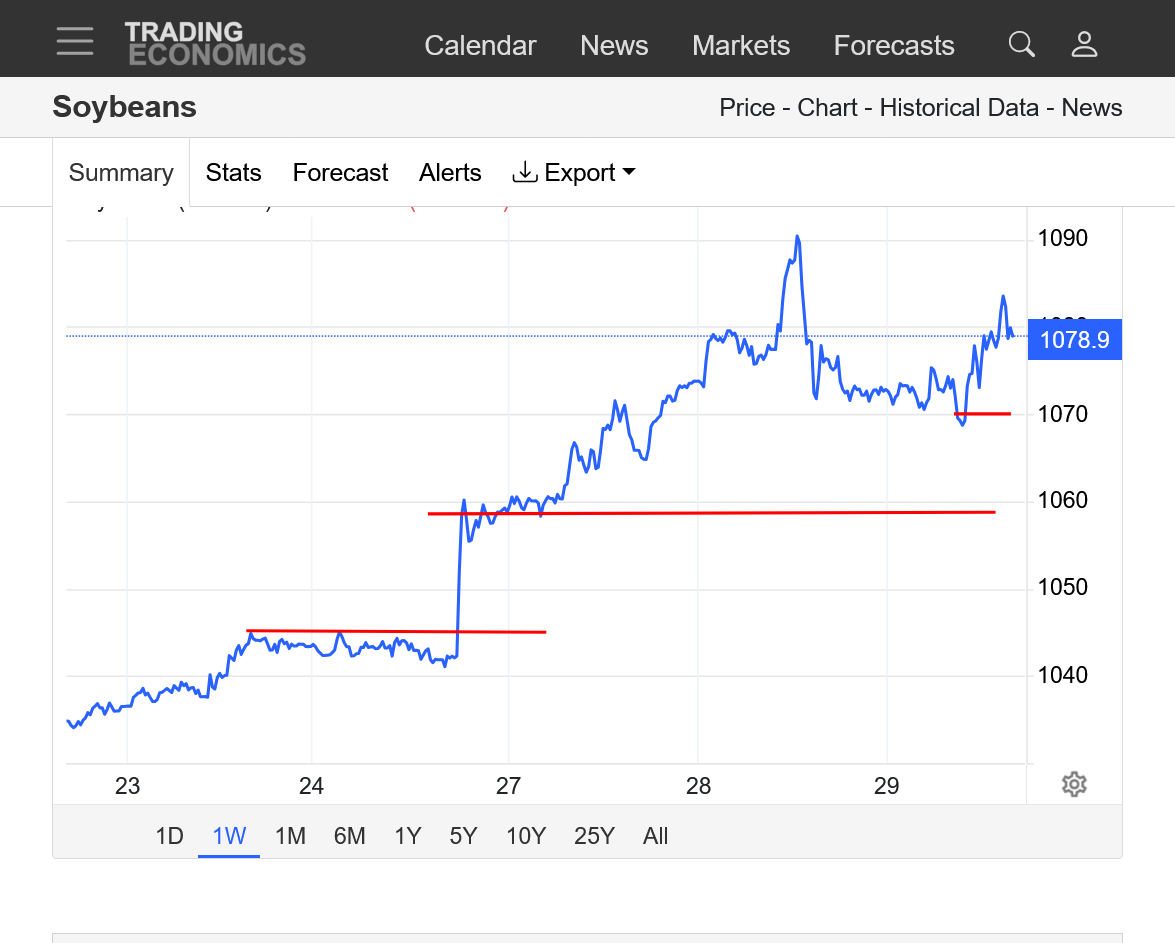
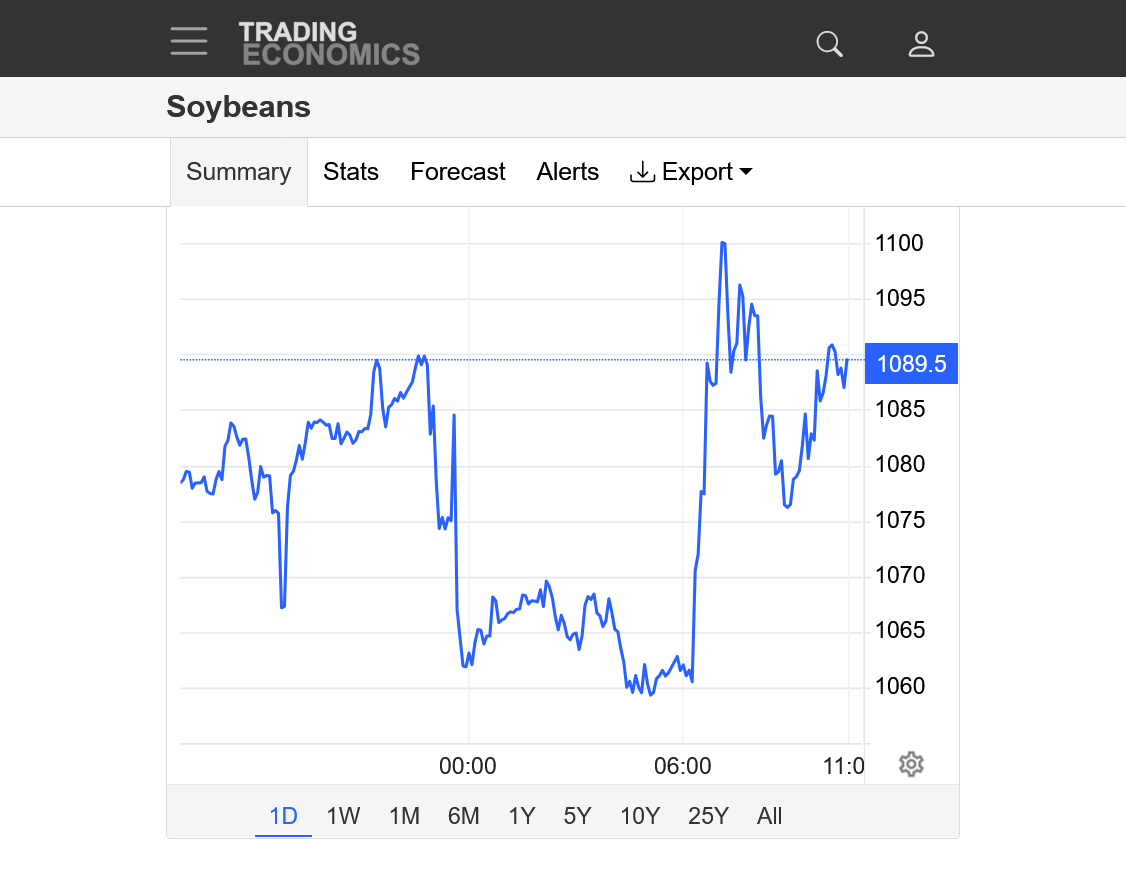
4. 1 week: After $10 held and Trump has made soybean bullish comments related to China, the market has added 30c in a flash!
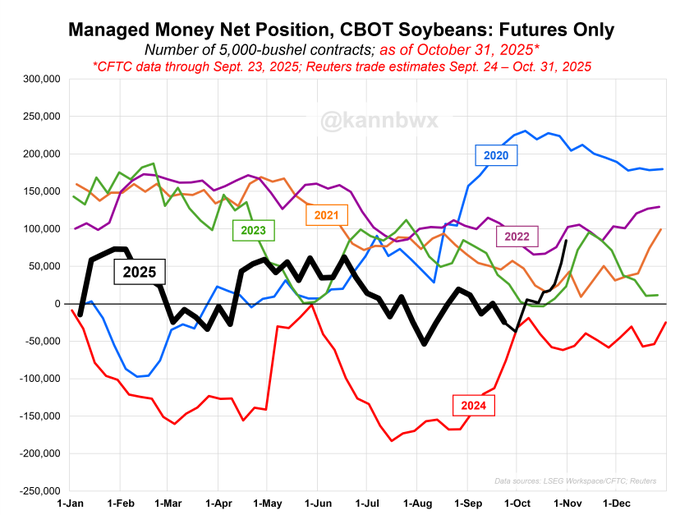
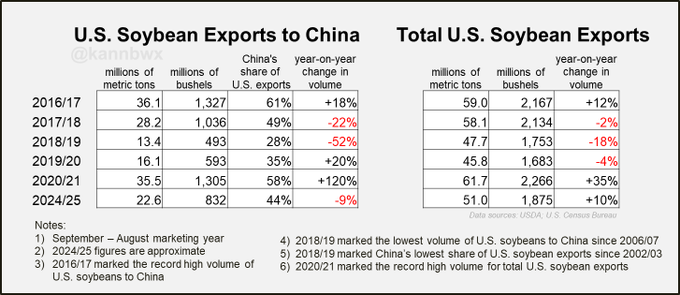
Bookmark this, perhaps. U.S. soybean trade with China is among the hottest topics in agriculture / geopolitics right now, though I've seen some suspicious numbers floating around out there. Don't worry, I've got you. Here's your cheat sheet with some milestones identified.
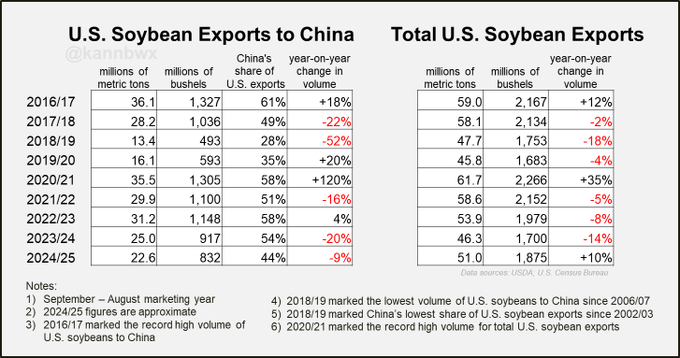
Someone requested the fuller table in the comments - pasting it here. My goal was to show the progression of U.S. soybean exports to China through the first trade war versus where we are today. Didn't wanna pack too much on there, but seeing the last three years doesn't hurt!
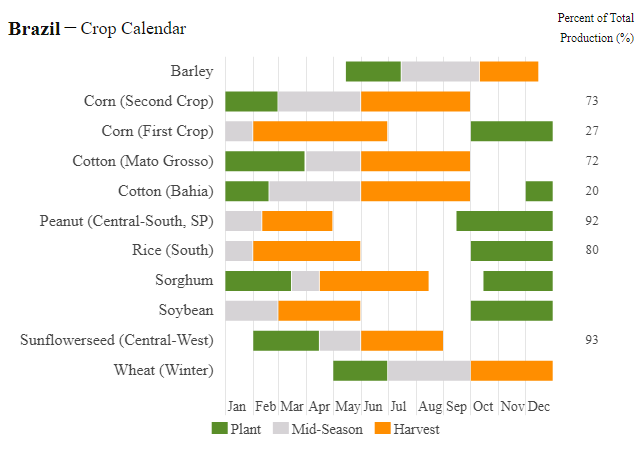
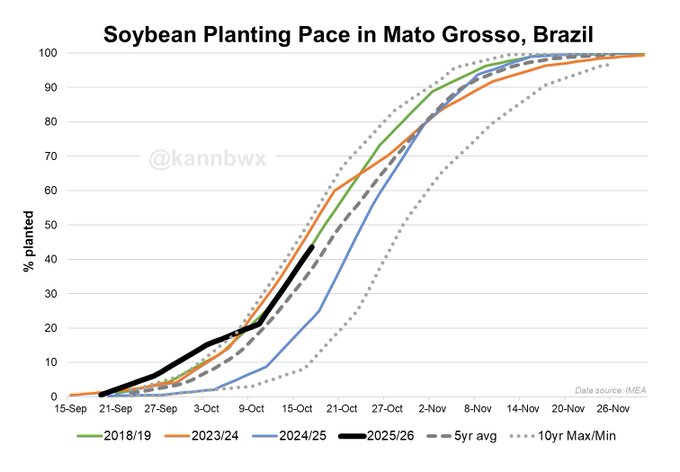
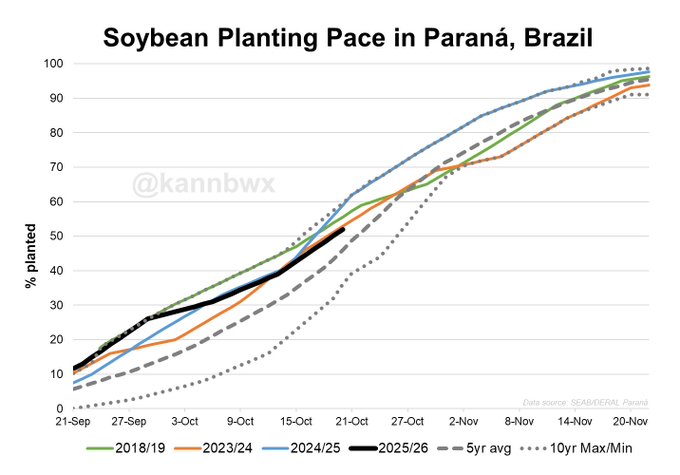
Brazil 2025/26 soybean planting update: Mato Grosso (as of Fri): 44% planted, ahead of average 37% and last year 23%. Not as fast as 2yrs ago. Parana (as of Mon): 52% planted, ahead of average 46% but slightly slower than in the past 2yrs.
https://ipad.fas.usda.gov/rssiws/al/crop_production_maps/Brazil/Municipality/Brazil_Soybean.png
https://ipad.fas.usda.gov/countrysummary/default.aspx?id=BR
++++++++++++
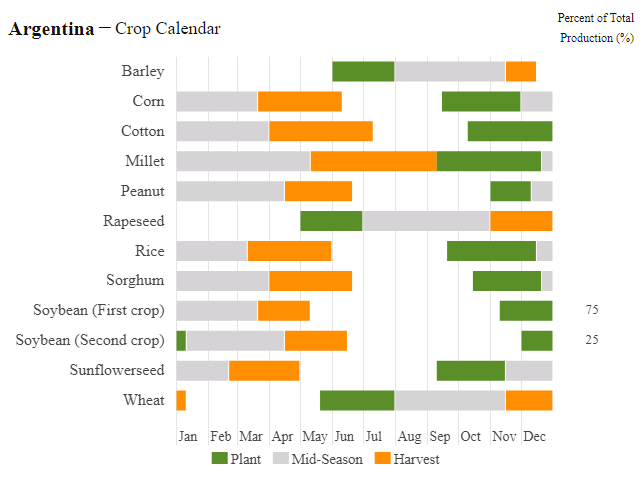
https://ipad.fas.usda.gov/countrysummary/default.aspx?id=AR
++++++++++++
Recent rainfall amounts: Makes sense that planting is off to a quick start because its been dry in Brazil! If it gets too dry, however they will sometimes wait for better moisture to plant.
30 days:
https://www.cpc.ncep.noaa.gov/products/Precip_Monitoring/Figures/global/n.30day.figb.gif
90 days:
https://www.cpc.ncep.noaa.gov/products/Precip_Monitoring/Figures/global/n.90day.figb.gif
180 days:
https://www.cpc.ncep.noaa.gov/products/Precip_Monitoring/Figures/global/n.180day.figb.gif
Matt did our weather this morning!
https://www.youtube.com/watch?v=T5GIgu2E2Ow
+++++++++++++=
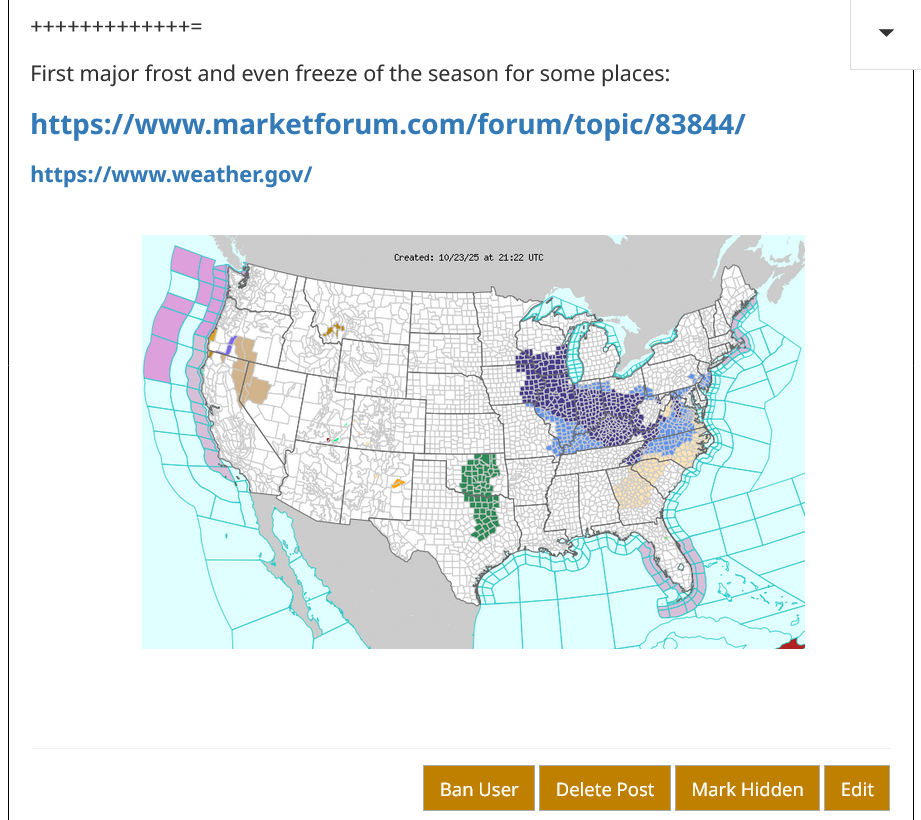
First major frost and even freeze of the season for some places:
https://www.marketforum.com/forum/topic/83844/

Freeze frame below for 10-23-25. Constant updated map above.
Matt did our Thursday weather:
https://www.youtube.com/watch?v=l7wMRHGk9Y8
maybe a breakaway gap in wheat tonight?
edit: maybe a measuring gap in beans?
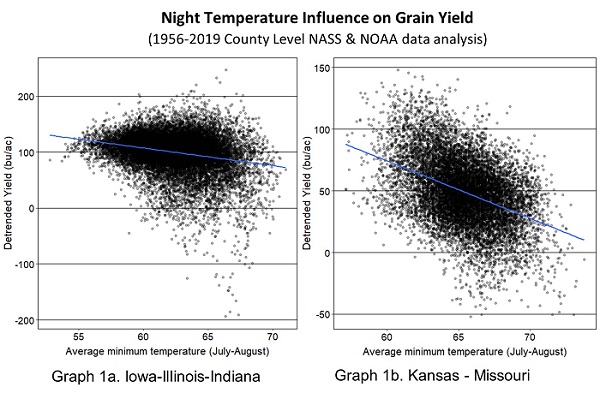
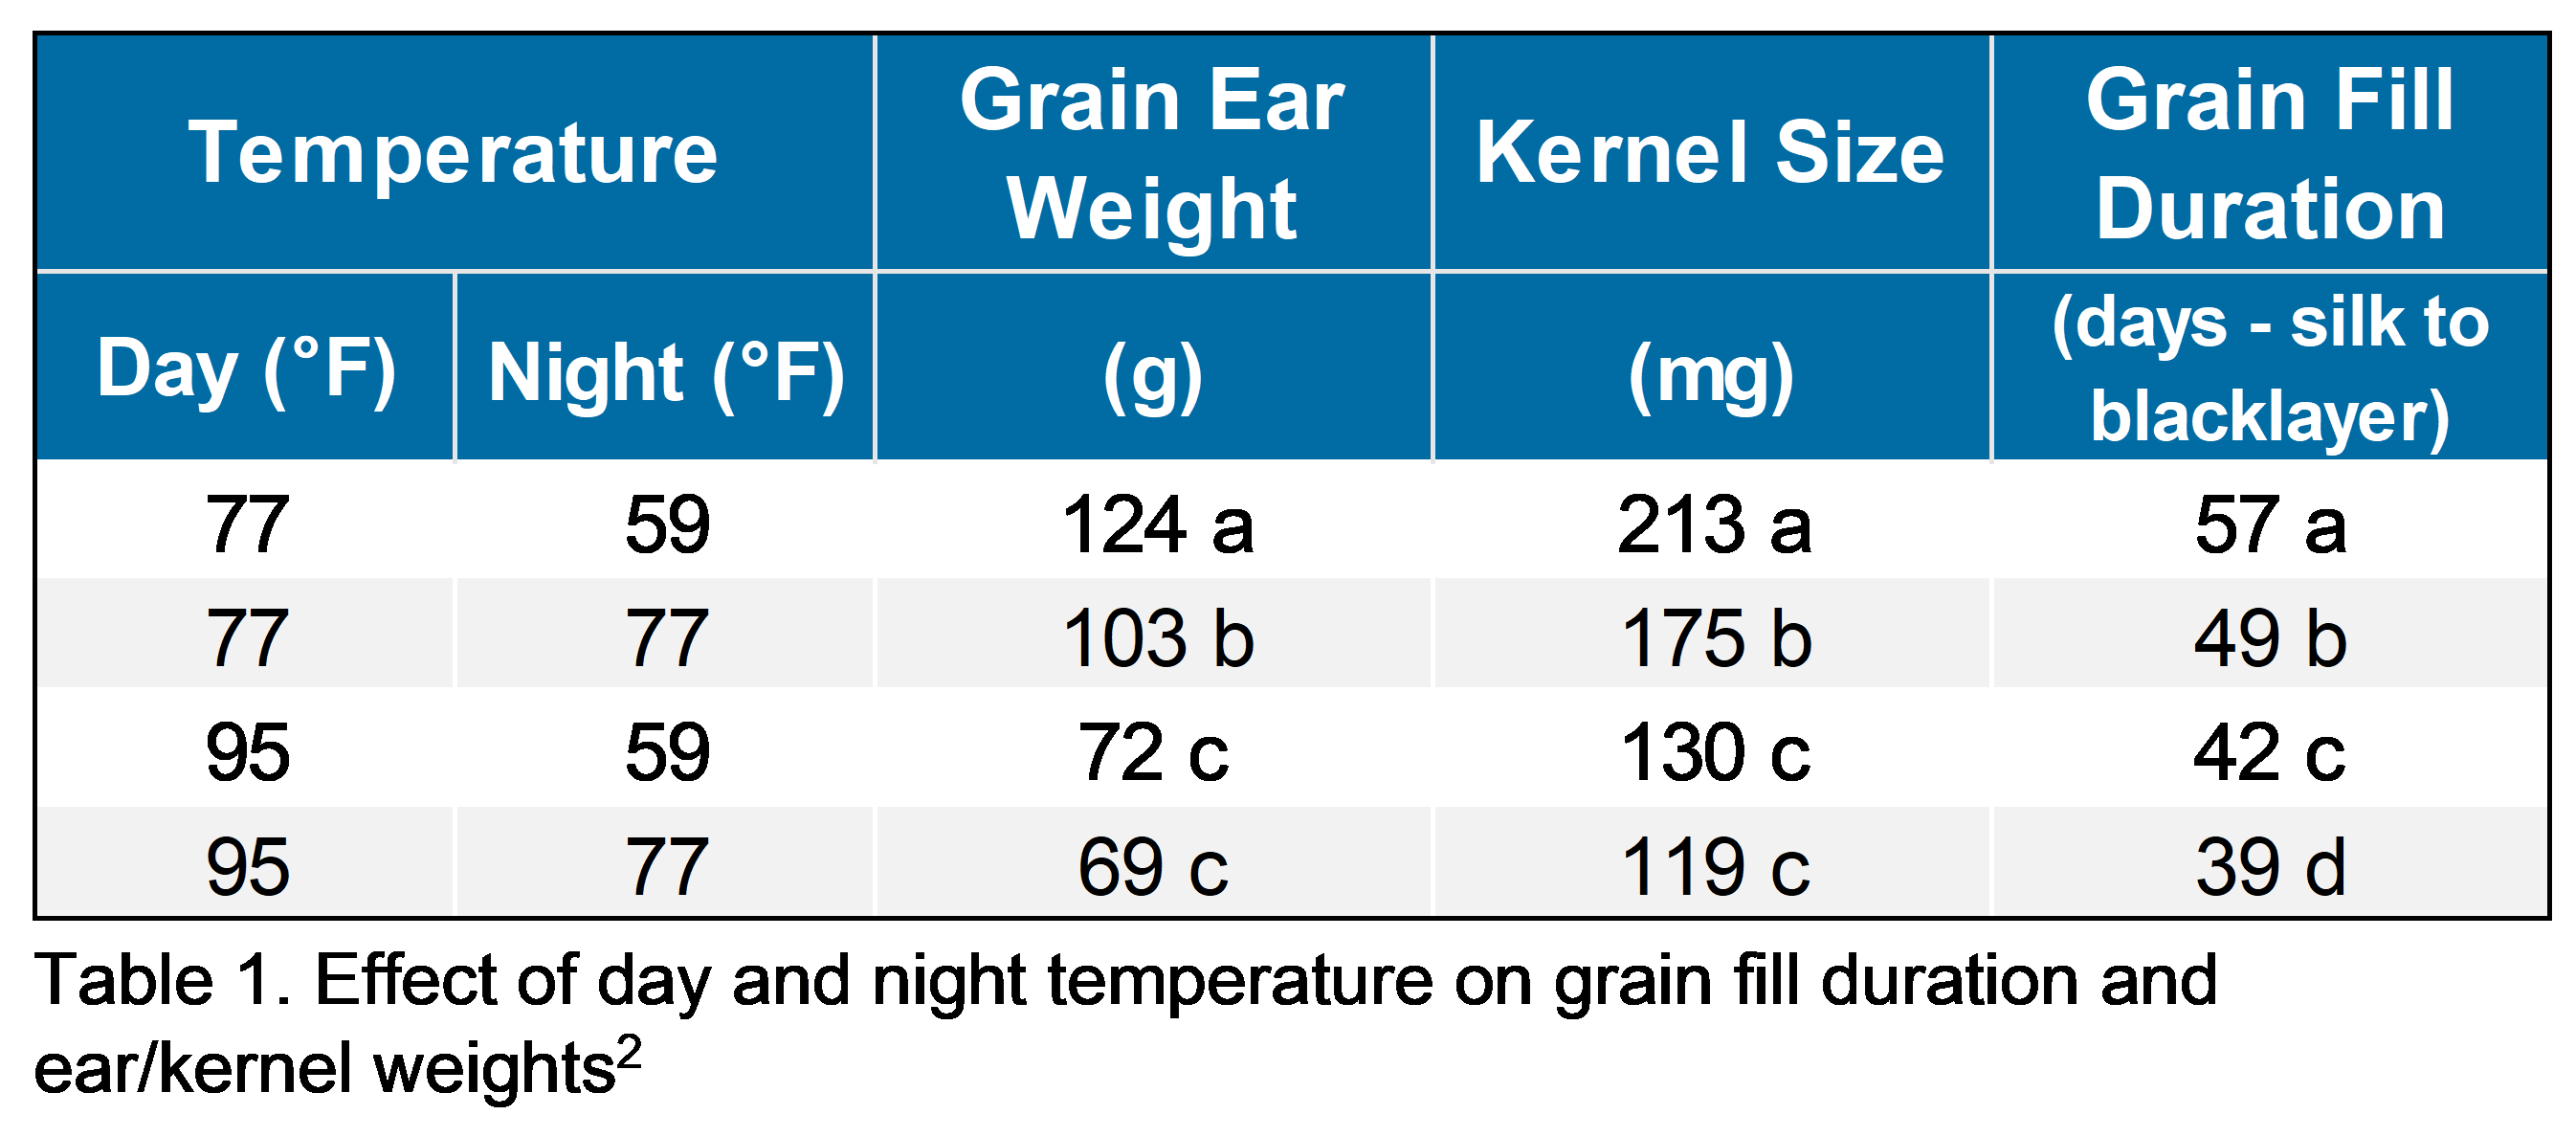
Corn and nighttime temps.
Thanks very much, cutworm!!! Great stuff. It's much more fun having discussions like this!
I think that there are half a dozen different factors that are incredibly important and this is just one of them. Her rule of thumb with yield loss might be close to an average but the range can vary a lot dependent on the other variables.
The amount of yield loss will be amplified from this particular factor if the soils are also dry for instance. Or if daytime heat is also excessive. Planting dates and root depth are important.
++++++++++++++
https://agrigold.com/resources/agronomy-library/corn-field-works-hard-day-night
+++++++++
This was our best thread for explaining and illustrating this principle but cutworms post helps us to really appreciate the importance of temperatures at night:
HeatFill for Corn
Started by metmike - July 14, 2023, 2:47 p.m.
cutworm,
Agree with your technical interpretation! Pretty dang bullish!
BEANS
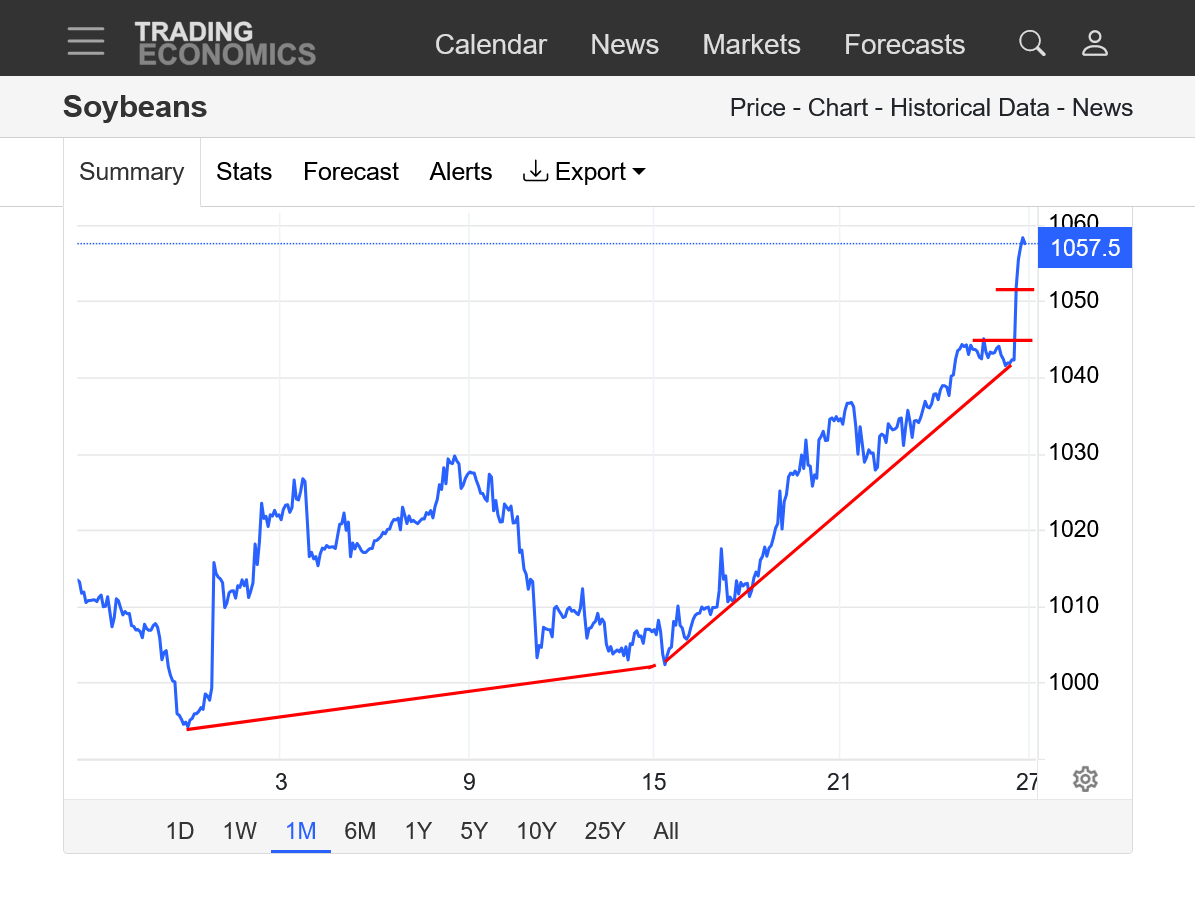
https://tradingeconomics.com/commodity/soybeans
1. 1 month: Gap higher this evening from possible deal with China that could jump start soybean sales. The harvest lows are in with a steepening uptrend this month.
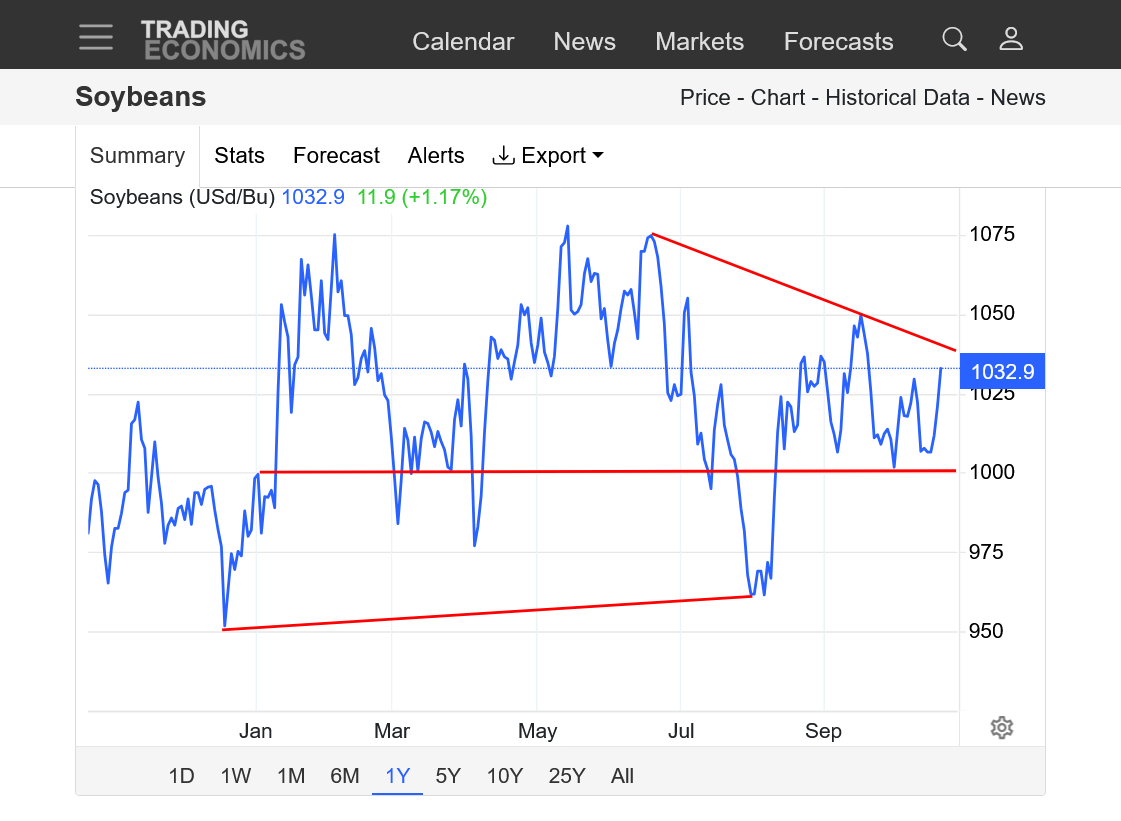
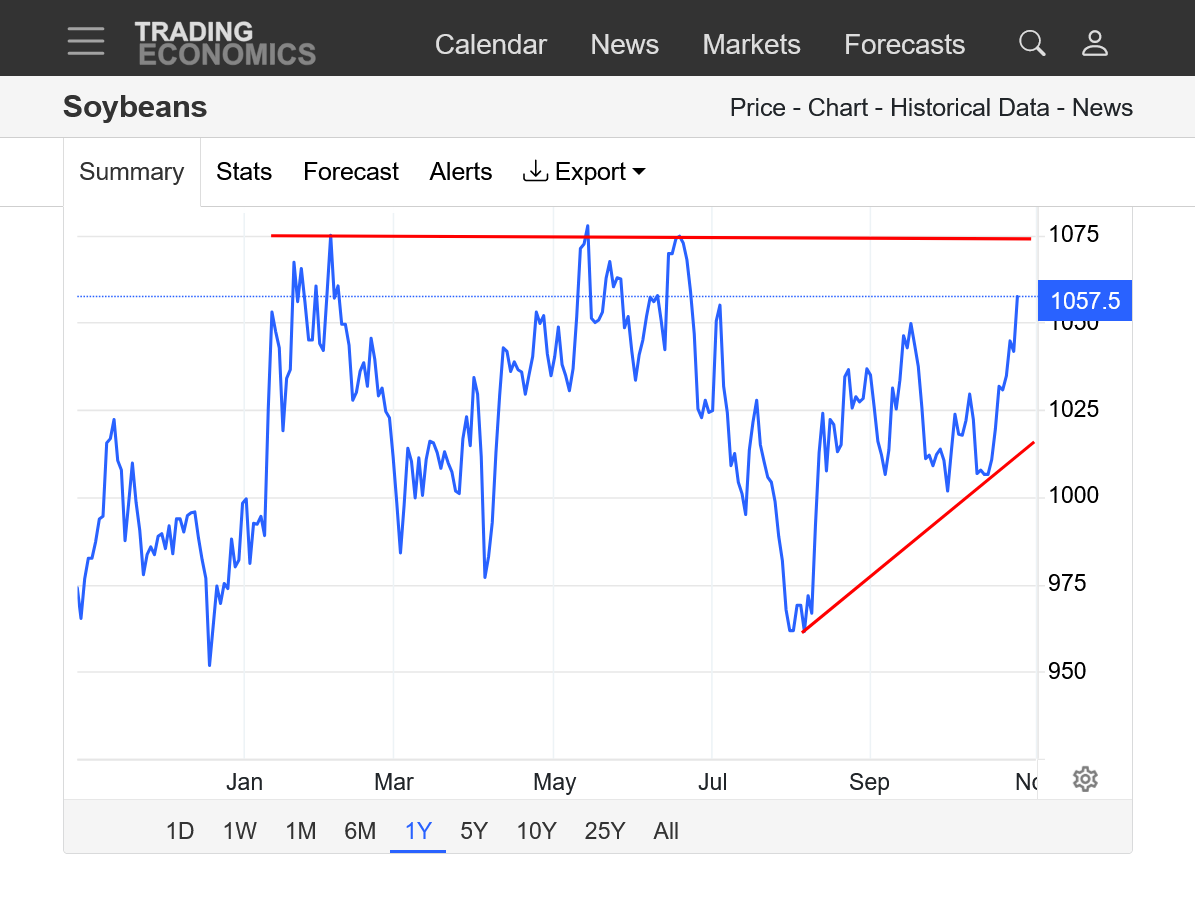
2. 1 year: The lows are in. Looks likely that we'll break thru resistance at the top.
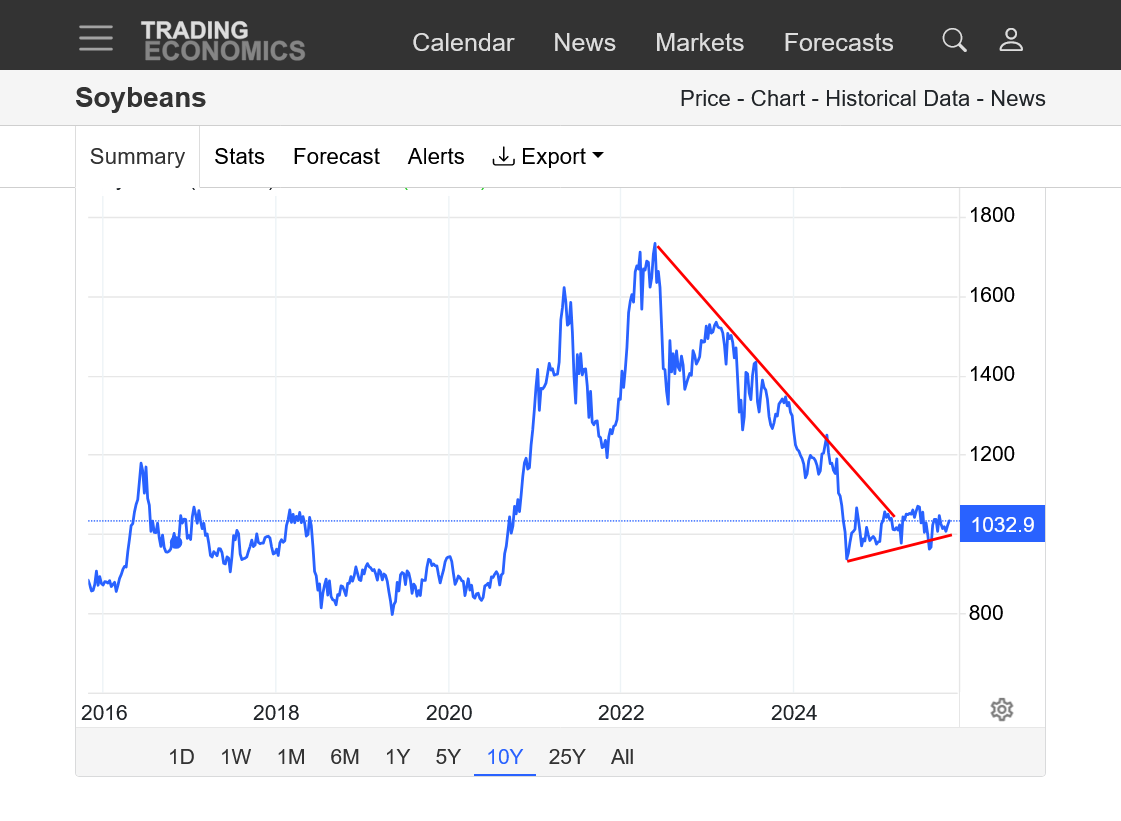
3. 10 years: Wedge/flag formation with higher lows. Poised to break out to the upside.
++++++++++++++++++++++
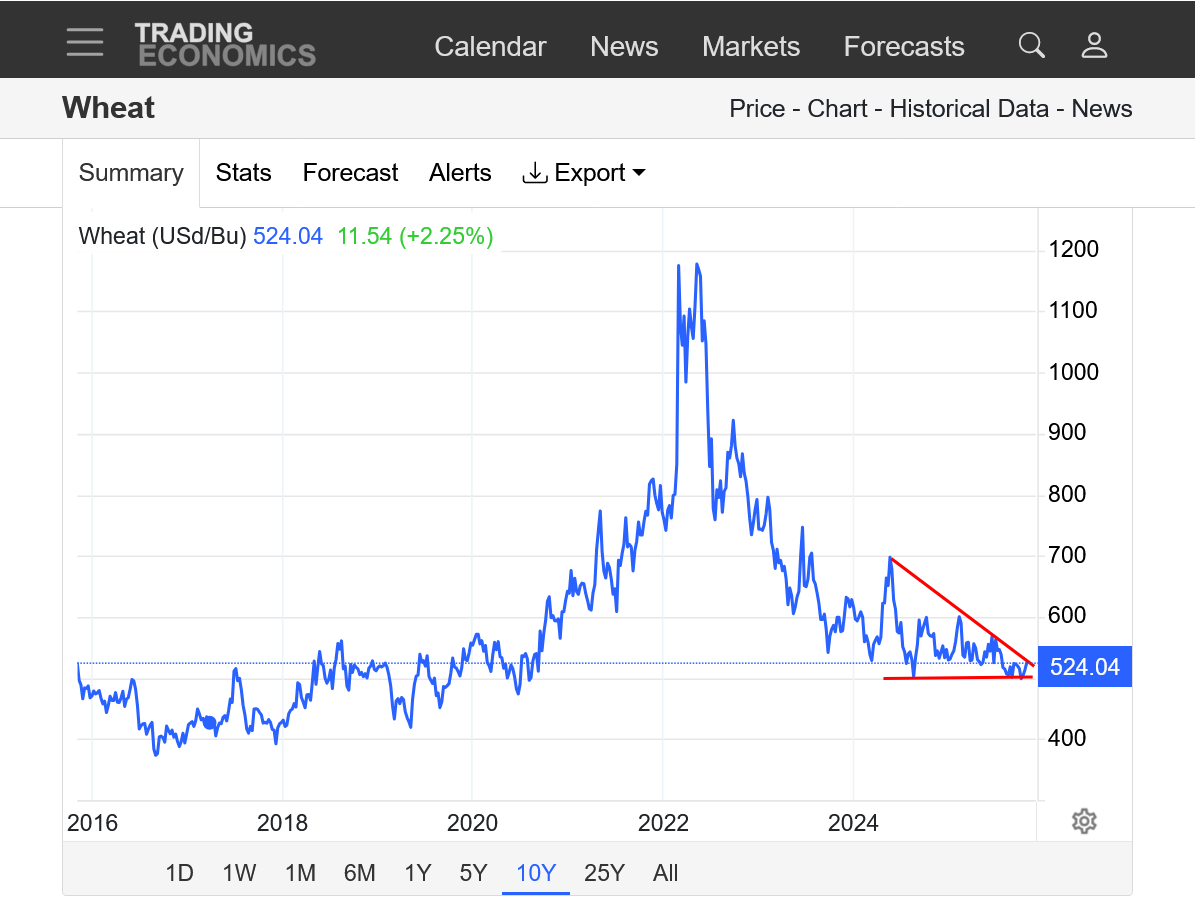
WHEAT
https://tradingeconomics.com/commodity/wheat
1. 1 month: Upside breakaway gap.
2. 1 year: Double bottom around $5. Upside breakout above resistance and above down trend?
3. 10 years: Double bottom? On the verge of breaking to the upside from a wedge/triangle pattern?
I mentioned a measuring gap in beans. It pointed to 11.13 today hit 11.08. (jan beans) I can never get these things to work out exactly. So near short-term top. Now back to near the top of the gap??10.72 ish??
Basis has been strong here in IN. Starting about a week and half ago the basis improved, someone wants beans now.
Thanks, cutworm! Good info. You've been on this.
I did a lengthy post on beans earlier today and its not here. I must have forgotten to send it .
Here's the charts that went with it:
1. 10 years: Poised for a huge upside break out on long term charts
2. 1 year: Hit resistance. Possible pull back
3. 1 month: Extremely bullish after harvest lows were put in
China FINALLY Buys US Soybeans + Joe Gets GHOSTED by Brooke Rollins
After the market closed it appears COFCO bought 3 cargoes of beans for 180k mt. During the last trade war, the US did see a ‘pre-buy’ before an agreement was eventually made.
Thank, cutworm!
You're on top of it. Looks like the beans spiked up around 7c quickly after the re-open but are still down just a bit for the session, so the market acts like it was expecting this sort of news.
yes by the time I hear news it has already traded.
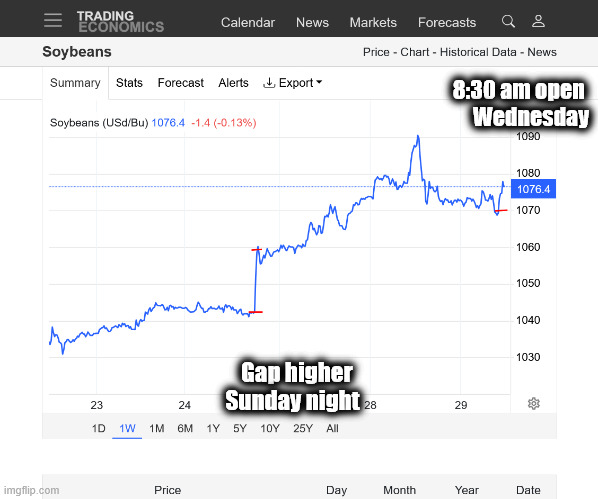
Beans continued to build on the early bounce in the day session. On the left is the gap higher from Sunday Night. This was not just a gap higher on the daily bar but also the weekly and monthly bars.
Markets act this way when something profound happens between trading sessions. When there is solid follow thru, like we've had in the beans this week, its because that sudden new fundamental is becoming MORE powerful as the market digests the (bullish in this case) impact on prices moving forward.
The amount of buying from China will dictate future price movement to some extent. Like cutworm said, we could have a pull back from the Tuesday resistance since we've come a looooong way in a short period of time. Spike harvest lows in beans are not that unusual and this one was amplified greatly by the China news.
https://tradingeconomics.com/commodity/soybeans
1. 1 week
2. 1 month
Just before 11pm beans crashed lower. Down 20c in around an hour.
Must have been related to something coming out of China or what Trump said!
Some insanely volatile trading during this session! This is totally from NEWS related to China. This was just todays trading session.
https://tradingeconomics.com/commodity/soybeans
Jan beans tested the gap and then made new highs.
Now can we close the week above 10.85?
Thanks, cutworm!
https://tradingeconomics.com/commodity/soybeans
Major upside break outs at every time frame!
1. 1 year: Much higher harvest low than Summer low. Highest price since 2024.
2. 10 years: Breaking out to the upside of some long term resistance. Higher lows since COVID/2020. MAJOR top in 2022 with steep down trend channel for 2 years, followed by a FLAG/TIGHT ASCENDING WEDGE formation that we broke out of to the upside from today!
Matt was in with the weather this morning:
https://www.youtube.com/watch?v=1-xjFUtCWVE
++++++++++++++=
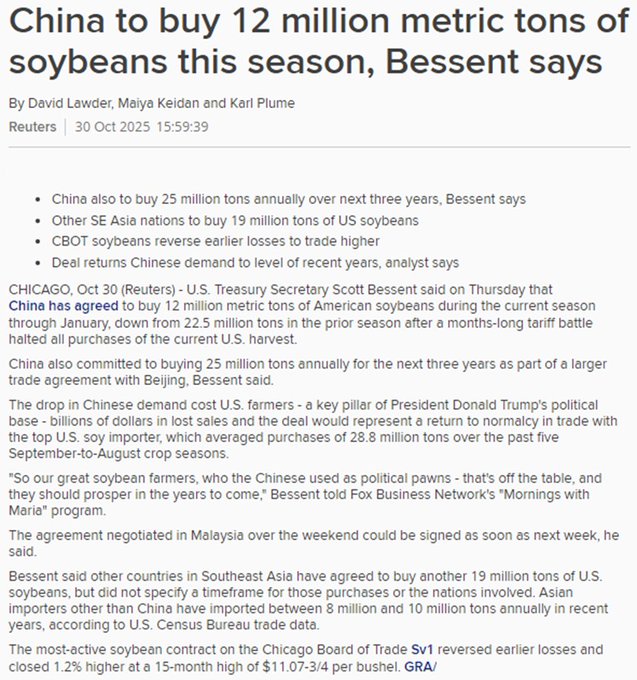
And obviously the most important development - Trump and Xi struck an agreement on Thursday that is set to include Chinese purchases of U.S. soybeans:
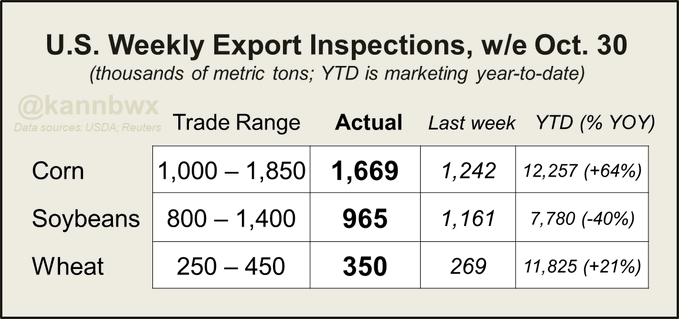
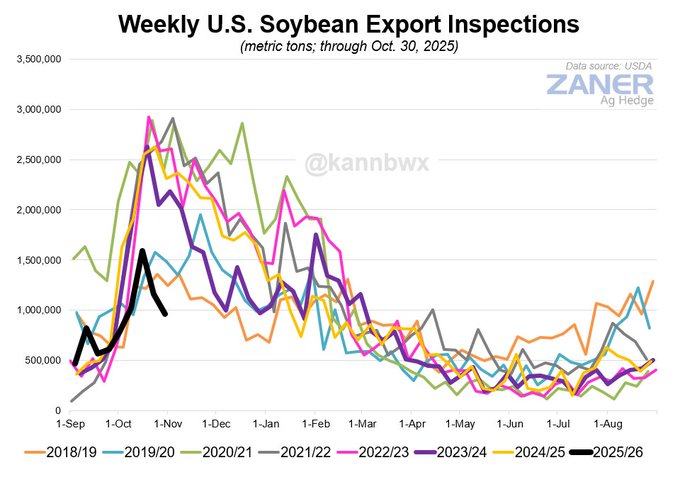
Last week's U.S. corn export inspections were the week's largest ever in records back to 1983. But the soybean volume was the week's worst in 18 years (nothing inspected for China).
It's almost as if corn and beans have switched seasons??? Massive corn inspections during a time when beans should be the leader (due to China's presence, usually). Wheat inspections moving along seasonally.
Fun fact: YTD U.S. soy inspections are nearly 9% below the same period in 2018. But in that 2018 period, 8% of the volume was to Argentina, 4% was to China (vs none to either this year). As such: YTD 2025 non-Argy, non-China inspections are actually up 4% from 2018.
++++++++++
I've been using Karen for the past 6 years as my favorite source for this kind of FREE comprehensive information conveniently. She IS the best at it and I hope she continues to provide much of this for free. Unfortunately, she is charging for some of this information now and could be gradually phasing out the free stuff completely. I've used thousands of her wonderful graphics and data and will always be grateful for that. If you really enjoy her stuff, I ALWAYS provide her link (and others) in every post to give due credit to the source. She might not even know who I am, so I am not selling anything or getting anything, just giving readers good options if they like her data.
Matt's awesome weather today!
Nov 4, 2025: Lake Effect Snow | Coldest Air of Season | Telegraphed Pattern | MJO + December Chat
Eric was in today with the weather!
crop report Friday at 12 eastern time
Thanks, cutworm!
I guess the USDA is back reporting?
Yes back to reporting BUT where are they getting their data? everything has been closed down.
Great point, cutworm!
I'm thinking this report won't inspire much confidence. However, we both remember the November 2024 report being woefully overly optimistic in OVER reporting yields, especially beans after the late season drought decimated pod filling and kernel filling.
Then, the incredible, ultra bullish January shocker with data they should have had months earlier, with cutworm and metmike posting many times about in late August/September on MarketForum.
If they can;t get it close to right under those circumstances, I don't feel confident in this next report with lacking data.
I've mentioned this several times now and will again. How is it that the USDA could be so extremely wrong a year ago about production that required a no brainer reduction?
They don't have anybody as smart as cutworm/metmike that works for them?
That can't be it because they HAVE ALL THE DATA. You don't have to be smart to add numbers. Maybe there's some incompetence but I have strongly suspected that some of the insiders at USDA know exactly how their reports impact the markets on the release and they will manipulate "some" reports to be overly bearish/bullish. I can't explain how they do it but it makes no sense that they have so many reports that go from upside surprises(compared to the market guesses from places that spend big bucks to calculate their own numbers) then, after everybody works from the updated bigger numbers for the next report, they surprise us with a downside number.
If you are shooting a target with a gun and its too far to the right, you make a slight adjustment to the left to get closer. With the USDA, they can shoot too far right, make an adjustment and next time, are even FARTHER AWAY from the target to the left. I get that its way more complicated than that and things I don't know about but I know about statistical analysis, agronomy, data and expectations using logical progression and close observations of the facts.
Something isn't completely right with our USDA reports. What do you think as a producer, cutworm?
How many producers got screwed over with the too high production number last year in November? Did that result of selling crops at lower prices for 2 months, until the REAL numbers came out in January???
This is what Karen had to say about it:
My guess is that USDA will use its November set of estimates for the long-term projections (usually it uses October WASDE estimates as the starting point). That full report usually comes out in mid-February.
·
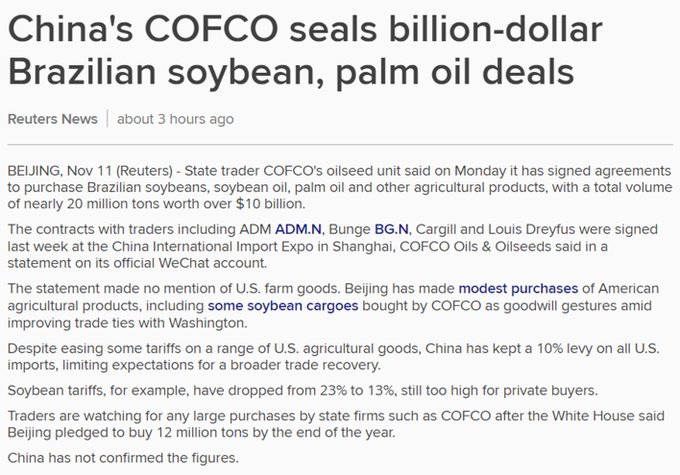
China's COFCO signed Brazilian soybean purchase agreements at an annual expo in Shanghai last week. The optics aren't great for the USA, but this isn't new. Framework deals are signed every year at this expo. FYI Jan-Oct 2025 Brazil soy exports to China = $31.6 bln.
++++++++++++++++
One of the most damaging impacts of the tariffs extends beyond just our lost sales in soybeans this year to China. Dozens of countries have sought out other countries to replace doing business with the United States. Not just as a result of the penalty that Trump has imposed from the tariffs and they reciprocated with but also because they can no longer rely on the United States as a stable trading partner. Signed agreements mean nothing to Trump. Ask Canada about NAFTA 2 which was supposed to be reviewed in 2026 for an extension to 2036. Trump pushed hard for the terms in the conditions in 2020. Instead, here in 2025, he changed his mind.
Disrespecting and unjustifiably punishing our trading partners is the way to LOSE business. .........and that's what's happening.
In general, when you bully and crap on people that have other options, you alienate them. You can take advantage of them if they have no other choices, then you can control them.
One of the many huge oversights in Trump's promise for 90 deals in 90 days after announcing his tariffs is assuming that he could bully 90 countries and dictate HIS terms to new arrangements because he falsely assumed(from complete lack of comprehension) they wouldn't go elsewhere or resist.
Instead of better deals for the United States, they are creating better deals between our trading partners and their new trading partners that replace some of the United States business.
·
Brazilian soybean planting reached 61% last Thursday, below the year-ago 67% due to sporadic rainfall. That compares with 47% a week earlier. In the top state of Mato Grosso, planting slipped behind average late last week (86% complete vs 91% avg).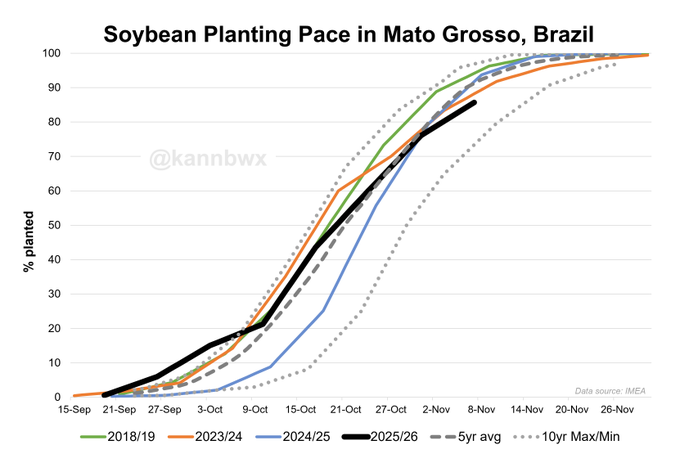
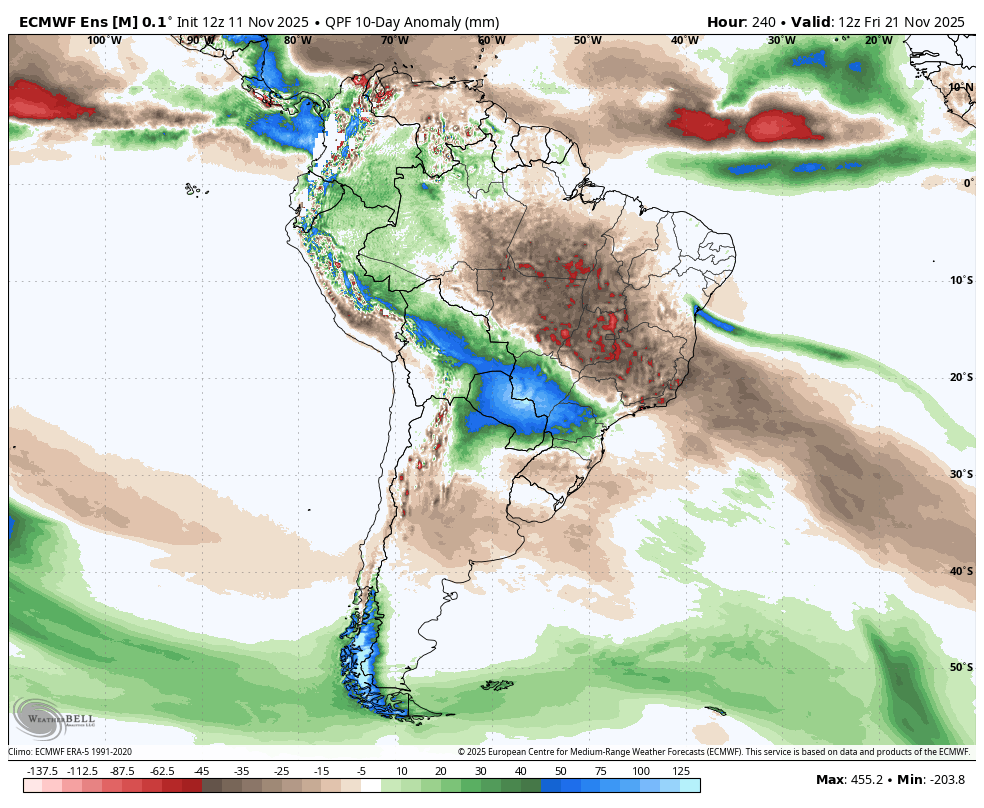
1. This was the rainfall anomaly for the next 10 days from the last 12z European Ensemble model. Pretty dry.
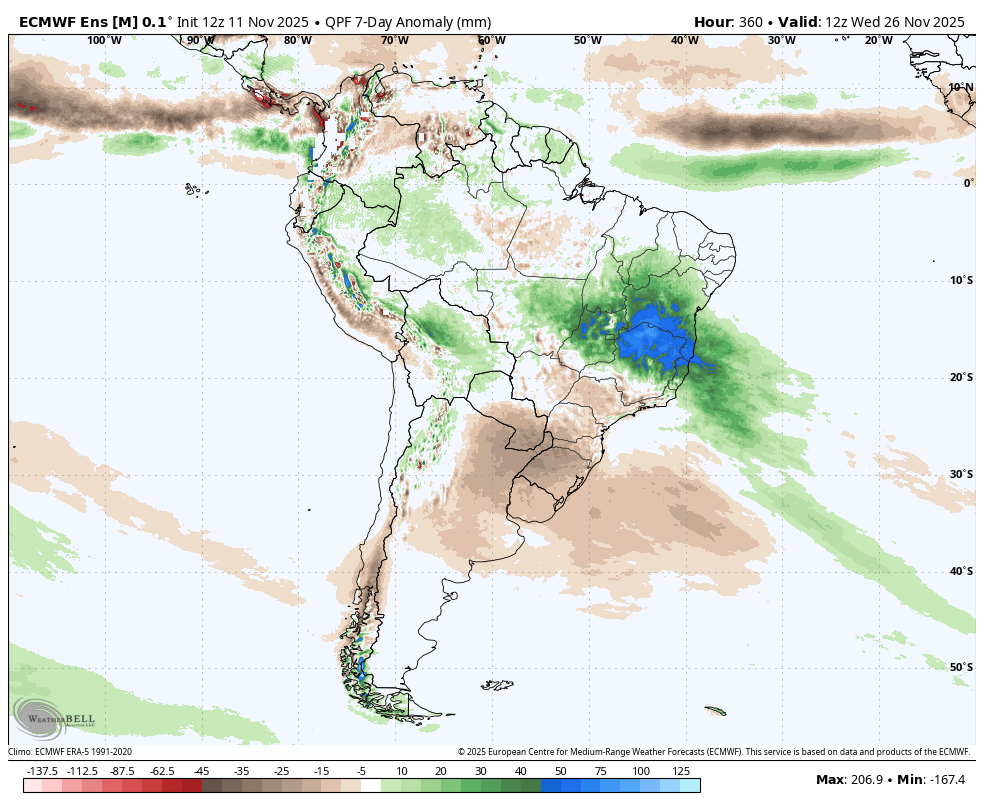
2. Rainfall anomaly for week 2. Turning MUCH wetter. I’ll have that map when I get back home
https://www.youtube.com/watch?v=QuRDkjZ27YM
+++++++++++++++==
Thanks, Matt!!!
