Not saying this is "THE" top [we'll find out in due course] but I think we have a September/October high in place.
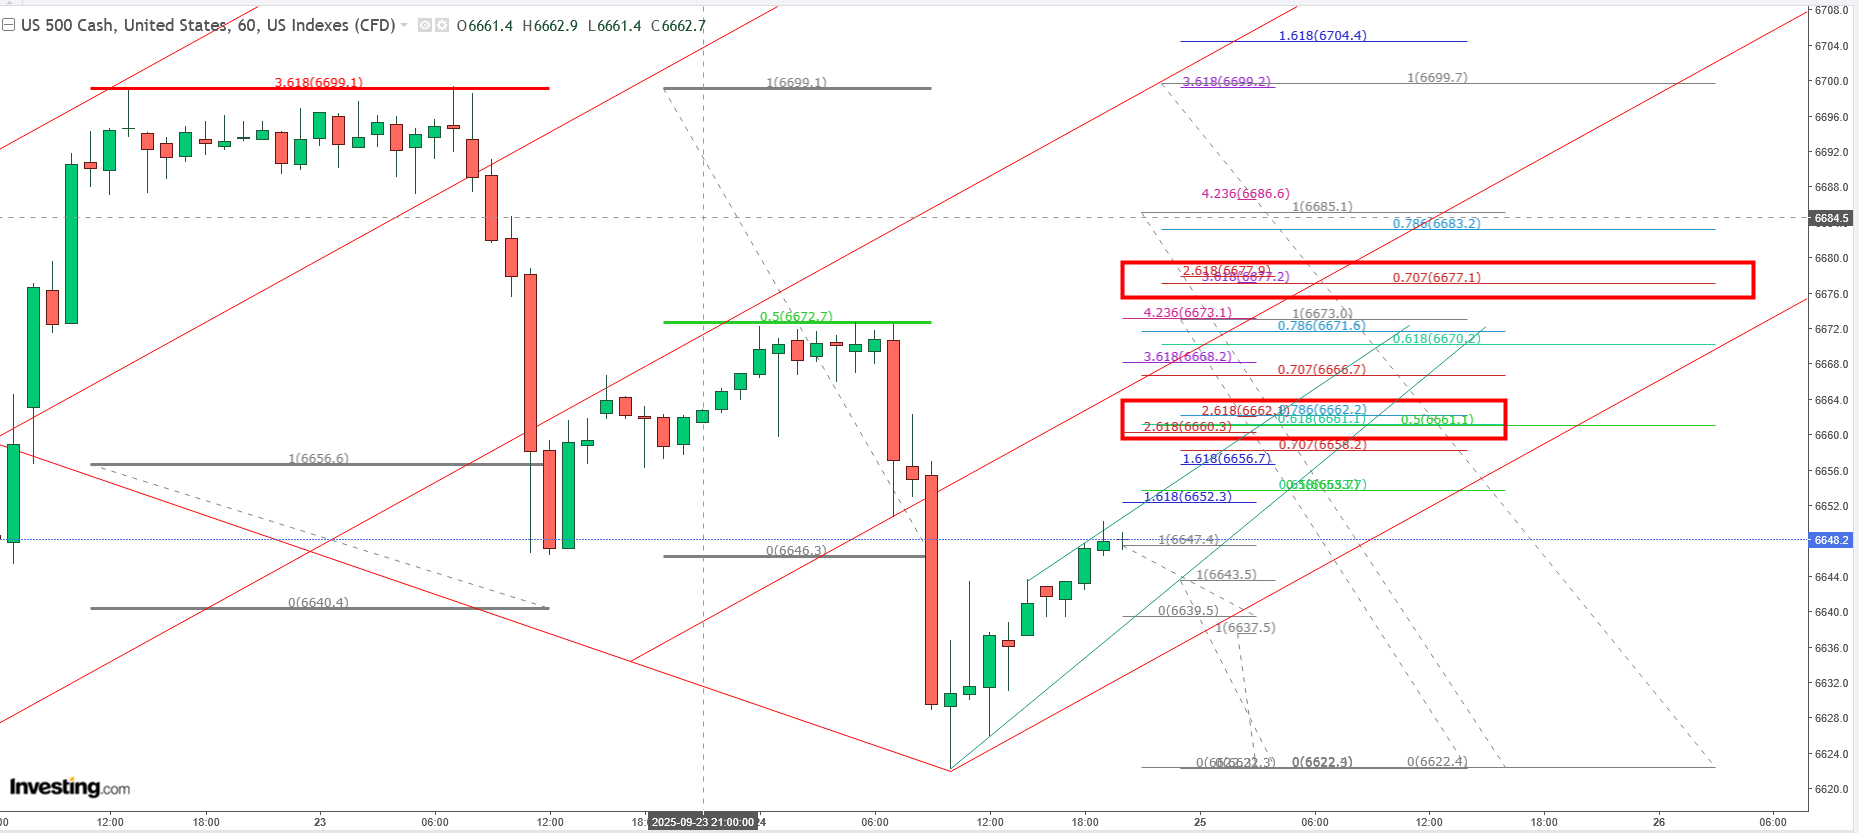
I have attached a chart with two major points of interest for tomorrow 09/25/2025 , let's just say I will be looking into the short side ....

Thanks, Kris!
I posted similar thoughts earlier. Nice chart.
More on Thursday. Keep us posted with your ideas.
By metmike - Sept. 24, 2025, 11:21 a.m.
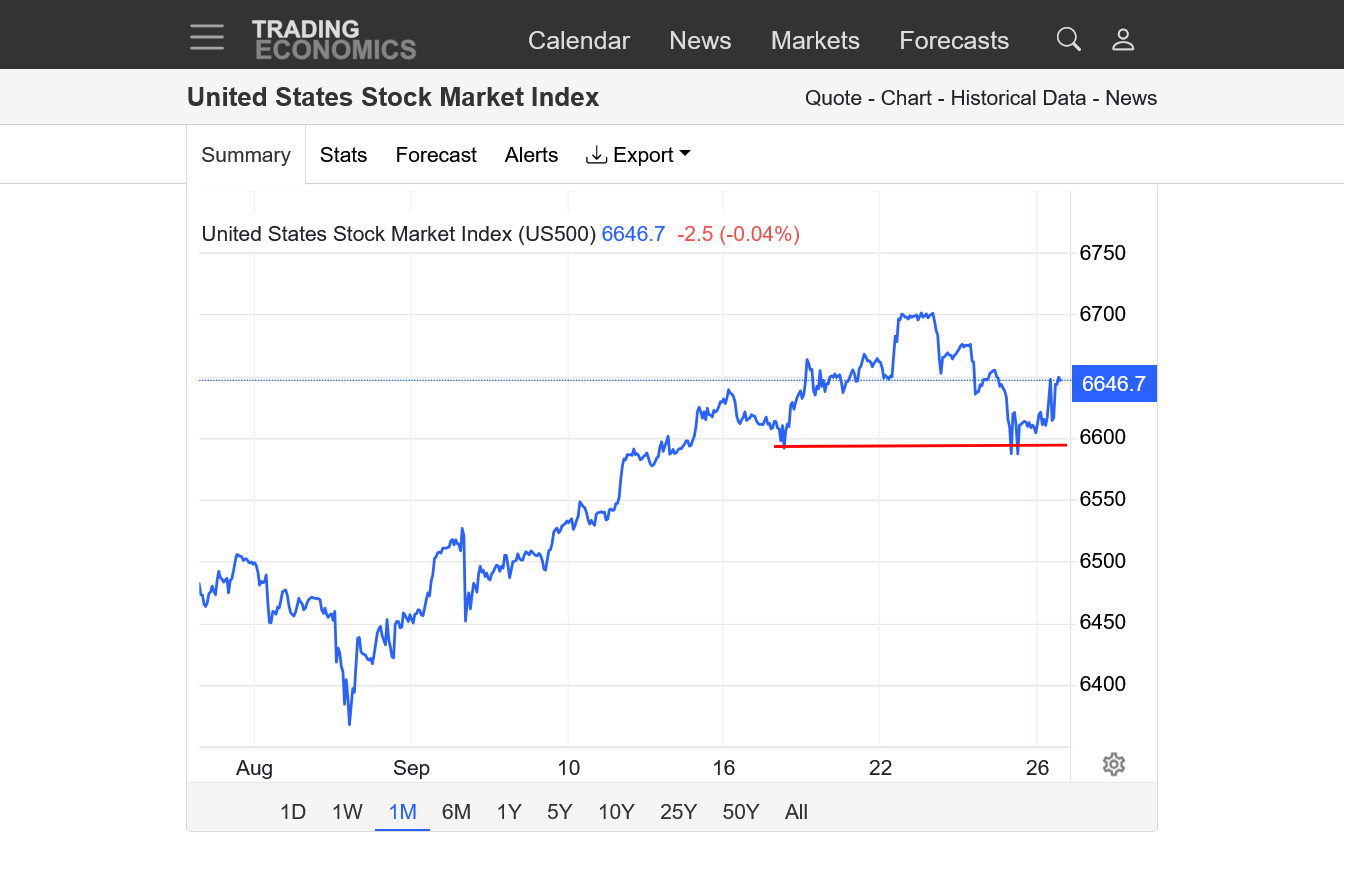
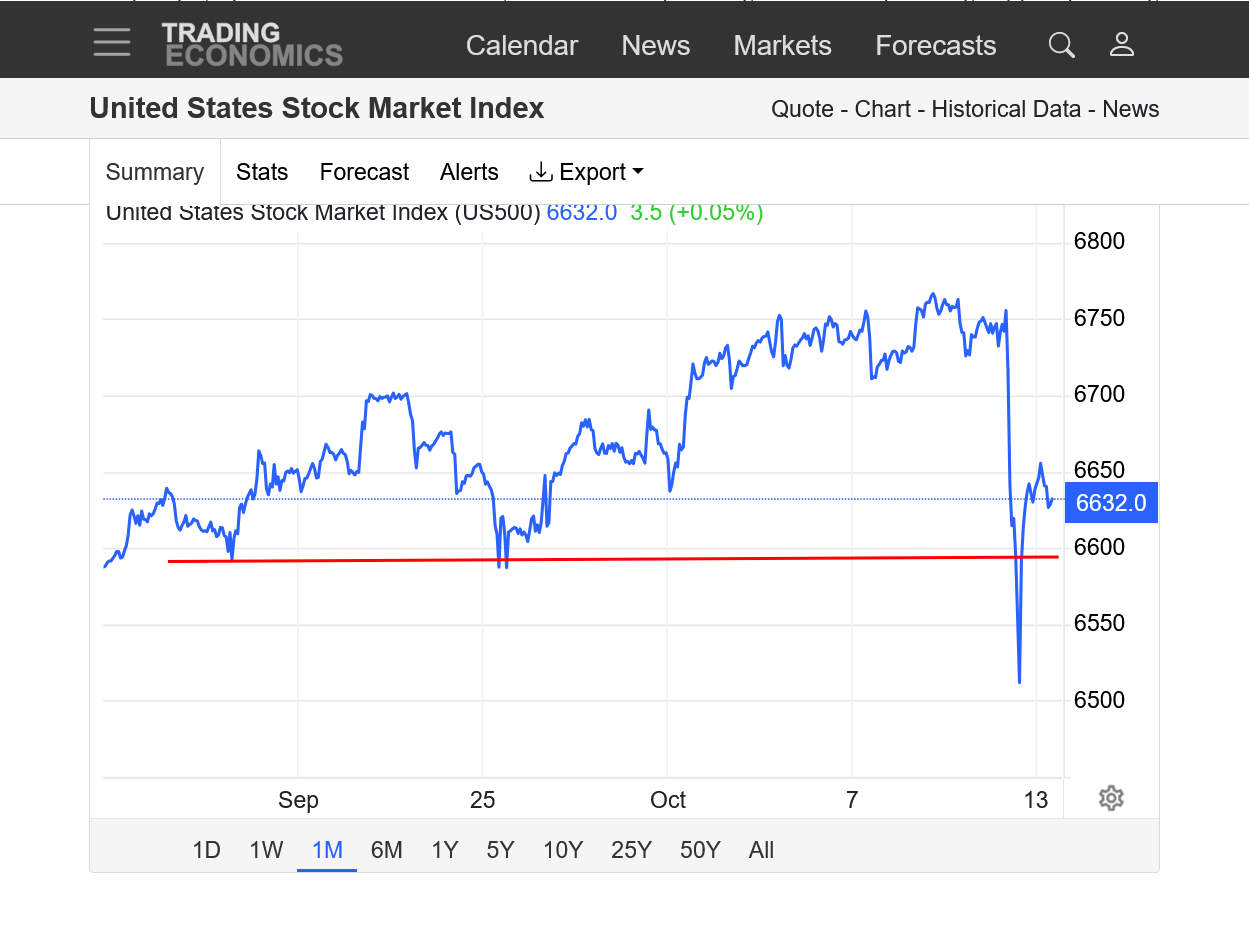
Potential reversal lower on the weekly chart if we close below the red line.
We can disregard the above chart since the overnight broke yesterday's low, crash cycle may be underway ... ?
Jobs report later this morning, going to be a fun day !
Thanks, Kris
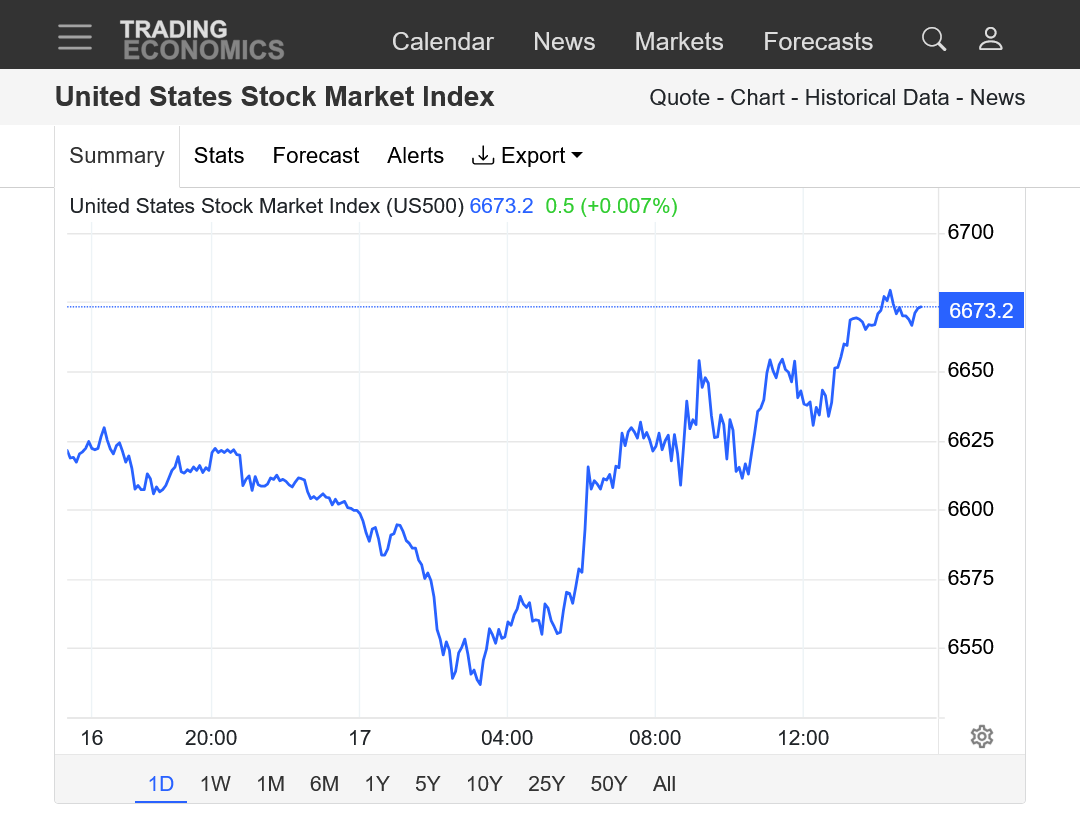
https://tradingeconomics.com/united-states/stock-market
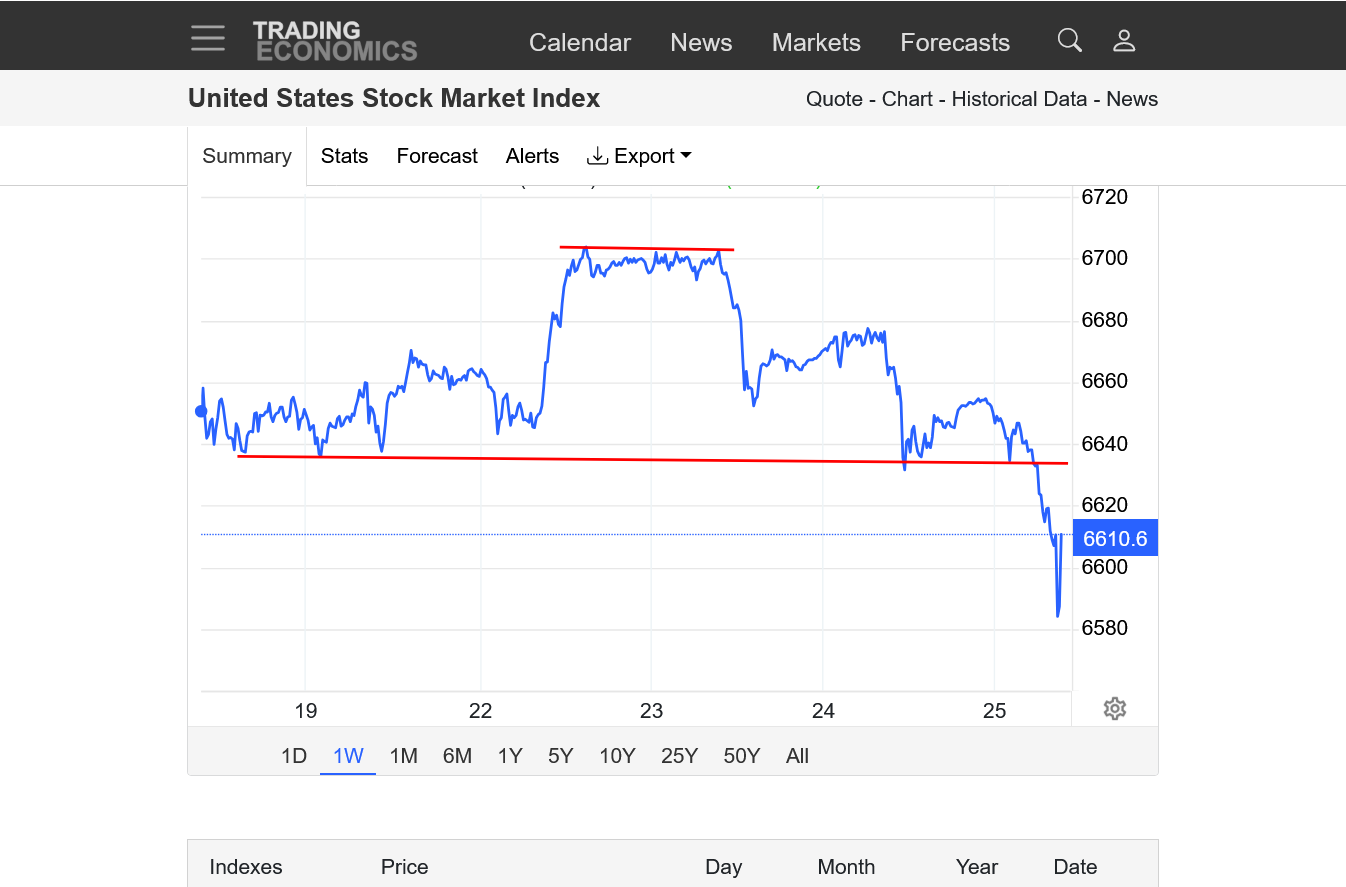
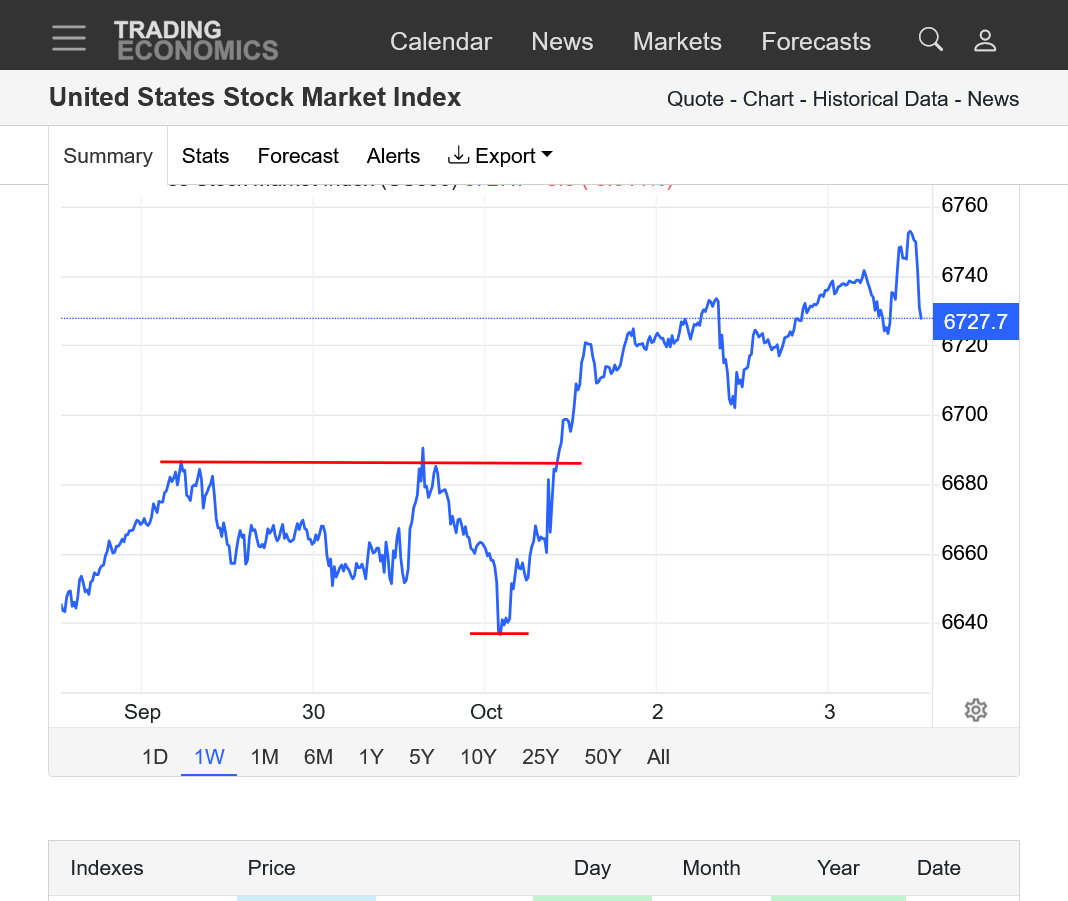
1. 1 week
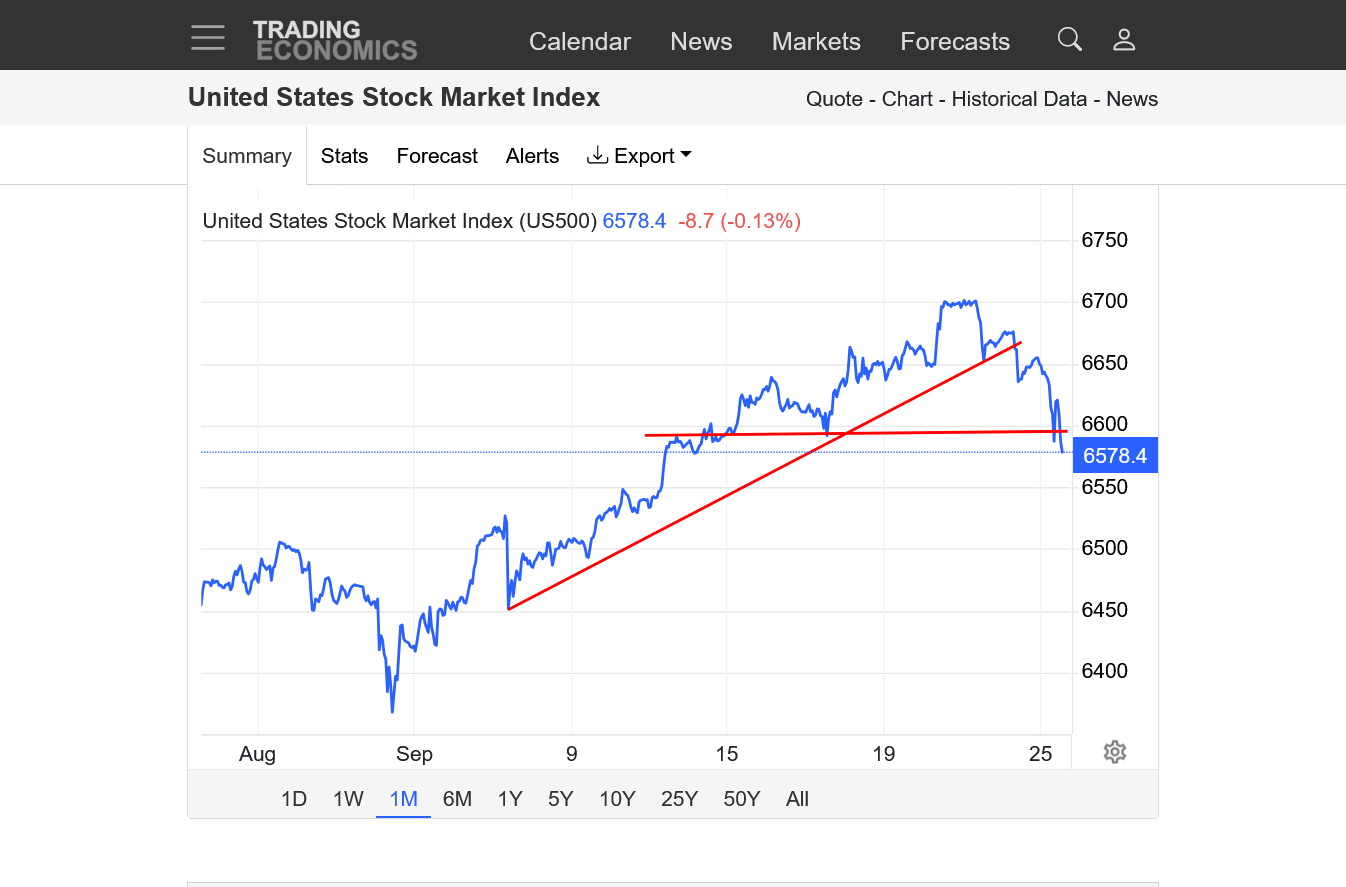
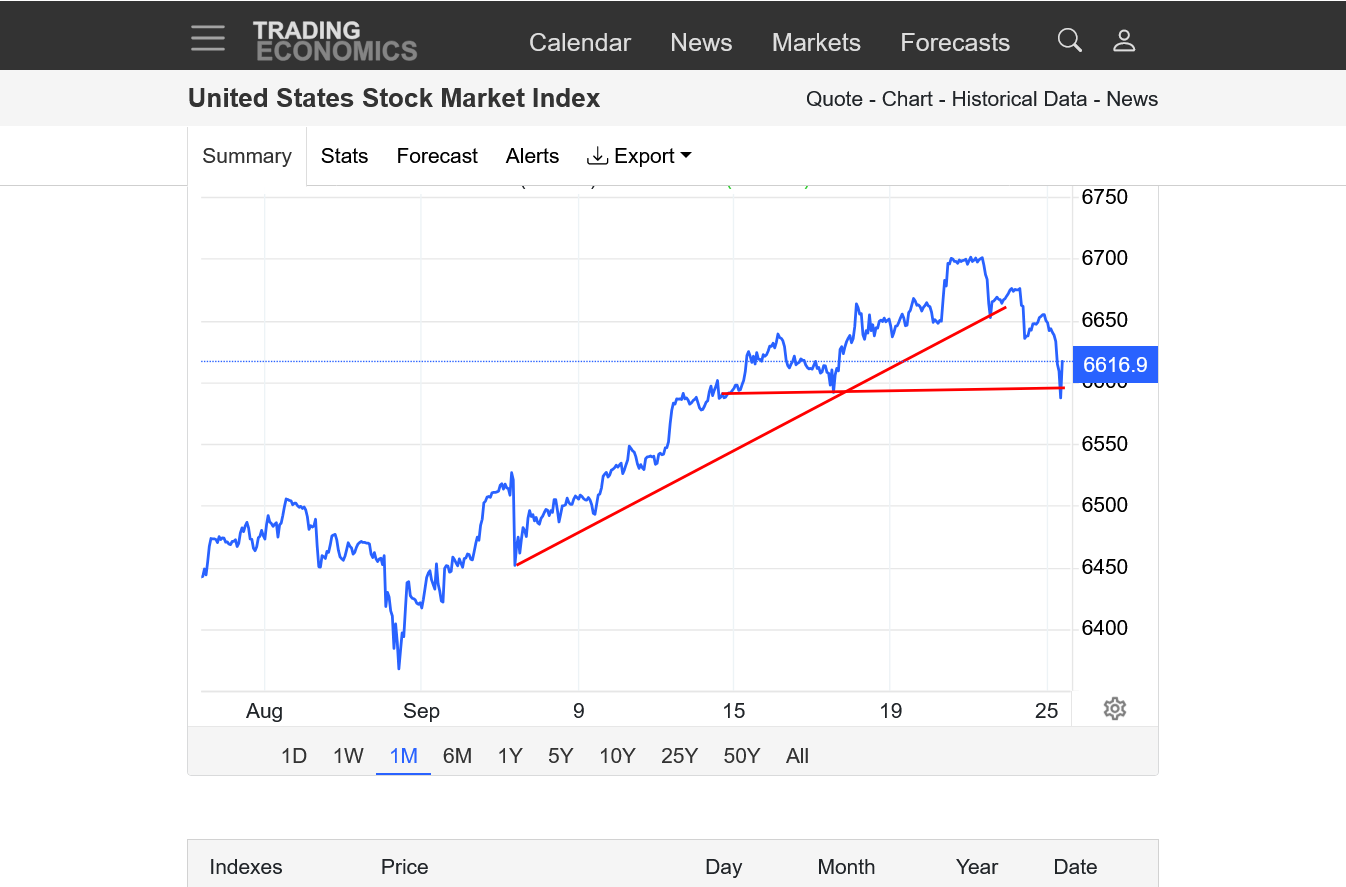
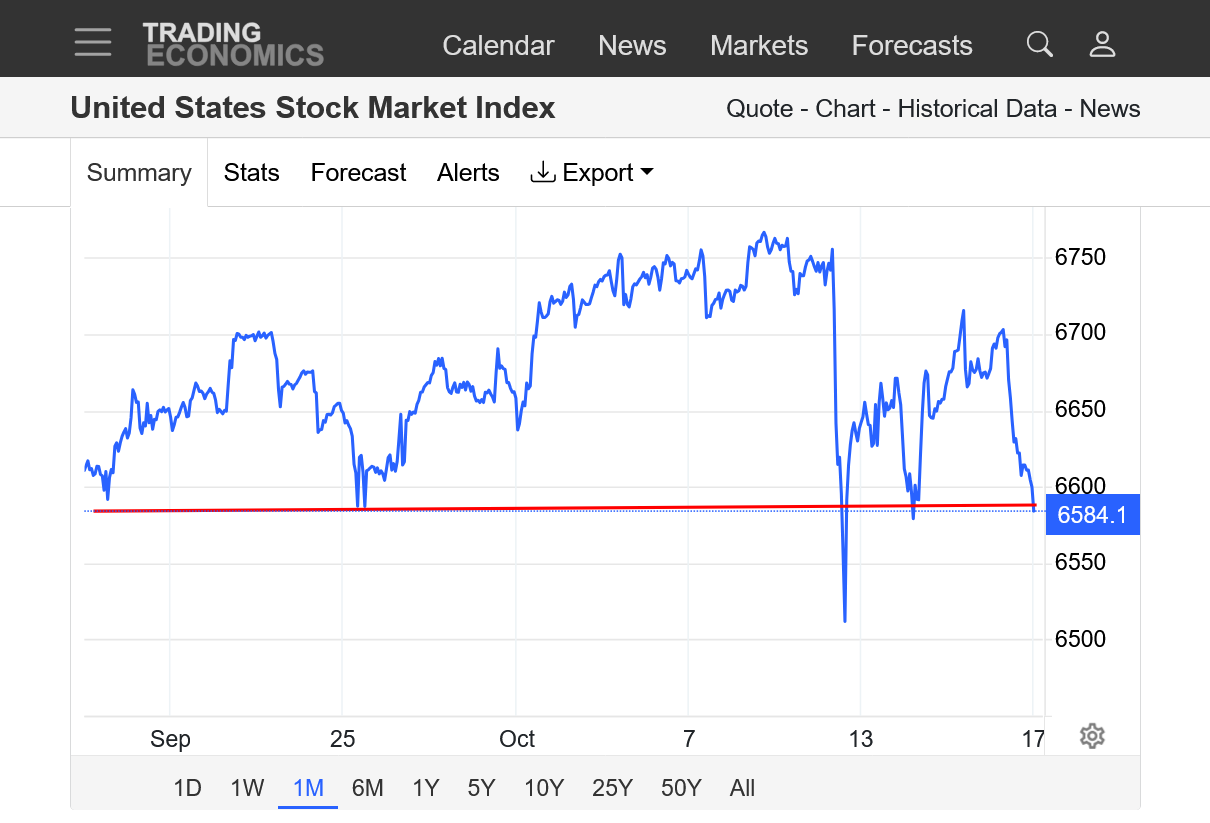
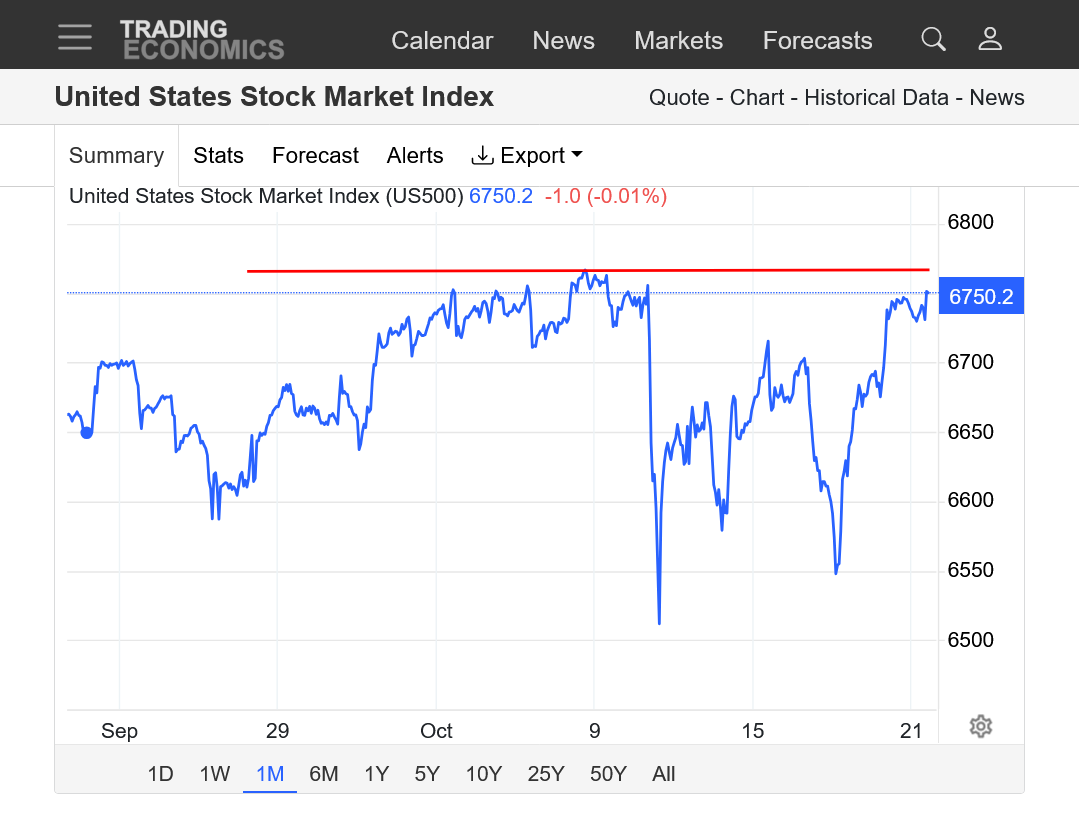
2. 1 month
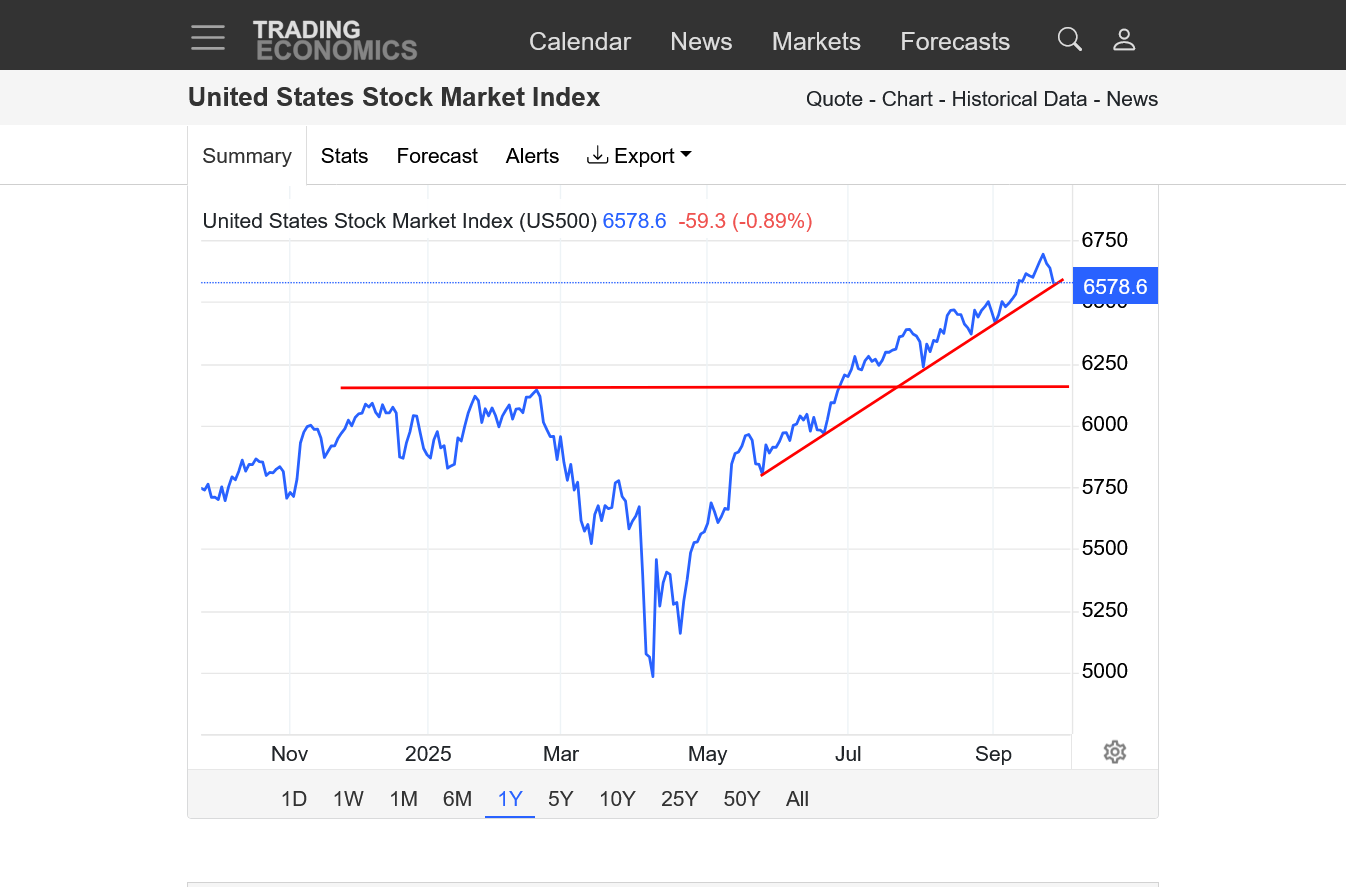
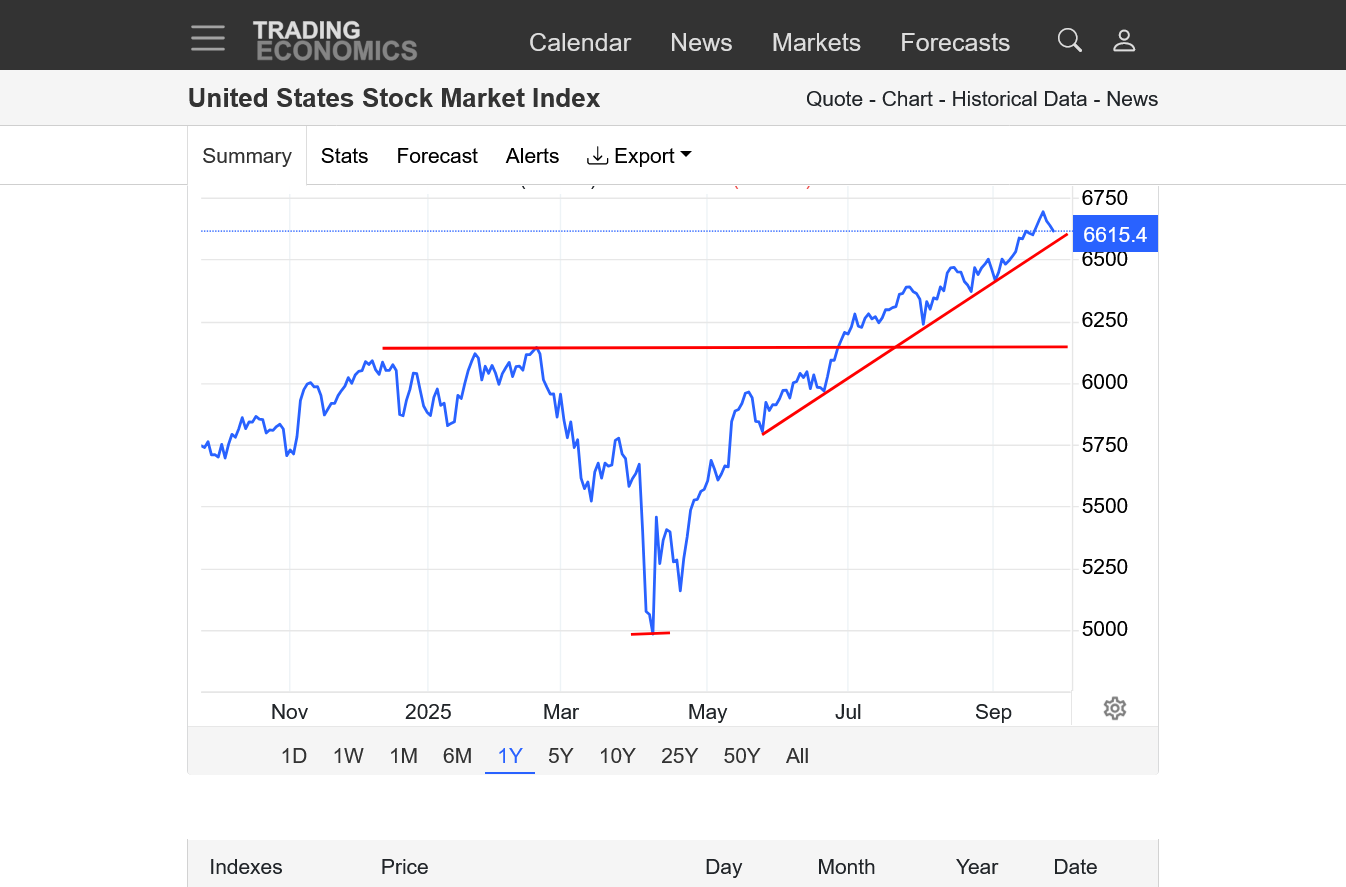
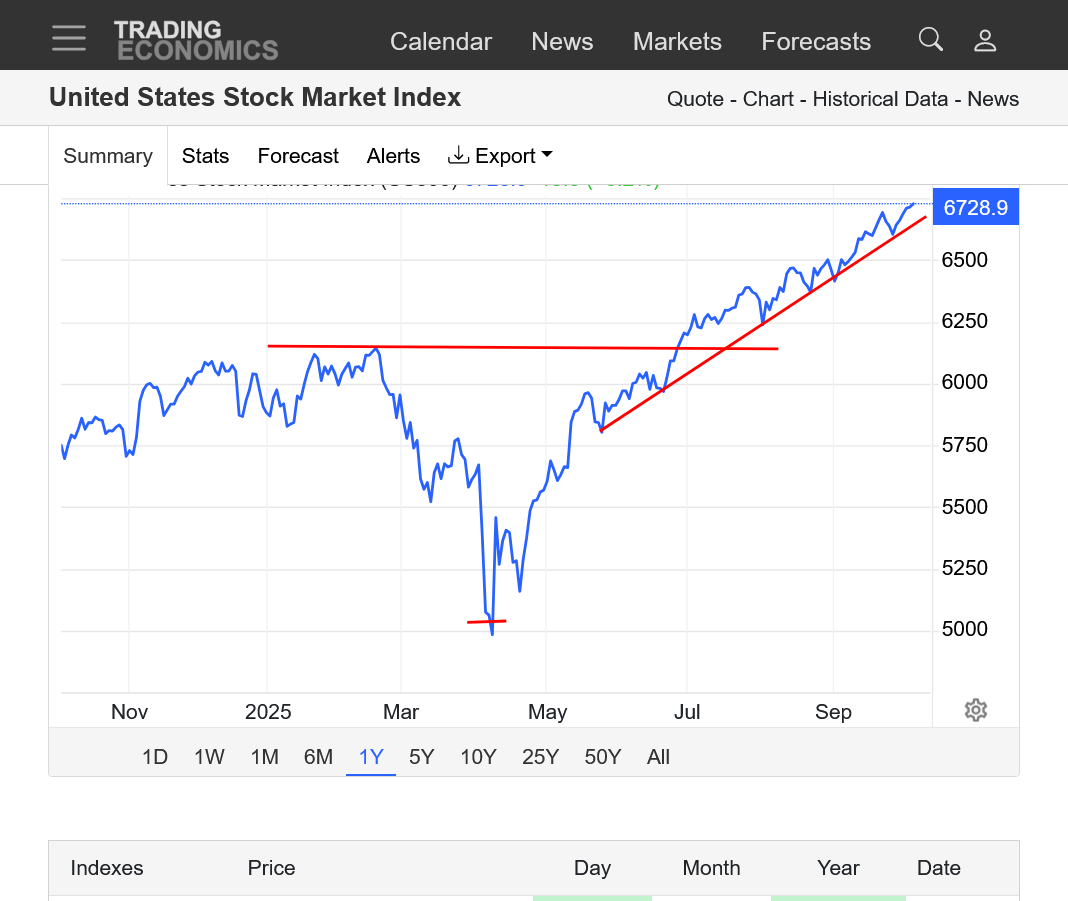
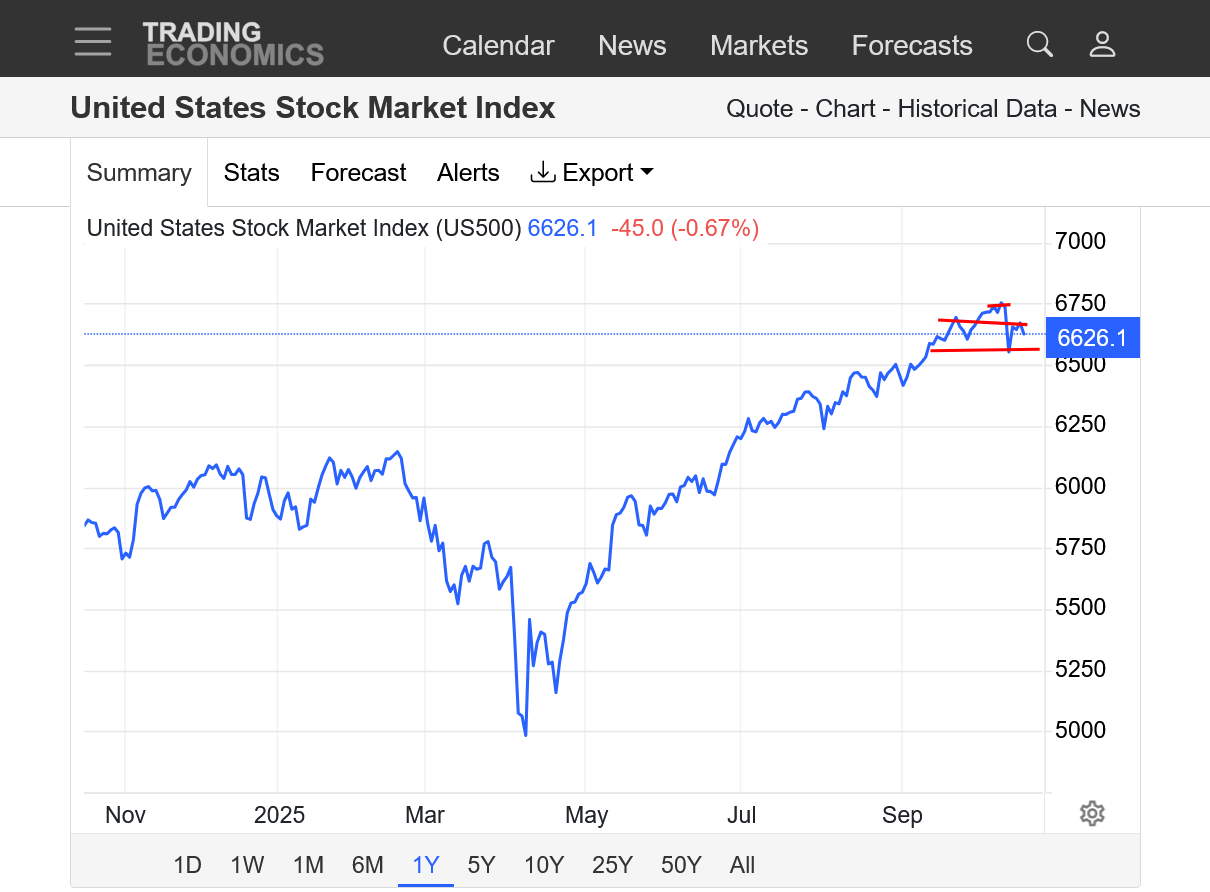
3. 1 year
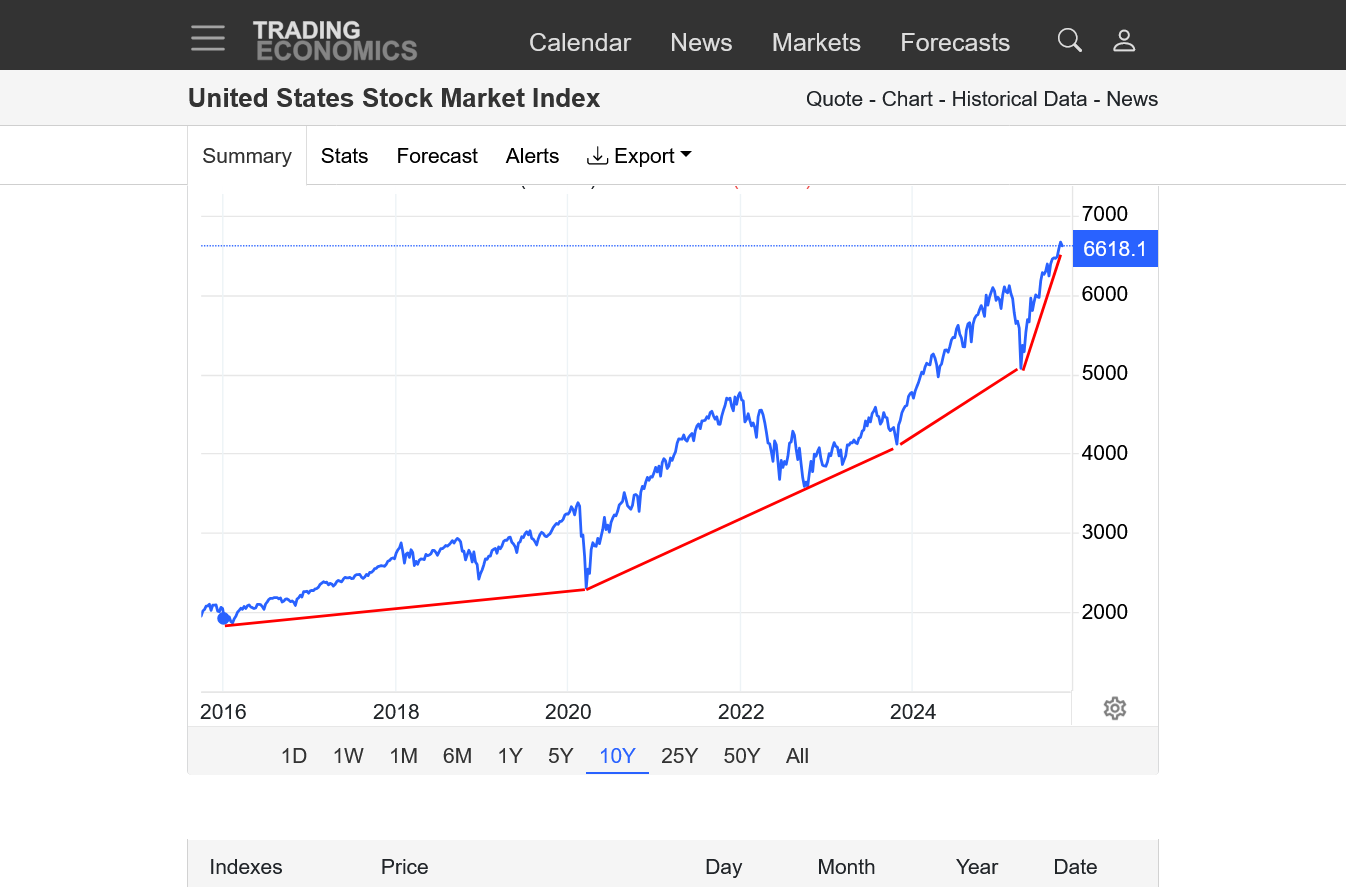
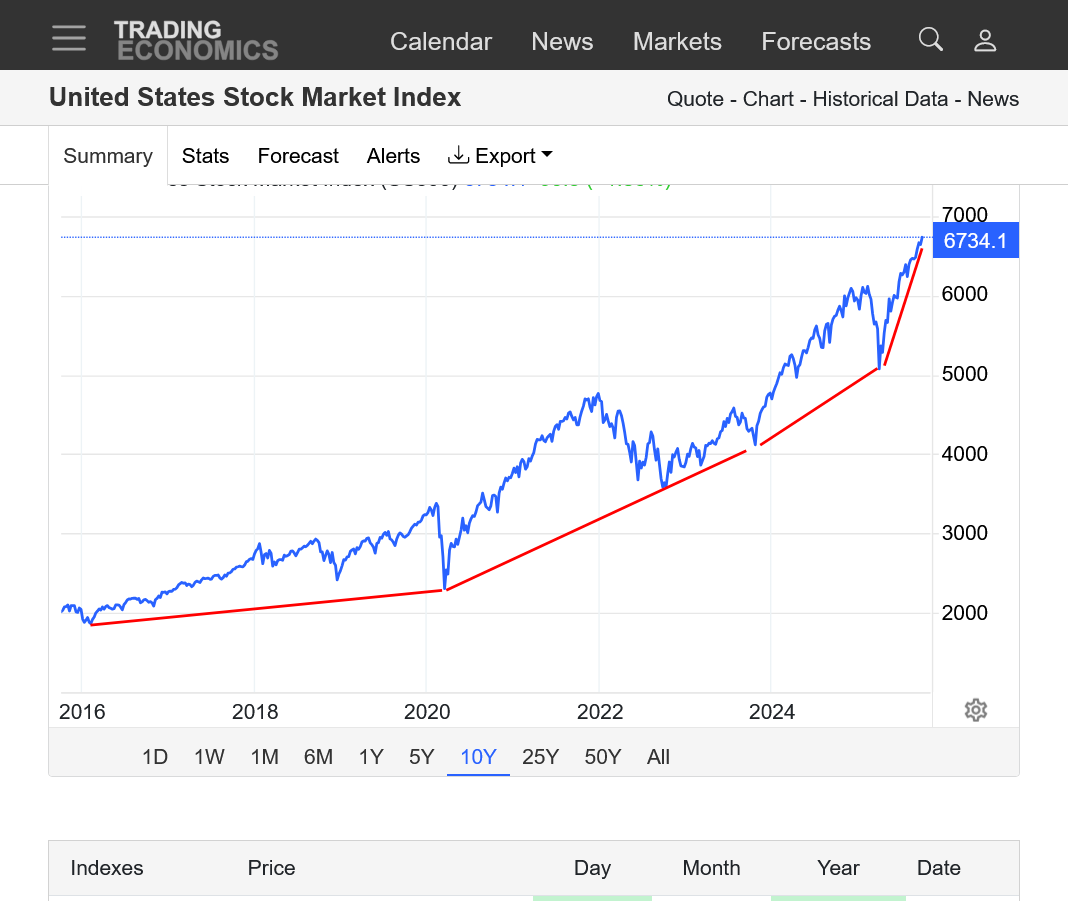
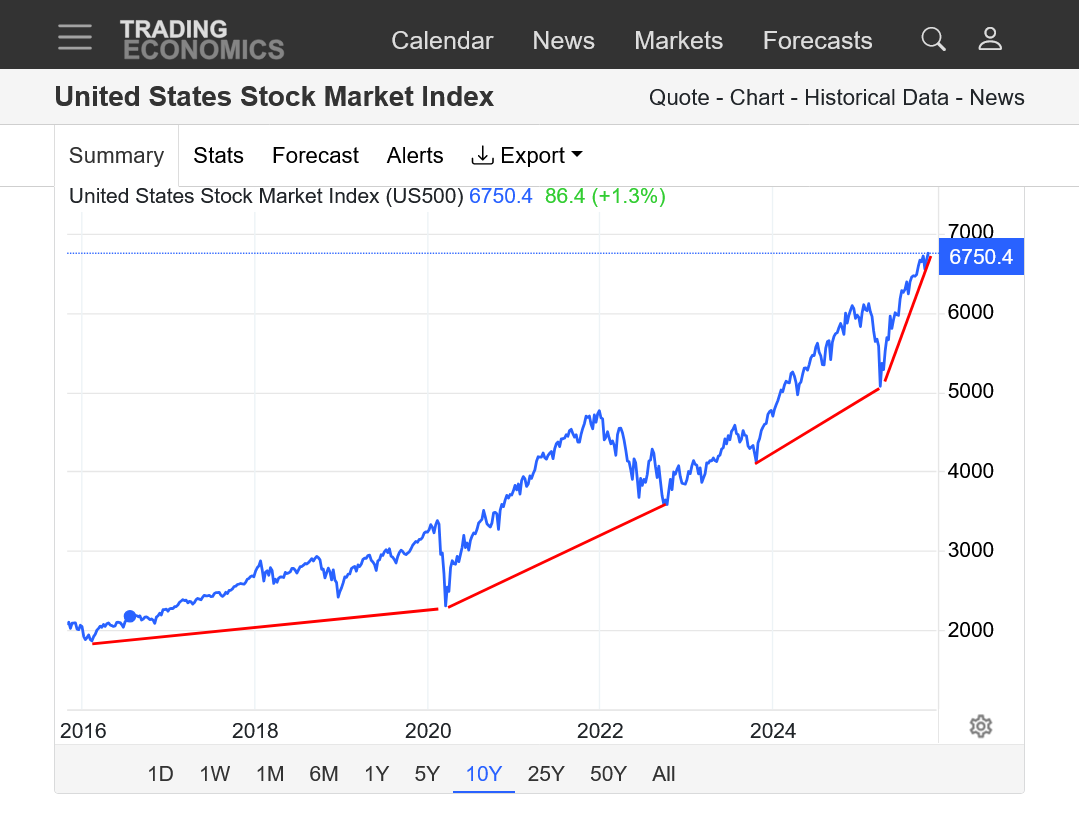
4. 10 years
Interestingly, the stock market has been trading bad economic news as bullish and good economic news as bearish!
By metmike - Sept. 25, 2025, 5:51 p.m.
Published
Sep 25, 2025 at 08:58 AM ED
https://www.newsweek.com/trump-gets-surprise-boost-on-economy-10740222
The Ponzi Scheme for wealthy people hold's on for the umpteenth time!
https://tradingeconomics.com/united-states/stock-market
we may have a top in today ... !
Thanks very much, kris!
We can't keep going higher forever!
The rich people's Ponzi Scheme and self fulfilling prophesy greatly exceeding intrinsic valuations and making records highs on bad economic news, then more record highs on more economic news.......completely detached from anything but the big money traders feeding it and giving each other positive feedback(self fulfilling prophesy) will eventually have to reckon with the world outside of their money.
Parabolic/exponential moves like this never last and are impossible to predict the top. but this could be a buying exhaustion/top, considering the bad news is getting SO bad.
After markets like this top, the extraordinarily over leveraged and unbalanced long positions that fed it on the way up............are high octane fuel for the spike lower collapse.
1. 1 week
2. 1 year
3. 10 years-Parabolic/exponential move higher. Not sustainable
https://tradingeconomics.com/united-states/stock-market
Previous post on the other thread. We can continue the discussion here and appreciate your contributions, kris!
By metmike - Oct. 1, 2025, 3:58 p.m.
Fresh all time highs again today for the wealthy people's Ponzi scheme!
1. News of an economic slow down and weak economy and lost jobs = record highs
2. News of excessive inflation = record highs
3. News of additional ruinous tariffs with no rhyme or reason in setting them =record highs.
4. News of a government shutdown = record highs
5. Increasingly unhinged, lunatic rants from a pathologically thinking and acting president that completely makes up and imagines the world he describes = record highs
6. Record highs in the stock market =Trump's positive reinforcement message that the wealthy people want him to keep doing exactly what he's doing and in fact, double and triple down on it.
++++++++++++++++
https://tradingeconomics.com/united-states/stock-market
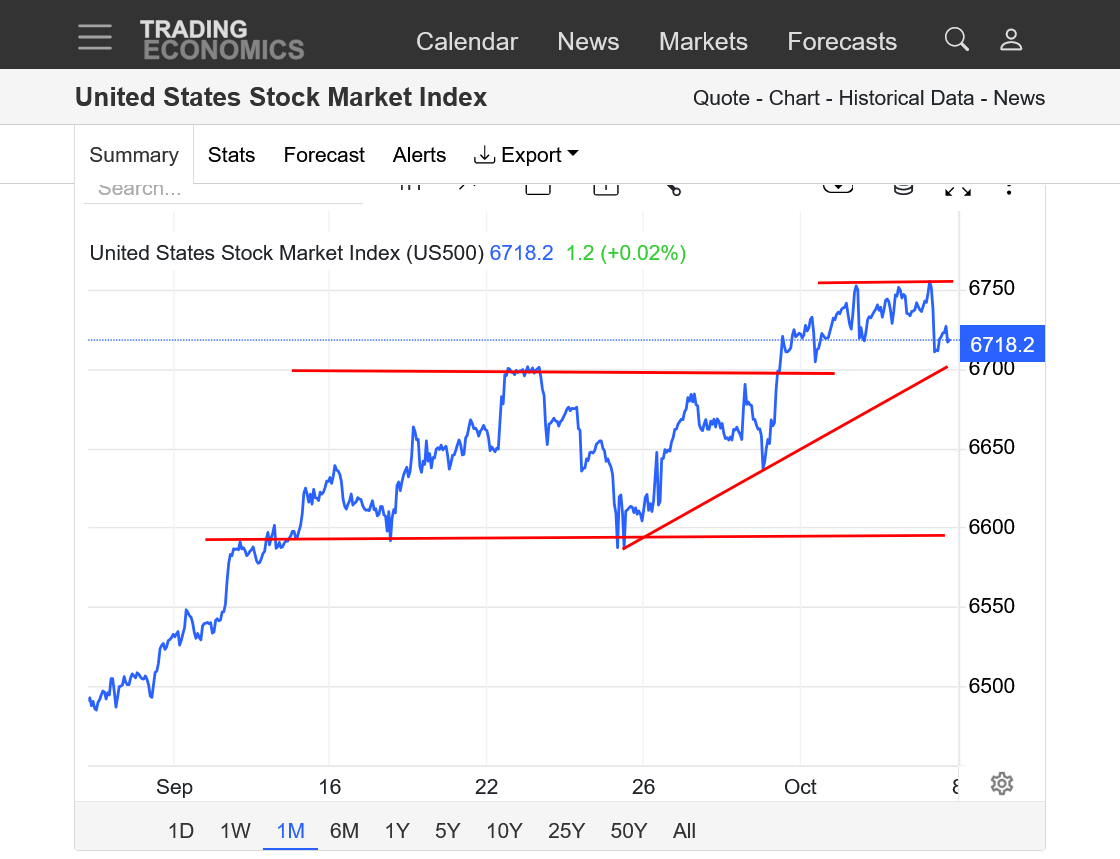
1. 1 month. New highs today
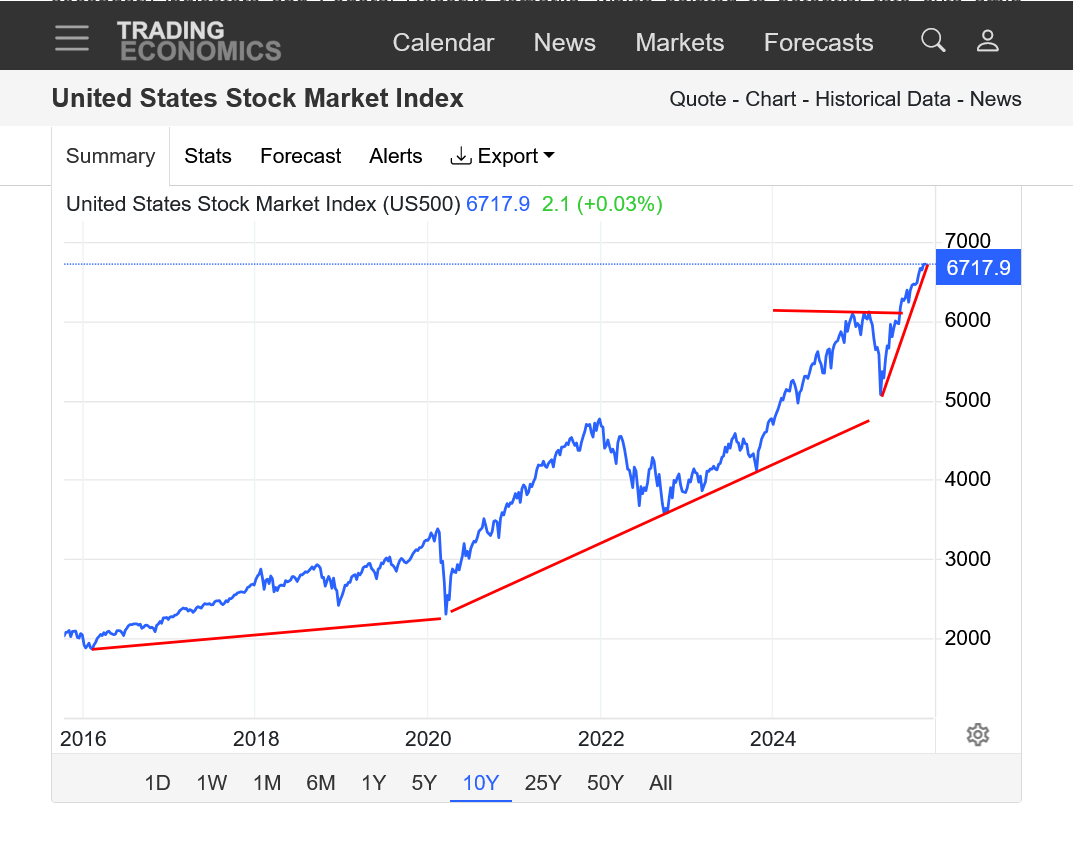
2. 10 years. Parabolic/exponential move higher with an increasingly steep uptrend slope line. Completely detached from intrinsic valuations. Money flows are dumping in from rich people based on the principle of a "self fulfilling prophesy".
https://philonotes.com/2024/12/robert-k-mertons-theory-of-the-self-fulfilling-prophecy
++++++++++++++=
+++++
The Stock Market Is Disconnected From Reality.
+++++++++++
Re: Re: Re: Re: : Micro Nasdaq
By metmike - Oct. 2, 2025, 11:41 a.m.
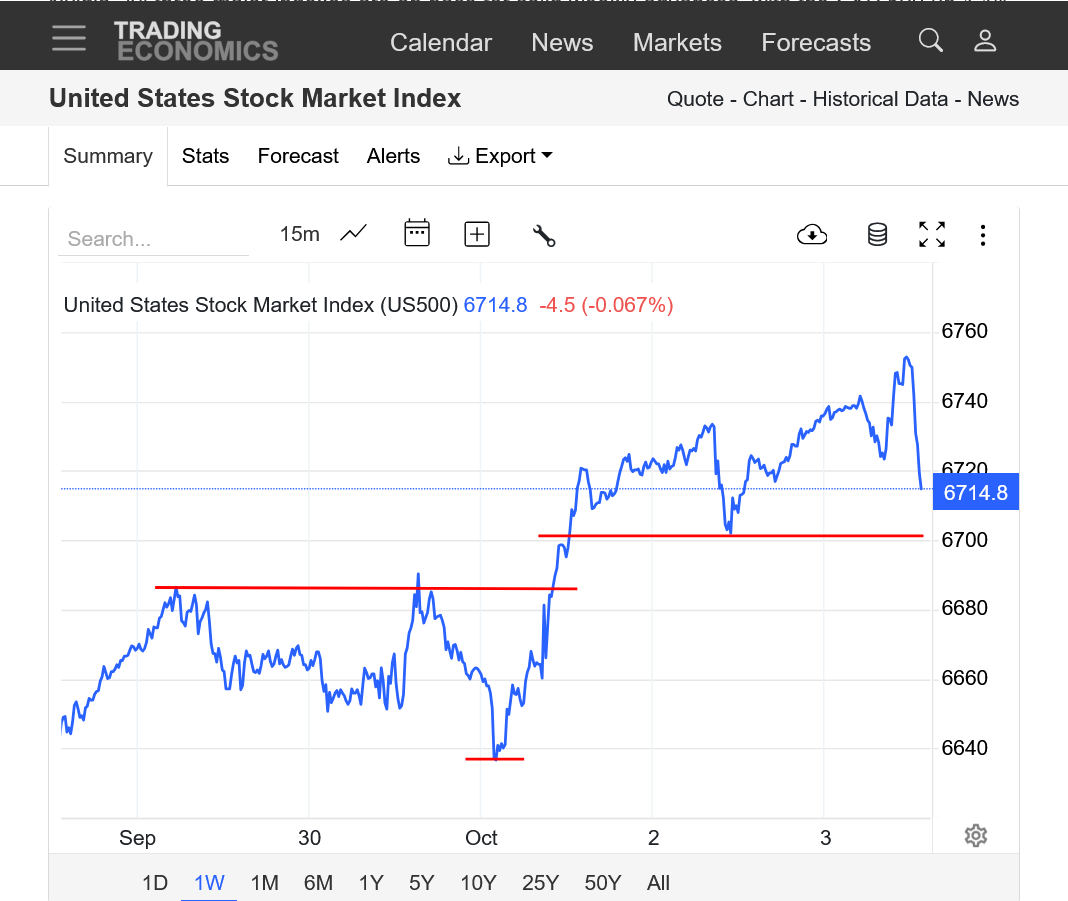
A close below any of these red lines would be especially bad with today's reversal lower from record highs! It would set us up for a GAP LOWER open on Sunday Night which would be a powerful top signature!
Today may be a high for a while, textbook performance on the part of the markets ....
Thanks, kris!
Keep us posted. Almost everything tells us this market should have topped previously and it should have topped again on Friday. We'll see if the market FINALLY runs out of huge traders that will buy no matter what.
No top yet. Buyers stepped in again before we even tested any sort of support.
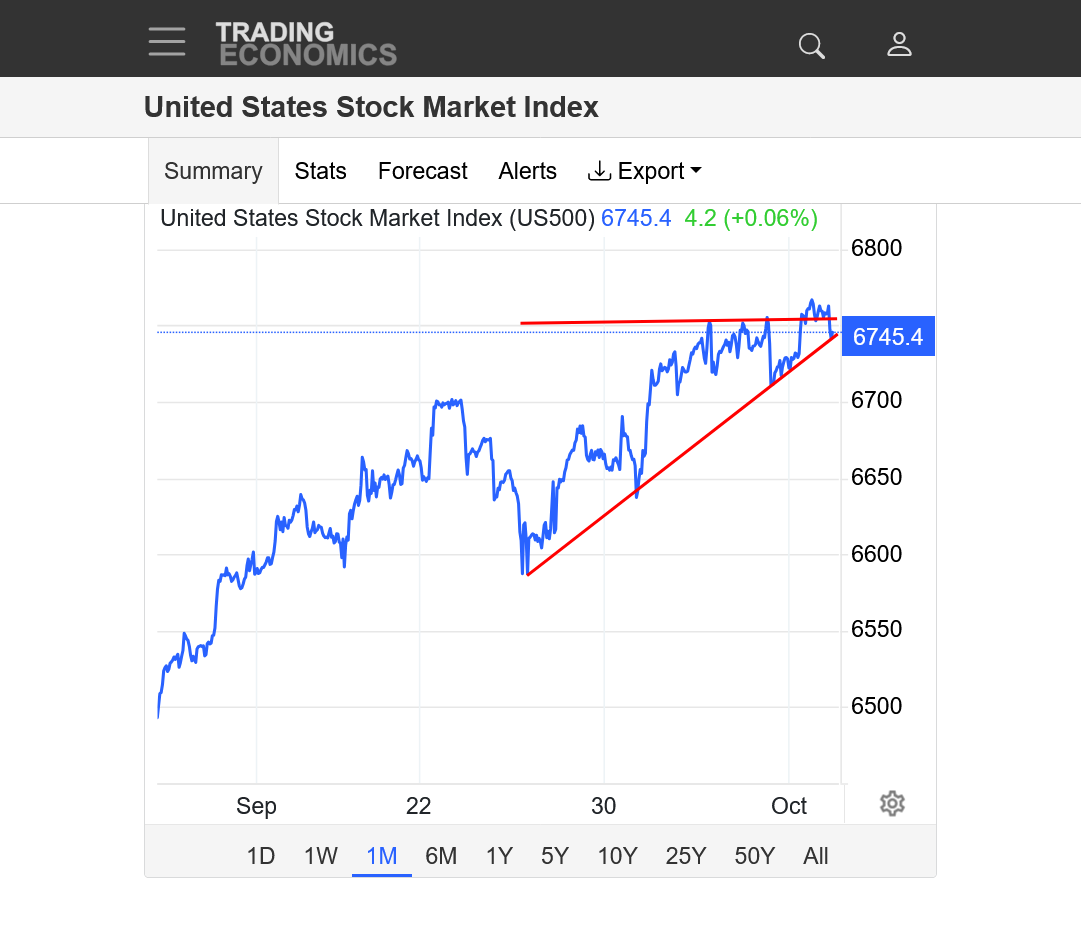
https://tradingeconomics.com/united-states/stock-market
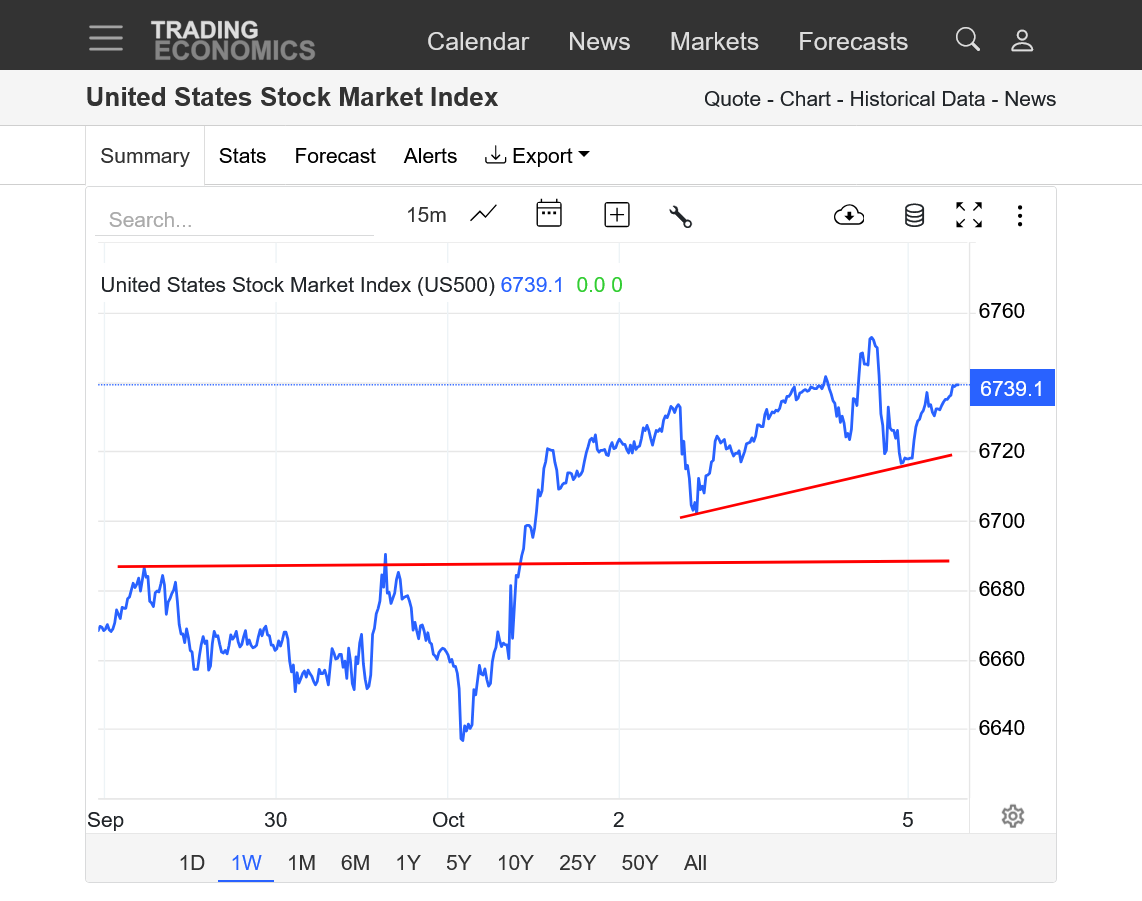
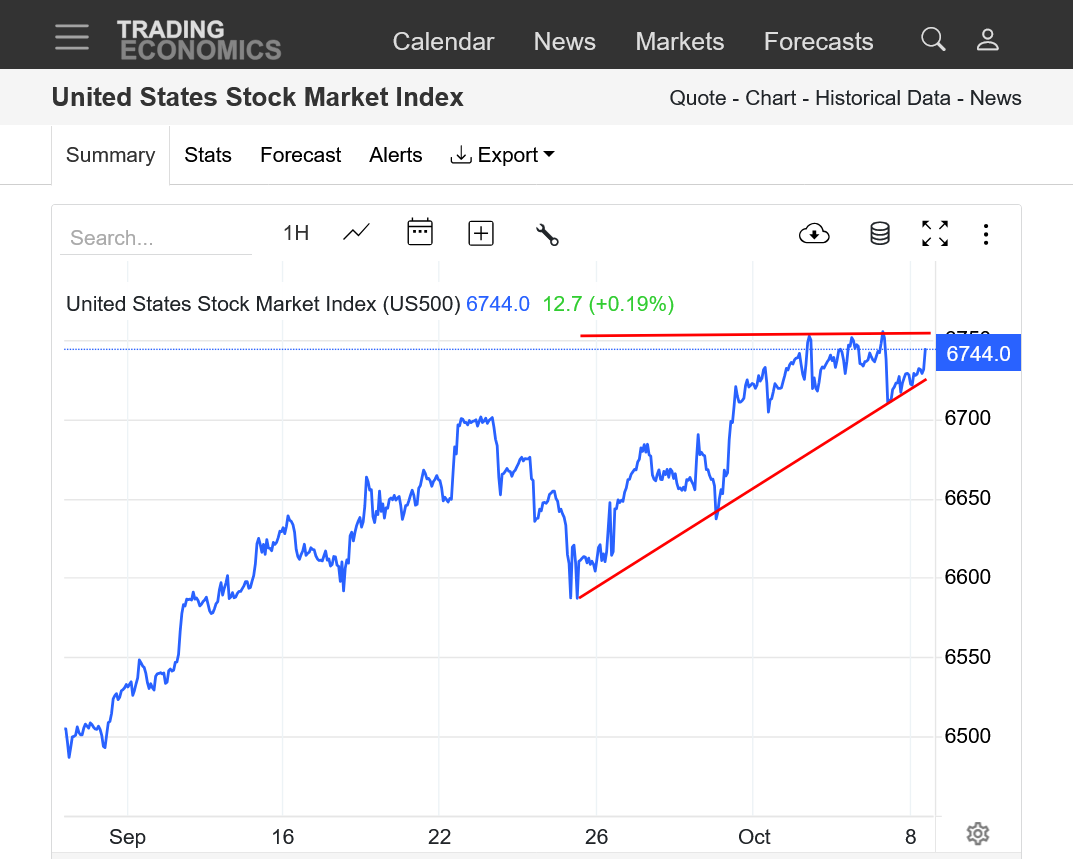
Ascending wedge/triangle formation now. This is a continuation pattern verified when we break the top line, which would be new all time highs.
Failing here would obviously be a double top.
I'm not predicting that or trading this market, just having fun analyzing price charts for this mind boggling market that is completely dominated by the self fulfilling prophesy of wealthy traders in a realm that trades what it wants to trade and ignores numerous realities that mattered in the past..........and may have to eventually reconcile with when the disparities between intrinsic valuations and speculative valuations become too great to maintain.
https://tradingeconomics.com/united-states/stock-market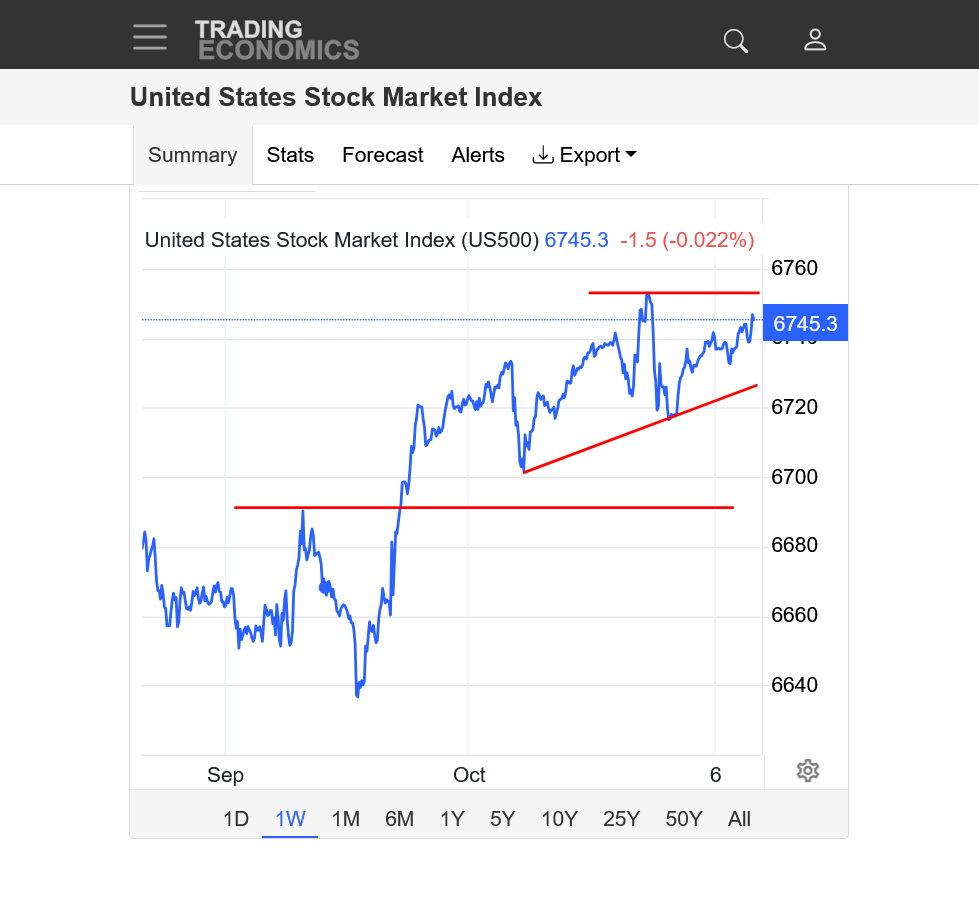
+++++++++++++++++++++
1pm CDT:
Final answer: the tops are in ..... ???!!!
Thanks, kris!
Keep us posted. Here's some lines of support and resistance to consider.
I have nothing to add.
1. 1 month
2. 10 years
https://tradingeconomics.com/united-states/stock-market
I would not want to be short The NASDAQ . There is absolutely nothing on a daily chart to indicate any type of pull back. It is above the 20 day average, above rising trend line,
as for the economy, what is wrong with these numbers?
United States Stock Market Index - Quote - Chart - Historical Data - News | Trading Economics
| Related | Last | Previous | Unit | Reference |
|---|---|---|---|---|
| United States Inflation Rate | 2.90 | 2.70 | percent | Aug 2025 |
| United States Fed Funds Interest Rate | 4.25 | 4.50 | percent | Sep 2025 |
| United States Unemployment Rate | 4.30 | 4.20 | percent | Aug 2025 |
Thanks, cutworm!
Looks like there are enough people that don't want to be short, like you stated to help minimize the selling pressure needed to offset the buying.........so we are unable to go lower in spite of top formation/momentum loss signals.
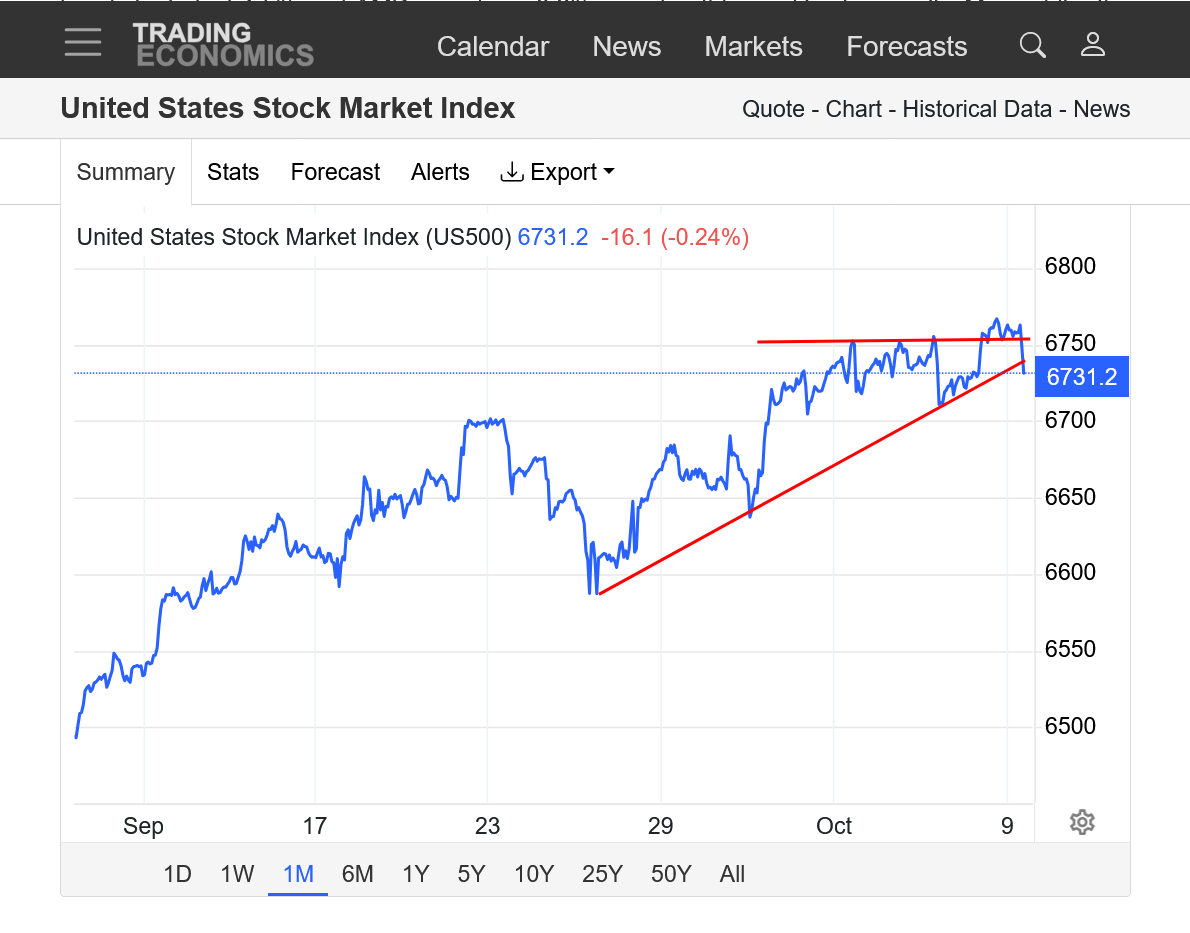
The ascending wedge/triangle chart formation mentioned earlier in the week is still valid. It can go 1 of 2 ways.
1. Prices breaking the top and confirmation of this continuation of the trend pattern formation.
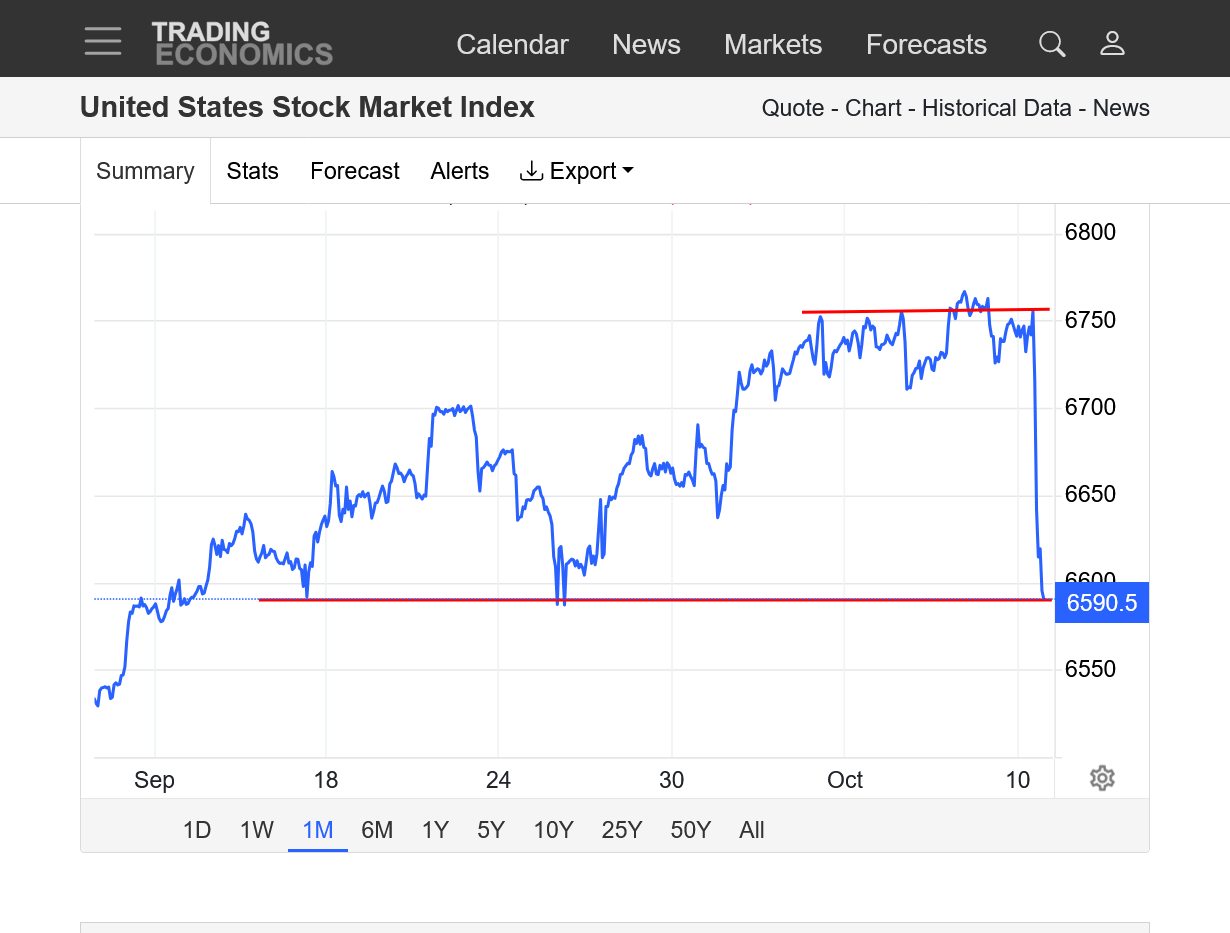
2. Breaking the bottom decisively. Top is in, POSSIBLY if we close below 6600.
https://tradingeconomics.com/united-states/stock-market
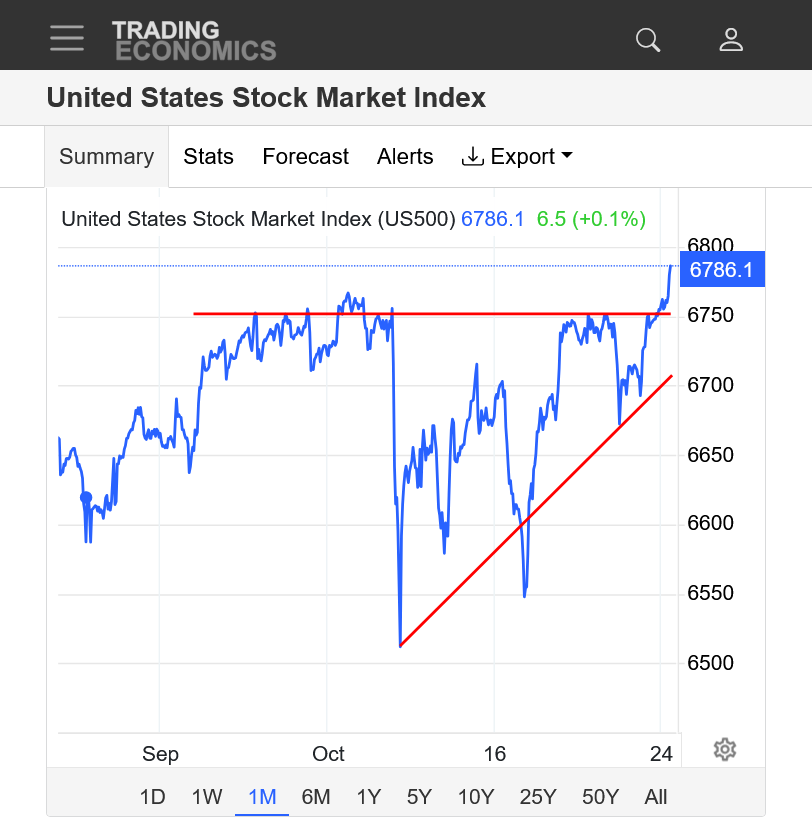
OK, NOW it looks like a potential top!!!!
We had a fake upside break out of the ascending wedge/triangle earlier today BUT NO FOLLOW THRU after the new all time highs and have reversed lower below that uptrend of the wedge/triangle.
The DOWNSIDE break out is confirmed with a solid close below 6600........and it could get ugly after that.
However, this energizer bunny market may still have more rich people that margin out/leverage even more of their speculative money to keep their self fulfilling prophesy going. That's the only thing that has been keeping it from collapsing.
https://tradingeconomics.com/united-states/stock-market
Has anybody else read this book?
I got it when it first came out almost 3 decades ago and the stock market at this moment reminds me of one of the trading signals that Linda Raschke suggested using.
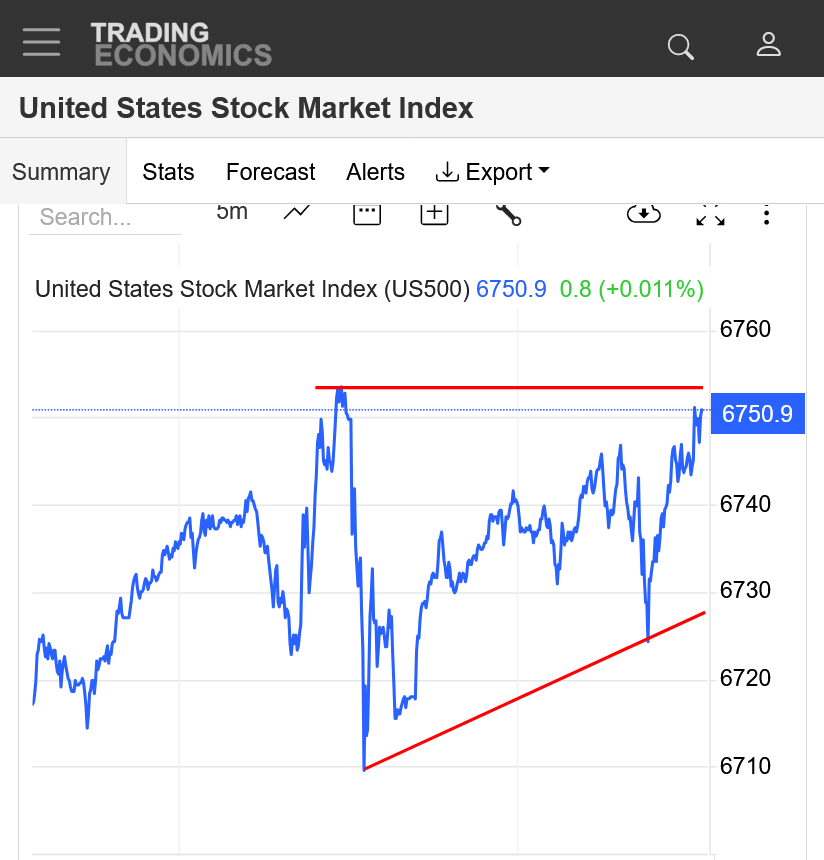
When a market breaks out to a new high but then trades BELOW that previous high with no follow thru because the buying has been exhausted, SELL THE MARKET and put a buy stop above the new record high set earlier that day.
I've watched the markets and seen that trade work many times.
The nicest thing about it is the well defined, low risk and potentially very high rewards to this trade. I don't trade stocks but selling right now with a stop above the highs earlier today would be the position outlined above from Linda!
I am not recommending that, just having fun with the analysis of this market as it trades with unprecedented craziness.
On further analysis, we could be holding the uptrend line based on the market generating some buying at that support level.
https://tradingeconomics.com/united-states/stock-market
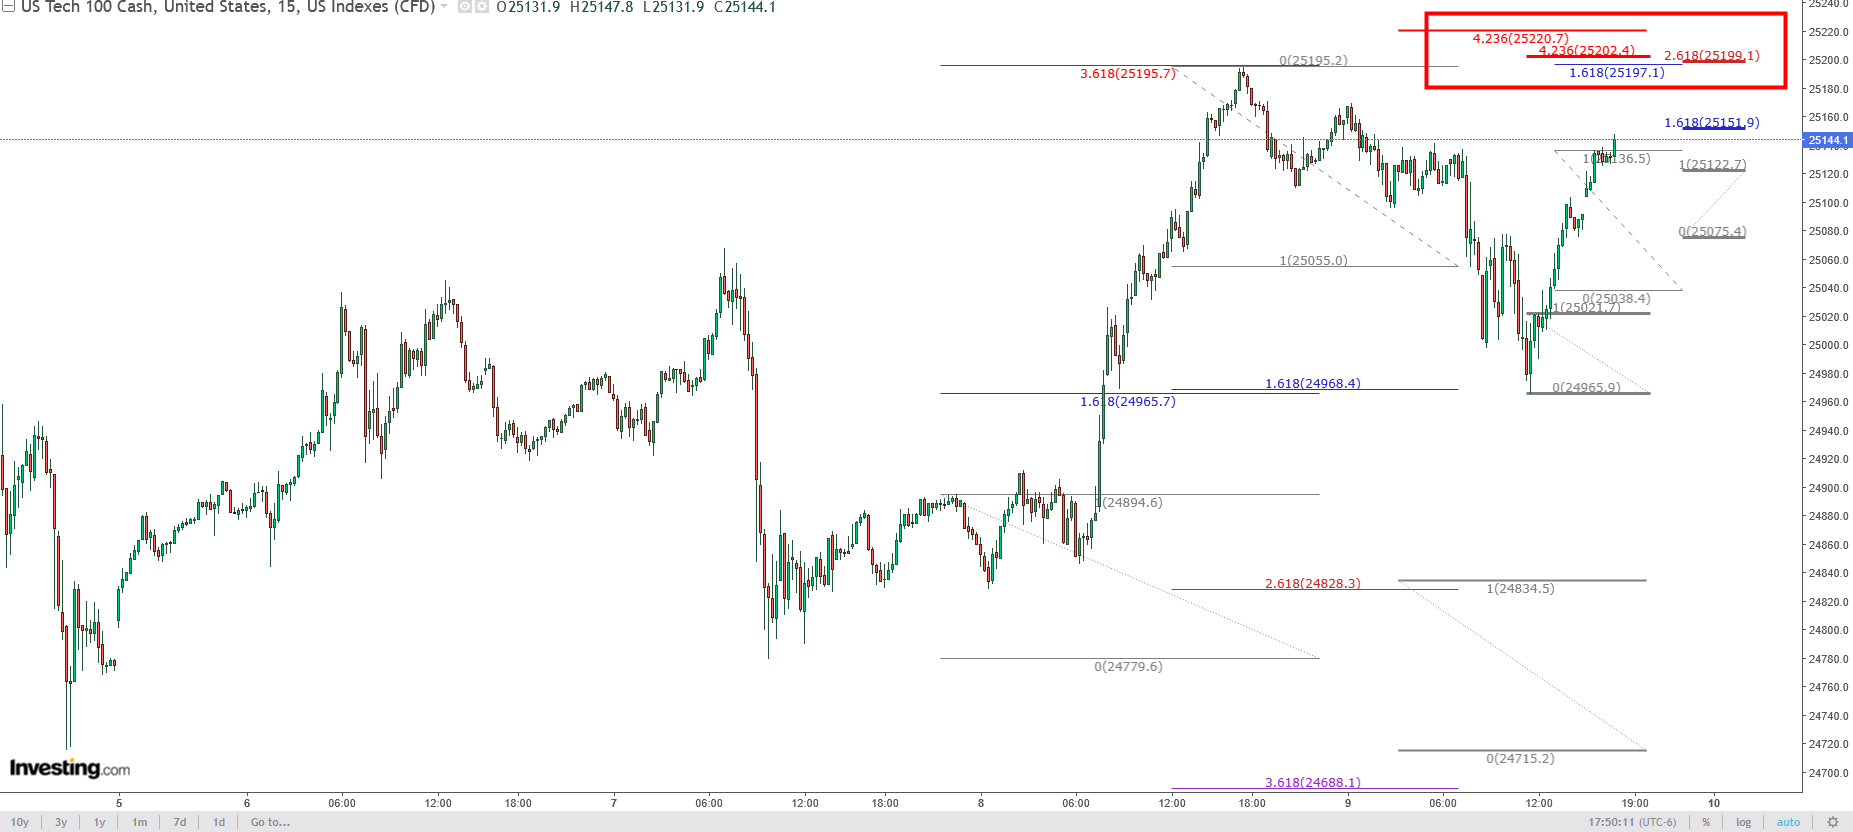
The above chart shows an area of interest (to me) slightly above today's high.
The DJI is cooked ...
The DJT is cooked ...
The NQ is usually the last one to put in a top ...
Markets like round numbers ....
An NQ high in the 25200 area will not surprise me ...
Trade safe everyone !!!
Thanks very much, Kris!
Based on most similar situations in the past, I would sure think the stock market is cooked.
I don't trade this particular market like you but don't ever remember the continuing move up to record highs on bad news and more bad news about the economy and so much chaos.
Gold making insane new highs actually makes more sense to me.
I don't trade gold either (mainly grains and ng/ho) but following it, silver and the stock market with chart analysis is fun and challenging............and doesn't cost any money!
The way i trade a
1 large outside day that closes lower,
2especially if it gaped higher then closed lower,
3 is a new high or at resistance
in a bull market
is to put a sell stop1 tick below the low of the day, stoploss if filled at 1 tick above the high
this has worked several times for me but sometimes it does not get filled.
this is NOT a trade recommendation
cutworm,
This sounds like a smart method to trade. Thanks for sharing it.
https://tradingeconomics.com/united-states/stock-market
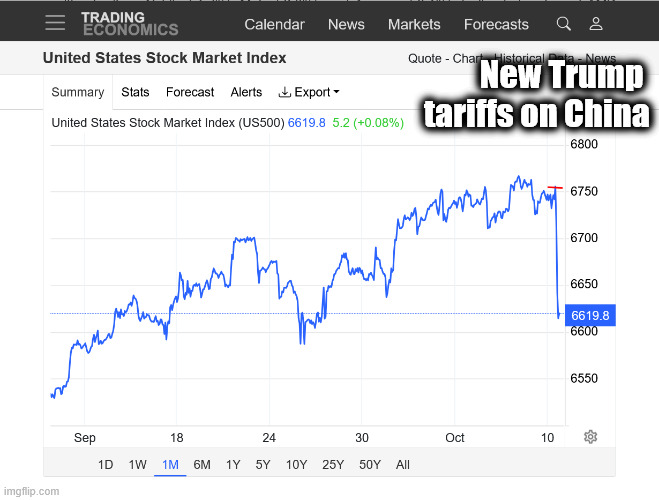
Global stocks pummeled on Trump China tariff threat
Reversal comes after equity indices hit a series of new records in recent weeks
https://www.ft.com/content/b9ae2417-2e89-4b0a-bad5-d94f4e980ecc
Even today's high in the NQ will hold for a while, today is just the start ...
Thanks, kris!
A gap lower to start next week would look especially ominous as it would be a downside break away gap after a powerful reversal down the previous day.
A gap at that spot in time would be a daily, weekly and monthly(Oct) gap lower.
It's still possible for us to hold here, for instance if Trump announces a deal with China that undoes all his damage. Or if Zelensky announces an agreement with Putin on ending the war.........but those items seem unlikely. '
I would be more concerned that Trump could announce something else to make it WORSE for the stock market.
https://tradingeconomics.com/united-states/stock-market
Three weeks of gains wiped out in a single day, October is going to be a bad month for the financials, long trades in this new environment would not last long imho because this is a rare paradigm shift.
Trade well my friends !
Thanks kris!
Great call the past 2+ weeks!
The last couple of hours after the main close were about as bad as possible.
It will take a miracle to recover from this next week!
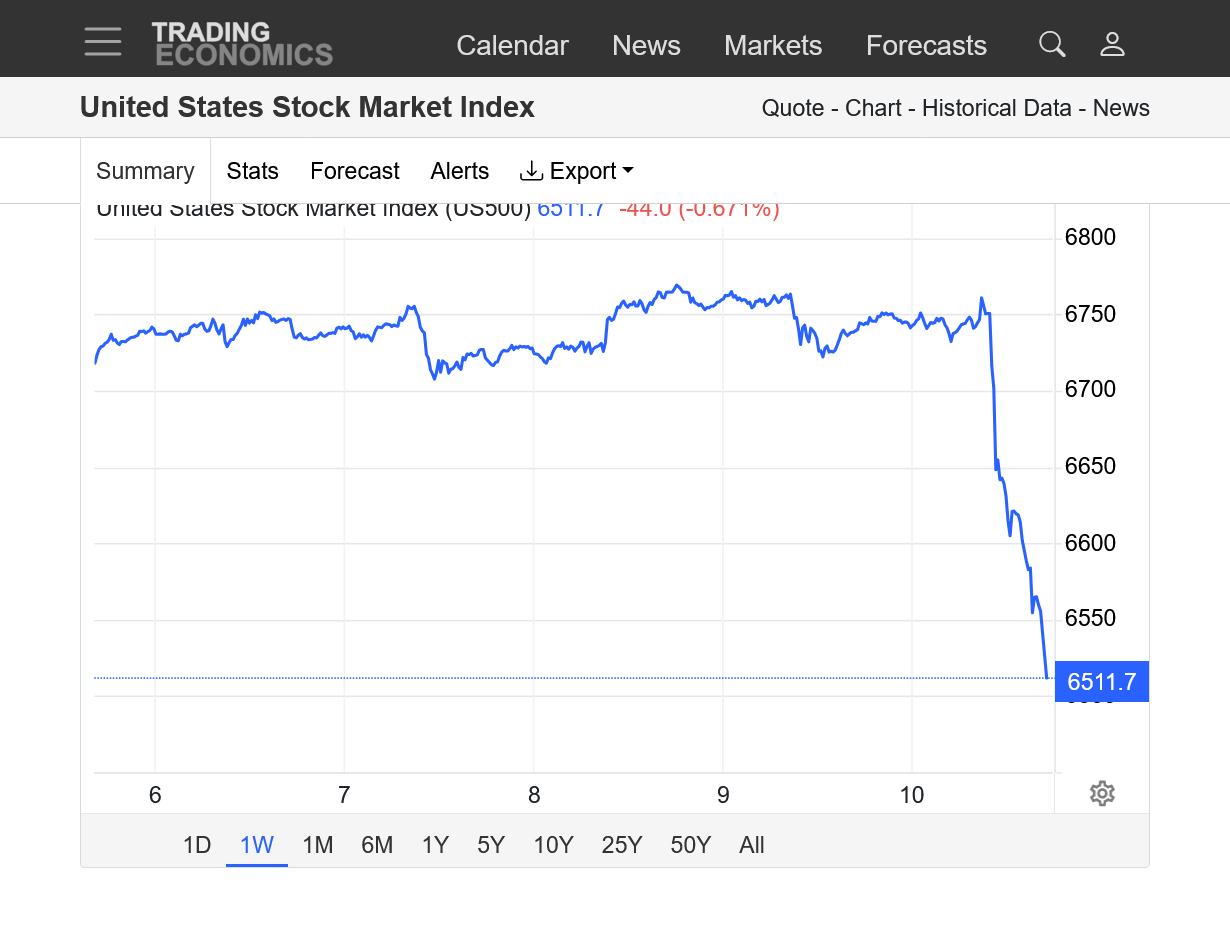
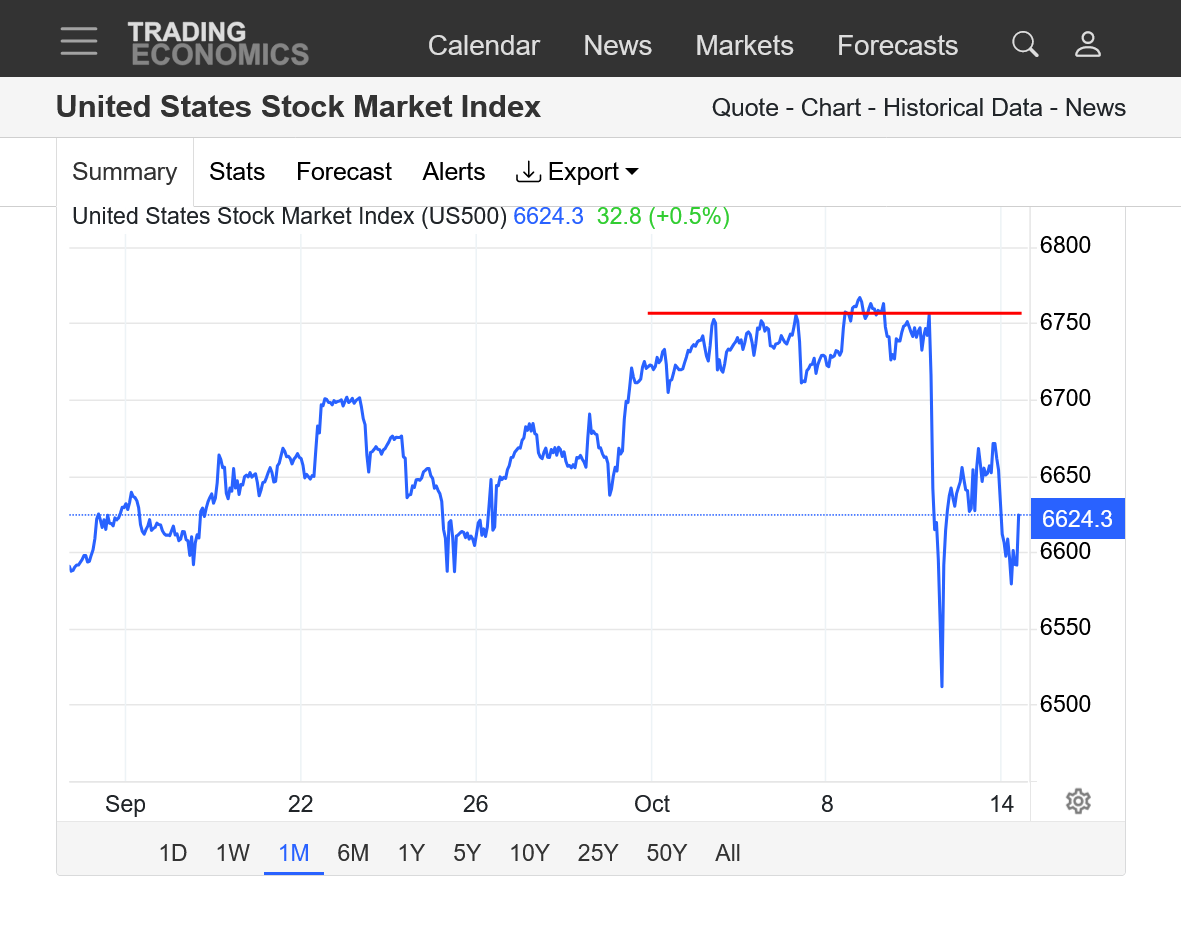
1. 1 week. WOW! Collapse this morning, immediately after more bad news on tariffs as this was FINALLY the bad news straw that broke the camels back. However, the market was struggling and vulnerable for the last 2 weeks(with numerous technical red flags) as kris has been recognizing with his posts.
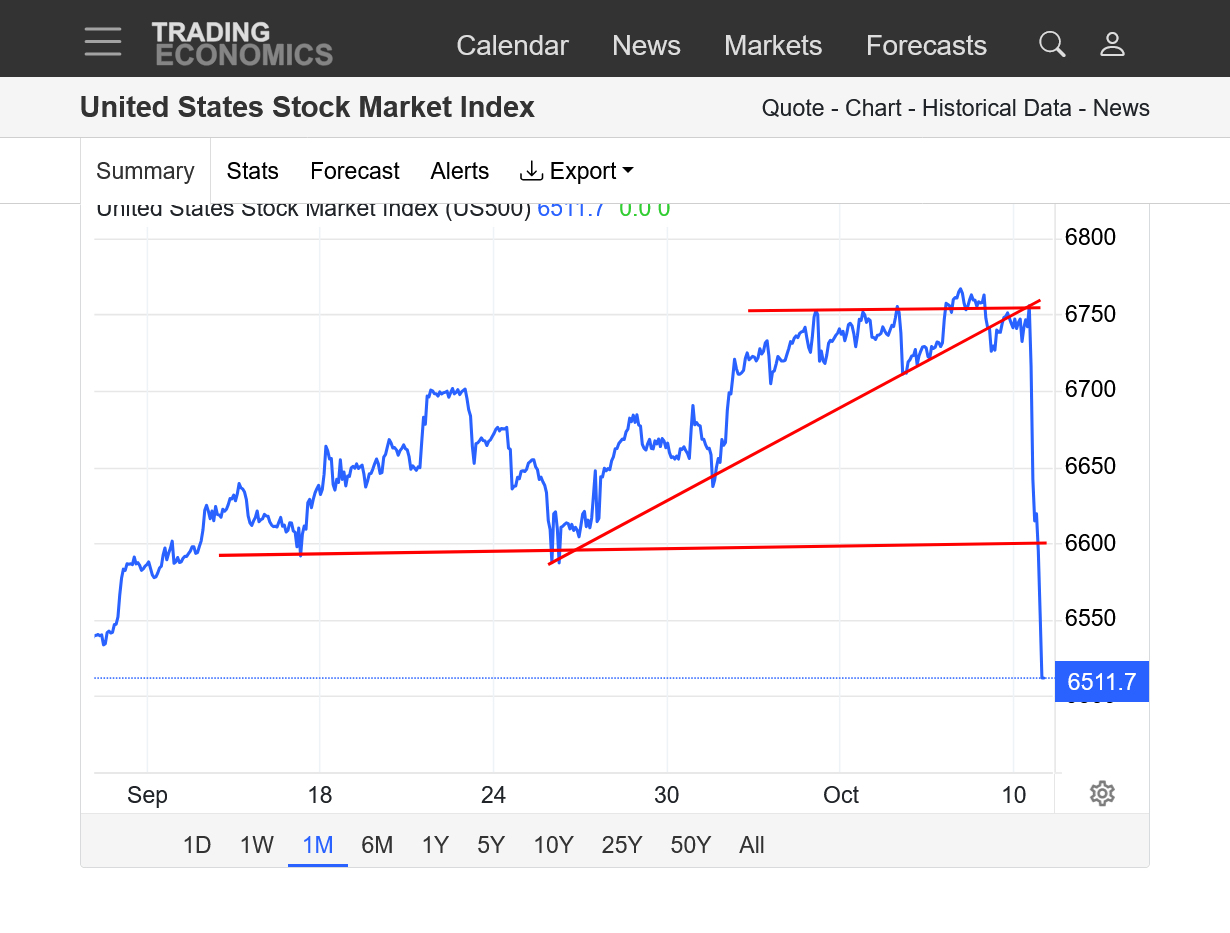
2. 1 month: After barely making new highs yesterday with the false upside break out, generating a Linda Raschke sell signal when the market traded below the old highs (and a buy stop above the new fresh highs-that never got hit so that short trade would have a massive profit right now).
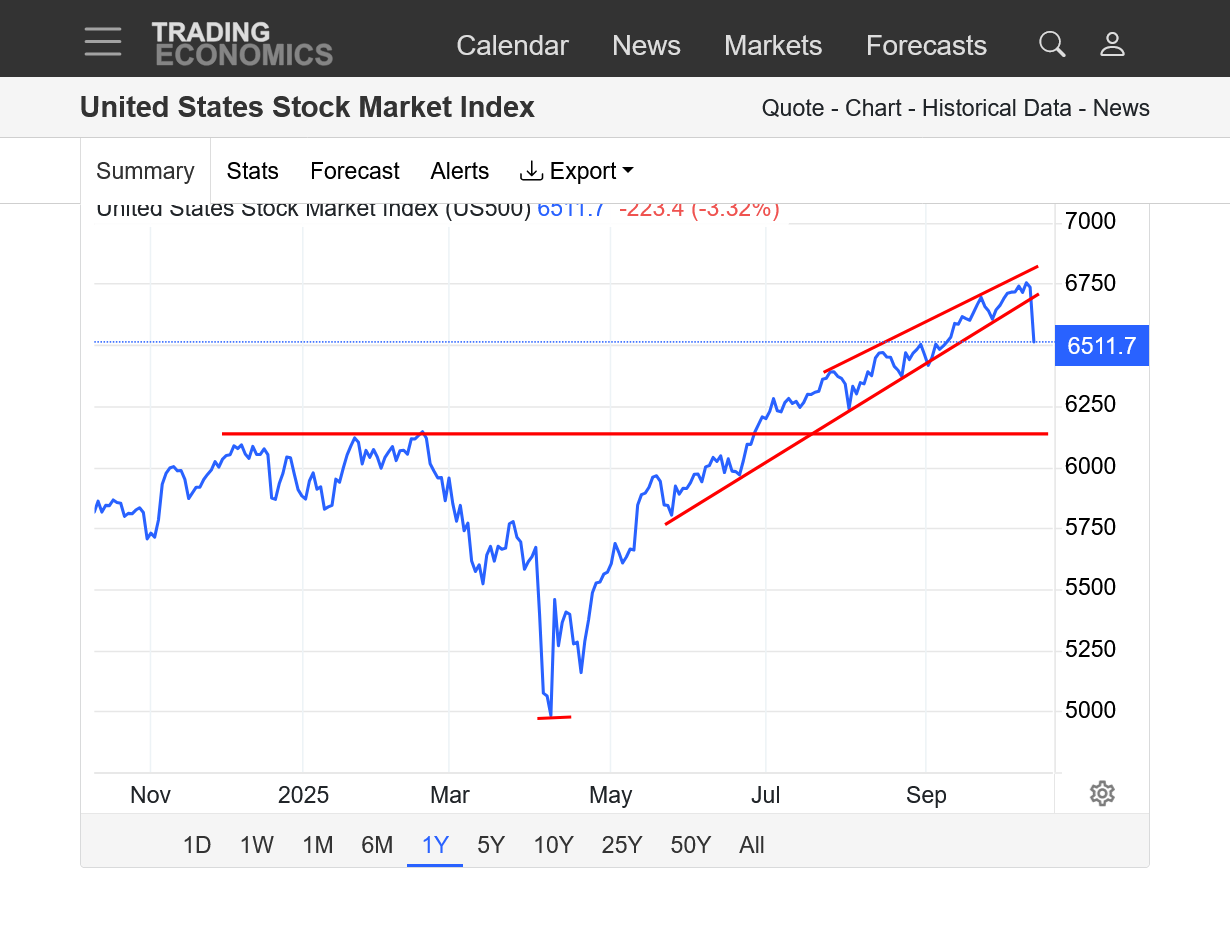
3. 1 year: Steep up channel decisively broken. Previous record high from early this year is the first red line. 2nd one is the spike low from Trump's tariffs at the start of April.
https://tradingeconomics.com/united-states/stock-market
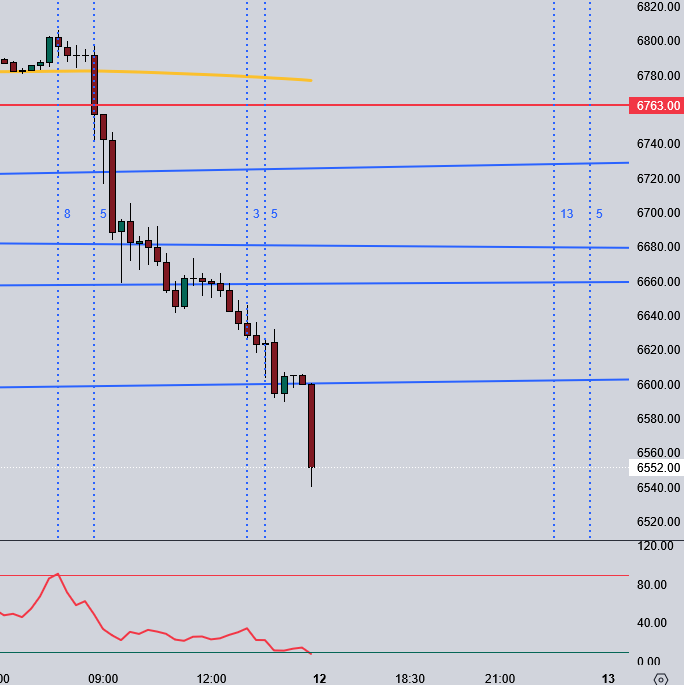
To your point Mike : "The last couple of hours after the main close were about as bad as possible"
In the last 15 minutes of trading we dropped roughly 50 points = total capitulation !
Well I was getting ready to post asking for thoughts on tonight's open...and then I remembered we are closed tomorrow! Oh well. I check back in tomorrow evening. ;)
Thanks, buck!
Actually we still have electronic trading.
I was going to mention over the weekend that that spike down from Trump's tariffs announcement on Friday could take a similar path to his initial announcement on April 2nd, so called "Liberation Day".
That was an extreme spike low followed by a surge to more and more new highs. The strong move up early tonight is surprising but maybe there is news I don't know about since I've been working outside all day.
I think kris is right though about this market being toast.
Ask me about grains and natural gas during a weather market and my thoughts about market direction should be considered more as a trader. Regardless, the stock market and metals are fascinating right now.
Well I guess I am really messed up! I was just thinking gov holiday and markets would be closed. I guess I should pay a little more attention!
This is why the stock indices are sharply up:
Donald Trump
@realDonaldTrump • ![]() Truth Social
Truth Social
Don’t worry about China, it will all be fine! Highly respected President Xi just had a bad moment. He doesn’t want Depression for his country, and neither do I. The U.S.A. wants to help China, not hurt it!!! President DJT
Thanks very much, Larry!
That would explain it alright.
More evidence that one of Donald Trump's key indicators is the rich people's Ponzi Scheme (stock market).
5am: And that Trump is a dementia mess with extreme emotions and impulsiveness driving many of his decisions that flip, then flop based on whims of the day or even hour.
The president of China has him by the balls and he can't manage it properly because the bully has more than met his match.
Looks like we recovered around 50% of the steep losses suffered on Friday.
The news may determine where we go next.
For instance, if the government shutdown is suddenly resolved or Trump and China agree to a solid deal, it not inconceivable that we could spike thru the old highs.
On the other hand, bad news (though being shrugged off most of the time recently) could take us below Friday's late day close.
https://tradingeconomics.com/united-states/stock-market
See the above chart, this could have been the max rebound, time will tell !
Point of inflection reached after hours, trade safe everybody and be aware of the volatility we have now !
Thanks, kris!
It appears as if you might be right. Trump's attempt to save the stock market on Sunday with uncharacteristic, nice comments about China, got it to around a 2/3rds retracement of the spike lower on Friday.
https://tradingeconomics.com/united-states/stock-market
Back higher again today!
The stock market refuses to stay down!
https://tradingeconomics.com/united-states/stock-market
https://tradingeconomics.com/united-states/stock-market
Potential head and shoulders top signature/formation!
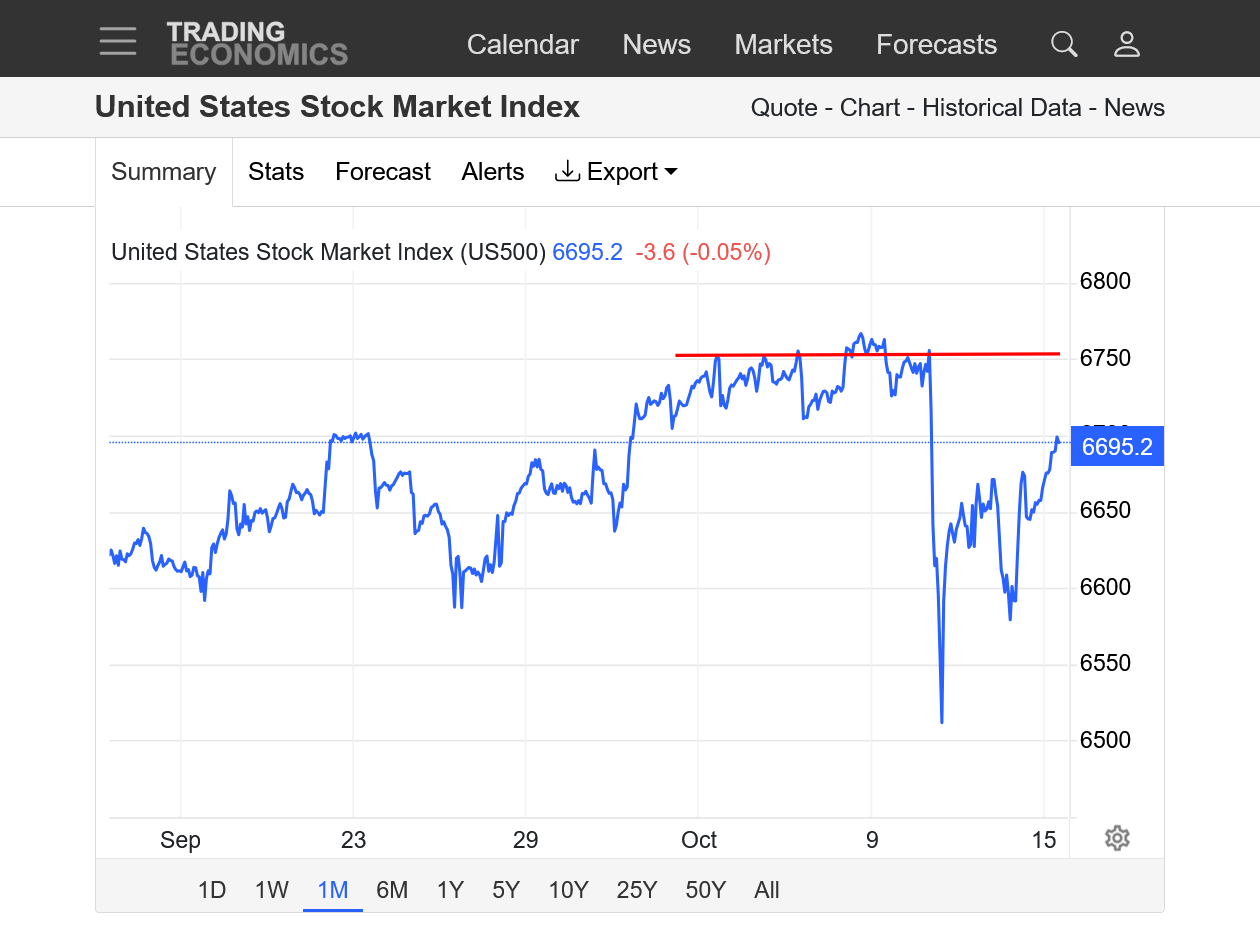
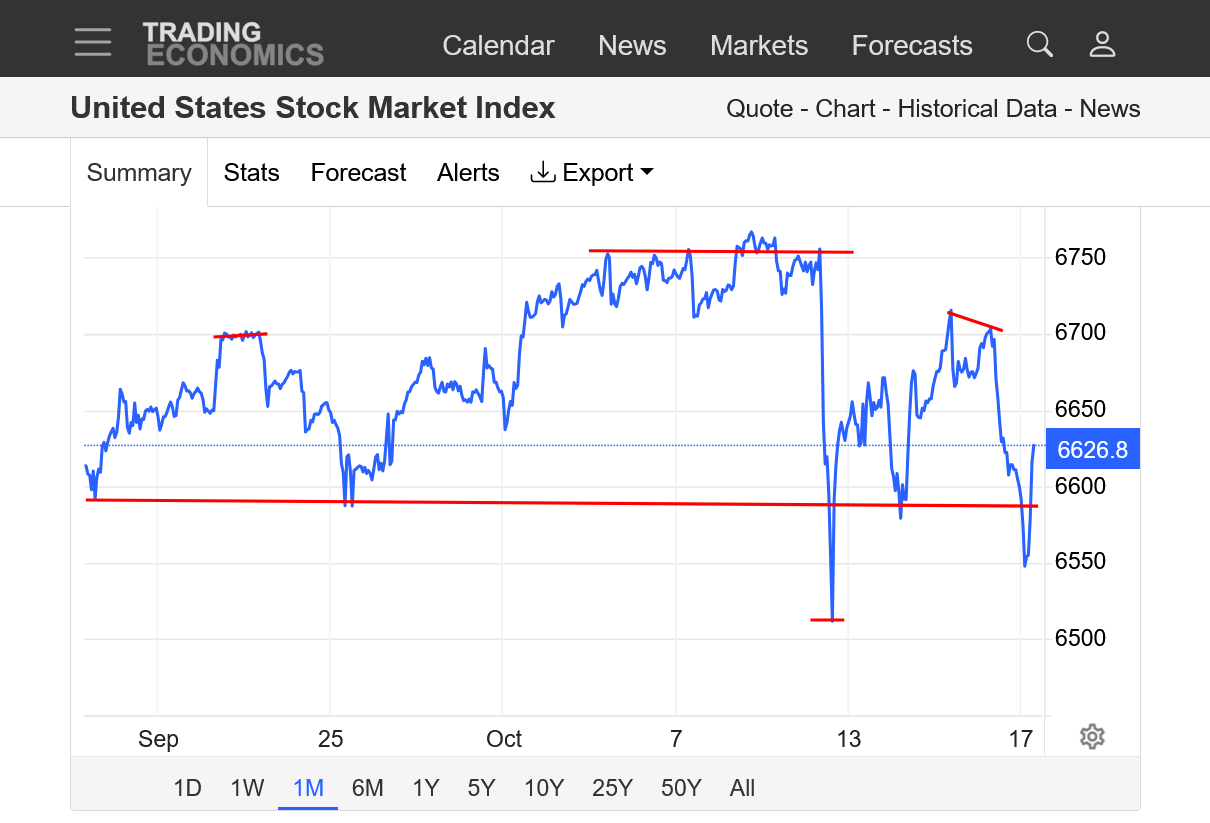
1. 1 month: Head/top, with shoulders/lower highs on either side.
2. 1 year.: Same formation. Need to break below the Friday low(neckline) to confirm the pattern.
https://www.youtube.com/watch?v=OZ2FXsJQxM8
%20The%20Stock%20Market%20Has%20Only%20Done%20This%203%20Times%20In%20the%20Last%20100%20Years%20-%20YouTube.png)
https://www.youtube.com/watch?v=7jdEG5F62s4
+++++++++++++
China, globally OWN's the extremely vital rare earth metals markets(with other BIG advantages over the US in this trade war). They have the winning hand and the smart leader.
We have a delusional, pathological thinker as our leader that doesn't understand the basic principles and benefits of free trading that benefits both sides of the trad. He doubles, triples, quadruples down on really bad policies.
If this were a poker game, Xi has a full house and Trump has a pair of aces and is convinced nobody can beat his hand.
But here's the thing.......... WE CAN SEE XI's CARDS and we can see Trump's cards. Trump needs to stop increasing his bets because clear thinking people know that 2 aces will never beat a full house.
Almost every US economist thinks(knows) that tariffs at this level will damage our economy, many believe enough to put us in a major recession.
Re: Re: Re: More delusional tariffs!
By metmike - Oct. 13, 2025, 3:10 p.m.
By metmike - Sept. 16, 2025, 12:13 p.m.
+++++++++++++++++
The stock market can't go up like this forever and increasing tariffs damage could be the trigger for the next crash.
A crash because the stock market and the individual stocks in it are more overvalued than at any other time in history.
This is not advice. I don't trade stocks. I just have fun analyzing any and all markets based on fundamentals, technicals/charts, emotions and political elements.
When a market is at an all time record high and fundamentals are in the toilet, it's especially fascinating to analyze.
The gold and silver markets soaring to record highs could also be, partly from those markets seeing what the rich people in the stock market Ponzi Scheme refusing to acknowledge because Trump's policies are best for rich people.
That part is speculation.
kris,
You must be a big fan of old Western's!
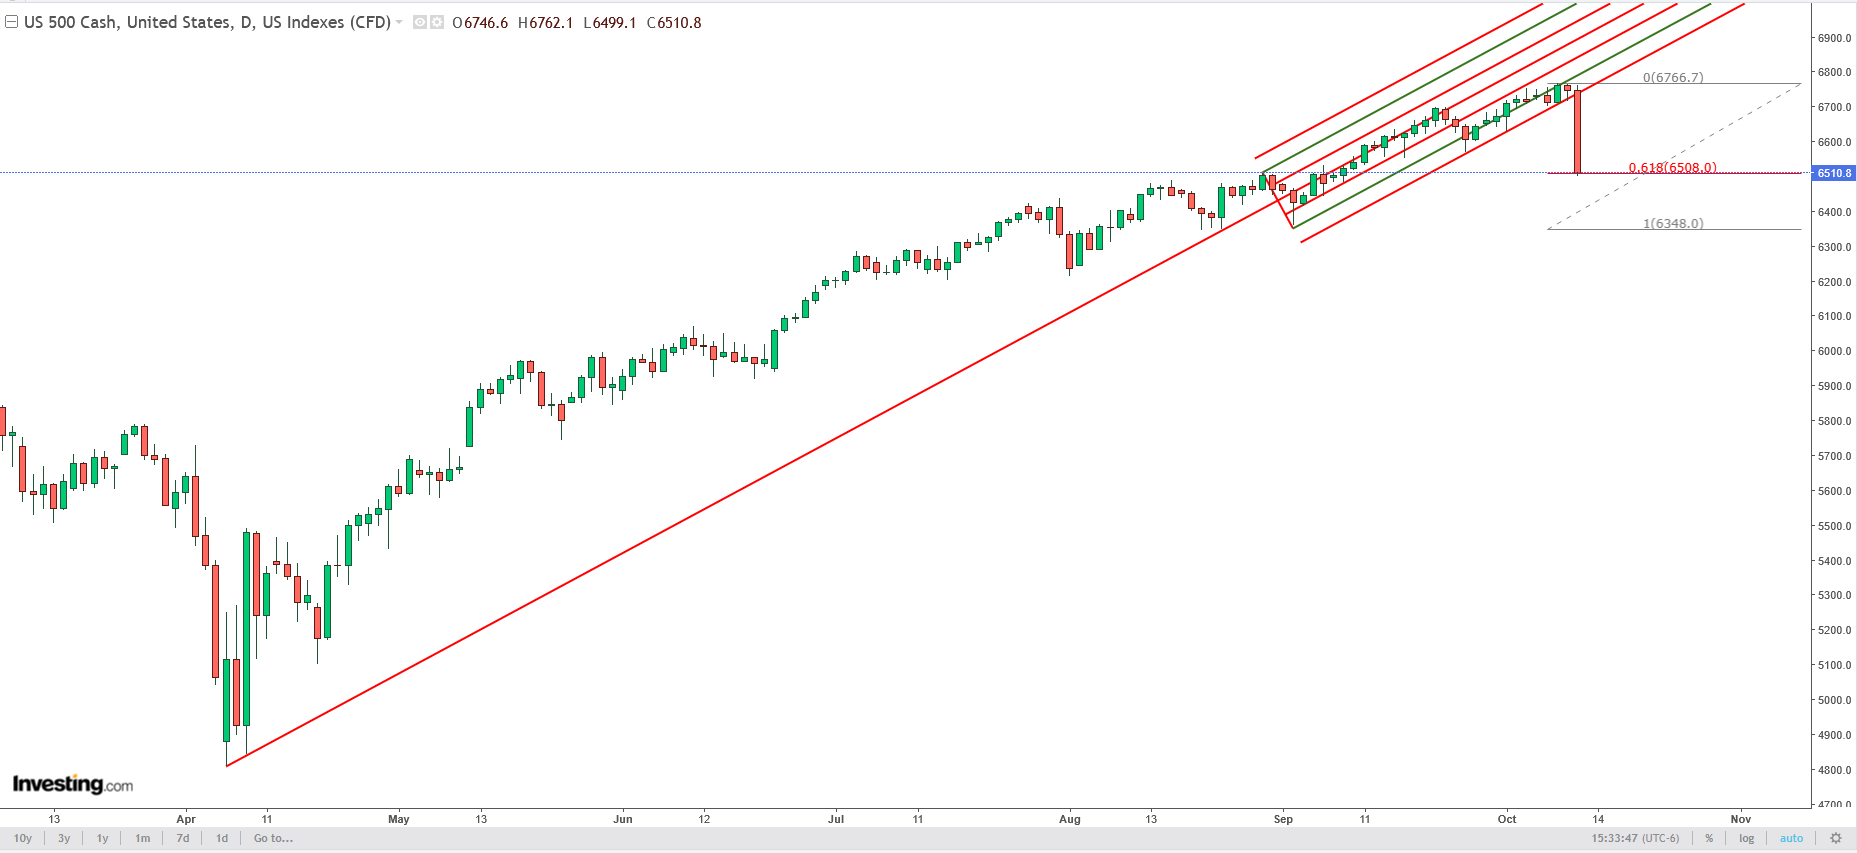
Could get really ugly here if MAJOR support gives way. (Last Friday's spike low).
The Friday afternoon spike low late in the trading session(last week), if violated could trigger massive selling. Support like that has been holding, time after time after time but this time might be different.
This market is SO over valued and the economic news is bad. In the past, this has ALWAYS crashed us lower.
This time could be different but I think kris is right here.
https://tradingeconomics.com/united-states/stock-market
"Something is going to happen"
Head and shoulders top formation the past week several weeks. Spike low on Friday because of Trump's new tariffs and battle with China but that held overnight on a test that didn't get that low. Now, we are attempting to reverse higher again.
Most indicators, the faltering economy, tariffs and EXTREME over valuations are screaming market crash.
The rich people's Ponzi scheme with it's self fulfilling prophesy(and Trump's pro rich people's agenda) has managed to reject all of that and be a source of massive money to continue to sustain itself, independent of historical norms and stock trading principles.
How long can this last?
https://tradingeconomics.com/united-states/stock-market
The never die stock market is closing near the highs of the week. Technically, a close like that is poised for a gap higher open next week but seems unlikely based on so many negatives bombarding the market.
If Trump announced a deal with China or that he's dropping all the tariffs, on the other hand would do it.
https://tradingeconomics.com/united-states/stock-market
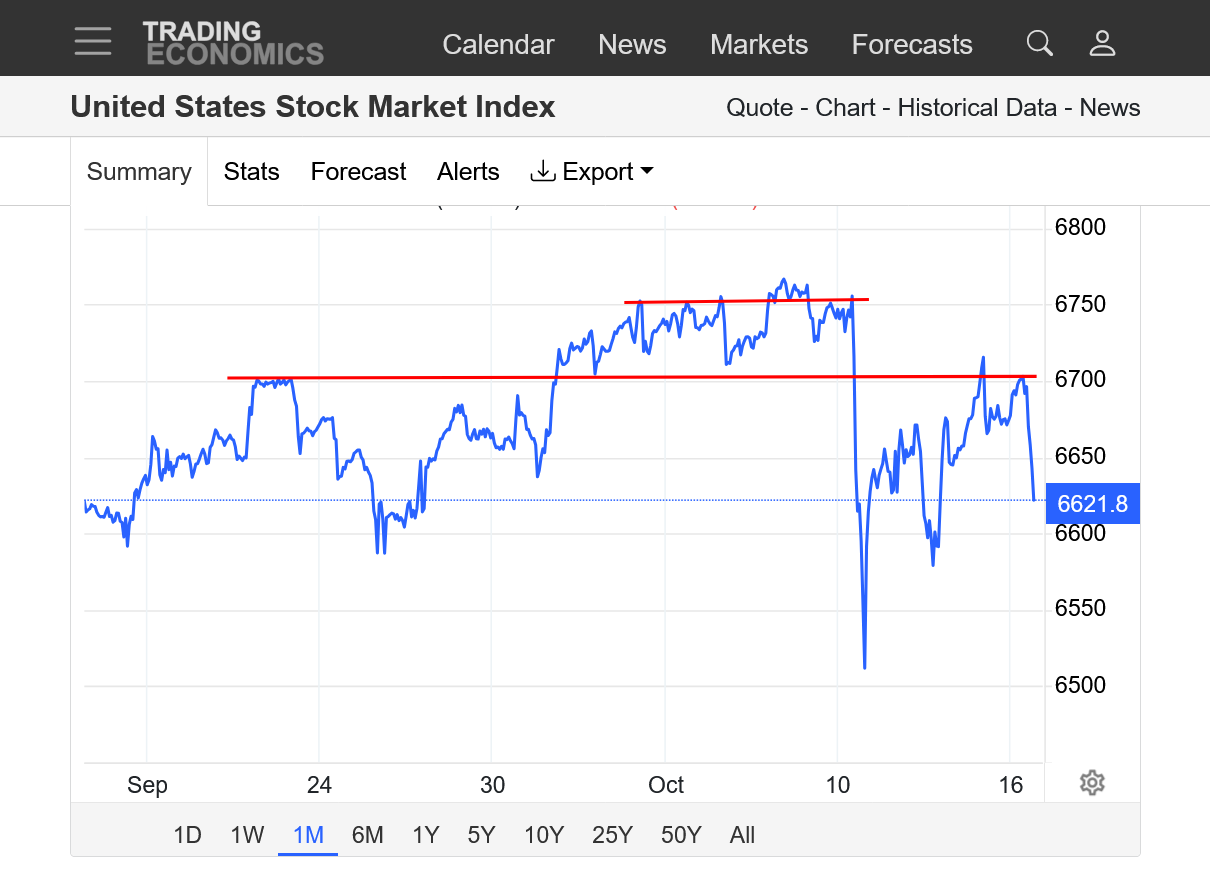
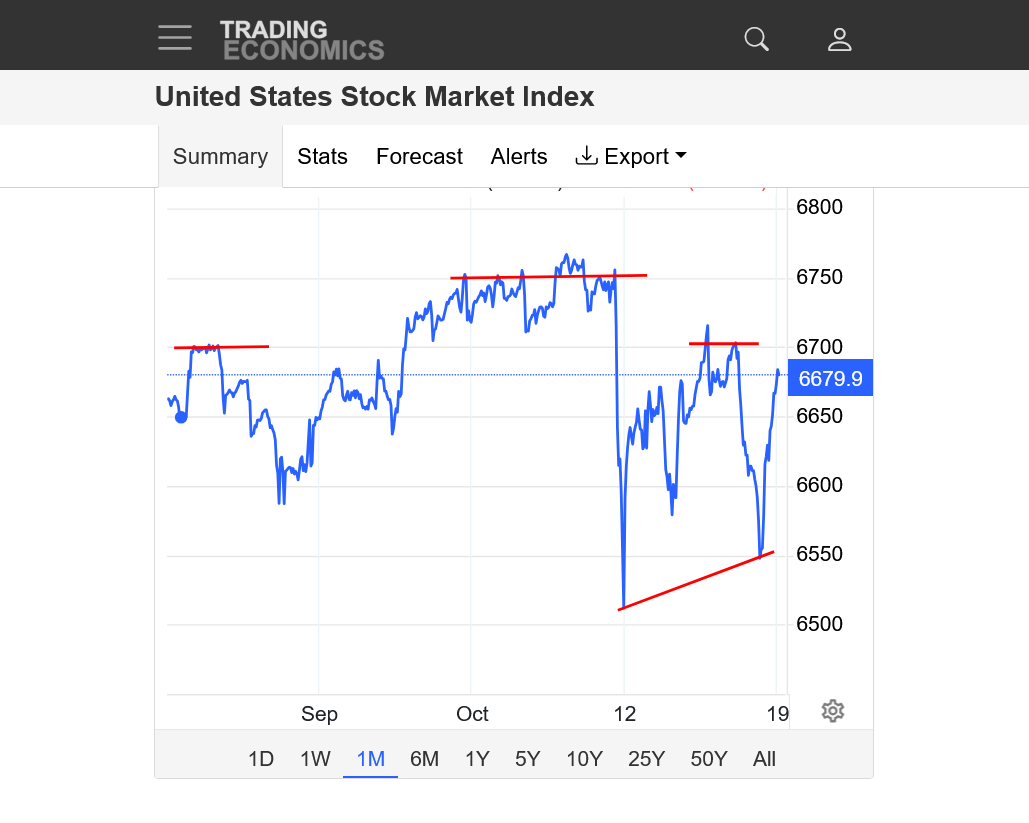
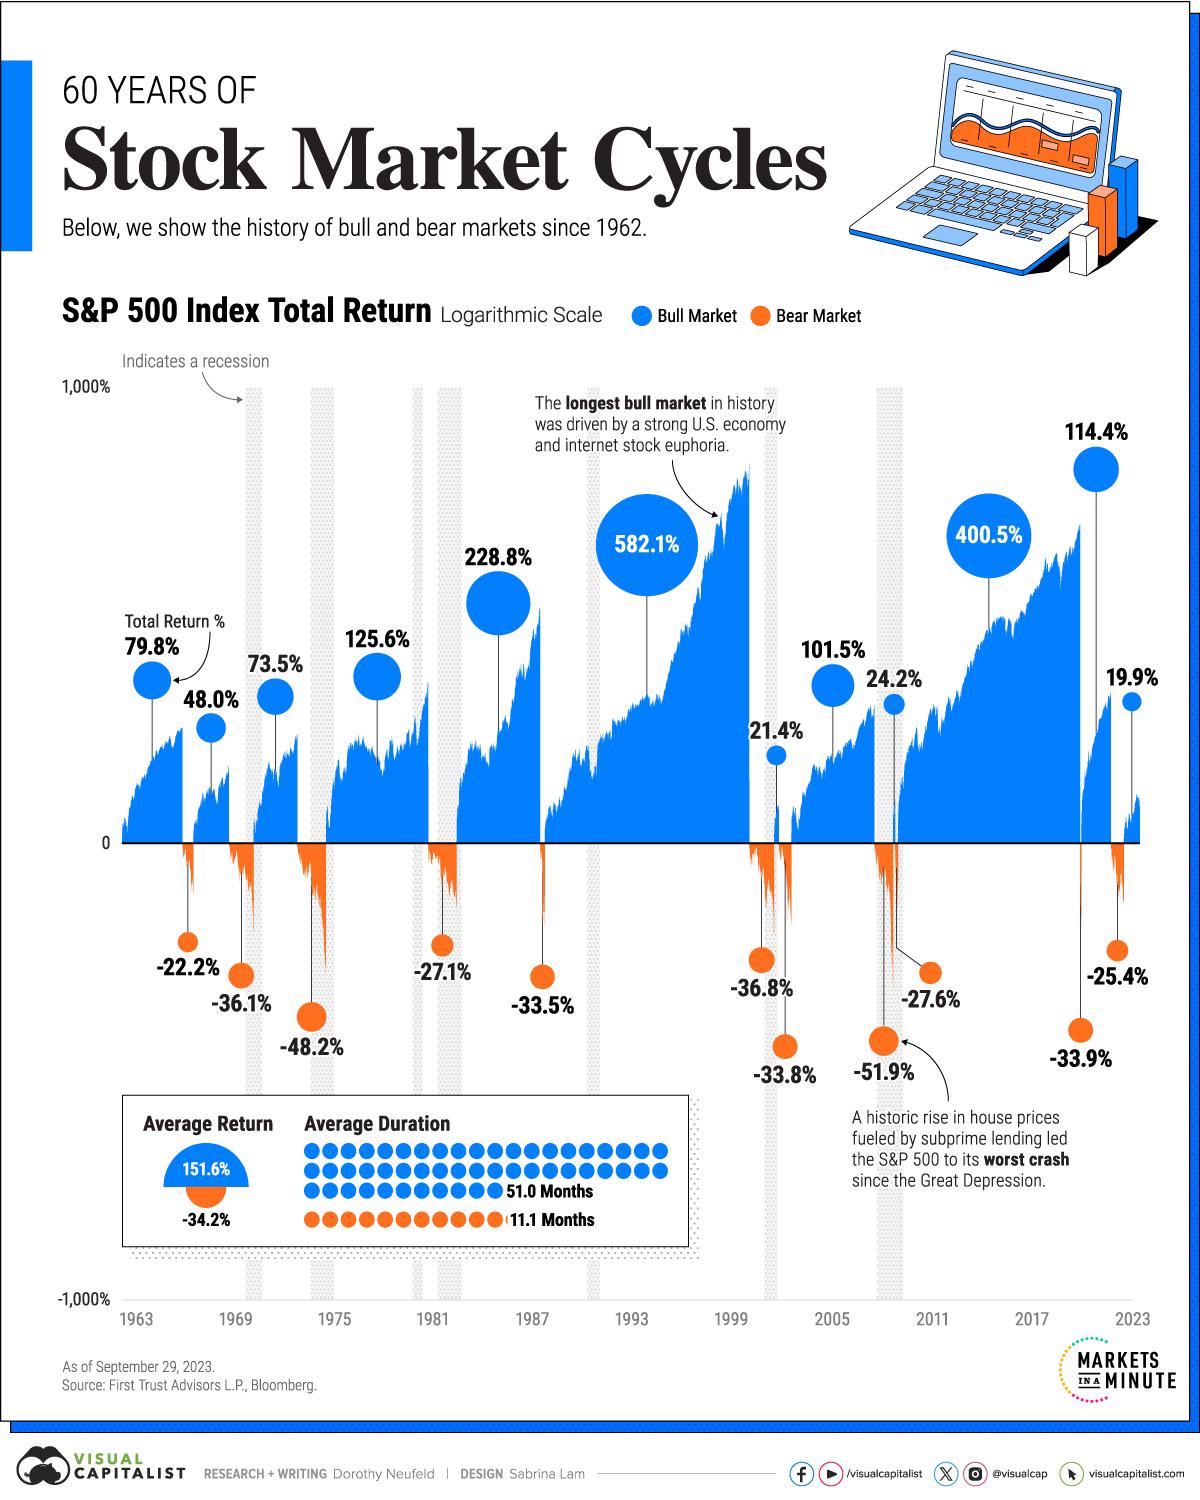
1. 1 month. Pick your favorite red line(s). Head and shoulders top. Support below that. Low this week that was higher than last week's spike low.
2. 1 day: Early morning low followed by sustained buying strength. Closing near the high of the day and close to the highs of the week. The complete opposite of last weeks close which was a huge spike down at the end of trading.
oct 19, 1987 black Monday
Black Monday (1987) - Wikipedia
Black Monday (also known as Black Tuesday in some parts of the world due to time zone differences) was a global, severe and largely unexpected[1] stock market crash on Monday, October 19, 1987. Worldwide losses were estimated at US$1.71 trillion.[2][A] The severity sparked fears of extended economic instability[3] or a reprise of the Great Depression.[4]
Possible explanations for the initial fall in stock prices include a fear that stocks were significantly overvalued and were certain to undergo a correction, persistent US trade and budget deficits, and rising interest rates. Another explanation for Black Monday comes from the decline of the dollar, followed by a lack of faith in governmental attempts to stop that decline. In February 1987, leading industrial countries had signed the Louvre Accord, hoping that monetary policy coordination would stabilize international money markets, but doubts about the viability of the accord created a crisis of confidence. The fall may have been accelerated by portfolio insurance hedging (using computer-based models to buy or sell index futures in various stock market conditions) or a self-reinforcing contagion of fear.
---
Frederic Mishkin suggested that the greatest economic danger was not events on the day of the crash itself, but the potential for "spreading collapse of securities firms" if an extended liquidity crisis in the securities industry began to threaten the solvency and viability of brokerage houses and specialists. This possibility first loomed on the day after the crash.[23] At least initially, there was a very real risk that these institutions could fail.[24] If that happened, spillover effects could sweep over the entire financial system, with negative consequences for the real economy as a whole.[25] As Robert R. Glauber stated, "From our perspective on the Brady Commission, Black Monday may have been frightening, but it was the capital-liquidity problem on Tuesday that was horrifying."[26]
Great point, cutworm!
38 year anniversary On Sunday!
October is a month with several spectacular market crashes but September has weaker seasonals.
2 months ago I never would have thought we would make it thru mid October and still be this close to the all-time highs.
The high point for the stock market in 1987 was in august, 2 months before the crash. JFYI
Thanks, cutworm!
Looking at this chart, gives one the illusion of no risk to the stock market if an investor just stays long forever.
https://www.covenantwealthadvisors.com/post/understanding-stock-market-corrections-and-crashes
.png)
You're all barking up the wrong tree, cyclical events rule global markets (politicians don't ) !
This past April low was the culmination of the 17 year cycle (typically down 20/25 % in the stock markets) along with the recurring war cycle.
The current highs are the rebound of the above cycles (doesn't mean we're out of the woods). (HURST cycle)
The 10/10 highs remain intact in all indexes, the NASDAQ on that day did exactly what I anticipated.
This past week was OPEX week which 9 out of 10 is always bullish, after the last day of OPEX weeks the markets typically will resume their bullish momentum but : on the rare occasions when they don't it's Katy bar the door ...
I'll put up a chart later when I'm done with my chores .
Meanwhile, in case you have no idea what the Mother Divine cycle is it did show in 1929 / 1987 / 1997 and the crash happened two or three calendar days after the conclusion of that cycle.
This past Friday was Diwali (conclusion) within that cycle; two or three calendar days would suggest the possibility of a serious down move Monday or Tuesday
Caveat : it's never been a regularly recurring cycle and crashes are very rare events but when it shows up it shows up in a big way .
More later !
Thanks, kris!
We look forward to it!
Thanks very much, kris!
I note that your charts have no time frame.
As somebody that fact checks information here, including those from posters, I'm going to push back on your long term cycles dominating the stock market right now.
"You're all barking up the wrong tree, cyclical events rule global markets (politicians don't ) !
This past April low was the culmination of the 17 year cycle (typically down 20/25 % in the stock markets) along with the recurring war cycle.
The current highs are the rebound of the above cycles (doesn't mean we're out of the woods). (HURST cycle)"
++++++
I fully acknowledge that many markets have very reliable cycles and in fact post them frequently here. Seasonals are based on historical tendencies, like for grains(planting/growing/harvest) or energies based on demand/supply and storage tendencies.
Here's an example of REAL cycles:
Re: Re: Re: Re: Re: USDA September 12, 2025/Grains
By metmike - Oct. 17, 2025, 9:03 a.m.
+++++++++++++++++++
However, in the stock market and other markets, these magical mystery 17 year, 25 year or 100 year type cycles are most dependable for promoters to make money selling them.
They are mostly bunk and often similar to somebody flipping a coin 10 times and getting heads on the 2nd, 5th and 8th flip and calling it a reliable cycle. Even though we know that the results of flipping a coin have odds each time that are COMPLETELY INDEPENDENT odds from previous coin tosses.
People can go back and find many random variations like this and call them cycles, then sell them to people. In some cases, if enough people actually believe in it, the law of a self fulfilling prophesy kicks in, which means that if enough traders believe in and trade bunk, bunk will actually determine the price outcome for that market.
However, I can tell you with confidence, that currently the huge money in the stock market is not being driven by long term stock market CYCLE expectations.
I spent a decade+ studying cycles very closey. As a meteorologist/atmospheric scientist, I use cycles all the time based on the changing angle of the sun(seasons) along with repeating DECADAL oceanic cycles that are based on the circulation of and movement of heat in the oceans that takes decades to play out, then repeat again. Ocean temperatures have an enormous impact on global weather as in El Nino/warm and La Nina/cold in the tropical Pacific. The PDO, Pacific DECADAL Oscillation is one that repeats but not exactly with reliable timing.
https://en.wikipedia.org/wiki/Pacific_decadal_oscillation
Because of this, people want to use something that is true and apply the same principles in areas where it is not true........looking to interpret coincidences in random variation as cycles.
Don't feel too bad about this, kris.
I gave a great deal of push back on fays/fayq for basing his trading on junk science ASTROLOGY. It's possible that in some realms, if enough people would believe in astrology(alignment of the planets in the sky that have NO PHYSICAL IMPACT ON EARTH) there would be a self fulfilling prophesy).
Large traders that control the movements of markets KNOW that astrology is complete hogwash.
Market Insight: Echoes of History and the Coming Reset
Started by fays - July 27, 2024, 12:50 p.m.
https://www.marketforum.com/forum/topic/106231/
https://www.marketforum.com/forum/topic/106231/#106232
+++++++++++++++++
Re: Re: Re: Sp 500 diamonds for ever-- 1H chart top or 5581??
By metmike - July 13, 2024, 3:02 p.m.
+++++++++++++++++++
By fayq - Oct. 15, 2025, 11:26 a.m.
+++++++++++++++++++++
++++++++++++++++++++++++++
I strongly encourage you to continue to post your thoughts, including those on cycles as an alternate opinion to mine on cycles. People are welcome to form their own opinions. With regards to the current stock market, regardless of disagreeing on very long term cycles, we are on the same page about potential outcomes and your views have value here.
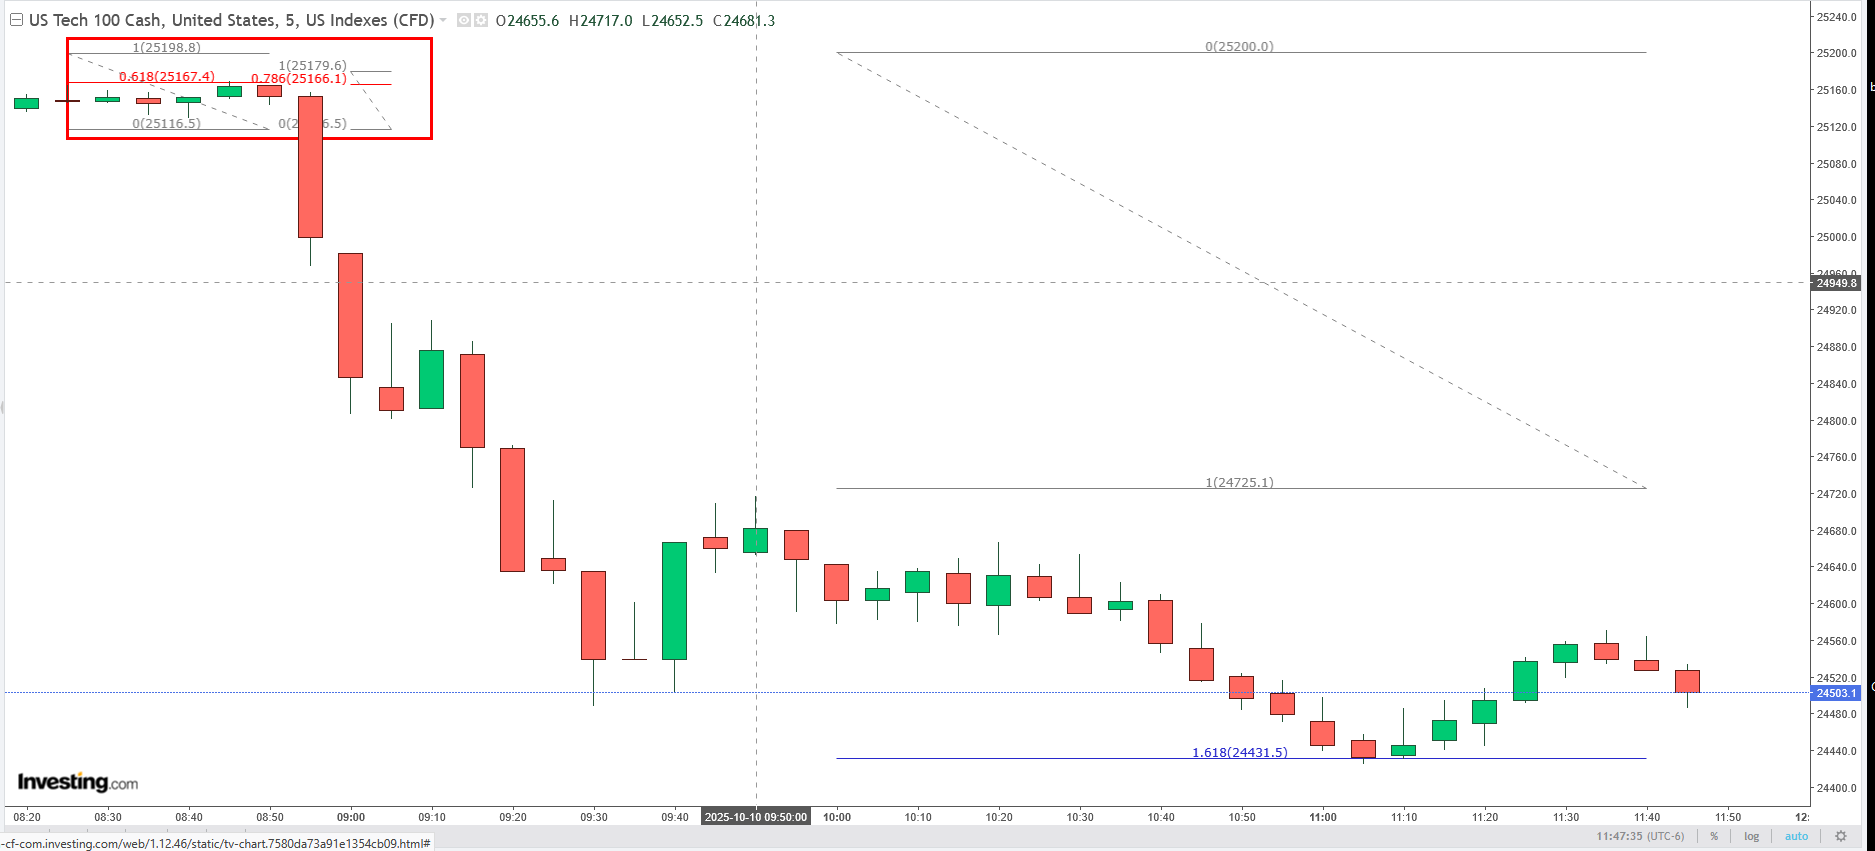
"I note that your charts have no time frame"
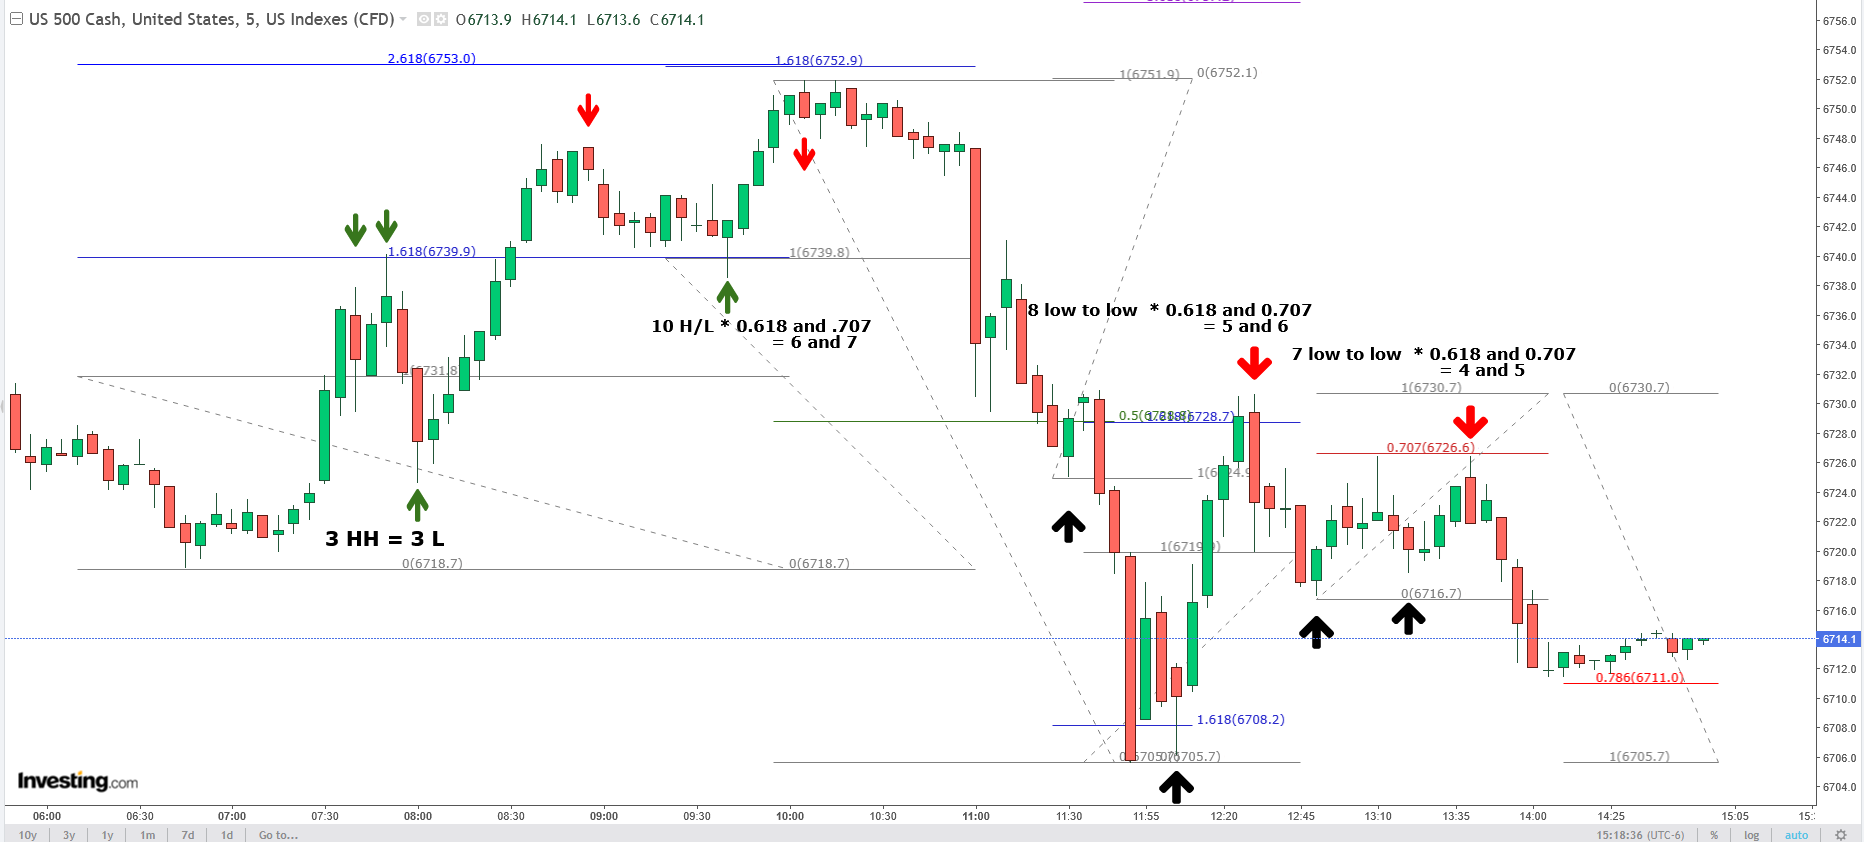
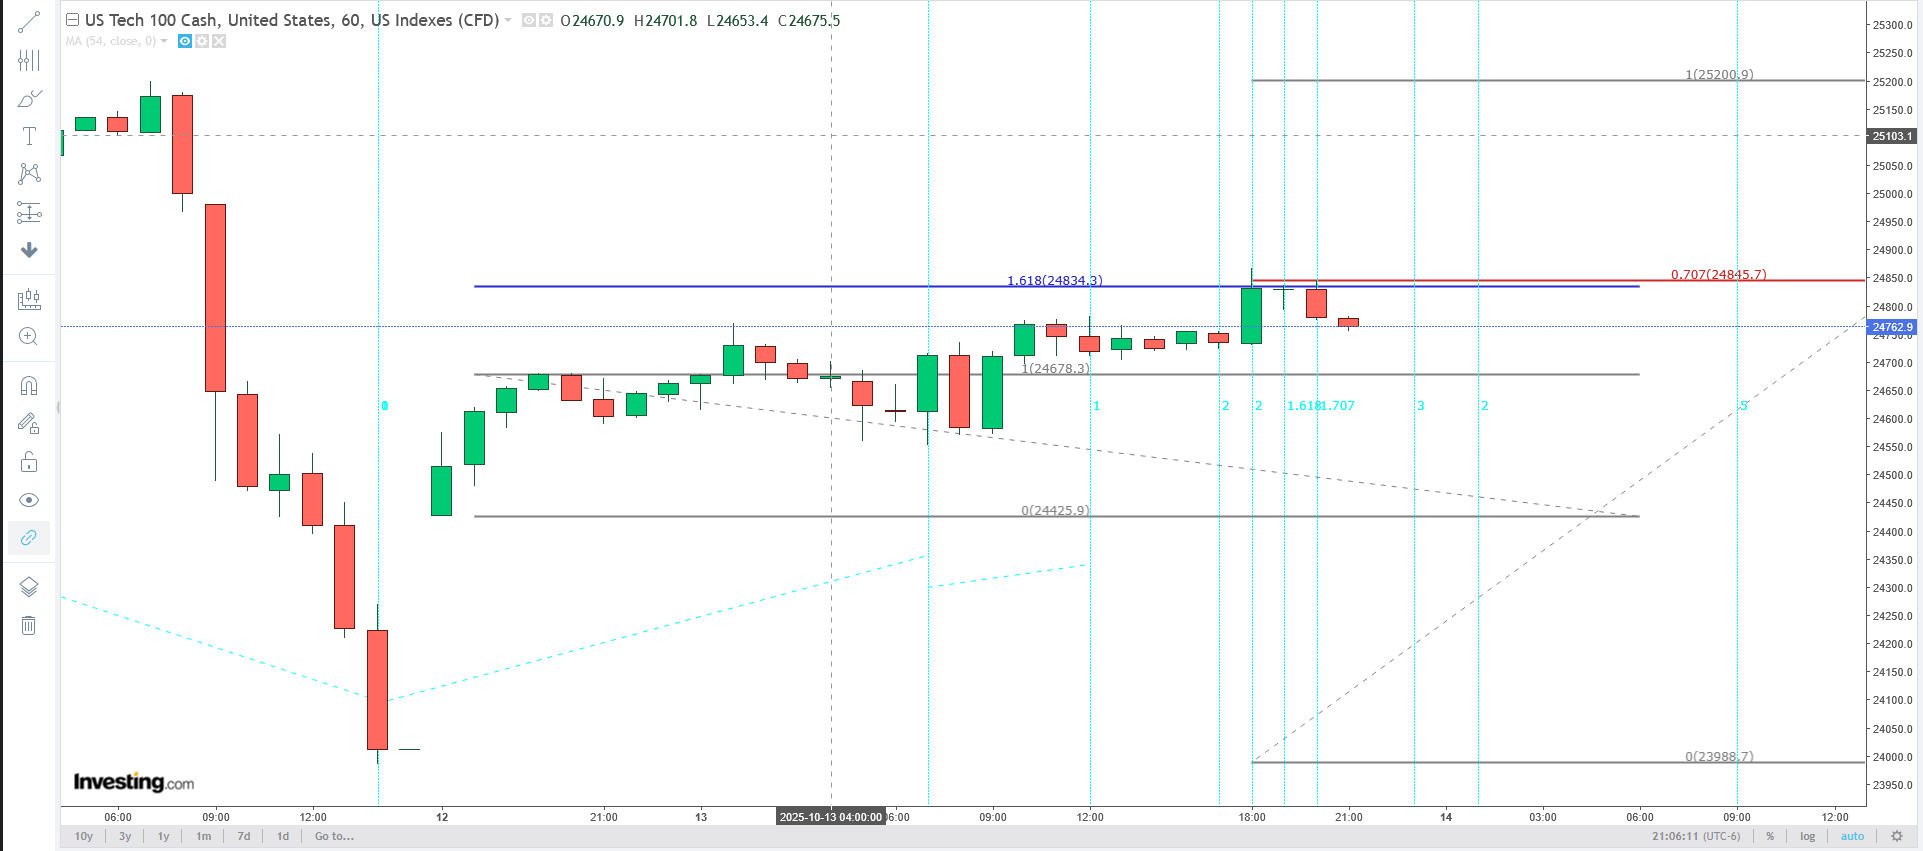
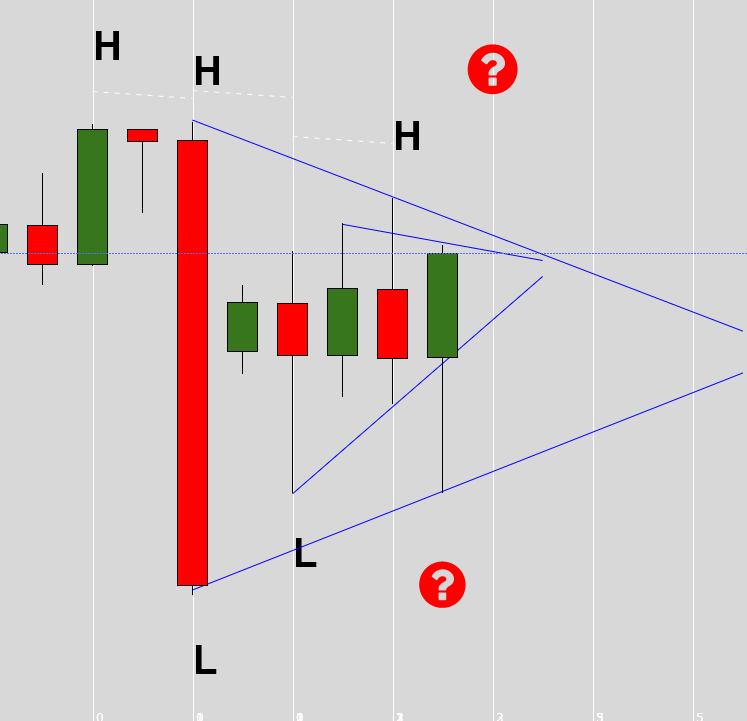
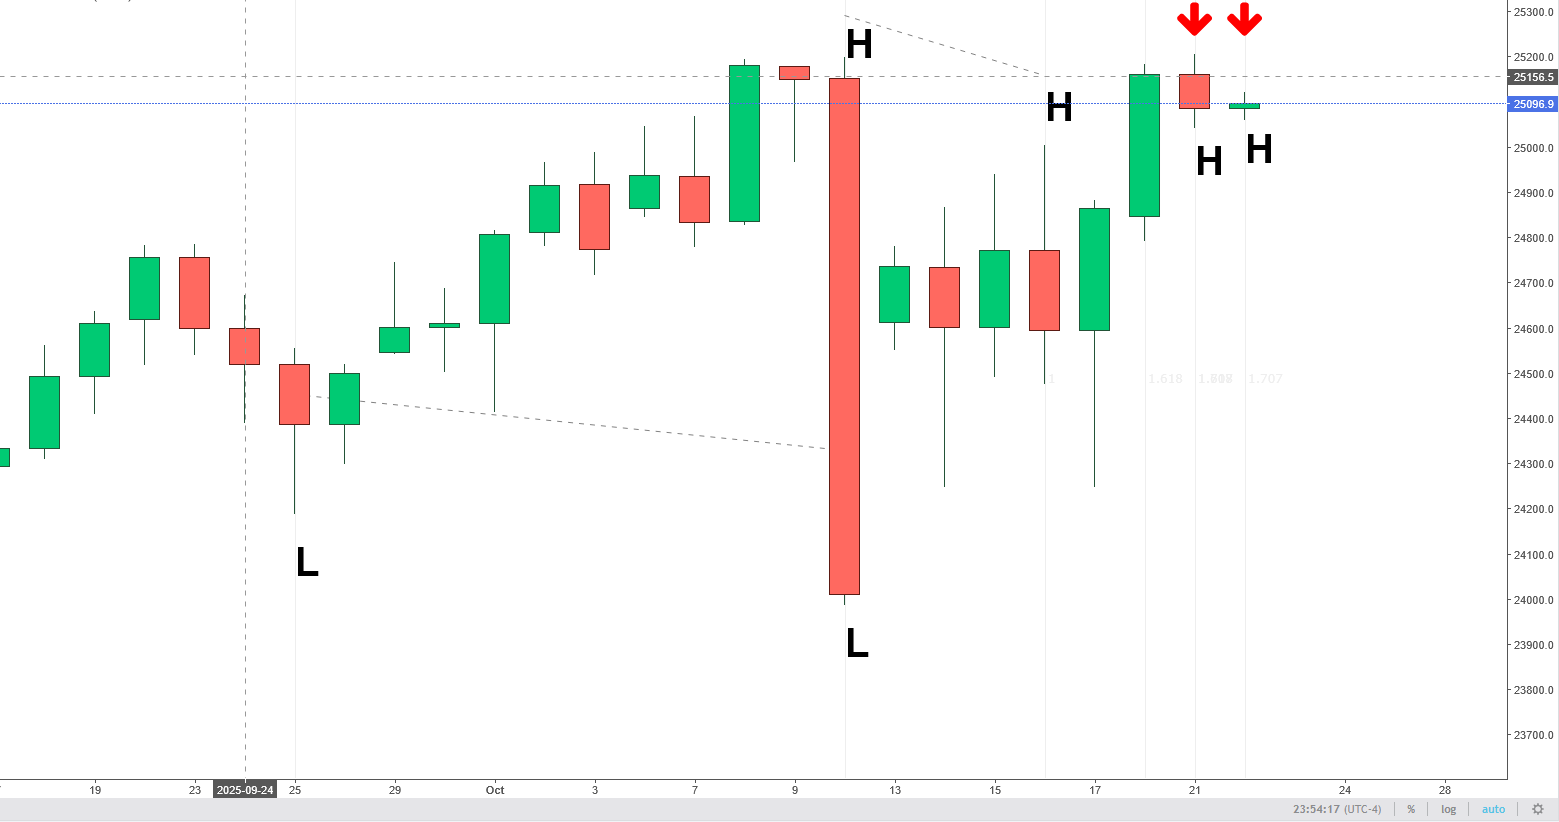
Big bar chart is the continuous Nasdaq Daily, I'm pointing to the 3 day interval since 10/08, the sequence = H/H - L/L -L/H so if the 3 day sequence holds then the next bar could be a H or L , we'll find out ...
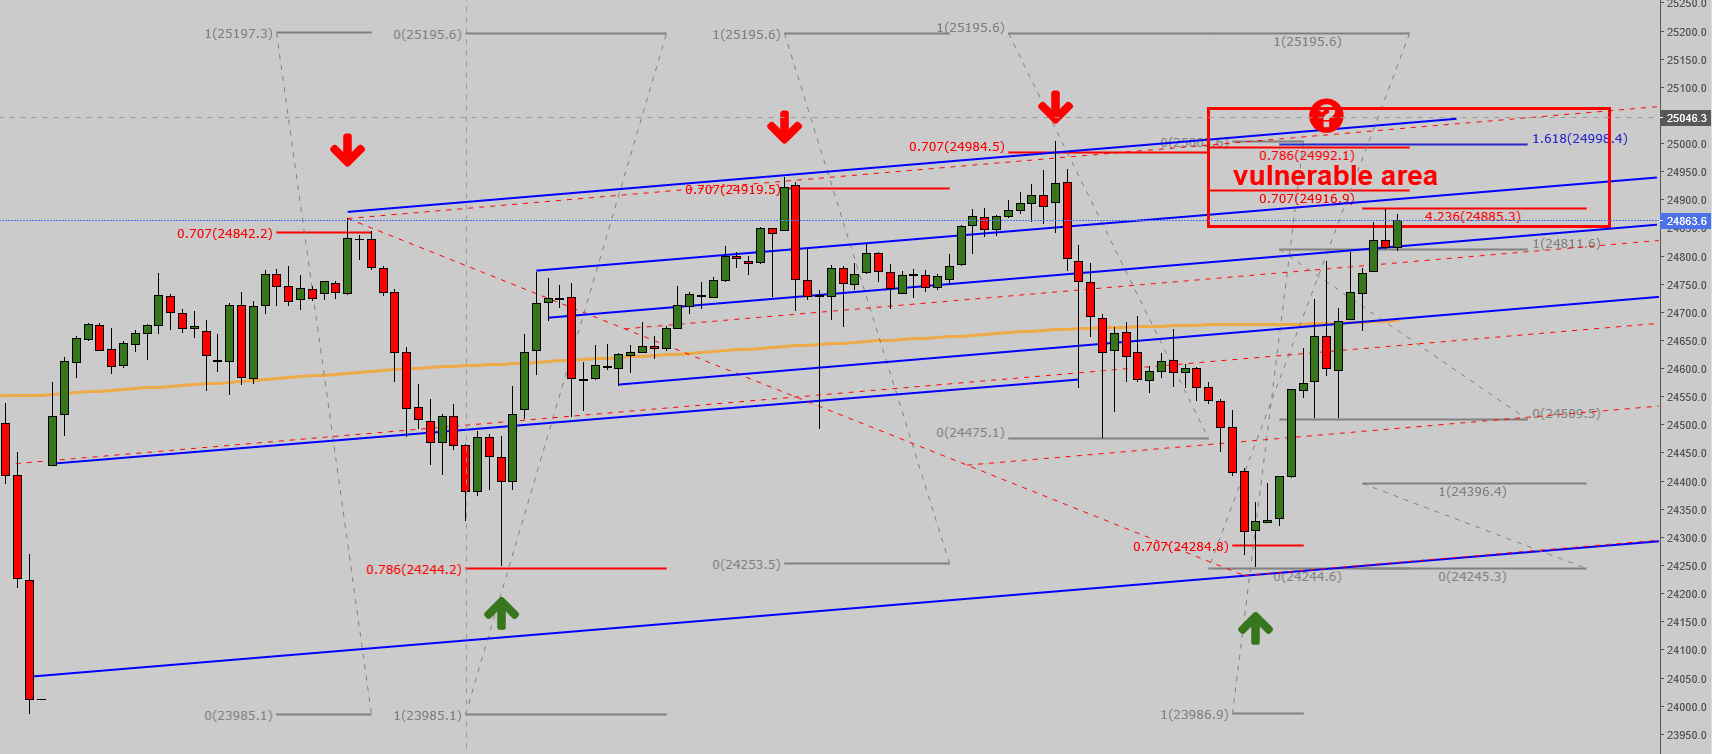
The bottom chart is the continuous Nasdaq hourly where I point to the 0.707 / 0.786 points of inflection ruling the current swings both up and down.
We are once again at or close to the next inflection point within the rectangle outlined in red, exciting times ... !
"However, I can tell you with confidence, that currently the huge money in the stock market is not being driven by long term stock market CYCLE expectations."
I spent a decade+ studying cycles very closely"
You should really do a study on the 17 year cycle (stock markets only) before making such a claim !
Kris I checked out your 17 year cycle in the stock mkt. Pretty good!
Spike lows all the way back to 1974.
74, 91, 2008, 2025.
My question to you is, have you ever seen a cycle flip? low, low, low, high !!
I have. Maybe 2025 puts in a multi year high?
But I'm with you that politicians don't have much to do with economic cycles. But there is the occasional self inflicted wound.
I'm reminded of a professional off floor grain trader I met when I was very young. Once he bought wheat telling me it would rally for a week or 2. I asked why the wheat was going to rally. He said: "After it rallies, read the reporting on it. They will tell you why it rallied."
You should really do a study on the 17 year cycle (stock markets only) before making such a claim !
Thanks, kris.
How about I do it right now for you?
https://www.covenantwealthadvisors.com/post/understanding-stock-market-corrections-and-crashes
.png)
https://en.wikipedia.org/wiki/List_of_stock_market_crashes_and_bear_markets
++++++++++++
Now let's go back in 17 year increments to see how many previous major crash/bear market events were captured using this cycle.
2008: Exactly 17 years ago and but we haven't had the event this year so that's 0 so far.
1991: ~17 years before that. There was an early 1990s recession, so we can count this as 1.
1974: There was an oil price shock from OPEC that DID cause a crash in Jan 1973(18 years before that). We can count that as 2(I'm giving your 17 year cycle 1 year before or after 17 years).
1957: Nothing
1940: Nothing
1923: Nothing
+++++++++++
So it was like I stated earlier with the coin flipping example. Flipping a coin is always 50-50 for heads-tails odds that are independent of previous flips. If you flip a coin 100 times, you will get random stretches with patterns that repeat. Not just heads, then tails, then heads then tails.
~1974, then ~1991, then 2008 is 17 years X 2 times. That's the extent of your 17 year cycle. This would be like getting 3+ heads or tails in a row in the coin toss X 100 times because 1923, 1940 and 1957 violate this cycle.......so by definition, it can't be a valid cycle.
Is the market going to crash in 2025, 17 years later than 2008?
I think it will but not because of a 17 year cycle that repeated 2 times the past 100 years and this means we're due for #3.
What do you think, kris?
Thanks, joj!
If you want to include the spike low of 2025, then you have to include a dozen other spike lows in between those 17 years during that short time frame.
2011, 2015, 2018, 2020 and 2022 to name just those since 2008.
What do you think, joj?
This doesn't mean that I'm right or you're wrong but before I transferred to the University of Michigan to get a degree in atmospheric science, my first love, I spent 2 years at the University of Detroit studying to be an actuary, with statistics always being another love.
https://en.wikipedia.org/wiki/Actuarial_science
Actuarial science is the discipline that applies mathematical and statistical methods to assess risk in insurance, pension, finance, investment, psychology, medicine, and other industries and professions.
just like a surfer watching the waves come in, waves might come in a set of three or four and then dissipate. Similarly, cycles emerge and dissipate.
I think Kris has something with the 17 year. cycle.
The break in April was a little over 20% which "counts" in my opinion.
But as I said previously, I have seen cycles flip low, low, low, high which would make 2025 a possible top.
Cycles work (or appear to work) until they don't. The intermittent cycles that MM points out are to me, like waves crossing other waves.
Or, maybe it's all in our imagination. We see what we want to see.
Outstanding points, joj!
If we are including the April 2025 crash, then we must include this crash, mentioned last week in this thread by cutworm:
By cutworm - Oct. 17, 2025, 9:09 p.m.
oct 19, 1987 black Monday
Black Monday (1987) - Wikipedia
+++++++
And these crashes:
2001 crash from 9-11-01 attacks
2000 Dot. com crash
Oct. 1997 Asian financial market crash
Fri 13th Oct 1989 mini crash(although that 1 was only 12%)
None of those line up with a 17 year cycle.
In fact, they contradict it when you allow April 2025 in necause that means we have to include all the other ones that I mentioned.
++++++++++++
On waves, YES!
So many markets trade with waves that often have reliable timing and price considerations.
I posted a perfect example of this recently for a market but can't remember which one.
+++++++++++
Just remembered it:
Re: Re: Re: Re: Re: Gold Update
By metmike - Oct. 14, 2025, 11:21 p.m.
joj,
Thanks for giving us more of your unique and profound thoughts. You clearly understand the gold and silver markets better than almost everyone (including me).
Great to have your valued thoughts!
These updated price charts show a pattern that is extraordinarily rare in the stock/commodity price world!!
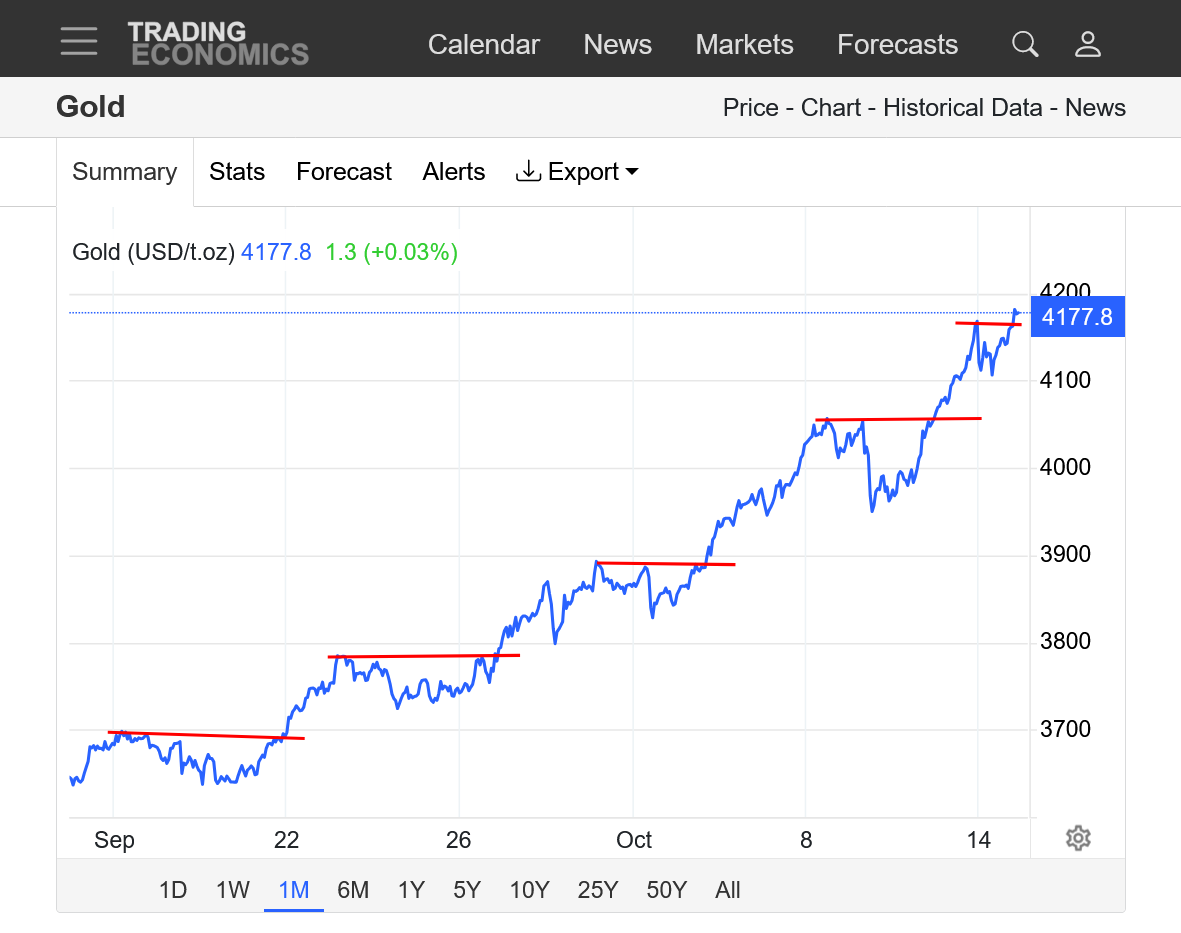
https://tradingeconomics.com/commodity/gold
3. 1 month: 5 well defined waves/bull flags with the first 4 that look uniformly spread apart. Each red line was an upside break out of that wave/continuation pattern. This last break above the wave had a much shorter wavelength/time frame but maybe its not complete yet. Amazing!!
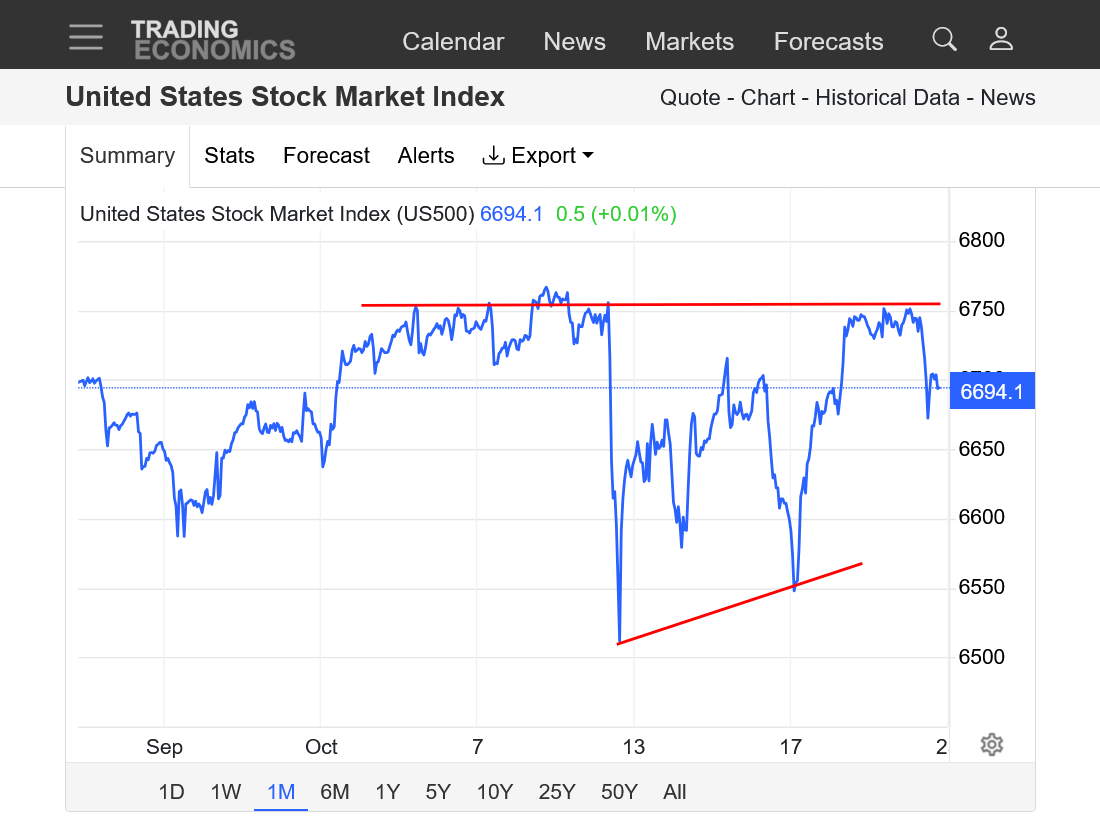
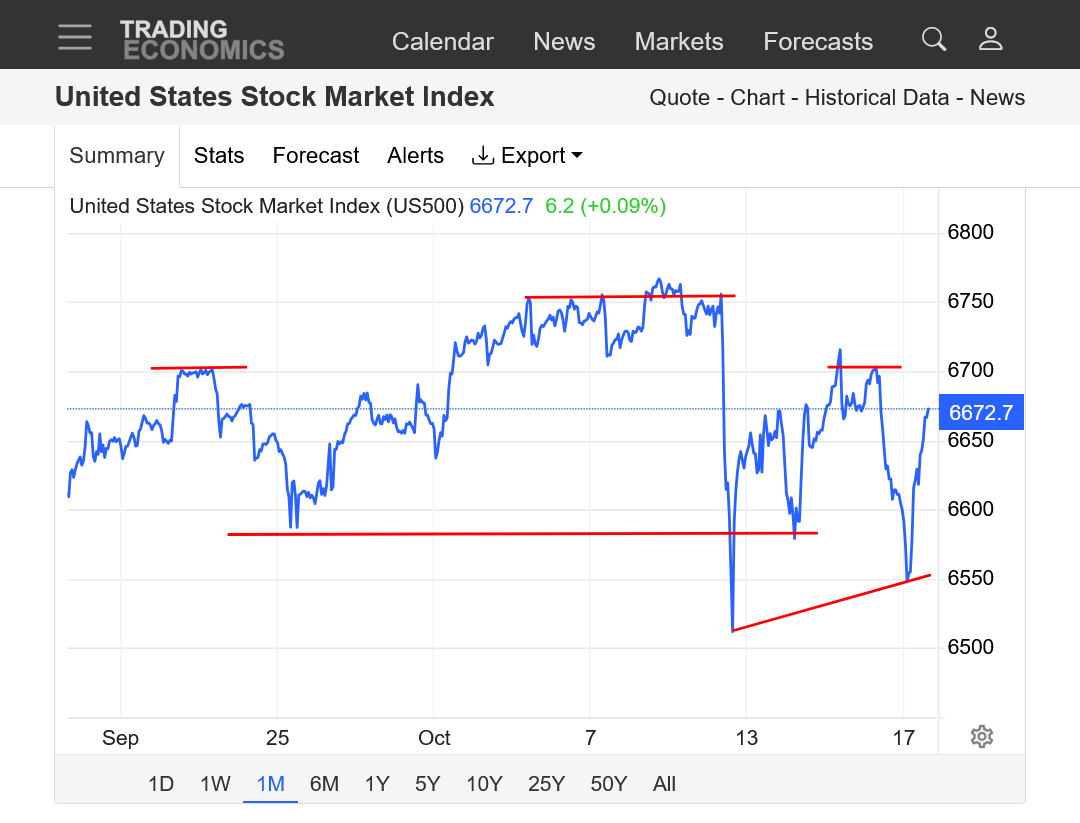
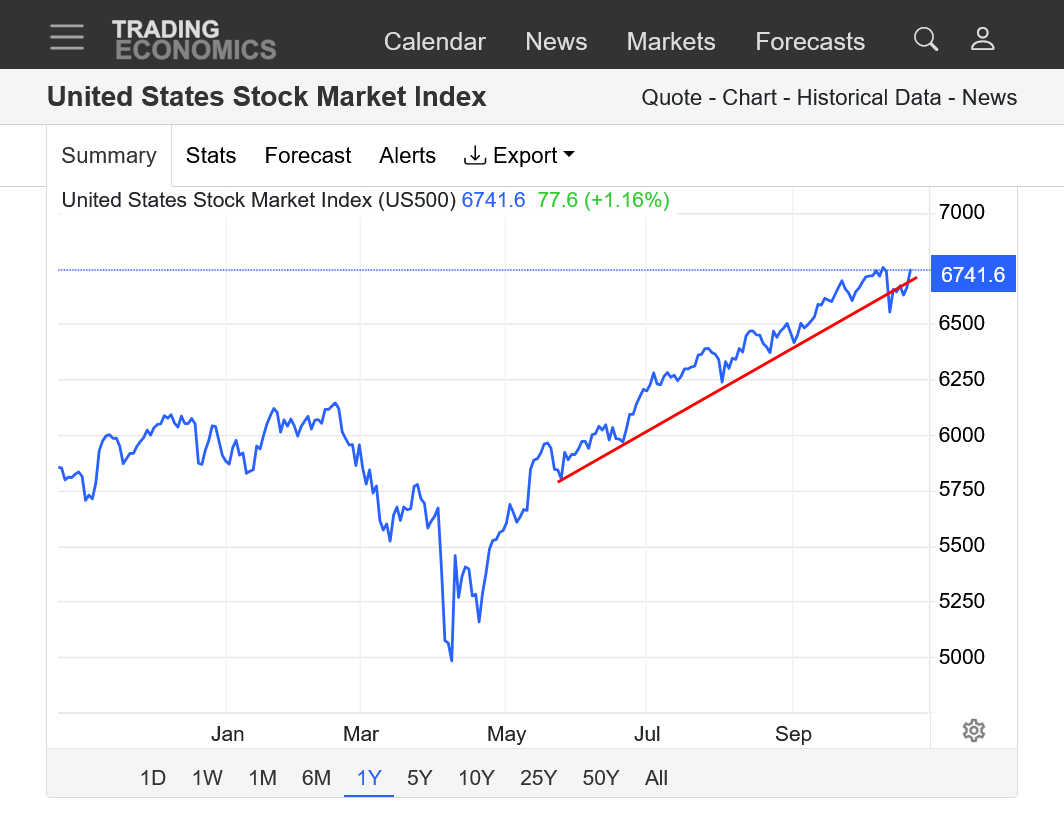
We've opened a bit higher. I drew some red lines that define a head and shoulders top, along with a potential neckline below.
The neck line could also represent support in, yet another bull flag too.
As always, potential chart patterns are confirmed AFTER the price breaks out strongly 1 way or the other.
I normally don't watch the stock market that much but it deserves alot of attention since we are discussing it so much here and record highs mean being unprecedented. Picking tops, just like picking bottoms is actually my favorite trade(in grains/energies). tjc's favorite too and he trades many more markets and shares with us.
These are prices the past week below with us approaching 3 hours after the open of the new trading week. Again, my guess is that kris is right about this being a top but am blown away at this markets resilience as it ignores many reasons to go down. A market that refuses to go down on bearish news or won't go up on bullish news is often telling us something. I have never traded this market and never intend to. Please don't use my posts in this thread as reliable trading advice(ng and grains-that will work out for you much of the time but always rely on your own system while considering information here, which traders like tjc, kris and cutworm do).
These posts are only to provide credible information, entertainment with a little education along the way featuring posters that enjoy discussing, learning about and sometimes trading markets and especially sharing their thoughts respectfully.
https://tradingeconomics.com/united-states/stock-market
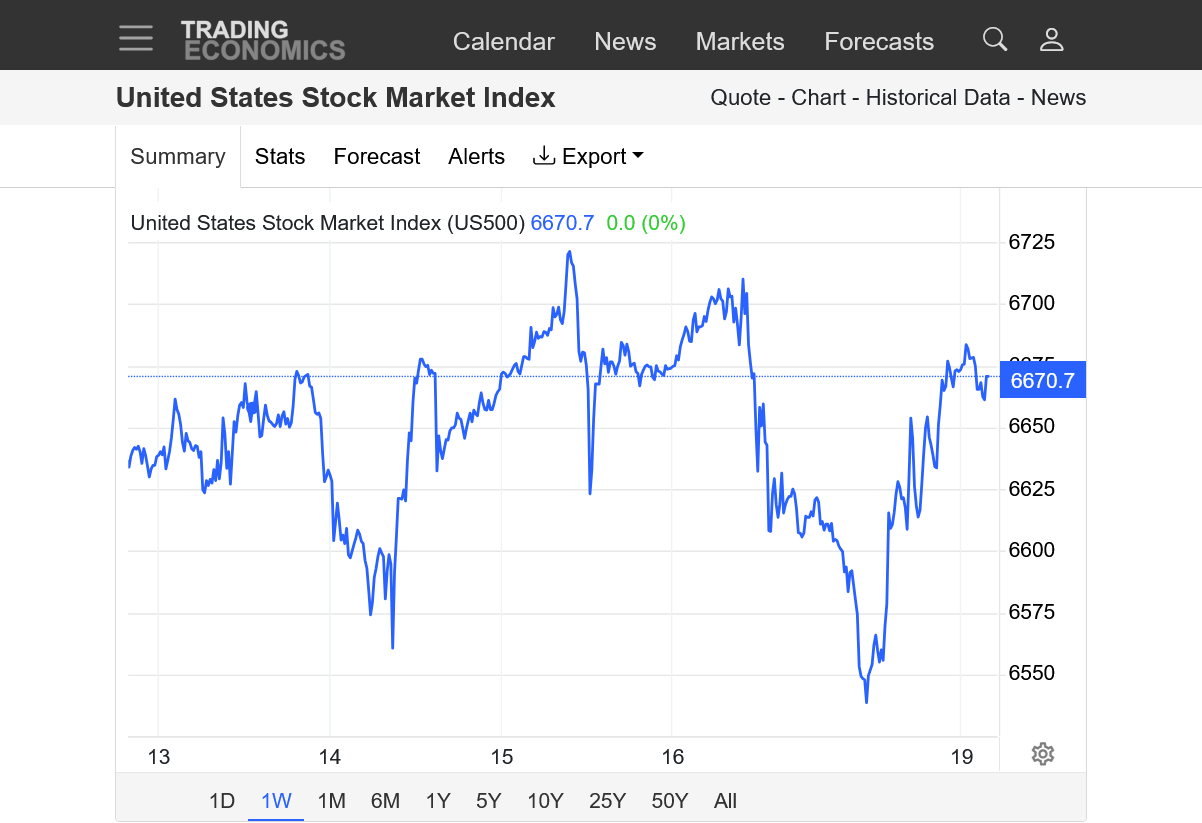
The red line is where we opened Sunday Evening and where we are right now. The market is treading water and uncertain of where to go, possibly waiting to see what Trump does next with China which carries with it extremely high risk news that spikes the market in 1 direction or the other.
https://tradingeconomics.com/united-states/stock-market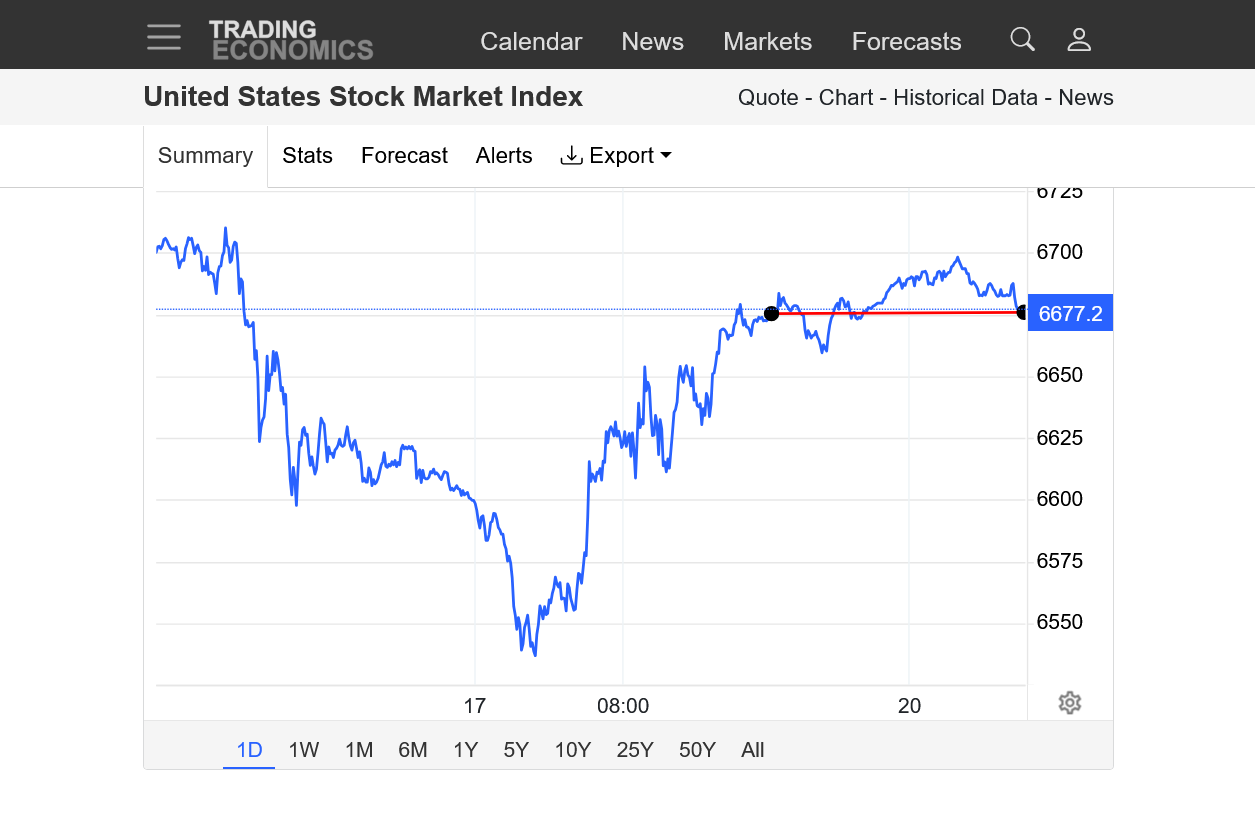
We are in a time frame where the market is extremely vulnerable.
Another comment on the 17 year cycle. There is well over $65,000,000,000,000 in the stock market. The huge money that controls the stock market can be caught off guard by events and Trump announcements, like what he did on April 2nd of this year that wiped out almost 10 trillion of paper value.
Here's an interesting stat about the people who own these stocks based on their income level:
This elite group, that is often invested thru fund managers does sometimes get caught off guard by events and can cause bubbles and is causing the record OVER valued stocks on paper vs intrinsic value........that can go on indefinitely with the rich people's Ponzi Scheme, based on a self fulfilling prophesy control of the market. However, the idea that there is a secret, very powerful and reliable 17 year cycle that only small, really smart traders know about and they don't is how people that make a living selling scams instead of trading/investing make money.
People selling this stuff are usually NOT using it to get rich for the following 2 reasons:
1. They wouldn't waste their time/effort to sell something when they are making 100 times more money using it.
2. People that spend great amounts of money/time for research to use for their investments/speculation don't share it with the public because its what gives them their edge most of the time.
3. There is no question that the stock market has cycles. Just not reliable timing cycles. However, if enough big traders believed all the cycles lined up in 2025, because psychology CAN impact trading (self fulfilling prophesy). It could have an impact. However, it's October 10, 2025. Any long term cycle impact for the year 2025 is well dialed into the psychology of traders.
4. The market trades on expectations. Traders/investors buy/sell based on believing the price will go higher or lower in the future. If a 17 year cycle really was valid for that specific time frame, smart traders/big money would be dialing that in to expectations with negative psychology behavior (self fulfilling prophesy). However, this part of the trading mentality has been the complete opposite. A HUGE positive impact from the self fulfilling prophesy psychology element to the current market. It's exactly what makes this market especially vulnerable right now because of the disparity between this and intrinsic value which is unbalanced at record levels. However there is nothing that happened in 2025 that correlates with 2008 because its 17 years later.
There are no reliable long term cycles in the stock market based on regular intervals of timing. However there ARE CYCLES that repeat at VERY IRREGULAR TIMING INTERVALS.
Look at the graph below to see the ups and downs of the stock market over the past 60 years. None of these moves were based on the stock market following a regular timing cycle.
One can look at this AND FIND what they want to think is an exact X or XX year cycle repeating. However, most of that is random variation between REAL cycles that vary in time based on impossible to predict economic and other realms that dominate.
The chart below of prices of the last month shows that we are violating the head and shoulders top formation as we're now ABOVE last week's highs.
However, the top formation is still potentially valid as long as the highs earlier this month hold.
Also, the spike low from Friday, 10-10-25 was followed by a HIGHER low last week, which makes this look like just another bull flag/wedge and continuation of the trend pattern.
There is tons of negative/bearish news around to make this market go lower..........but it refuses to stay down. When a market won't stay down on bearish news or won't go/stay up on bullish news, it's often telling us something about the psychology of the "composite man" which is the term that Wyckoff used for all the traders in the market acting together.
Maybe the extreme bullishness of Artificial Intelligence is completely overwhelming all the bearish factors bombarding this market????
AI did not exist in the past, so using the past in a market trading on an unprecedented fundamental that didn't exist in the past will be flawed!
https://tradingeconomics.com/united-states/stock-market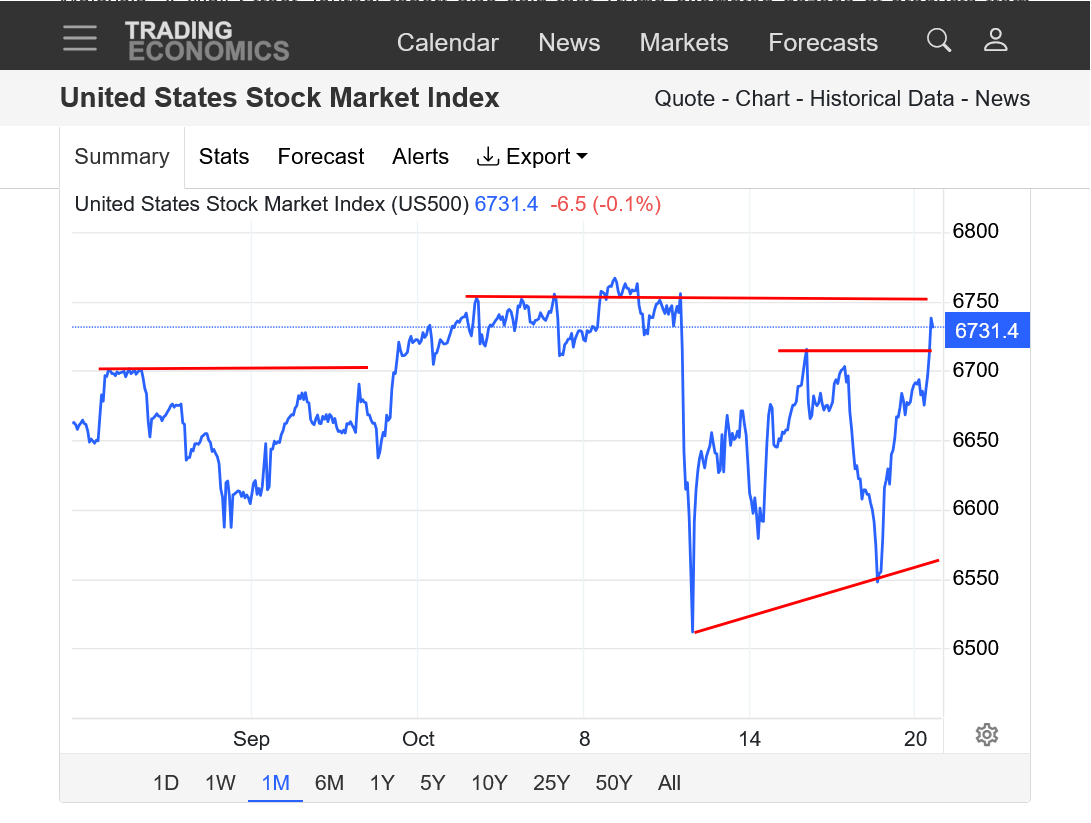 +=
+=
Here's more on Wycoff:
The Simplified Guide To Trading With The Wyckoff Method
https://tradersmastermind.com/wyckoff-method/#elementor-toc__heading-anchor-6
++++++++++++++++++++
Reading the above is one of the best ways to educate yourself about the REAL reasons for why markets act the way they do.
Todays sharply higher close makes new highs the mostly likely path. President Trump follows the stock market and his positive comments about the trade with China and removing some of the tariffs is intentionally having a positive impact.
I am NOT predicting anything. Just telling you what the charts are showing because this market is not following what history tells us should have happened long ago.
Good traders don't get married to positions or ideas markets that keep acting different than expected.
Maybe it still will crash lower? What do you think kris?
This is 1 year, below. Lots of wave like features on the way up the past 5 months, all with different timing and one could make a case of them being a bunch of mini bull flags/minor corrections of a continuation pattern. The last spike down 10 days ago stands out as being more extreme than the others but today's recovery negates most of that.
https://tradingeconomics.com/united-states/stock-market
Powerful up move today post OPEX week, if we close above last week's highs on a daily basis then we may have a top the first week of November ... or not ... !
Trade safe folks .
Thanks very much, kris!
https://tradingeconomics.com/united-states/stock-market
Interesting that the market is extremely quiet here just below the highs with todays todays trading bar. This means something. Maybe it means that market is waiting for news(Trump's chaotic relationship with China).
With the government shutdown, there is no economic data to trade off of which is really increasing the uncertainty too. When the data resumes, chances for BIG changes are greatly elevated.
NG trades weather. Weather changes the most over weekends when the market is closed, so Sunday Night huge gaps up or down in the Winter happen because of that(the last one just this week).
A similar impact could happen when economic data resumes........IF the trend has shifted markedly in 1 direction since the previous report before the shut down.
So the initial resumption of economic data will carry unusually high risk upon the releases.
1. 10 years: Some trendlines. One can identify countless bull flags at different times frames along the way up. These are like waves that often follow a pattern that joj mentioned over the weekend.
2. 1 month: Record highs just above this.
The DJI and the DJT closed above last weeks' highs today; final gasp maybe ?
Neither the NQ ES or RT followed suit but instead stayed in a rather narrow range which makes today very vulnerable both up or down ....
(he's still whittling .... }
The above chart of the daily NQ shows my L to L and H to H counts , both come up with today Tuesday and tomorrow Wednesday as being potential highs, we shall soon have resolution ... !
Here was the latest today, a down day!
What do you think, kris?
I continue to be amazed that the rich people's Ponzi Scheme and their power in being able to control a self fulfilling prophesy, with Trump's policies benefiting them and AI acting as fuel is keeping the stock market up here.
Major tops in most markets usually don't end by treading water for so many days close to record highs like this, then suddenly failing but anything is possible here. I think kris's assessment is probably right based on history and fundamentals. However, a manipulated market doesn't need to follow any of that.
The government shut down and lack of economic data could be part of the market being so quiet here. I've not looked at volume recently but might guess that its reduced with the reduced volatility and lack of big moves expected at near record high prices.
Lots of uncertainty for sure, including mine!
https://tradingeconomics.com/united-states/stock-market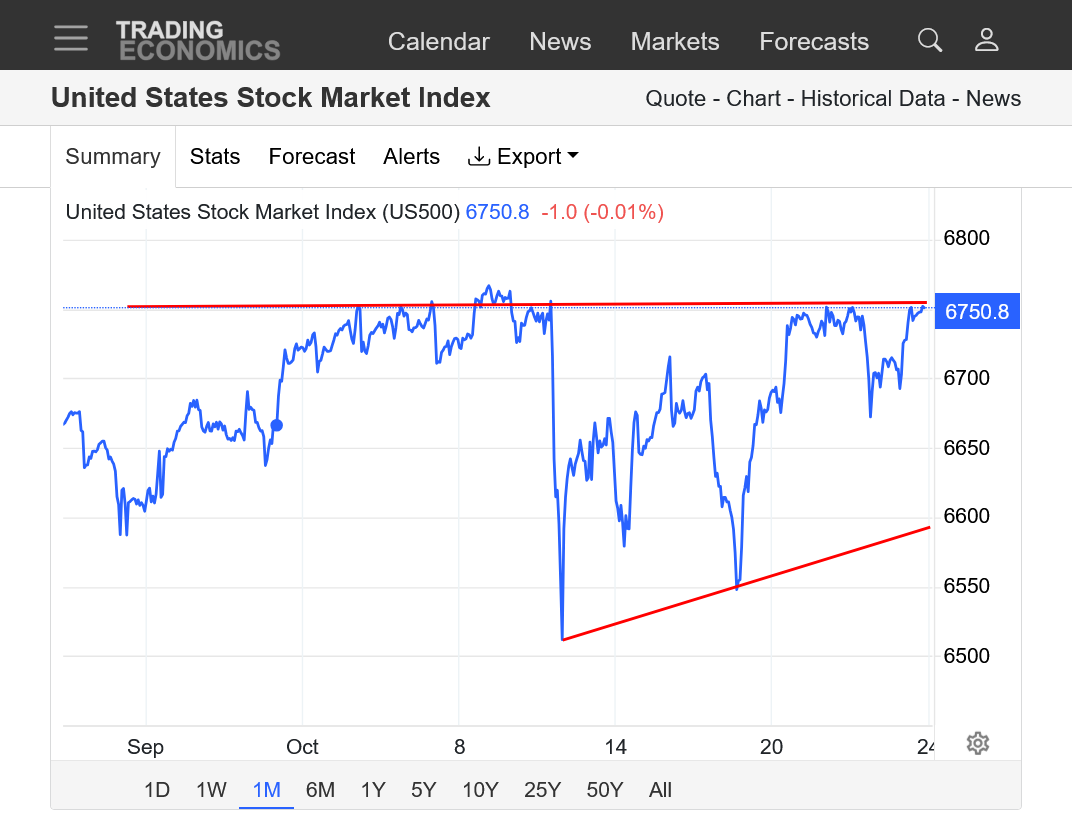
Amazingly long pause at and just below record highs, technically looks like a continuation pattern/bull flag.
News could break us in either direction. News of the government shut down ending would take us to the upside since the extended shut down, negative tariff and economic news has somehow been unable to keep us down.......so far.
Upside breakout to the bull flag(wedge) pattern identified yesterday.
Bull/bear flags are continuation patterns(temporary pauses in the trend).
https://tradingeconomics.com/united-states/stock-market
"irrational exuberance"
This market environment beats the dotcom bubble, how long can it last ?
If today's high doesn't hold then maybe tomorrow's [potential] high will, the Fed rate decision could be the catalyst for many weeks to come.
If tomorrow turns out to be another low then the first week of November could be a decisive "tell" !
"stay thirsty my friends"
Thanks very much, kris!
We started a new thread 4 days ago since this one was getting so long. I copied this last post of yours at that new thread for you.
Stock Market 10-24-25
Started by metmike - Oct. 24, 2025, 9:42 a.m.
https://www.marketforum.com/forum/topic/115443/