I don't trade much anymore but I have owned some gold as financial disaster insurance since the 1990s. My hope was (is) to pass them along to my children when I'm gone. Similarly with fire insurance on your home. You don't want to use it, but you sleep better knowing you have it.
There are always the exceptions to the rule. If someone offers me more for my fire insurance policy than the value of the home, well that's what I call "stupid valuations".
Back in the late 70s silver was a necessary metal for developing film. As you may recall silver rallied from $5/oz to $50/oz in the Hunt brothers bull market also fueled by pretty severe inflation. The story I recall was a film developer looked at his silver inventory and discovered that it was worth 3 times the value of his business. He unloaded at the top, not because he thought "this is the top". He sold because people were offering him "stupid valuations".
So what gold price would I consider to be "stupid valuations"? That is a difficult question for me to answer. I have numbers in my head like 10,000 - 15,000 per oz, but it is based on nothing. I cannot even be sure of why gold is this strong (not that it matters). I fear that this move is a canary in the coal mine that is a prelude to the world being out of whack. Scary.
Lower interest rates (potentially inflationary) are often cited as a bullish fundamental for gold. When Powell's term expires on May 15th, 2026, Trump will install a loyalist who commits to aggressively lowering interest rates sharply. (like 150 basis points from current levels). MORE VODKA in the punch bowl anyone? Perhaps that will be a sell the news event at much higher prices than here.
Gold is up 50% this year. If it accelerates, maybe 100% next year? Scary!
-----
Shorter term, CNBC is FINALLY covering the gold market with some news stories. Maybe a short term top is imminent?
Thanks for sharing this, joj!
Those are some of the most profound thoughts on gold/silver ever!
Certainly worth our "Post of the Week"
Nothing special for earning that except the moderators appreciation and recognition that your post really was profound in his/my view.
Previous thread:
Gold adjusted for Inflation
47 responses |
Started by joj - April 24, 2025, 7:18 a.m
https://www.marketforum.com/forum/topic/111451/
+++++++++++++++++++++++++
Last post from that thread that is still valid for the first response to the new thread.
Re: Re: Re: Re: Gold adjusted for Inflation/silver
By metmike - Oct. 7, 2025, 2:10 a.m.
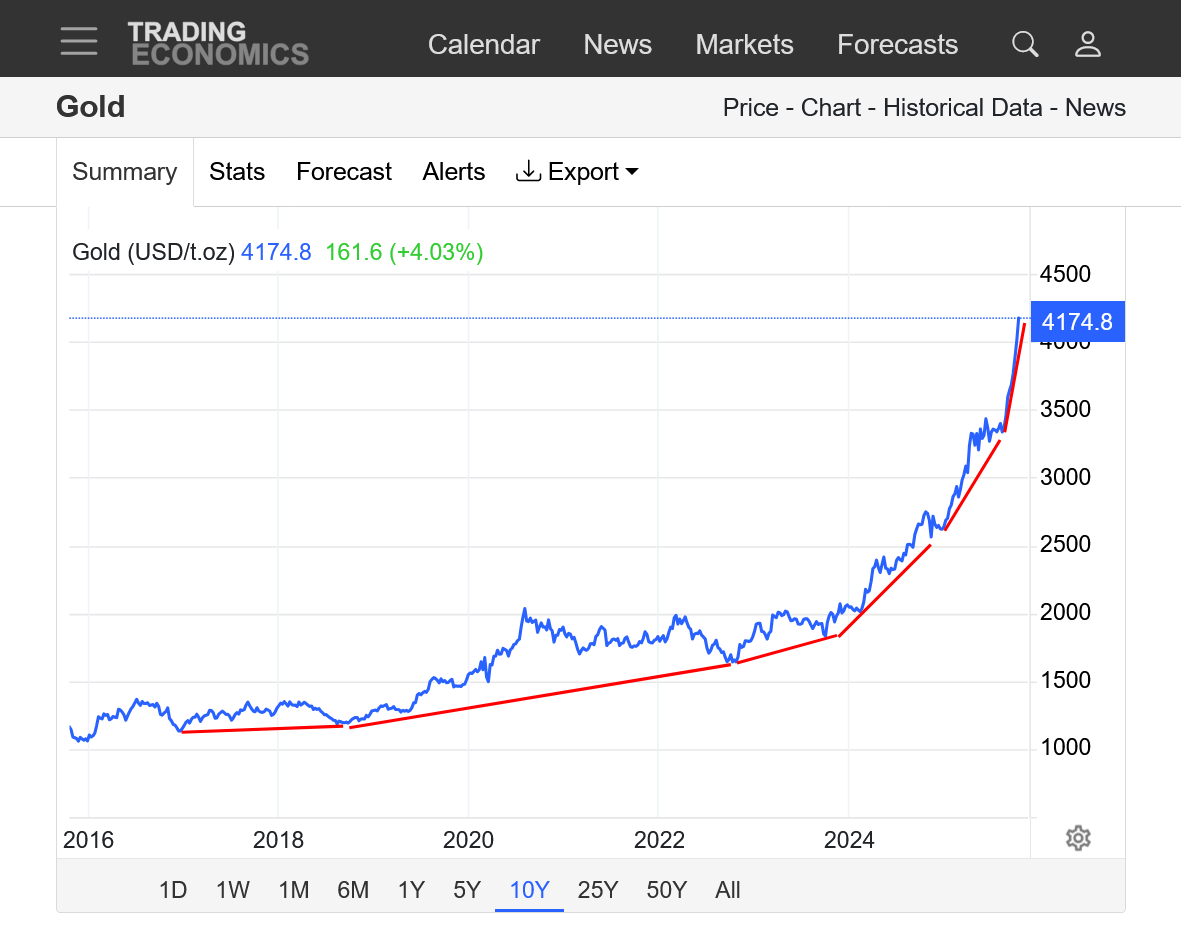
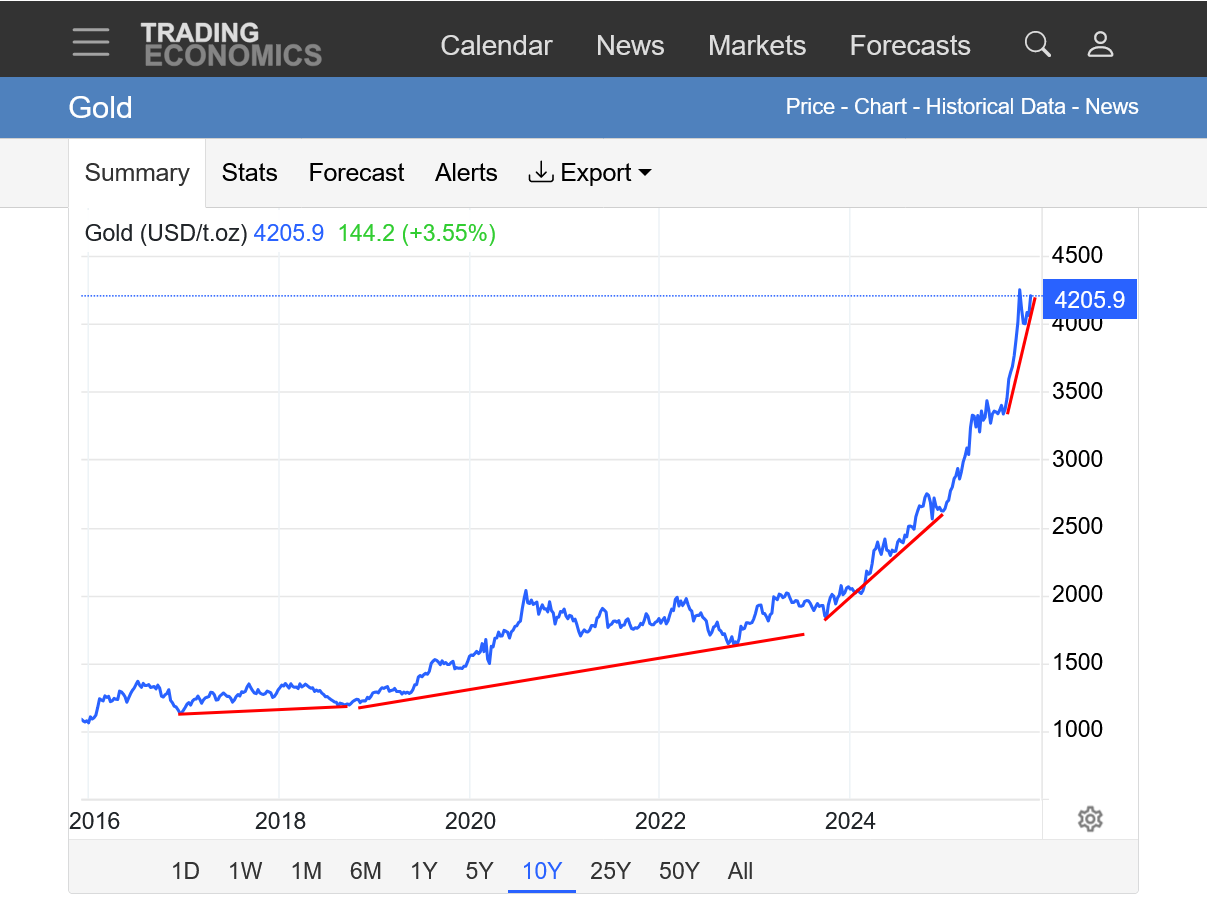
Incredible parabolic/exponential move up! Steepening uptrend slope. 3-4 times higher price compared to a decade ago.
https://tradingeconomics.com/commodity/gold
+++++
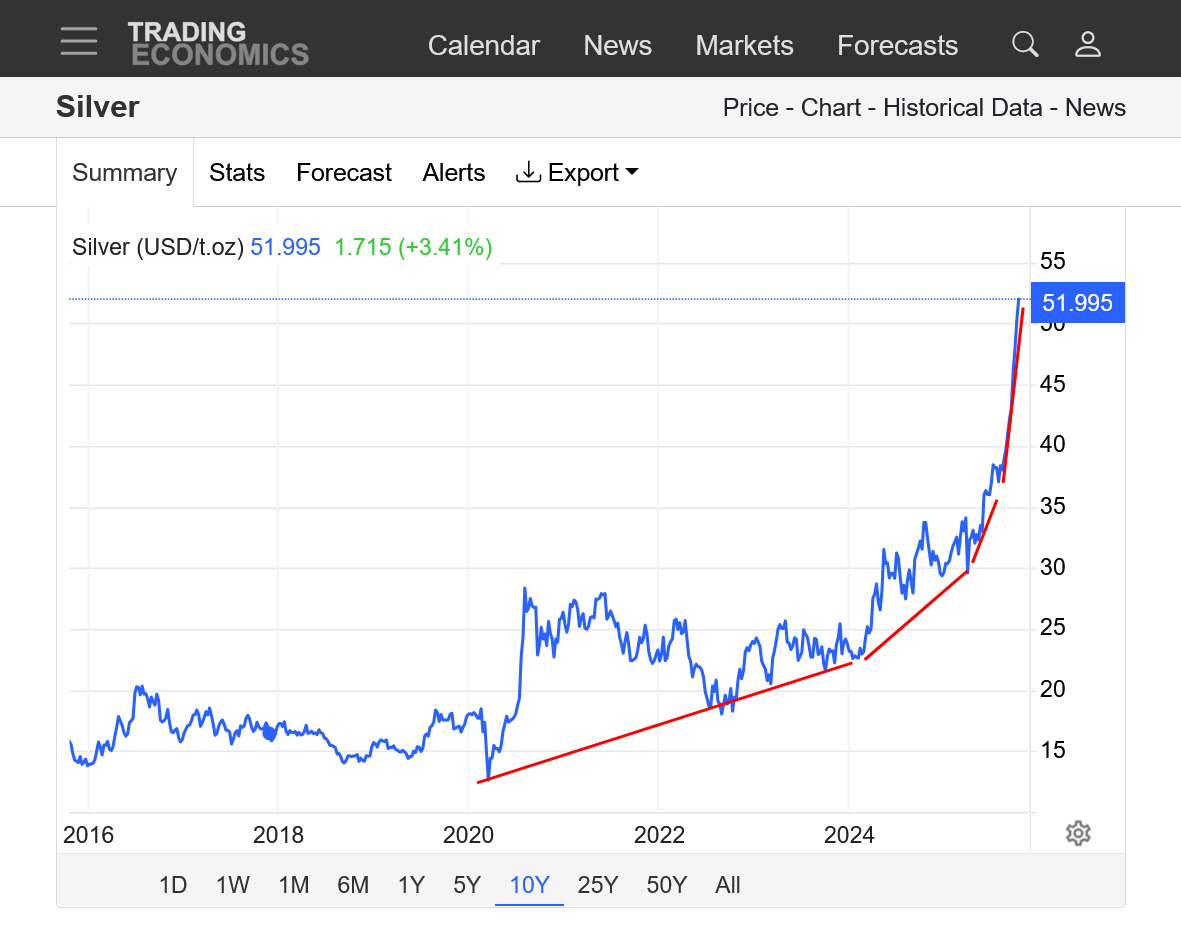
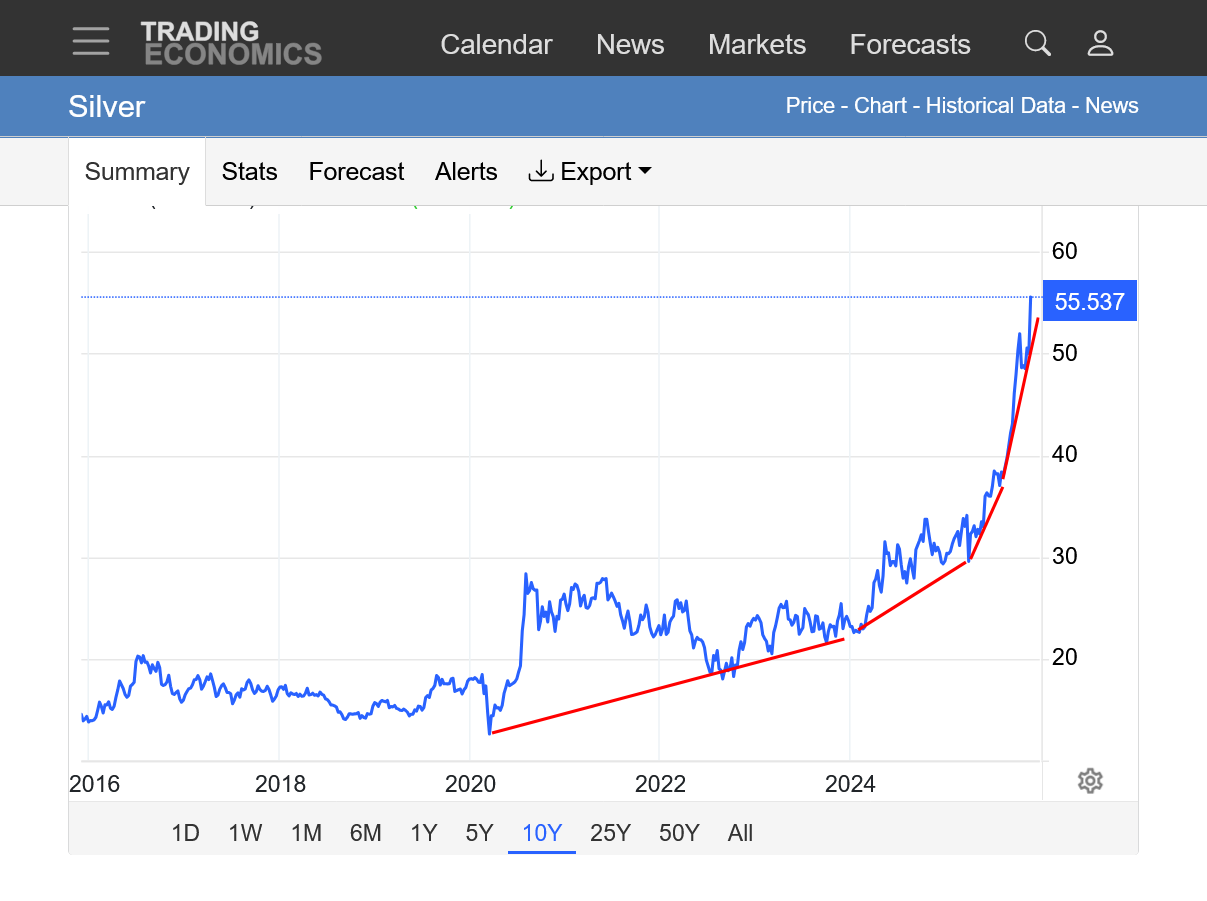
Same thing with silver! WOW!
https://tradingeconomics.com/commodity/silver
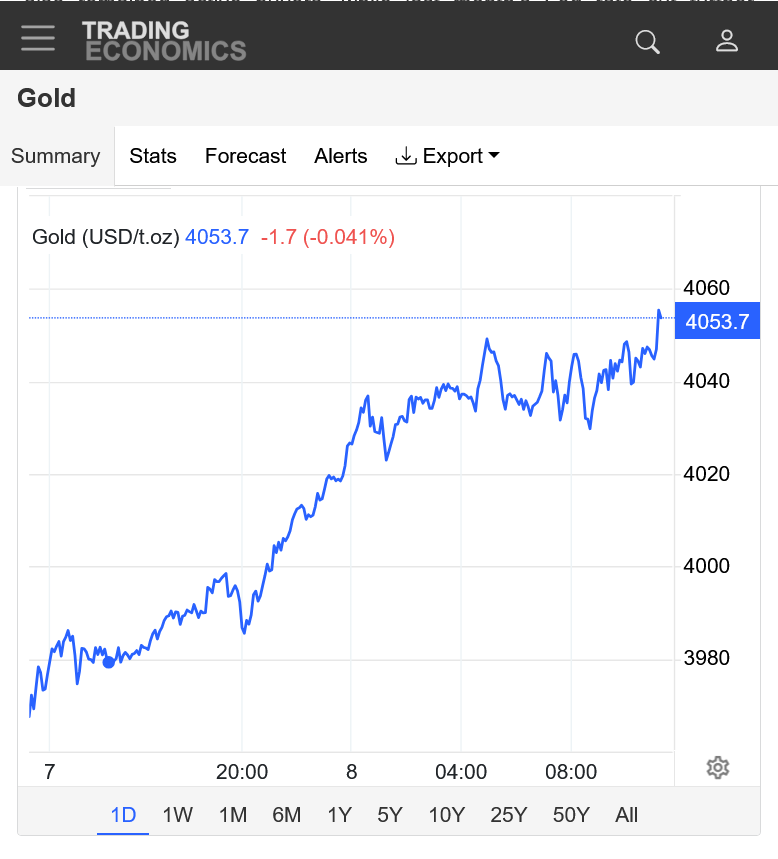
Gold today is soaring higher!
Historic day!
https://tradingeconomics.com/commodity/gold
1.1 day
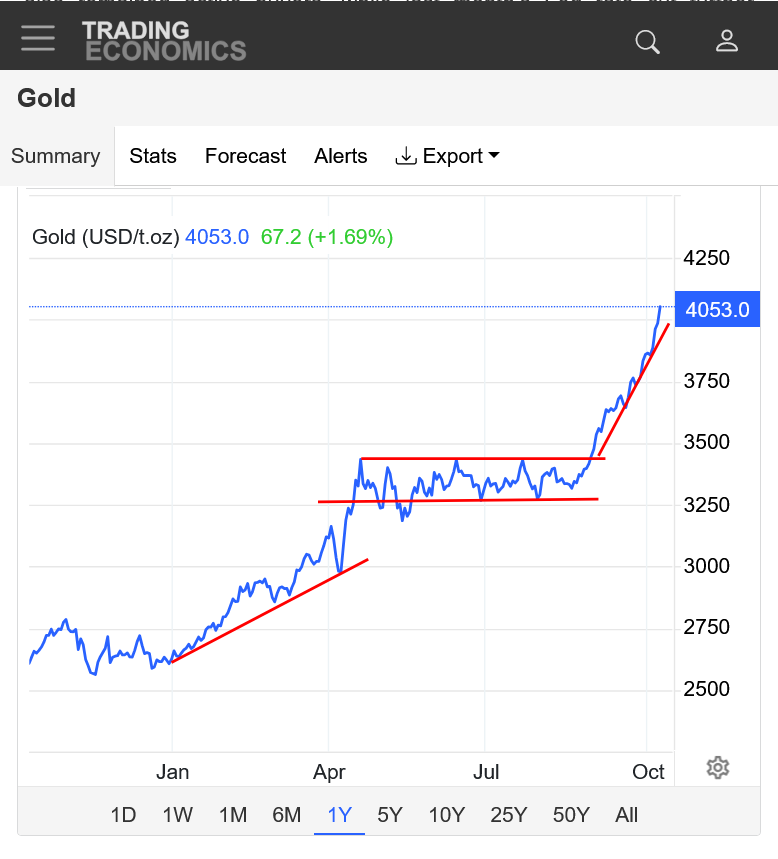
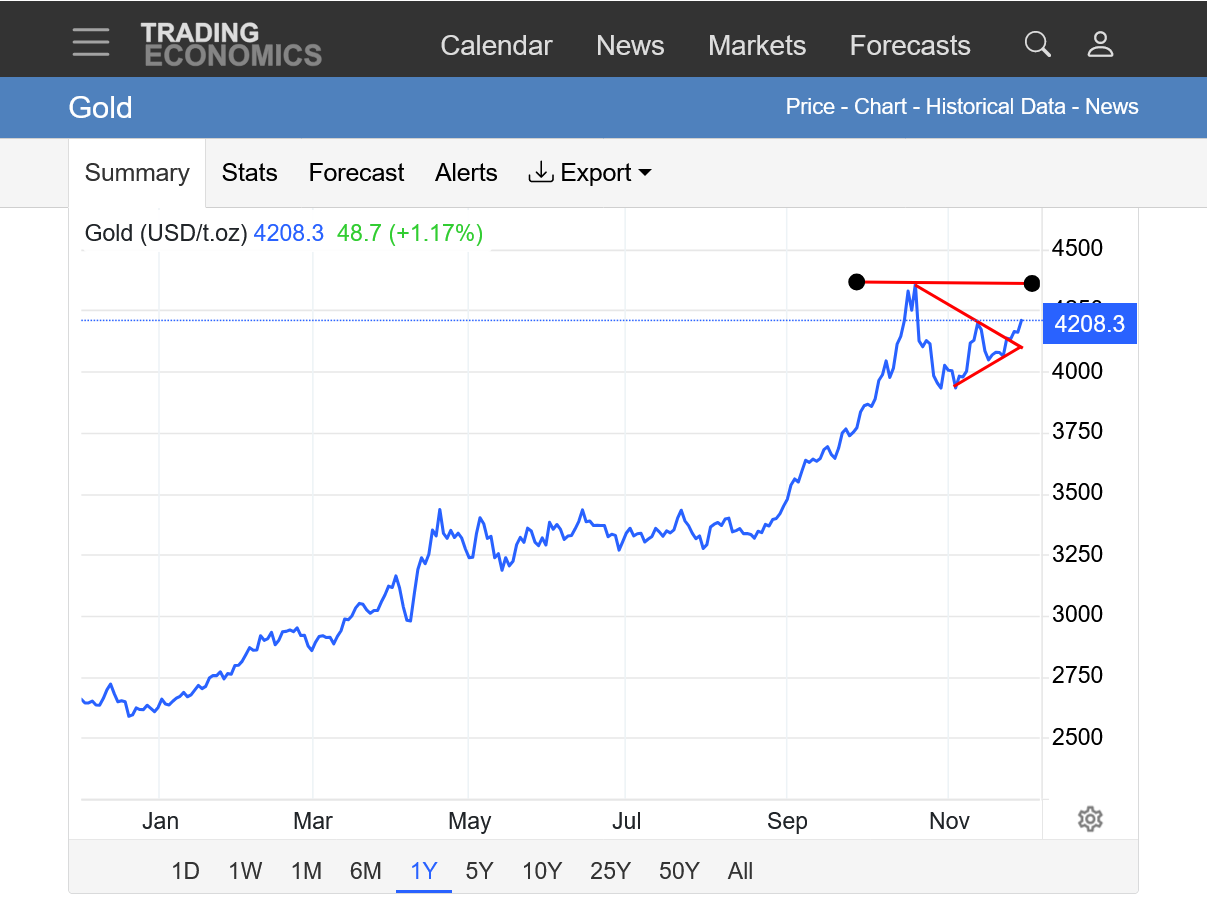
2. 1 year
Top is in for gold. At least short term???
https://tradingeconomics.com/commodity/gold
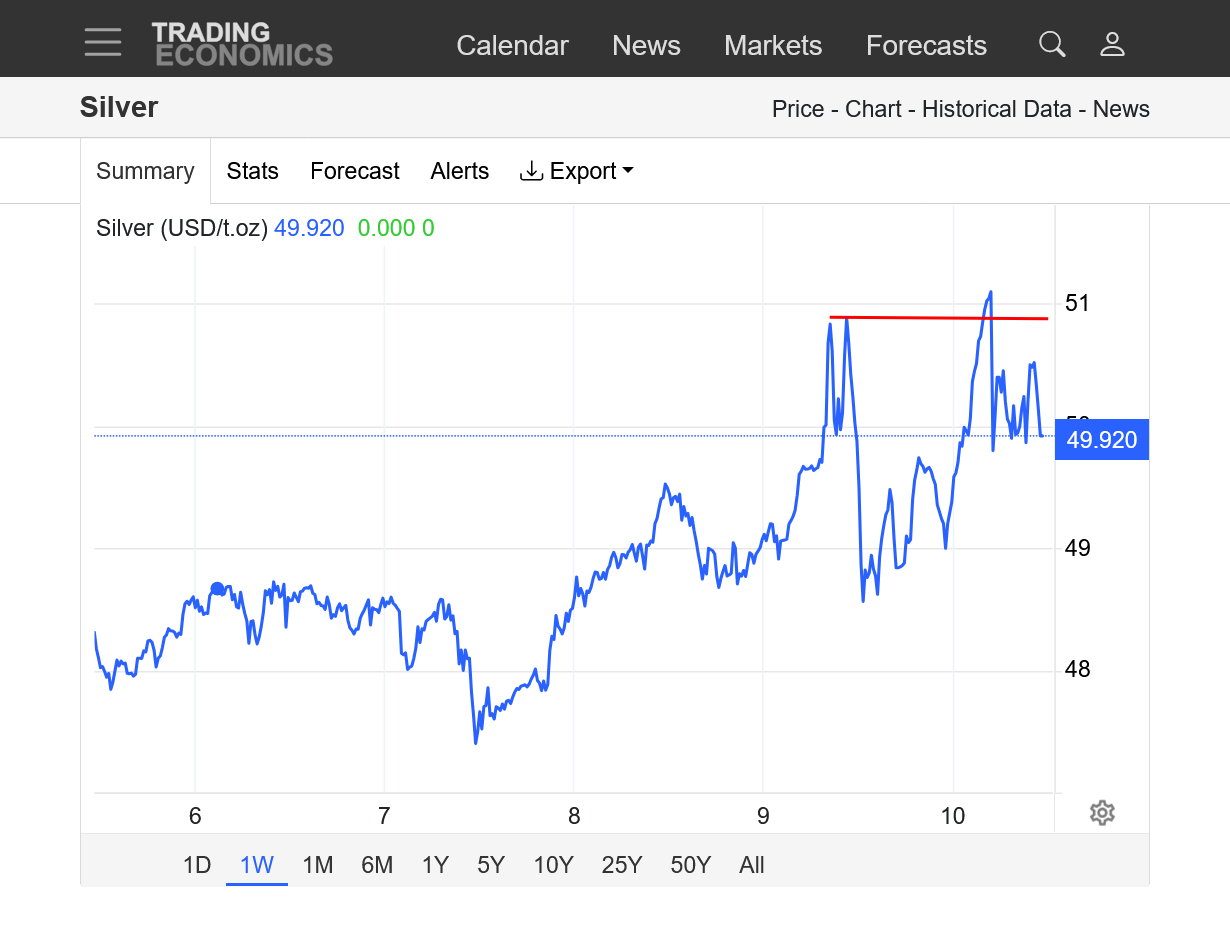
Silver hit new all time high before reversing lower:
https://tradingeconomics.com/commodity/silver
This particular trading strategy would have been very profitable in gold/silver today. I have never traded the metals.
By metmike - Oct. 9, 2025, 11:11 a.m.
Has anybody else read this book?

I got it when it first came out almost 3 decades ago and the stock market at this moment reminds me of one of the trading signals that Linda Raschke suggested using.
When a market breaks out to a new high but then trades BELOW that previous high with no follow thru because the buying has been exhausted, SELL THE MARKET and put a buy stop above the new record high set earlier that day.
I've watched the markets and seen that trade work many times.
The nicest thing about it is the well defined, low risk and potentially very high rewards to this trade. I don't trade stocks but selling right now with a stop above the highs earlier today would be the position outlined above from Linda!
I am not recommending that, just having fun with the analysis of this market as it trades with unprecedented craziness.
That reversal and short term high in gold lasted for..........1 day
We're back above 4000 and have NEGATED part of the reversal down, top formation from yesterday.
This is a market that still has more buyers that will still buy at these lofty levels.
However, this could also be a topping formation too. Only time will tell.
https://tradingeconomics.com/commodity/gold
How about that silver. WOW!
Today's high COULD HAVE been a double top, however like the gold market, we apparently still have traders that will buy aggressively at the market even at this lofty prices.
https://tradingeconomics.com/commodity/silver
I have that book on my bookshelf. Lots of other trade ideas. Been 25+ years... I'll have to give it another read soon.
Thanks, joj!
I think the trading environment has changed a great deal over the past 3 decades since that wonderful book came out but there are still some great trading ideas. Even more so, trading rules about risk management and so on that will always be valid.
Here's a few of them:
https://sobrief.com/books/street-smarts
+++++++++++++
As a meteorologist trader that exclusively uses the impact of weather on certain markets(not as active anymore), my particular method trumps everything else but there is so much to learn about markets from this book. Even a non trader that is just interested in learning about the markets will get more than their money's worth in the form of authentic knowledge that can be applied for the rest of their lives and used as a good source to reach discernment.
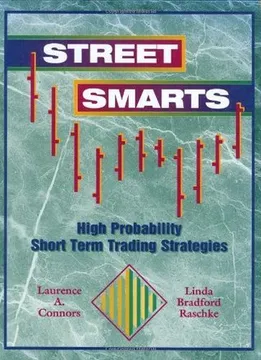
Gold and Silver off to very strong starts to the trading week!
New all time highs for gold and silver!
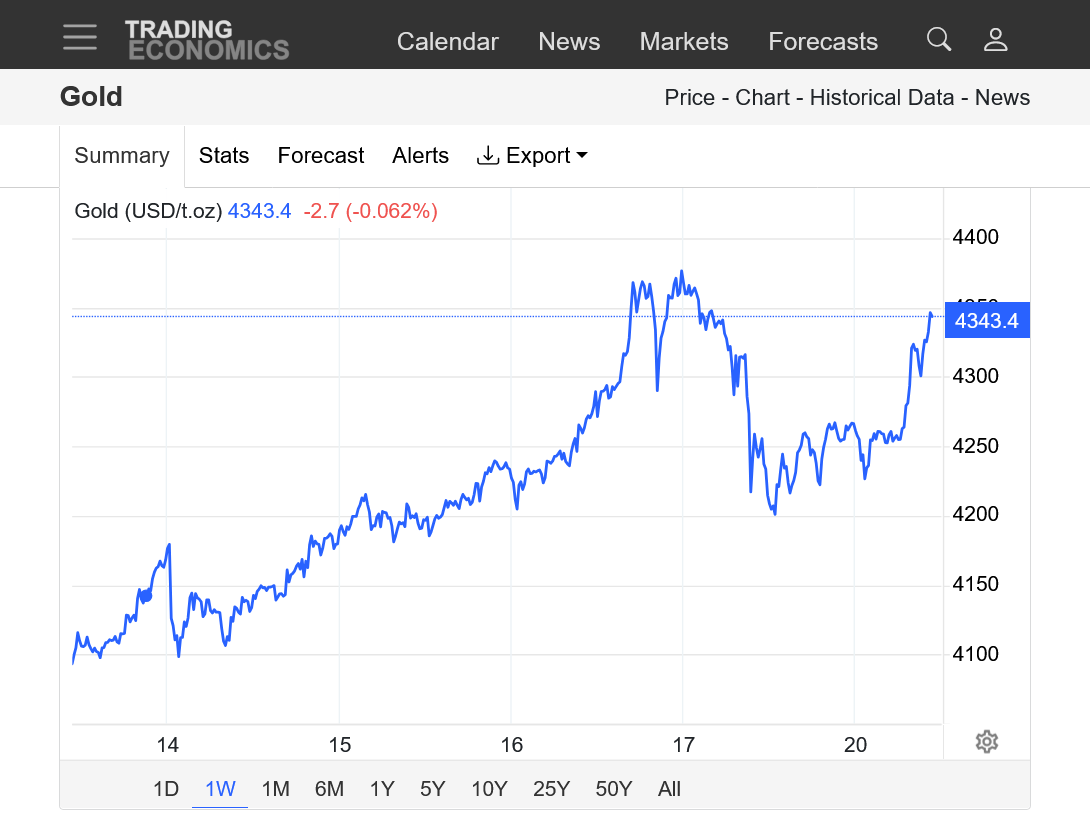
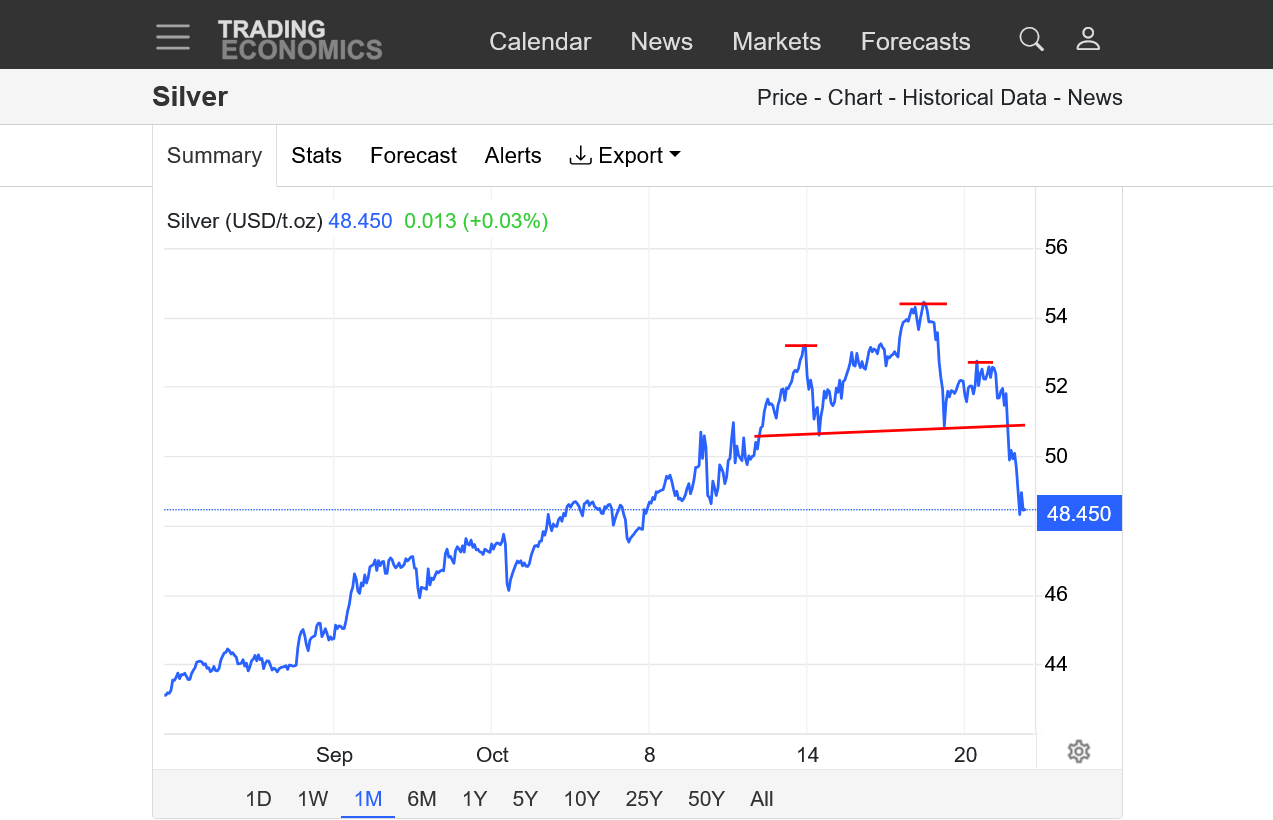
Prices for the last week are below. Red lines are last weeks all time highs.
Amazing comebacks from reversal down price bars last week!
Some of the daily ranges in price recently are more than the YEARLY ranges in price a decade+ ago for some years!
At all time highs, the volatility is expected to be "off the charts"! I can imagine that options, both calls and puts must be priced in the stratosphere right now.
https://tradingeconomics.com/commodity/gold
https://tradingeconomics.com/commodity/silver
Up $133 as I post.
I follow options implied volatility in gold.
It bottomed around 9.5% around the time gold was about to launch from the 2000/oz level. During the 4 month sideways this year it was between 14-16%, which was a good short, until it wasn't. Coming into today gold was about 20% on calls and silver was trading at 37% implied volatility. It's pricey, but it hasn't blown up yet. I would call 50% in gold a blow up.
By the way, the US dollar is higher today, even though pundits keep on with the tired analysis that the gold is strong because the US $ is weak. It is not. It has been sideways for months.
Don't ask me why gold is so strong, I haven't a clue. But it does scare me a little.
Thanks for a wonderful response into an aspect of this (options) that provides unique, valuable insight to this historical move higher.
There have been a couple of historical spikes higher in the past for metals that traders and historians have discussed for decades AFTER it happened, with the spikes higher being short blips in actual time on the price charts, especially as they got farther away in the rear view mirror.
In 2025, we are currently living, in REAL TIME at an historical moment that is making record highs on the price charts. In the history books this will be studied and analyzed for decades to come. That does not happen very often in history and we are living it. From that aspect, it's fascinating and fun/challenging to follow and analyze it. Profitable for traders on the right side(the opposite on the wrong side). I don't trade metals.
That's the reason to appreciate the significance of the current move for most of us following it daily. But it can seem to just be old news or like a broken record.
Historical highs X times in a row gradually become the NEW NORMAL compared to the first time.
This is the complete opposite of NORMAL as judged from what we would prefer in our NORMAL past.
Much of this is the result of chaos and uncertainty in the world, especially caused by the the most powerful person on planet who suffers from dementia and pathological/delusional thinking, along with him NOT being restrained by Congress because both houses are from his party and they are colluding with him on some ruinous agenda.
Damaging tariffs are at the top of that list because he's punishing his own country and all the other countries that benefit from free trade using deranged thinking. I would venture to guess if the tariffs were removed, for instance the highs would likely be in for gold and silver.
When a market is trading emotions and politics its less predictable. in this case, its extremely unpredictable with the leader of the free world potentially saying anything on any day and sometimes saying the complete opposite of that the next day.
Attacking China on Friday with new tariffs-then telling us he wants China to do well on Sunday, as if he didn't mean a word of what he stated 2 days earlier. Having changed the tariffs on them half a dozen times this year based on impulsive thoughts in a pathologically thinking brain-the most powerful brain in the world!)
MM,
You may be correct that the gold move could very well be connected to the whims of Captain Crazy Pants, also known as the leader of the free world.
And I like your observation about the brevity of time that these spikes have transpired historically. That briefness in time is a challenge to me as a holder of cash gold. If a spike and collapse is going to unfold, what chance do I have of timing my exit well? Not likely to be honest.
I have another criteria for attempting to time the "stupid valuations" which I will now share.
Once upon a time the US dollar was backed by gold, hence the term greenback. People had confidence in the paper currency because they trusted gold. Then in the Nixon administration, the exchange rate was "floated" because the US could no longer make good on all the gold redemptions for currency. So the supply of money has obviously grown over the years and probably more of an increase than the price of gold, although there is additional gold mined over the years.
I went on ChatGPT (I know... it might not be accurate) and I asked how much currency (by broad M2 type of measurements) there is in the world and it responded with a range of between 95 trillion and 123 trillion (in US dollars but including all monies). Then I asked how much gold is currently above ground. It responded with approximately 6.6 billion ounces. Soooo.... If you divide the money supply by the number of ounces (currency backed by gold) you get a range of......
$14,380 to $18,636 per ounce.
joj,
Thanks for giving us more of your unique and profound thoughts. You clearly understand the gold and silver markets better than almost everyone (including me).
Great to have your valued thoughts!
These updated price charts show a pattern that is extraordinarily rare in the stock/commodity price world!!
https://tradingeconomics.com/commodity/gold
1. 10 years: Exponential/parabolic move higher with the uptrend getting steeper and steeper and steeper. Appearing to go almost straight up near the end. Impossible to sustain for very long but impossible to predict or time the end point. There were numerous waves/bull flags on the way up.
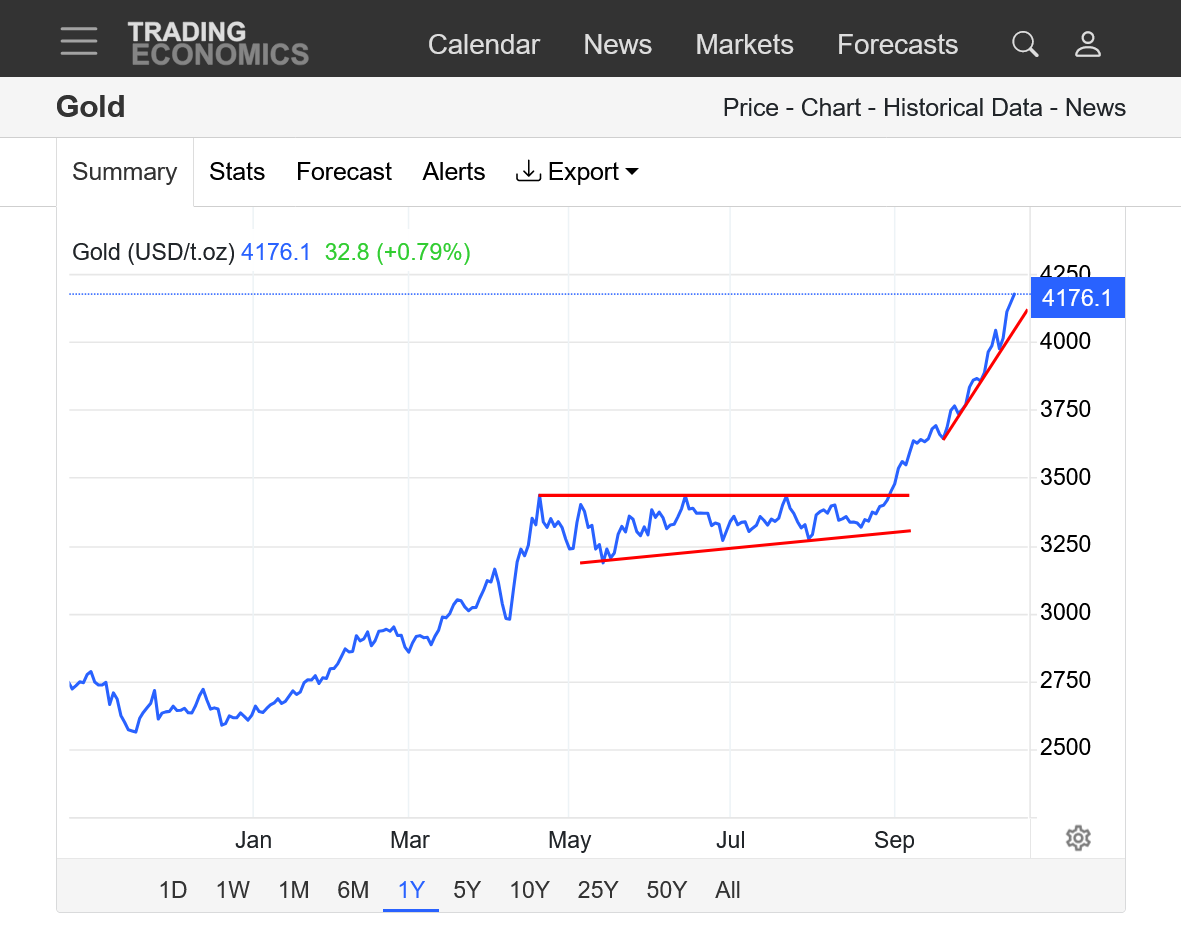
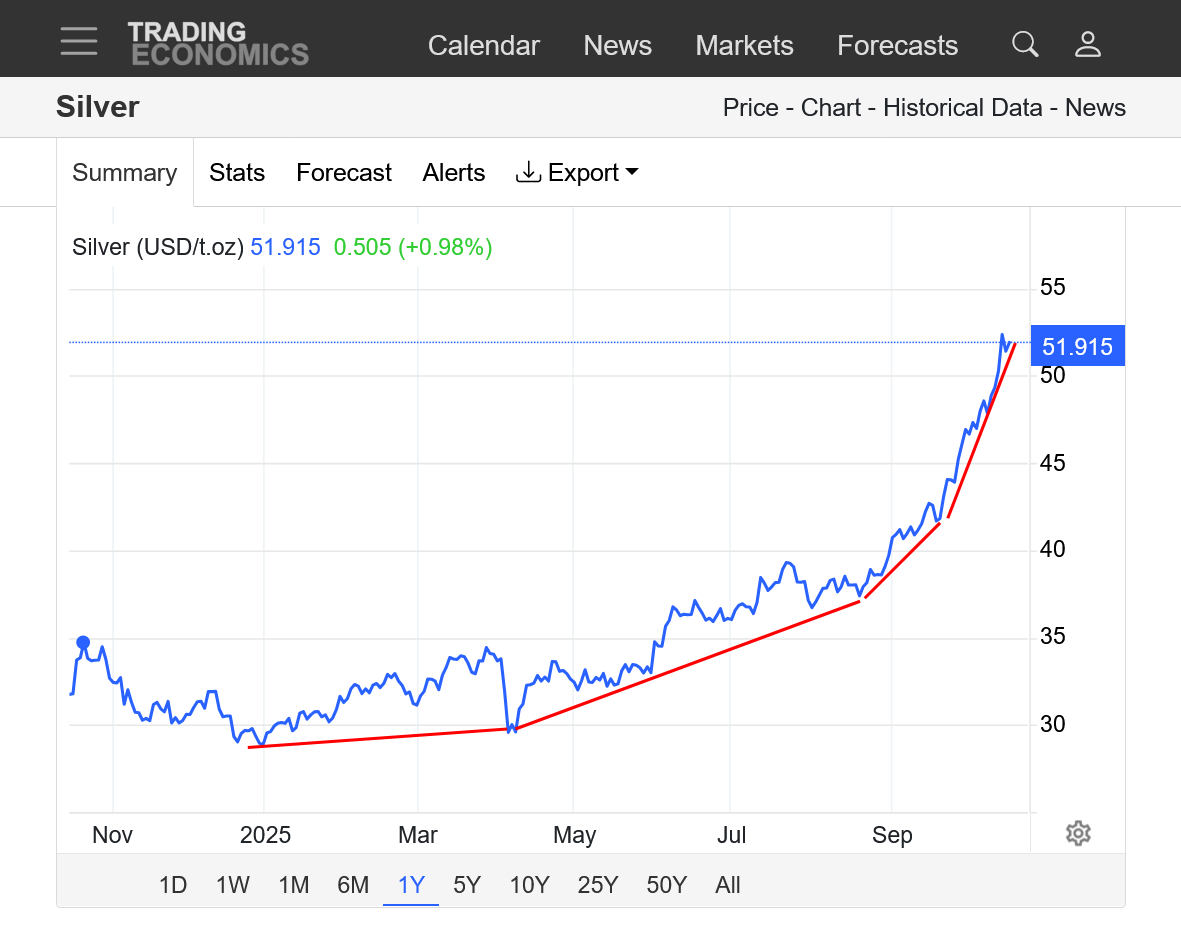
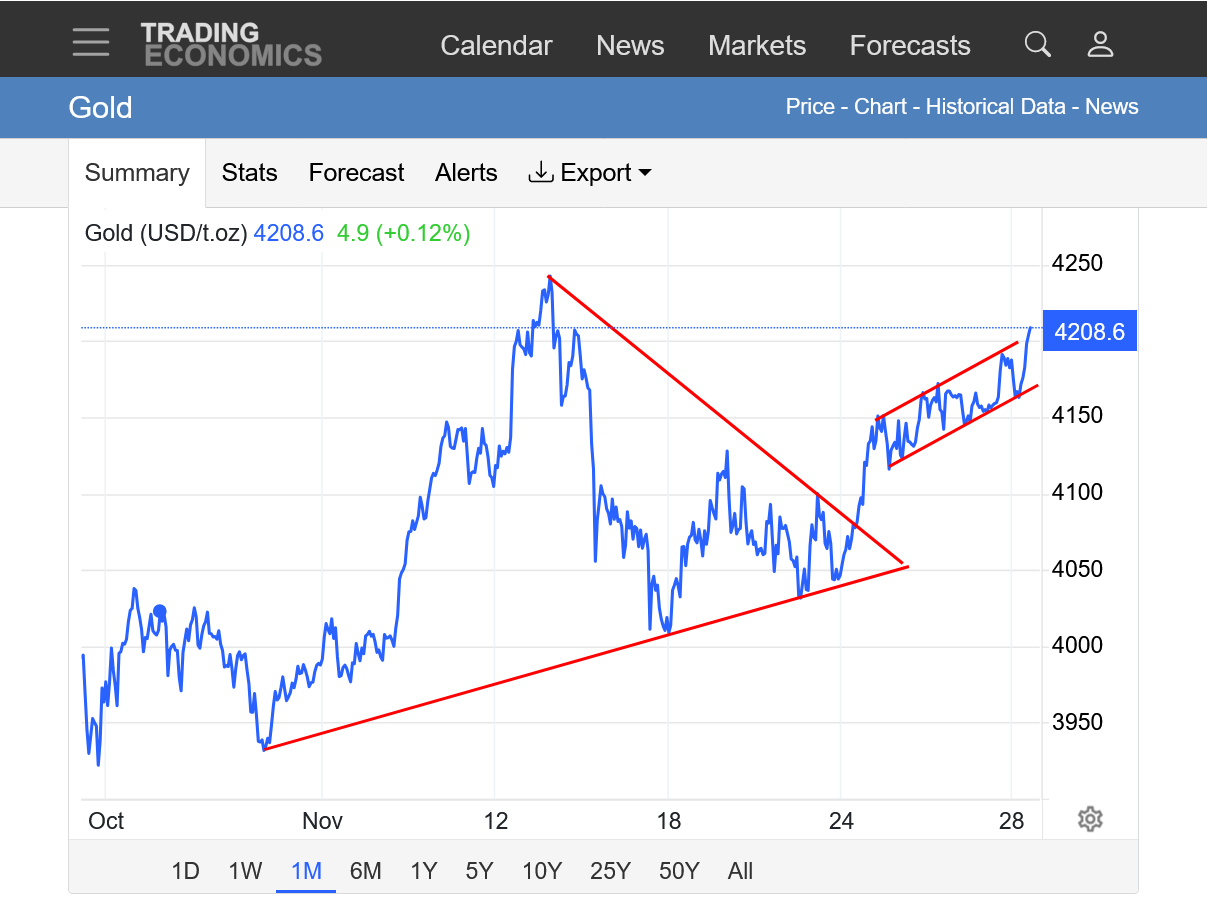
2. 1 year: May-August was one of those bull flags/wedges. We broke out to the upside around 6 weeks ago and have been following a new, much steeper uptrend line since then.
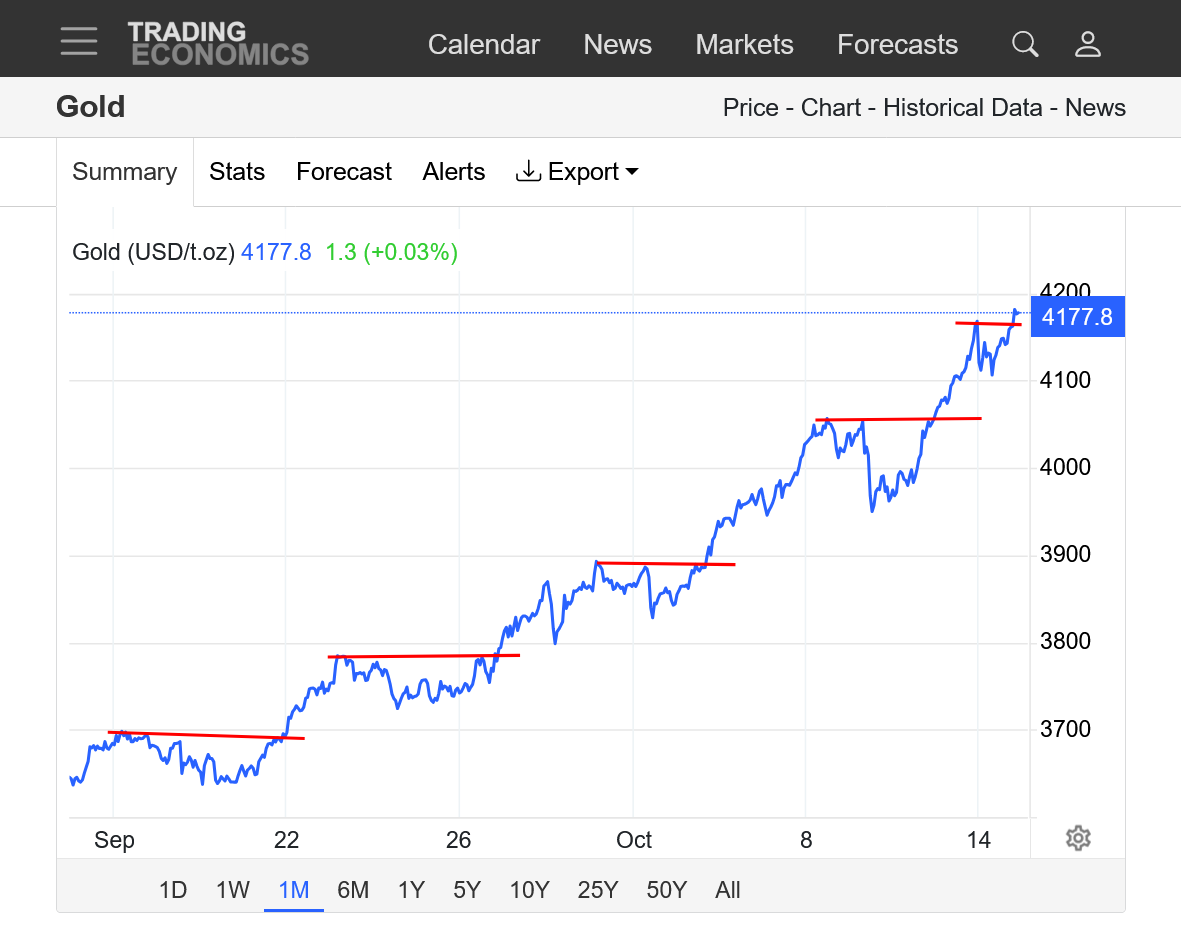
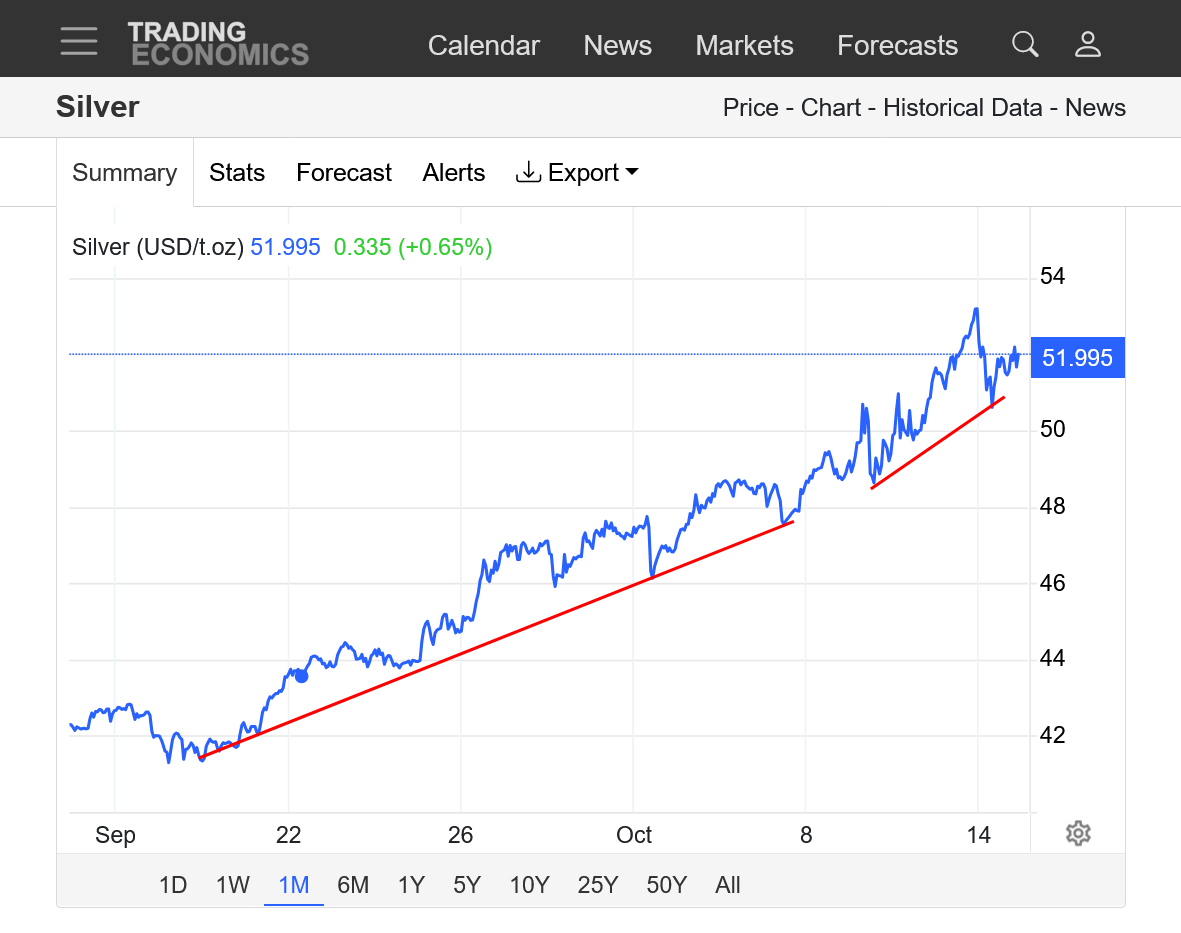
3. 1 month: 5 well defined waves/bull flags with the first 4 that look uniformly spread apart. Each red line was an upside break out of that wave/continuation pattern. This last break above the wave had a much shorter wavelength/time frame but maybe its not complete yet. Amazing!!
https://tradingeconomics.com/commodity/gold
+++++++++++
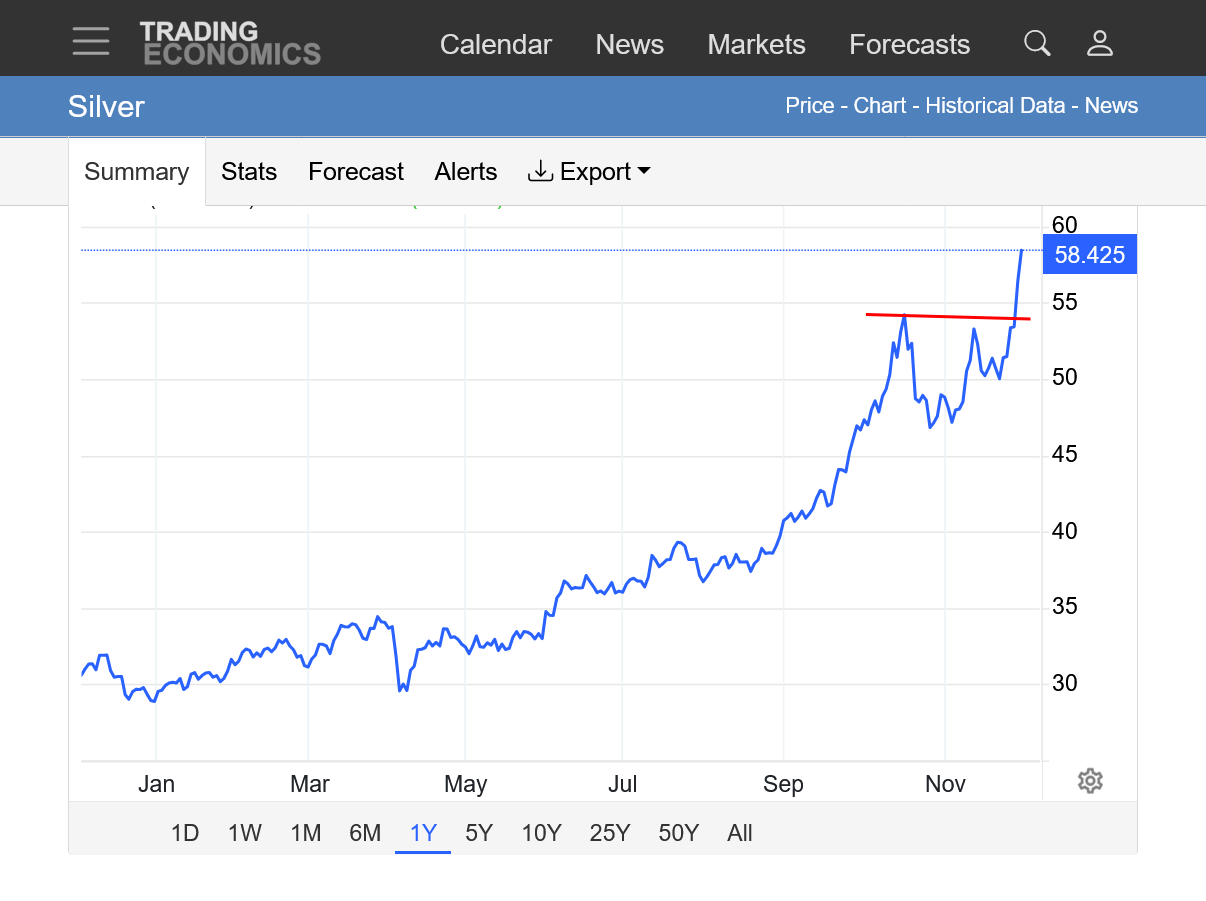
Silver took a bit longer to make all time highs and was a follower at first but now might be stronger than gold the past 6 months?
https://tradingeconomics.com/commodity/silver
1. 10 years:
2. 1 year
3. 1 month
now ready for surge -----15000 by 2028 or 37k ---war or mkt melt down Major turn feb 2026
Wow, fayq!
Where can I sell some February 2028, 37000 calls
Both gold and silver are having one of their biggest 1 day drops ever and possible reversal lower from historic highs.
Extreme volatility is expected when a market is at historic highs like this.
Is this THE top?
Despite the potential, powerful top formation signal, these 2 markets have shown price appreciation from several factors that have trumped that repeatedly.
Similar to the stock market, this can turn into a self fulfilling prophesy market where the speculative big money trades in a way that positively reinforces where traders want the market to go.
This can last for a very long time but if it increases the disparity between price and intrinsic value, corrections in price that gravitate towards true value can be brutal and fast.
The question is will there be fallow through on Monday?
The answer to your question (so far) cutworm.
Gold and Silver held and are recovering a bit of the huge losses on Friday. I won't even try to predict where we're going. Avoiding a gap lower on the open prevented a real ugly technical picture (break away gap lower, the day after a huge reversal down from record highs)
Either this is just a pause with extreme volatility or last week was the top. Other opinions are greatly appreciated since that tells us nothing.
An unprecedented gold and silver market are super fascinating to follow right now.
https://www.marketforum.com/forum/search/
https://tradingeconomics.com/commodity/silver
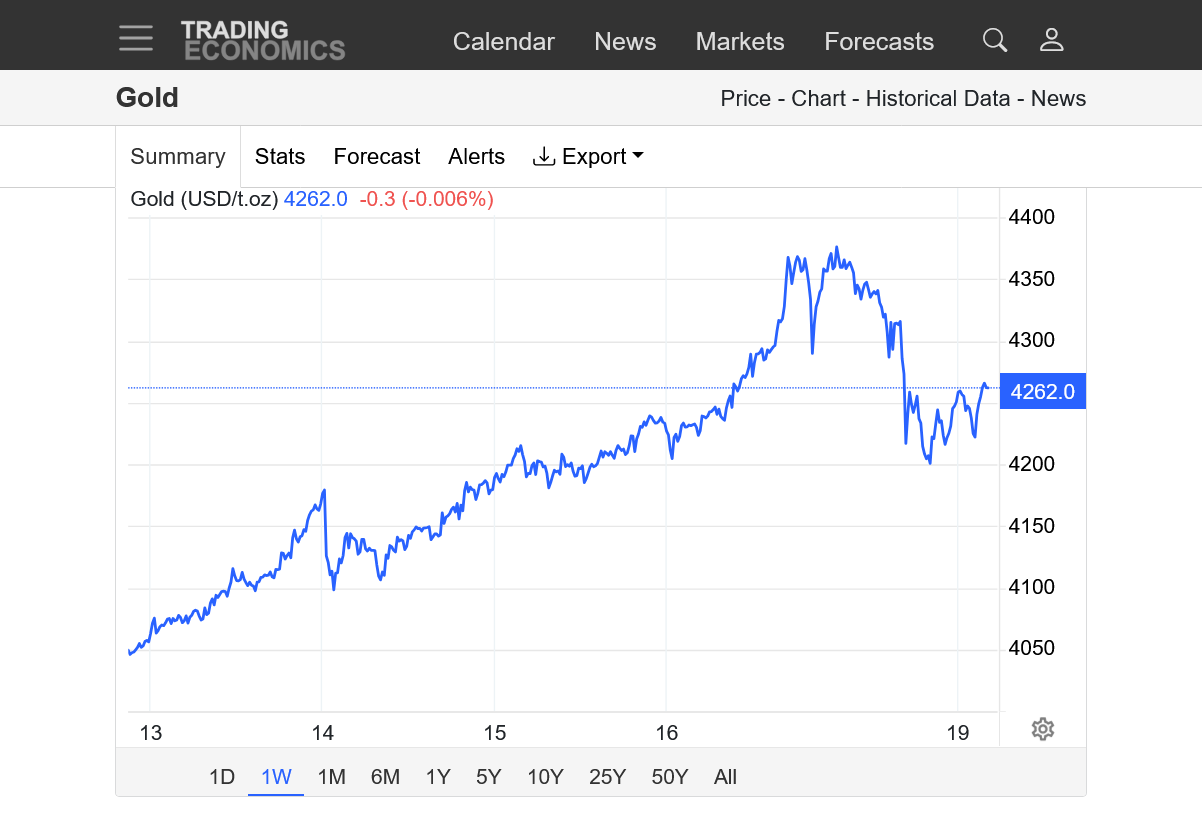
Gold has been especially strong today!!! Plenty of aggressive buyers not deterred by Friday's huge reversal down which has been rejected here on Monday.
I don't follow volume compared to previous sessions. If volume is extremely weak/low today then its a lack of sellers causing this huge bounce. High volume tells us its from really strong buying and is usually a more solid indicator of reinforcement of that days trading bar.
https://tradingeconomics.com/commodity/gold
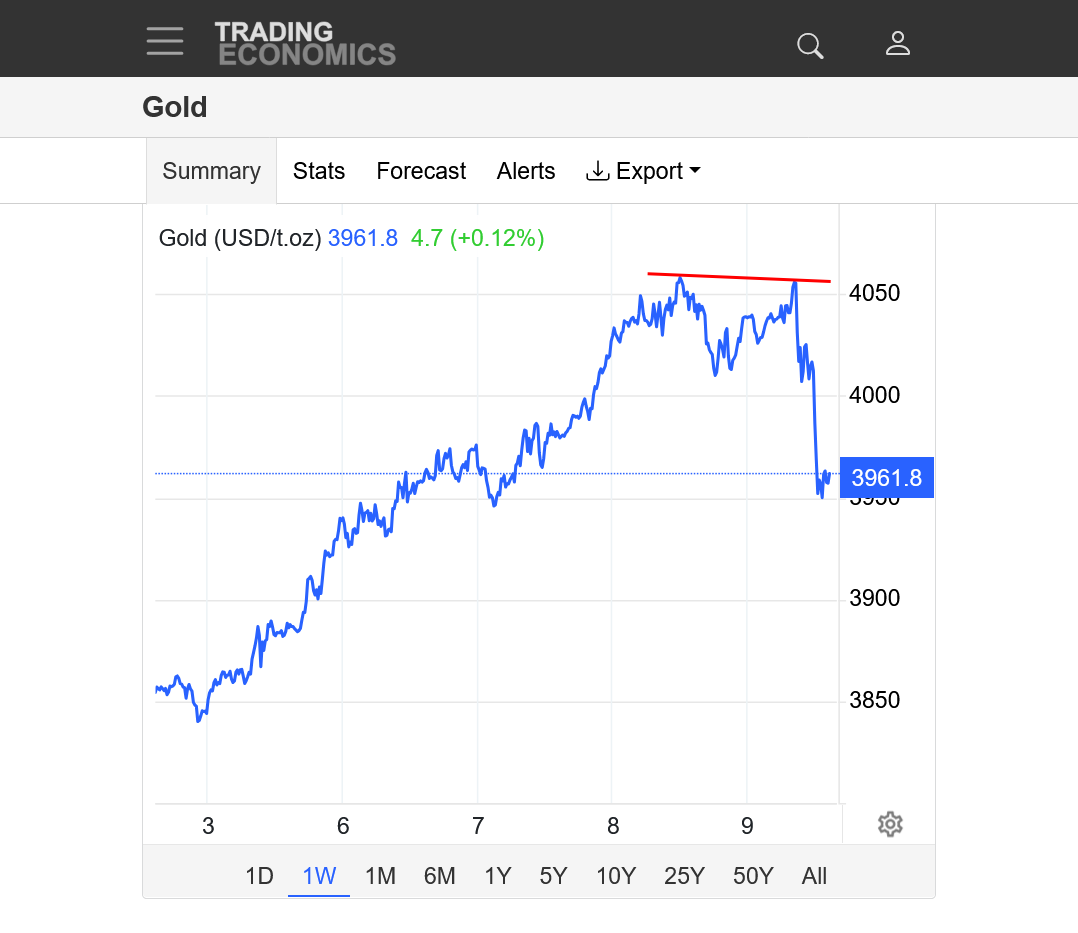
GOLD
If gold can come back from this sell off it will really be impressive!
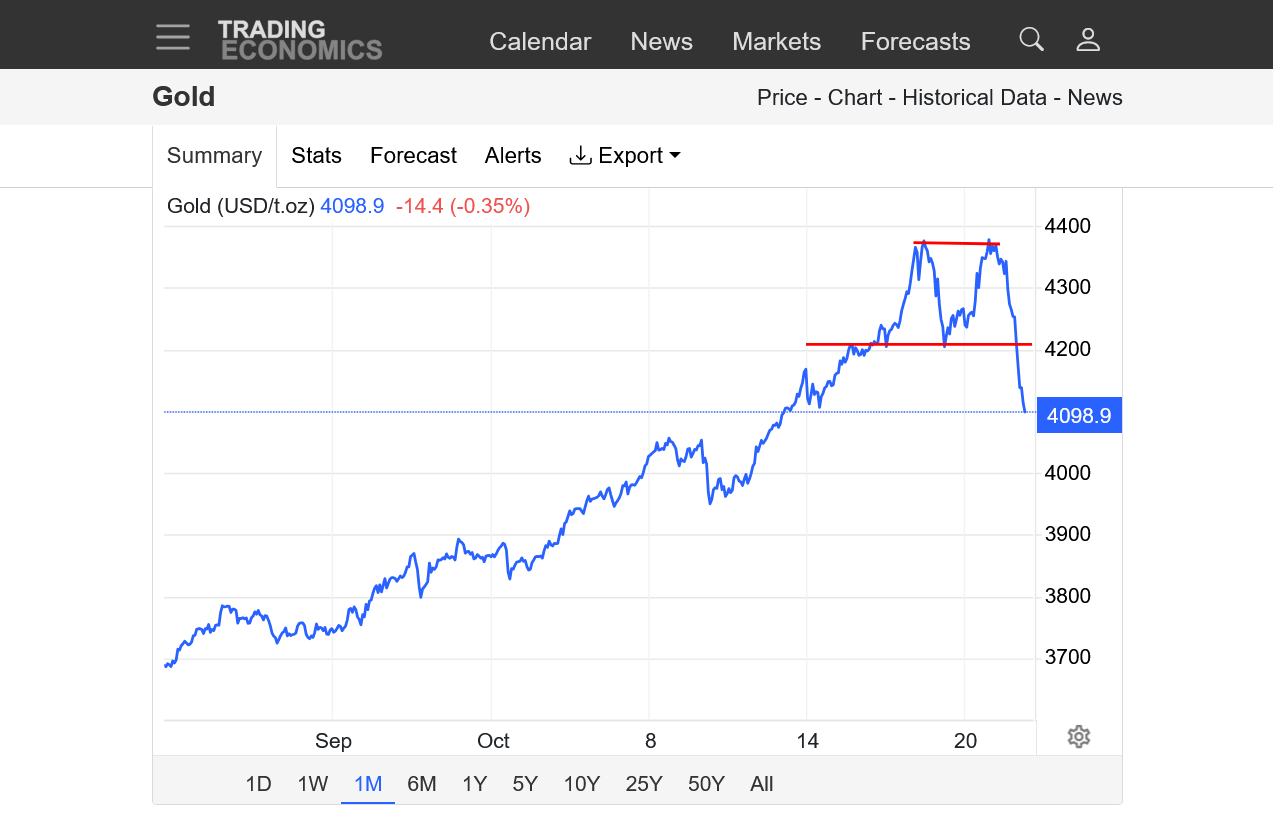
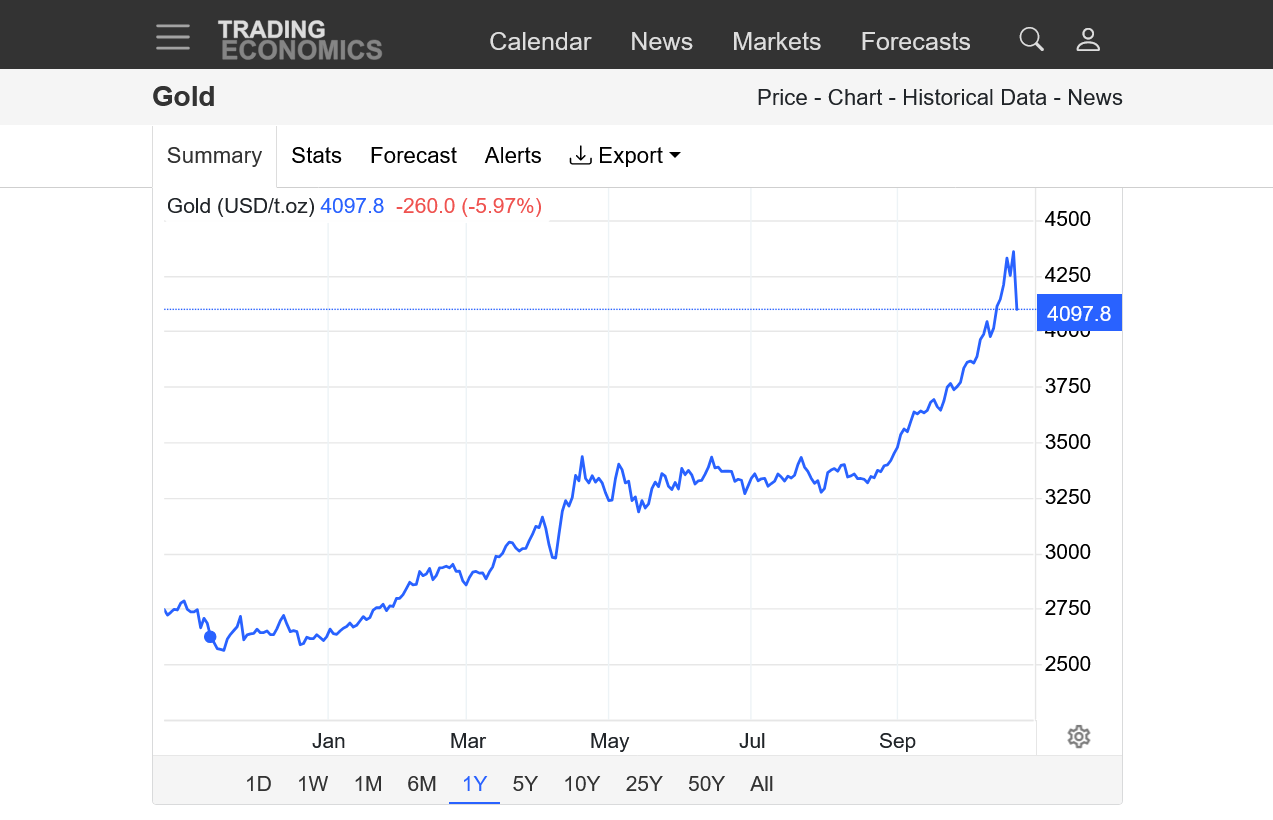
https://tradingeconomics.com/commodity/gold
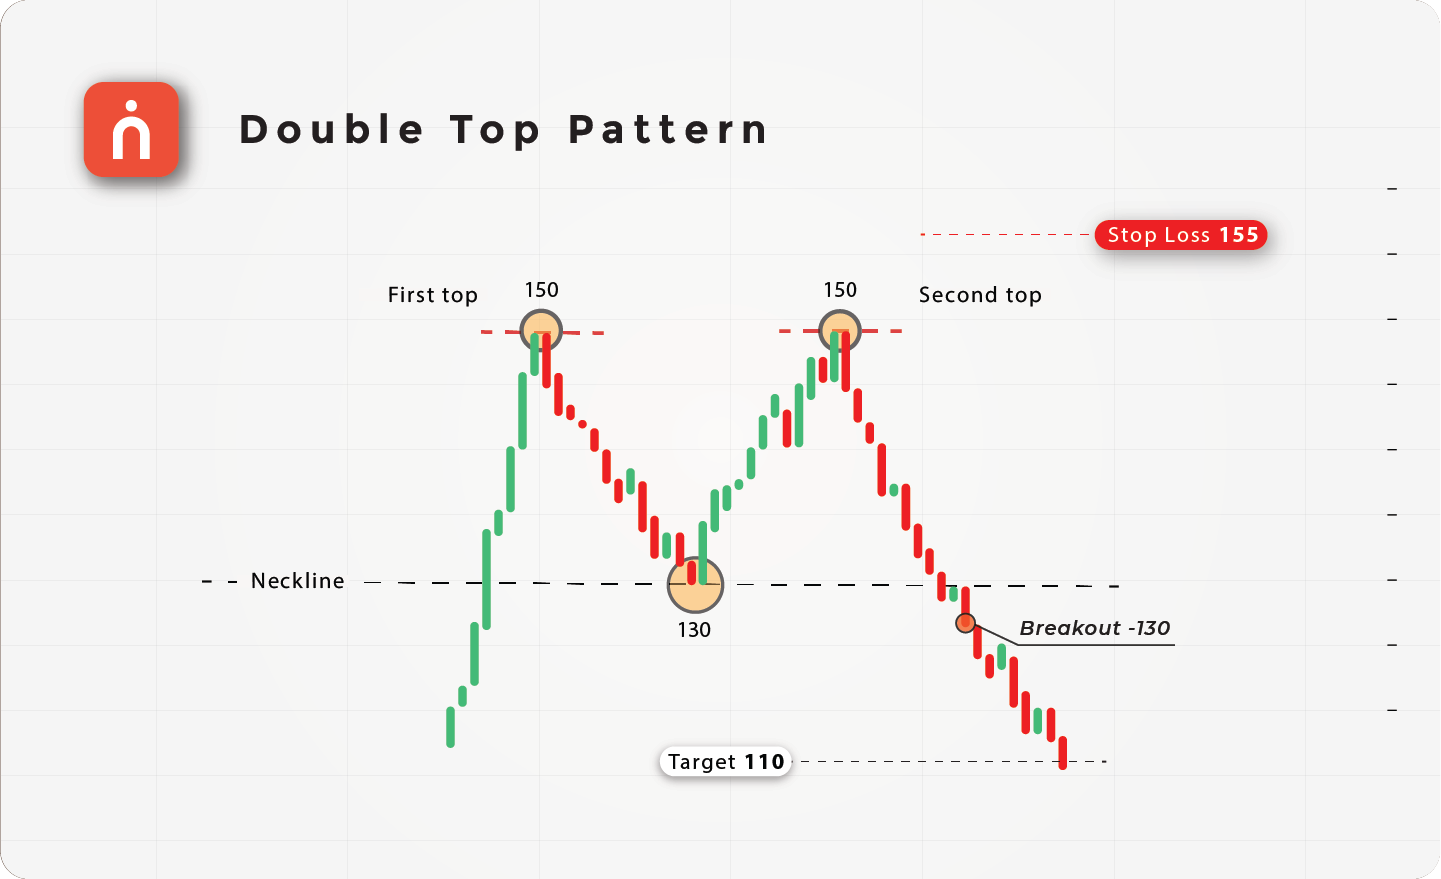
1. 1 month: Classical double top! Crashing thru the lows of the previous reversal down, which is considered the neckline for this well known pattern.
2. 10 years: Biggest 1 day loss/drop in history?
https://navia.co.in/blog/understanding-double-top-pattern-technical/
++++++++++++++++
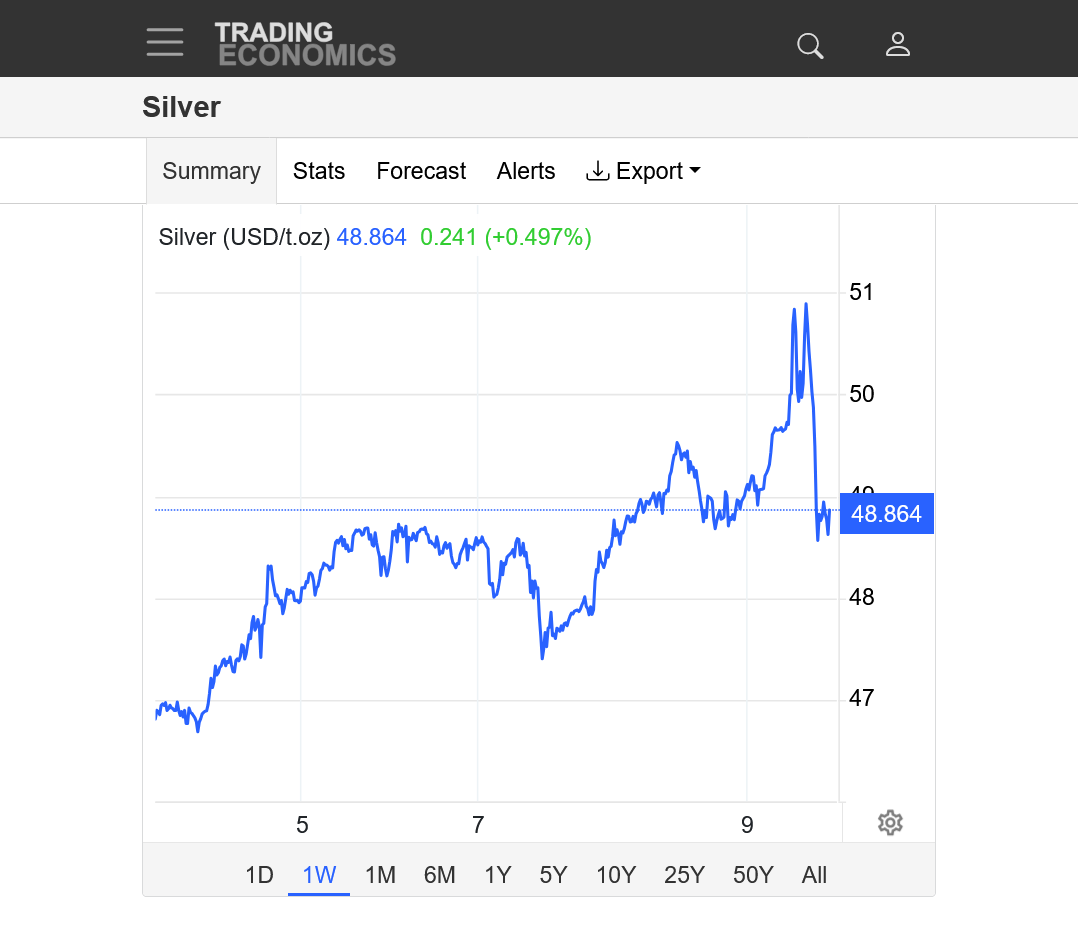
SILVER
https://tradingeconomics.com/commodity/silver
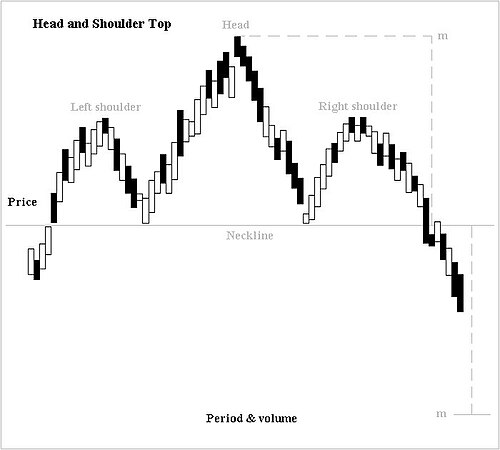
1. 1 month: Head and shoulders top. Crashing thru the neckline
2. 1 year
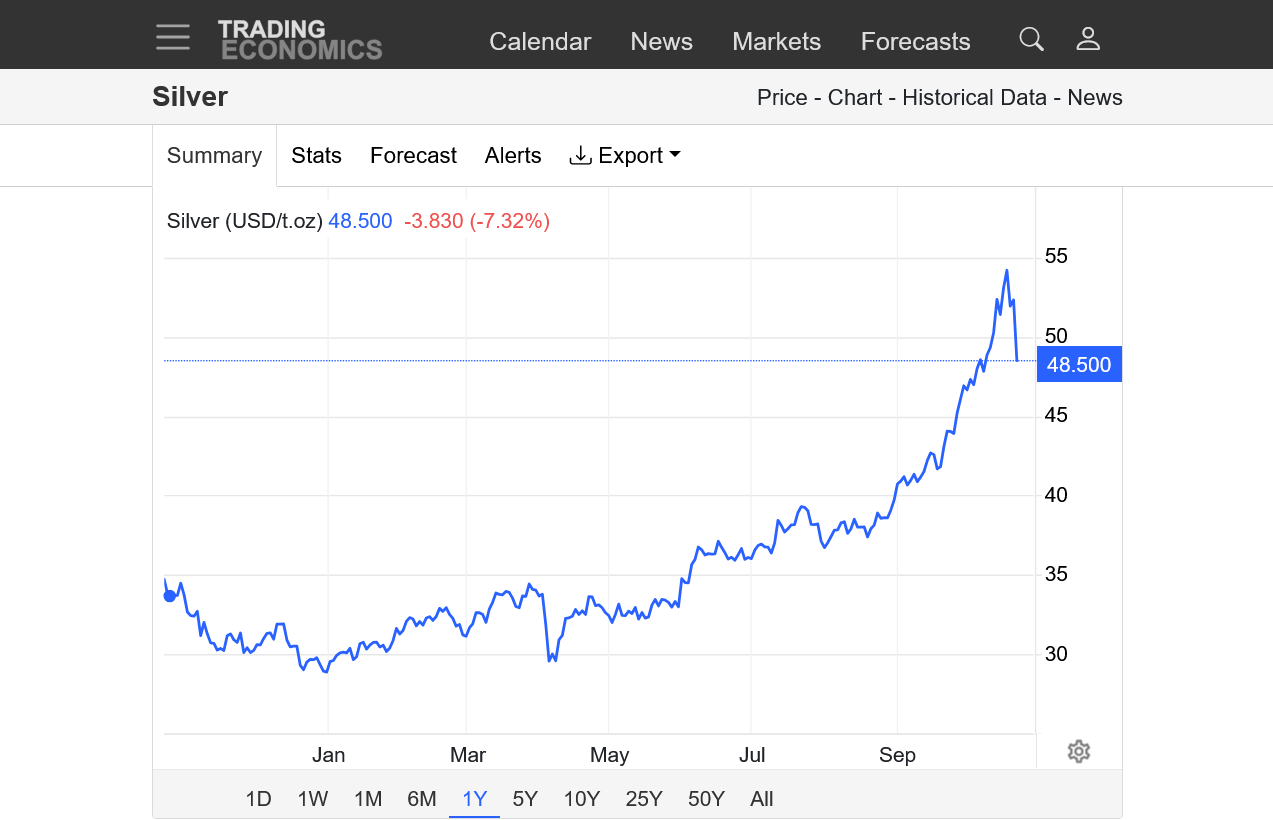
https://en.wikipedia.org/wiki/Head_and_shoulders_(chart_pattern)
Head and shoulders formations consist of a left shoulder, a head, and a right shoulder and a line drawn as the neckline.
The left shoulder is formed at the end of an extensive move during which volume is noticeably high.
After the peak of the left shoulder is formed, there is a subsequent reaction and prices slide down somewhat, generally occurring on low volume.
The prices rally up to form the head with normal or heavy volume and subsequent reaction downward is accompanied with lesser volume.
The right shoulder is formed when prices move up again but remain below the central peak called the head and fall down nearly equal to the first valley between the left shoulder and the head or at least below the peak of the left shoulder. Volume is lesser in the right shoulder formation compared to the left shoulder and the head formation.
A neckline can be drawn across the bottoms of the left shoulder, the head and the right shoulder.
When prices break through this neckline and keep on falling after forming the right shoulder, it is the ultimate confirmation of the completion of the head and shoulders top formation.
It is quite possible that prices pull back to touch the neckline before continuing their declining trend
+++++++++++++
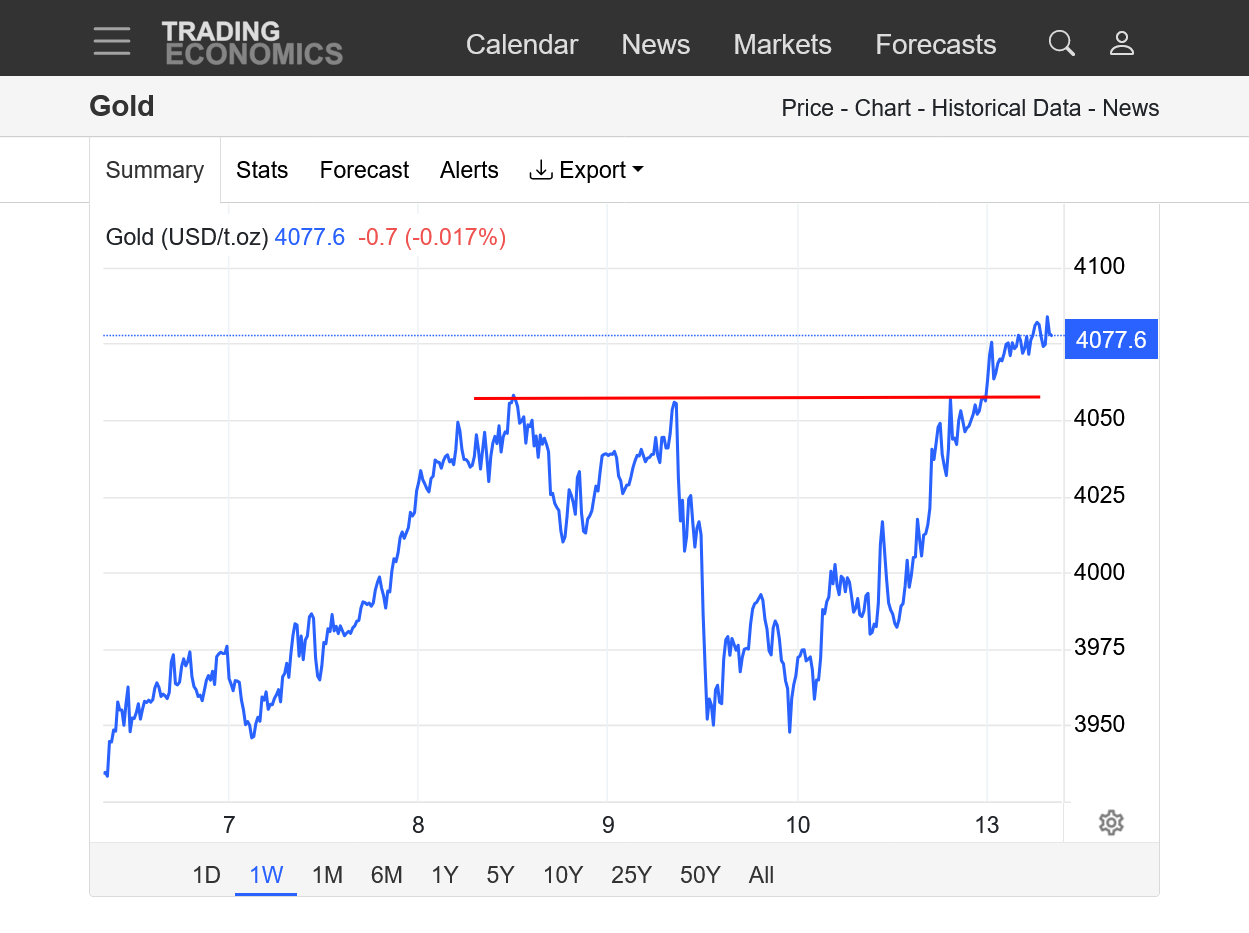
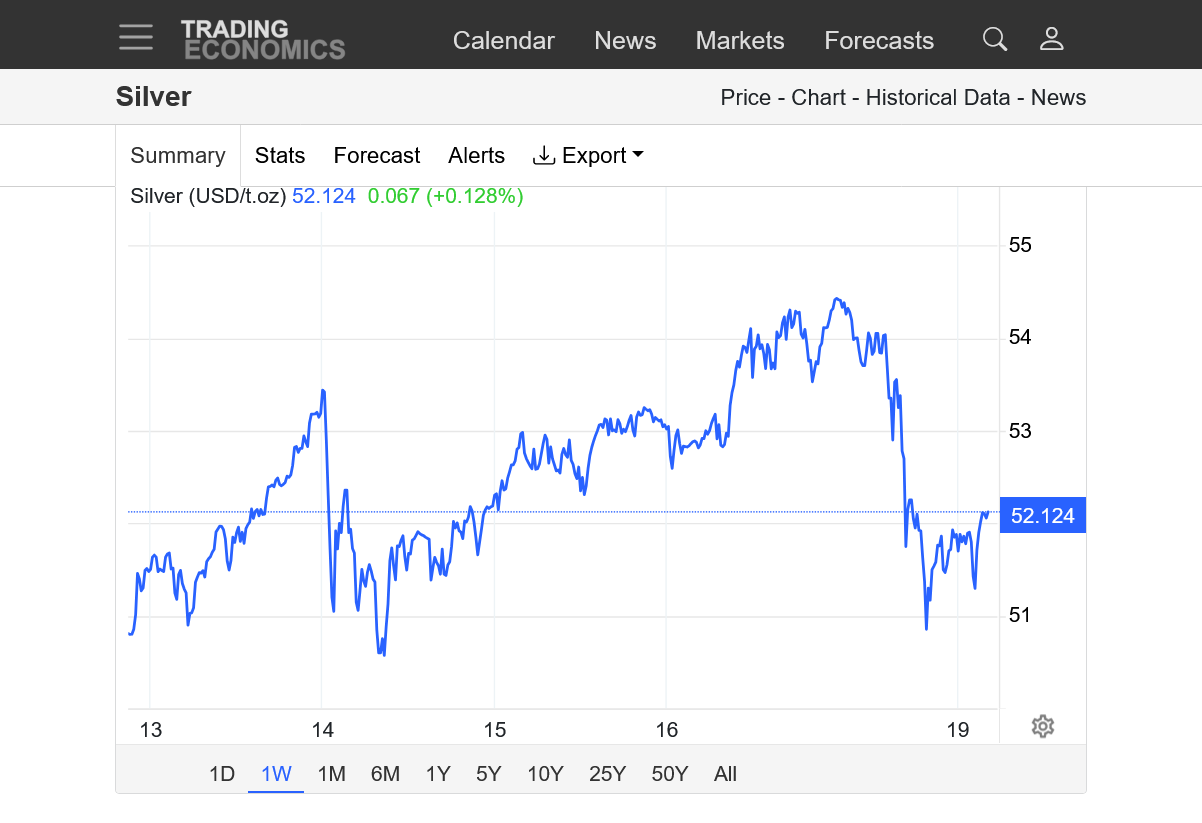
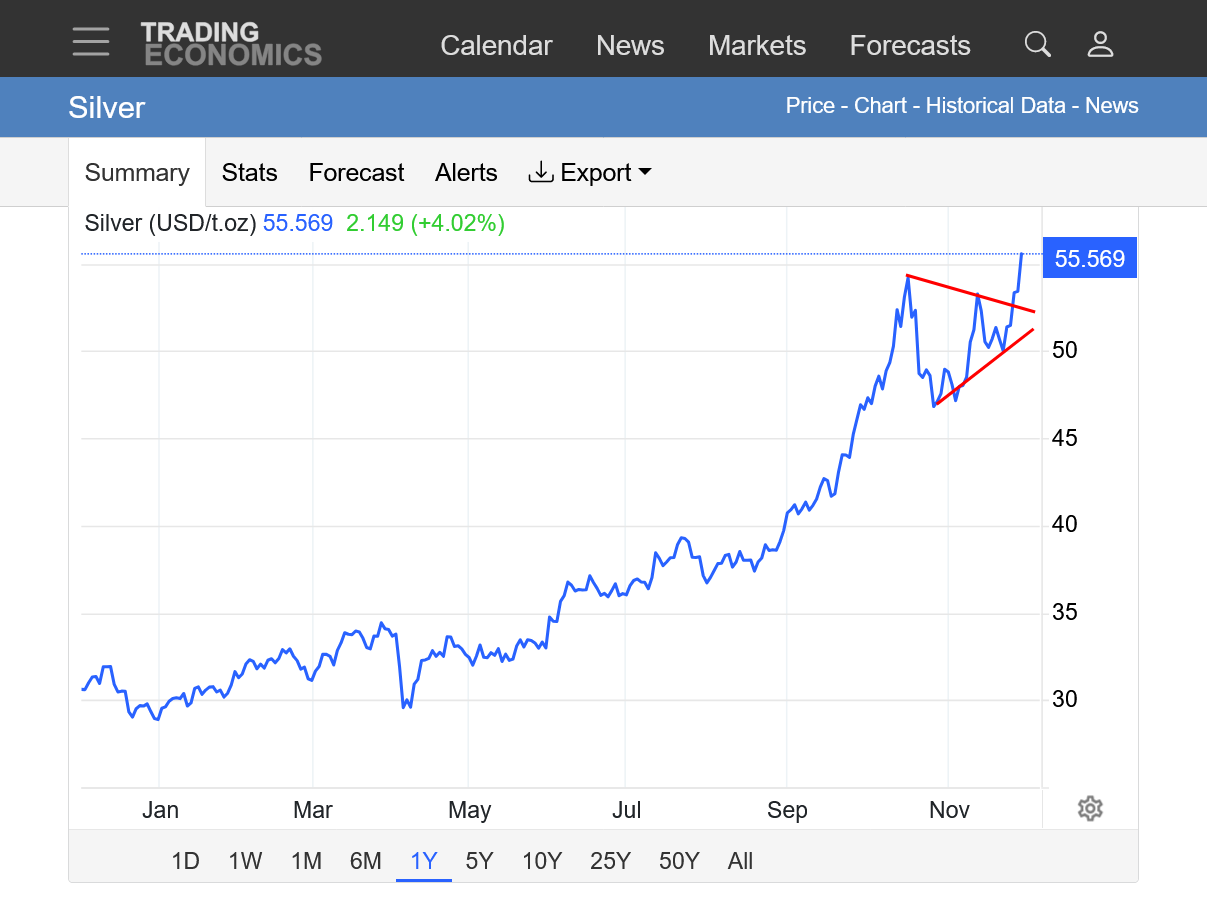
Silver, after a huge correction down, after flashing top/sell signals has come roaring back and is breaking out to the upside again.
Silver is massively outperforming gold! Much of this is related to a legit supply induced issue and short squeeze INDEPENDENT of speculator money.
The latest is Just another bull flag with EXTREME volatility and daily price swings. Daily price bars recently have shown changes that would take a year to happen a couple of decades ago!
The charts below are of the front month, that rolls over to a new month with time and leads to some misleading data showing more strength than what is there but still gives the general idea.
https://tradingeconomics.com/commodity/silver
1. 1 month: Huge full flag/pennant with decisive upside break out. I’ll change that to the right graph below when I get back.
2. 1 year: Same as #1.
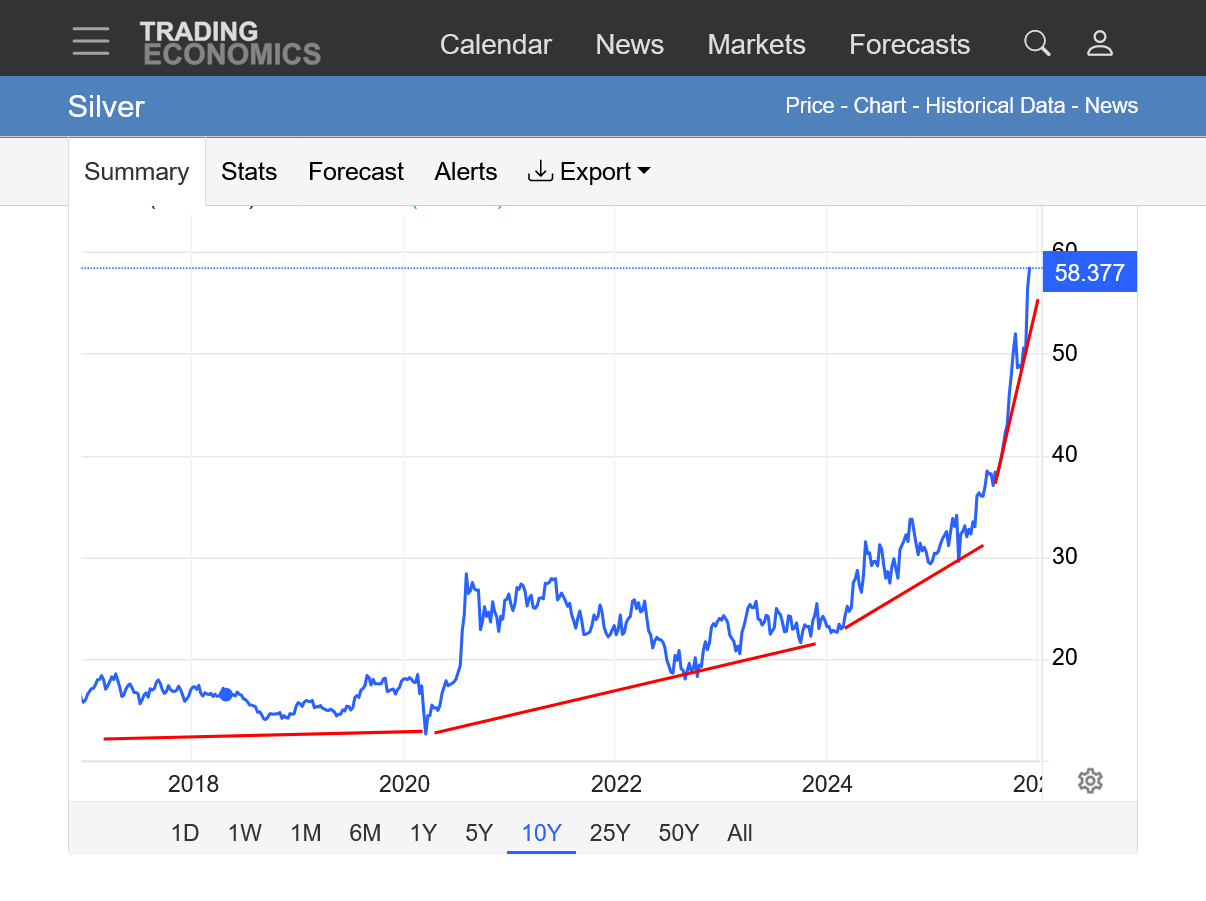
3. 10 years: Exponential/parabolic move higher with a steeper and steeper slope to the uptrend. It cant be sustained forever but is impossible to predict a top.

+++++++++++++++
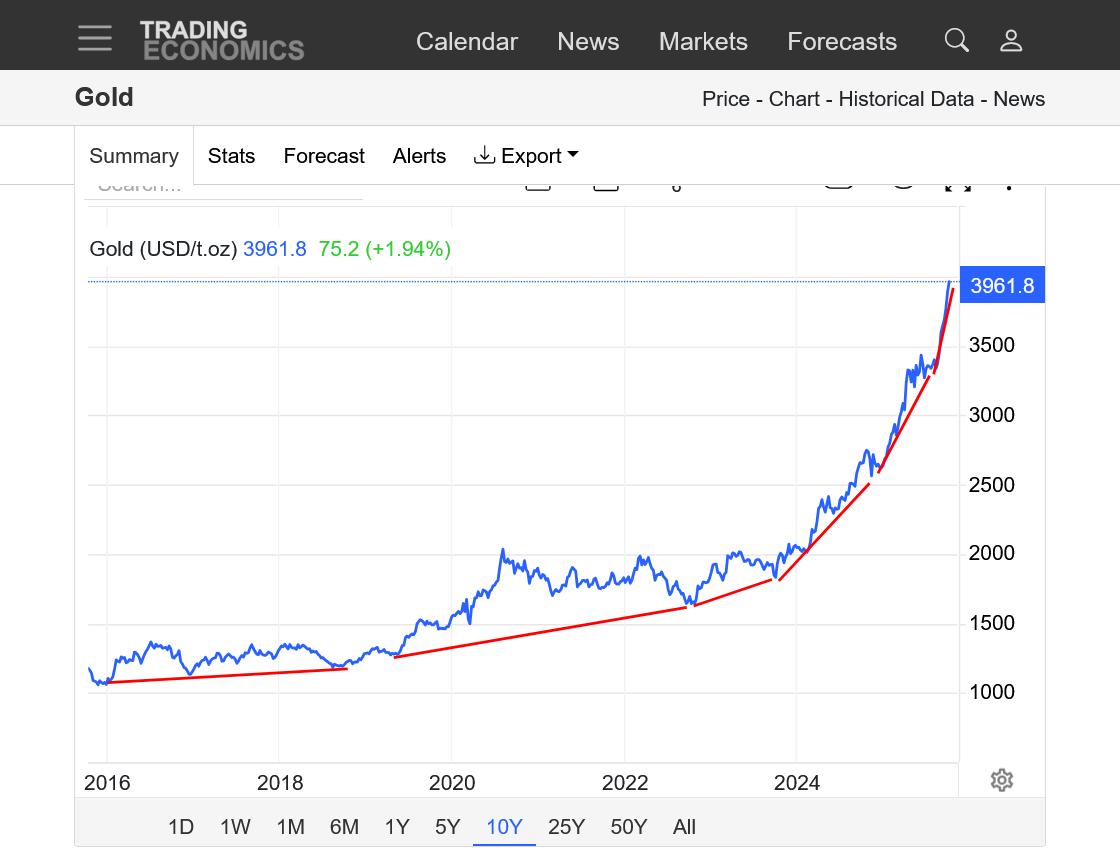
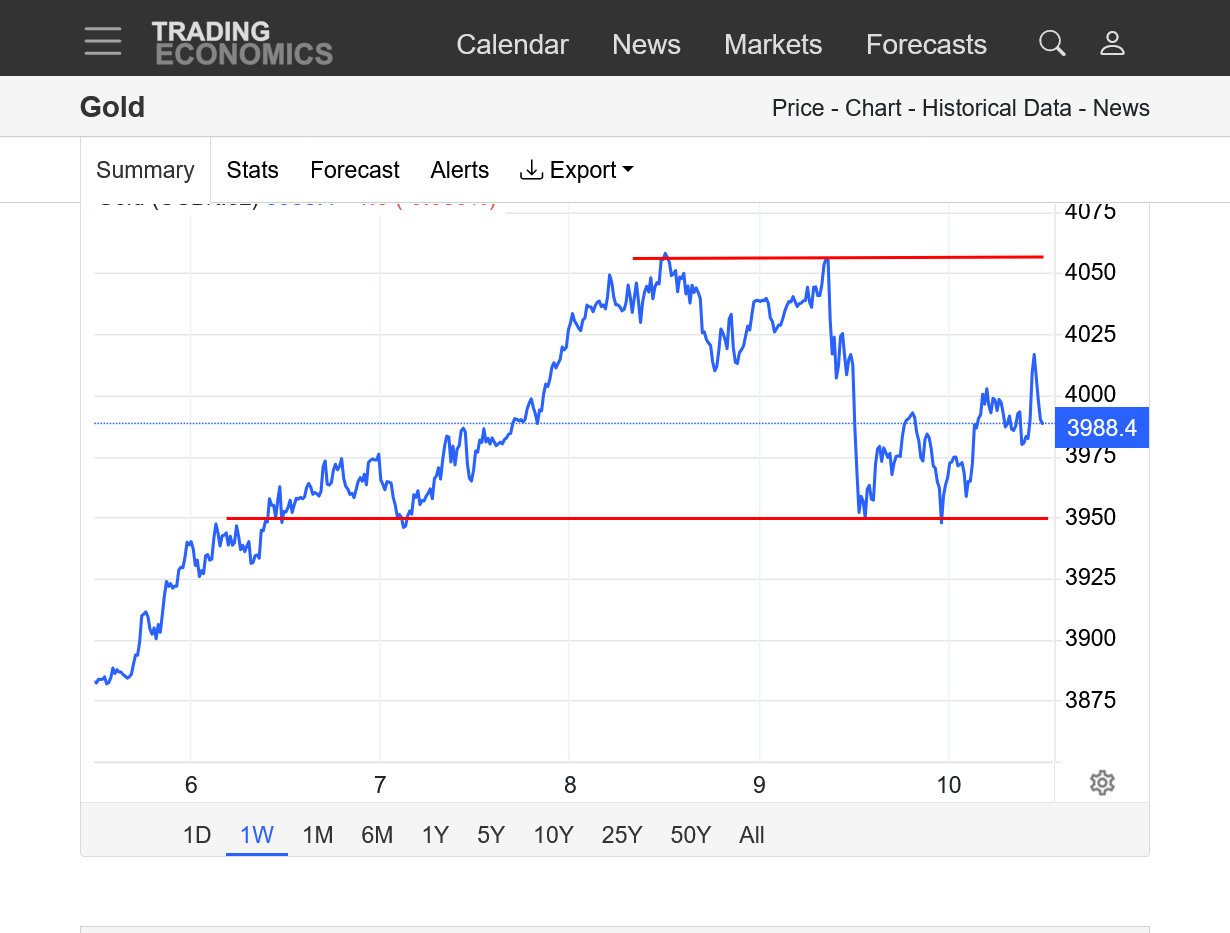
Gold, which moves in tandem with Silver is FOLLOWING instead of being the leader, like it was early in this move. The charts are not nearly as strong as silver but still bullish Gold still has a bit to go to break out above the previous record highs last month.
https://tradingeconomics.com/commodity/gold
1. 1 month: Still below theprevious highs but breaking out from a bull flag/wedge/pennant which is a CONTINUATION of the longer term trend pattern. Narrow, new short term uptrend channel recently.
2, 1 year: Potential upside break out from another huge bull flag/pennant but still well below the record highs in October. Clearly not as strong as silver.
3. 10 years: Parabolic/exponential move up, like silver, just not as strong this year as silver. Increasingly steeper and steeper slope to the upchannel. It can't continue forever but its almost impossible to know when it will end. Still below all time highs last month.
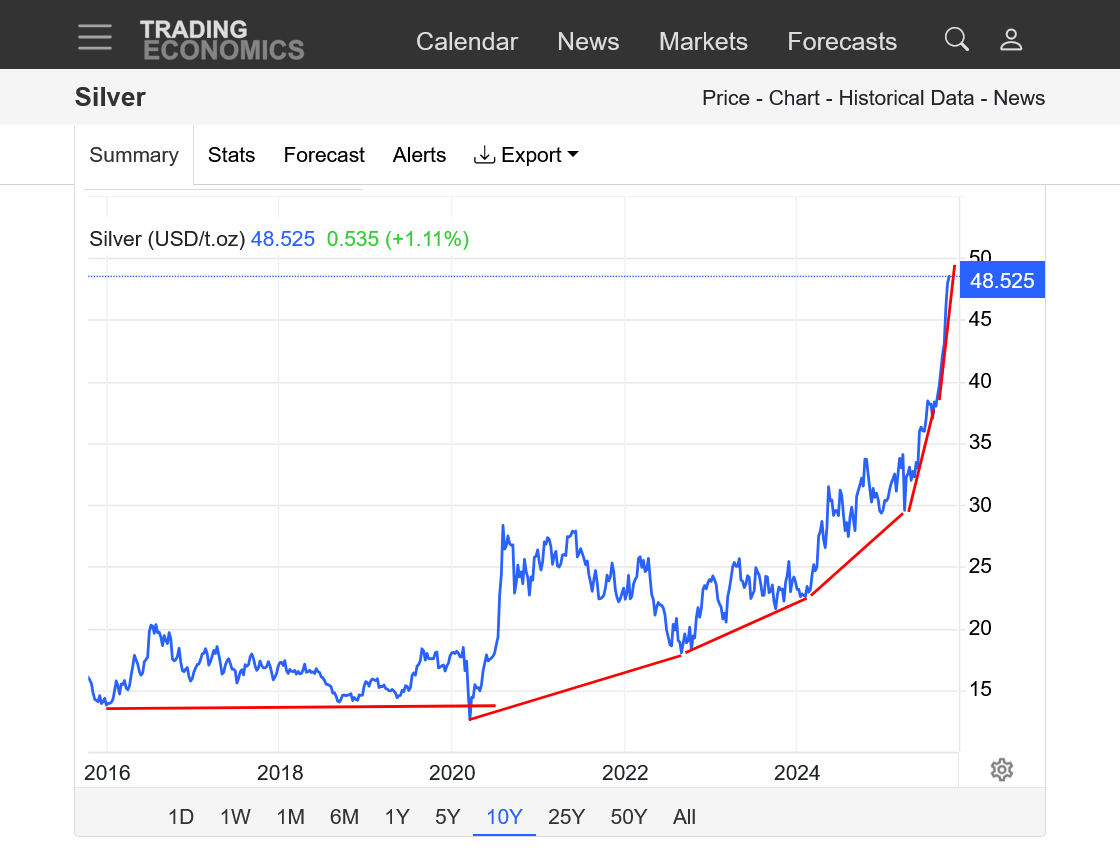
Silver: WOW!!!!!
https://tradingeconomics.com/commodity/silver
1. 1 year
2. 10 years
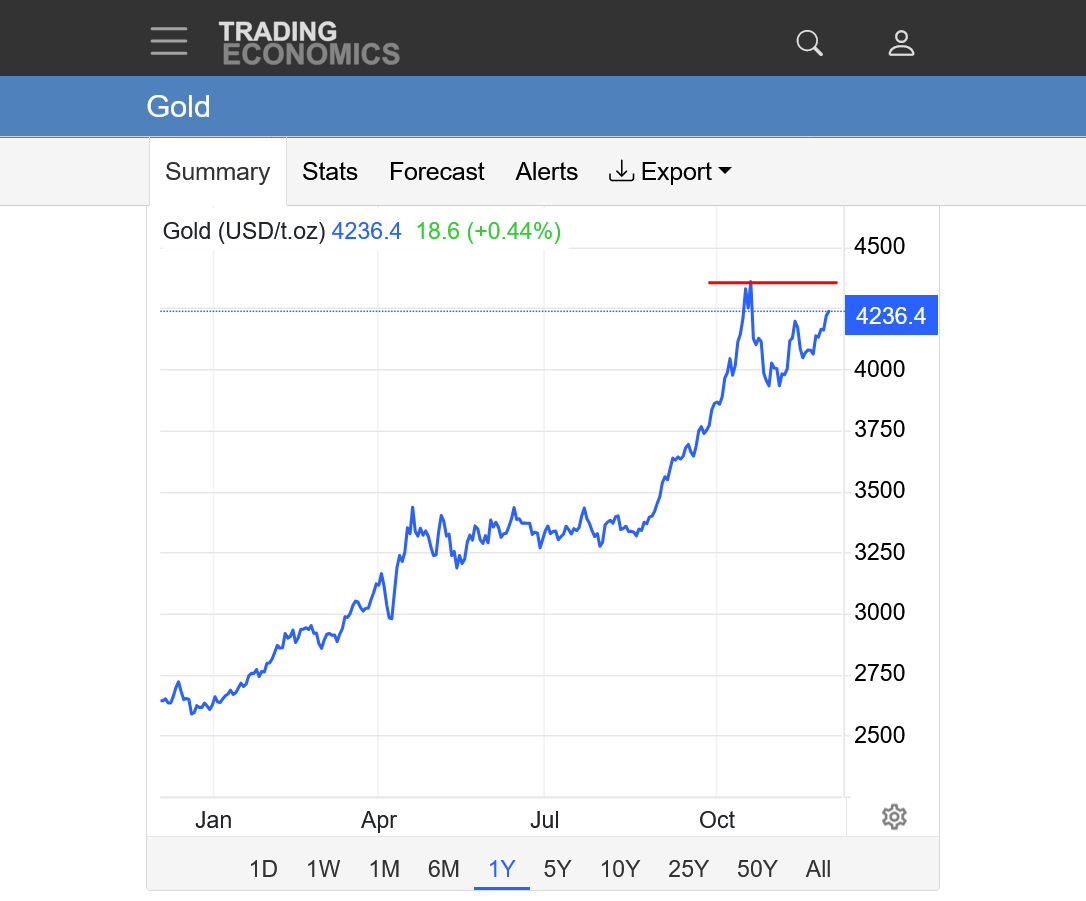
Gold: Still below the October 20, 2025 high
Insane silver!
Below is a logarithmic chart. The price of silver is 100+ times higher than it was less than 100 years ago(when it was less than $0.50 and now is $58+)
https://www.macrotrends.net/1470/historical-silver-prices-100-year-chart
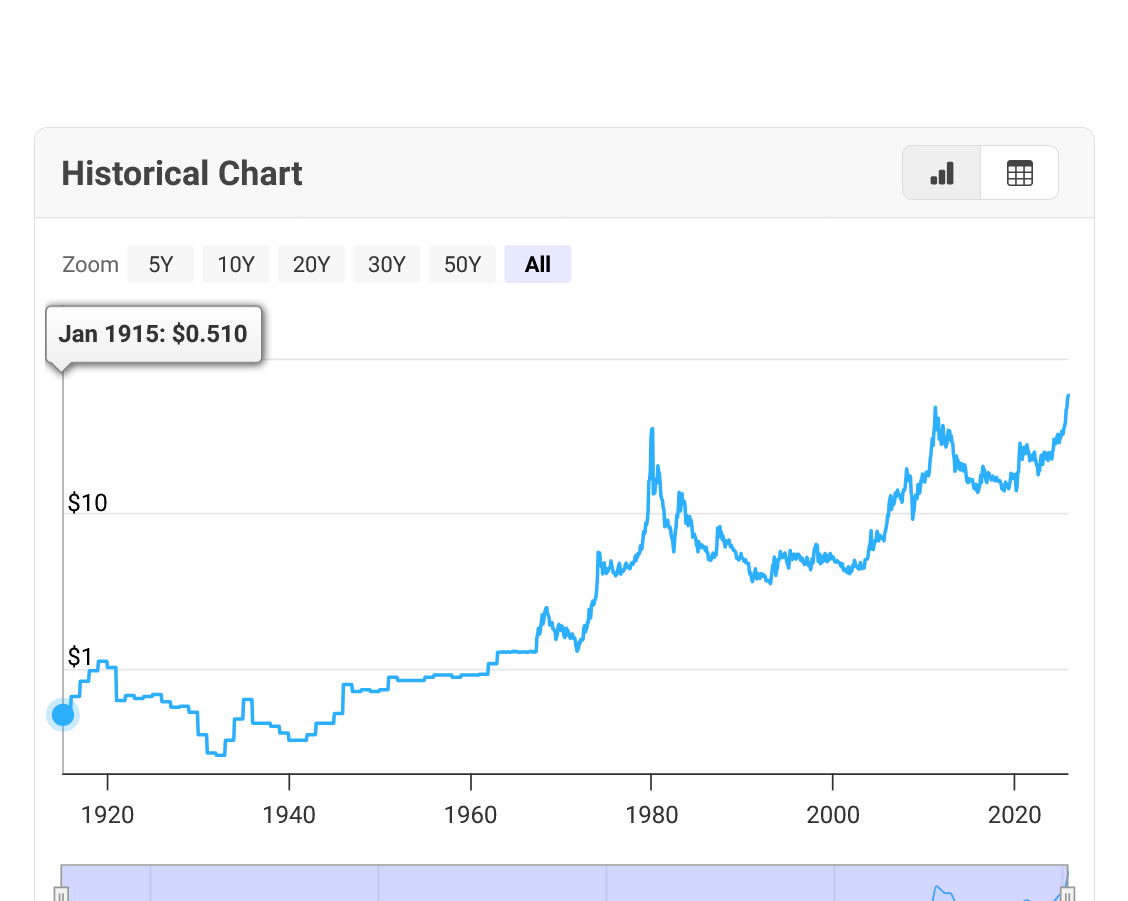
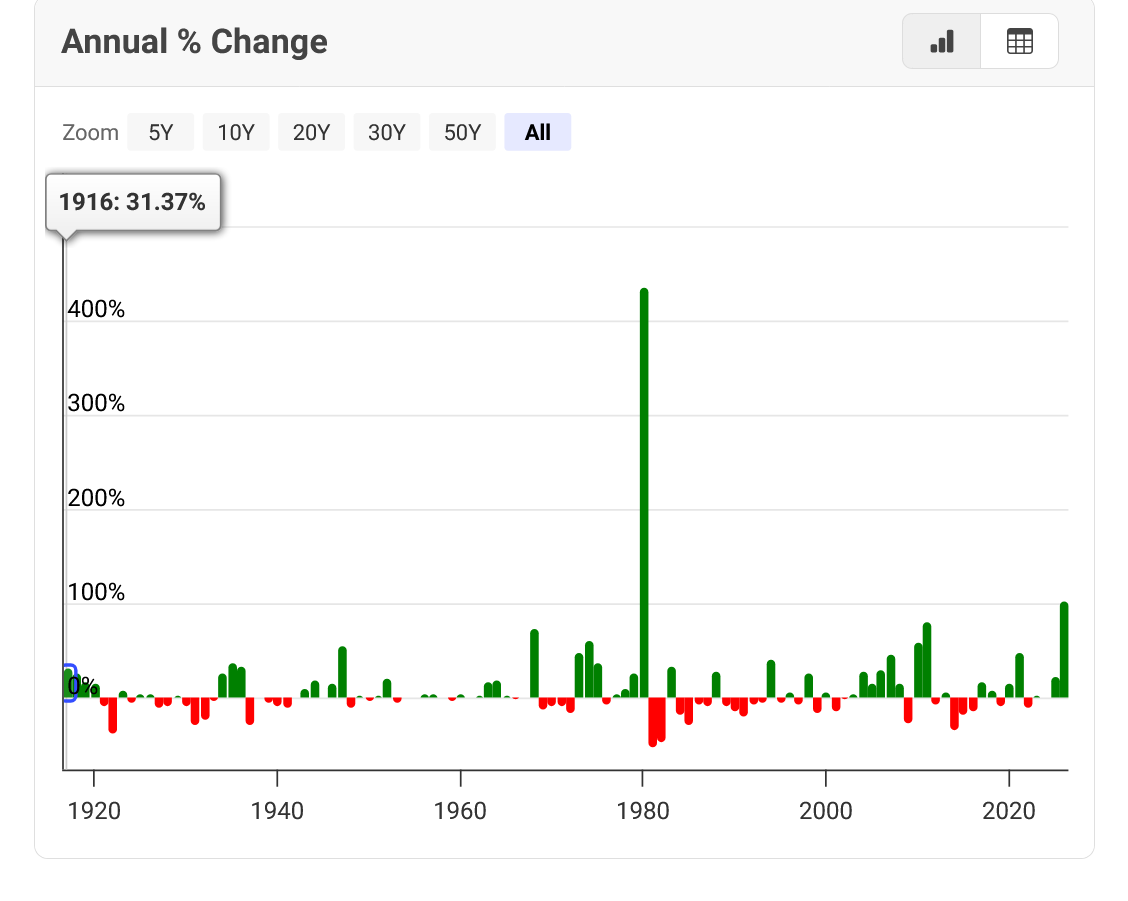
joj mentioned this before here. Adjusted for inflation, the 1980, previous all time record/spike up was even more impressive!
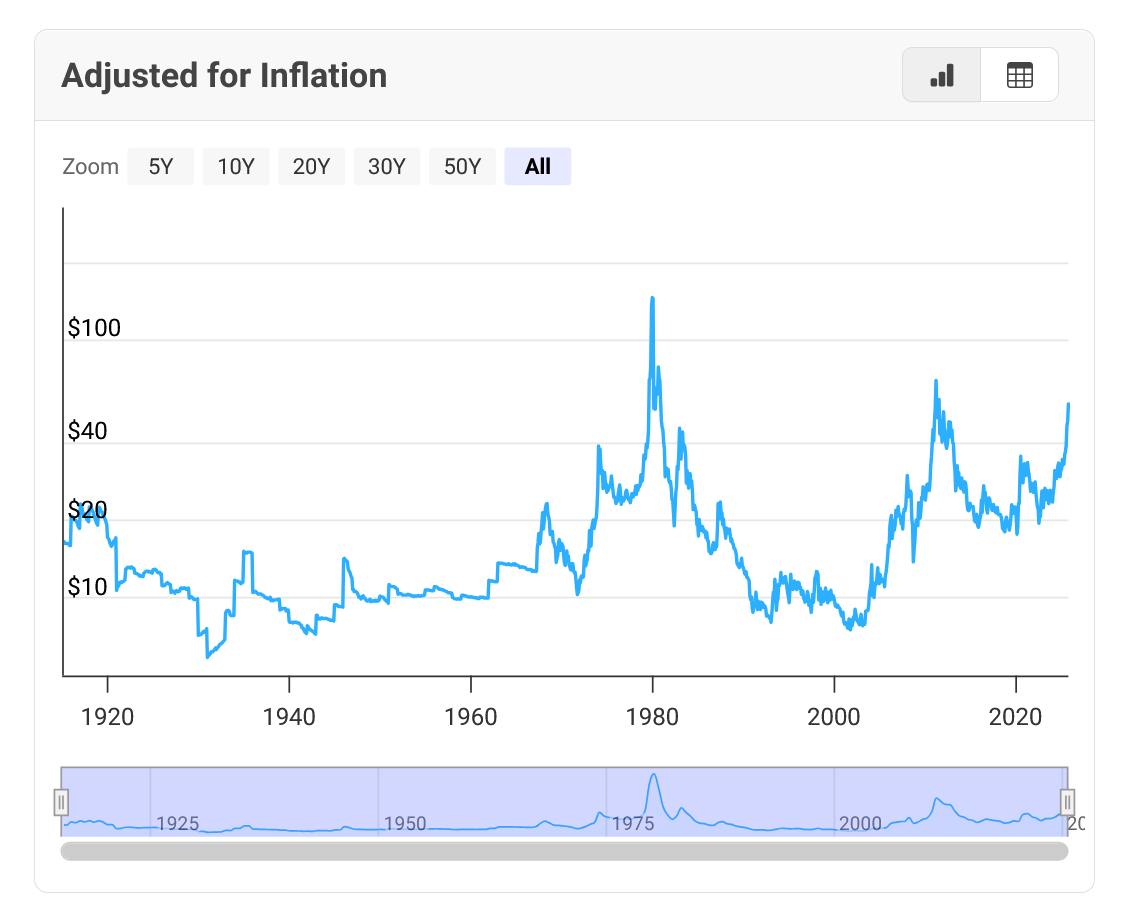
The spike higher in 1980 was +400% that year. This year, we're up 100%.
copper seems to be breaking out of a 7 week long channel
Thanks, cutworm!
I'll check that one out.
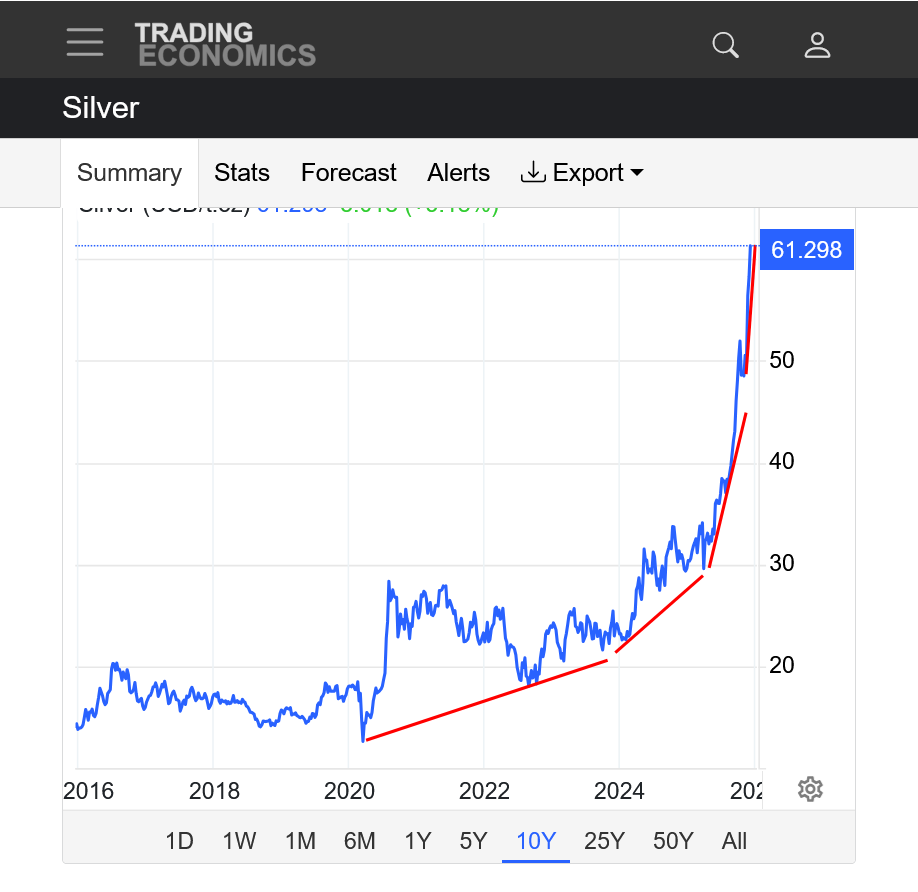
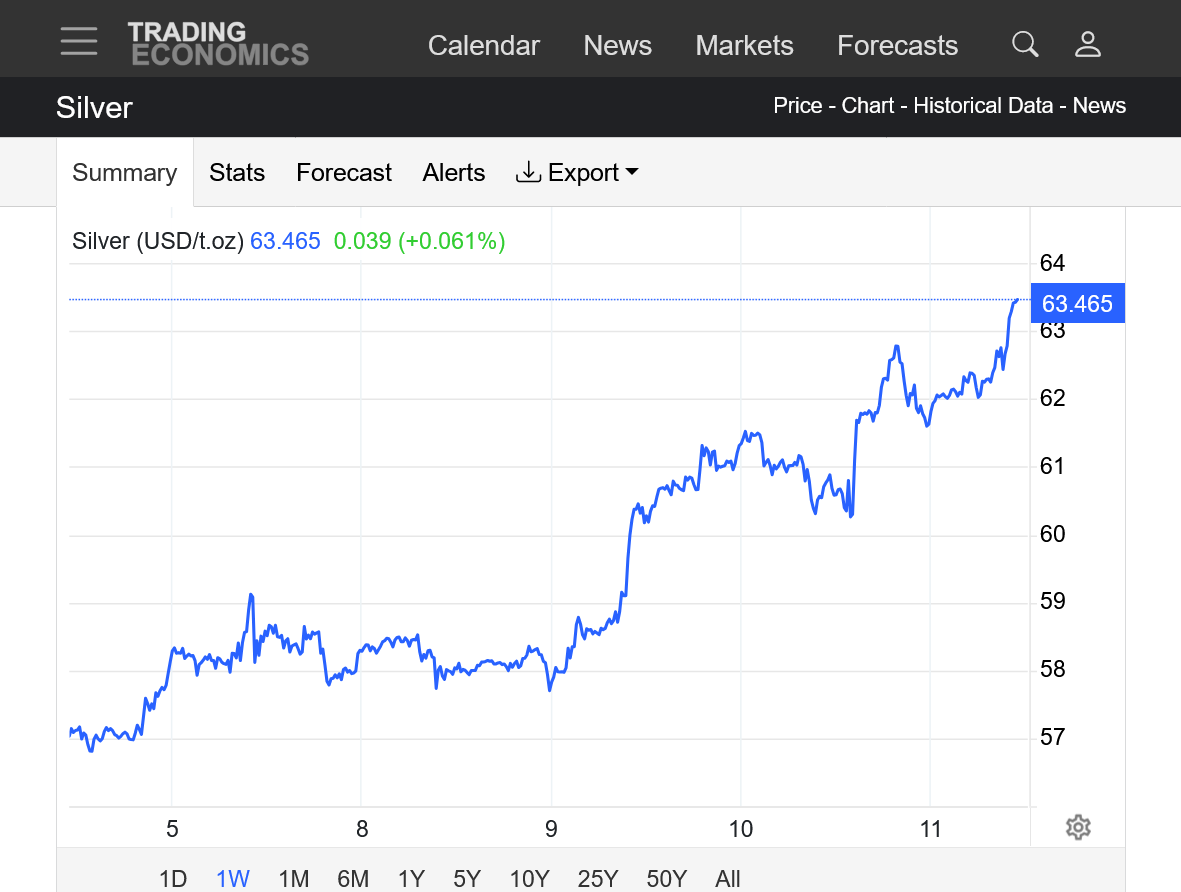
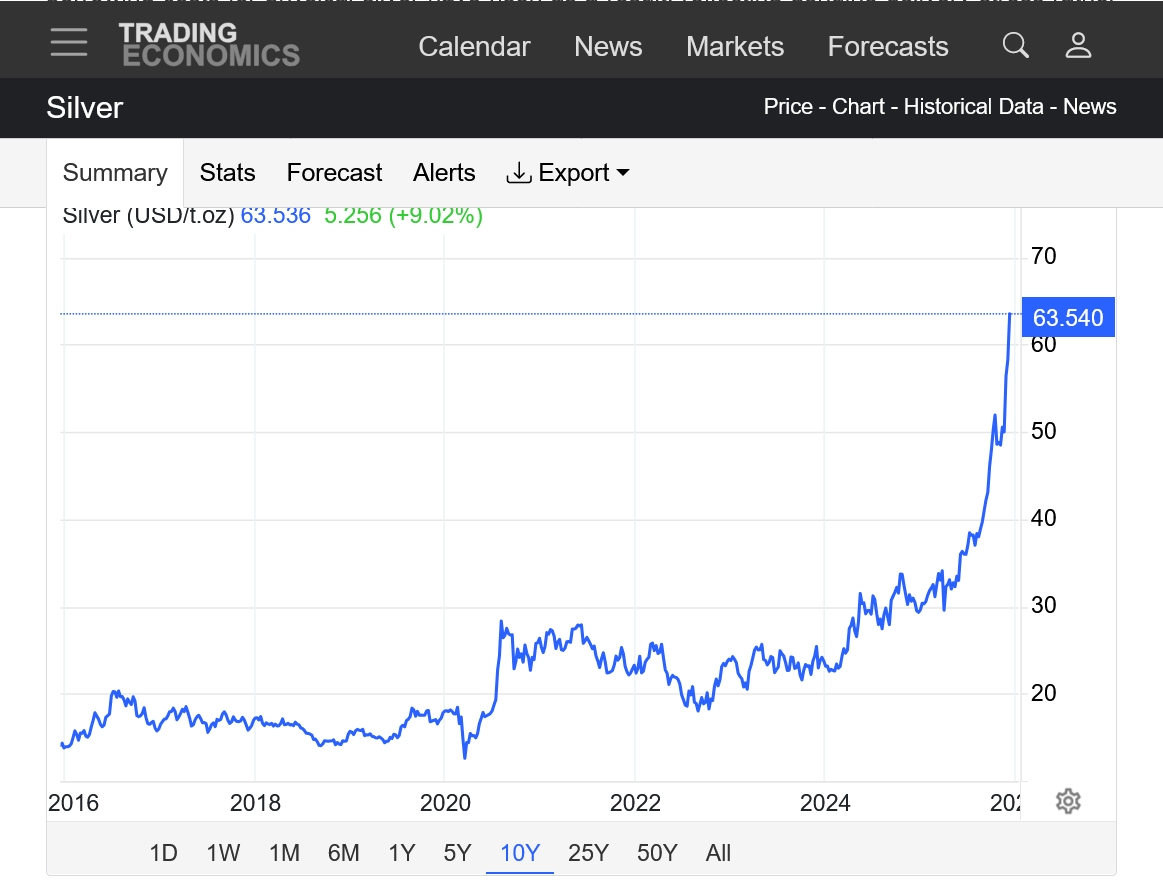
An even bigger, WOW!
https://tradingeconomics.com/commodity/silver
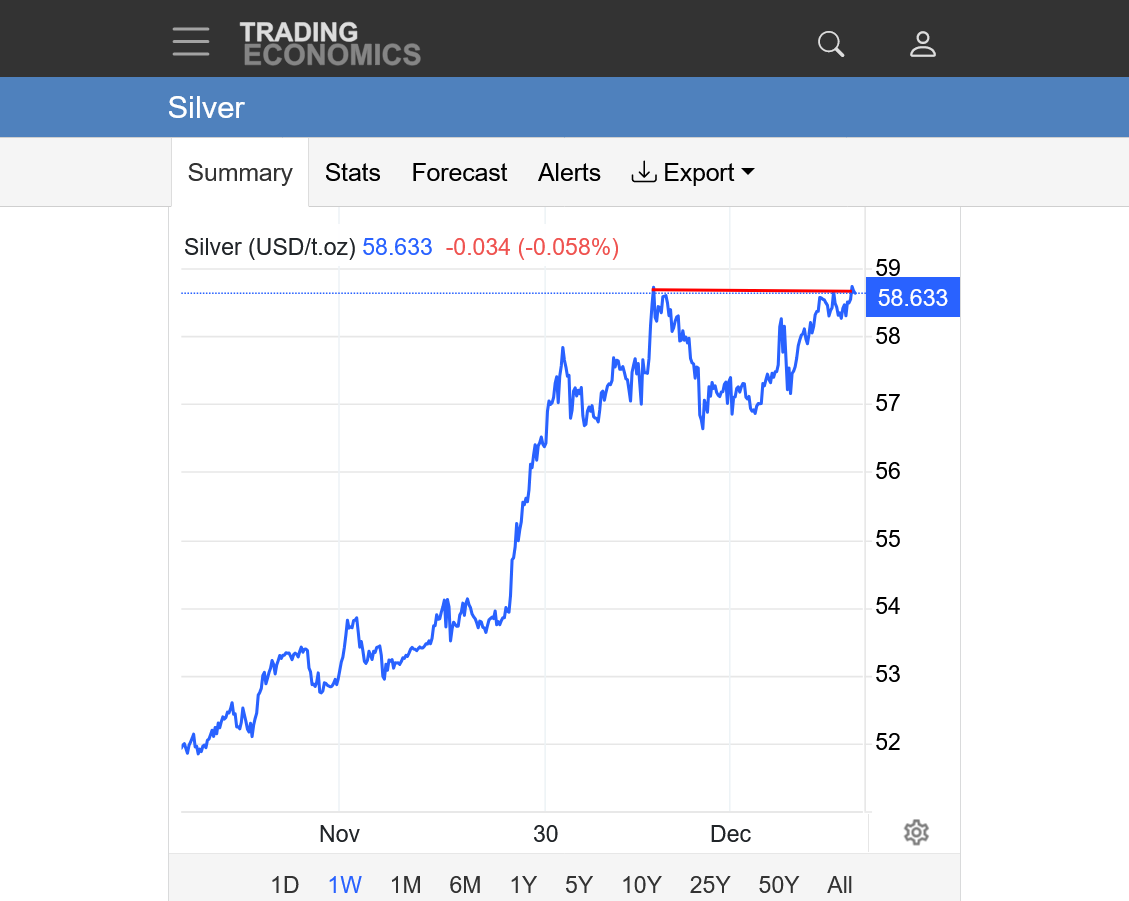
1. 1 week: Daily ranges are wider than entire yearly ranges a couple of decades ago!
2. 10 years: Parabolic/exponential, historic move with an increasingly steeper and steeper slope to the uptrend.
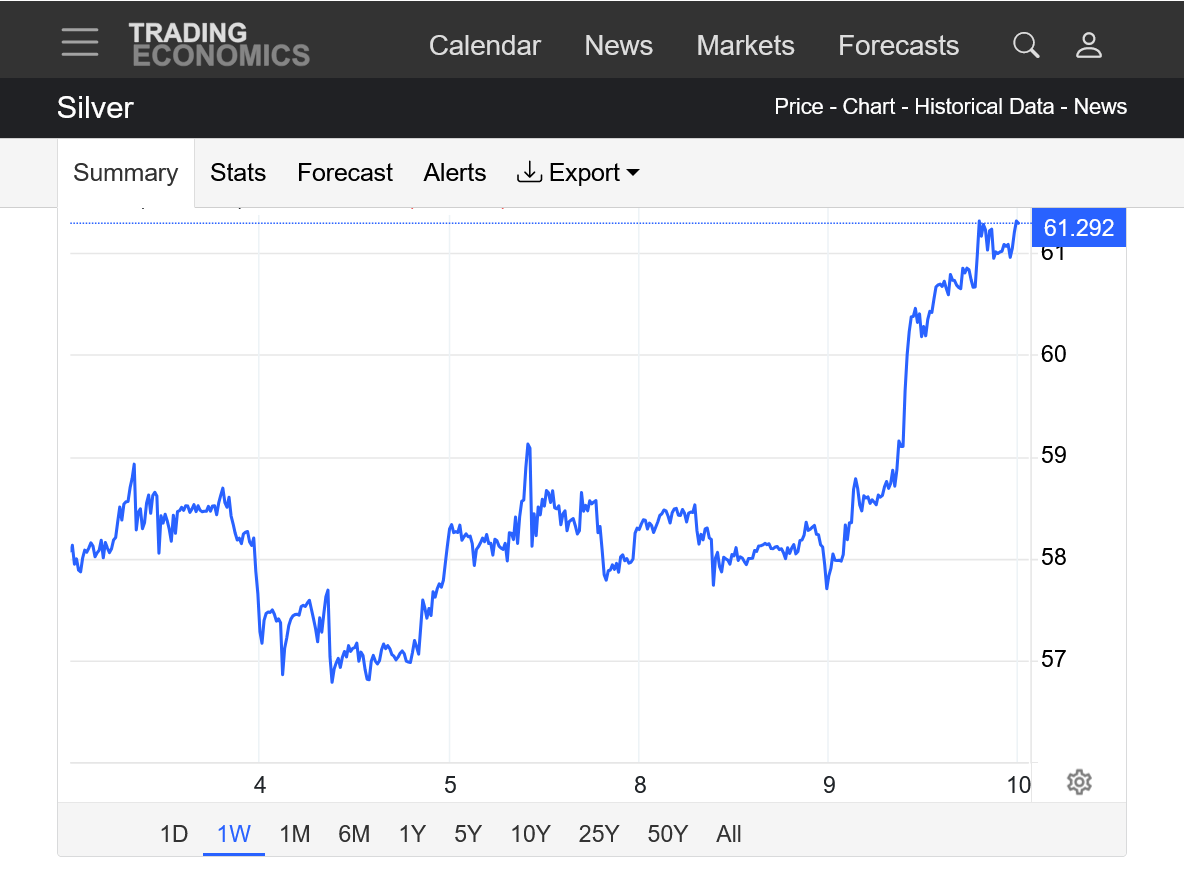
1. This is just the last week!!
2. 10 years: This is the quintessential example of a parabolic/exponential move higher. This is more than just speculation. There's a legit supply shortage and demand/supply imbalance.
The cure for high prices?
High prices because they create great incentive for producers to produce more supply as well as stifle demand. However, sometimes demand is very inelastic.
In silver, it takes awhile for those things to happen.
https://tradingeconomics.com/commodity/silver
IMHO---time to buy PUT all 4 metals
Bought PLT put 2pm
Thanks, tjc!
You must have paid a pretty penny with the extreme volatility right now but then, you could make a couple of pretty pennies if you're right
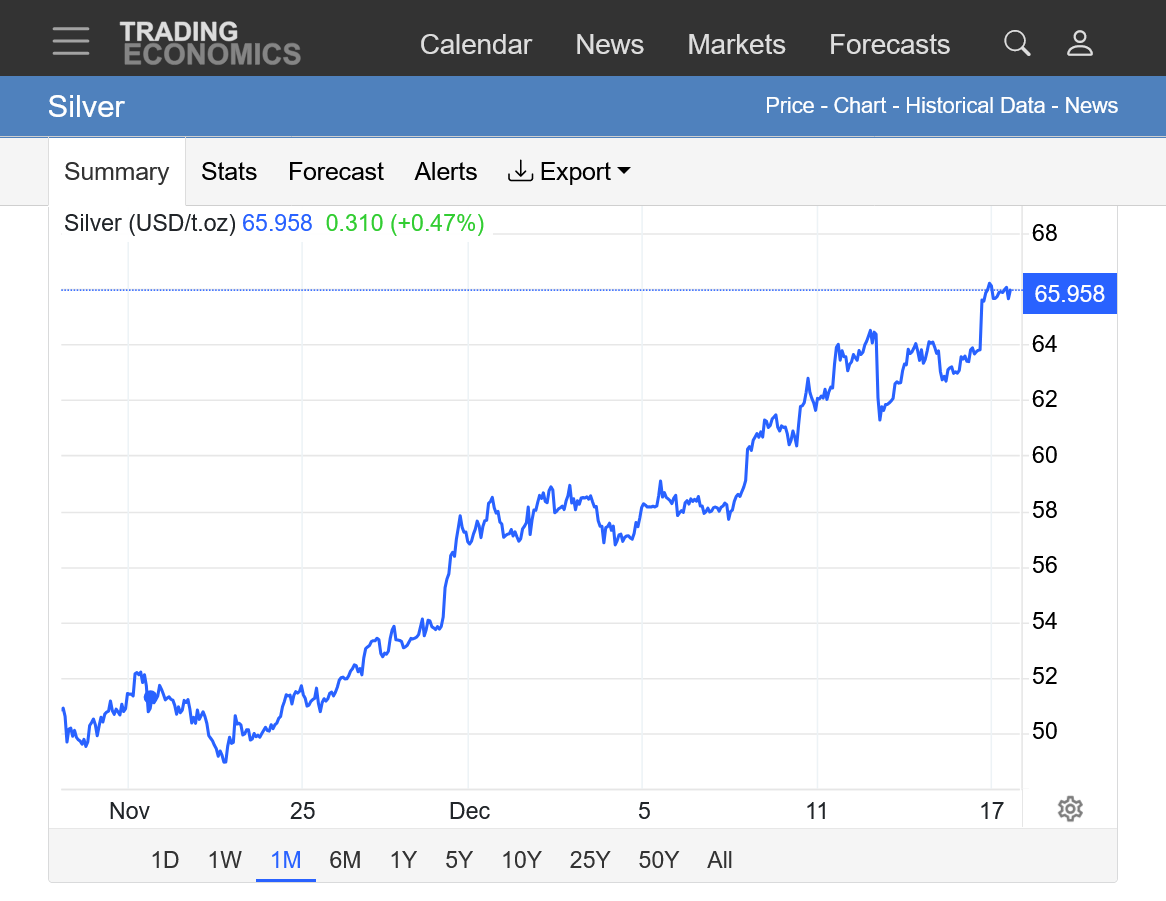
We can't keep going up forever!
https://tradingeconomics.com/commodity/silver
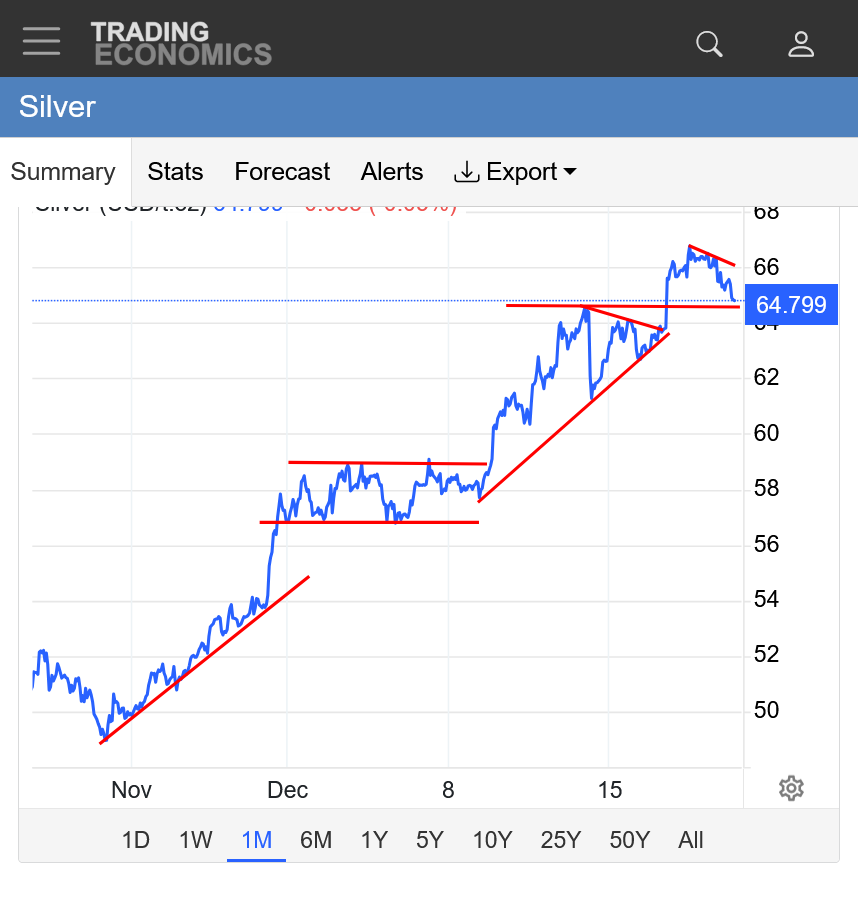
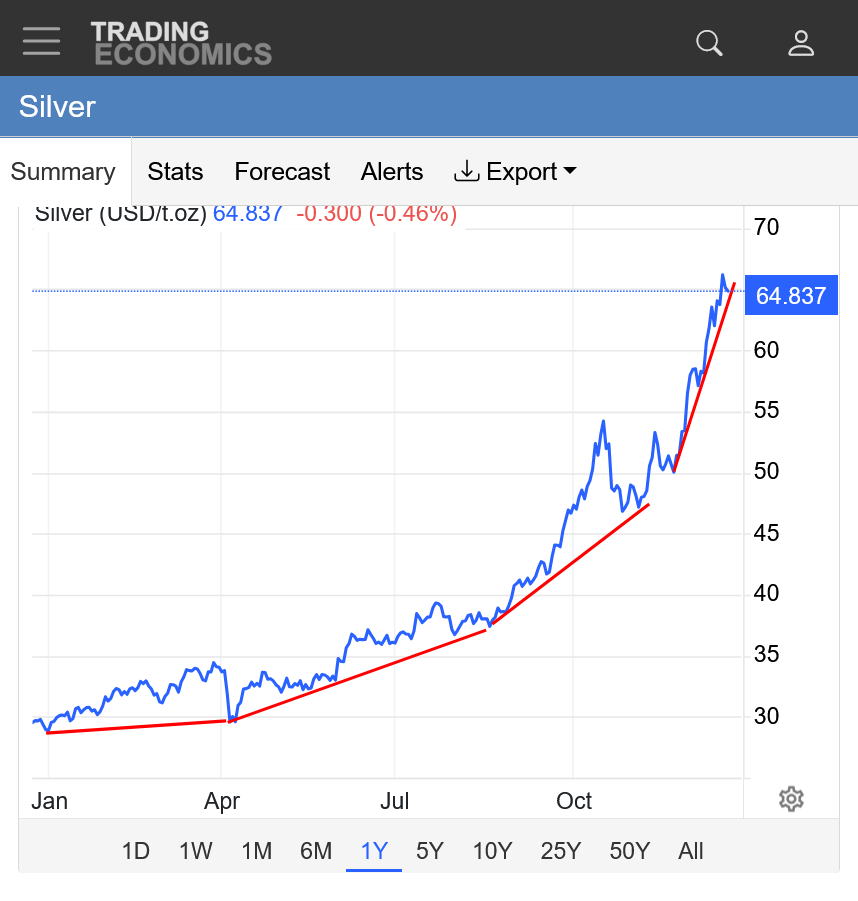
1. 1 month: 50 to 66 in a month. A couple of bull flag formations on the way up. Is this just another bull flag? Or is it a short term top.
2. 1 year: The price has more than doubled this year.
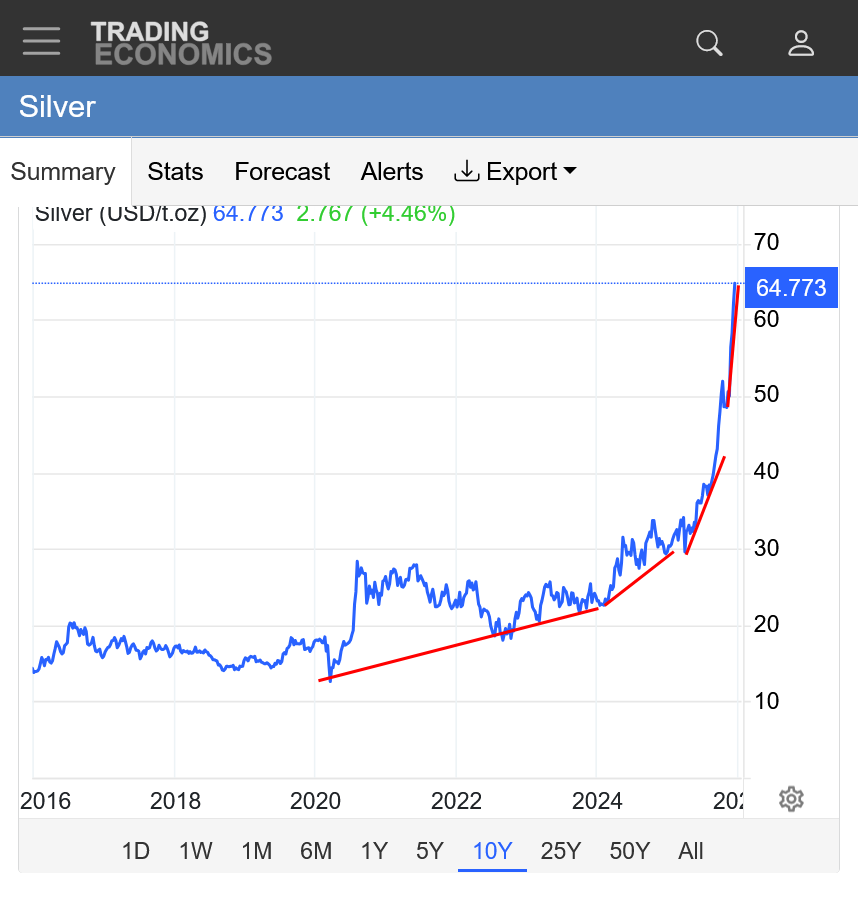
3. 10 years: Extreme parabolic/exponential move. Steeper and steeper upslope. Prices have quadrupled in 4 years. Can't go on forever but it's impossible to know when the top is in with confidence until........we're long past the top.