Time for a new NG thread as we approach the start of the cold season, the strongest demand period for NG since it’s used by many for heating.
Thanks very much for starting the new thread, Larry.
You are exactly right about this being the bread and butter weather trading market in the heating season!
This was the previous thread:
NG 8/4/25-10/9/25
77 responses |
Started by WxFollower - Aug. 4, 2025, 12:26 a.m.
Re: Re: Re: Re: Re: NG 8/4/25+
By metmike - Oct. 9, 2025, 1:33 a.m.
Near record warmth in the NorthCentral US last week where HDDs are normally higher than CDDs so the warmth there was bearish.
Plenty of warmth to go around in other places except a bit cool West/Southwest compared to average.
https://www.cpc.ncep.noaa.gov/products/tanal/temp_analyses.php
+++++++++++++
Actual EIA number was close to expected. Storage levels will likely peak in November before the first major cold snap.
Stocks are slightly above last year. However, last Winter was very cold compared to average. Look at the graph below and not THE BLUE LINE. This is the storage level of the last EIA report.
Storage went from near record highs a year, to well below the 5 year average and near the bottom of the 5 year range!!!!
This shows, as Larry stated why temperatures in the HDD season are so critical to storage and prices!! So the current surplus, even higher than last year's(at the moment) is not enough to prevent storage from getting low by early in 2026!!!
https://ir.eia.gov/ngs/ngs.html
![]()
for week ending October 3, 2025 | Released: October 9, 2025 at 10:30 a.m. | Next Release: October 16, 2025
| Working gas in underground storage, Lower 48 states Summary text CSV JSN | |||||||||||||||||||||||||
|---|---|---|---|---|---|---|---|---|---|---|---|---|---|---|---|---|---|---|---|---|---|---|---|---|---|
| Historical Comparisons | |||||||||||||||||||||||||
| Stocks billion cubic feet (Bcf) | Year ago (10/03/24) | 5-year average (2020-24) | |||||||||||||||||||||||
| Region | 10/03/25 | 09/26/25 | net change | implied flow | Bcf | % change | Bcf | % change | |||||||||||||||||
| East | 860 | 832 | 28 | 28 | 869 | -1.0 | 842 | 2.1 | |||||||||||||||||
| Midwest | 1,001 | 972 | 29 | 29 | 1,037 | -3.5 | 1,004 | -0.3 | |||||||||||||||||
| Mountain | 275 | 269 | 6 | 6 | 286 | -3.8 | 232 | 18.5 | |||||||||||||||||
| Pacific | 304 | 302 | 2 | 2 | 293 | 3.8 | 277 | 9.7 | |||||||||||||||||
| South Central | 1,201 | 1,186 | 15 | 15 | 1,133 | 6.0 | 1,129 | 6.4 | |||||||||||||||||
| Salt | 295 | 292 | 3 | 3 | 272 | 8.5 | 280 | 5.4 | |||||||||||||||||
| Nonsalt | 906 | 894 | 12 | 12 | 861 | 5.2 | 849 | 6.7 | |||||||||||||||||
| Total | 3,641 | 3,561 | 80 | 80 | 3,618 | 0.6 | 3,484 | 4.5 | |||||||||||||||||
| Totals may not equal sum of components because of independent rounding. | |||||||||||||||||||||||||
Working gas in storage was 3,641 Bcf as of Friday, October 3, 2025, according to EIA estimates. This represents a net increase of 80 Bcf from the previous week. Stocks were 23 Bcf higher than last year at this time and 157 Bcf above the five-year average of 3,484 Bcf. At 3,641 Bcf, total working gas is within the five-year historical range.
For information on sampling error in this report, see Estimated Measures of Sampling Variability table below.

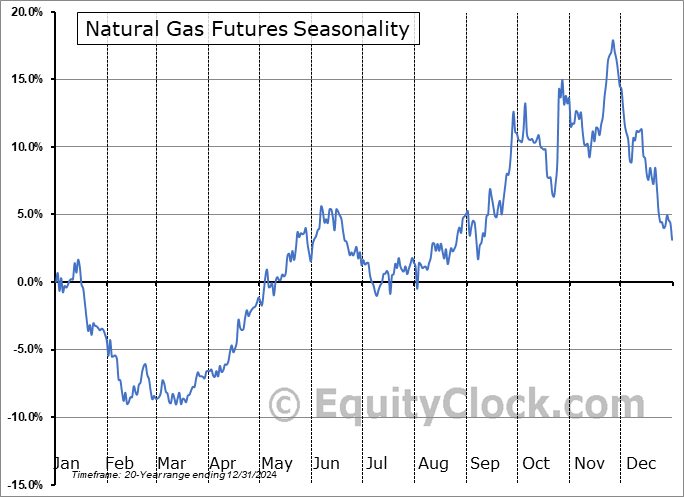
This is a time of year when ng futures move higher towards a seasonal peak ahead of Winter as the market dials in cold weather risk premium and storage fills up with extra buying. Each year is different but this average over the past 20 years gives us clear tendencies at certain times of year.
Some seasonal rules that I use:
1. Being long in April/May almost always makes money, regardless of the weather.
2. Being short in Dec/Jan during widespread unusual warmth almost always makes BIG money.
3. Extreme cold during the first half of the heating season usually has a much higher impact on speculators buying than towards the end, unless storage is very low. During the back half of the heating season, the market knows that time is running out to draw down storage.
4. Summer heat waves don't have the same RELIABLE impact on prices as extreme cold in Winter but are tradable.
5. The market, under some conditions (early Winter-pattern change to brutal cold) can start trading that weather 2 weeks before it starts.
Got any more, Larry?
https://charts.equityclock.com/natural-gas-futures-ng-seasonal-chart
Natural gas price charts.
https://tradingeconomics.com/commodity/natural-gas
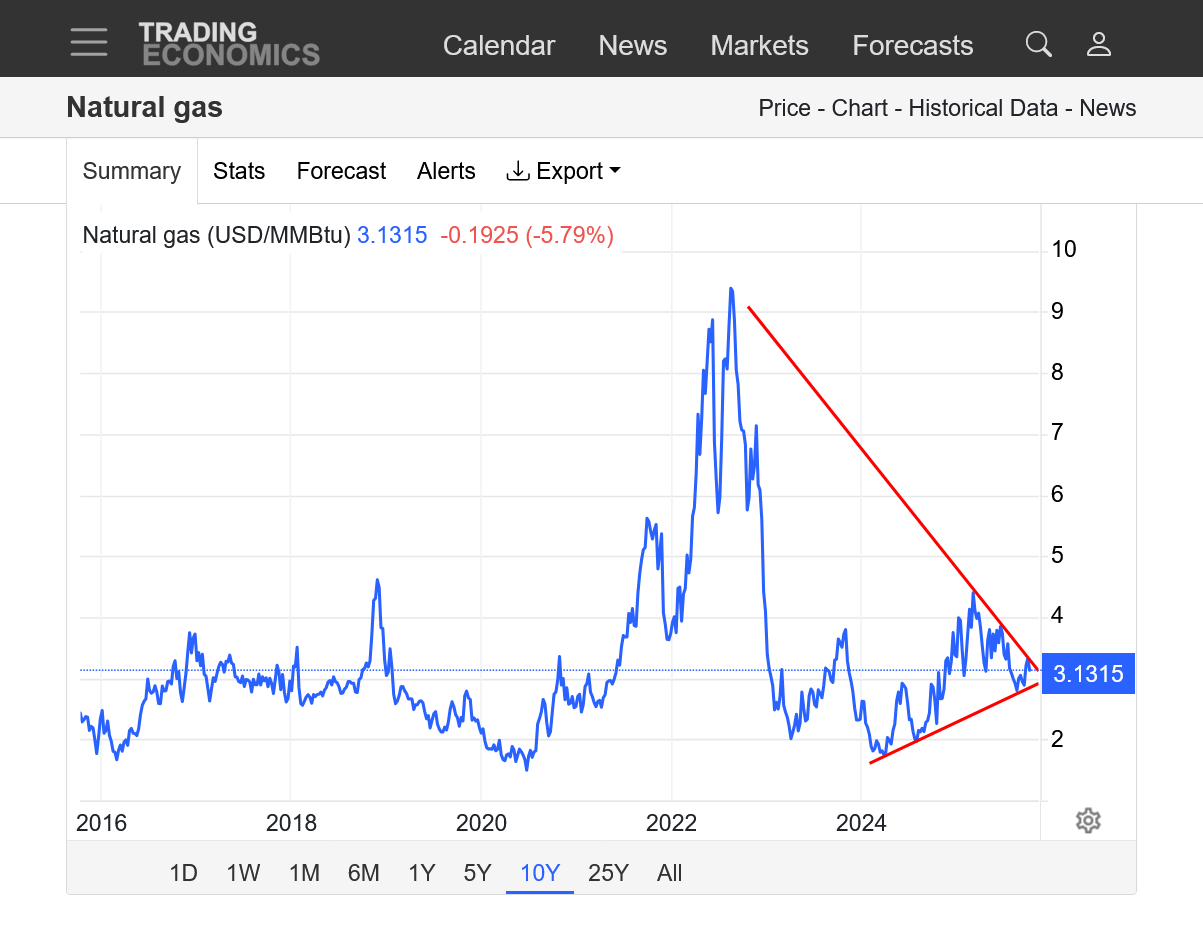
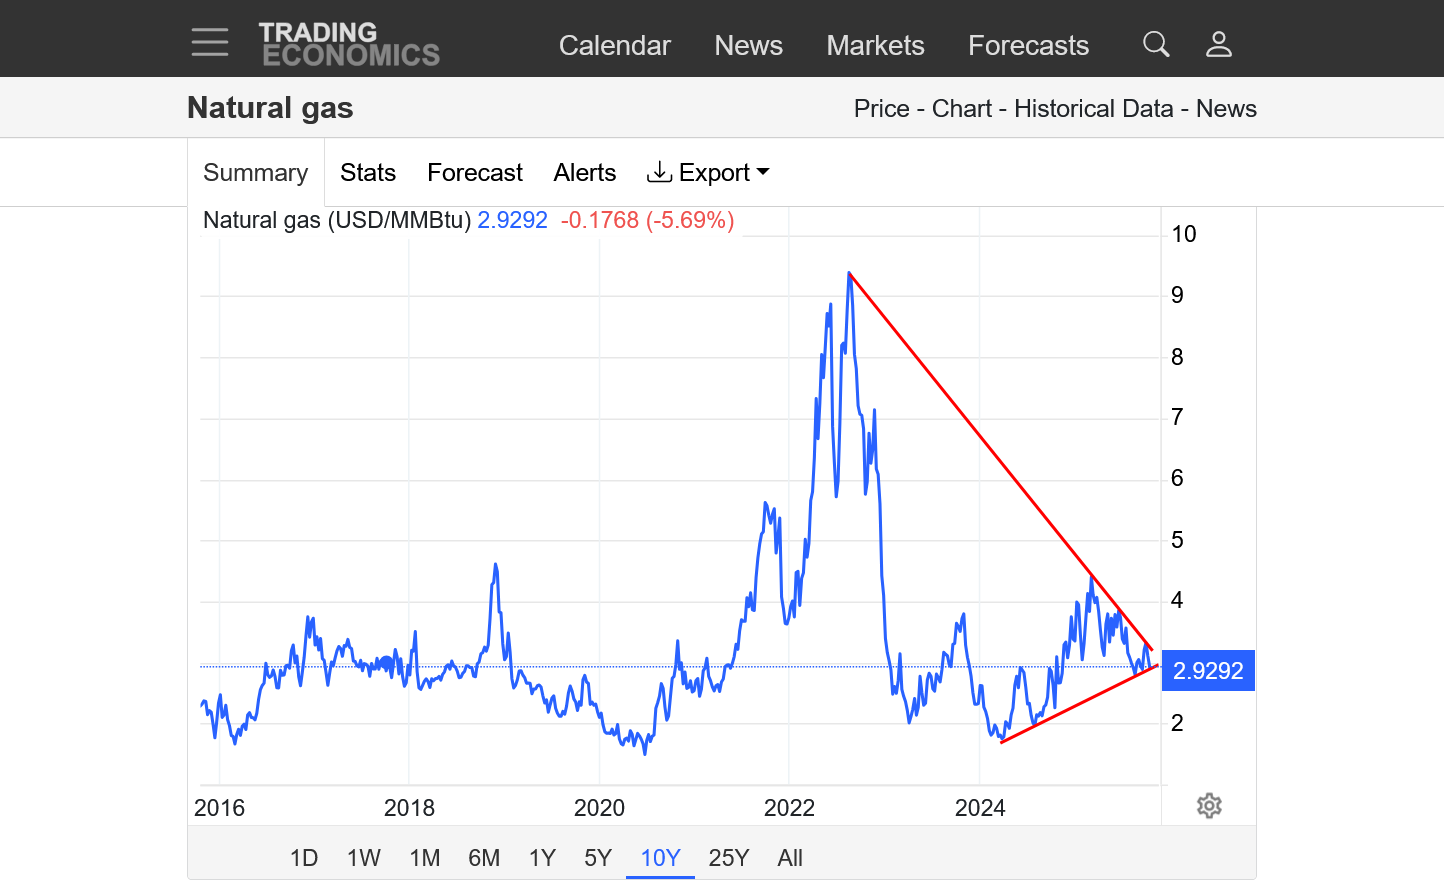
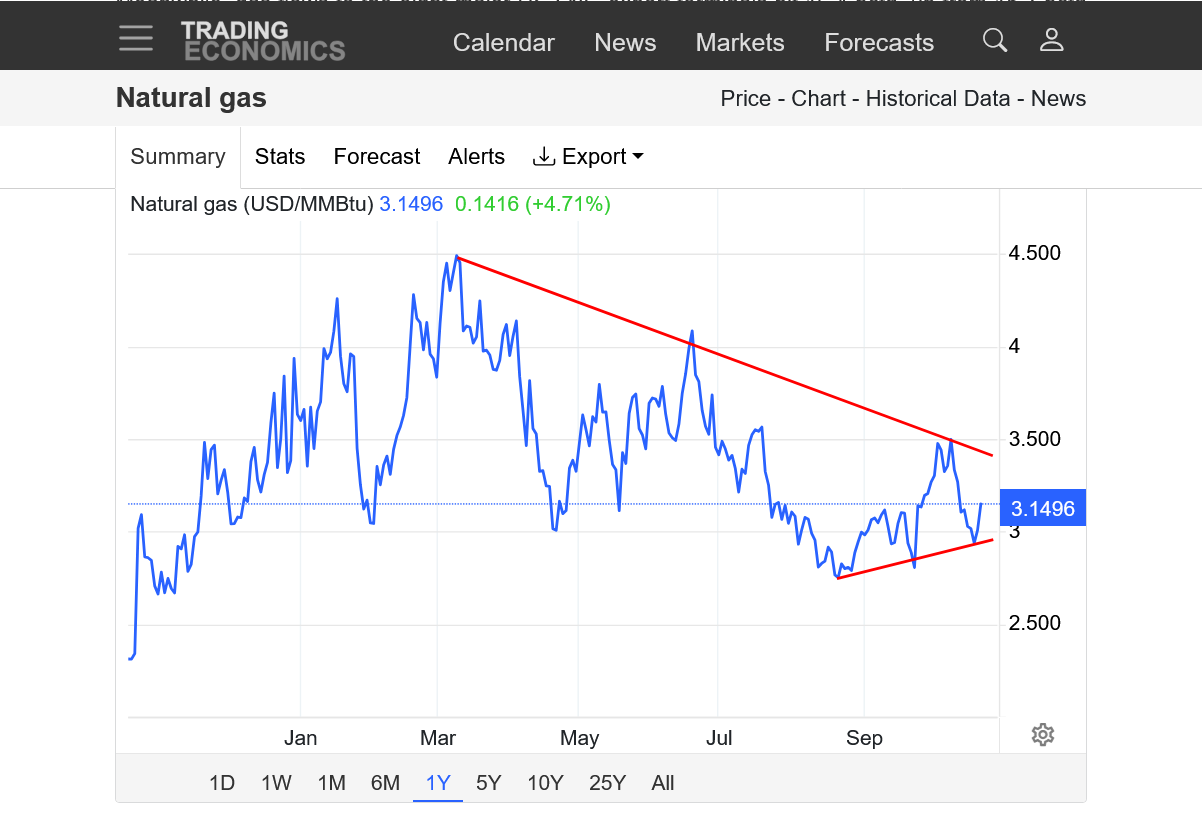
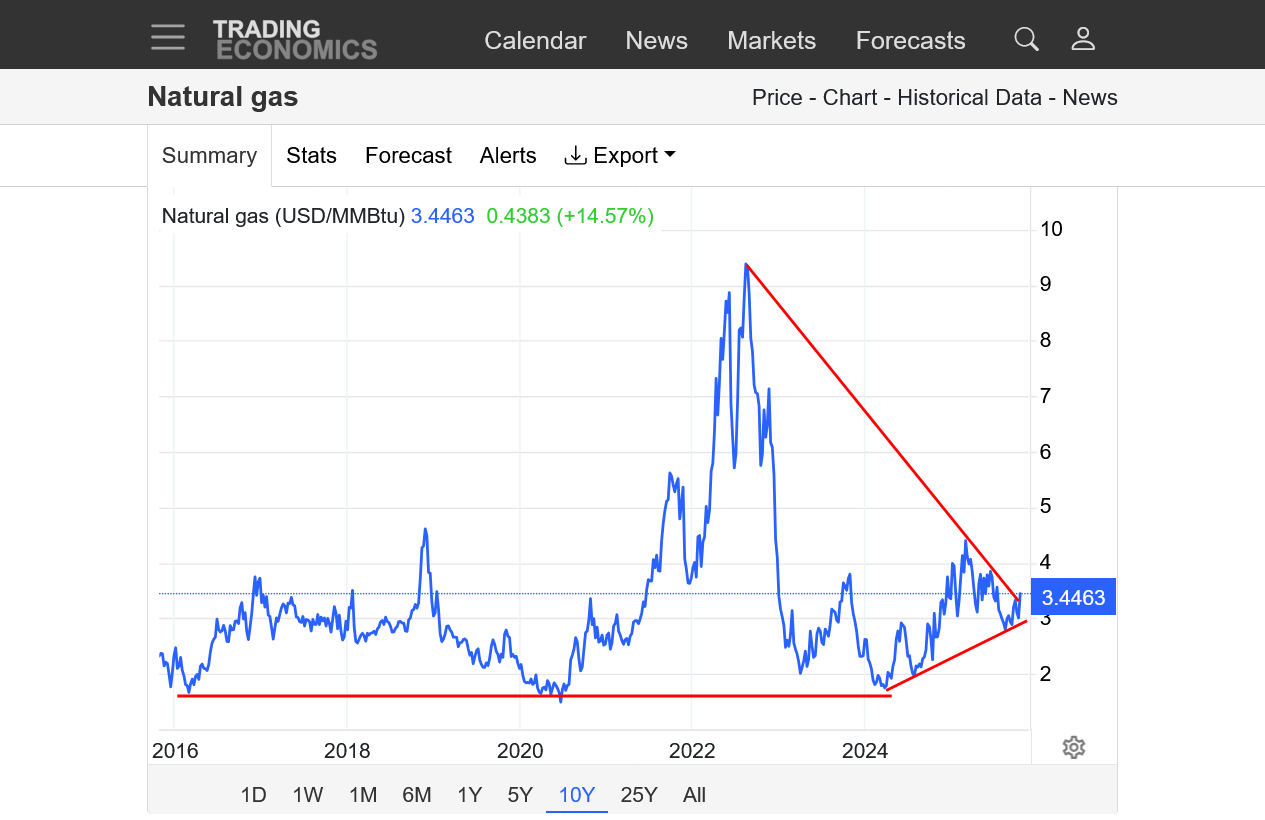
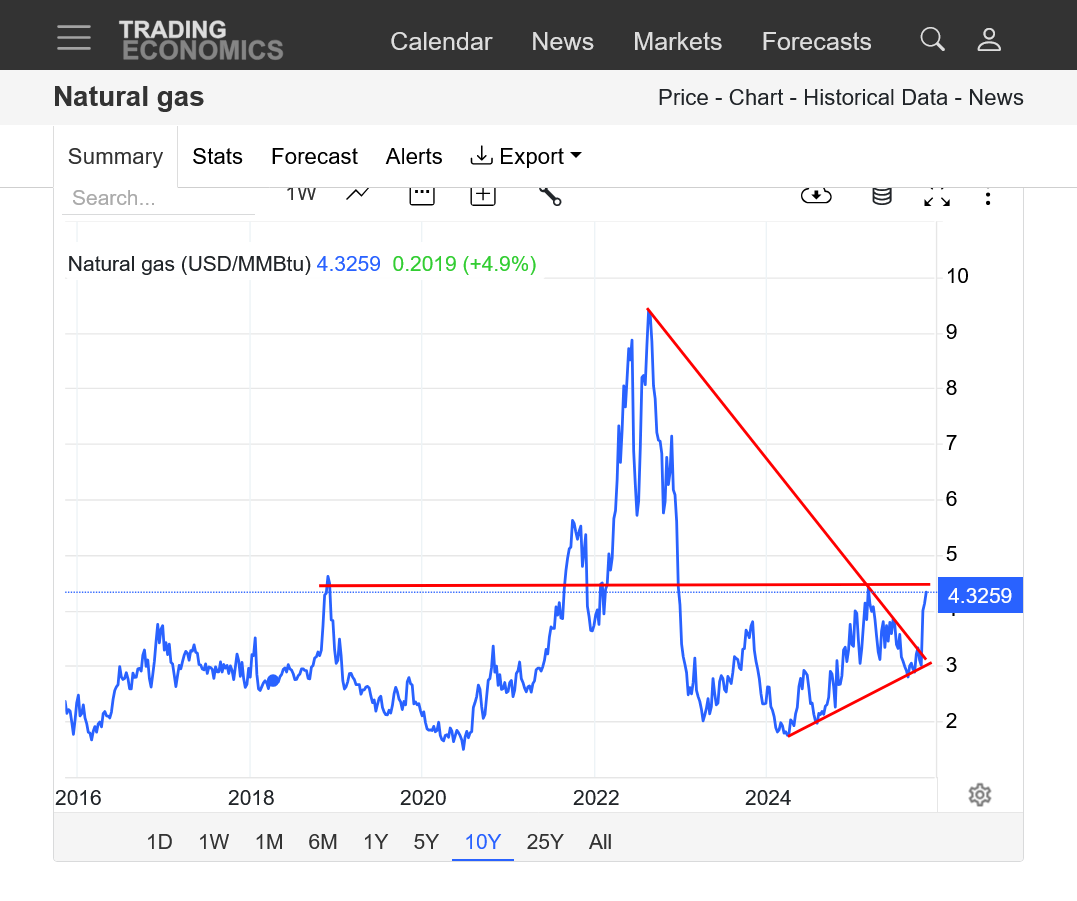
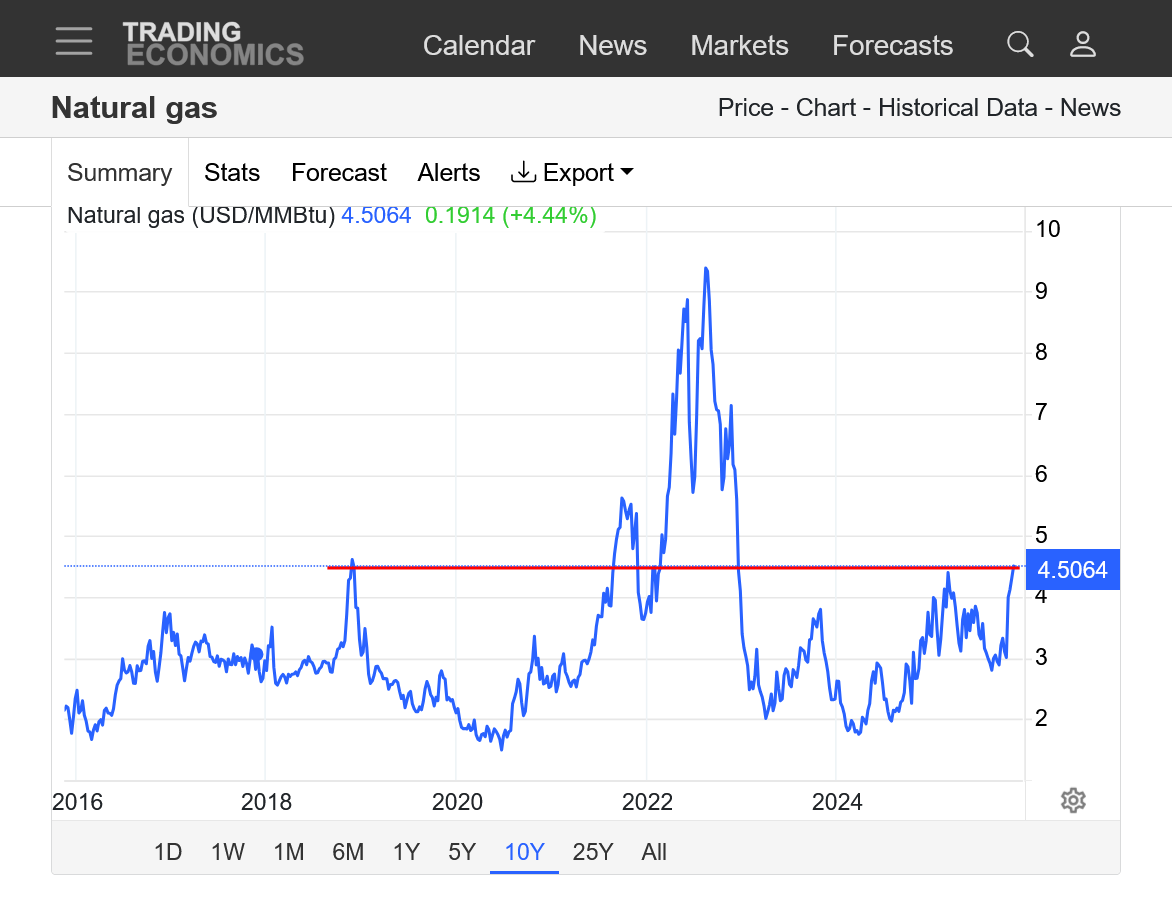
1. 10 years: Classical symmetrical wedge with lower highs and higher lows.
2022-highs from very low storage, followed by massive injections and near record high storage-low prices in 2023/24, followed by near record draw downs from the cold Winter of 24/25-spike to a lower high early 2025. Downtrend line since then, recently touched as the apex of the triangle is approaching.
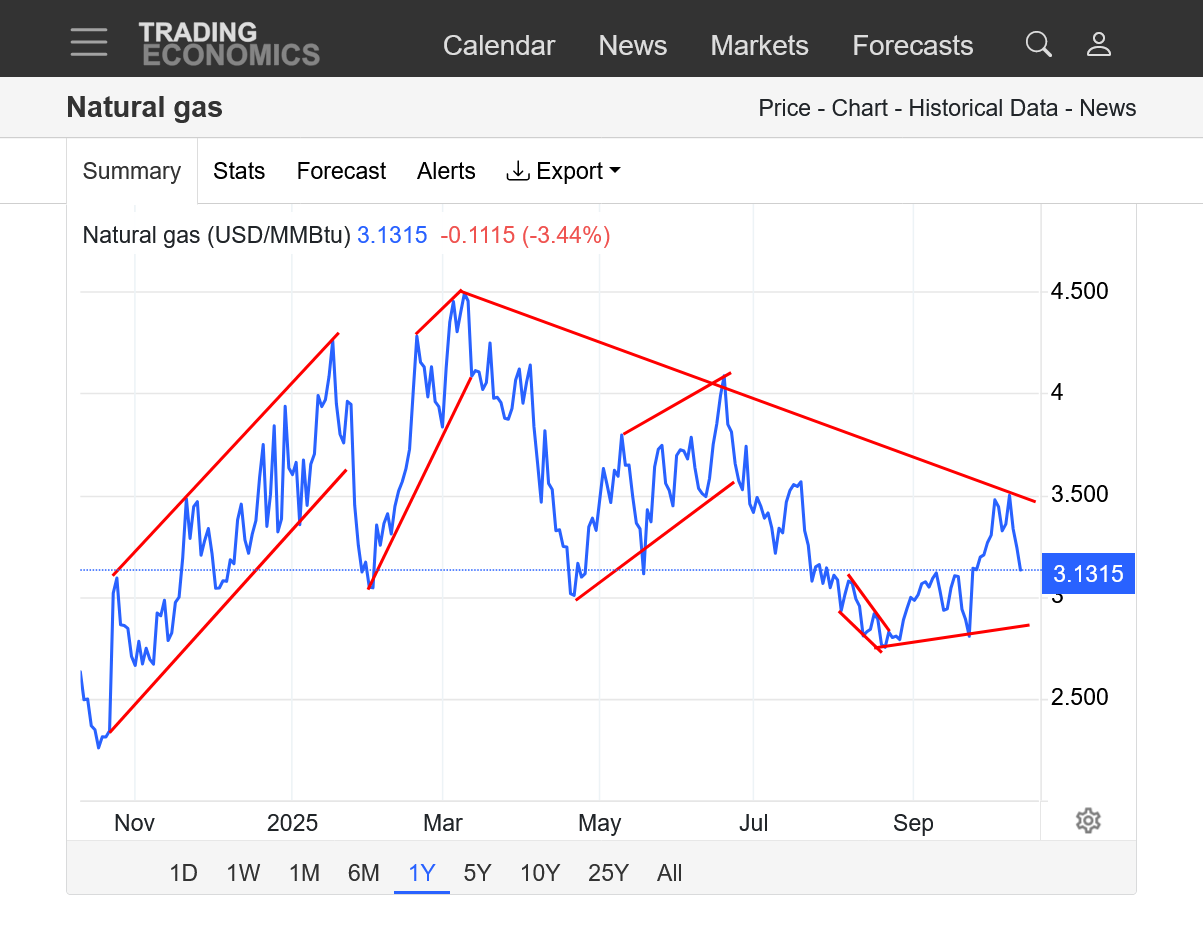
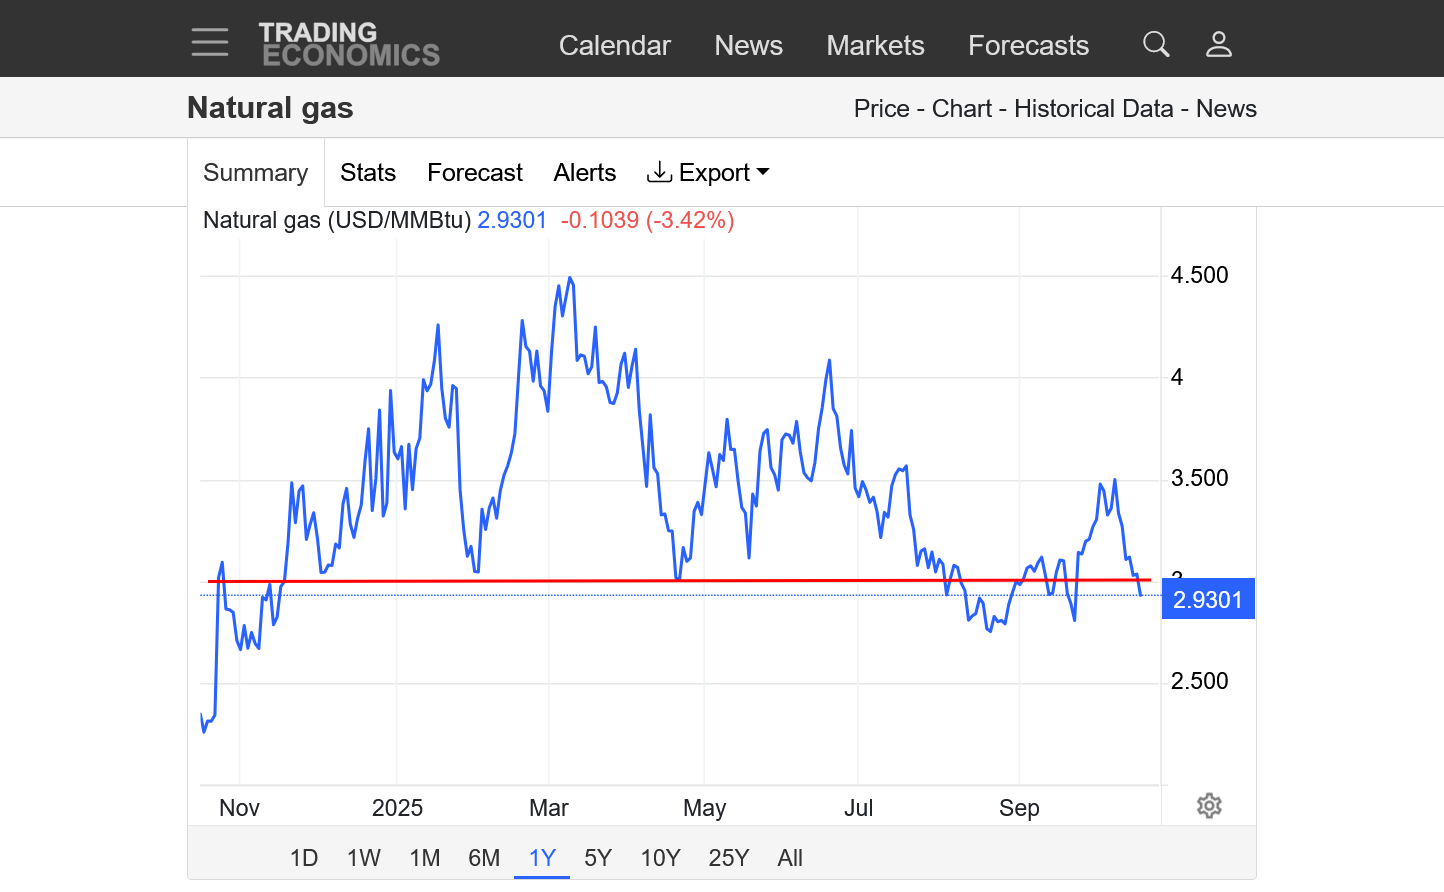
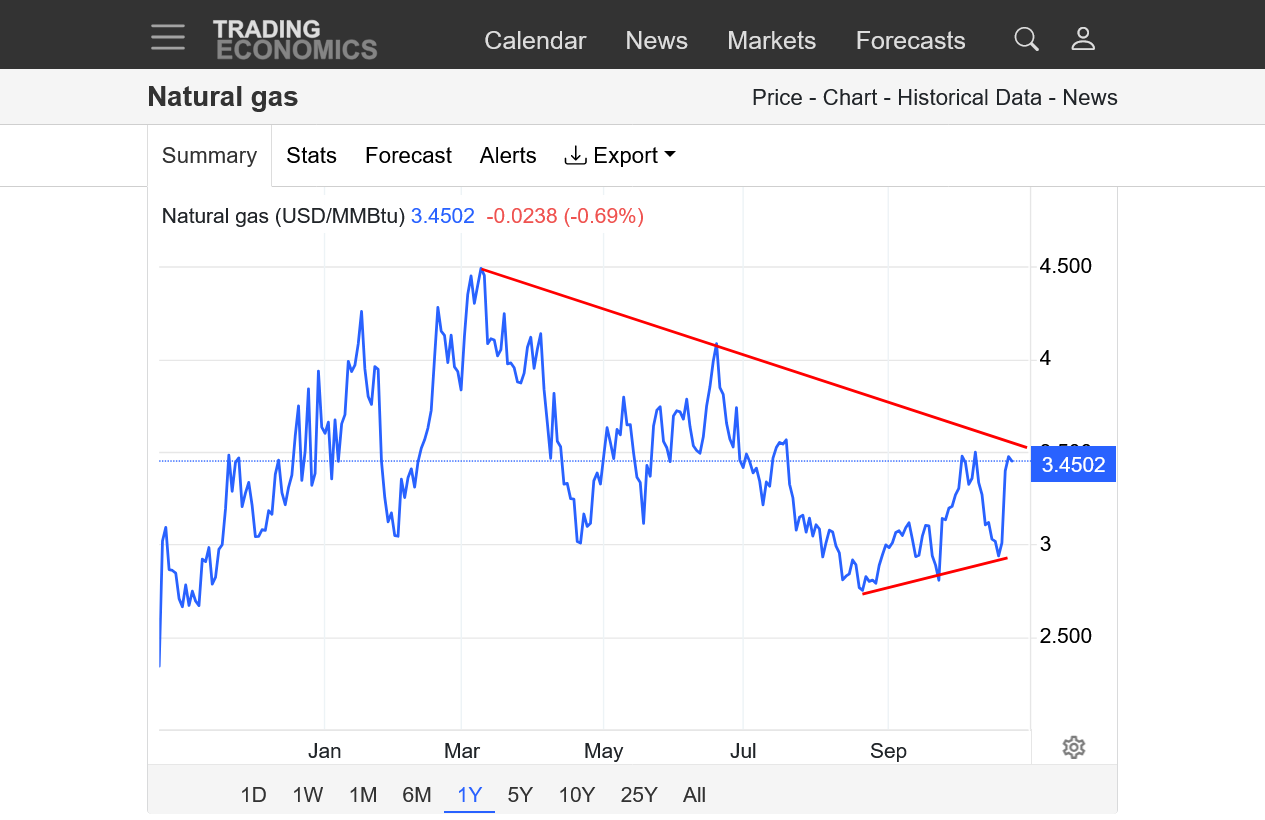
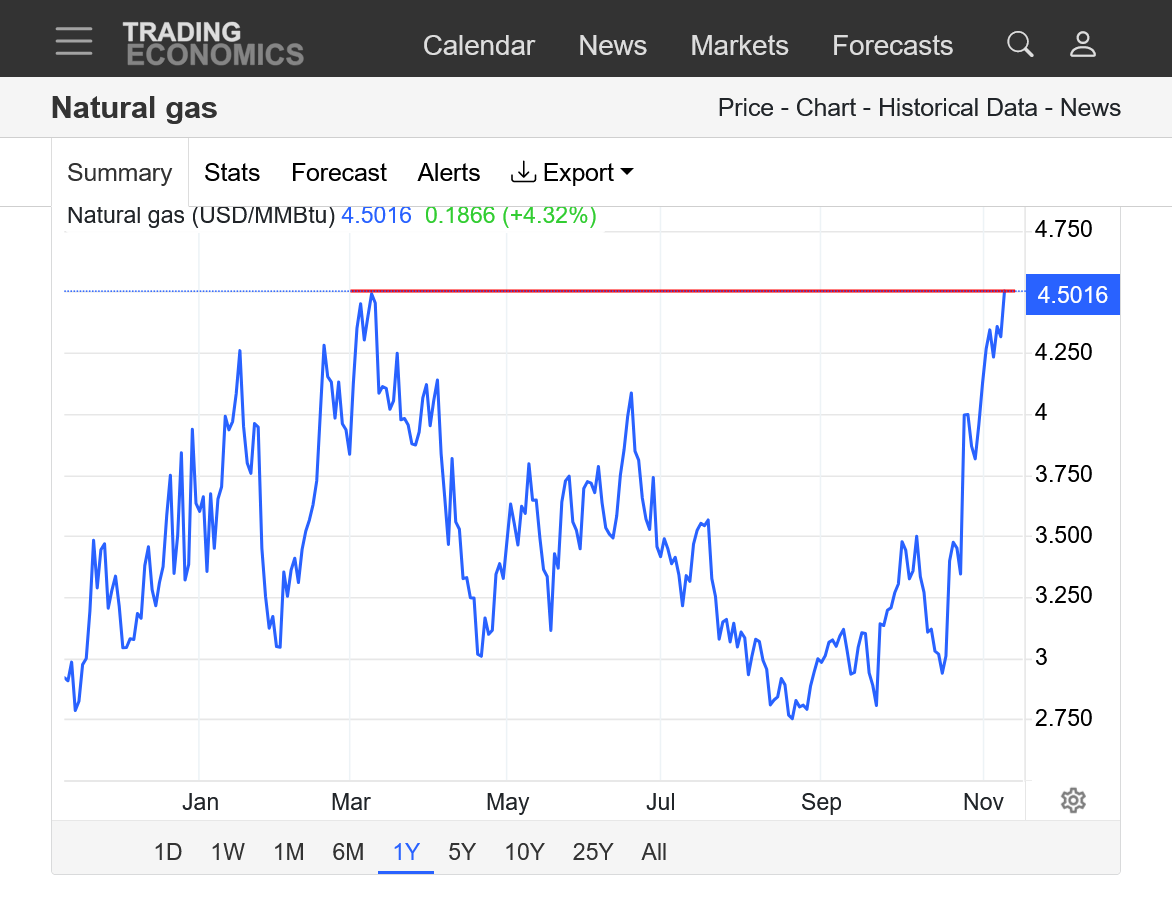
2. 1 year:
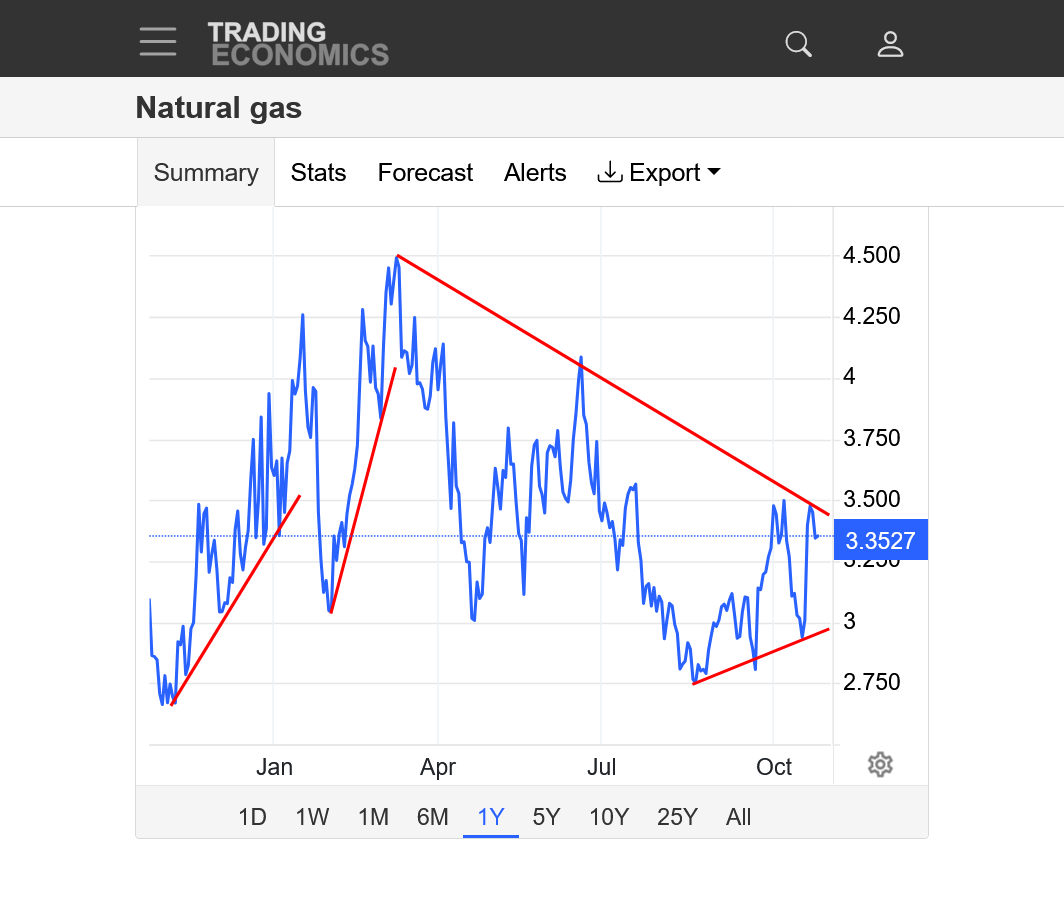
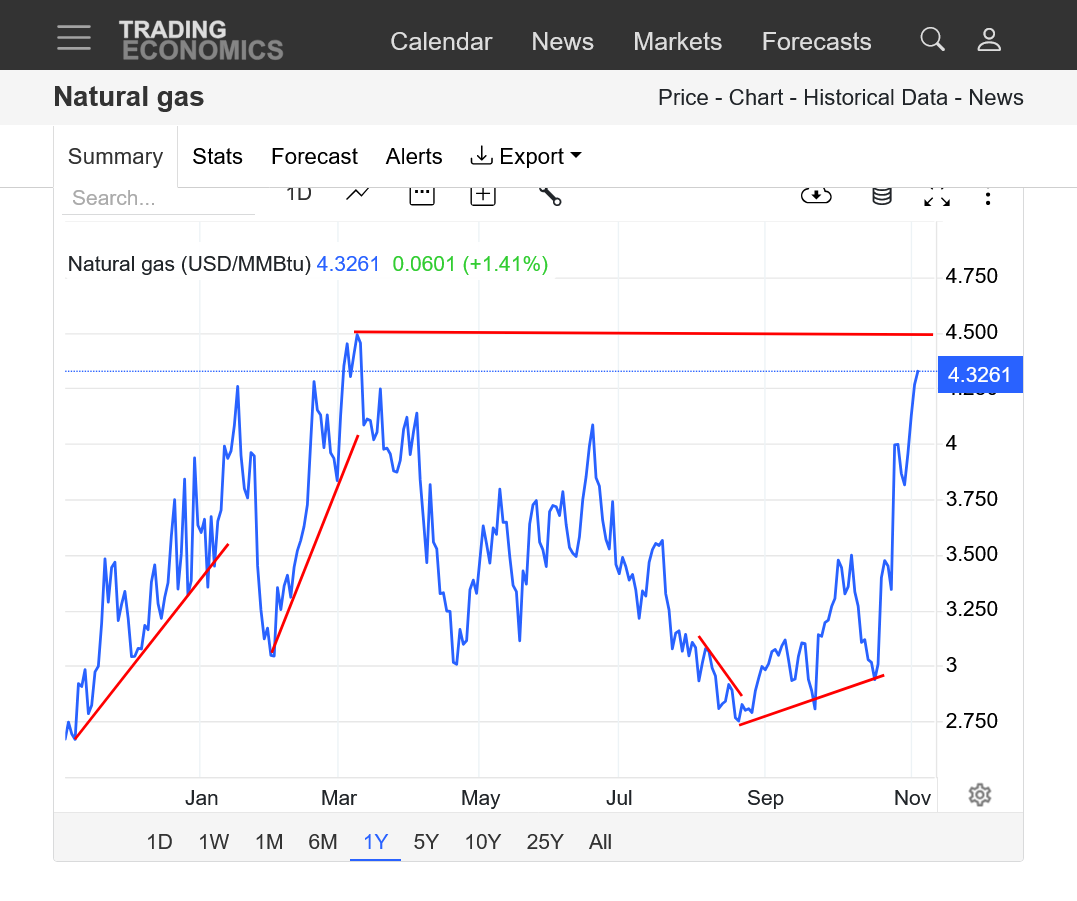
a. 2 strong uptrend channels from last Winters cold. Major market top in March 2025.
b. Late Spring/early Summer uptrend channel from Spring positive seasonal along with widespread intense heat forecasts for the Summer of 2025.
c. Downtrend channel that accelerated in late August from huge pattern change to widespread near record cool temps(and low electricity use for AC use, generated by burning natural gas)
d. Bottom ahead of positive Fall seasonal and late season heat returning with elevated CDDs.
e. Prices at the very end have plunged again as late season heat has turned from bullish to bearish. Rapidly increasing average HDDs pass up rapidly dropping CDDs on October 4th but every year is different. The VERY warm forecasts this week are now BEARISH weather.
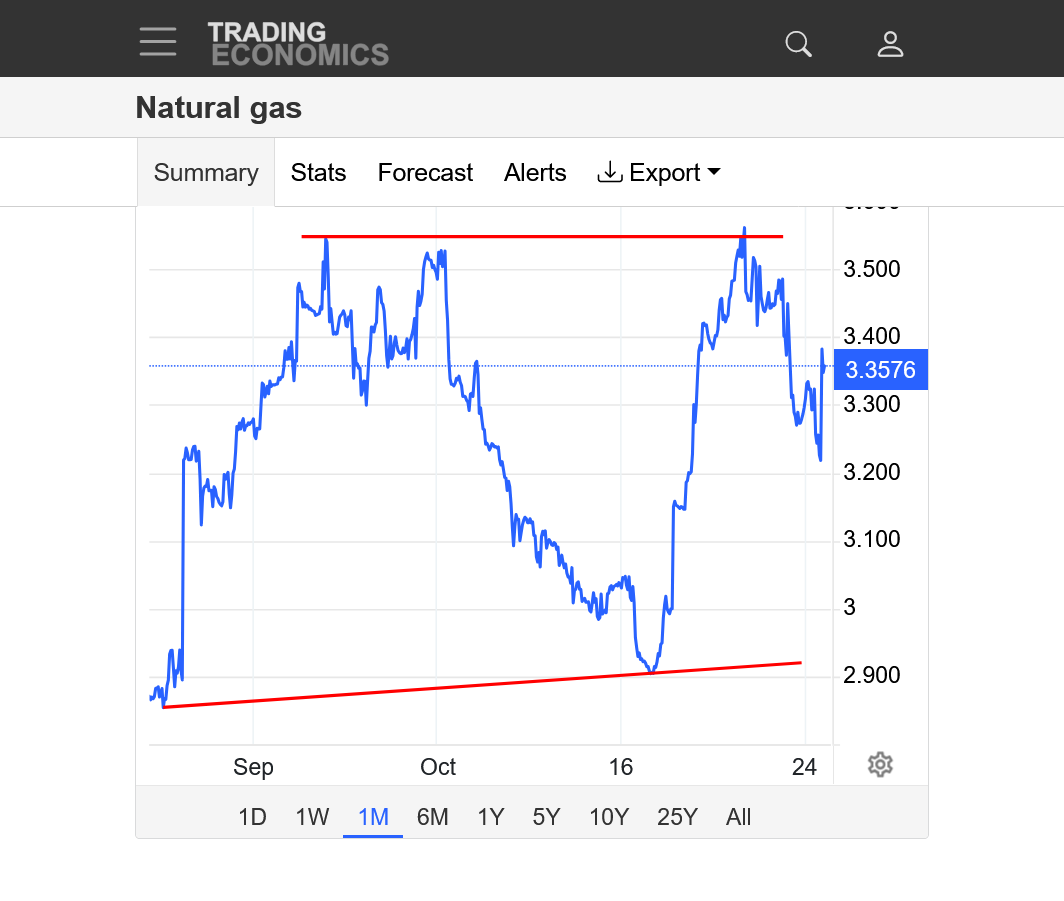
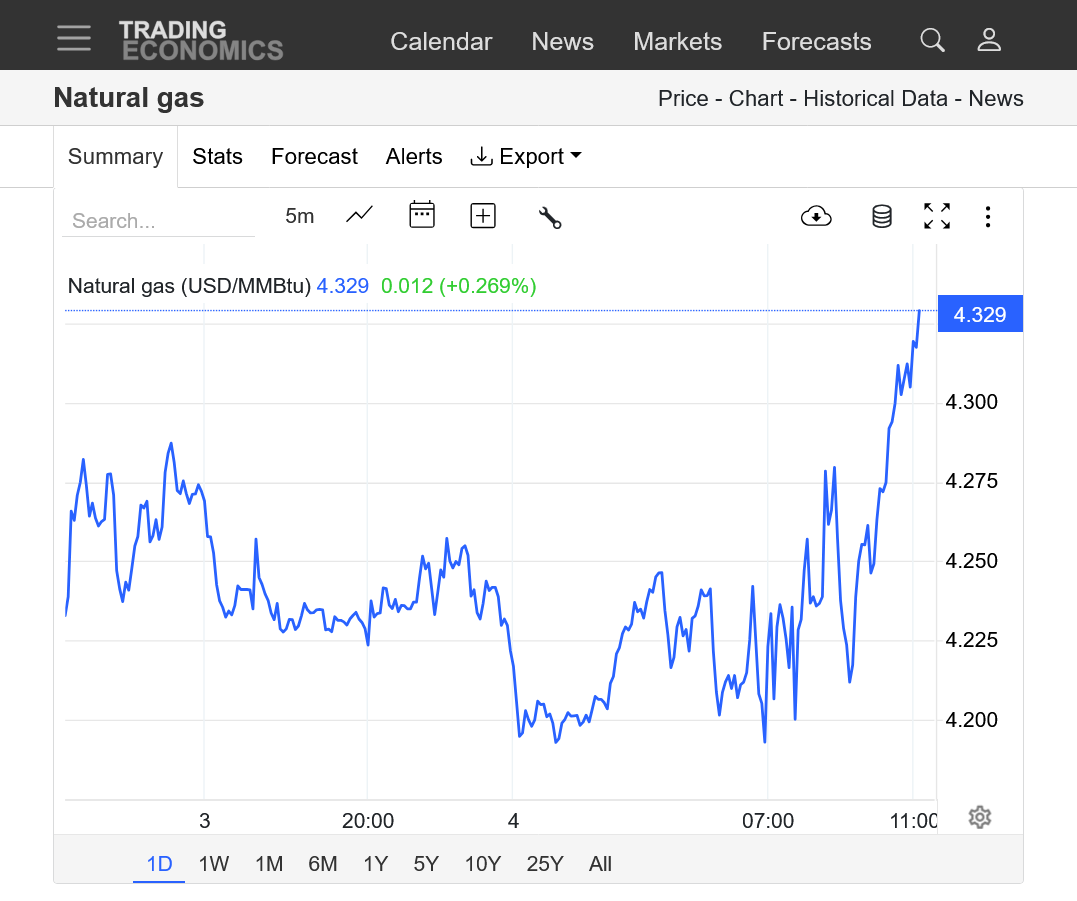
3. 1 month: Early seasonal high???? This usually doesn't happen until well into November but varies from year to year. My guess is that a pattern change to widespread MUCH colder temps in the high population centers that has staying power will make new highs.
The straight up line in the center of the graph was the price adjustment from the lower priced October contract rollover to the higher priced November contract that is the current front month.
Warm weather in late October is bearish.
Warm weather and depressed heating demand are not bearish natural gas.
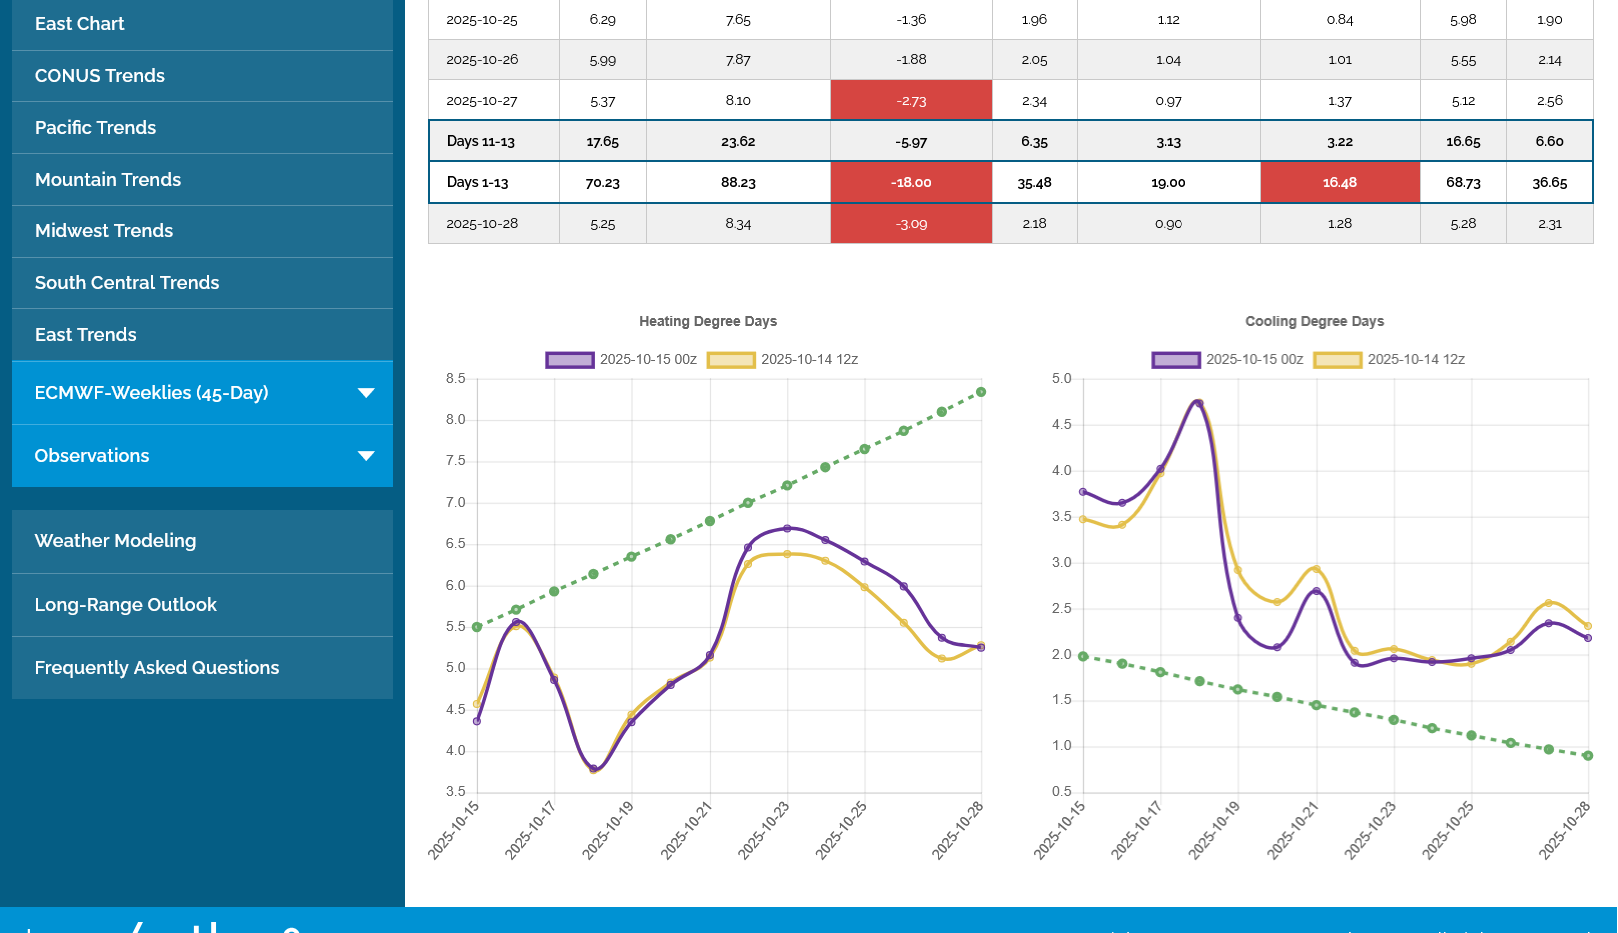
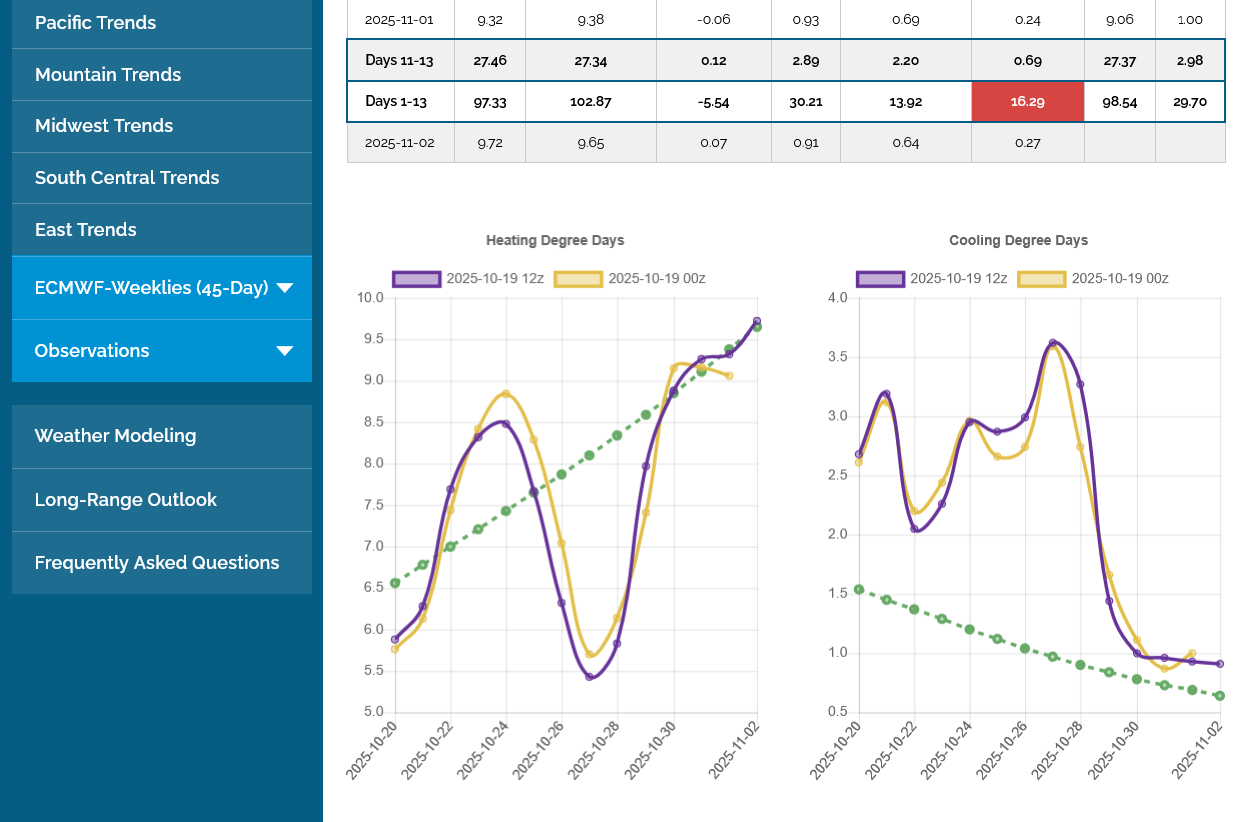
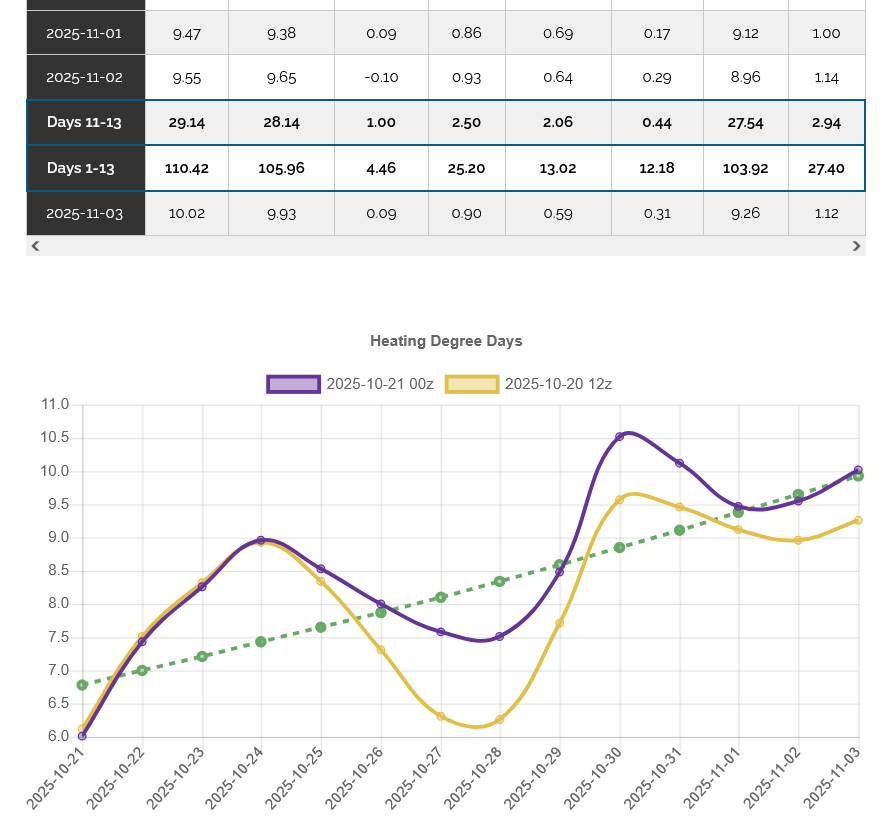
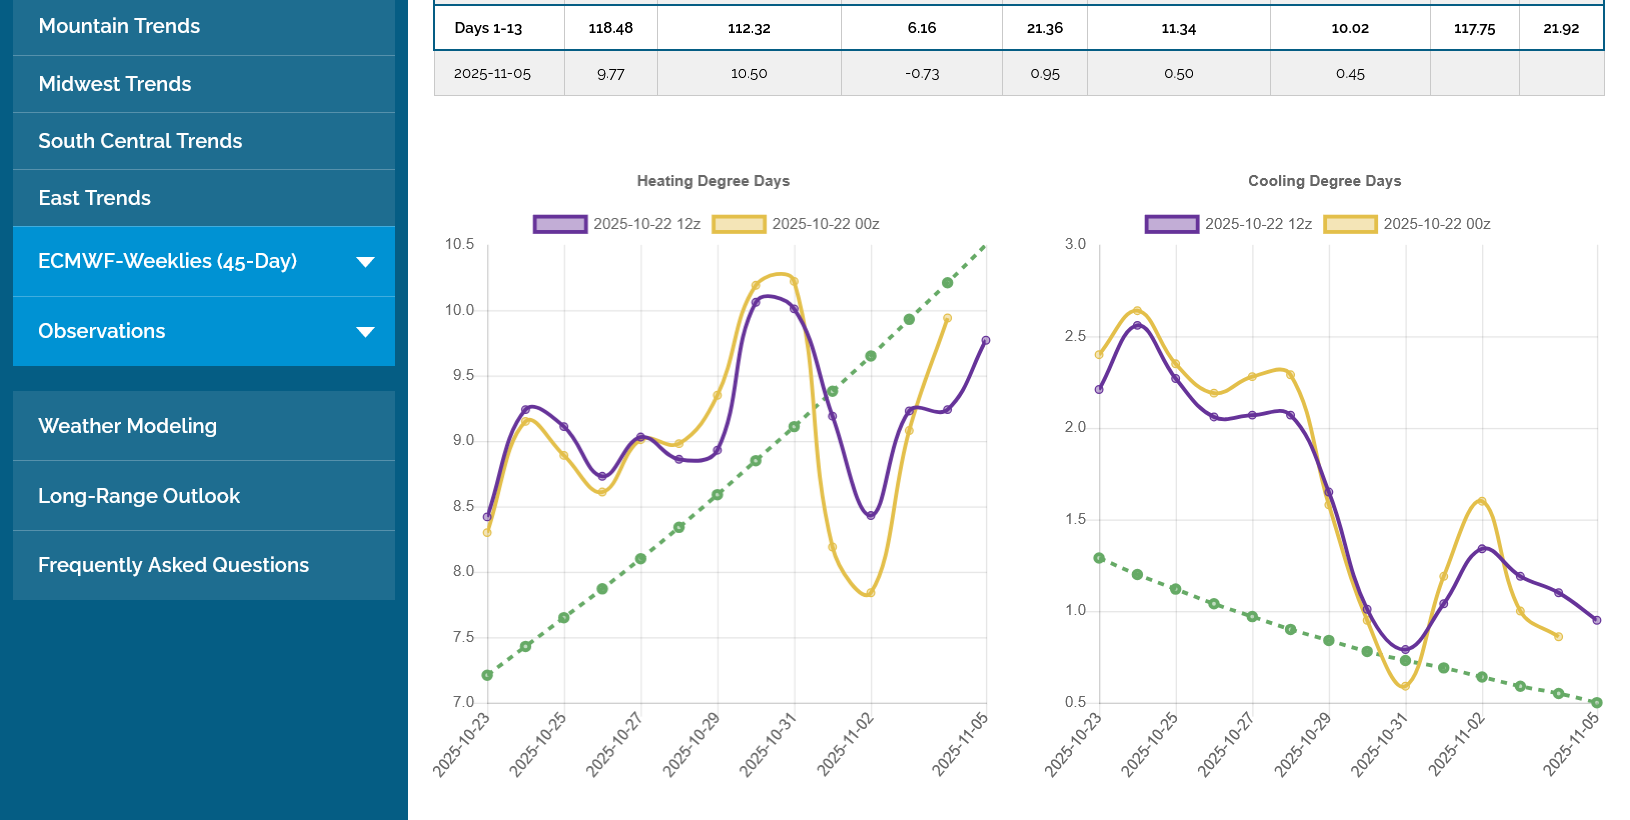
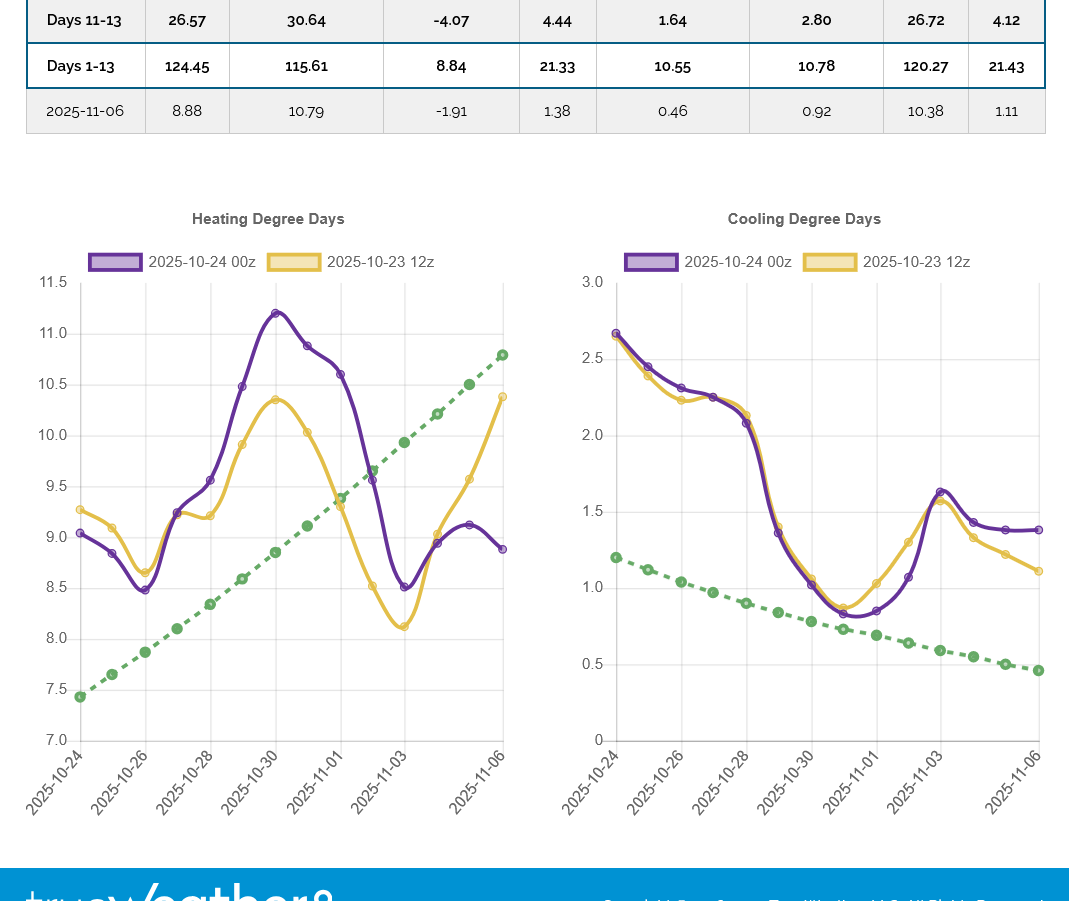
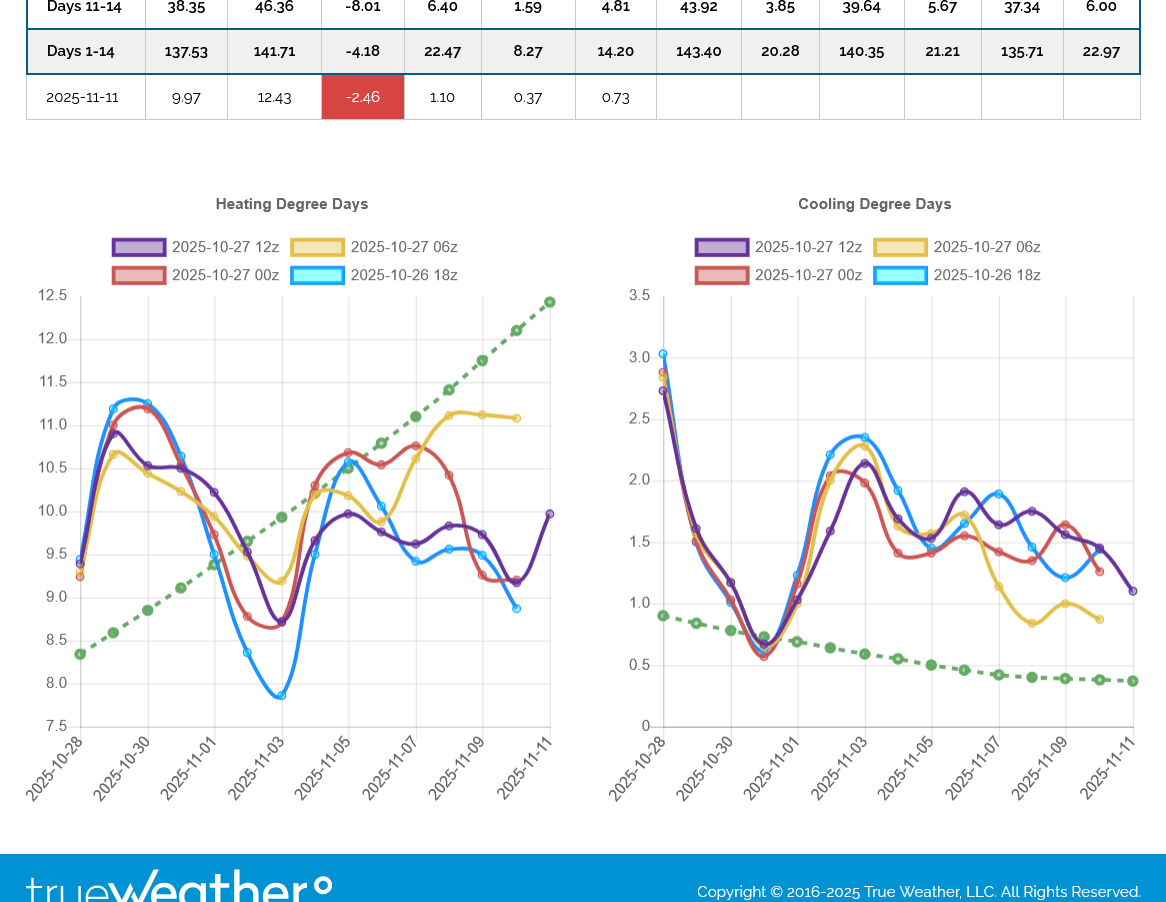
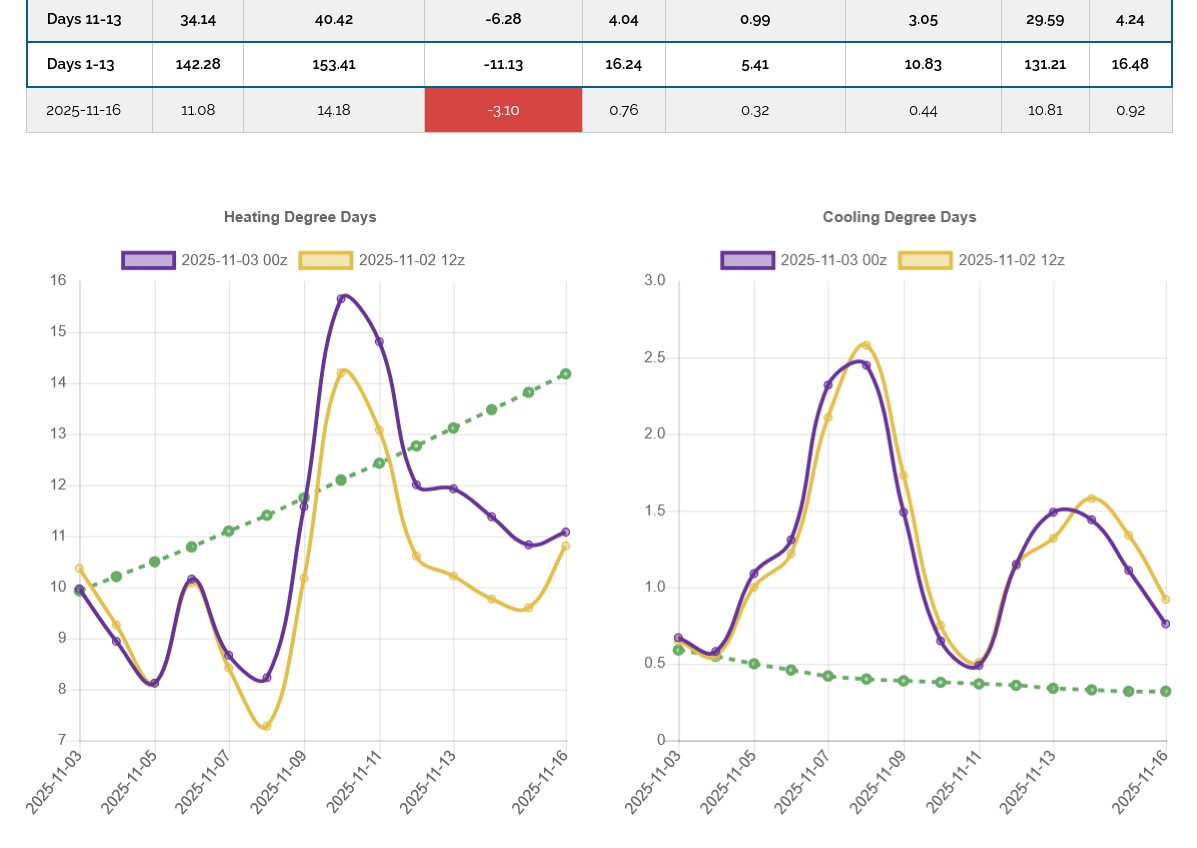
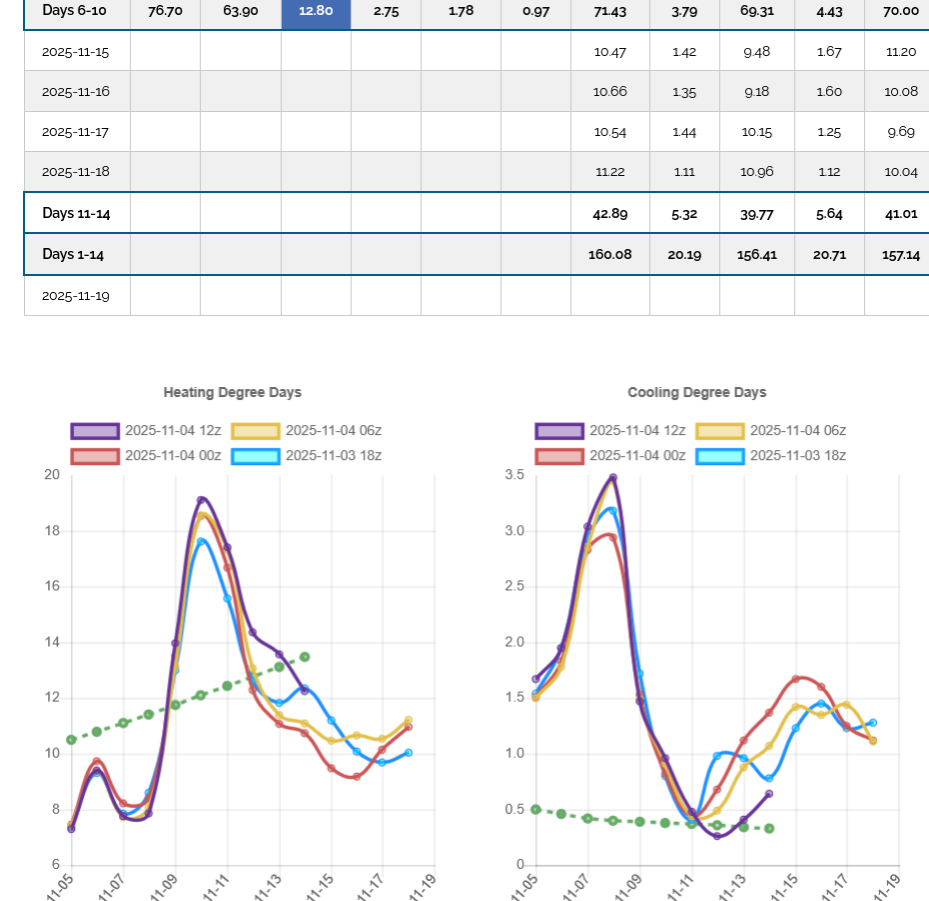
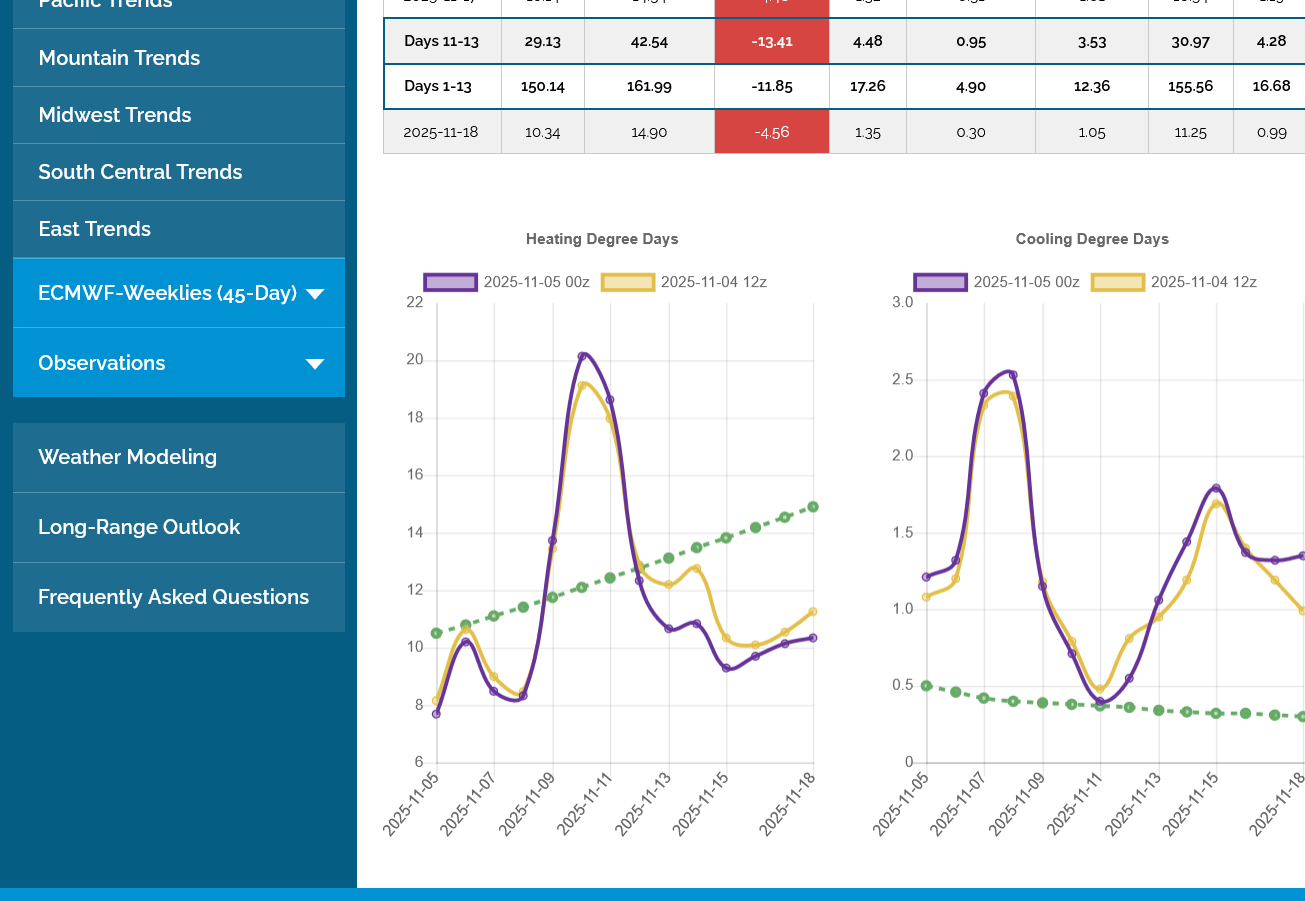
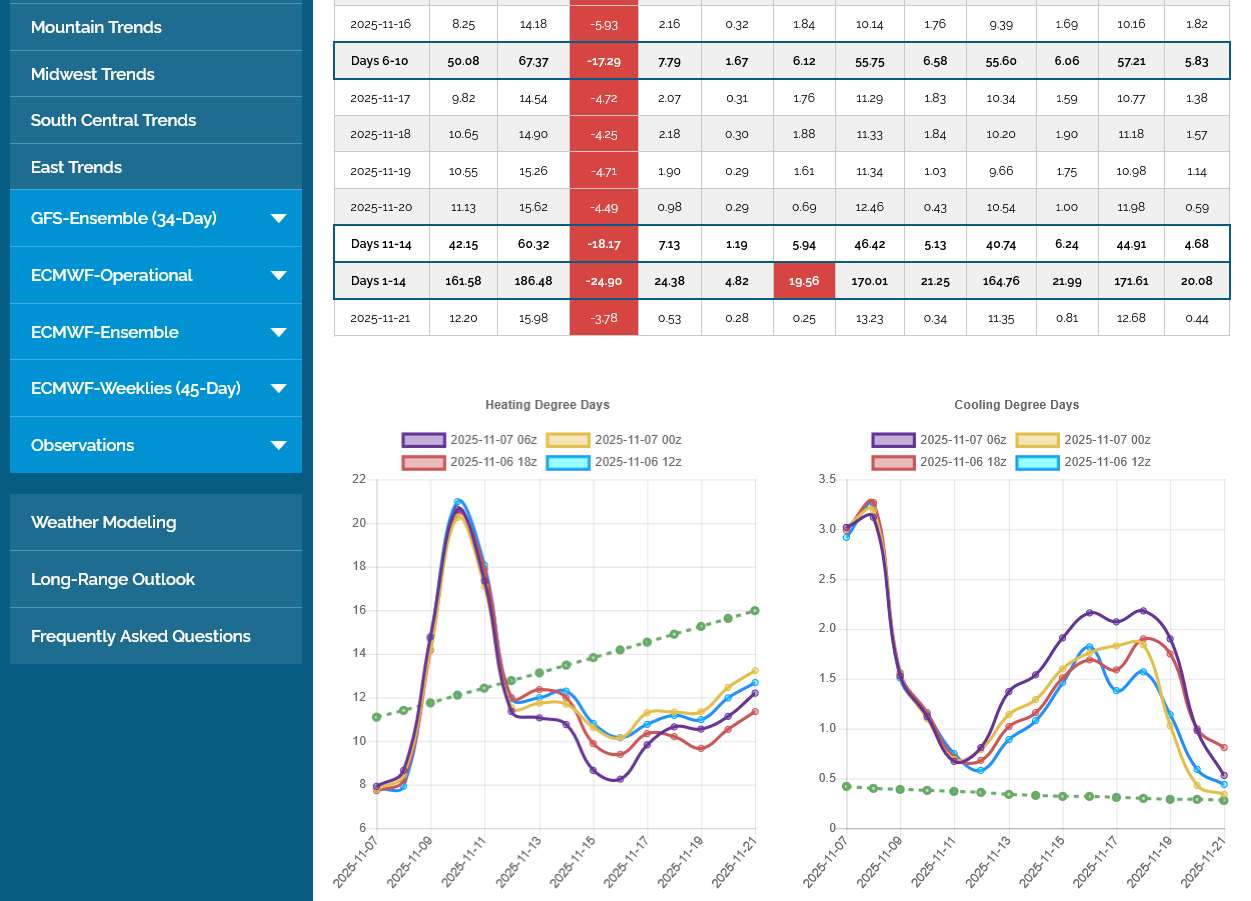
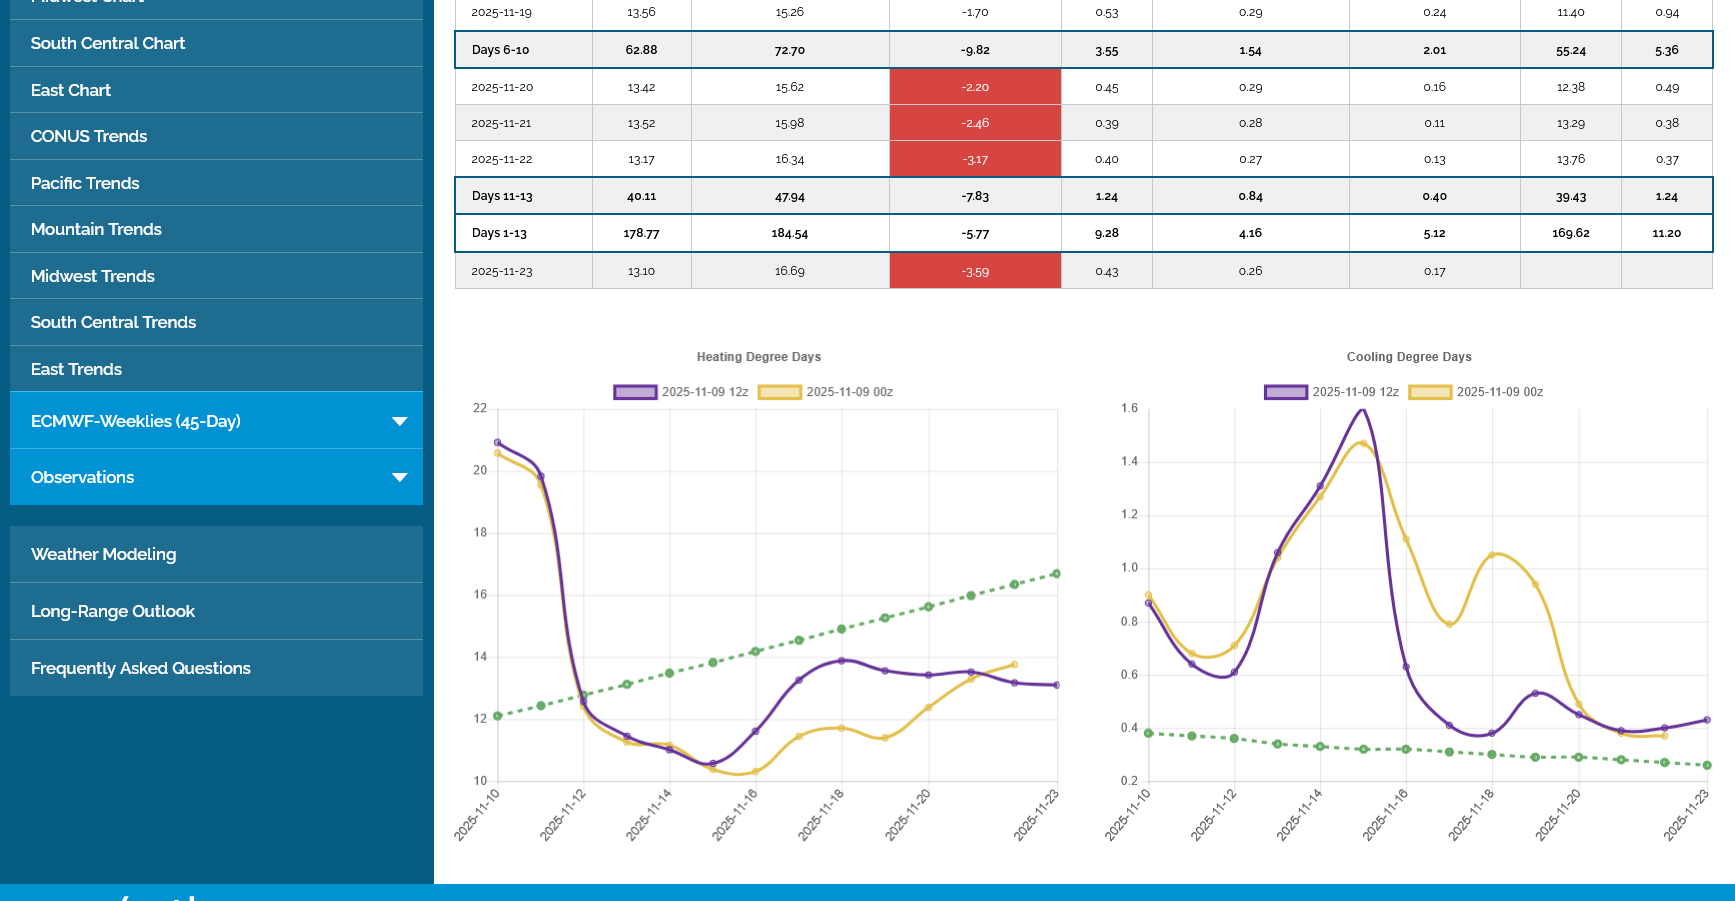
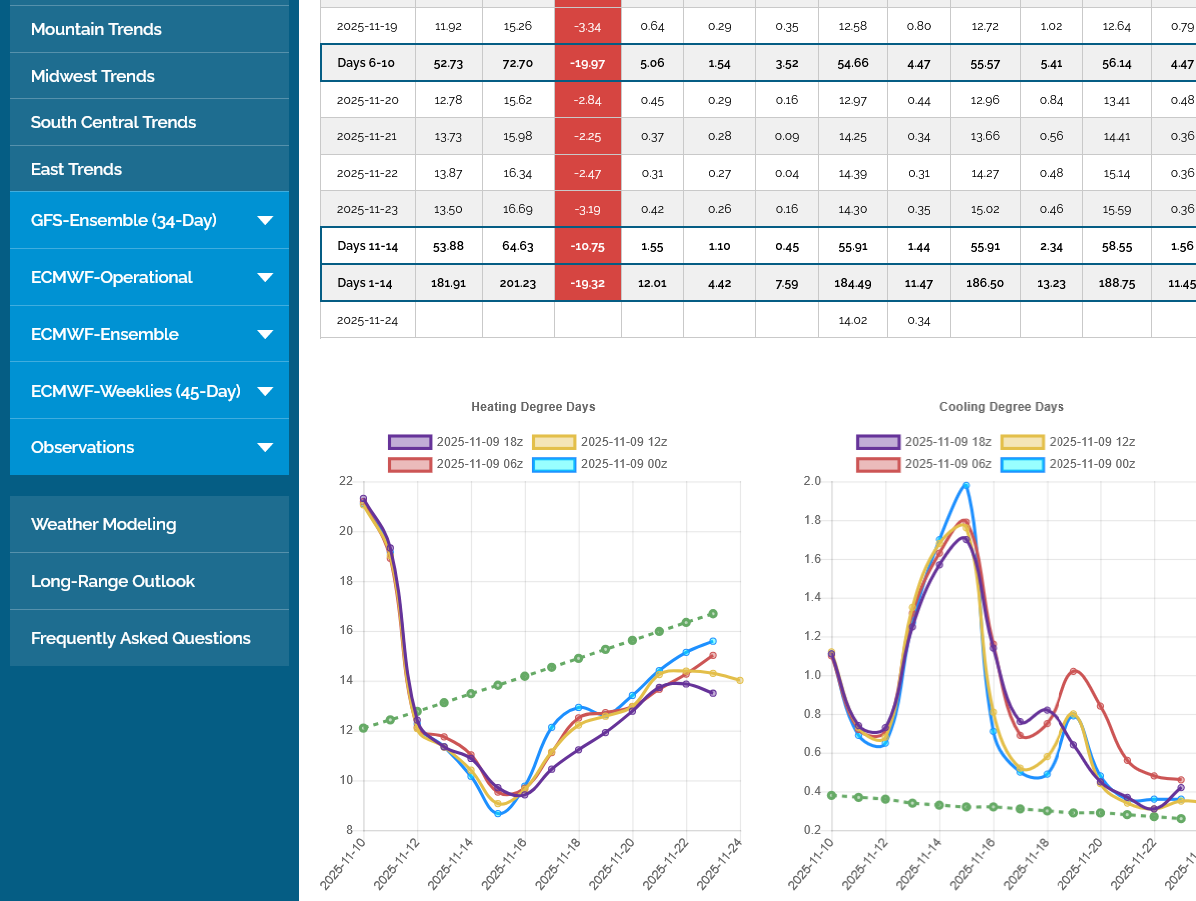
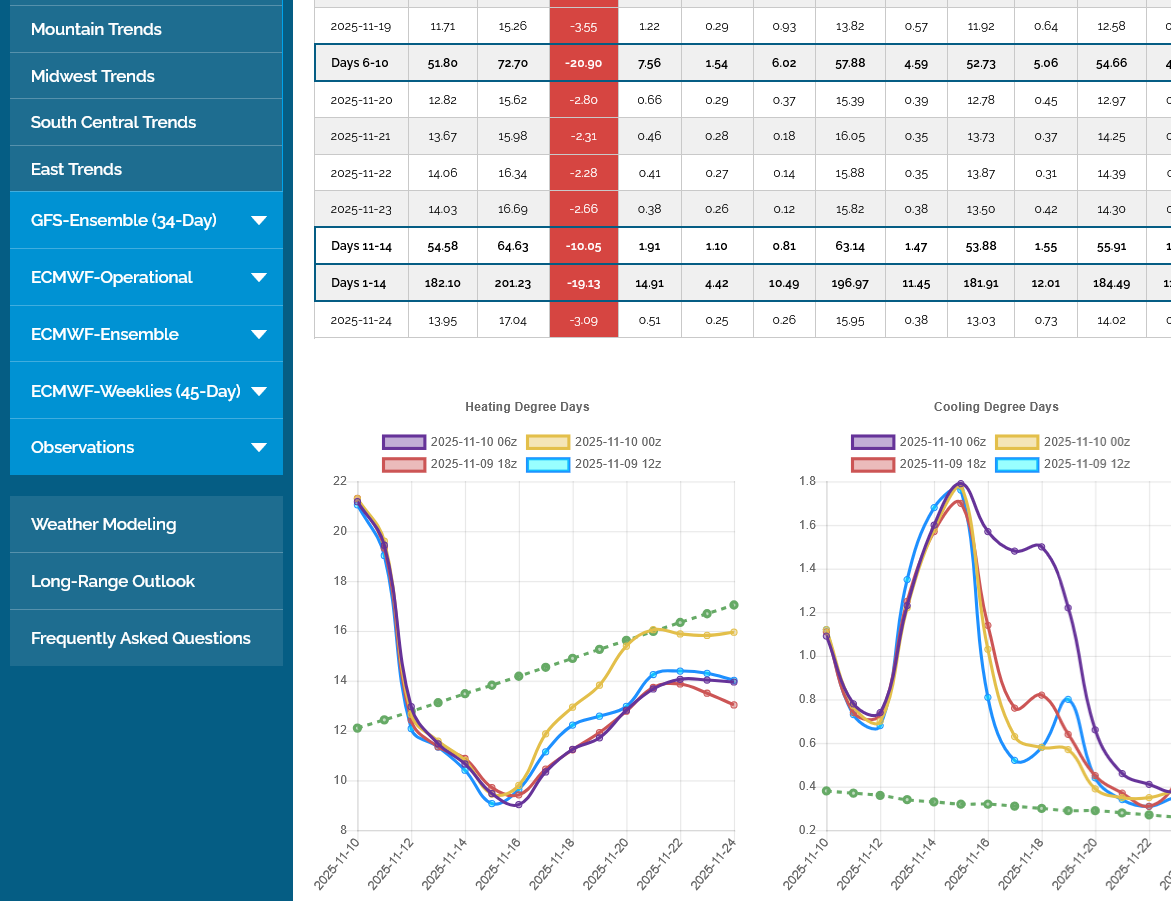
This was the last European Ensemble model average. HDDs are on the left. Green dashed line shows how quickly the seasonal average is increasing. We will be well below that the next 2 weeks. Purple was the last 0z run. The tan line was the previous 12z run from 12 hours earlier.
Although the CDDs on the right are elevated, by the end of the 2 week period below, the average, climatology/historical HDDs are 8 times higher than the average CDDs.
This futures market trades on weather patterns coming up and how they impact heating and cooling demand as far as 2+ weeks from now. The NG market is interpreting warm=bearish until, at least April. However, ng stops trading temperature forecasts closely towards the end of Winter(unless storage is unusually low) because its impossible to draw down storage from robust levels when more than half of Winter is over.
This temperature product is no longer available, starting October 9, 2025(so I have the last date for data on October 8th below). Not sure if this is related to the government shutdown since its automated and all the other NOAA sites are working.
https://www.cpc.ncep.noaa.gov/products/tanal/temp_analyses.php
+++++++++++++++++++++++
The injection of 80 Bcf was close to the middle of average guesses. Maybe a tad bullish with the price also going slightly higher for a very short while after the release.
https://ir.eia.gov/ngs/ngs.html
![]()
for week ending October 10, 2025 | Released: October 16, 2025 at 10:30 a.m. | Next Release: October 23, 2025
| underground storage, Lower 48 states Summary text CSV JSN | |||||||||||||||||||||||||
|---|---|---|---|---|---|---|---|---|---|---|---|---|---|---|---|---|---|---|---|---|---|---|---|---|---|
| Historical Comparisons | |||||||||||||||||||||||||
| Stocks billion cubic feet (Bcf) | Year ago (10/10/24) | 5-year average (2020-24) | |||||||||||||||||||||||
| Region | 10/10/25 | 10/03/25 | net change | implied flow | Bcf | % change | Bcf | % change | |||||||||||||||||
| East | 883 | 860 | 23 | 23 | 890 | -0.8 | 865 | 2.1 | |||||||||||||||||
| Midwest | 1,031 | 1,001 | 30 | 30 | 1,063 | -3.0 | 1,032 | -0.1 | |||||||||||||||||
| Mountain | 279 | 275 | 4 | 4 | 287 | -2.8 | 235 | 18.7 | |||||||||||||||||
| Pacific | 307 | 304 | 3 | 3 | 294 | 4.4 | 279 | 10.0 | |||||||||||||||||
| South Central | 1,221 | 1,201 | 20 | 20 | 1,162 | 5.1 | 1,157 | 5.5 | |||||||||||||||||
| Salt | 303 | 295 | 8 | 8 | 289 | 4.8 | 293 | 3.4 | |||||||||||||||||
| Nonsalt | 918 | 906 | 12 | 12 | 872 | 5.3 | 864 | 6.3 | |||||||||||||||||
| Total | 3,721 | 3,641 | 80 | 80 | 3,695 | 0.7 | 3,567 | 4.3 | |||||||||||||||||
| Totals may not equal sum of components because of independent rounding. | |||||||||||||||||||||||||
Working gas in storage was 3,721 Bcf as of Friday, October 10, 2025, according to EIA estimates. This represents a net increase of 80 Bcf from the previous week. Stocks were 26 Bcf higher than last year at this time and 154 Bcf above the five-year average of 3,567 Bcf. At 3,721 Bcf, total working gas is within the five-year historical range.
For information on sampling error in this report, see Estimated Measures of Sampling Variability table below.
Note: The shaded area indicates the range between the historical minimum and maximum values for the weekly series from 2020 through 2024. The dashed vertical lines indicate current and year-ago weekly periods.
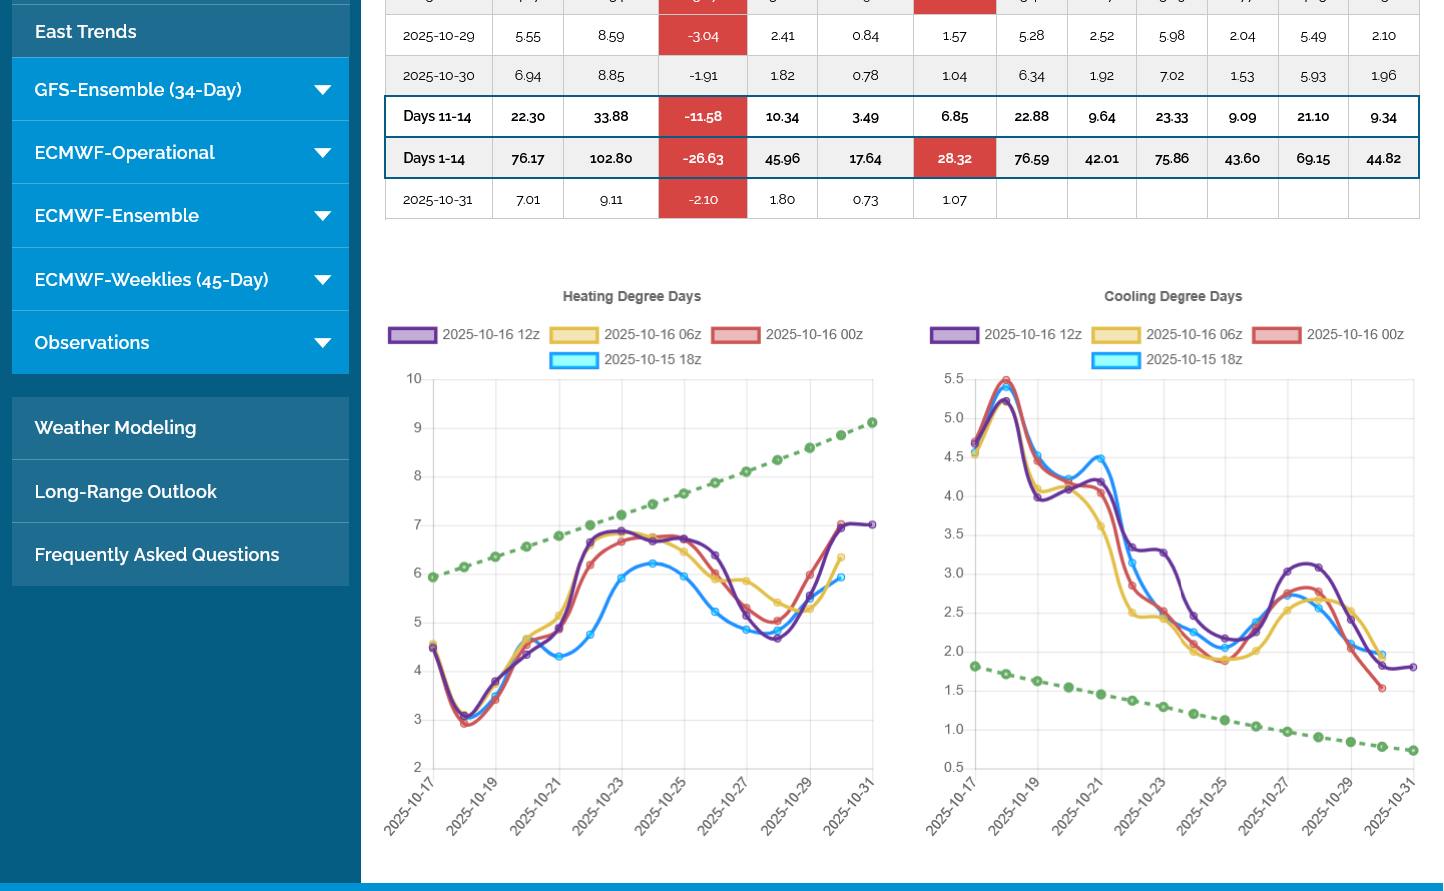
The just out 12z European Ensemble model, as well as the other models continues with above average temperatures for the rest of October. HDDs on the left, last run is always purple.
++++++++++
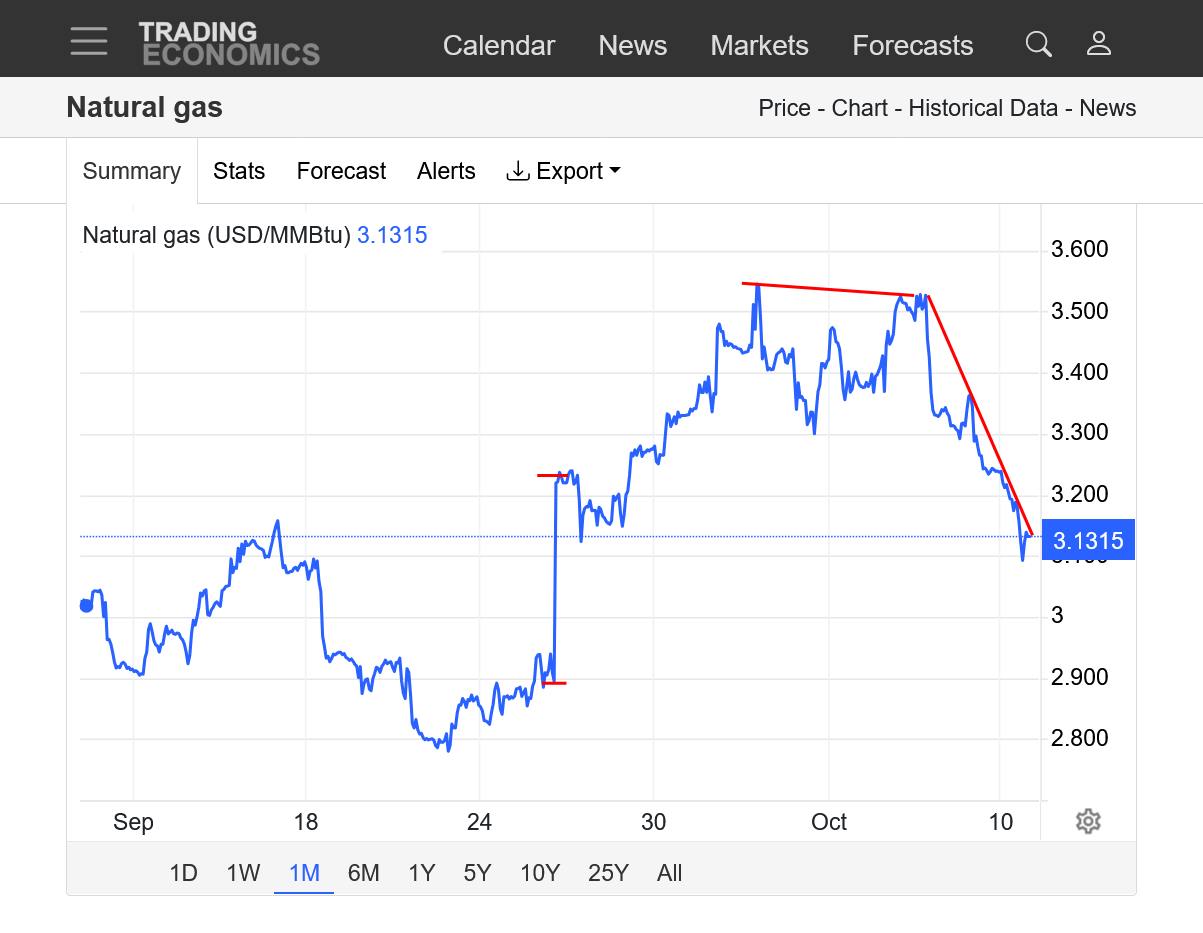
https://tradingeconomics.com/commodity/natural-gas
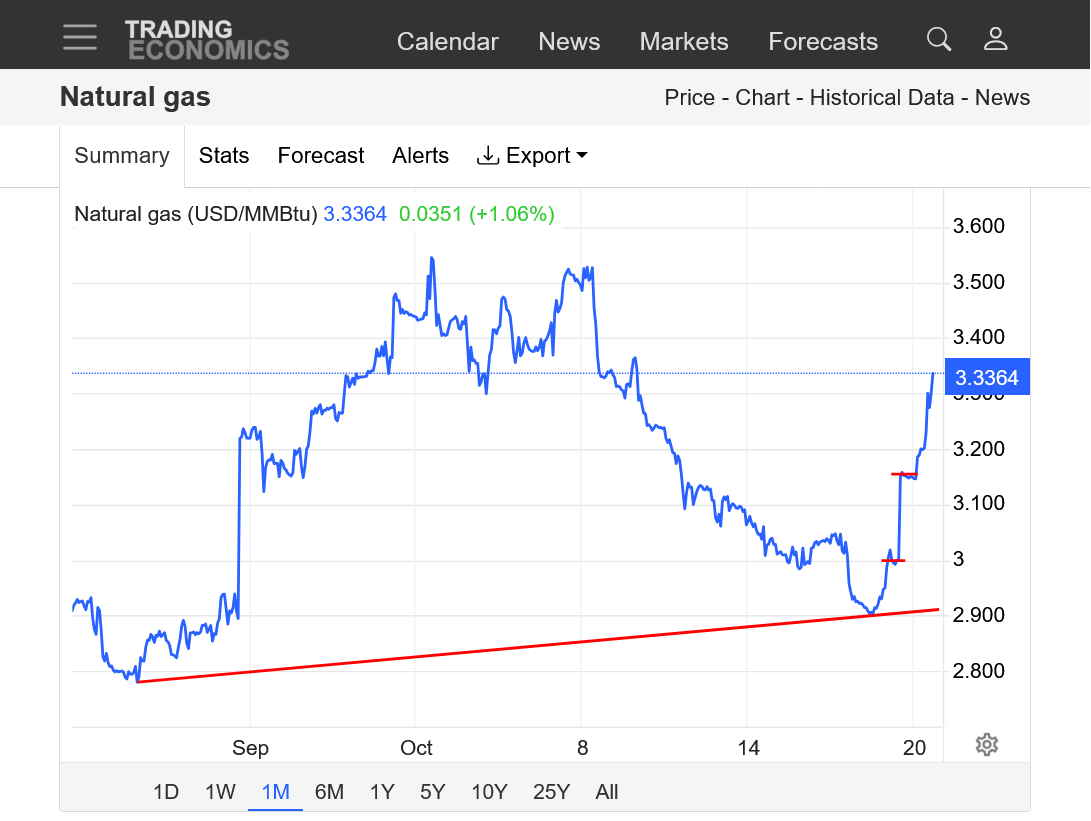
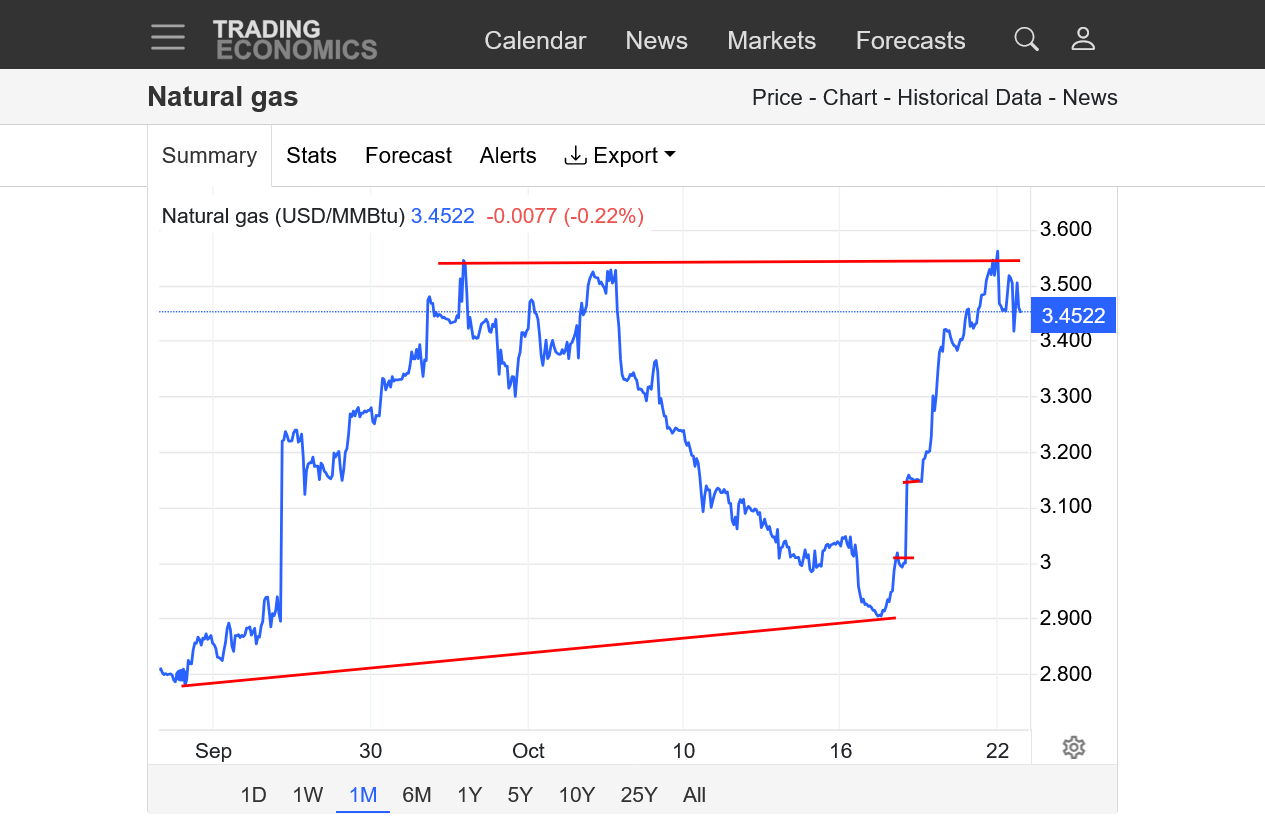
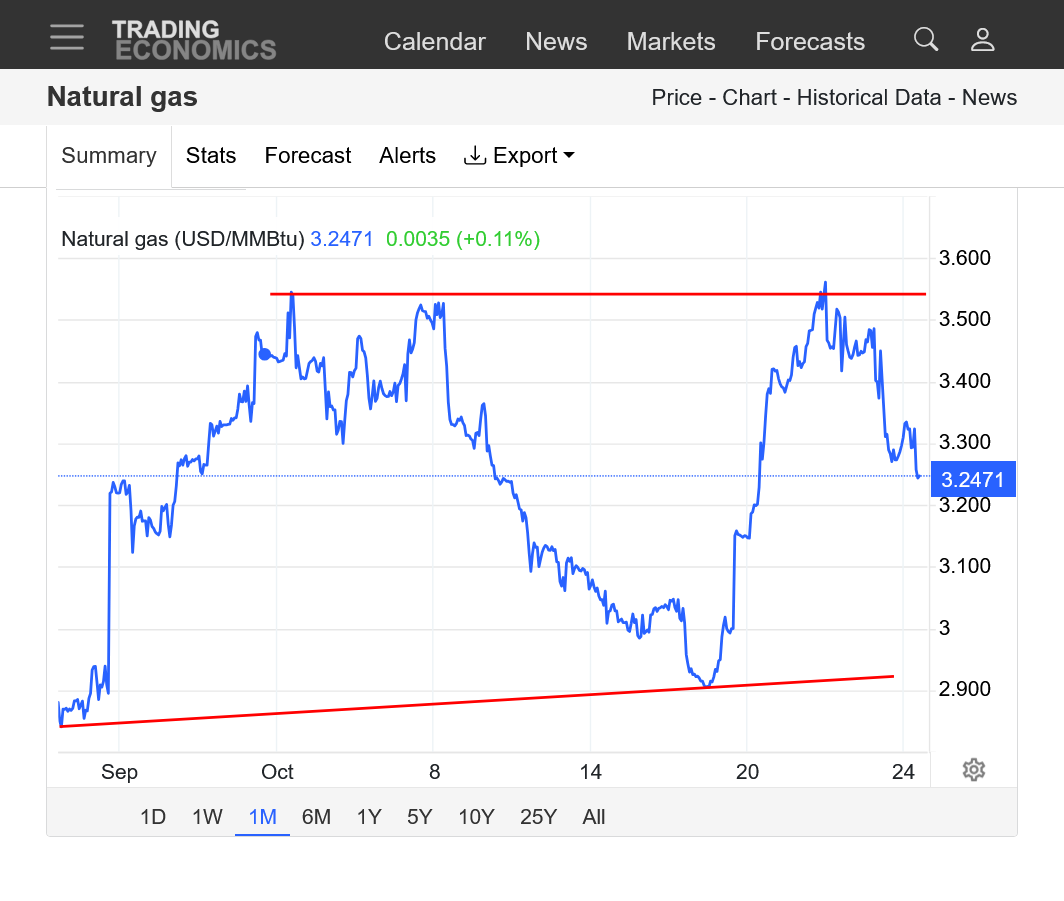
1. 1 month: Clear double top. Downtrend in October from very mild temps. The huge blip straight up in the center was when the October contract rolled over the the higher priced and current November contract.
2. 1 year: Now closing below key $3 support.
3. 10 years: Threatening to break out to the downside of a long lived symmetrical triangle (lower highs and higher lows).
A Trump recession will reduce INDUSTRIAL DEMAND and be bearish for natural gas prices. As long as temperatures remain mild, the downside is favored, despite this being the time of year with positive price seasonals. Any sign of a pattern shift to sharply colder should trigger a big bounce up. 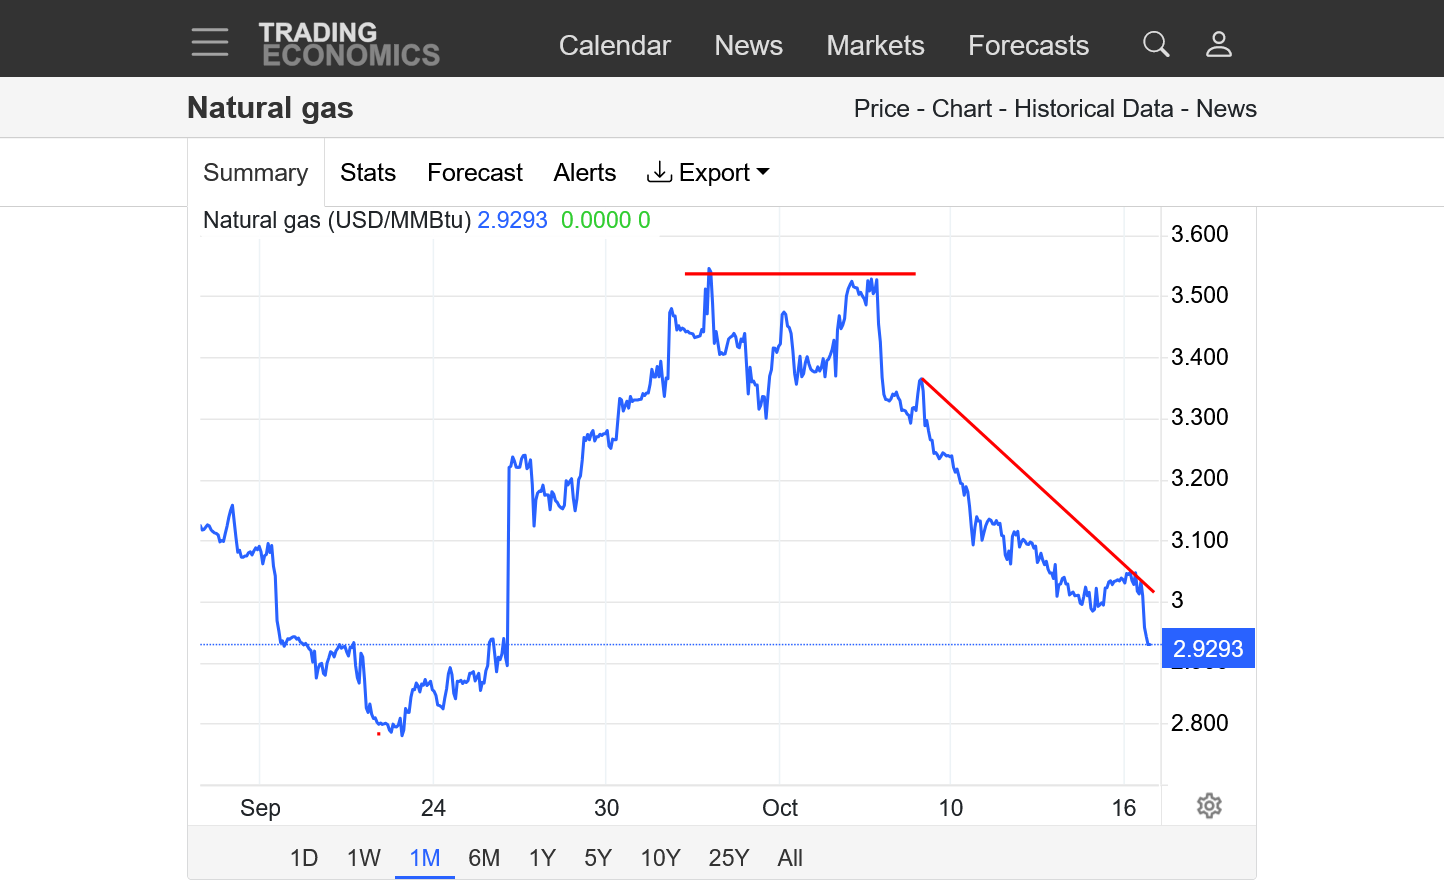
From the previous post:
Any sign of a pattern shift to sharply colder should trigger a big bounce up.
We just had a HUGE gap higher!
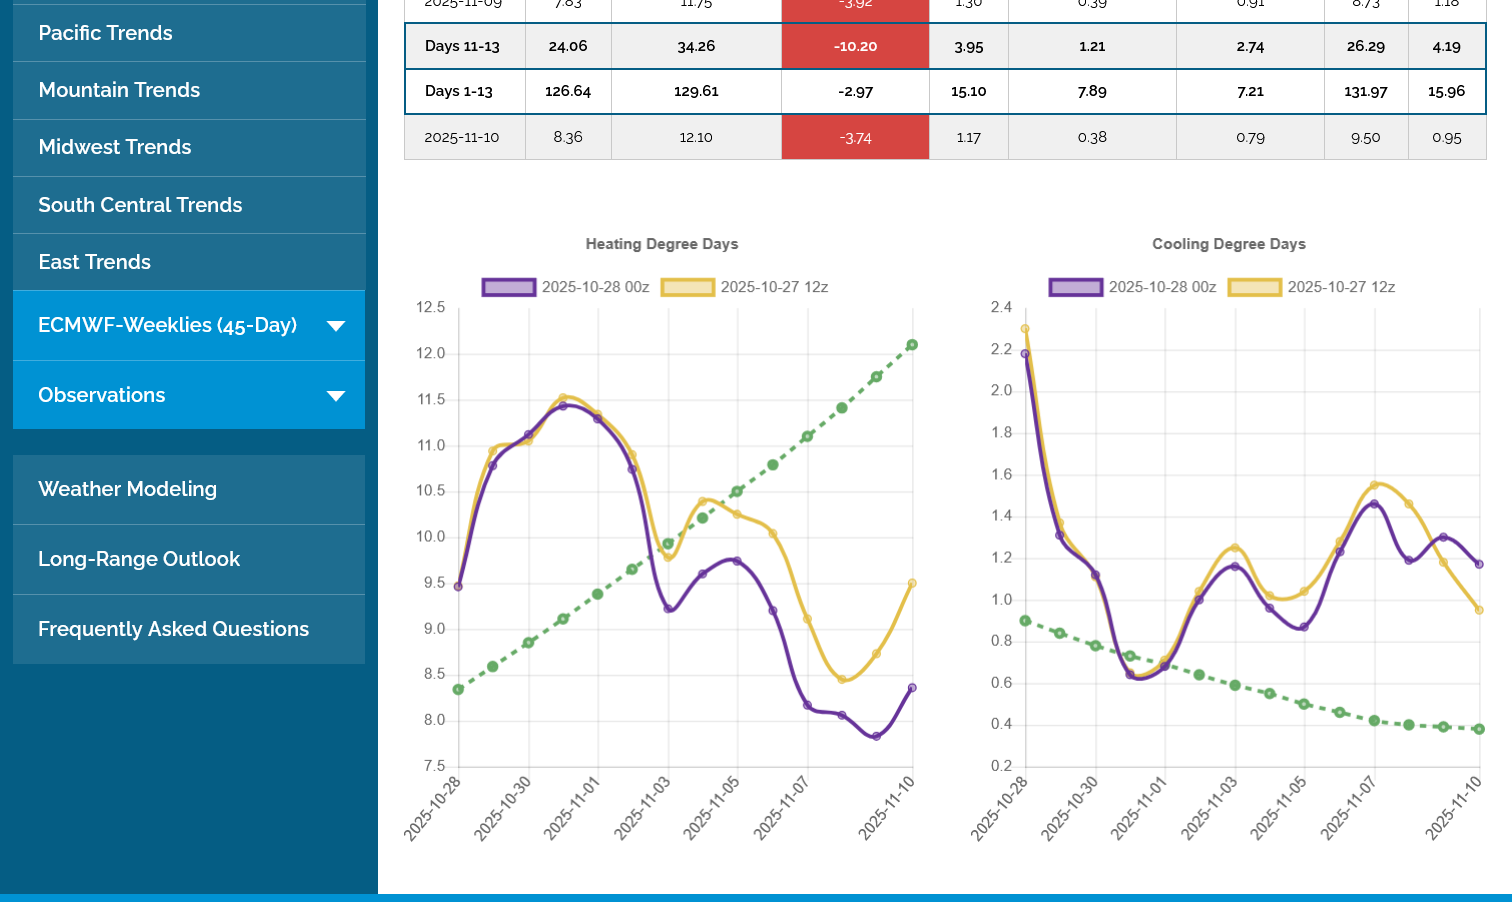
The models are looking colder(less mild) at the end of the 2 week period which, especially in the first half of Winter matters a great deal. The purple line on the left was the last HDD forecast from the last 12z European Ensemble model. CDDs on the right don't matter anymore.
My bad on the November outlook that I posted at first. That was a surface pressure anomaly map.
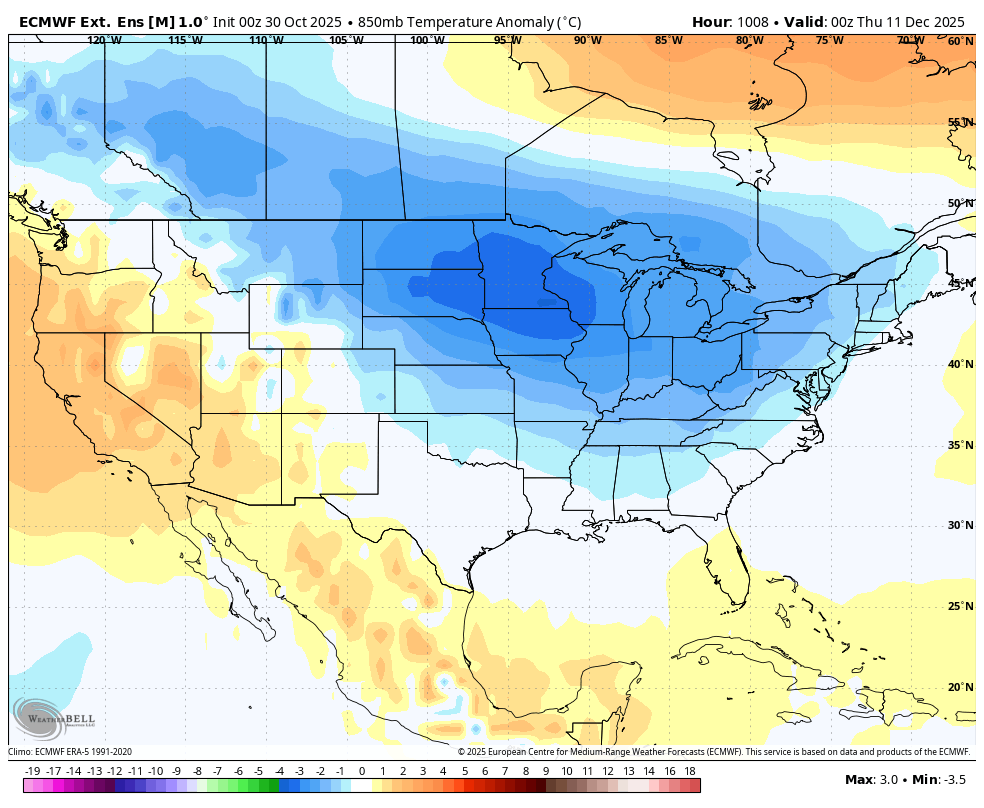
This is the correct temperature anomaly map for November from the last European weekly model run.
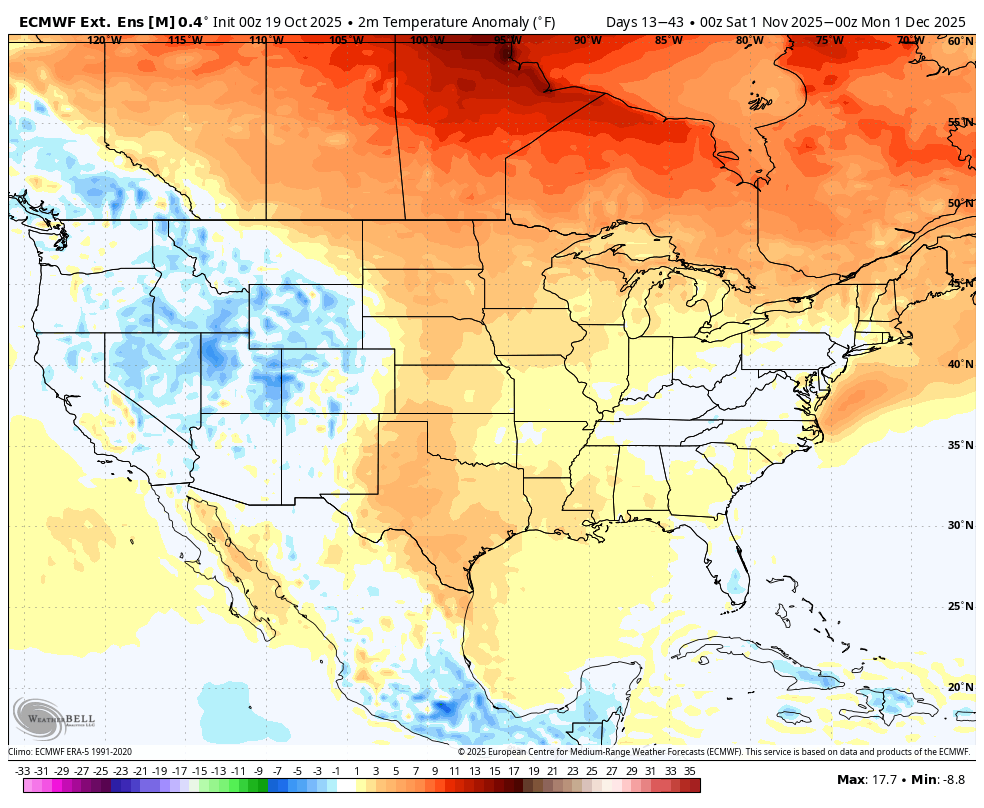
However, late in the month/early December we have a significant +PNA/-NAO featuring a ridge west/trough east couplet which means cold in the East! This is a high population area that consumes a great deal of fuel to heat their homes.
That's a LONG ways off and LOW skill!!!
Temps to start December:
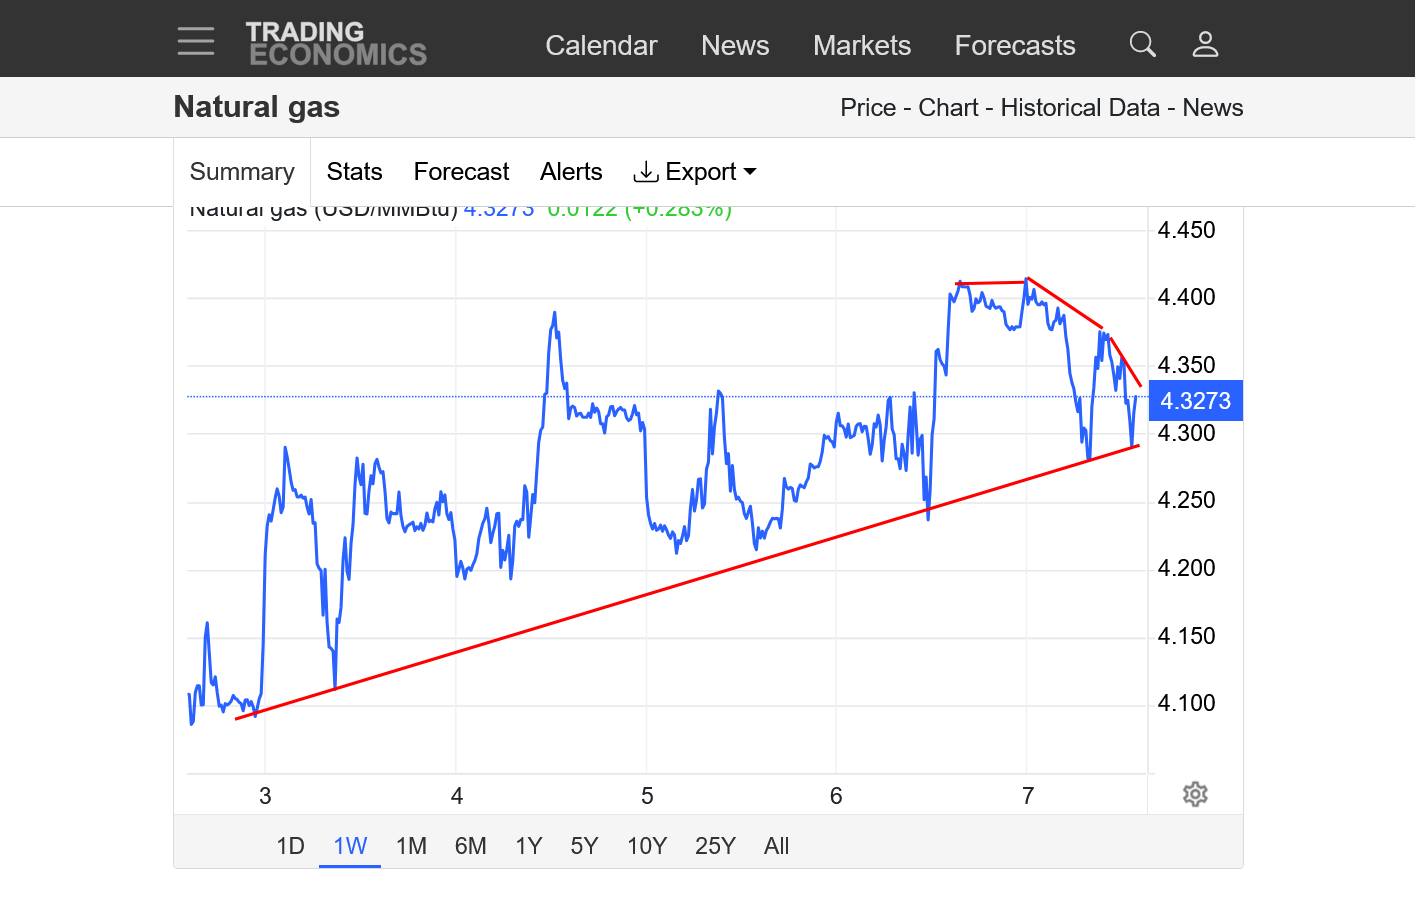
This was the huge +$1,500/contract higher open and gap up to start this week's trading. We closed last week close to long term $3 support after putting in what looks like a significant low from near record mild temps and low seasonal heating demand to start the HDD season this month.
This is likely an upside break away gap.
https://tradingeconomics.com/commodity/natural-gas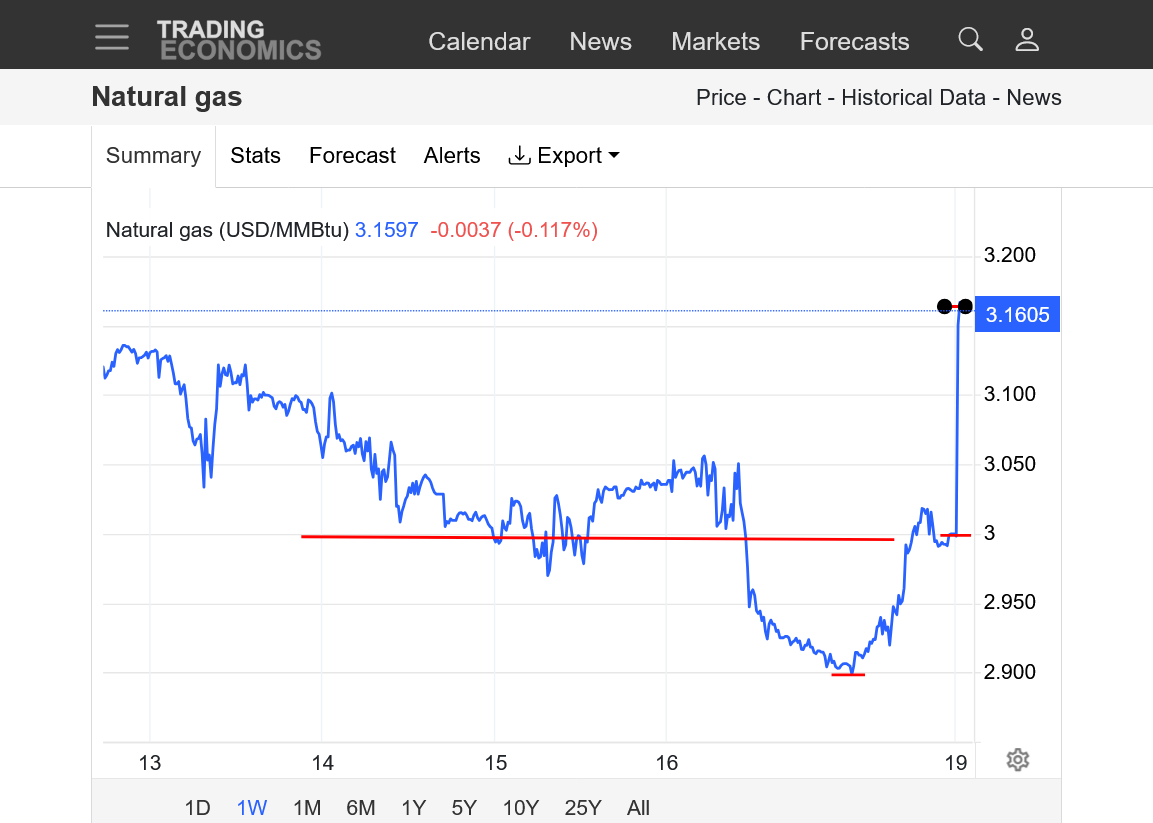
What do you think, Larry?
8pm update:
These are prices the last year. The last month+ has set up a clear symmetrical wedge pattern with lower highs since the big March top(from last Winters cold drawing down storage-a 2nd lower, early Summer high-then a 3rd, even lower high to start October, with very mild temps the first half of October pressuring prices.
We also saw a major late August/early September low from unusually cool temps at the end of Summer reducing cooling demand, followed by 2nd HIGHER low and last week, after prices had dropped from the mild October, a return to colder forecasts put in a 3rd, higher yet low.
The big gap higher tonight from this formation is an upside breakaway gap that's a pretty bullish signal.
If weather forecasts keep turning colder this week, it should hold. However, in weather markets THE WEATHER causes the price signatures. When the weather changes, it usually causes the price pattern prediction on the chart to be violated.
The weather pattern change usually comes first. If it looks like the market reacted BEFORE the weather to most people, its almost always because the traders with the best weather information had that information before everybody else and they were getting in, moving the market.
The early trading bird catches the money worms in weather markets!!!!
Getting in too early, trying to pick a bottom or top can cause a big drawdown temporarily if you are right, before it turns to a profit.
If you are wrong about the weather in a weather market.......you lose money.
Too be honest, I was caught by surprise at how big the gap higher was tonight, just looking at the weather.
As Larry knows, the natural gas market, more than any others has big gaps higher and lower on the Sunday Night open. This is often because there were 2 days for the weather forecast to change and an additional 2 NEW days at the end of the forecast compared to the one Friday. Those NEW days are the ones that are most prone to have changes because of the increased uncertainty with time in a weather forecast.
https://itez.com/en/blog/education/lower-highs-higher-lows-trading-guide
Daily Gas Price Index Markets Report Natural Gas Prices
Having trended substantially colder over the weekend, weather forecasts were in the driver’s seat Monday morning as natural gas futures mounted substantial early gains.
+++++++++++++++
Record warmth in the middle of the country last week dominated the weather picture.
However, there are not that many high population centers in the Plains but there are a few in the Midwest, where the warmest air compared to average was located. The natural gas market dialed this in with lower prices EARLY in October WELL BEFORE it happened.
The East Coast was close to average. The West Coast was chilly.
https://www.cpc.ncep.noaa.gov/products/tanal/temp_analyses.php
+++++++++++
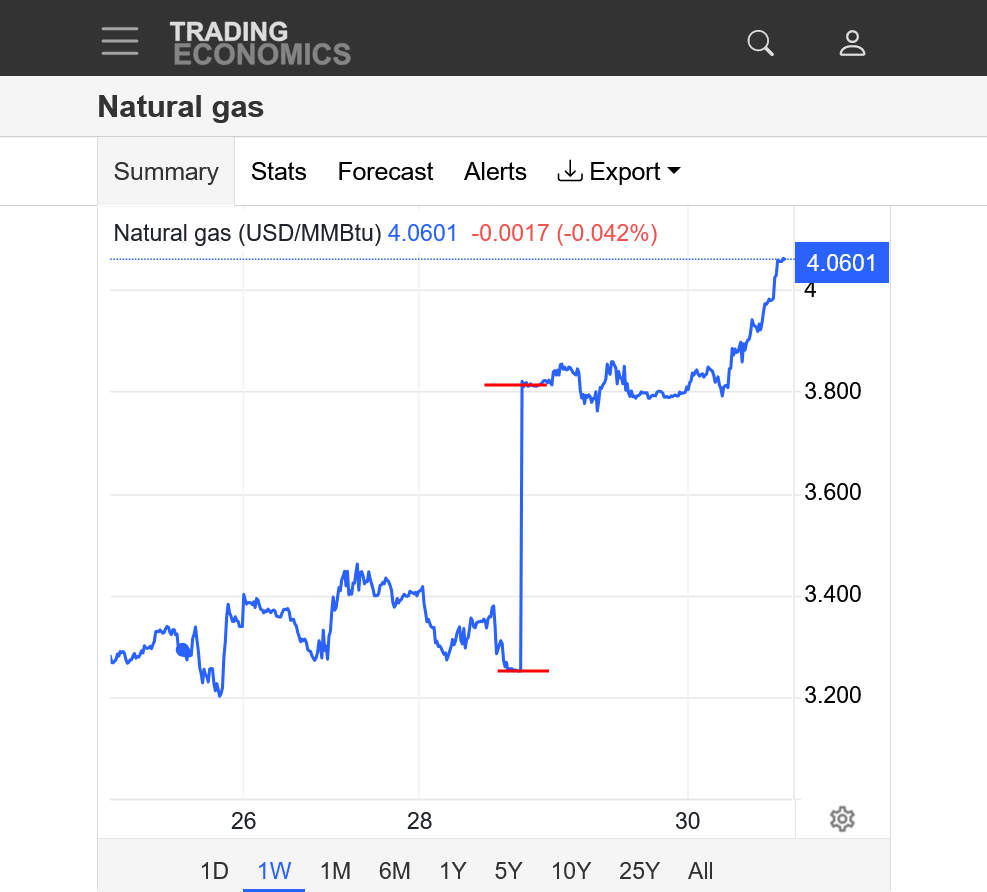
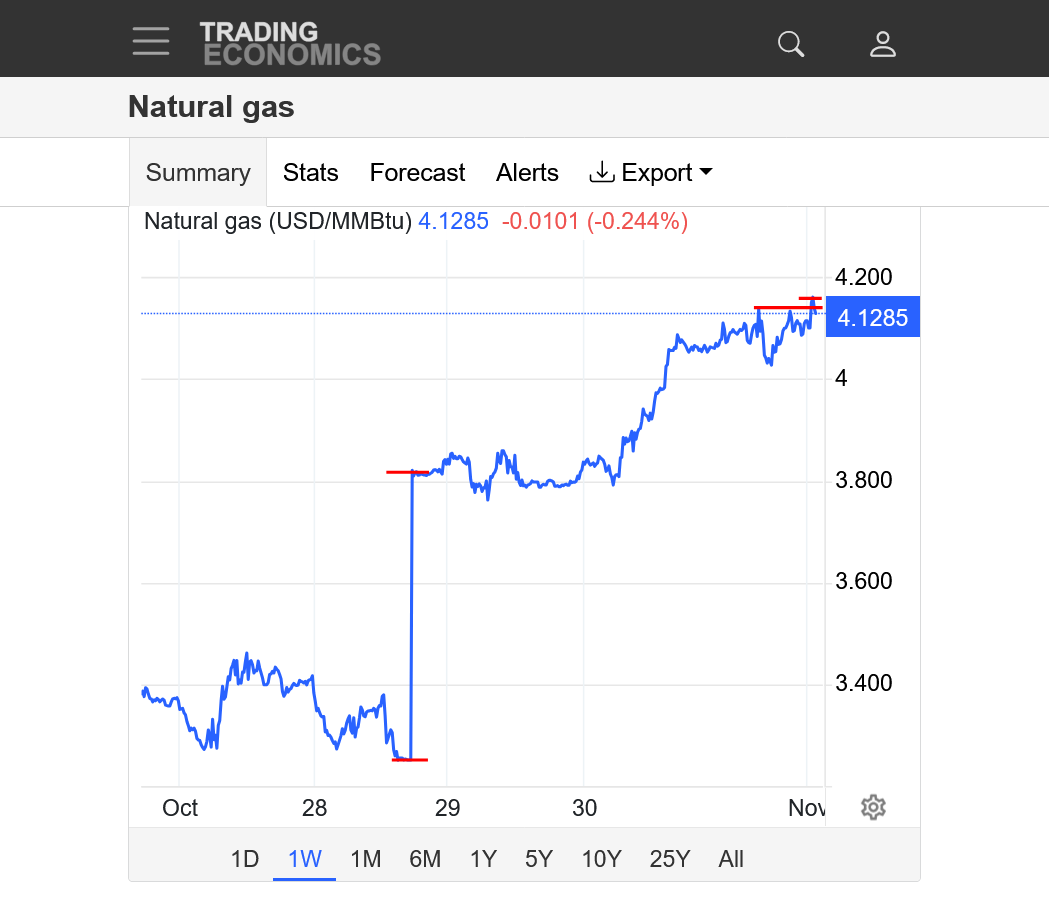
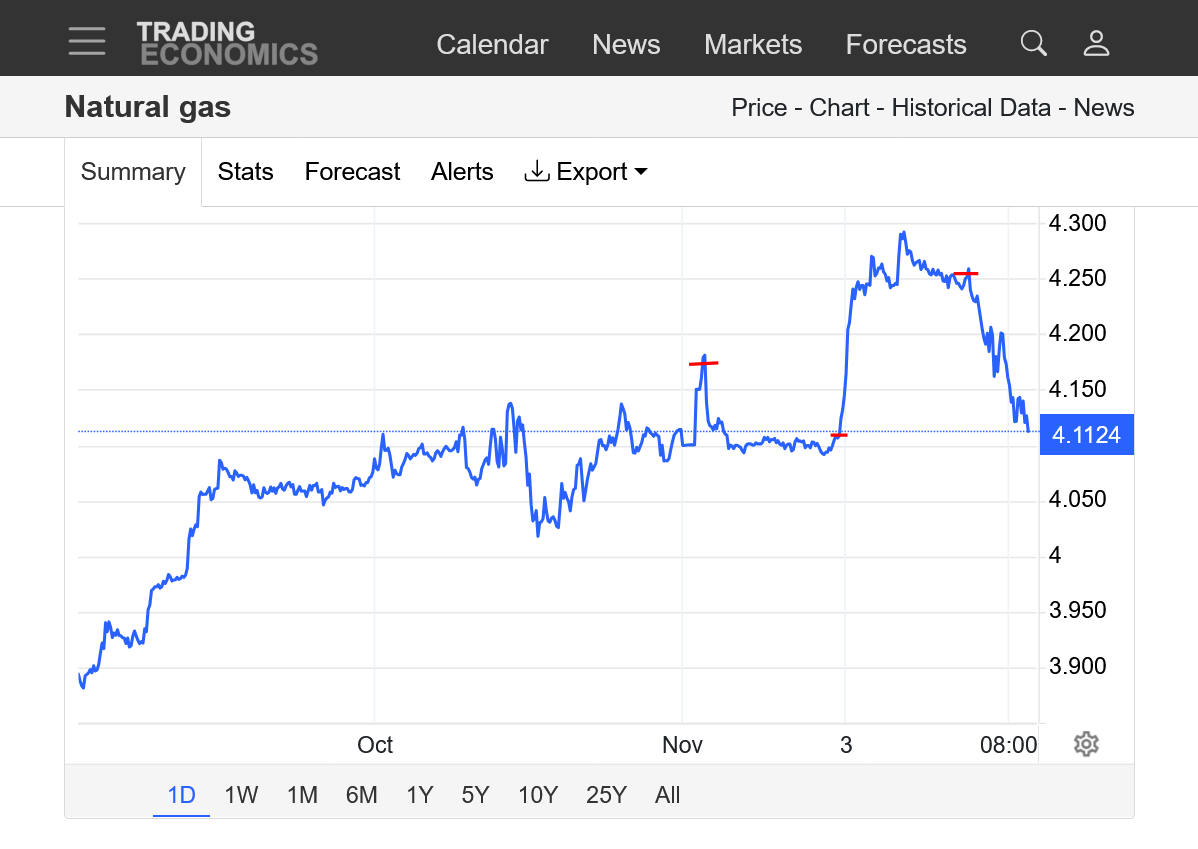
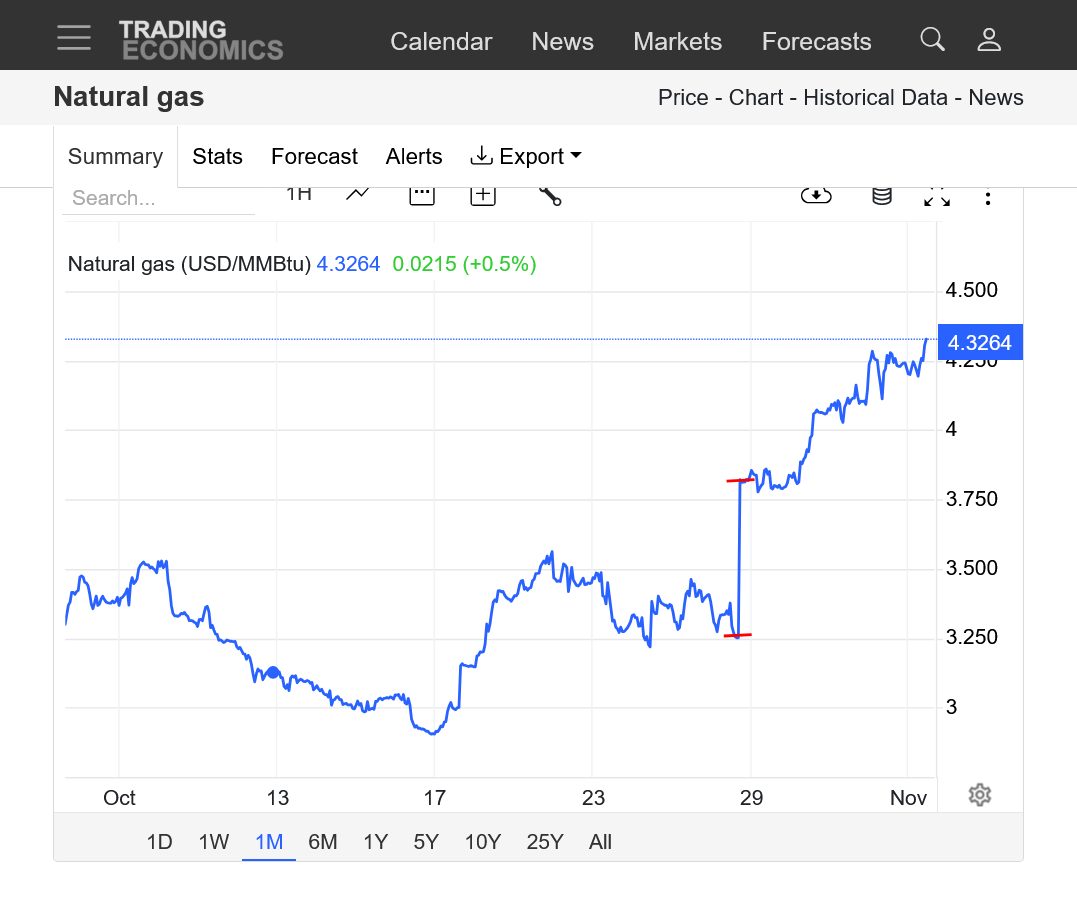
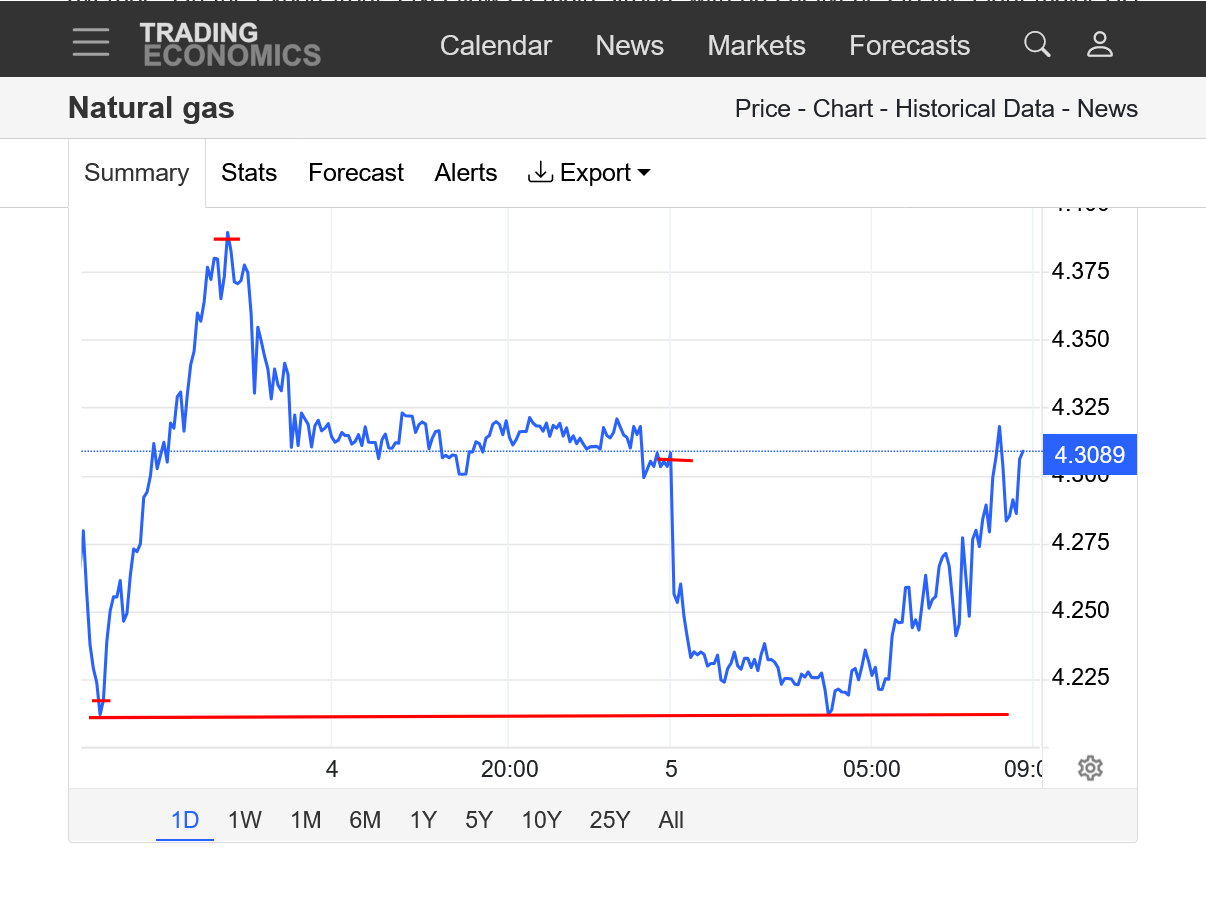
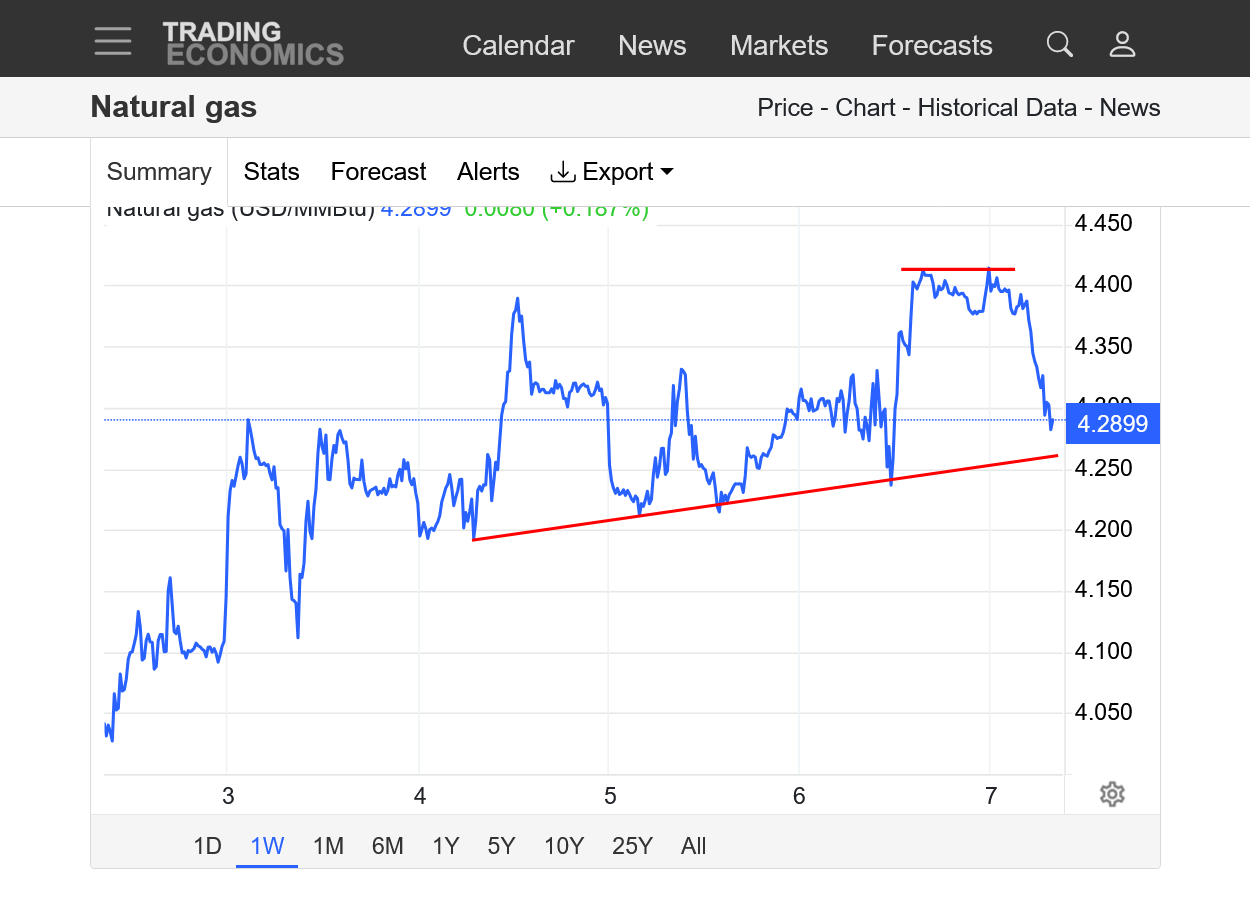
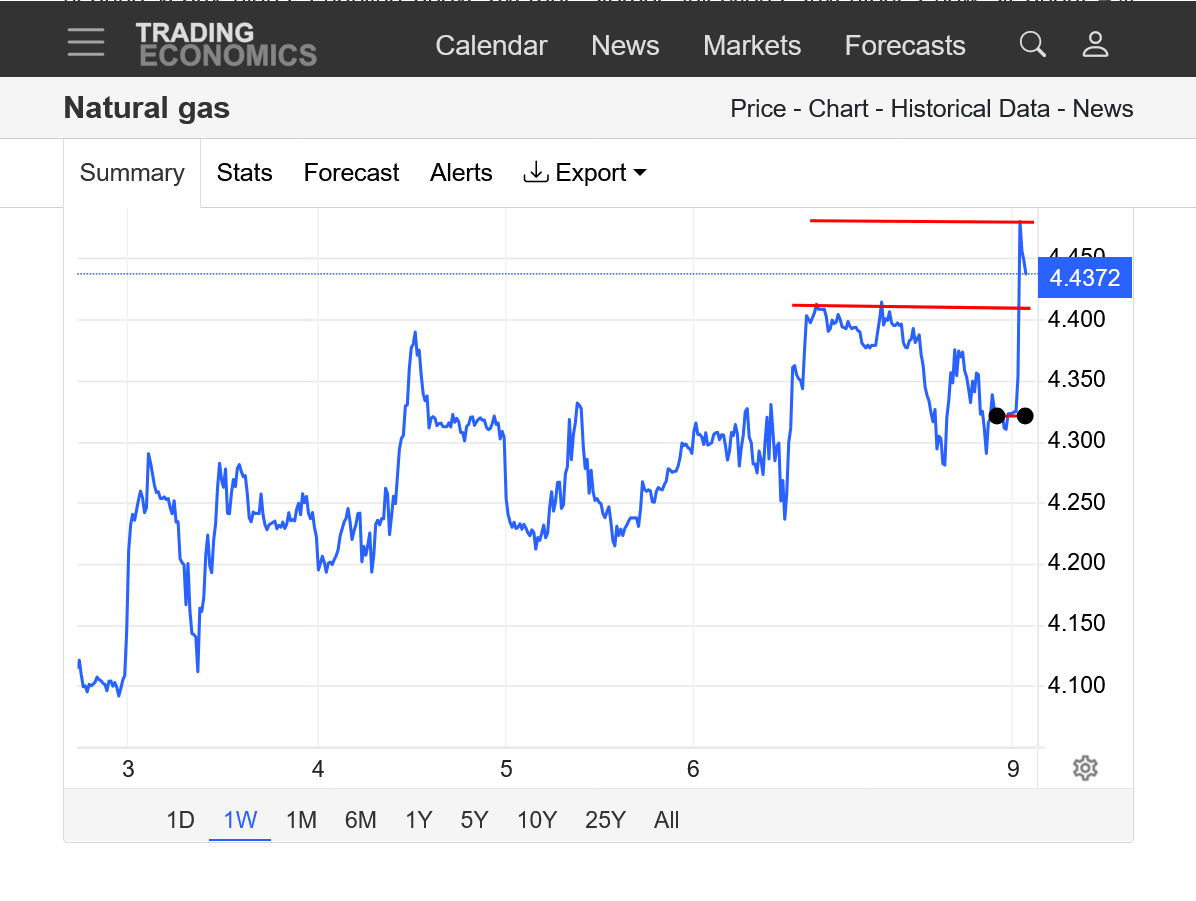
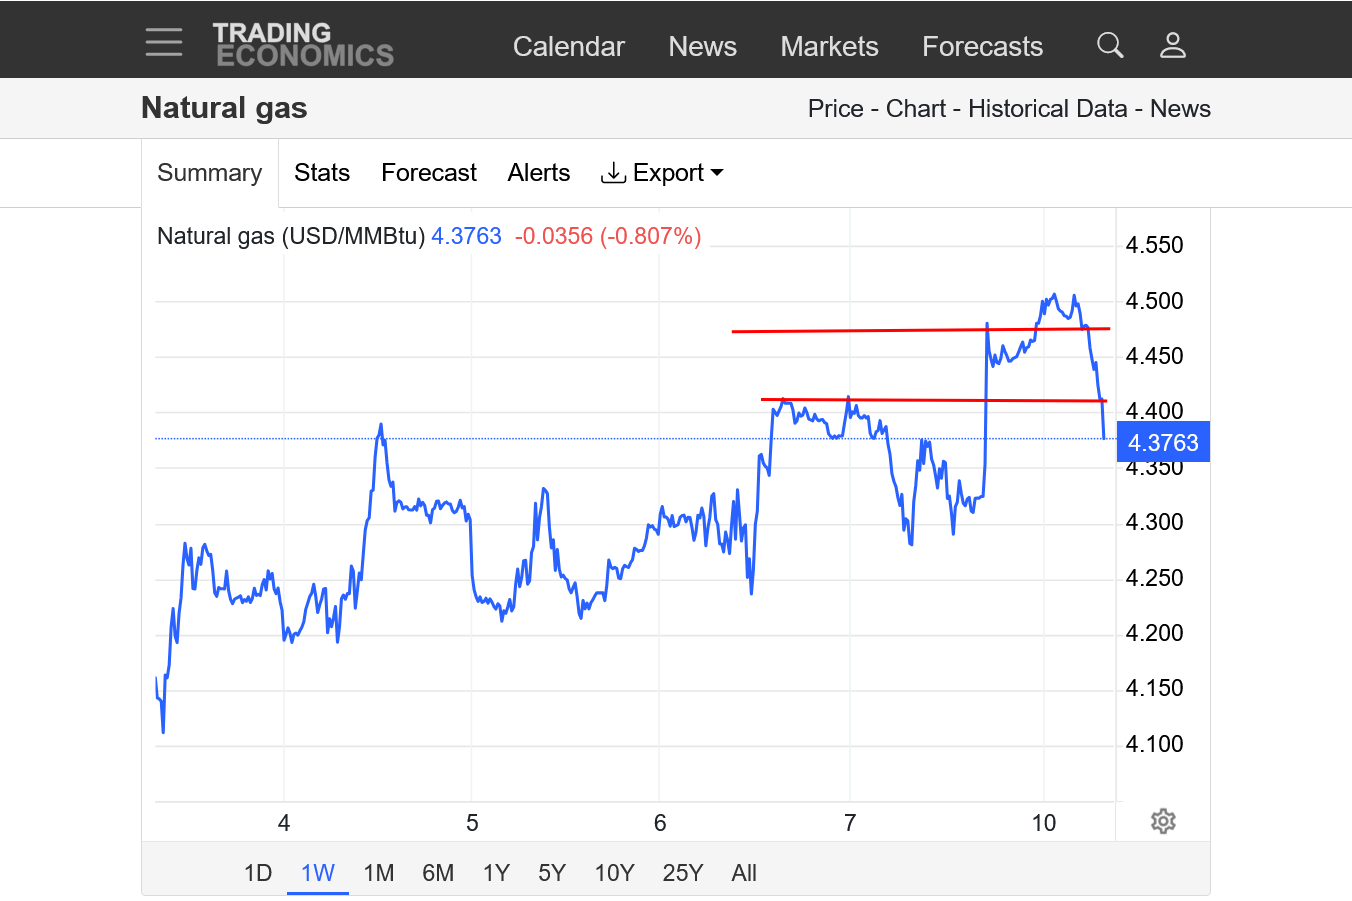
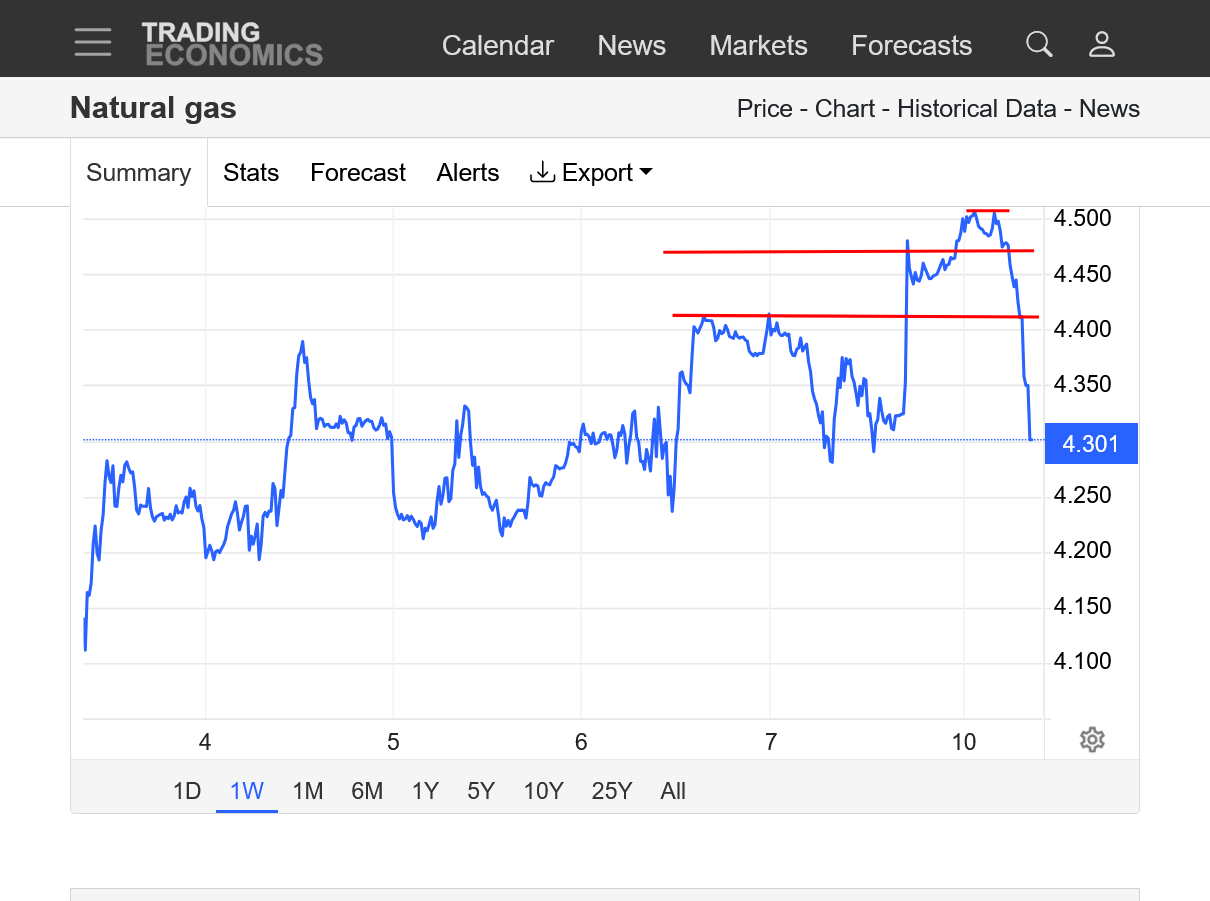
This source does not show price gaps so I put in the red lines that define the close Friday and the open Sunday Night. Very large gap higher on the open with very solid follow thru that confirms the initial interpretation after the open last evening of it as an upside break away gap.
Coming from a solid test of the uptrend with higher lows last week, this is extremely bullish.
https://www.cpc.ncep.noaa.gov/products/tanal/temp_analyses.php
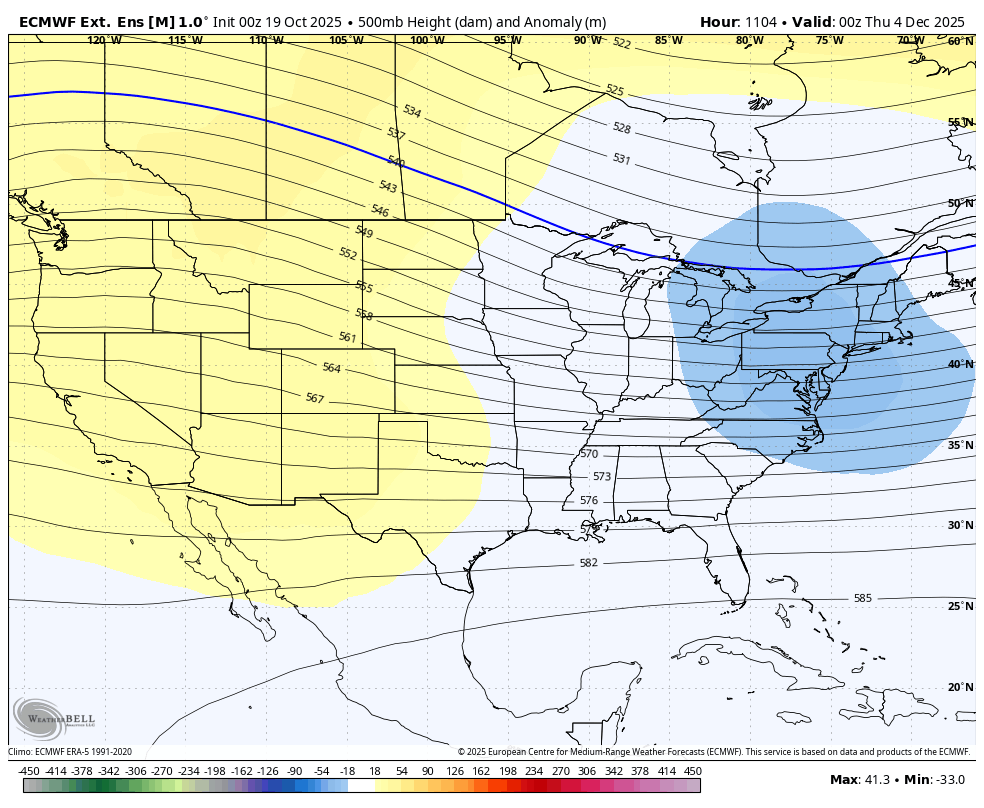
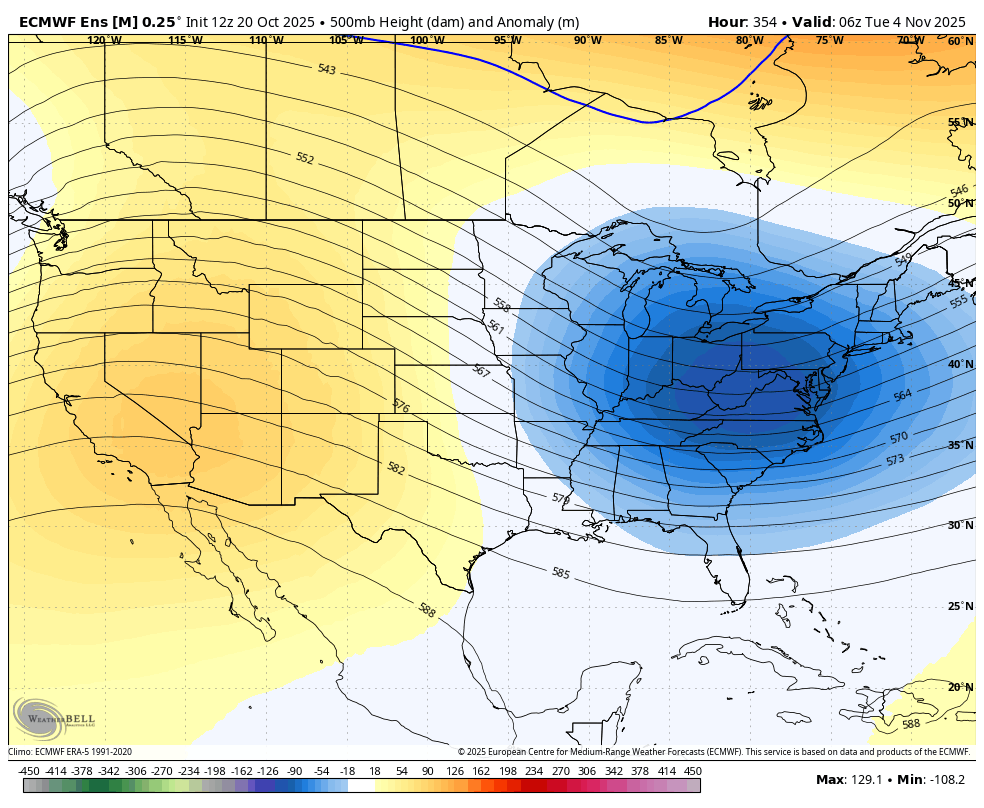
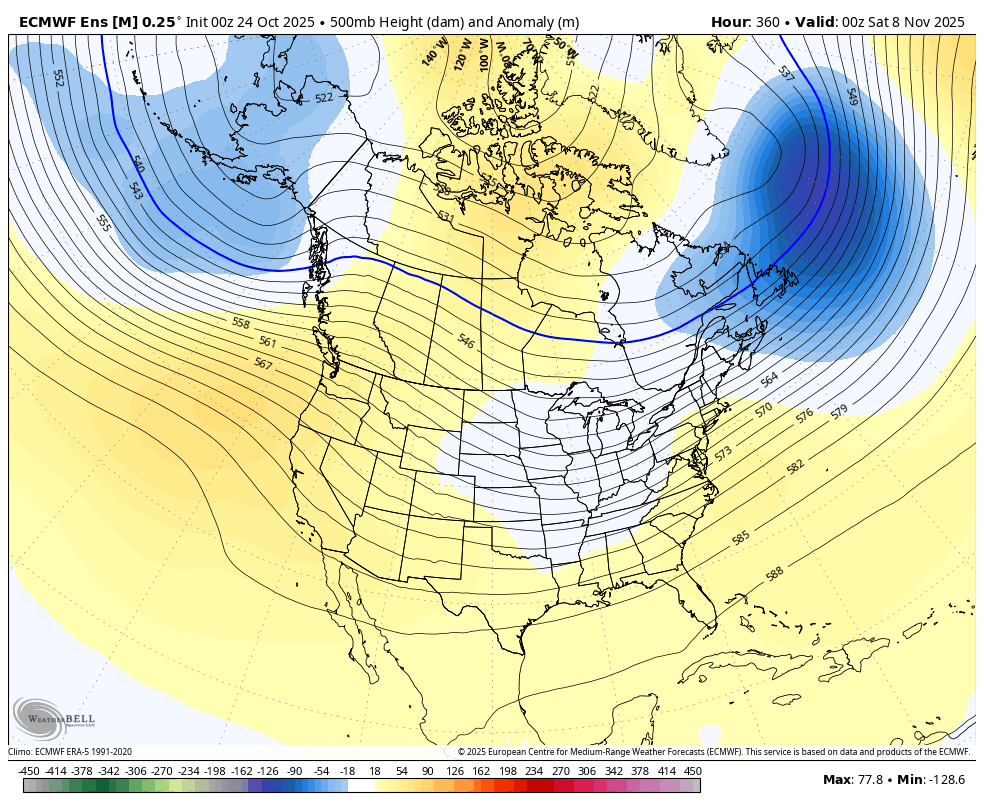
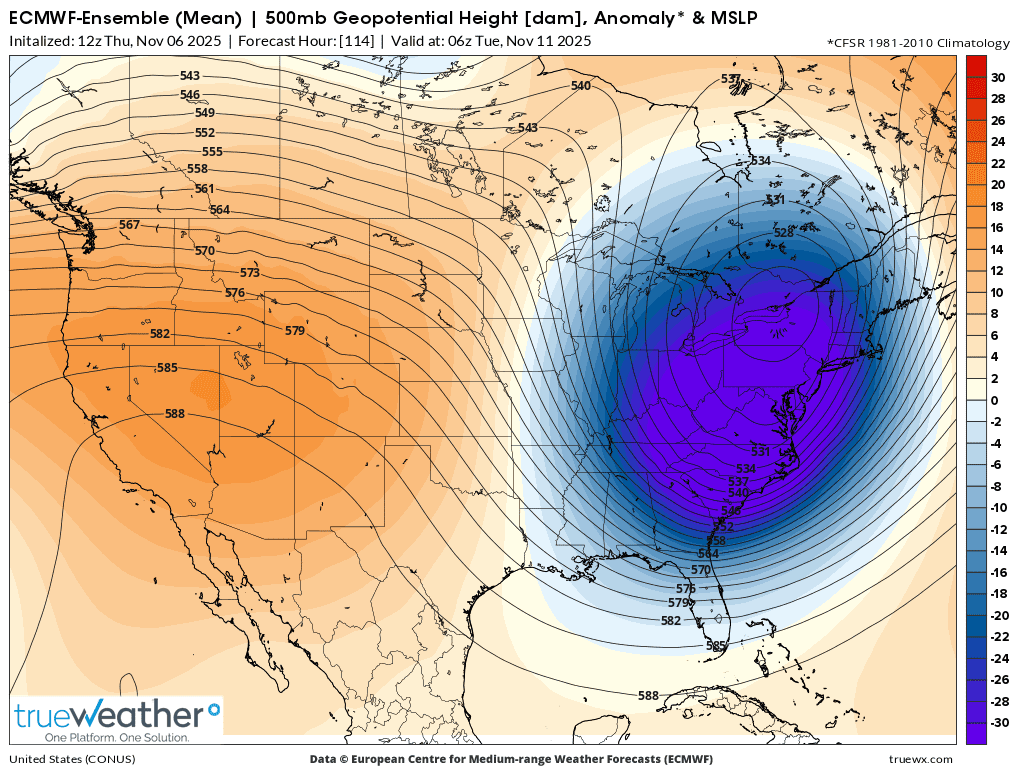
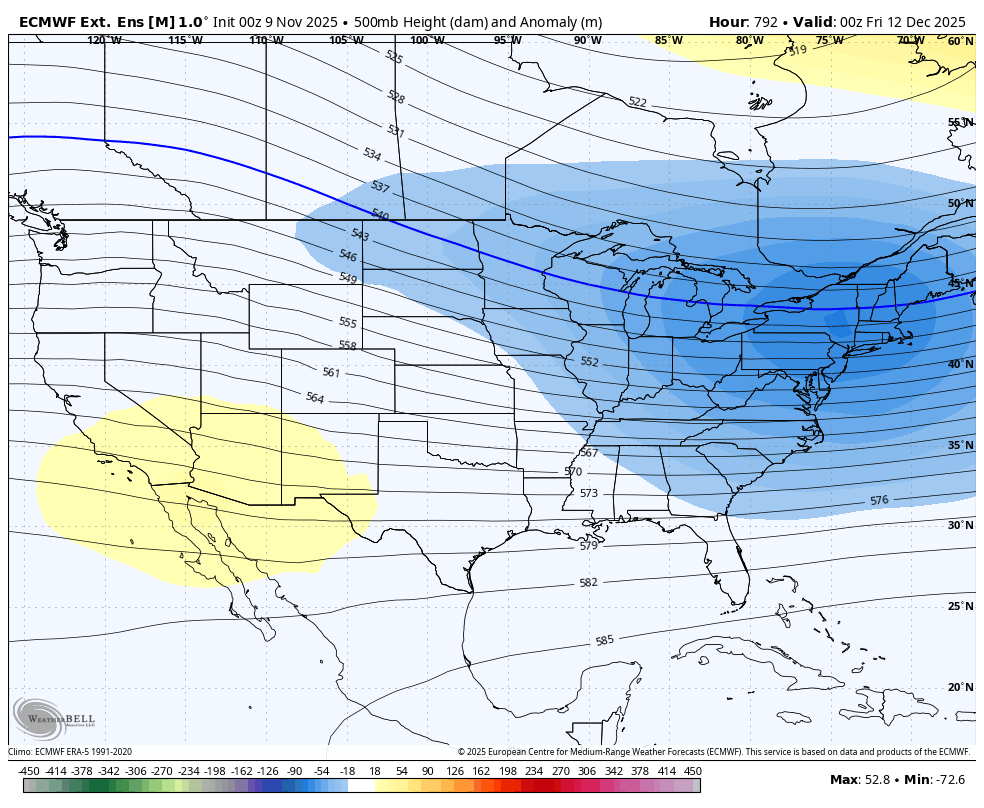
This was the last 500 mb from the latest 12z European Ensemble model which show the colder pattern in early November evolving.
This is a ridge/west tough/east couplet which will features very warm temps in the West and chilly temps in the East. We don't yet have a connection in Canada that would bring down Arctic air or air masses from higher latitudes. Canada will be fairly mild at this time so air masses that cross the Canadian border south into the US will have a modest brand of cold. This is quite a bit different than the recent very mild pattern.
Heating demand and HDDs with this scenario will be ABOVE average compared to MUCH BELOW average thru the first half of October.
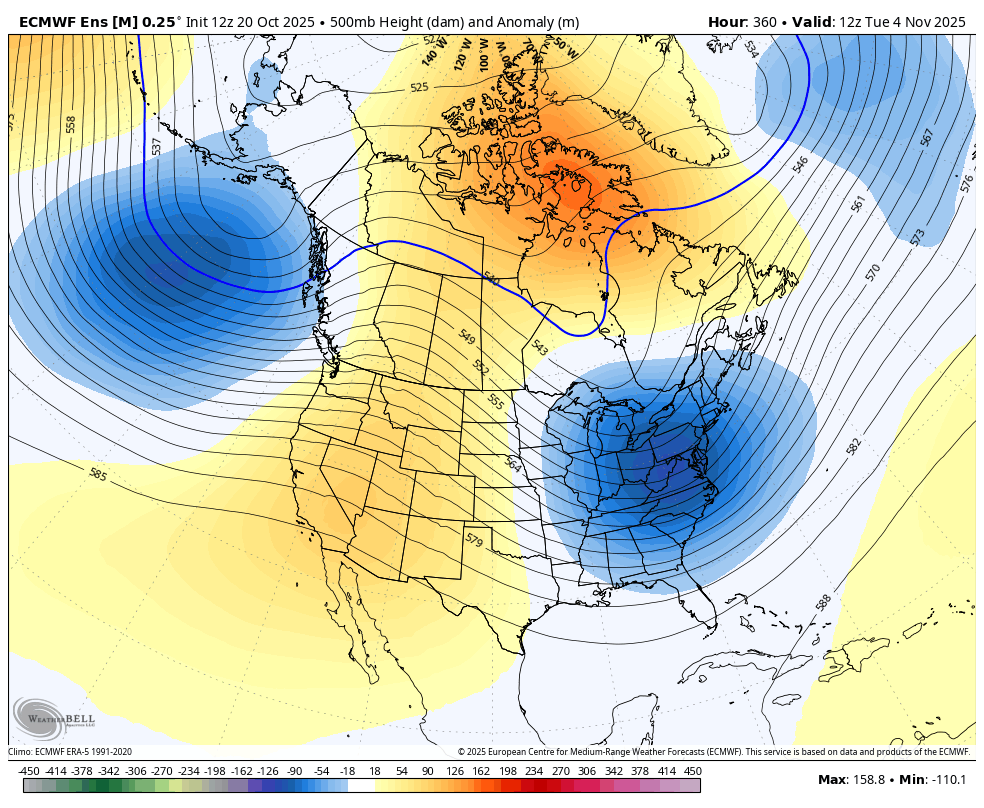
Expanding the view all the way north shows mostly mild zonal flow in Canada with the dip east in southeast Canada so the source region for these air masses will not be very cold.
However mild air for Canada, when plunging south will be chilly for the regions south, especially farthest south.
The 0z European Ensemble model was +6.5 HDDs vs the previous run very early this morning which caused a huge spike up at that time.
1:50 pm:
This last 12z GEFS run in purple/left was the coldest yet(pattern changes tend to gradually get colder).
This helped NG close towards the top of the daily trading bar!
The teleconnection couplet today looks colder with the positive height anomaly greater over the higher latitudes in North/Central Canada(instead of the Western US where its modest) and the negative height anomaly in the Northeastern US.
https://www.psl.noaa.gov/map/images/ens/ens.html#nh
10-22-25: I note that the map above updates every day. That’s good for the maps on our weather page.
However, the solution today is different than the one described yesterday which will be different than tomorrow/Thursday, so please keep that in mind.
The extreme short covering bounce from the weather pattern change to much cooler over the weekend may have been dialed in and run its course for now as it bumps up to resistance.
OR, if the forecasts get colder then we could be having a major upside break out!
This was the last 12z EE in purple on the left:
https://tradingeconomics.com/commodity/natural-gas
1. 1 month: Note the upside gap higher to start the week on Sunday Night. We peaked today, well over +$5,500 from the close on Friday! Will this resistance hold?
2. 1 year: Symmetrical triangle with lower highs and higher lows(the last 2 months).
3. 10 years: Are we having an upside break out of this longer term symmetrical triangle/wedge??
As always, the weather forecasts CONTROL the technical pattern/formations. If we go back to unseasonably mild for a couple of weeks, the price will go lower. If the forecasts keep getting colder, we will go higher. And it will happen with wild gyrations that are often triggered from individual much colder or much warmer weather model runs.
These reactions usually start early in the model run as traders with that data first are buying at the market on cold or selling at the market on warm. It happens just like that 100+ times every Winter!
I get data extremely fast from a wonderful, paid data service that I use 24 hours/day but traders with in house models are sometimes even faster. Seconds faster when the price is spiking up or down means MISSING THE TRADE.
And it can mean trading on a model run thru 7 days, when somebody else just got day 9 and has a slight edge of a minute or less! Larry understands how this works exactly!
That describes the overnight session. The day session features the big traders that have the huge edge with in house model forecast data that can run up to an hour faster than the government global models. It's government data/model runs but they get the data and, I suspect run it on in house models using AI(been around for many years in the world of weather).
See more below!
Hedge funds on average hired 23% more weather experts in 2024 compared to a year earlier.
Updated on
Now, at 35, he leads a small group of data scientists and meteorologists who help teams of traders at one of the world’s largest hedge funds position themselves in commodities markets.
+++++++++++++++++++++++
Hey MM,
It seems like NG wx trading keeps getting more and more complicated, which is one reason I’ve yet to even try it again. I’ve been too busy, regardless, and don’t feel like getting back to staying up much of the night. But I keep an open mind for the future, mainly for the less unreliable late fall/winter period. If I felt I could do it successfully in the daytime, especially around the 12Z model releases, that might one day get me into it again if not too busy though probably with a smaller volume of contracts or perhaps mainly through going long options.
I hope you’ve been doing well. Have you been having a decent level of success?
I did ok early in the Summer trading C and S but have been back on the sidelines since then.
I had some small NG trades last Winter but only overnight.
Unfortunately, during the later morning, the market appears to react an hour before the GEFS comes out, so there must be big traders with in house AI models that are way out ahead of everybody else. Its been that way for awhile.
They are not there overnight most of the time.
Sometimes the early afternoon is trade-able off the 12z EE model.
Mike said:
“Unfortunately, during the later morning, the market appears to react an hour before the GEFS comes out, so there must be big traders with in house AI models that are way out ahead of everybody else.”
———
Hey Mike,
This is still another reason to keep me away at least for now.
1. Are you sure they’re not reacting to the 12Z GFS since it comes out an hour before the GEFS? It sure used to react to it strongly, often even more than the 12Z GEFS when that goes in the same direction as the GFS.
2. How often has that reaction prior to the GEFS ended up being consistent with the actual GEFS HDD change? And if wrong, does it later go the other way as the GEFS is released? If so, that may mean even better opportunities for those reacting as the actual 12Z GEFS is released.
3. What do you mean by in-house AI models and why should NG react to them if they’re not GEFS or Euro ens?
This is still another reason to keep me away at least for now.
Thanks, Larry.
1. I'm not sure of anything since I'm not one of their meteorologists. No, I don't think it's from the GFS because the reaction is not very consistent with the new 12z GFS's.
2. My "1 hour" is a rough estimate of the time frame and yes, it's almost always in the right direction as the GEFS and the magnitude of the move up or down, well before the 12z GEFS government model run comes out online is very consistent with the latest 12z GEFS.
3. In house AI models, unlike those of the GLOBAL models can use the raw data that the GLOBAL models start with and only run it for the United States and maybe Canada for instance and have solutions that come out much quicker. I speculated this for several years now, just based on many dozens+ obserations of the market reactions ~1 hour BEFORE the actual 12z GEFS comes out. Not just most of the time but almost all of the time big moves in 1 direction, correctly predicted what the 12z GEFS was going to show.
Here's more for you:
https://www.bbc.com/weather/articles/cwy6ykp7049o
20 June 2025
Traditional models take hours to run on hugely expensive supercomputers, however this new breed of models can take less than a minute to run on a standard laptop. They don't need to know all the 'burdensome' laws of physics, but are instead trained on 40 years of past data to make their predictions.
++++++++++++++++=
I know they have changed in recent years, being updated with better technology but this has been happening for over a decade in the mornings BEFORE the 12z GEFS comes out. I am 100% certain of this. What exactly they have been using(which has evolved) I can't say but it clearly is a product that uses the FRESH data from weather balloons and other sources to FRONT RUN the 12z GEFS.
This never happens at other time frames to the same extent.
At 0z, for instance you can see the reactions often being a couple of minutes faster than Weather Bell's products show the changes and often simultaneously which suggests we are just seeing government weather models that everybody gets having an impact.
I have not traded natural gas in the last several months so things could have evolved, however, it's really easy to just look as a price chart later in the day or next day and see the spike and their times to observe the impact as long as you know what the GEFS and EE showed too.
I think the product being used to front run the 12z models only has 1 big impact BEFORE the models start coming out, including the GFS. And it's a gradual impact, over the course of an hour or so, suggesting the data might not all come out for the entire run in 1 blob or else, if it does than other traders, who know what the front runners are doing are following their lead.
FYI the weather community has been using different forms of AI for almost 2 decades.
I joke all the time with my wife about how lazy its made operational meteorologists at local NWS offices. They often just use the AI product for the worded forecast which breaks the forecast down hour by hour. In doing so, the verbiage often suggests impossible preciseness in the timing of forecasts.
I think I gave an example here earlier this year that I'll try to find.
++++++++++
Actually, the examples were sent to my wife/son via email earlier this year. I'll see if I can copy those here.
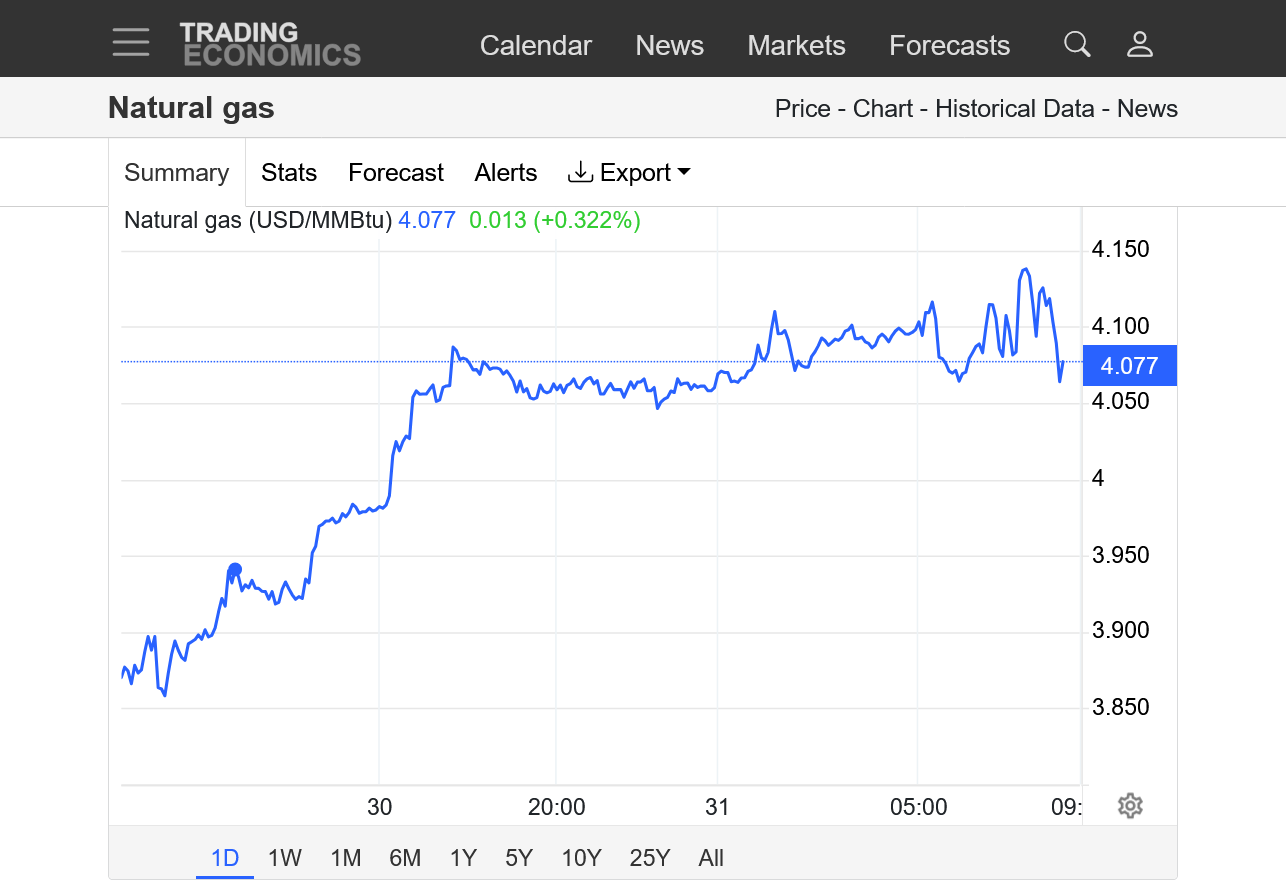
The 0z EE was colder, but milder at the end which gave NG a boost into the very early morning. Then we crashed lower again as the overall pattern for November continues to look milder.
https://tradingeconomics.com/commodity/natural-gas
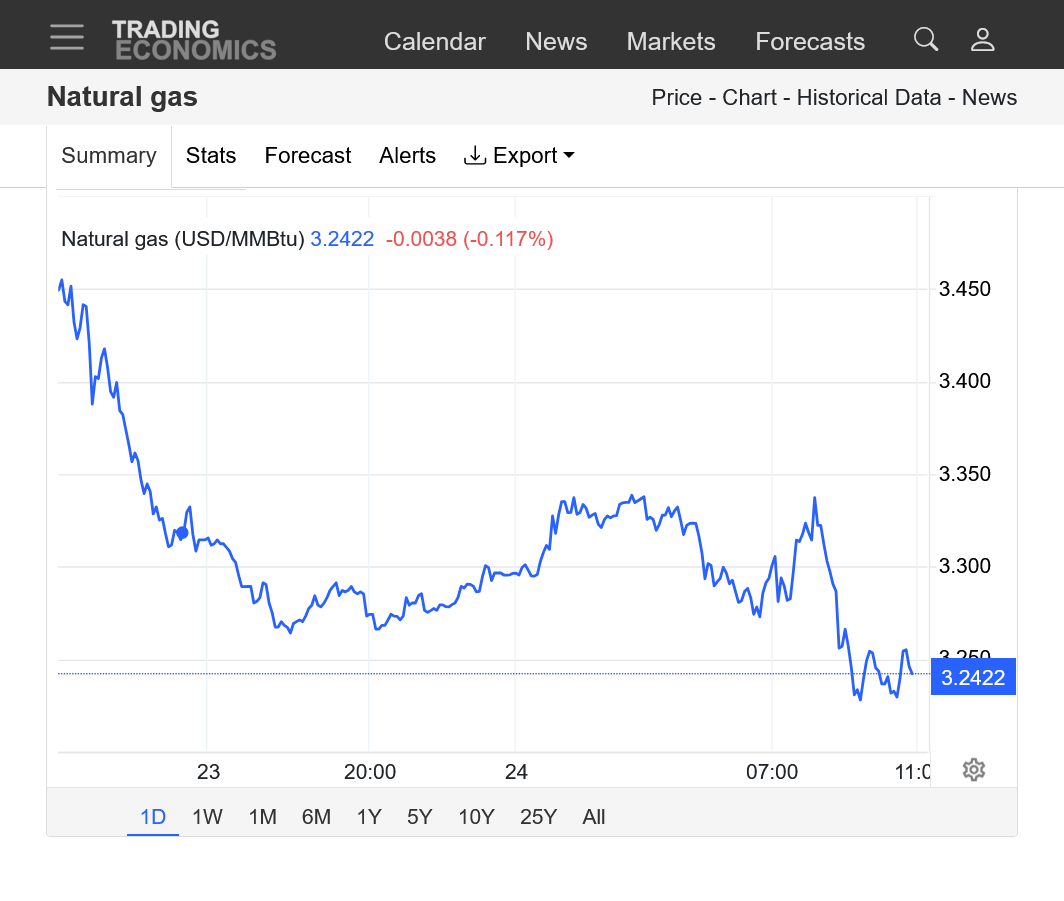
1. 1 day
2. 1 month
Almost forgot about the bearish EIA report yesterday!
https://ir.eia.gov/ngs/ngs.html
![]()
for week ending October 17, 2025 | Released: October 23, 2025 at 10:30 a.m. | Next Release: October 30, 2025
| Working gas in underground storage, Lower 48 states Summary text CSV JSN | |||||||||||||||||||||||||
|---|---|---|---|---|---|---|---|---|---|---|---|---|---|---|---|---|---|---|---|---|---|---|---|---|---|
| Historical Comparisons | |||||||||||||||||||||||||
| Stocks billion cubic feet (Bcf) | Year ago (10/17/24) | 5-year average (2020-24) | |||||||||||||||||||||||
| Region | 10/17/25 | 10/10/25 | net change | implied flow | Bcf | % change | Bcf | % change | |||||||||||||||||
| East | 899 | 883 | 16 | 16 | 900 | -0.1 | 883 | 1.8 | |||||||||||||||||
| Midwest | 1,060 | 1,031 | 29 | 29 | 1,083 | -2.1 | 1,057 | 0.3 | |||||||||||||||||
| Mountain | 282 | 279 | 3 | 3 | 290 | -2.8 | 239 | 18.0 | |||||||||||||||||
| Pacific | 311 | 307 | 4 | 4 | 301 | 3.3 | 282 | 10.3 | |||||||||||||||||
| South Central | 1,255 | 1,221 | 34 | 34 | 1,199 | 4.7 | 1,184 | 6.0 | |||||||||||||||||
| Salt | 320 | 303 | 17 | 17 | 309 | 3.6 | 305 | 4.9 | |||||||||||||||||
| Nonsalt | 935 | 918 | 17 | 17 | 890 | 5.1 | 880 | 6.3 | |||||||||||||||||
| Total | 3,808 | 3,721 | 87 | 87 | 3,774 | 0.9 | 3,644 | 4.5 | |||||||||||||||||
| Totals may not equal sum of components because of independent rounding. | |||||||||||||||||||||||||
Working gas in storage was 3,808 Bcf as of Friday, October 17, 2025, according to EIA estimates. This represents a net increase of 87 Bcf from the previous week. Stocks were 34 Bcf higher than last year at this time and 164 Bcf above the five-year average of 3,644 Bcf. At 3,808 Bcf, total working gas is within the five-year historical range.
+++++++++++
These were the very mild mid-continental temps for that report.
By metmike - Oct. 20, 2025, 11:56 a.m.
This was the just released weeks 3-4 outlook from the NWS. Pretty mild in mid November which has pressured NG prices the last couple of days after the massive short covering bounce to start the week.
However, we had an amazing spike higher that started at 12:30 pm. Explanation for that is below.
https://www.cpc.ncep.noaa.gov/products/predictions/WK34/
+++++++++++++++
https://tradingeconomics.com/commodity/natural-gas
1. 1 day: What would cause the NG to go up $1,750+/contract for the 90 minutes after 12:30 pm today? Answer below.
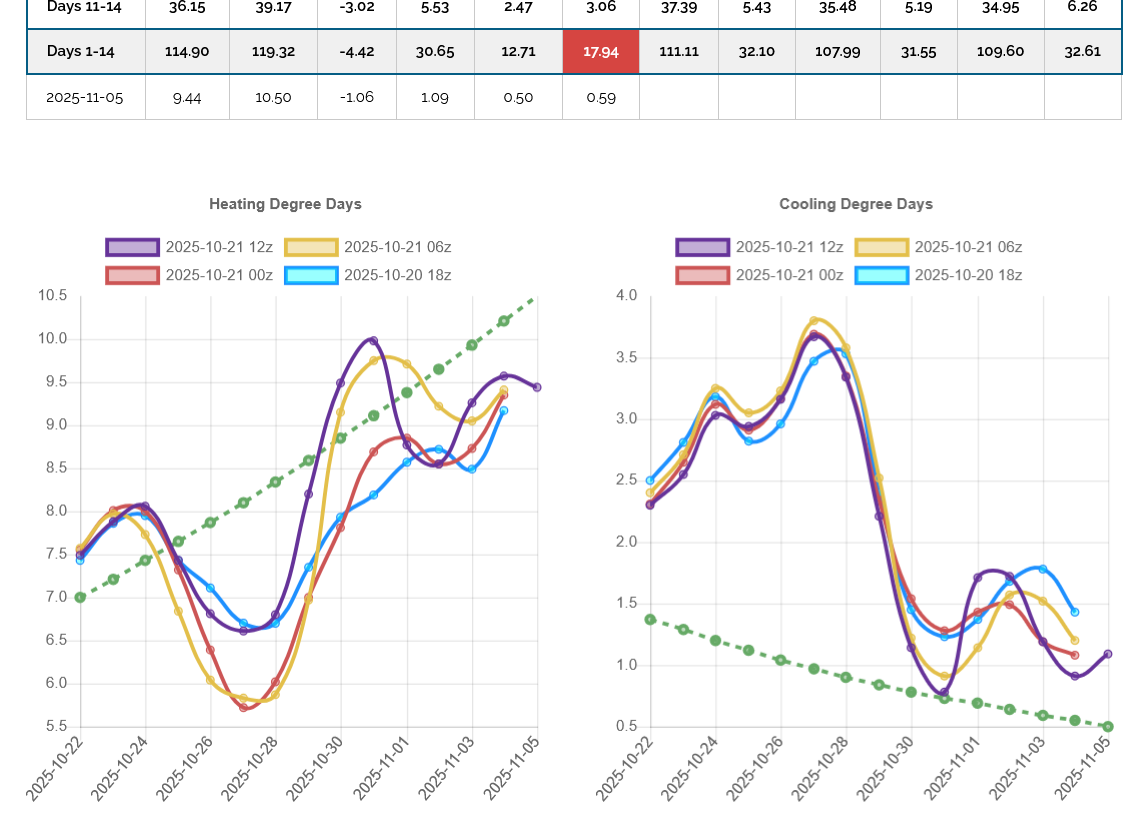
Look at the incredible week 2 change in HDDs for the 12z European Ensemble model on the left in purple. +7 HDDs vs the previous run! The week 2 part of the forecast that was so bullish started coming out at 12:30 pm and is responsible for that entire spike higher.
I was NOT watching at the time, unfortunately and did not trade it.
2. 1 week: The gap to start this week's trading is still wide open below!
3. 1 month: Topping formation?
4. 1 year; Note the steep up trends on the left from last Winter. They were caused by widespread, long lasting FRIGID blasts! Symmetrical wedge pattern at the end? Or is this a bear flag, which would be a continuation pattern in the longer term down trend?
On that last 12z EE model. This was the day 15 solution from the PREVIOUS 0z run. Pretty mild, zonal flow from west to east with only minor anomalies in the US and vicinity.
This was the 12z run for the same period.
Much more amplified flow with a modest ridge/positive anomaly in the West and MUCH deeper trough/negative anomaly in the East.
This ridge west/trough east couplet if favorable for cold air delivery from Canada, worth a north to south component in the movement of air masses, especially in the Southeast with this particular dynamic.
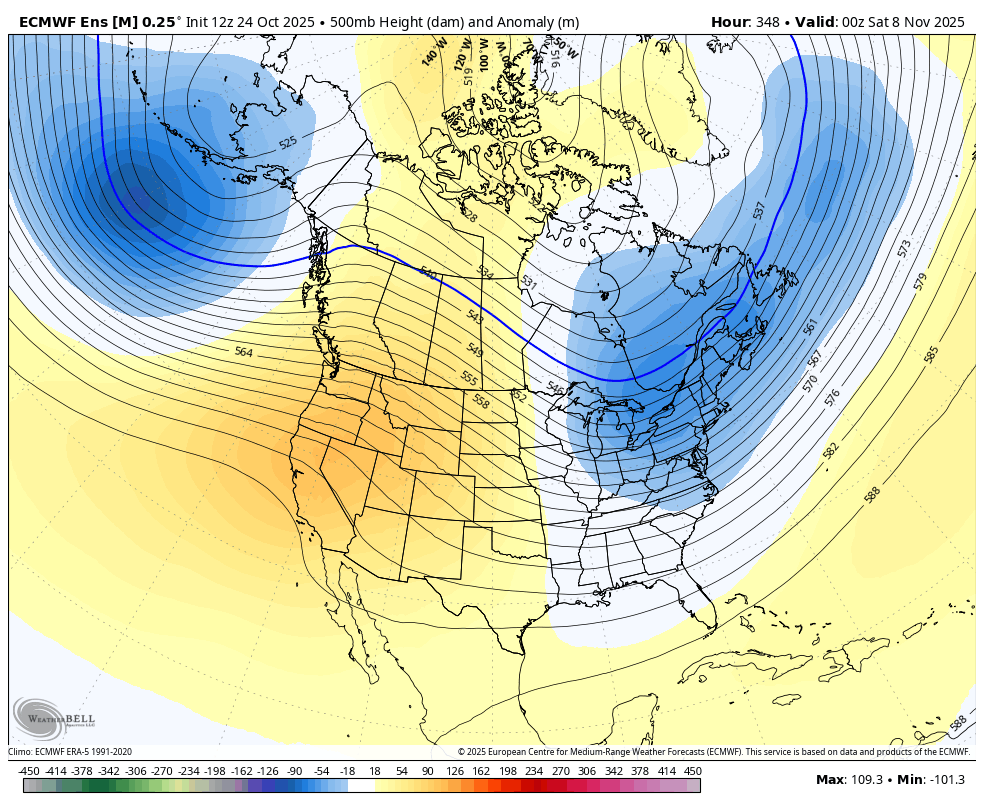
For comparison below. I showed the same 12z solution from the GEFS model with the winds. Completely zonal, west to east which would spread mild, Pacific Oceanic air masses across the country and cut off any cold to the north.
NG in the heating season is well known for NOT opening up on Sunday Night close to the price it closed at on Friday Afternoon. This is the perfect situation for a sharply higher or lower open next week if we see more changes anything close to like this last one on the European Ensemble model.
NG opened the new trading week with a modest gap higher, noted by the gap between the red lines below(Friday's close and tonight's open). I doubt it will hold though.
The front month, November will be expiring this week and December already has more volume.
We've got some chilly weather ahead for the east compared to what the forecast had last Thursday/early Friday of last week.
https://tradingeconomics.com/commodity/natural-gas
The last 0z European Ensemble model was -4 HDDs in purple on the left. vs the previous one. We had already filled the gap higher from the open which is a bearish, gap and crap buying exhaustion technical signature on the price charts.
We spiked down to modestly lower but are back up to trading unch for the December but are still +$750/contract for the November, which expires Wednesday? Crazy things can happen to the front month when we get close to expiration!
-5.5 HDDs on the last 12z EE model in purple on the right:
++++++++++++++++++++++++++
The 12z GEFS model in purple on the left below came out first and had the same thing. -6 HDDs vs its prior 6z run. (which was colder and caused a +$1,400/contract spike higher 6 hours earlier)
The expiring November contract is not really a speculators weather market anymore with 2 days of trading to go and volume rapidly dropping off.
It was MUCH stronger today than the next month, December which IS trading weather. The December is down around $150/contract with the expiring(Wed) November UP +$1,300/contract.
The Dec would be down even more if the Nov was not trading.
The last 0z EE was much milder compared to the previous run for the 3rd run in a row!!
As a result, ng prices crashed lower overnight!
I'm not showing the price chart because it's still using the November, front month which expires tomorrow and is NOT trading weather. Probably trading speculators exiting their positions, the discount to the cash market as it converges and stuff like that.
The December is very much trading weather. I would use my trading account price charts here but it has my account number in the right corner.
The last 0z EE was +6.6 HDDs in purple on the left. We had a blip up at exactly 12:30 am in response to that, which is earlier than I get the EE data. However this spike higher was only able to hold for around 3 hours and we made new lows after that because, as you'll not from the graph below the TRAJECTORY is still DOWN for HDDs, especially at the end(when the previous 12z run suggested colder). The cooler changes on the last run were for individual days in the same BEARISH PATTERN. The November contract expires today but there's almost nobody left trading it.
Temps last week for the EIA report his morning.
https://www.cpc.ncep.noaa.gov/products/tanal/temp_analyses.php
+++++++++++++++++++
+74 Bcf
https://ir.eia.gov/ngs/ngs.html
![]()
for week ending October 24, 2025 | Released: October 30, 2025 at 10:30 a.m. | Next Release: November 6, 2025
| Working gas in underground storage, Lower 48 states Summary text CSV JSN | |||||||||||||||||||||||||
|---|---|---|---|---|---|---|---|---|---|---|---|---|---|---|---|---|---|---|---|---|---|---|---|---|---|
| Historical Comparisons | |||||||||||||||||||||||||
| Stocks billion cubic feet (Bcf) | Year ago (10/24/24) | 5-year average (2020-24) | |||||||||||||||||||||||
| Region | 10/24/25 | 10/17/25 | net change | implied flow | Bcf | % change | Bcf | % change | |||||||||||||||||
| East | 913 | 899 | 14 | 14 | 917 | -0.4 | 900 | 1.4 | |||||||||||||||||
| Midwest | 1,085 | 1,060 | 25 | 25 | 1,104 | -1.7 | 1,078 | 0.6 | |||||||||||||||||
| Mountain | 286 | 282 | 4 | 4 | 291 | -1.7 | 240 | 19.2 | |||||||||||||||||
| Pacific | 316 | 311 | 5 | 5 | 305 | 3.6 | 283 | 11.7 | |||||||||||||||||
| South Central | 1,282 | 1,255 | 27 | 27 | 1,235 | 3.8 | 1,209 | 6.0 | |||||||||||||||||
| Salt | 336 | 320 | 16 | 16 | 326 | 3.1 | 317 | 6.0 | |||||||||||||||||
| Nonsalt | 947 | 935 | 12 | 12 | 908 | 4.3 | 892 | 6.2 | |||||||||||||||||
| Total | 3,882 | 3,808 | 74 | 74 | 3,853 | 0.8 | 3,711 | 4.6 | |||||||||||||||||
| Totals may not equal sum of components because of independent rounding. | |||||||||||||||||||||||||
Working gas in storage was 3,882 Bcf as of Friday, October 24, 2025, according to EIA estimates. This represents a net increase of 74 Bcf from the previous week. Stocks were 29 Bcf higher than last year at this time and 171 Bcf above the five-year average of 3,711 Bcf. At 3,882 Bcf, total working gas is within the five-year historical range.
For information on sampling error in this report, see Estimated Measures of Sampling Variability table below.
Note: The shaded area indicates the range between the historical minimum and maximum values for the weekly series from 2020 through 2024. The dashed vertical lines indicate current and year-ago weekly periods
+++++++++++++
Story of the Day
Traders were treated — not tricked — by an in-line storage build Thursday with no Halloween surprises. Still, December natural gas futures climbed on stronger demand despite ample supply.
+++++++++++
metmike: The magnitude of the massive move up surprised me!!!
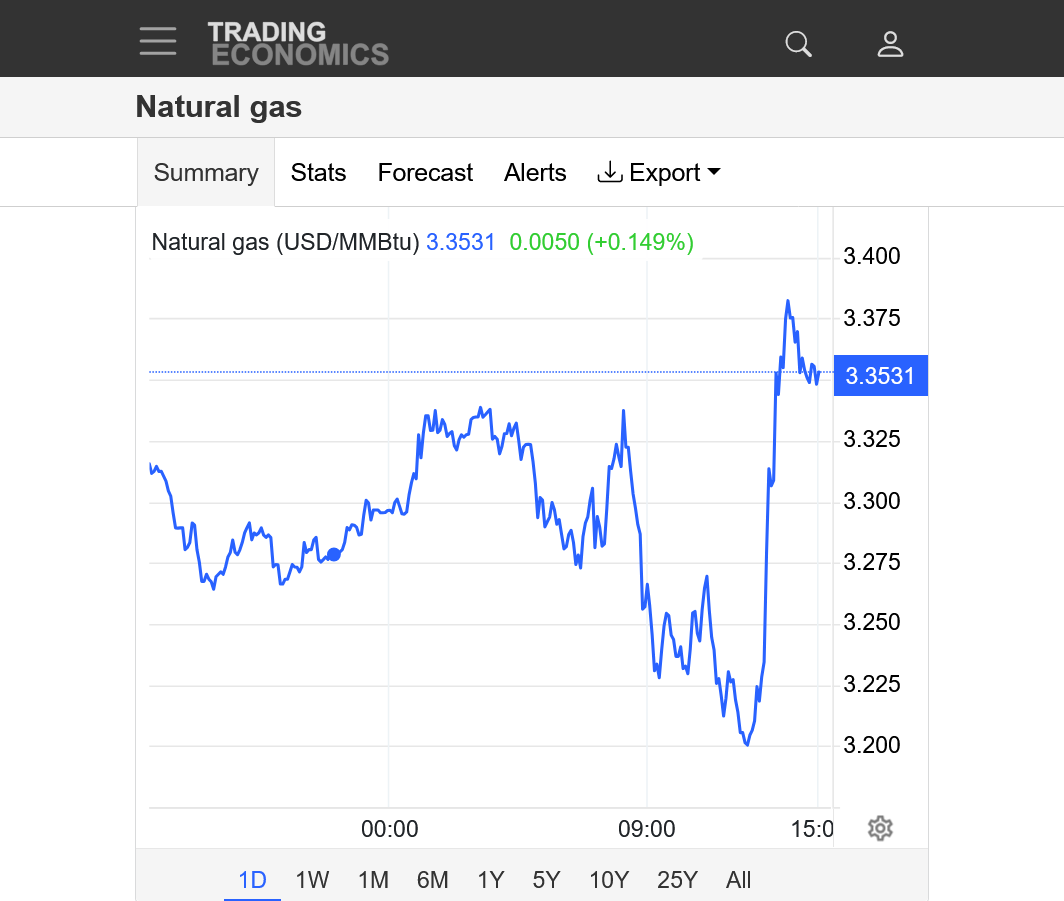
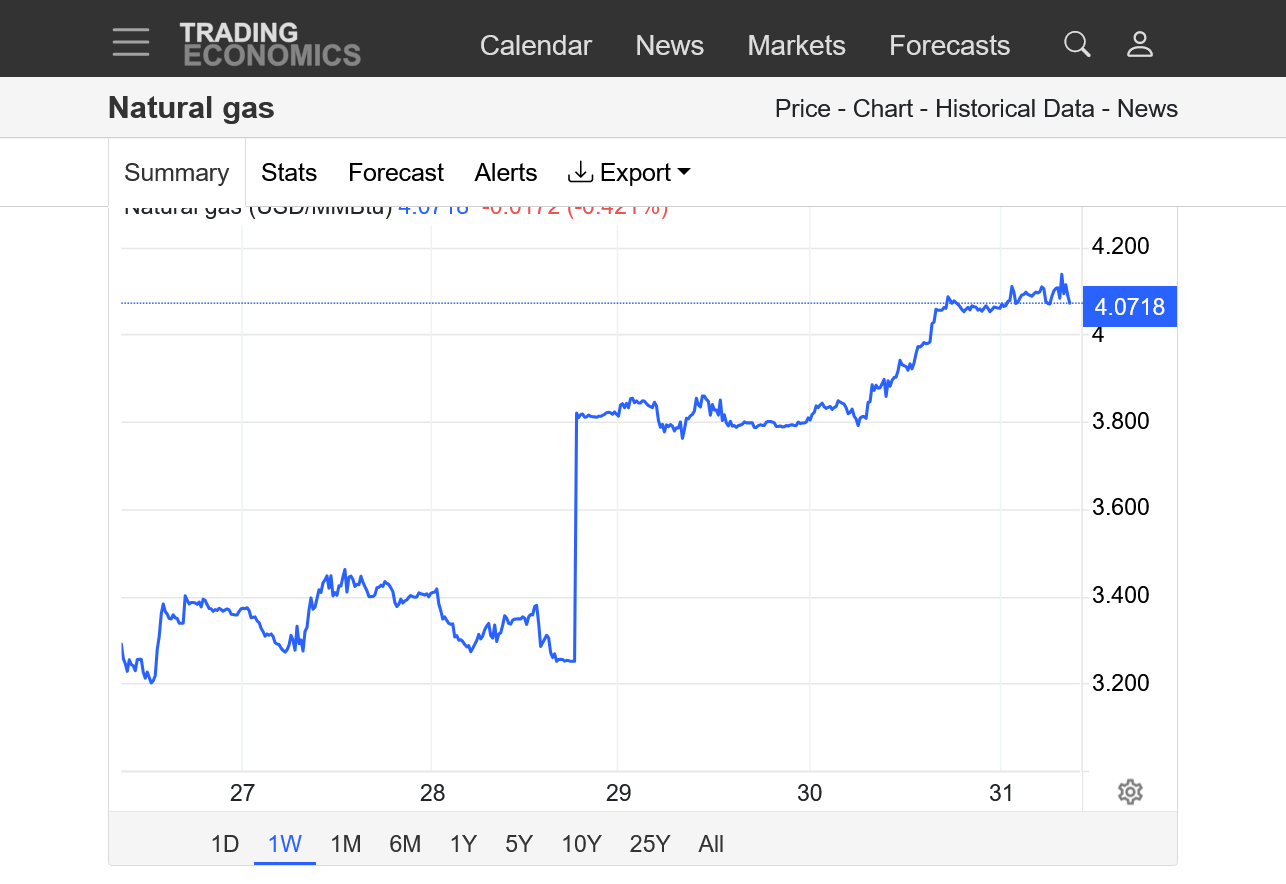
https://tradingeconomics.com/commodity/natural-gas
1. 1 week; The huge spike up was just the price differential when this source went from plotting the November contract to the much higher priced December contract. Such a huge difference, messes up using price chart formations.
2. 1 day: This shows the massive move up today that was from SUSTAINED buying that kicked in around 6am which is when the big money/huge traders enter the market.
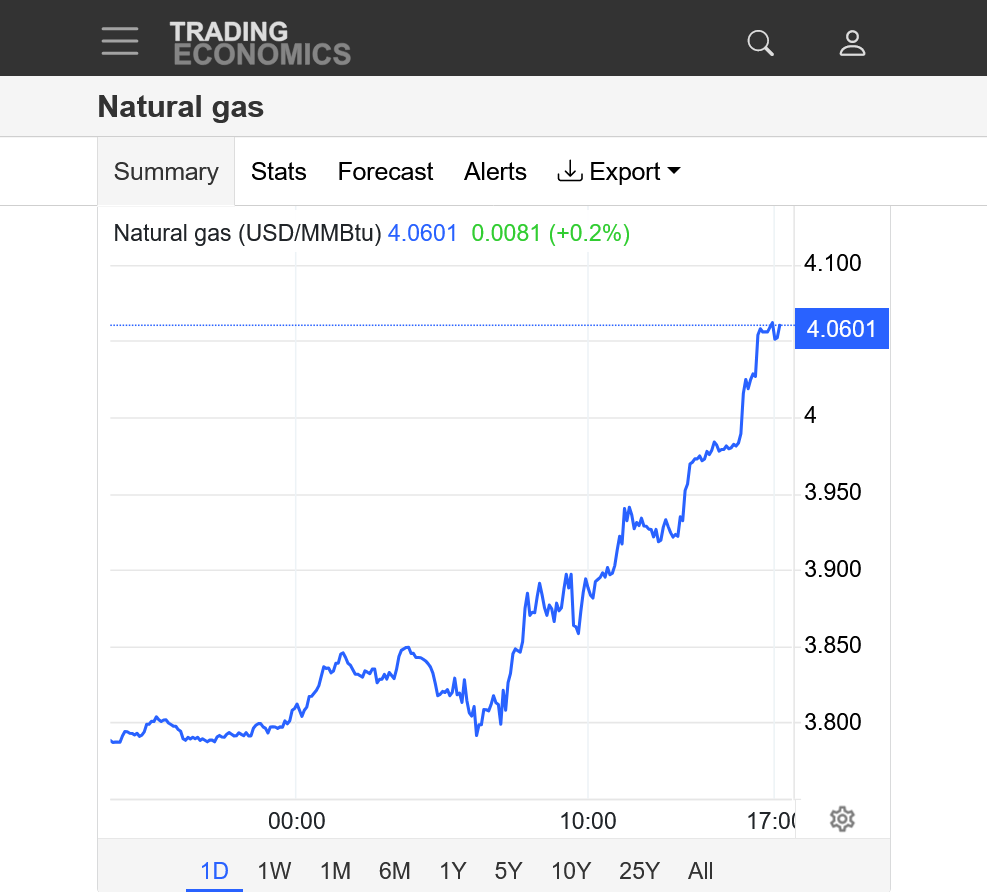
++++++++++++++++
The only potentially bullish part of the forecast is early December which has low skill at the end of October.
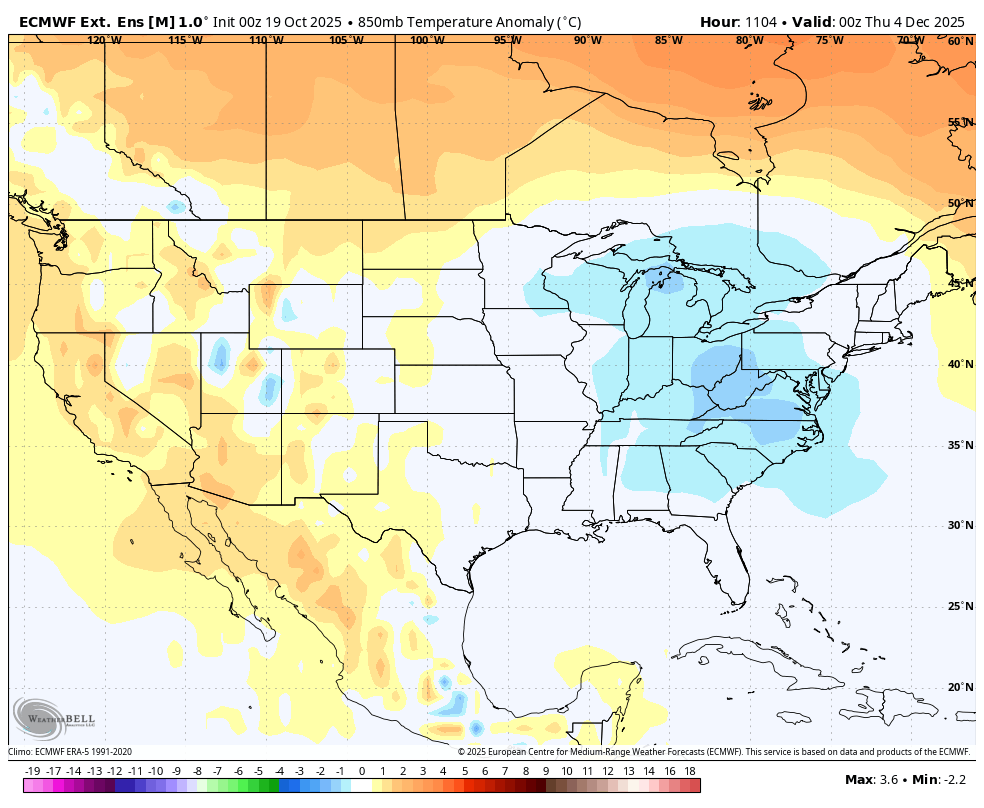
These were the 850 mb temps on December 8th from the last European Ensemble model. This is also not new. Maybe the December contract was waiting for the November to expire???
Some of the upcoming Winter forecasts are pretty chilly for the northern half of the country.
Madden-Julian Oscillation:
Recent Evolution, Current Status and
Prediction
https://www.cpc.ncep.noaa.gov/products/precip/CWlink/MJO/mjoupdate.pdf
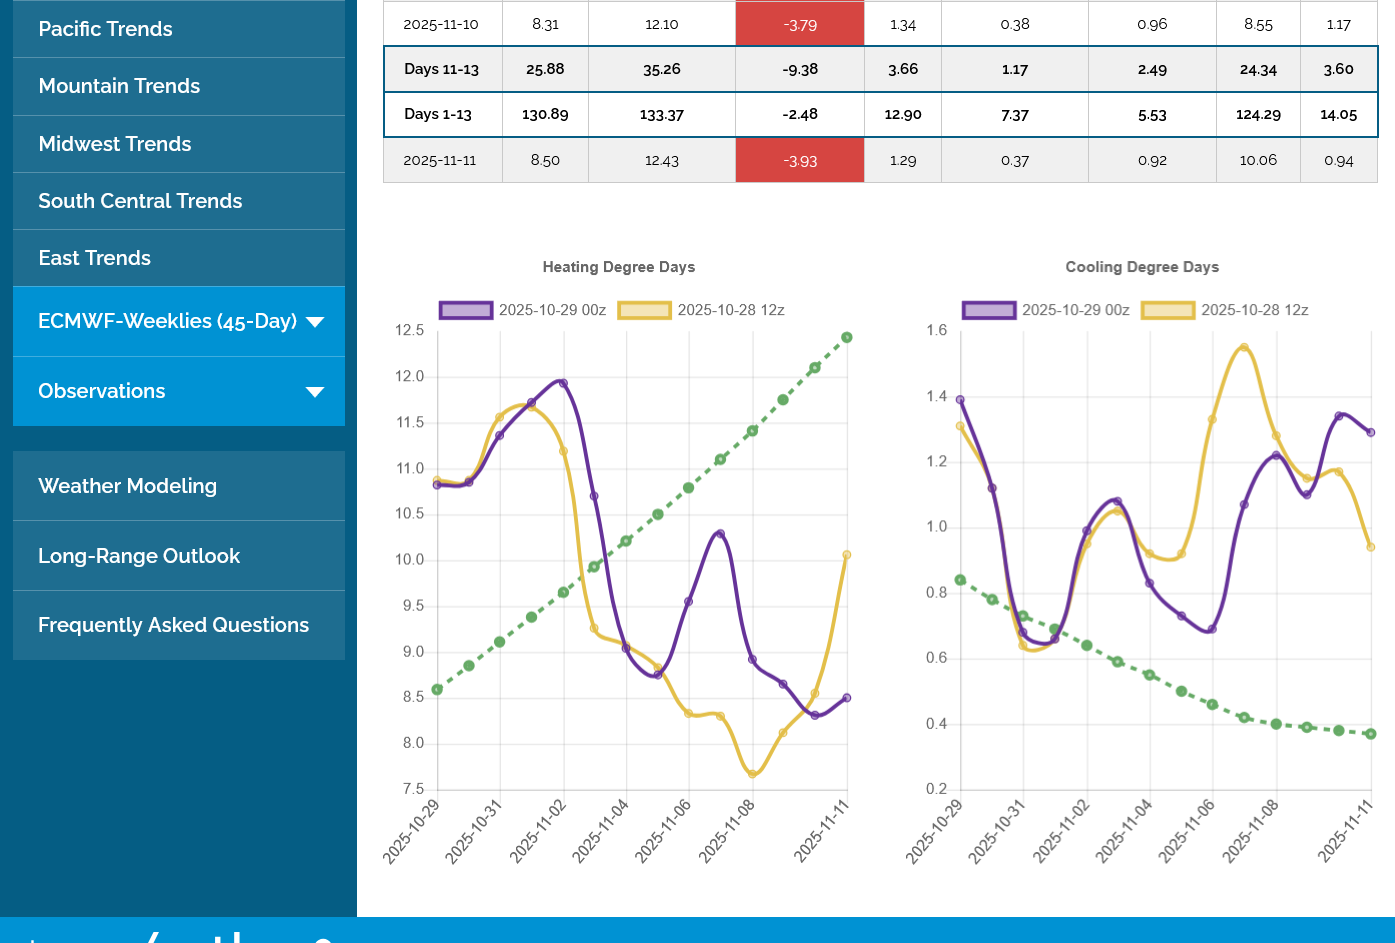
+2.7 HDDs on this last 0z European Ensemble model(from some cooler individual days mid period). That's a bit bullish but the actual graph below is not really that bullish. The trajectory is actually bearish.
https://tradingeconomics.com/commodity/natural-gas
1. 1 week with huge jump up after going from November to the higher priced December contract on the chart.
2. 1 day: Up around $2,000 on the new front month, December since the release of the EIA data on Thursday.
NG had a small gap higher on the open. I don't see this going too far on weather.
The pattern is bearish overall the next 2 weeks.
However, forecasts for late November/early December continue to show colder than average temps in the Eastern half of the country. If the market is focusing on that, along with expectations of the upcoming colder than average Winter for the northern half of the US, then that could be a source of bullish ammo.
That didn't last long. Small gap filled.
It's now a gap and crap, small buying exhaustion at the open, probably more from the lack of selling right at the open.
It's marked by red lines on the right.
The spike up on the left was just the price on this chart rolling over to the much higher priced December contract as November was expiring.
The Winter months are almost always much higher priced than Oct/Nov which are extremely low demand(and building storage) months.
Our first draw downs usually happen when December is the front month.
https://tradingeconomics.com/commodity/natural-gas
WOW! The 0z GEFS came out milder, then the 0z European Ensemble came out MUCH colder and NG took off like a rocket. +11 HDDs!!!!(purple line on the left vs the previous 12z run from 12 hours earlier).
Then the 6z GEFS came out milder again and we gave back most of the gains!
https://tradingeconomics.com/commodity/natural-gas
1 day: 3 inflection points with red lines, starting on the left.
1. Higher open at 5pm Sunday. Sold off immediately, almost -$1,000
2. 0z EE came out MUCH colder(after the milder 0z GEFS was out) Shot up almost $2,000/contract.
3. 6z GEFS came out milder again and we're back down closer to the lows right now.
++++++++++
10 am update: A bounce off the lows and +$500/contract vs the Friday close.
The middle part of this 12z GEFS (purple/left) that is still not finished came out much colder for a couple of days.
NG shot up back to the highs!
After having a few chilly runs in late Oct in the E US for the period around Veteran’s Day and then backing off to mild, the model consensus since Nov 1st has gotten much colder for then with the last few runs being the coldest yet!
Check out the EE progression for 0Z on Nov 9th from the 0Z 10/30 run through the 0Z 11/3 run: check out the big rise in Greenland heights along with the increased +PNA intensity: this shows that models out 10 days were clueless!
Thanks, Larry, I get you on this point.
This is similar to what happened during the 2nd half of August when the models kept getting colder and colder because they couldn't accurately forecast the northern stream.
You can follow the cooling progress here by scrolling down thru the posts:
https://www.marketforum.com/forum/topic/113735/
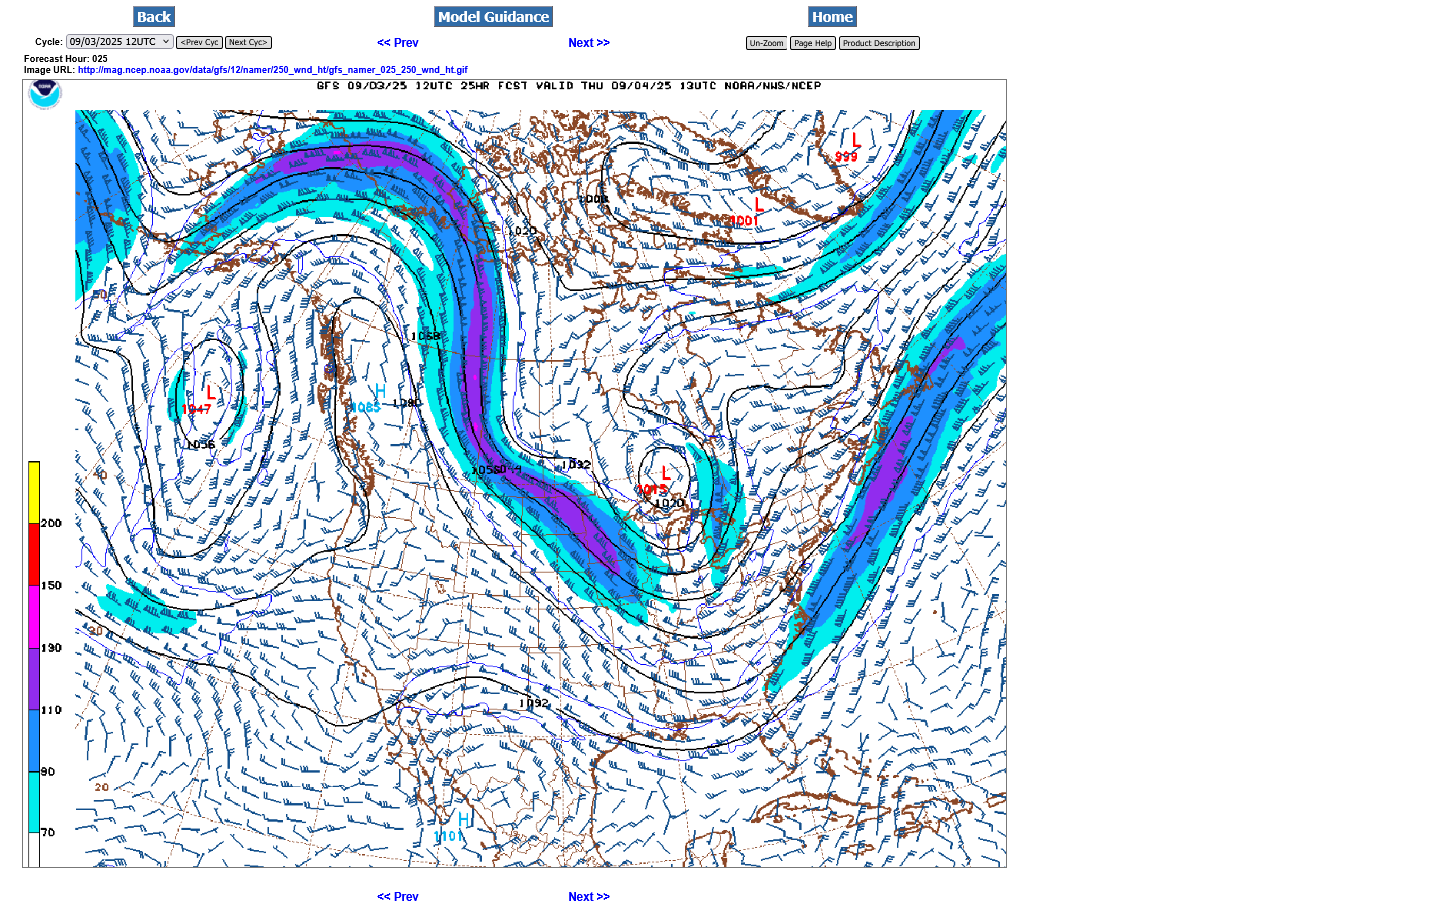
It culminated in this at the peak, to end August and start September which was a shockaroo compared to expectations in early August:
By metmike - Sept. 3, 2025, 3:48 p.m.
++++++++++++
I don't know if we're going to follow the same extreme path here in November as we did in August. It's likely a function of the unpredictable northern stream. Patterns tend to repeat but this is also a different season and there's almost no daylight left in the higher latitudes, along with snows starting to accumulate compared to August when those areas were basking in extra daylight hours on bare ground. That can change the forcing and alter the patterns.
3pm:
After the 0z EE was +11 HDDs as show above the 12z run HDDs was not available at the source that I use.
NG is showing more strength this morning and making new highs for the move! Because of the huge price differential between the Nov contract that expired last week and the new, higher priced Dec contract, the weekly and monthly charts of just the front month, especially are distorted.
https://tradingeconomics.com/commodity/natural-gas
1. 1 day: No doubt, the bulls have take charge in the past hour! I'm guessing the guidance is coming out colder again.
2. 1 month: Spike up from rolling over to the Dec from Nov. Solid uptrend, even if you take that away.
3. 1 year: On the left, 2 very steep uptrends/spikes up caused entirely by extreme cold. Major top in March. The current Dec price is approaching that March top price even though Dec has added premium that makes it misleading. At the bottom: steep downtrend with near record cool weather late in August, followed by a major bottom and higher lows.
4. 10 years: MAJOR top in 2022! At the end of Summer/into Fall we had record, 100+ injections that increased storage the fastest ever. The cure for high prices.........high prices because it stimulated incentive TO INCREASE PRODUCTION. Current: Breaking out to the upside from a symmetrical wedge/triangle(lower highs/higher lows). Approaching what appears to be long term resistance with the horizontal line. Again, the prices in ng can really vary from month to month depending on the season and these graphs are the FRONT month. In the low demand Fall months(Oct/Nov contracts) the price is MUCH lower than the higher demand Winter months(Dec/Jan)
++++++++++++
My guess above that the guidance was coming out colder again based on price action the past hour is verified below.
Purple on the left are the HDDS of the now updating 12z GEFS. Note the last 4 data points are ALL HIGHER than the previous 3 runs because this run of the model was COLDER for that time frame. +7 HDDS from just that period vs the 0z run, for instance.
Honestly, I don't know how much longer this can last because the trajectory after the huge cold spike higher (that keeps getting colder from individual days) is DOWN back into well below average HDDs.
The market will dial in the colder individual days completely at some point, maybe today unless it really gets even colder) then trade on whats coming up after that. When that happens, unless it turns much colder, the weather will have a bearish impact on prices.
Yesterday, Larry mentioned the models getting colder and colder and colder for the cold shot coming up at the end of this upcoming weekend.
This happened again this morning.
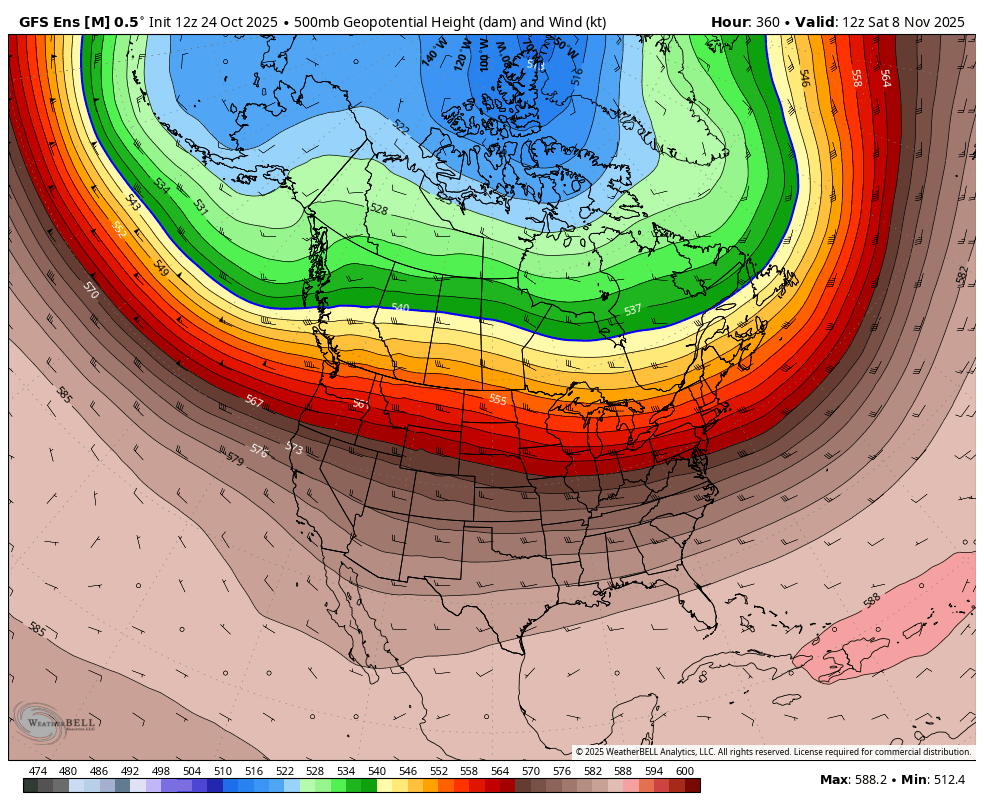
Look at the similarities to this last 250 mb jet stream from the end of August, when the pattern was similar(kept getting colder and this was when it bottomed out) and this last run of the 12z GFS.
1, 250 mb for September 4, 2025-slightly more amplitude than now. Especially impressive for a jet stream in the warm(Summer) season.
2. 250 mb for November 9, 2025. Similar but with a more zonal flow in Canada vs the meridional (north to south) flow 2+ months ago that pulled down air from higher latitudes.
Note the L or upper level low around and just north of the Great Lakes at both time frames. This is actually a piece of the Polar Vortex displaced unusually far south, especially in the first image for that time of year.
In the 2nd image, note the powerful jet stream in the Pacific which is likely going to completely blow out this current, temporary (north to south)pattern and replace it with strong, zonal, west to east mild flow by late next week. If that continues to be the forecast, ng prices are likely to come back down fast and it will happen numerous days before the warm up. Maybe as much as a week before it happens if the rest of the guidance turns milder/less cold.
We can also continue to get colder if the solutions change from today.
Again, this big surprise intrusion in the magnitude of the upcoming cold is mainly a function of the models struggling to forecast the northern stream.
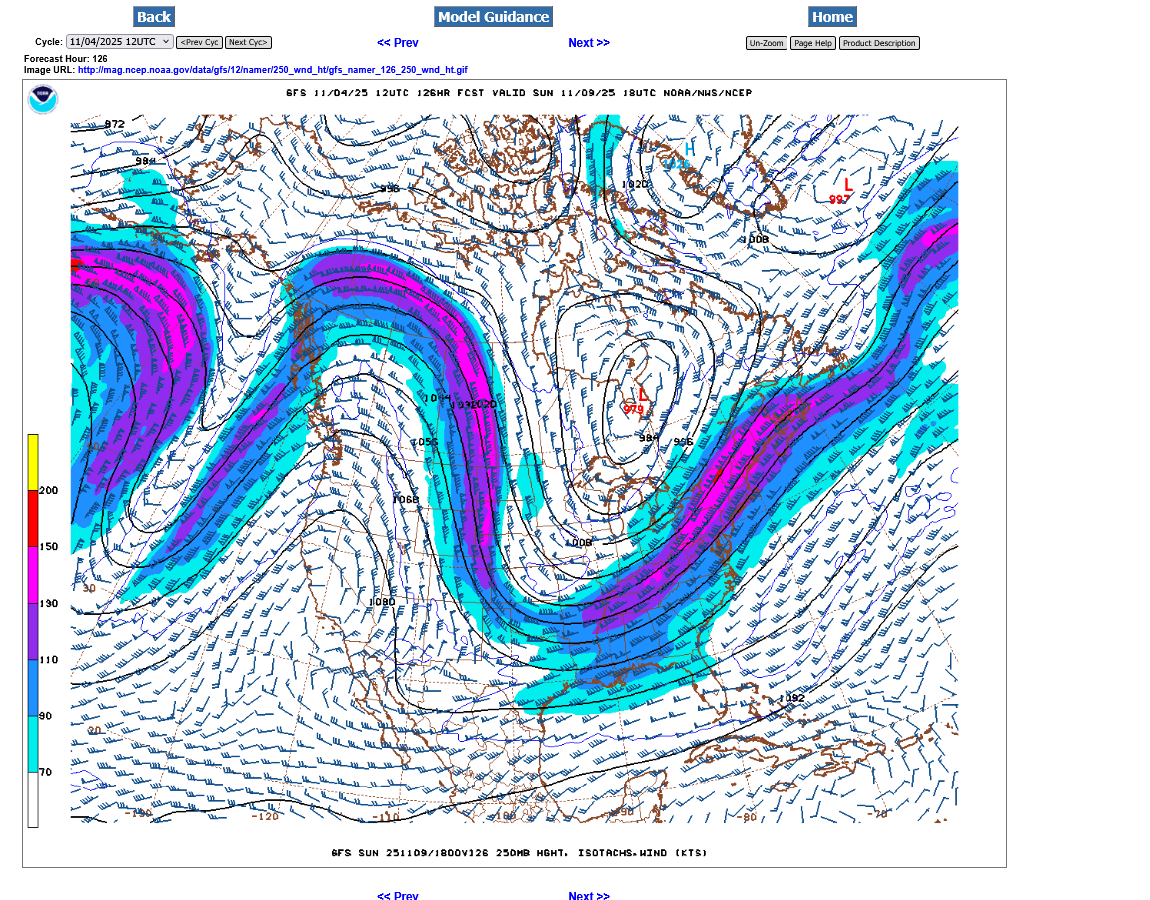
Added: The European model that comes out a bit later than the GFS products above was even colder than the 12z GEFS with it's upper level low farther south into the Great Lakes and the cold lasts a couple days longer.
https://tradingeconomics.com/commodity/natural-gas
This was quite a pop higher from the colder 12z model runs.
Larry, it started BEFORE 9:30am which was before most of us had any GEFS model data. This was because (I believe) big firms that had access to meteorologists with in house models that front run the data on just a regional basis(that can have solutions lighting fast compared to the entire globe model runs that much longer to run) had this colder output before the rest of us.
In the 1990s when I had a satellite dish on the roof and a private weather service I was getting data an hour before the market. I was making a killing, especially in the grains during the Summer.
I opened an account with 2k in 1992 and it grew to 500k in around 8 years. I would load the boat on every extreme model change, worry my arse off for up to an hour because the market was taking so long to react, then every time, the worry would turn to euphoria between 10 minutes to an hour later as the profits gushed in.
There are traders that get this information BEFORE me right now, especially in the mornings like today.
The market doesn't react as fast at other times of day. The 18z run, in fact usually doesn't cause the same reactions.
The 0z runs for sure react very strongly but not nearly as fast as the 12z run.
I had all my money stolen on October 31, 2011 at MF Global, then borrowed a ton of money (and put the money that came back from MFG) in PFG Best which went bankrupt in July 2012.
Since then, my account has never gotten close to 6 digits because my 1990s HUGE edge is gone.
++++++++++++++++++
I have to add that all those huge profits came during the week and often when the market was trading.
On the other hand, I lost over half my money a couple of times margined out like that by holding a position over a weekend. One time over a 4th of July, long weekend. When the weather changes in the WRONG direction on Saturday, then gets even worse on Sunday, EVERYBODY KNOWS ABOUT IT when the market reopens and you pay the piper with a gap in the WRONG direction.
One time, the market only traded for 10 minutes on the Monday 9:30 am open, then went lock limit down the rest of the day. That 10 minutes allowed me to get out in 1994 and not doing that would have meant Losing all our money as well as $20,000 more on the Tuesday morning open. I still think of that huge loss(for my equity at that time) as being the best trade of my life as I would have had to find a real job if I had hesitated to cover on the Monday morning open.
I came back and actually made money that year, then got really dumb again years later and repeated the same thing. Only I had more money to lose so I stayed in and lost almost 70% of the equity before emotions and a huge margin call caused me to cry uncle and covered my 300 corn and 200 beans long position at the exact lows of the entire Summer..........when I should have been buying!!!
That was the WORST trade of my life......watching the market go straight up for the next month and being a weekend too early getting long. It took a couple of years to get that money back. The only nice thing is that the year following that almost $300,000 loss on our tax return I got to use that loss to have a ton of the previous years fed taxes refunded to us using the carryback option. It almost seemed like an investment with 0% interest. Pay huge taxes on profits for several years and get a bunch back when you lose money after that!
Hey MM,
After I saw NG price graph showing a sharp drop from 12:05AM to 12:30AM CDT of 1.8%, I checked out the 0Z EE. Sure enough, the WxBell change maps suggest a sharp drop in HDDs 11/12-19!
How much did 0Z EE HDDs drop 11/12-19?
Hi Larry!
You're a night owl!
Unfortunately, that product for the EE was unavailable for that site thru the first couple of days this week, which is why I showed the GEFS instead the EE.
It's back now. Let me do an assessment for that period for you.
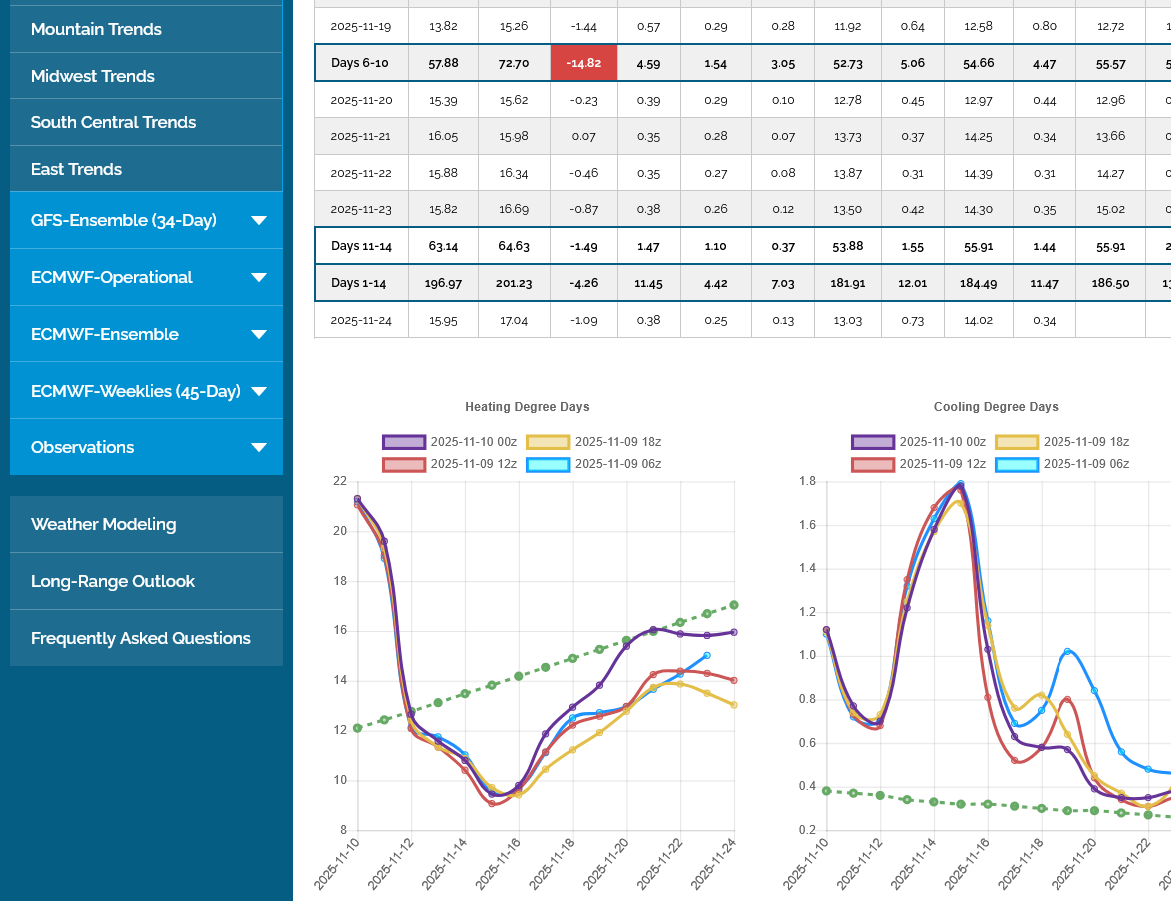
This last run in purple was -5.4 HDDs(milder) from what Larry noted. Note the purple data points during the time frame that Larry identified dropped BELOW the data points from the previous model run below.
I calculated the drop in the period you noted and the magnitude was just over 6 HDDs so that -5HDDs from the last 0z run came entirely from that milder period that you noted and shows up clearly below.
Here's some turning points from the last 24 hours, starting from the left.
1. 12z GEFS came out colder. The reaction up started an hour before most of us had that information.
2. The 12z EE came out colder too early in week 2 but that is followed by milder weather at the end of the forecast and we apparently exhausted the buying from the colder models that was based on colder individual days but not from a pattern change.
3. The 0z EE came out LESS cold as Larry mentioned and we collapsed straight down for several minutes immediately when the milder part of the forecast started coming out.
4. The 6 GEFS came out about the same(which is colder than the EE guidance) after we tested the lows of yesterday morning.
I revised my first analysis at the previous post to dial in additional information that allowed me to elaborate better about the specific time frame that Larry had astutely pointed out since I was not up overnight monitoring ng.
It's noted in bold/underlined text.
Cool vs average in the East. Mild in the N. Plains and Southwest.
https://www.cpc.ncep.noaa.gov/products/tanal/temp_analyses.php
https://ir.eia.gov/ngs/ngs.html![]()
for week ending October 31, 2025 | Released: November 6, 2025 at 10:30 a.m. | Next Release: November 14, 2025
| Working gas in underground storage, Lower 48 states Summary text CSV JSN | |||||||||||||||||||||||||
|---|---|---|---|---|---|---|---|---|---|---|---|---|---|---|---|---|---|---|---|---|---|---|---|---|---|
| Historical Comparisons | |||||||||||||||||||||||||
| Stocks billion cubic feet (Bcf) | Year ago (10/31/24) | 5-year average (2020-24) | |||||||||||||||||||||||
| Region | 10/31/25 | 10/24/25 | net change | implied flow | Bcf | % change | Bcf | % change | |||||||||||||||||
| East | 909 | 913 | -4 | -4 | 932 | -2.5 | 911 | -0.2 | |||||||||||||||||
| Midwest | 1,105 | 1,085 | 20 | 20 | 1,125 | -1.8 | 1,095 | 0.9 | |||||||||||||||||
| Mountain | 288 | 286 | 2 | 2 | 291 | -1.0 | 241 | 19.5 | |||||||||||||||||
| Pacific | 318 | 316 | 2 | 2 | 309 | 2.9 | 284 | 12.0 | |||||||||||||||||
| South Central | 1,296 | 1,282 | 14 | 14 | 1,263 | 2.6 | 1,223 | 6.0 | |||||||||||||||||
| Salt | 341 | 336 | 5 | 5 | 337 | 1.2 | 325 | 4.9 | |||||||||||||||||
| Nonsalt | 955 | 947 | 8 | 8 | 926 | 3.1 | 898 | 6.3 | |||||||||||||||||
| Total | 3,915 | 3,882 | 33 | 33 | 3,921 | -0.2 | 3,753 | 4.3 | |||||||||||||||||
| Totals may not equal sum of components because of independent rounding. | |||||||||||||||||||||||||
Working gas in storage was 3,915 Bcf as of Friday, October 31, 2025, according to EIA estimates. This represents a net increase of 33 Bcf from the previous week. Stocks were 6 Bcf less than last year at this time and 162 Bcf above the five-year average of 3,753 Bcf. At 3,915 Bcf, total working gas is within the five-year historical range.
For information on sampling error in this report, see Estimated Measures of Sampling Variability table below.
Note: The shaded area indicates the range between the historical minimum and maximum values for the weekly series from 2020 through 2024. The dashed vertical lines indicate current and year-ago weekly periods.
+++++++++++
The price spiked down immediately after the release:
https://tradingeconomics.com/commodity/natural-gas
+++++++++++
A short lasting cold blast will hit this weekend, then we moderate. Forecasts for December continue to look cold for the Eastern half of the country which is providing support.
https://tradingeconomics.com/commodity/natural-gas
Things got crazy after the update earlier!
1. Note the brief reaction to the EIA number.
2. We had a spike low then reversed up like a rocket by +$2,000/contract. My guess is the colder days on the back half of the European Ensemble forecast but I'm shocked that this small of a bullish change would have resulted in a move of this magnitude, unless the market was looking for an excuse to go even higher.
The 12z GEFS was almost the same as previous runs.
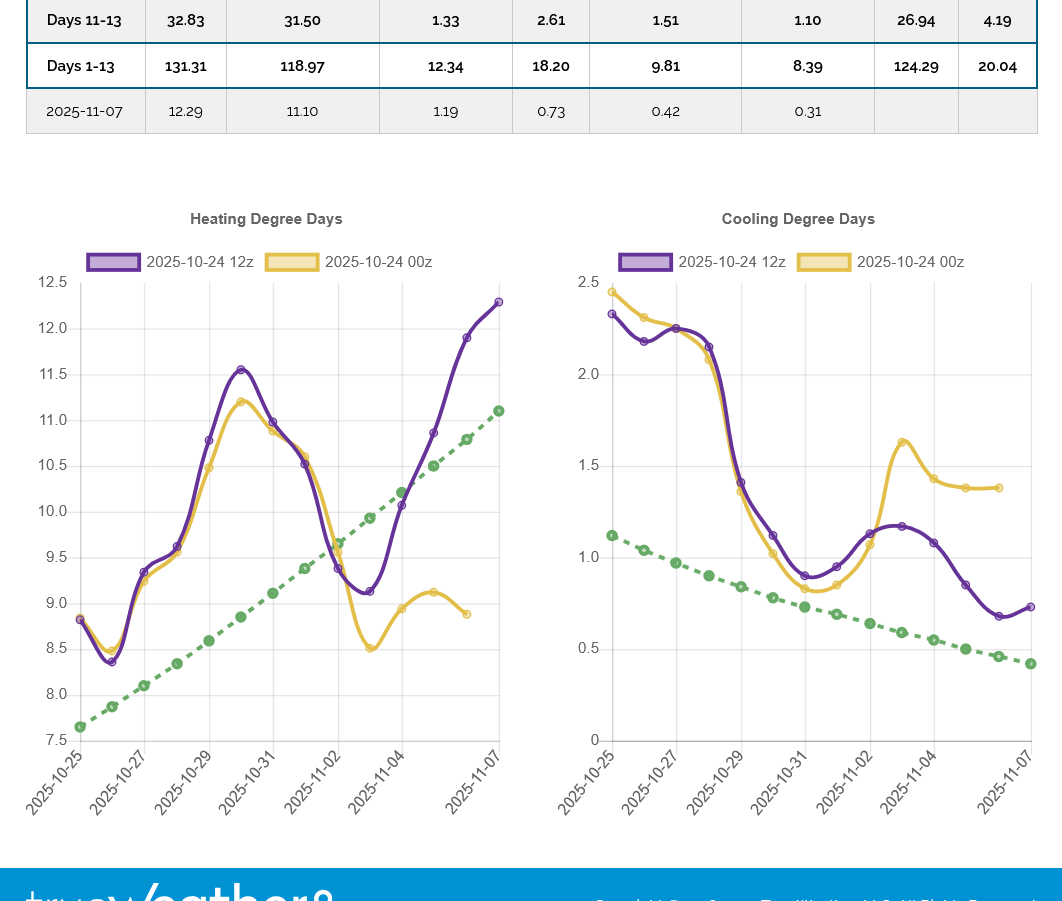
+++++++++++++
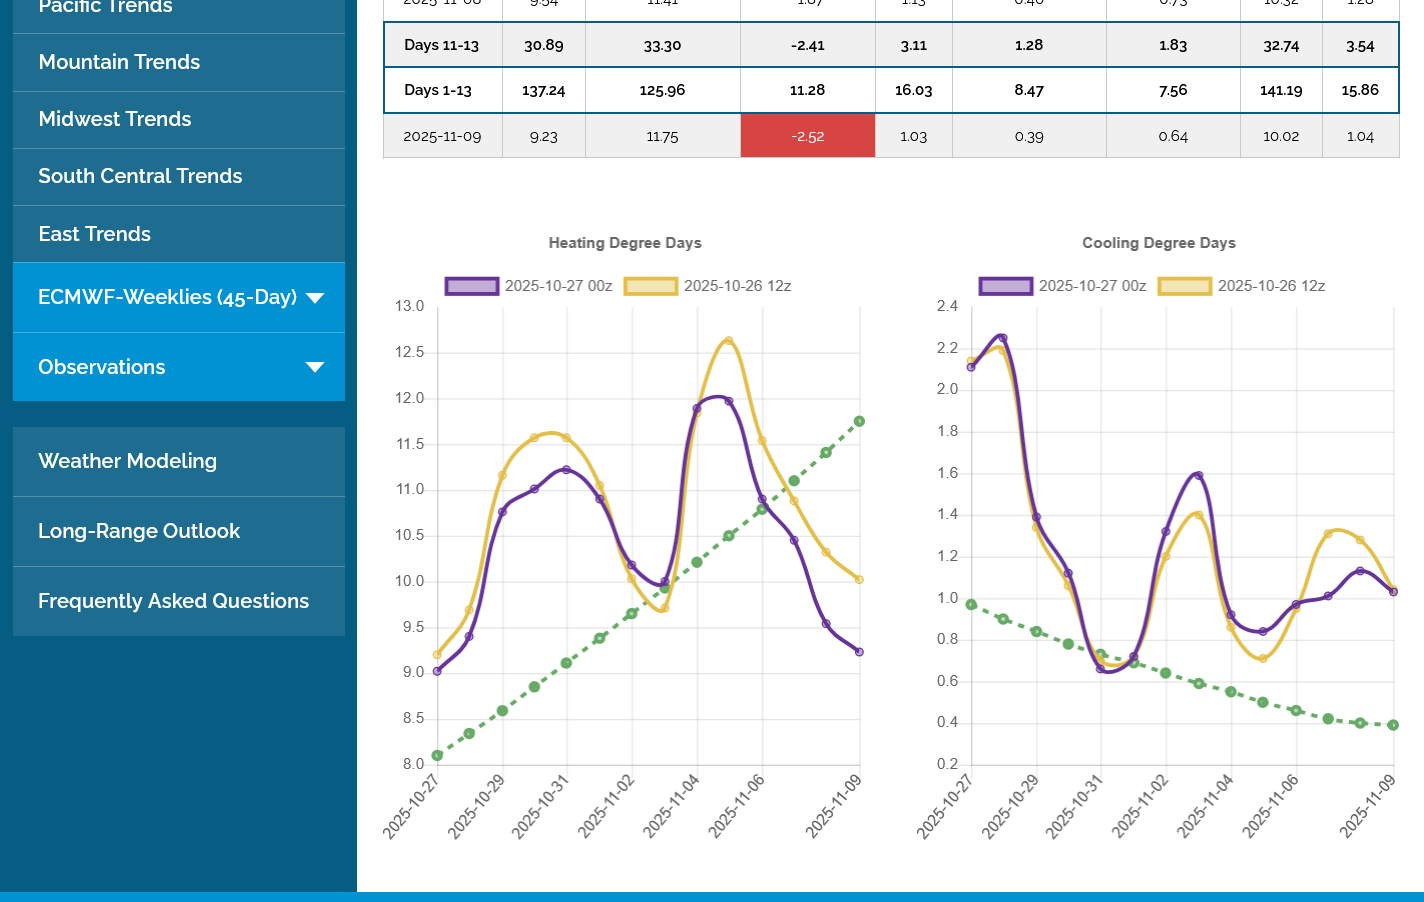
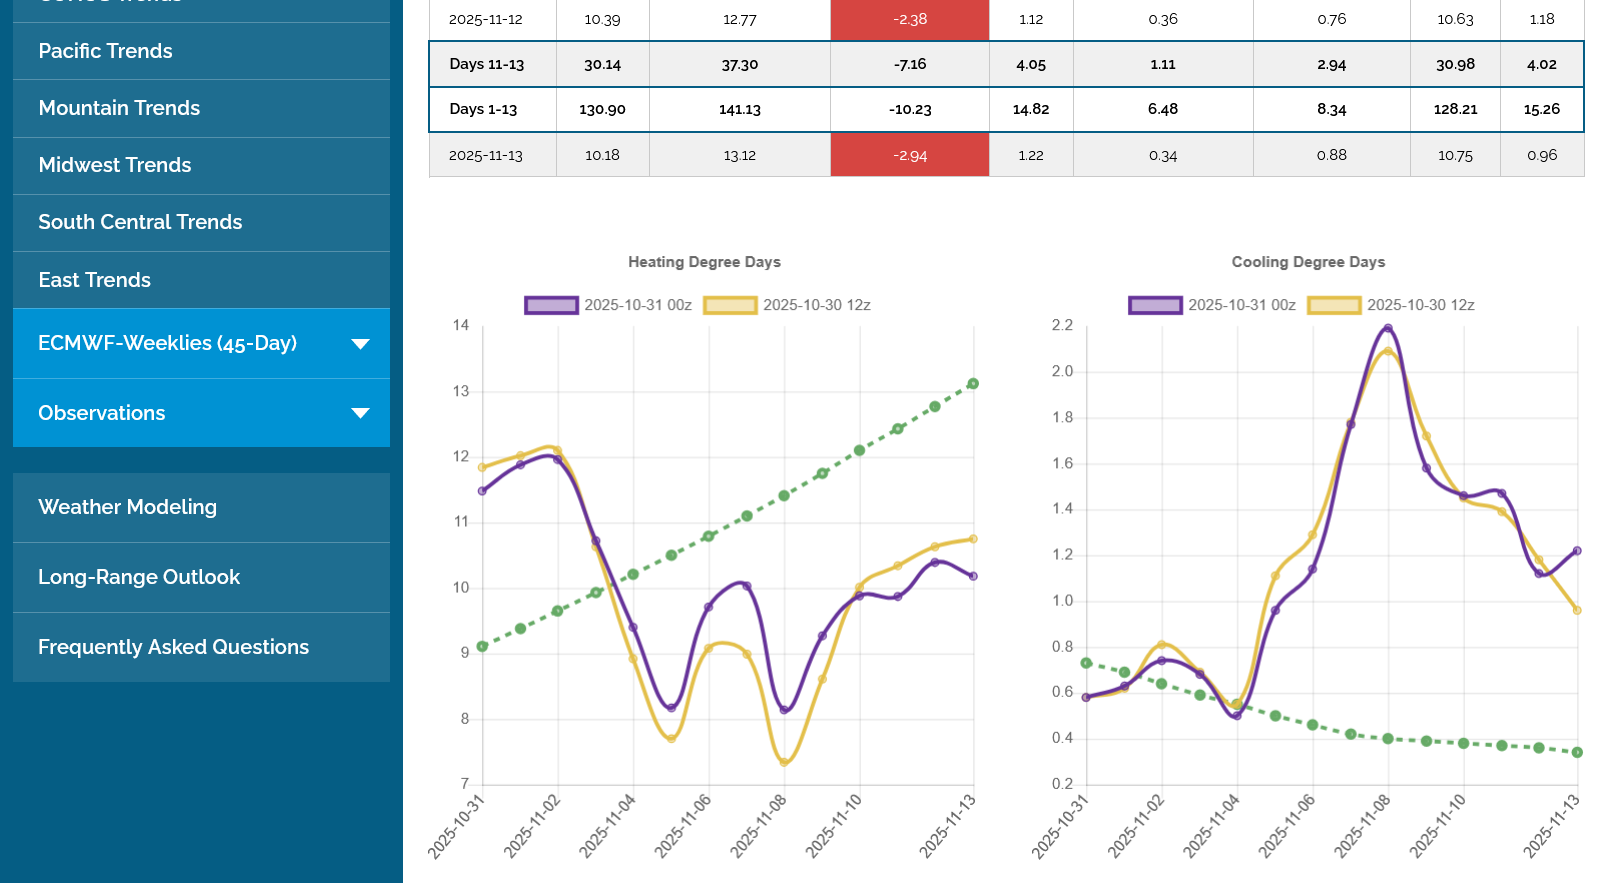
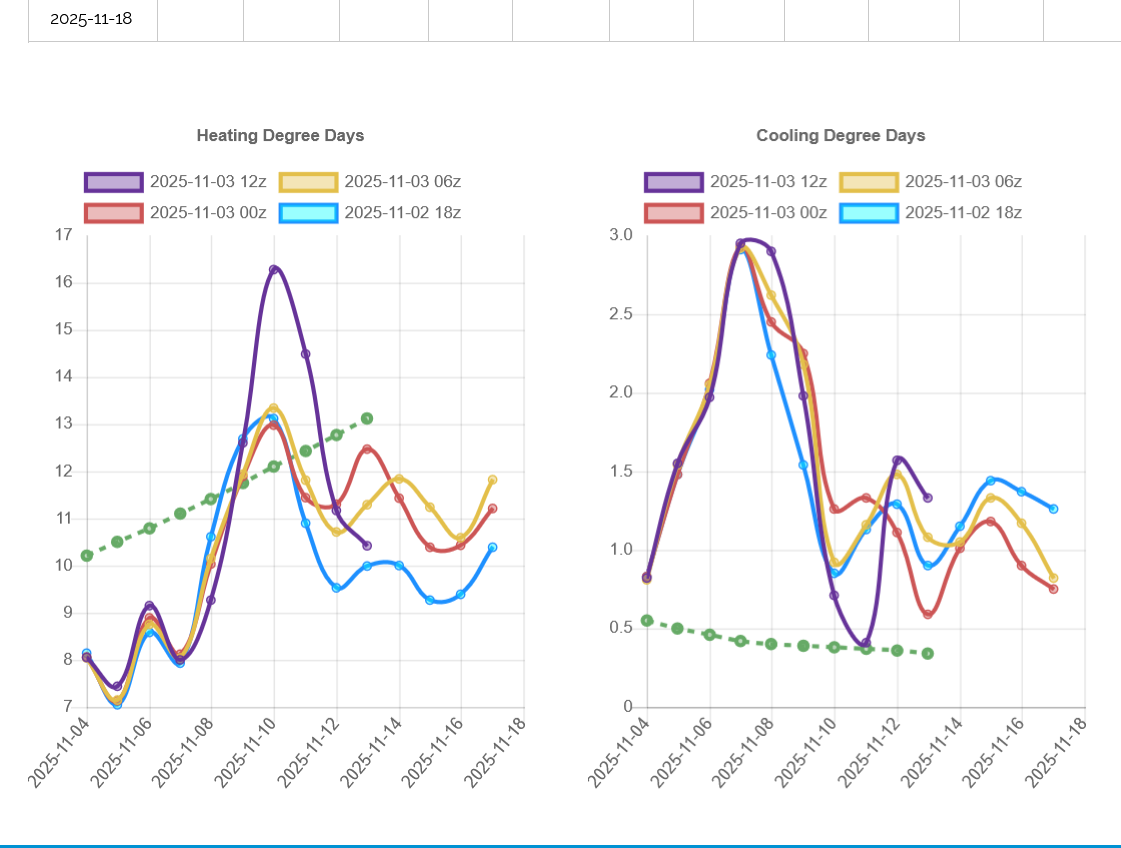
I just got the data for HDDs from this last 12z EE and it was a tad more than I thought. +5 HDDs, mostly from the end of the forecast in week 2. A total of 4 data points/days below in purple(on the left) contributed to almost the entire bullish change. This is a continuation of the forecast models to add colder days.
Despite that, the week 2 pattern is still BEARISH overall compared to the green line which is the rapidly increasing historical average for HDDs. As it goes up, the ACTUAL HDDs are going down in week 2! This is why the current set up is a shorting opportunity for my trading strategy. I believe that the next EE that comes out LESS cold will cause a big spike down and could put in the high..........unless the models keep getting colder which will provide more bullish fuel.
This is also the time of year we very often see a seasonal high.
https://charts.equityclock.com/natural-gas-futures-ng-seasonal-chart
++++++++++++++++
Here's more ng charts. Rolling over from Nov to the much higher priced Dec last week, messes up some of the shorter term charts. In NG because of the huge price differential between high demand and low demand months, the chart formations can be misleading.
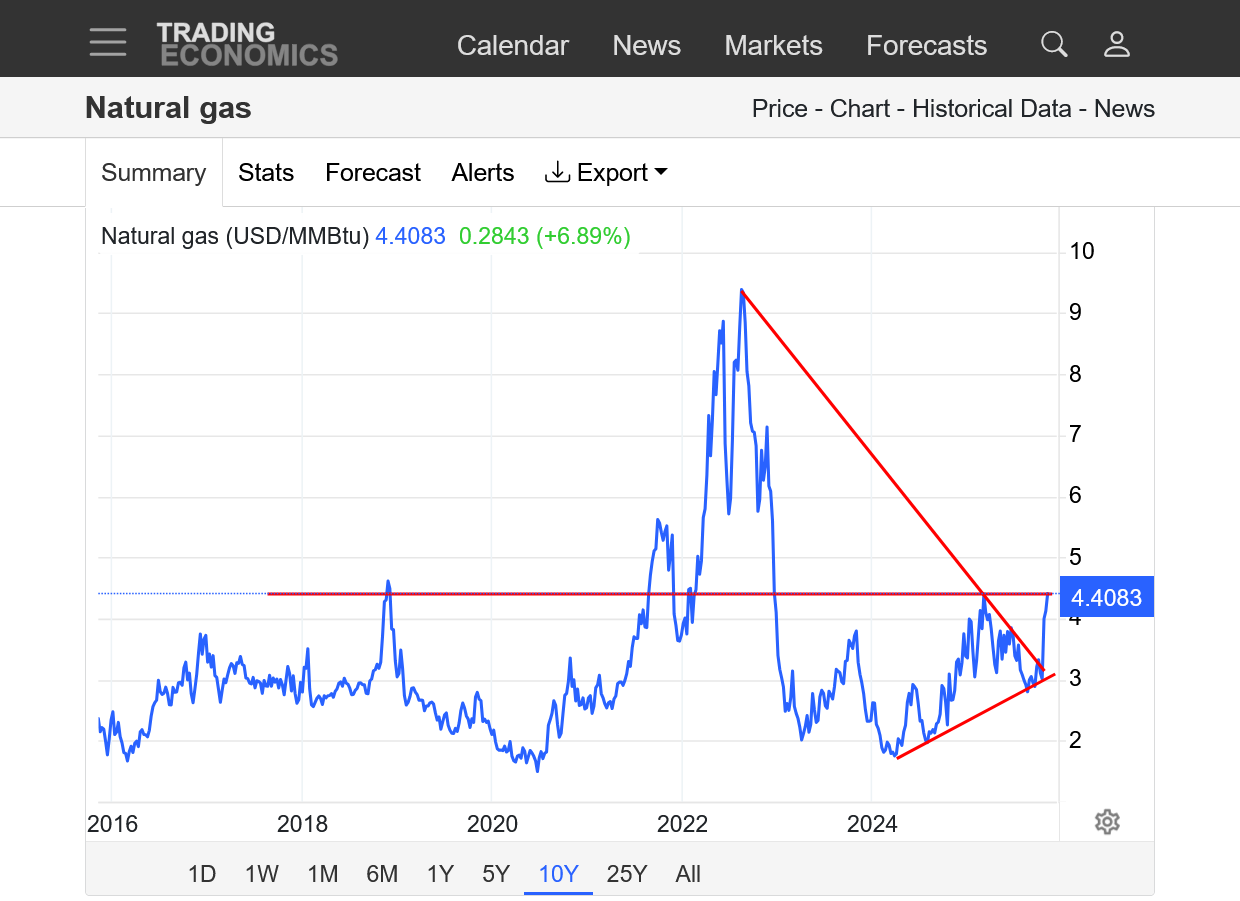
1. 10 years: Upside break out from a symmetrical triangle(but the lower prices in the downtrend in 2025 are from lower demand months).
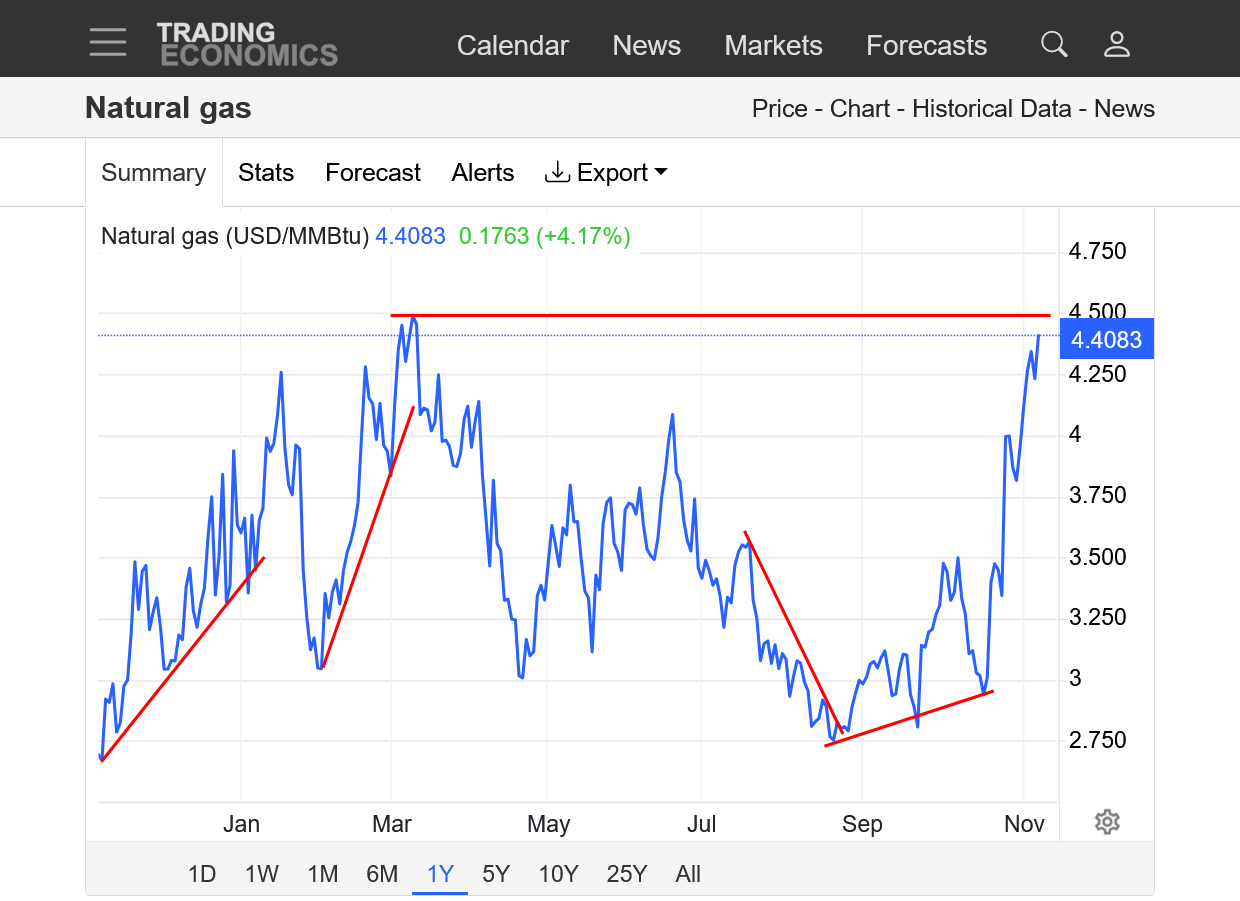
2. 1 year: Approaching the March 2025 highs. Note the 2 steep uptrends on the left caused by extreme cold patterns that resulted in huge demand/drawdowns that started in December. The market tends to remember that early in the next heating season if the forecast is for the same thing. The downtrend in Summer was from record heat not materializing early, then near record cool temps late. Part of the huge move up at the end is because the Dec contract is priced so much higher than the Oct/Nov.
Here's a look at the 12z EE 500 mb map for early next week with the anomalies shaded. That there is a piece of the Polar Vortex displaced very far south. The extension south from the center of it is basically off the color bar chart.
This has been traded for a week+ now, even as the forecast got colder so its already dialed in.
NG may have made a top, depending on the upcoming guidance.
The 0z EE guidance was not changed that much but the GEFS was actually colder and we spiked up a bit to test Thursday's highs but then had a slow decline. The 6z GEFS was MUCH milder. We had already been dropping and this reinforced that.
Should the remainder of the upcoming guidance NOT get colder, that was probably the high. If it gets colder, we can go up again.
Despite this sell off overnight from milder weather models, we could hold the uptrend if buyers step in and anticipate colder models(the trend the past few weeks).
Below are the last 4 GEFS solutions, purple on the left was the last one. HDDs are on the left.
The GEFS came out mostly milder but with a colder end. The EE came out MILDER and has caused NG to go lower again. I held a short with a tight stop for +5 ticks($50/contract) after the stop was hit. Would be up $500/contract if not stopped out. Again, there are people that get the updated guidance just before me, so my edge isn't what it was 30 years ago and it causes me to put in a trailing stop(in case I'm wrong about new weather maps not seen by me yet that somebody else has) instead of relying on an edge.
Regardless, I think the highs are in unless the models turn much colder over the weekend. If not colder, then we could open with a gap lower on Sunday Night.
1:40 pm CST: I updated the chart below. We held the week+ uptrend line again with this drop lower and have touched in numerous times the past week on the way up. This is telling us that buyers are still willing to aggressively jump in to buy BEFORE the price drops to the previous low.
However yesterday's high held around midnight last night and now we've been having lower highs since then......so a symmetrical wedge/triangle if you want to only include trading since then.
However, the overall trend is still clearly up until we violate the main uptrend line/channel. If the models don't turn colder over the weekend, I have confidence that we will trade lower to start the new week.
https://tradingeconomics.com/commodity/natural-gas
2:30 pm CST: This is what's keeping the market supported right now. If that verifies, especially with it being early in the heating season then we will go higher!
https://www.cpc.ncep.noaa.gov/products/predictions/WK34/
This is a shorting set up for me because of the time frame for a seasonal top, this cold wave dialed in last week and much milder weather on the way. I was short briefly on Friday.
Also, the charts were throwing off a top signal on Friday and we've come a long way upwards, part of that dialing in the legit, high risk for a cold start to Winter.
However, there is still big upside risk. As Larry has pointed out, the models have had a strong tendency to get colder with time the last several weeks(like they did in late August) and the threat for it to turn VERY cold late this month and in early December is real.
Here was the coldest 500 mb map on todays European model for the start of the 2nd week in December. This is a tad colder than Friday. I can't know how long this will be bullish/ important to traders but it has been the last 2 weeks and is a bit more bullish today.
The more important thing was a huge +9 HDDs vs the previous run on this last 12z EE model (left/purple). The EE is weather Gospel to the natural gas market. If the GEFS contrasts, the market almost always believes the EE model as it does display more skill overall(even though there are times when the GEFS does better).
This much colder 12z run of the EE makes me think we could have a higher open. However, the BULLISH +9 HDDs is entirely from individual days in the middle of the forecast which suggests, mainly model to model variability.
Note the trajectory for the last several days which matters in telling us WHERE THE PATTERN IS HEADED in week 3 that means a great deal to traders. The previous model was going up/getting colder. This run is going down, getting
milder and BEARISH at the end vs the previous run.
Sunday night opens in NG are notorious for gaps higher/lower.
If I had stayed short on the close Friday, the solution above would be wrecking the enjoyment of my Sunday Afternoon(with me wishing to be flat) because I'll guess that we see a higher open but probably not a gap.
Strongly on the bears side is this: But the market knew it on Friday and the 12z EE takes some of it away!
Every huge loss in my life was from holding a position over a weekend when the wx changed and I couldn't get out and it gapped on the next open (long in grains/OJ but I lost 200 K being short in NG 1 time because of the breaking news of the Enron scandal and I think they were in the market buying back all their shorts). Yes, that was it. For the first time ever, early in the heating season of the last 10 years, NG had made a clear top from weather, the forecast turned much milder but instead of going down like it did every other time..........it went UP instead because of Enron. . If I remember right, they were just covering all their shorts after going bankrupt. They were THE biggest player in the NG market by a wide margin!!!
Jeffrey Skilling (Tom the meteorologist from WGN's brother) was a key player.
https://en.wikipedia.org/wiki/Enron_scandal
Always assume the outside chance of an impossible to predict BLACK SWAN event while your trade is on! I had several of them:
1. Enron
2. MF Global going bankrupt with all my money on October 31, 2011
3. PFG Best going bankrupt with all my money in July 2012!
++++++++++++++
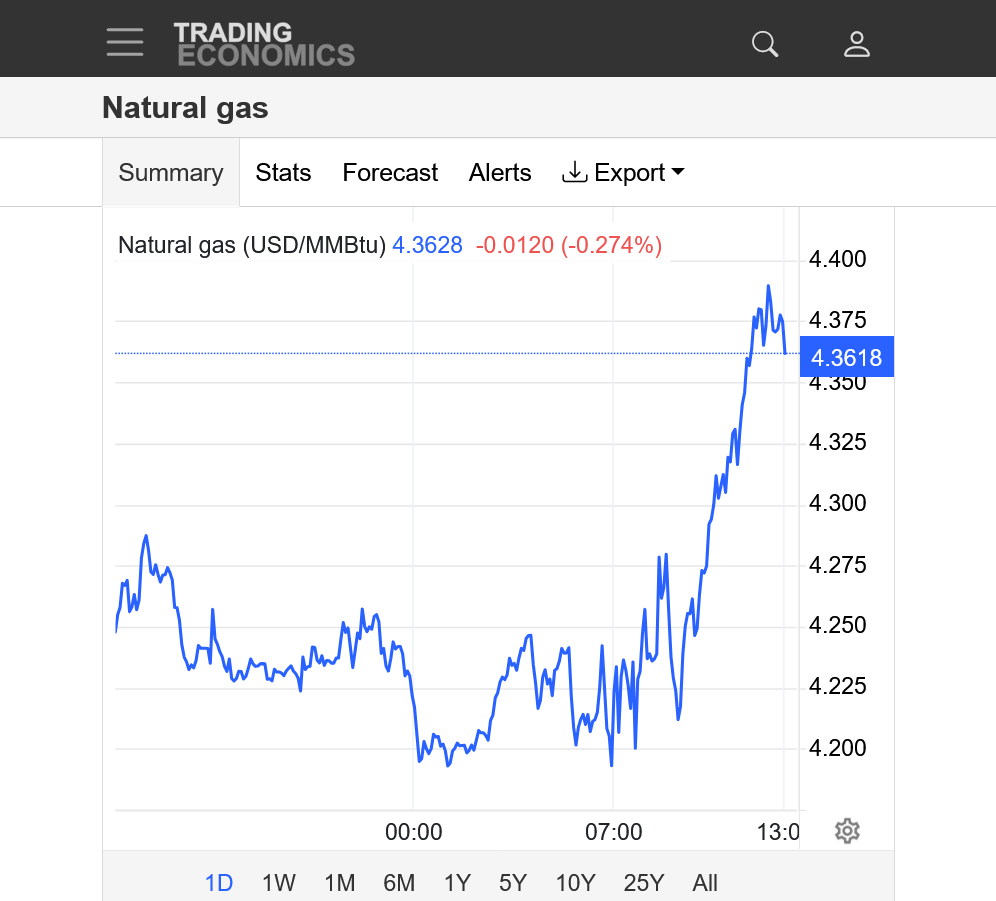
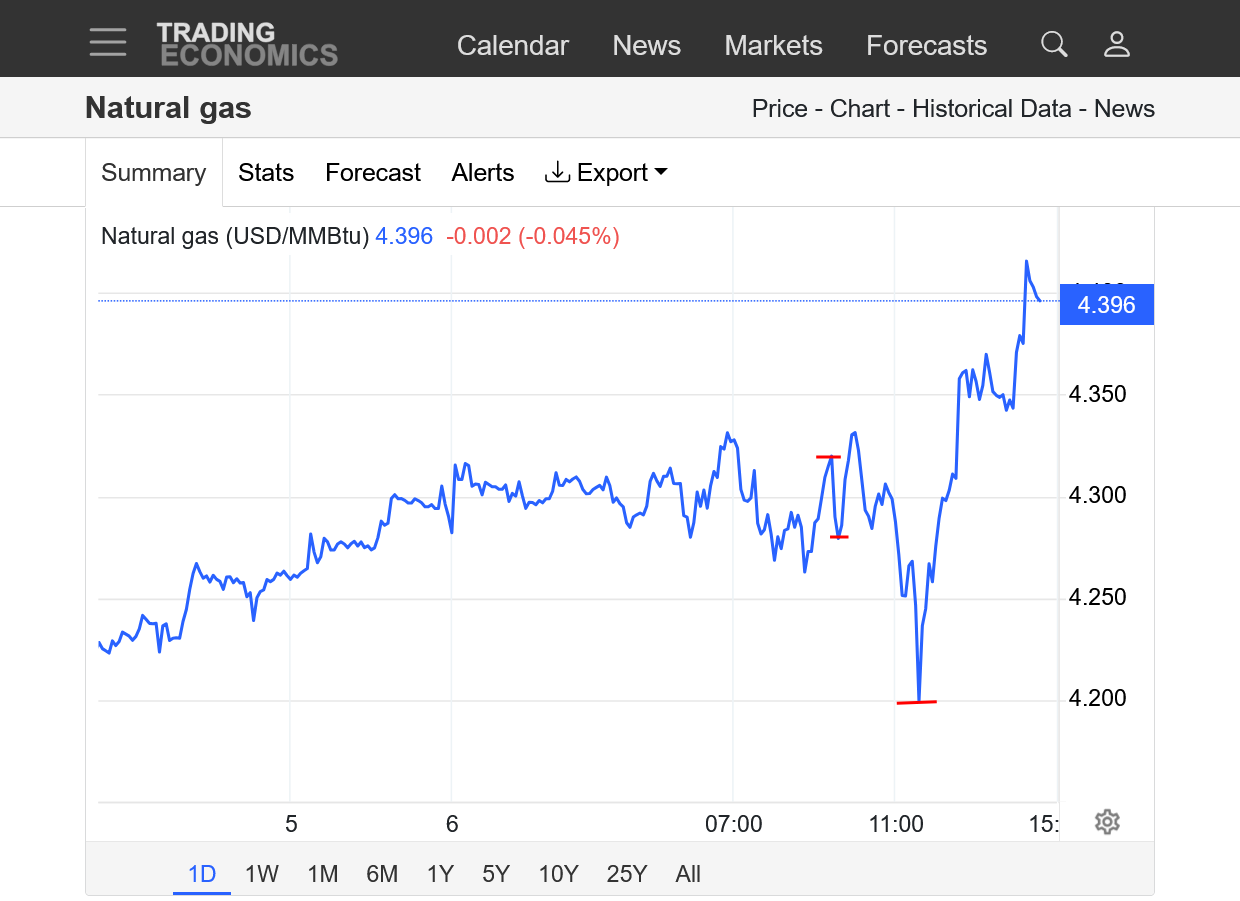
4:50 pm: Based on the bids/offers right now, we may in fact have a fairly large sized gap higher on the open.
OK, I just got lucky.
Earlier today, I was testing the trading platform on my laptop for all sorts of different orders (because I've usually used my computer in the past on a different platform) .
I was just using 1 contract shorts, testing it 5 times, then cancelling them each time. It showed they were all cancelled.
NOPE! Apparently I did something wrong or those orders can't be cancelled when the market is closed, so I sold 5 contracts of NG on the open.
If I was going to trade it, that's what I would have done(lucky I was testing with shorts only).
So I sold 5 on the open at 4.480 and immediately offset by buying 5 at the market because it was a mistake and made $510 (or around 10 ticks each X 5).
Yippee! I'll take it with it being 98% luck(2% skill because I will ONLY sell here and called the higher open because that's the set up).
It was what I would have done on a paper trade but selling a big gap higher in NG on the Sunday Night open is a dangerous thing.
++++++++++++++
If I was real smart, I would have put in a trailing stop as usual and be in great shape.
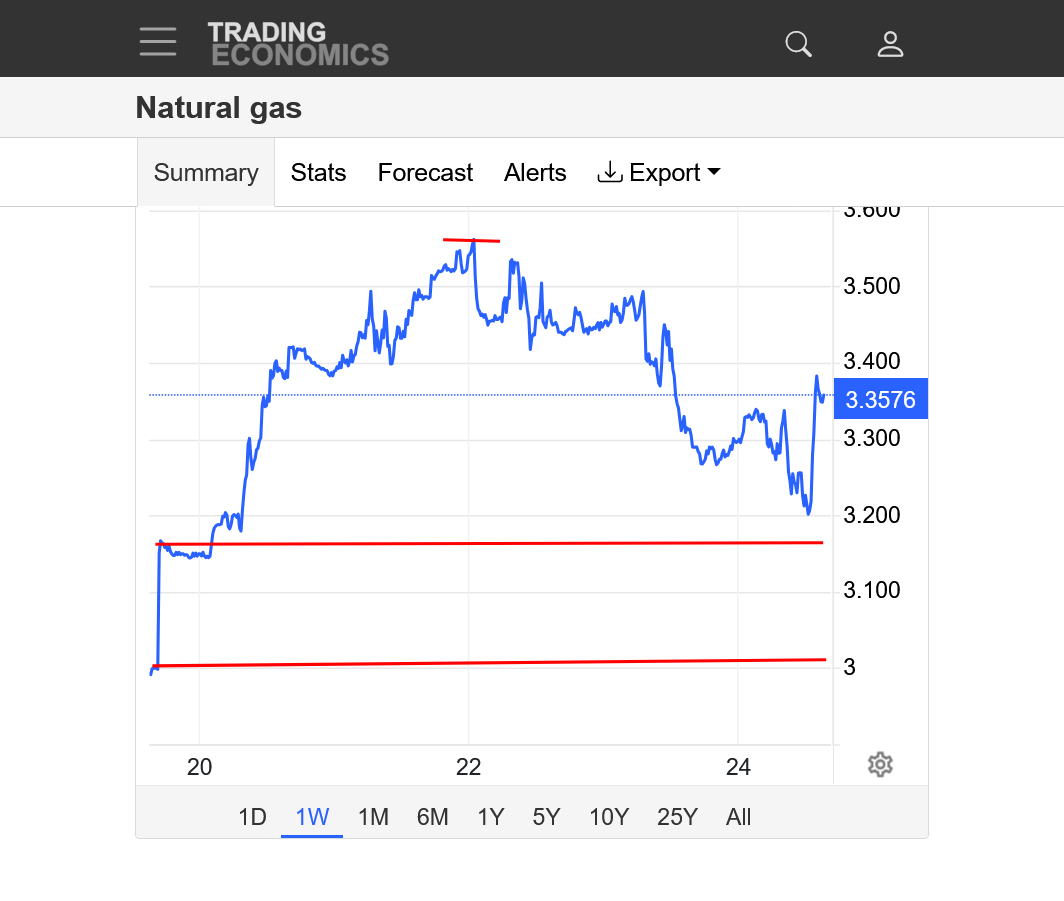
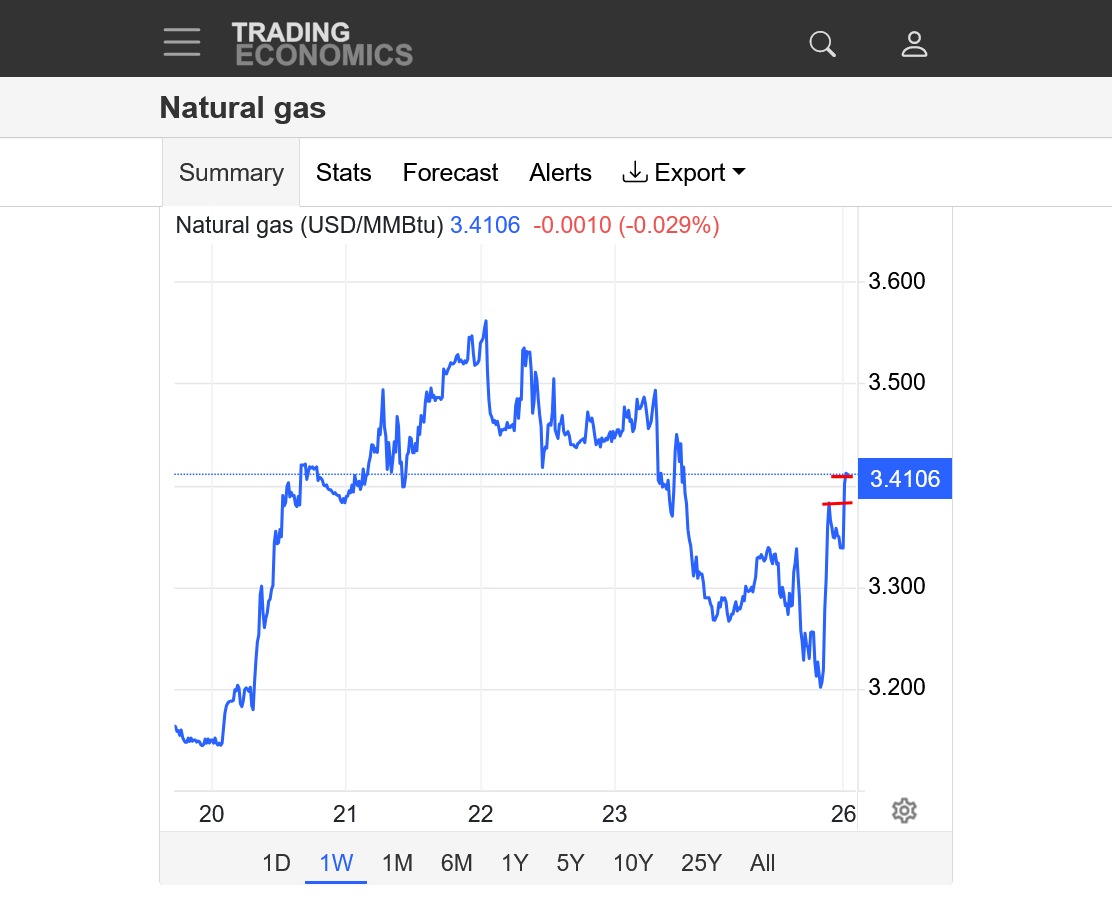
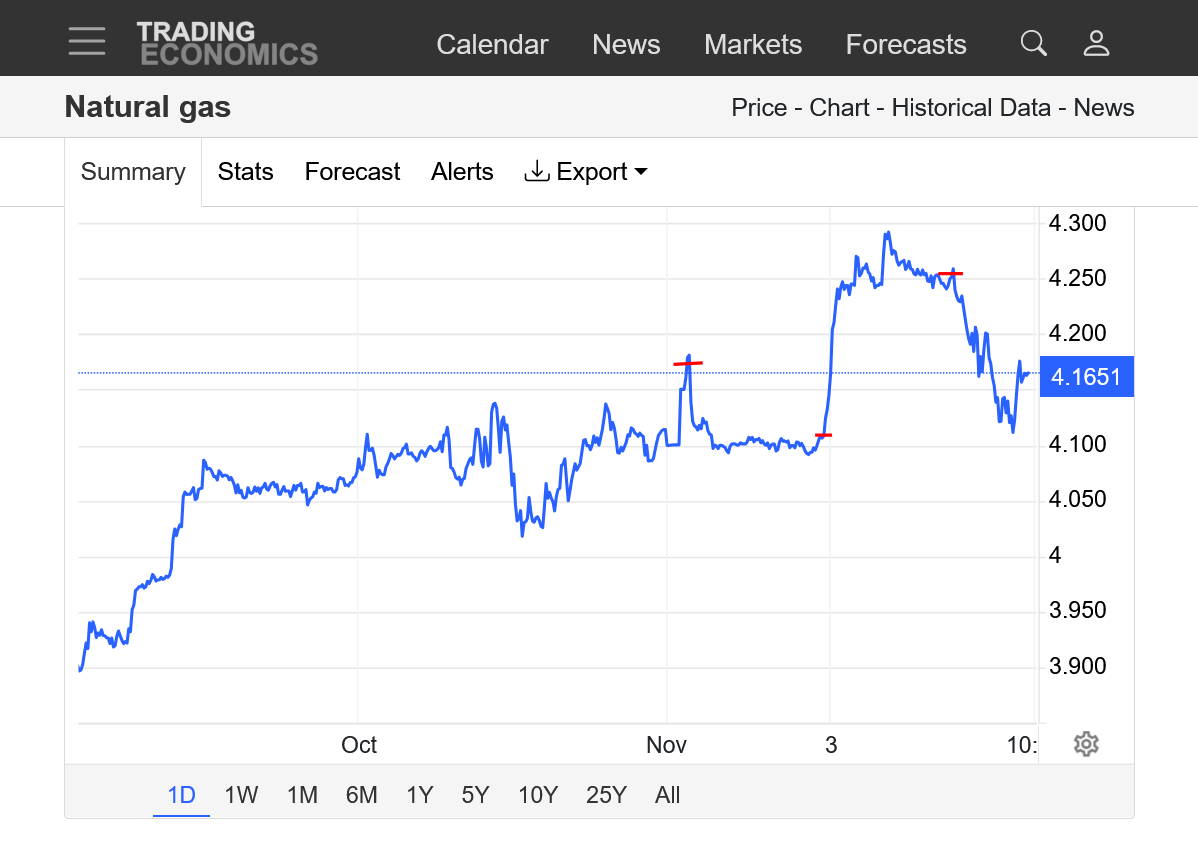
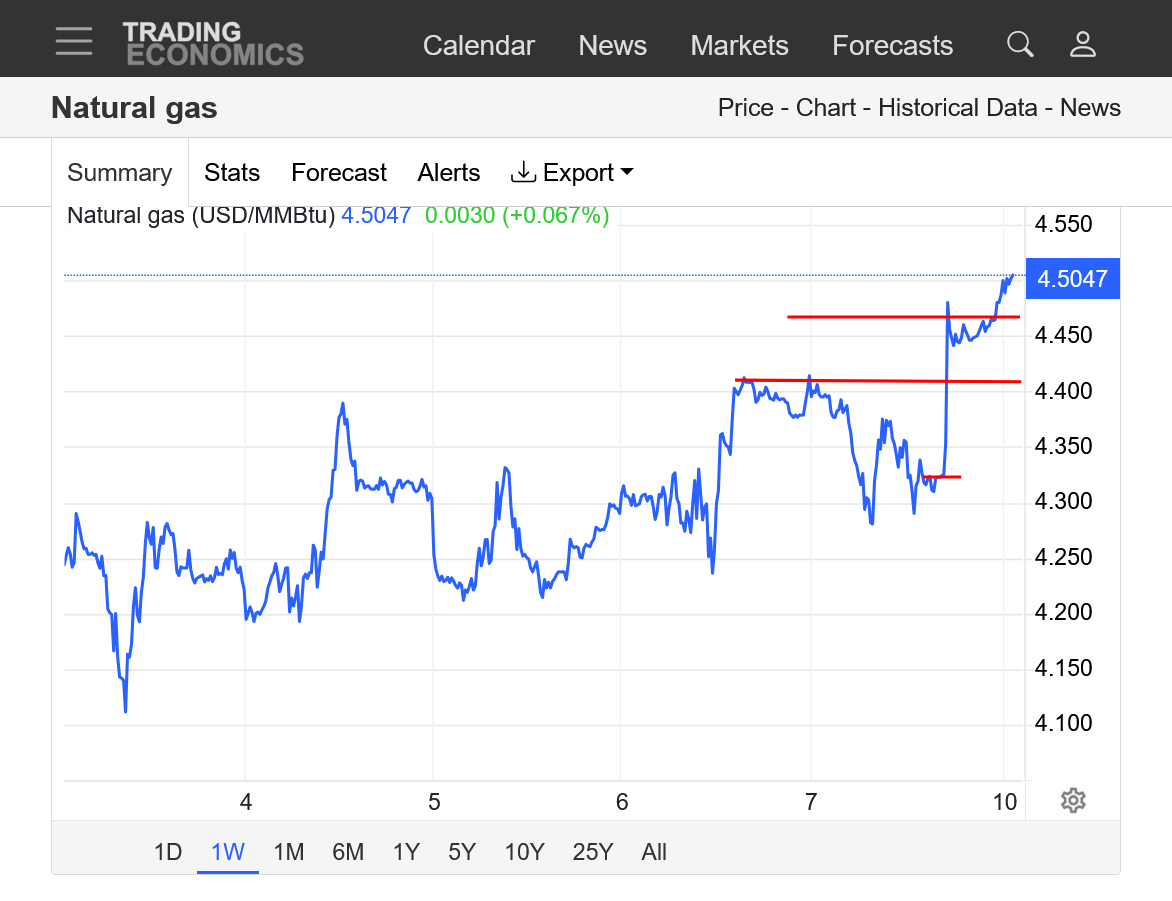
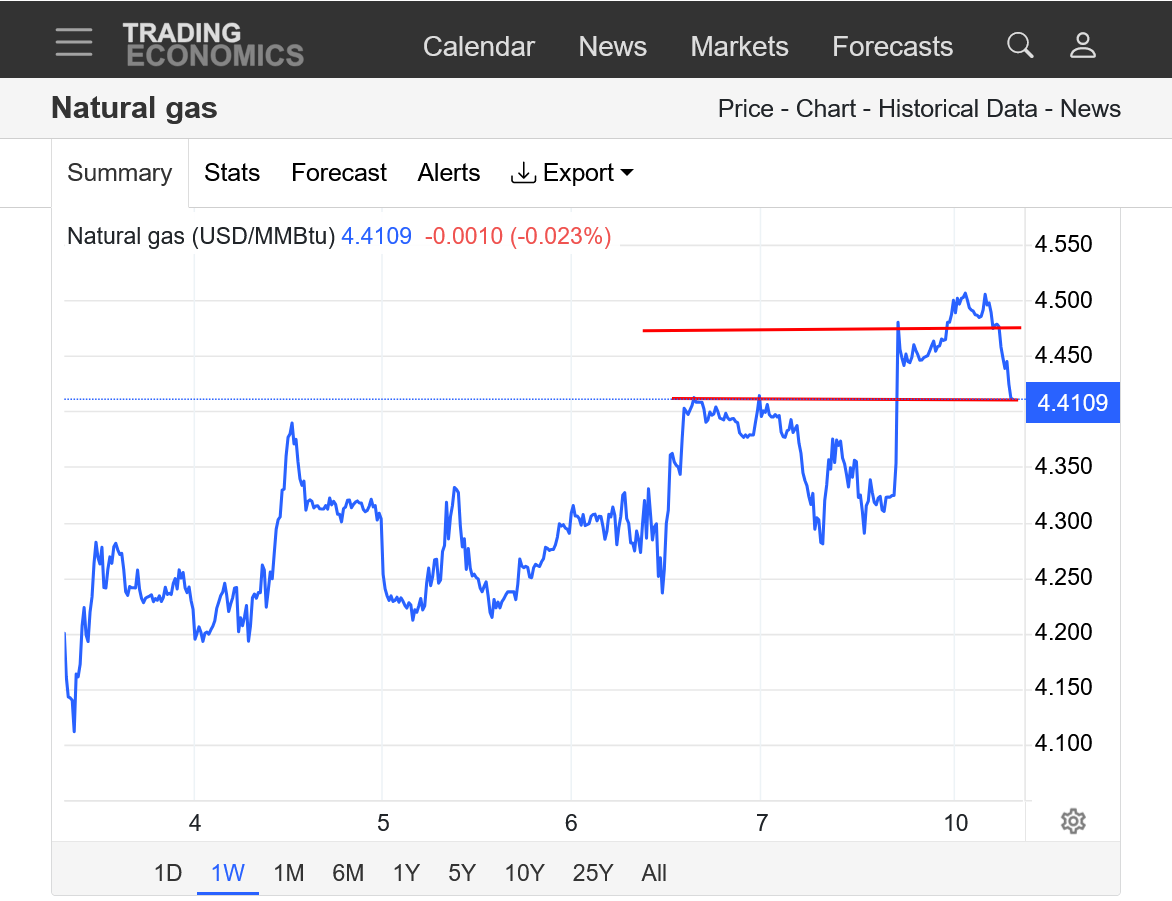
1. 1 week: Gap in long red lines. Closing the gap(trading down to Fridays high) is a gap and crap buying exhaustion at a top which would be extremely bearish. The high so far was 7 ticks above the 4.48 open and in the opening range. Fridays close is the line connecting 2 balls.
We're up $1,320/contract vs the day session close on Friday.
https://tradingeconomics.com/commodity/natural-gas
+++++++++++++
Good thing I double checked. I had another "test" order, this one to BUY just below Friday's close and just cancelled that. These seem like pretty dumb mistakes for somebody that has traded since January 1992!
I should have confirmed these orders were cancelled by going on my computer BEFORE the open!!!
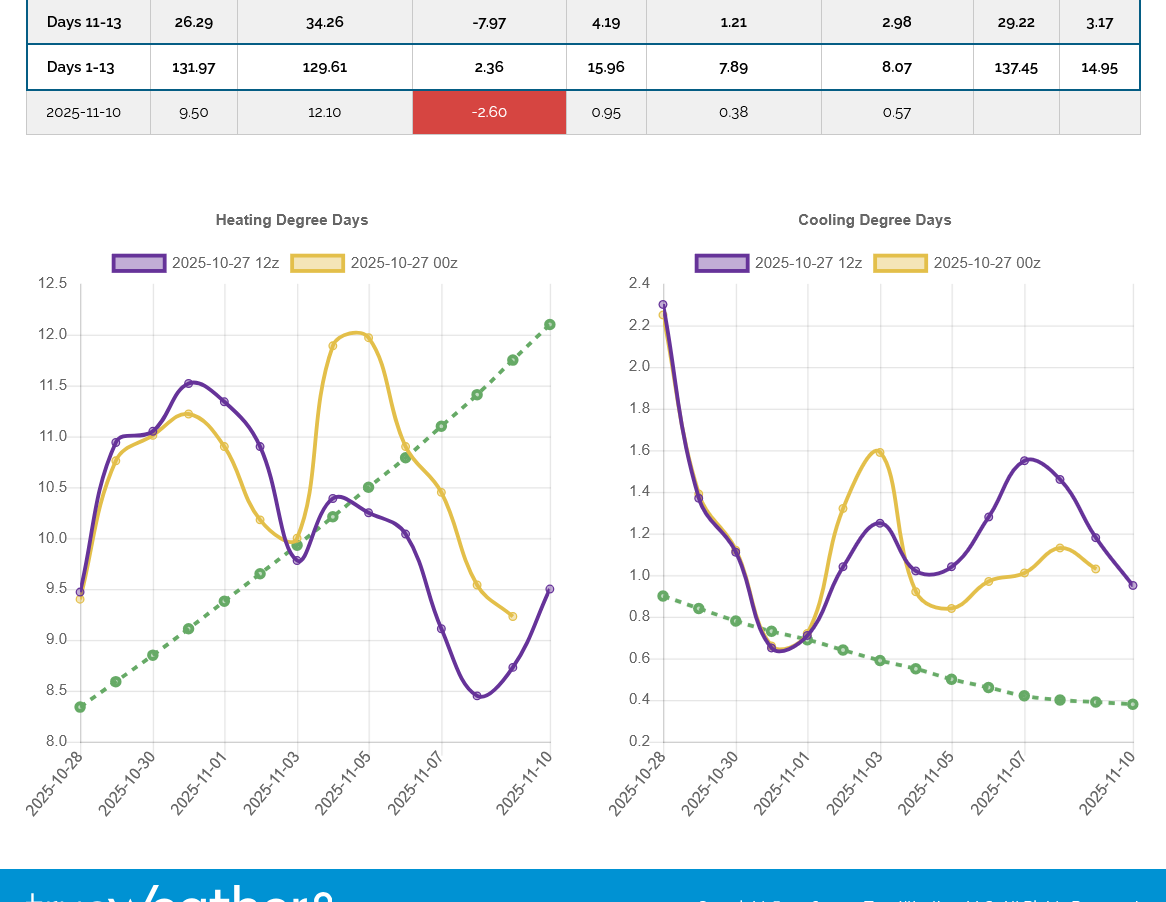
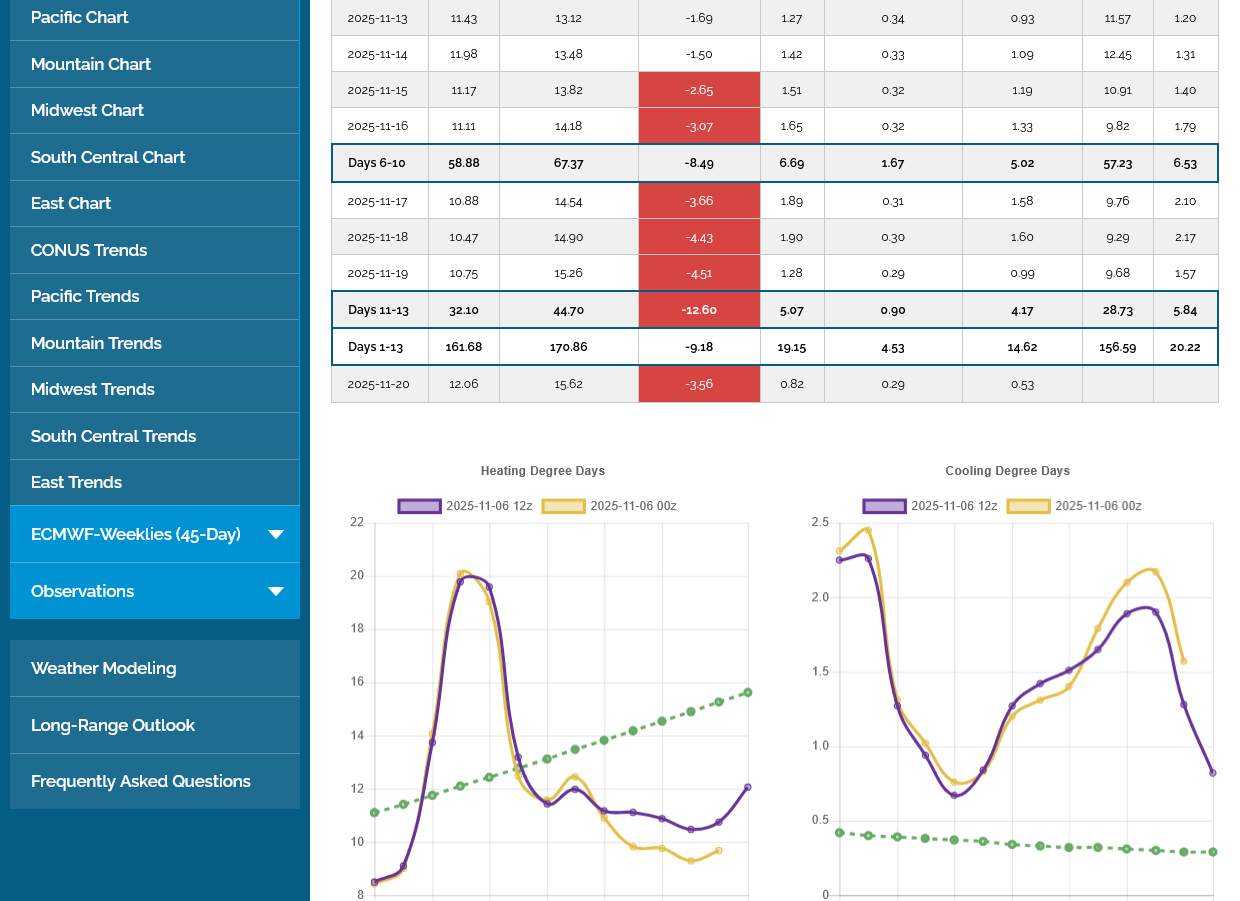
6:15 pm update: The 18z GEF was milder again by -4.6 HDDs vs the previous 12z run but the trajectory in week 2 being UP(but with a slope close to the green line which is the historical average. The market is anticipating a pattern change to much colder at the end of November. That is likely the main thing holding us up here.
All the long range models have it as well as the MJO phase being very favorable for cold then as well as the weak La Nina analog being favorable for cold in the Northern 1/2 of the US during the first half of Winter, when a weak La Nina is a sure thing.
++++++++++++++++
f the 0z EE is a bit warmer and we CLOSE the gap higher when prices drop below Friday's high overnight, that will make this a gap and crap exhaustion formation. but that's somebody with a bearish bias, seeing this as a selling set up.
Hey MM,
1. Congrats on your lucky good trade! Nice!
2. Is there a chance that NG is up 3% due to tonight’s near historic lake effect snow in Chicago? Sometimes NG does silly things like that because sellers are scared away in the short term despite it not meaning much for US NG demand as a whole. On Friday, nothing like this was forecasted for Chicago.
Thanks, Larry.
I highly doubt the snow in Chicago for 1 day (that I thought was coming late last week) has anything to do with it.
The colder EE and and slightly colder late November/early December maps are what I have been thinking. The best way to know with more confidence is if either of them change..............by observing the market's reaction
The GEFS into December was cold but get this: The last 0z GEFS below was a whopping +15 HDDs compared to the previous 18z run!!!! You can see it in purple below. All the much colder data points were in week 2.
NG, as a result has made new highs for the session.
The last EE looks colder yet in the center of the country but close to the same, a tad milder in the East. No HDDs yet.
The chart from the last week shows that us holding this gap higher from the increase in cold makes it an upside breakaway gap...........for now.
Cold weather increases will support that idea, although it will be tough for me to buy up here with it be a classical selling set up for a weather trade in natural gas but only when the models turn LESS cold.
Colder and colder can still make ng go higher and higher.
https://tradingeconomics.com/commodity/natural-gas
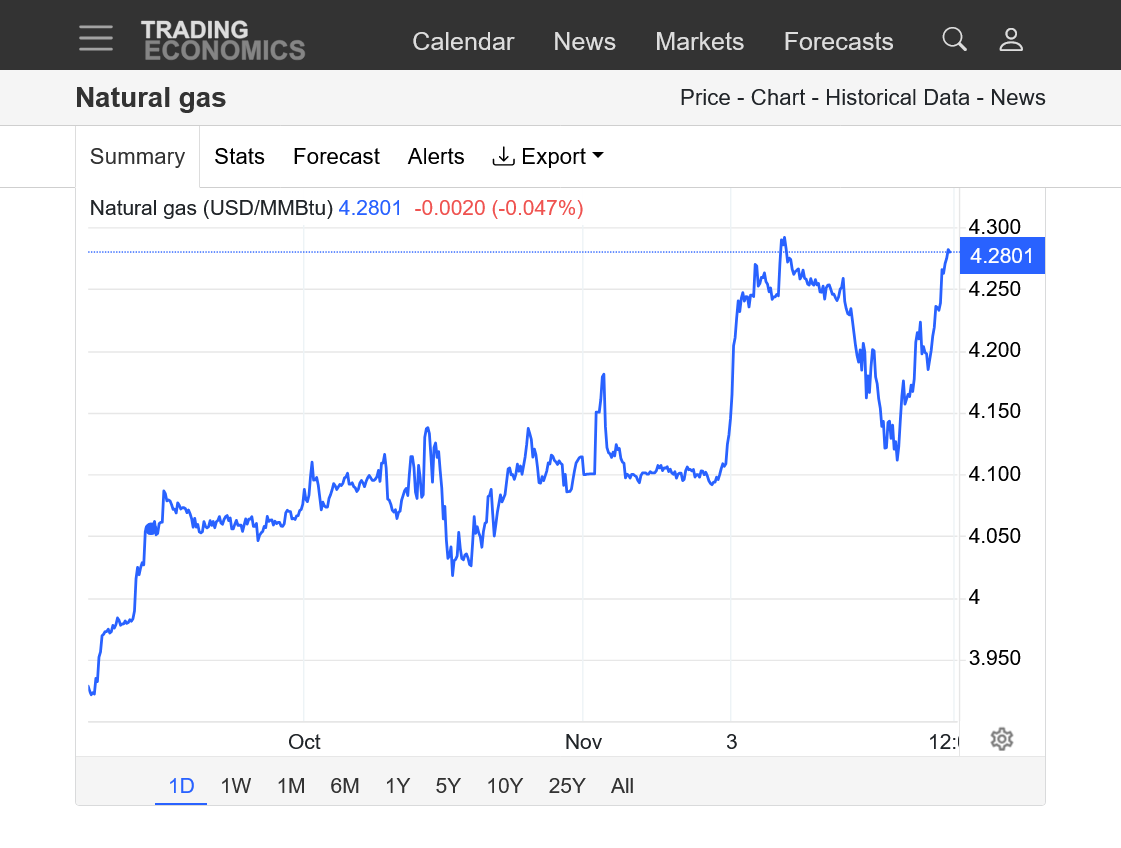
1. 1 week. Tested the top of the top of the gap but it held strong earlier in the session. New highs from much more cold.
2. 1 year: Interesting place here. Highest price since March of this year which was right at this price.
3. 10 years: Major upside break out in progress??? The charts say much higher prices on the way. The weather trading set up is to sell on a weather pattern change to warmer. For me that is.
This last 6z GEFS gave all that cold back and was -15 HDDs and we sold off to new lows. The previous solution was an outlier?
I missed the short because I can't stay up 24 hours(was up until 2am) and have to sleep some time although 20 years ago when I traded for a living, I would set my alarm clock all night for when new models were coming out.
We just filled last nights gap, so its POTENTIALLY a gap and crap, buying exhaustion gap! Colder maps later today will negative that, just like this last models warmth, negatived the upside break away gap signature.
I will guess that the short term top is in........unless the next models runs are much colder. Sometimes markets will fill a gap than go back in the direction they gapped in.
https://tradingeconomics.com/commodity/natural-gas
++++++++++++++
7:40 am
Follow thru makes the earlier call of a top one with more confidence: I missed the optimal selling time, around 5:30 am, when the much warmer 6 GEFS was just coming out because I was sleeping
I got lucky selling the Sunday Night open but missed the HUGE, selling opportunity from the exact set up I had identified, , shorting after 5am(from the warmer 6z GEFS) . Oh well, there will be hundreds of other opportunities. And weather trading for natural gas is still very early in the new cold weather season, right Larry?
++++++++++++++
8:40 am: Pretty safe to say now, just a couple hours later, that this was the short term top, if not THE TOP for this move and the year unless we get hit with much colder forecasts.
MM,
Indeed it’s still very early!
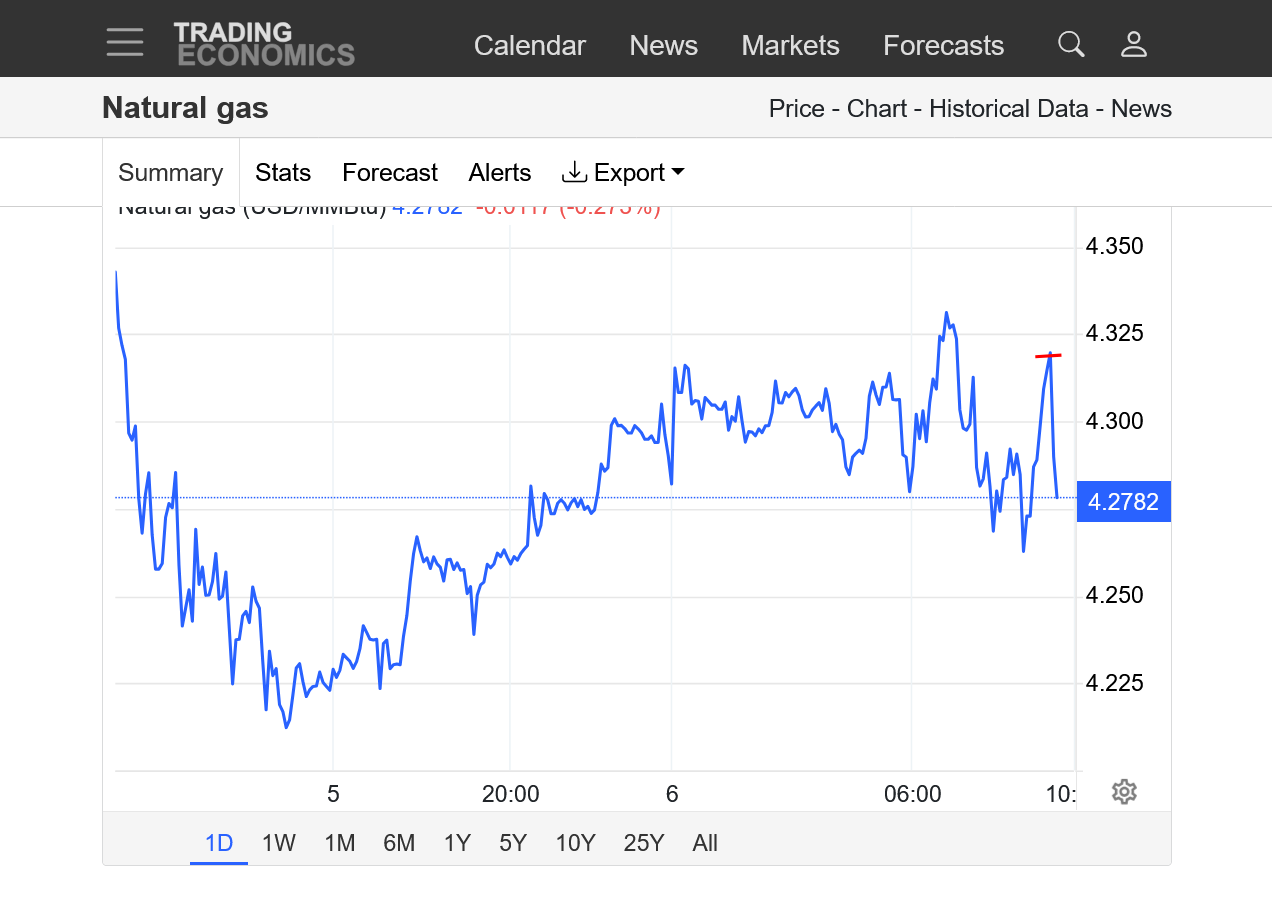
I saw that NG plunged from $4.48 to $4.33 5:40-8AM CST! That’s 3.3%!
Does the 6Z GEFS normally move the market that much when it is a reversal from 0Z GEFS? That seems like a lot!
Edit: Down to $4.27 an hour later for total drop of 4.7%!! Hard to believe that this is all due to the 6Z GEFS!
MM, your thoughts?
Not normally that much, Larry.
However, the 0z went from +15 HDDs to the 6z run of -15 HDDs vs the previous run.
That rarely happens and it did so at the very end of the markets huge move up on cold that had already been traded for weeks.
This was the classical/textbook ideal weather traders top picking set up, which I've been posting vehemently about since late last week.
I shorted a couple of times a bit early but WAS SLEEPING when THE OPTIMAL shorting signal/warmer weather signal hit. If not for being up well past 2am, I might have considered setting the alarm for the 6z GEFS and cashed in but its almost impossible to be up for every model run to not miss THE ONE that breaks the bulls backs!
The scenario leading up to this was well documented in these posts above BEFORE it happened.
The weather can turn sharply colder again, of course. However dropping $2,500/contract for the highs and filling the opening exhaustion gap has done massive technical damage to the charts with sell/top signals flashing on ng traders computers.
Thanks, Mike. I just stated a new thread due to this one being very long. I started it with the 6Z GEFS and the now 4.7% plunge being highlighted.
thanks, larry!