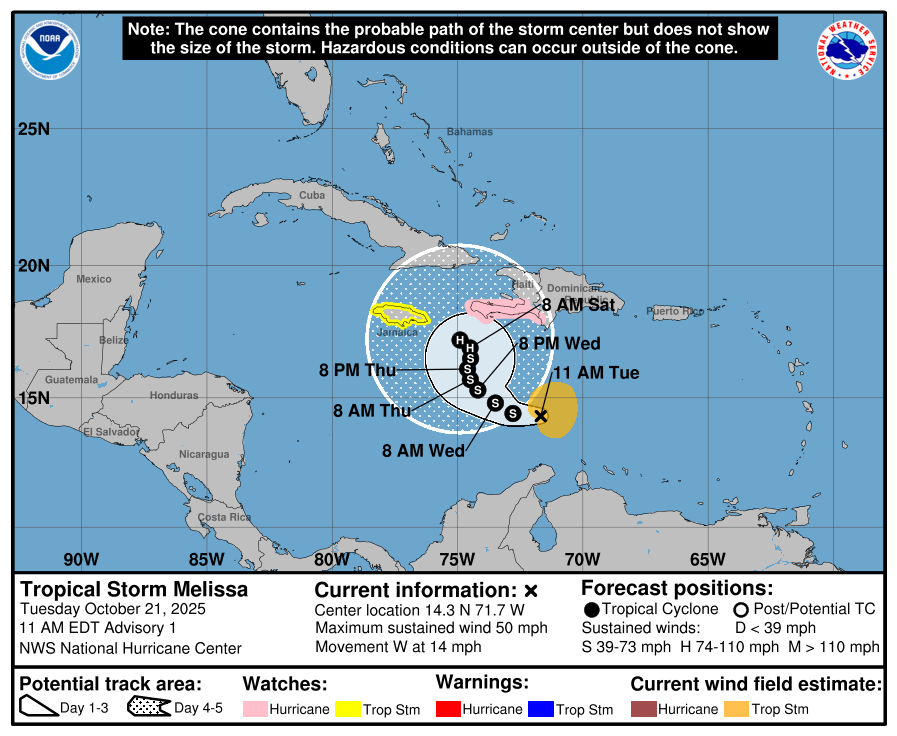
Lots of uncertainty!!
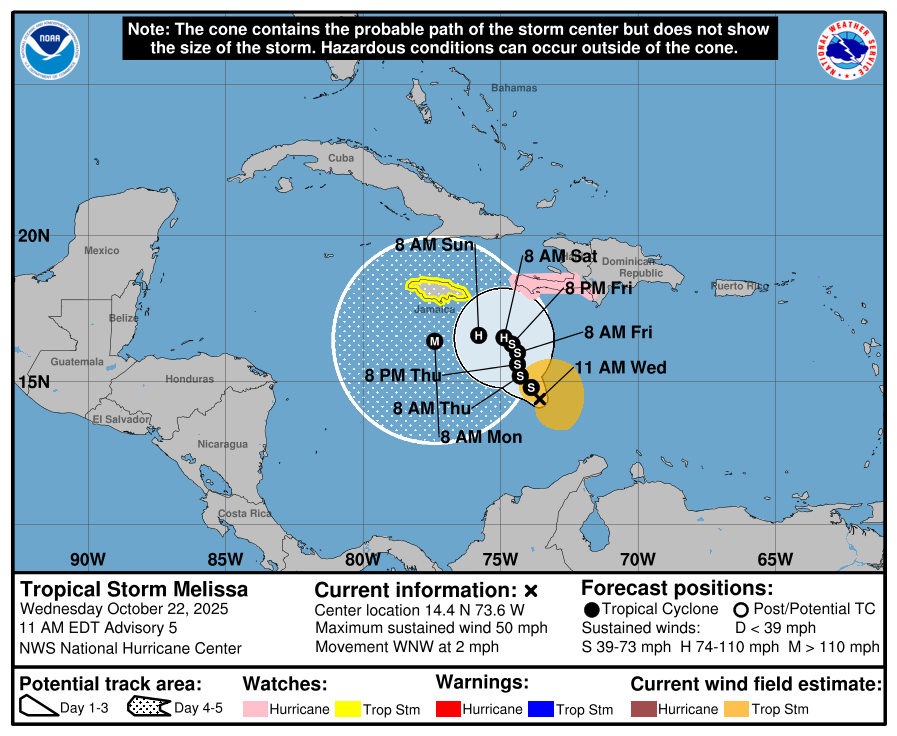
Tropical Storm Melissa Discussion Number 1
NWS National Hurricane Center Miami FL AL132025
1100 AM EDT Tue Oct 21 2025
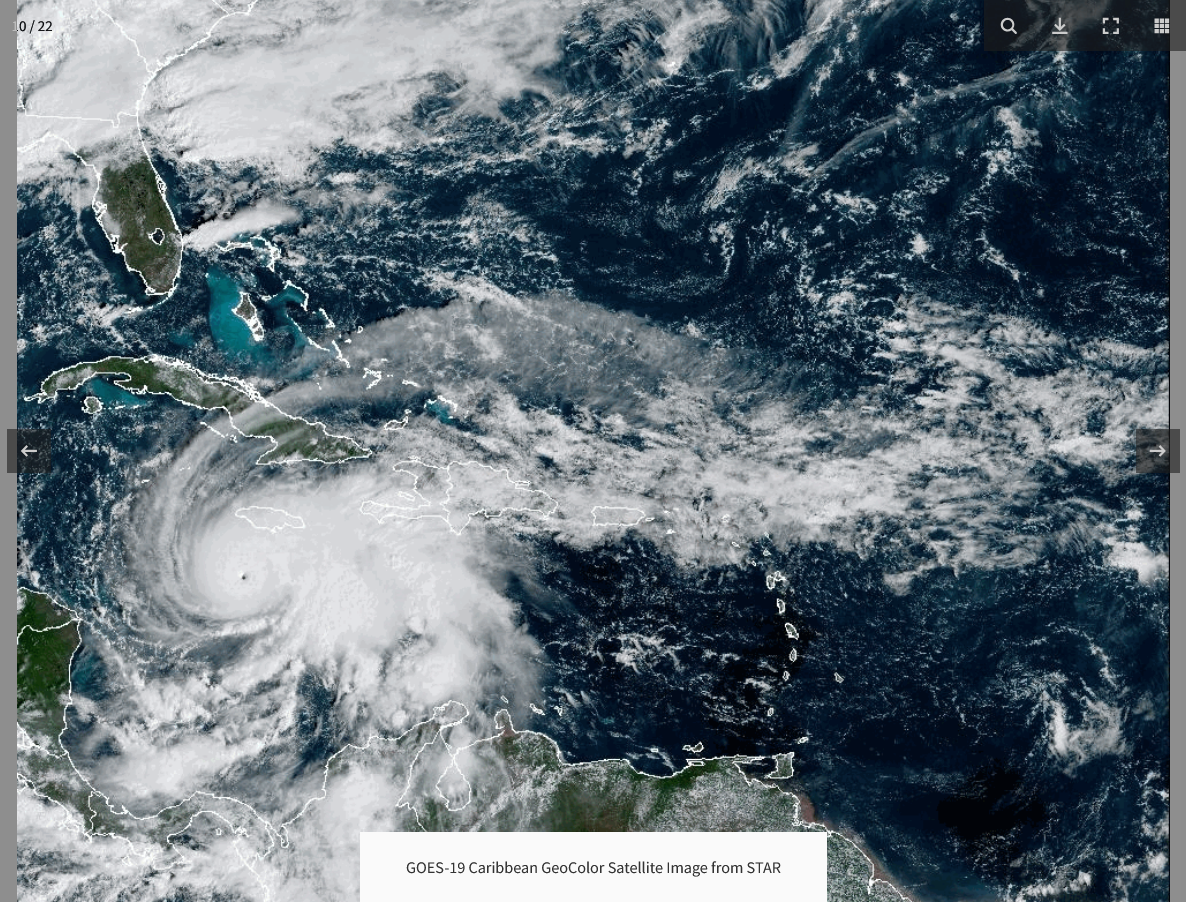
Satellite images, regional Caribbean radar data, and surface
observations indicate that invest 98L has developed a well-defined
center and organized deep convection to be designated a tropical
cyclone. A ship report that recently passed near the center of the
system reported a minimum pressure of about 1003 mb. Satellite
imagery shows the system is asymmetric, with the low-level center
near the western edge of the central dense overcast. The initial
intensity is set at 45 kt, based on a blend of the latest satellite
intensity estimates, marking the formation of Tropical Storm
Melissa. An Air Force Hurricane Hunter aircraft is scheduled to
investigate the system this afternoon, and their data should provide
a better assessment of Melissa's strength and structure.
The system was moving very quickly westward over the past several
days, but it has slowed down significantly this morning, which has
likely helped Melissa form. The initial motion is estimated to be
280/12 kt. Melissa should continue to slow down and gradually turn
to the northwest and then north during the next couple of days
toward a weakness in the subtropical ridge. This motion will likely
take the storm very near the southwestern tip of Haiti and Jamaica
by Thursday. After that time, the guidance diverges significantly
with some models like the GFS and HWRF showing a motion to the
northeast into the weakness, while the other solutions show a stall
or a westward drift on the south side of a building ridge. An
examination of the GFS, ECMWF, and Google DeepMind ensemble suites
suggest that the majority of the members show Melissa not moving
into the weakness and remaining in the Caribbean Sea throughout the
week and into the weekend. The NHC official track forecast lies
between the Google DeepMind ensemble mean track and the correct
consensus aid, HCCA.
Melissa is expected to be over the very warm waters of the
Caribbean, but the models suggest that vertical wind shear will be
moderate with some dry air in the vicinity of the storm during the
next few days. Based on these mixed signals, the strengthening
trend is expected to be slow and steady, not rapid. However, the
future intensity of Melissa is linked to the track and since that is
quite uncertain beyond a couple of days, the strength of the storm
is also quite uncertain. The NHC intensity forecast is in best
agreement with the HCCA model.
Key Messages:
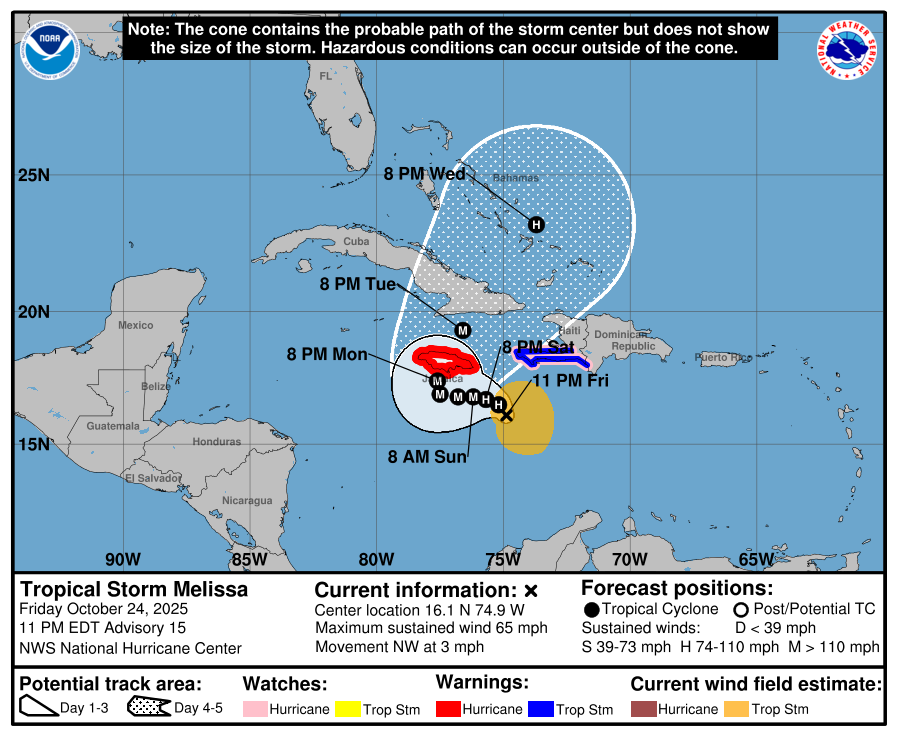
1. Melissa is expected to bring heavy rainfall and the risk of
significant flash flooding and the danger of landslides to portions
of Haiti and the Dominican Republic through the weekend.
2. A Hurricane Watch has been issued for the southern coast and
Tiburon peninsula of Haiti. A Tropical Storm Watch has been issued
for Jamaica. Preparations to protect life and property should be
completed by Thursday.
3. There is significant uncertainty in the track and intensity
forecast of Melissa. Interests elsewhere in Hispaniola and Cuba
should continue to monitor the latest forecasts.
FORECAST POSITIONS AND MAX WINDS
INIT 21/1500Z 14.3N 71.7W 45 KT 50 MPH
12H 22/0000Z 14.4N 72.8W 50 KT 60 MPH
24H 22/1200Z 14.8N 73.5W 55 KT 65 MPH
36H 23/0000Z 15.3N 74.2W 60 KT 70 MPH
48H 23/1200Z 15.7N 74.5W 60 KT 70 MPH
60H 24/0000Z 16.1N 74.6W 60 KT 70 MPH
72H 24/1200Z 16.5N 74.5W 60 KT 70 MPH
96H 25/1200Z 16.9N 74.5W 65 KT 75 MPH
120H 26/1200Z 17.2N 74.9W 70 KT 80 MPH
$$
Forecaster Cangialosi/Bucci
Thanks very much, Larry!
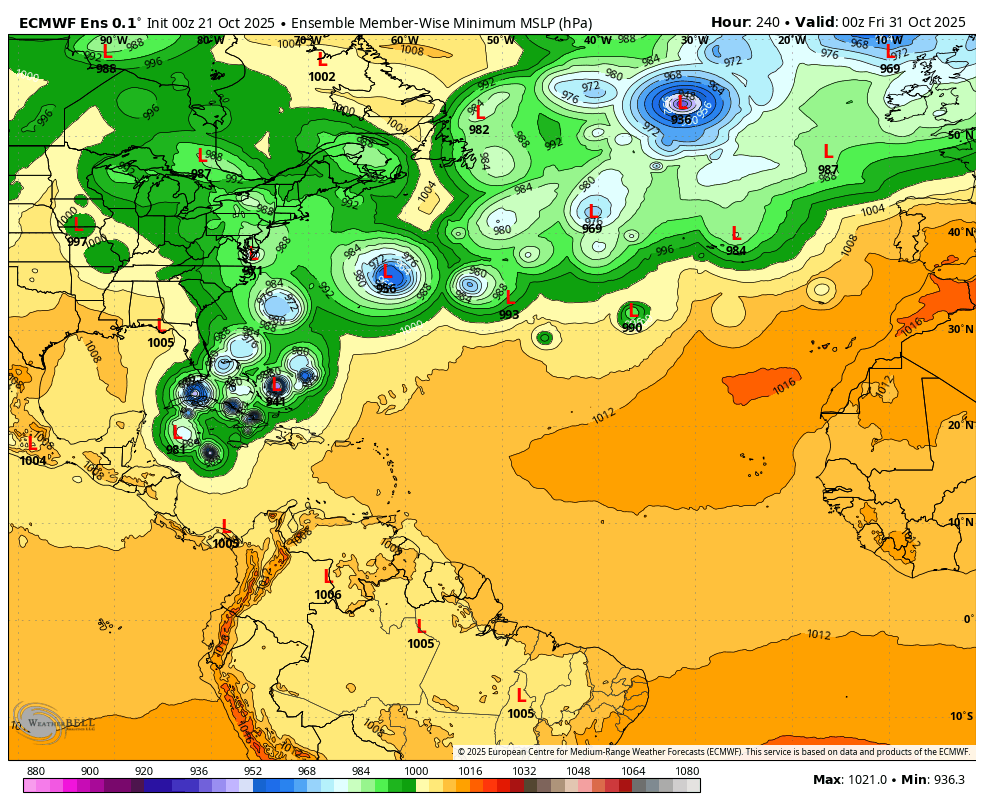
Looks extremely active the next 10+ days in the Caribbean, which could impact Southern Florida(but not the Gulf of Mexico).
The activity could be dominated by this 1 system, Melissa that stalls out or moves very slowly.
Water temperatures are very warm in this area but wind shear might be too high for rapid development. However, there is tremendous uncertainty and there is a chance of a major hurricane under the right conditions.
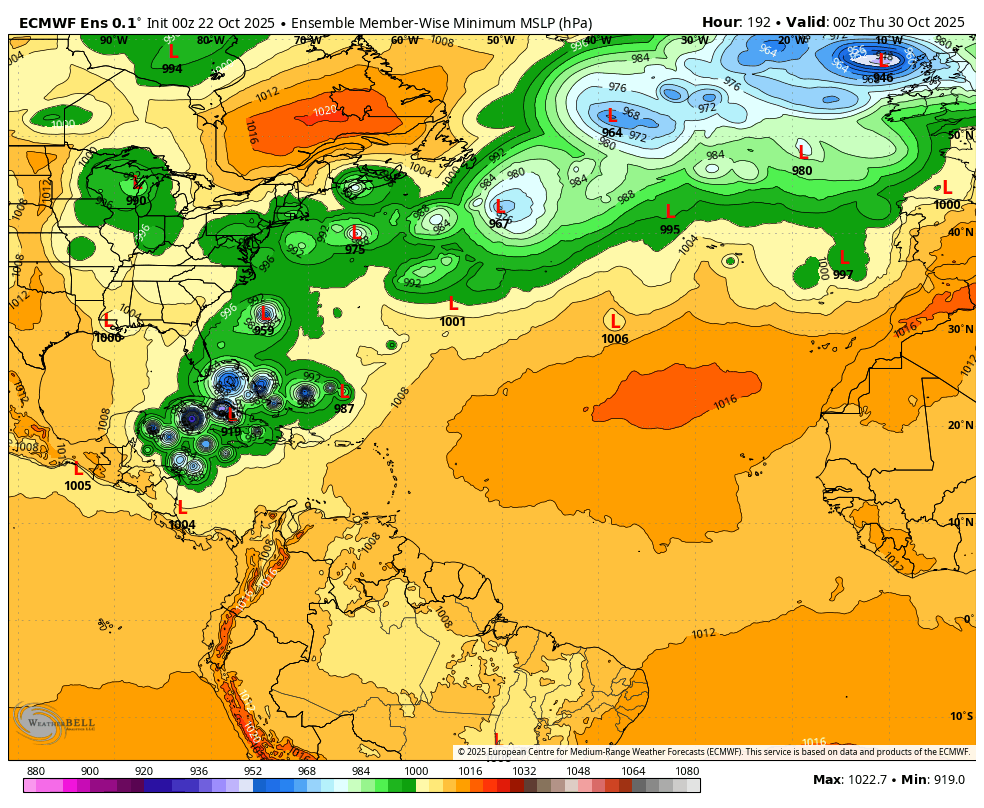
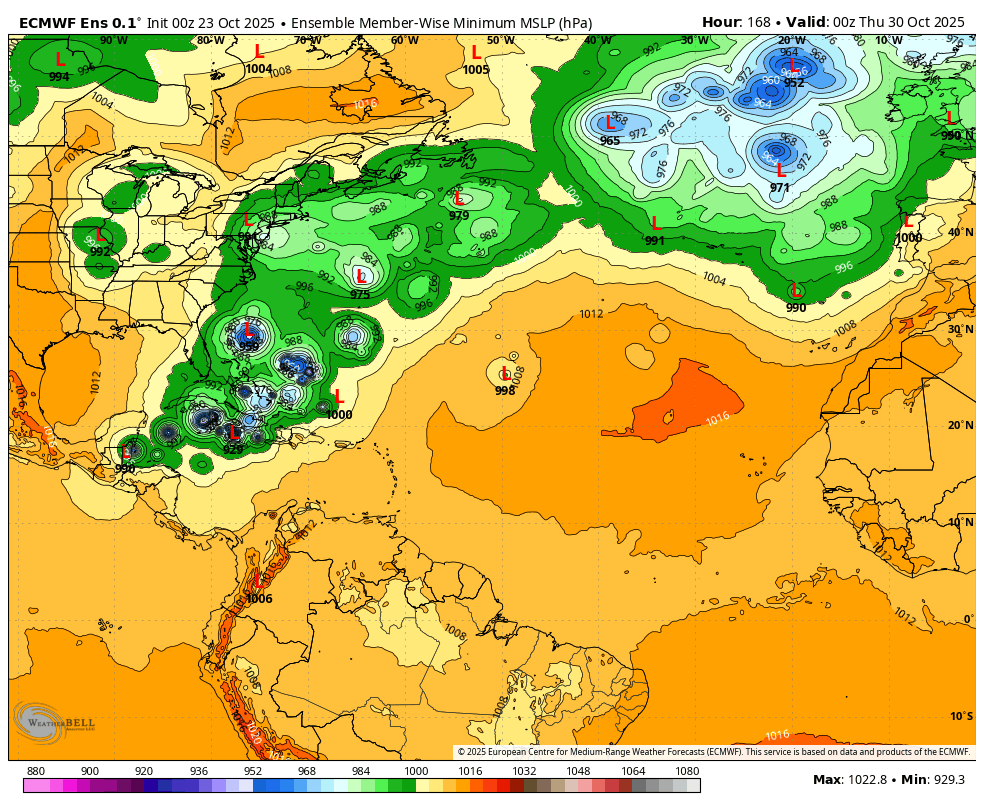
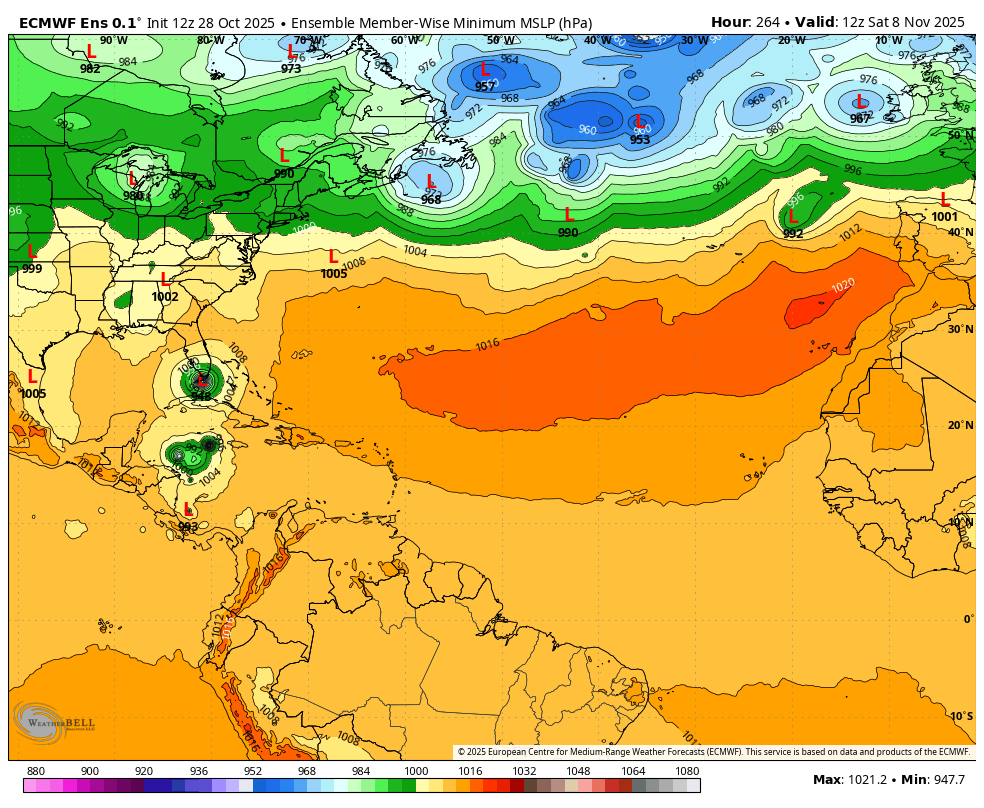
This is the day 10 forecast of the surface low pressure solution for the individual members of the last 0z European Ensemble solution.
Here are some links from the National Hurricane Center to follow Melissa:
 |
https://www.nhc.noaa.gov/graphics_at3.shtml?start#contents
https://www.nhc.noaa.gov/text/refresh/MIATCDAT3+shtml/211445.shtml?
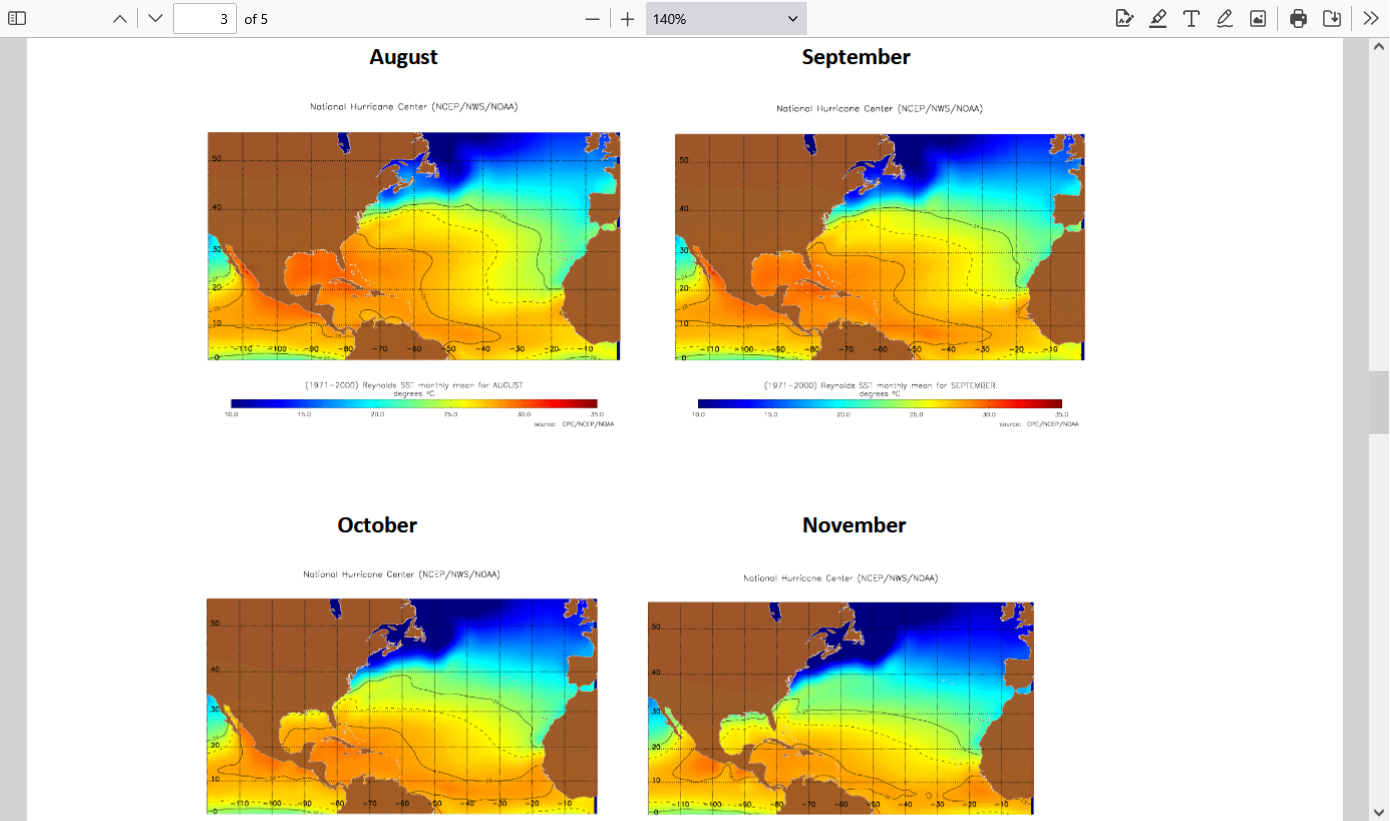
Global water temperatures main page:
https://www.ospo.noaa.gov/Products/ocean/sst/contour/
Some very warm water right now in the Caribbean!
https://www.ospo.noaa.gov/data/sst/contour/usatlant.fc.gif
Hurricanes and Sea Surface Temperature
https://ie.unc.edu/wp-content/uploads/sites/277/2014/12/Hurricanes-and-sea-surface-temperature.pdf
By Jeffrey Masters, Ph.D. — Director of Meteorology, Weather Underground, Inc.(Jeff and I were in school together-he got better grades than me!)
https://www.wunderground.com/hurricane/articles/loop-current-explainer
During summer and fall, the Loop Current provides a deep (80 - 150 meter) layer of vary warm water that can provide a huge energy source for any lucky hurricanes that might cross over.
 +++++++++++
https://en.wikipedia.org/wiki/Loop_Current

++++++++++++++
Melissa and the tropical activity is forecast to stay just southeast of the loop current but the point above is THE SOURCE REGION of the loop current.............some of the warmest water on the planet in the Caribbean that is DEEEP!
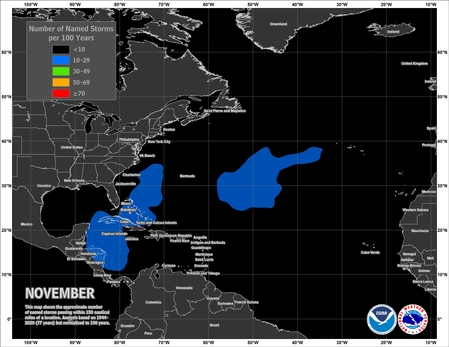
This area is where the tropics will be most active the rest of October.
This warm water is still there in November which is why most of the Atlantic Basin hurricanes come from this region.
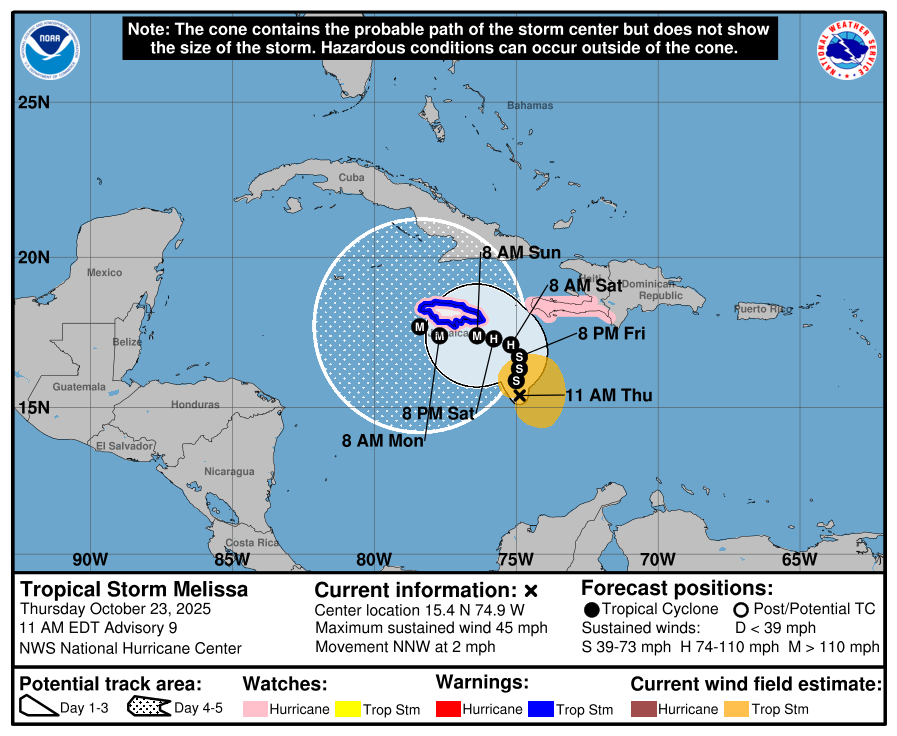
As mentioned yesterday, the forecast for Melissa was very uncertain and under the right conditions, it could become a major hurricane.
That actually is the new/updated forecast today. Major hurricane and a path MUCH farther west.
Still a great deal of uncertainty and potential for huge changes in the forecast track and intensity. The waters in this area, as shown yesterday/above are VERY warm (mid/upper 80s F)
|
https://www.nhc.noaa.gov/graphics_at3.shtml?start#contents
https://www.nhc.noaa.gov/text/refresh/MIATCDAT3+shtml/211445.shtml?
++++++++++++++++++++=
Southern Florida is a potential target next week if it follows the most northern path of model predictions.
Considering how warm the water is in this area, the source region for the loop current with its very deep, very warm water (if it tracks far enough west), there is a thread of rapid intensification!
The depth of the warm water is important with a nearly stalled hurricane. Shallow warmth, with a hurricane that churns up colder water to the top can kill a stalled hurricane.
This is day 8:
The latest hasn't changed much in the last day:
https://www.nhc.noaa.gov/refresh/graphics_at3+shtml/231447.shtml?cone#contents
This is day 7 from the last oz European Ensemble. Florida is a bit farther north and west than where all the members predict the center to be.
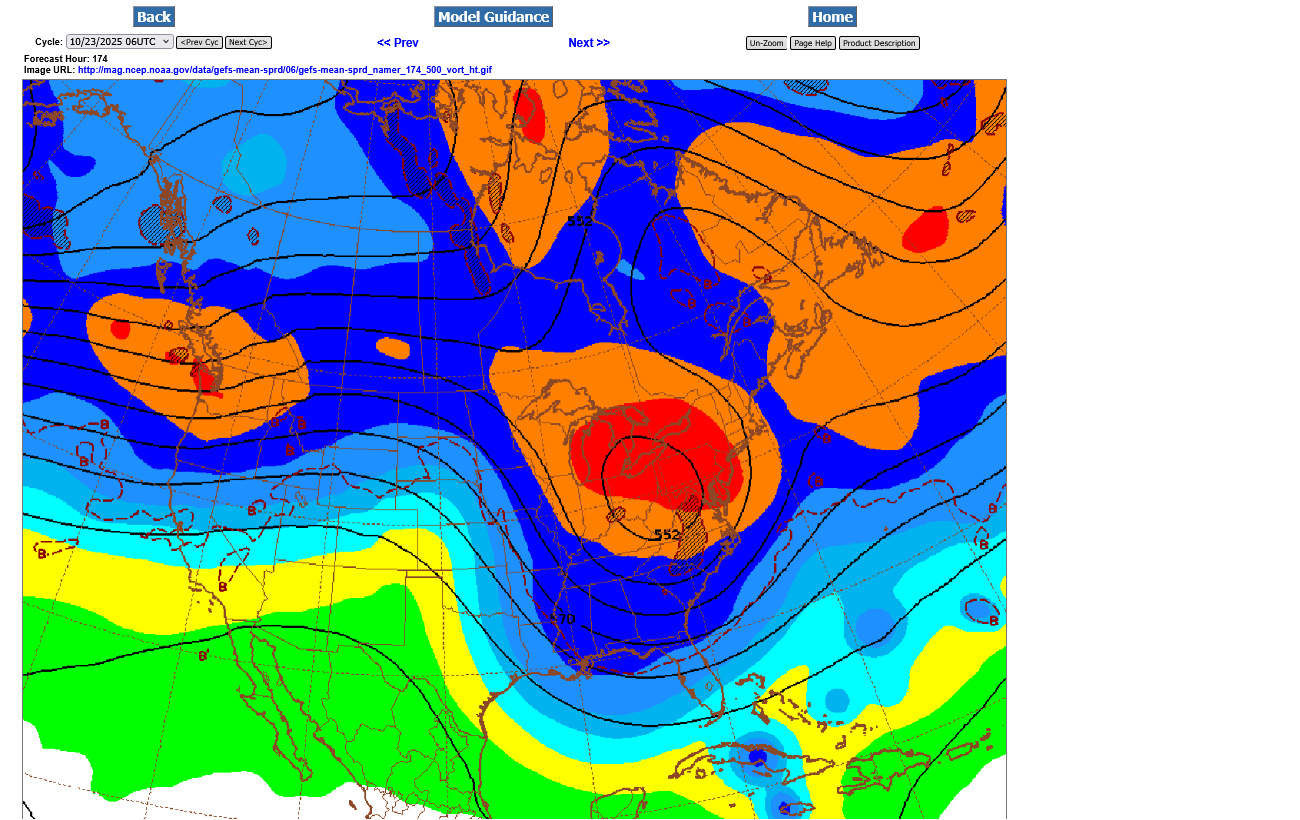
The DEEP upper level trough in the East, extending down to the GOM at that time will make it almost impossible for this hurricane to track farther north and west.
The wild card would be if the trough would dig farther west and pick up the hurricane if it tracks farther west, which would make it possible for Melissa to impact Florida.
Melissa to experience rapid intensification from 36 to 72 hours. Going from 70 mph to 130 mph in just 36 hours.
Peaking at 155 mph and also growing in size. However, some models are even stronger! Still lots of uncertainty. Almost all the tracks keep it southeast of Florida in around a week. However, the potentially massive size might cause the northwest quadrant of Melissa to impact S.Florida.
Even if that happens, some good news relates to the graphics below.
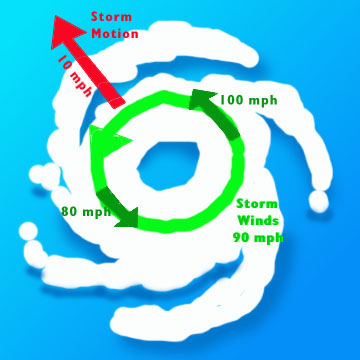
For a hurricane tracking northeast, like Melissa will be next week, it's the eastern, right quadrants(especially right/front quadrant) that are on the "dirty" side where the speed of the hurricane ADDS to the winds circulating around it.
On the left/western quadrants(the clean side), the speed of the hurricane SUBTRACTS from the winds circulating around it. This is where Florida will be next week, even with the outlier models having the closest approach to Florida(still well off the coast in the Atlantic).

Here's another graphic depicting that principle:
https://www.youtube.com/watch?v=G8SK6e8I01Y
This is day 7 from the last 12z European Ensemble model. Florida is northwest of ALL the potential hurricane tracks, as well as being on the "clean" side. 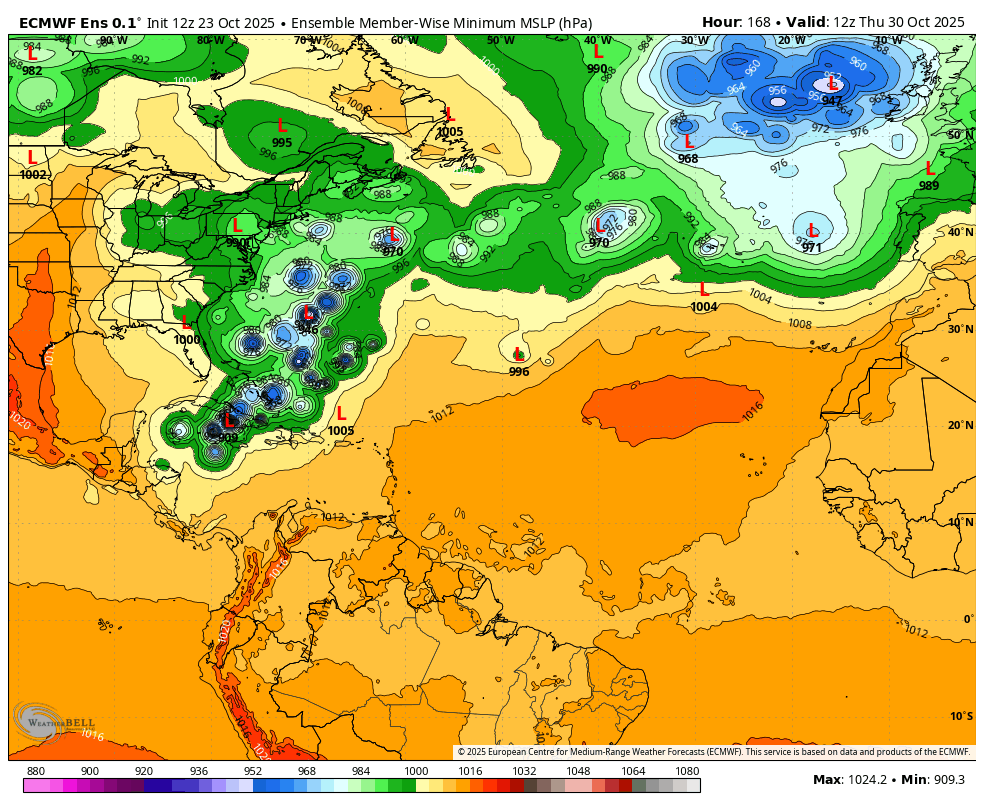
Melissa expected to go from a tropical storm to a major hurricane at 155 mph in the next 60 hours. That's some major rapid intensification.
No major threat to FL outside of rough seas/rip currents and possibly winds approaching tropical storm force in gusts.
https://www.nhc.noaa.gov/graphics_at3.shtml?start#contents
From 70mph to 155mph the next 60 hours. Not a major threat to FL except for the northwest periphery with TS wind gusts and high surf next week.
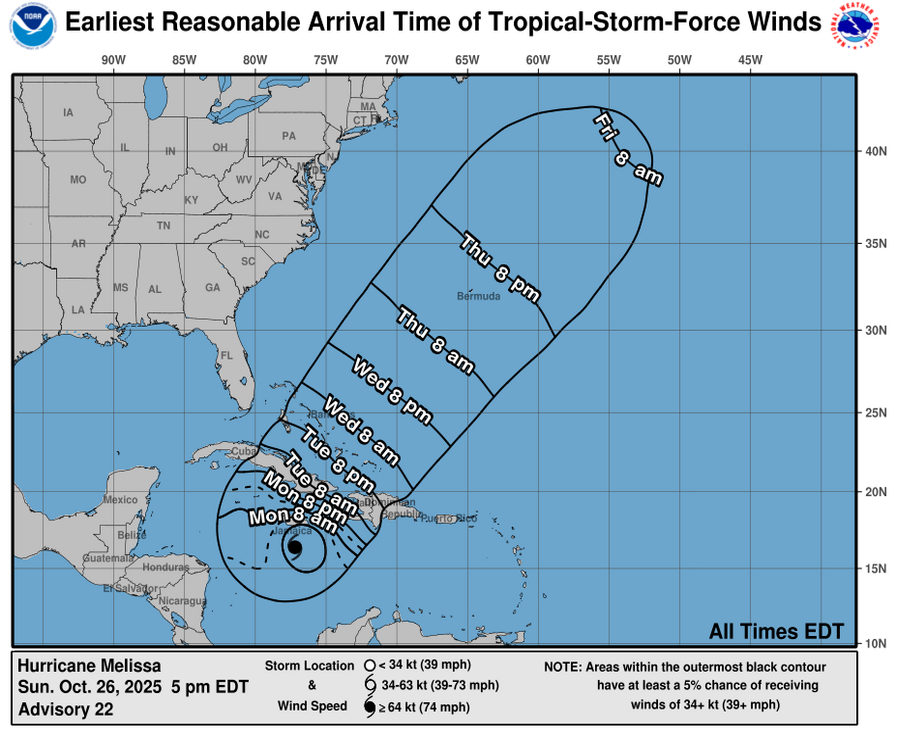
Melissa DID have rapid intensification, then a pause and should go from the current 145 mph to 160 mph on Monday. No threat to Florida other than some high surf.
https://www.nhc.noaa.gov/refresh/graphics_at3+shtml/231447.shtml?cone#contents
Unless something unexpected develops very late in the hurricane season, 2025 will have featured no hurricanes in the United States and just 1 tropical storm, Chantal in early July.
https://en.wikipedia.org/wiki/Tropical_Storm_Chantal_(2025)
Tropical Storm Chantal (/ʃɑːnˈtɑːl/ shahn-TAHL)[2] was a tropical cyclone that impacted the Southeastern United States in July 2025. Chantal originated from a decaying frontal boundary over Florida. It then moved offshore into the Atlantic Ocean and rapidly organized into a tropical depression on July 4. The next day, the system became better organized and was upgraded to tropical storm status, being assigned the name Chantal. The system steadily intensified until landfall early on July 6 in South Carolina, rapidly weakening into a tropical depression inland later that day
+++++++++++++++
Plenty of hurricanes this year but all of them stayed out in the Atlantic, mostly far away from the United States.
https://en.wikipedia.org/wiki/2025_Atlantic_hurricane_season
| 2025 Atlantic hurricane season | |
|---|---|
 Season summary map |
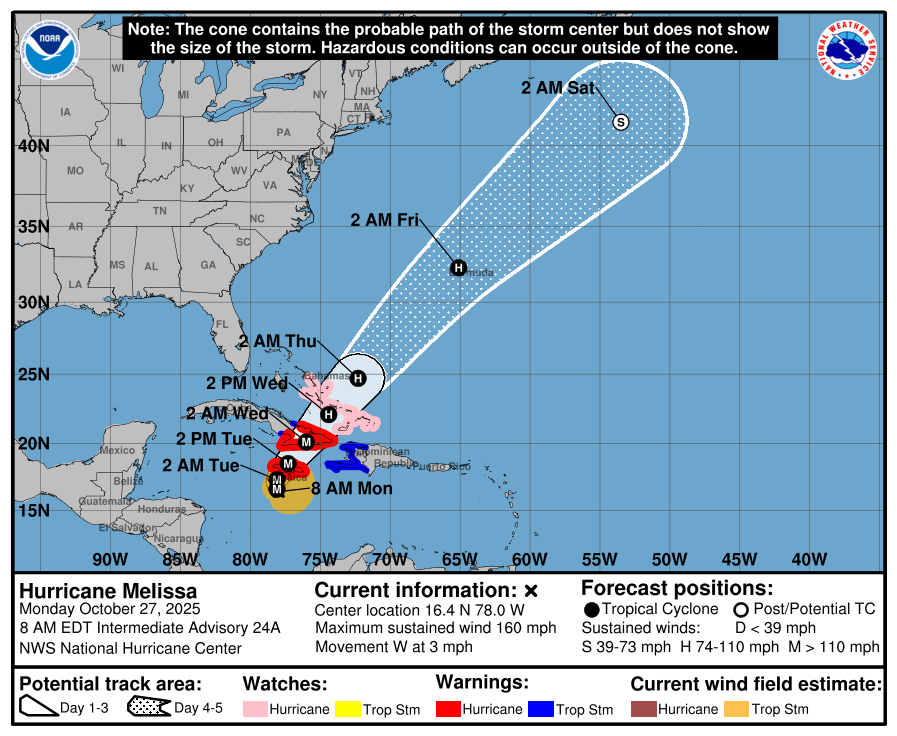
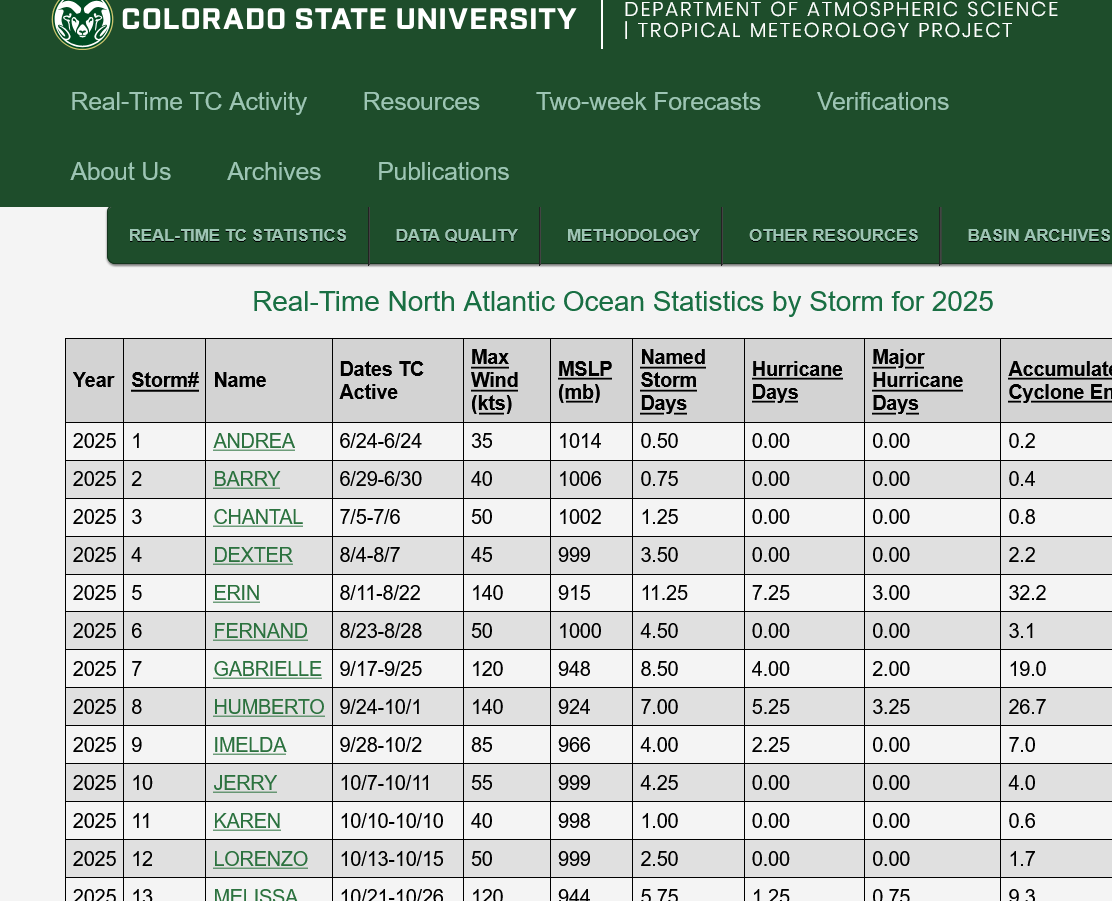
Melissa’s max winds rose to cat 5/160 mph as of 5AM EDT per aircraft recon. with pressure way down to 913 mb as of 8AM, which was well predicted.
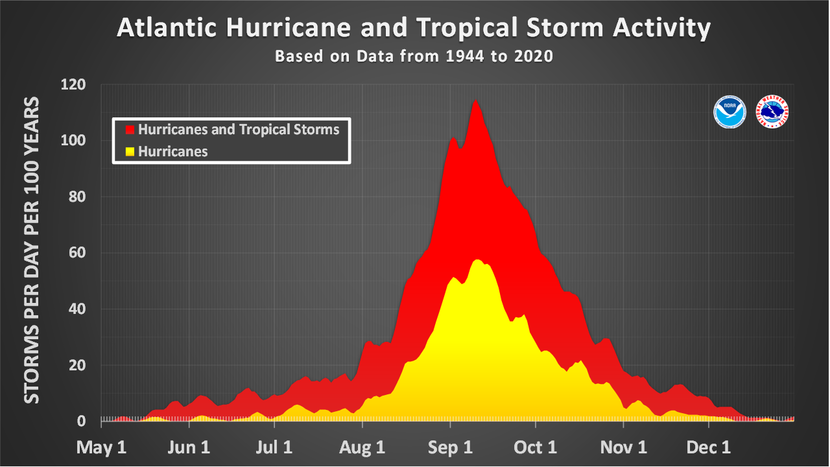
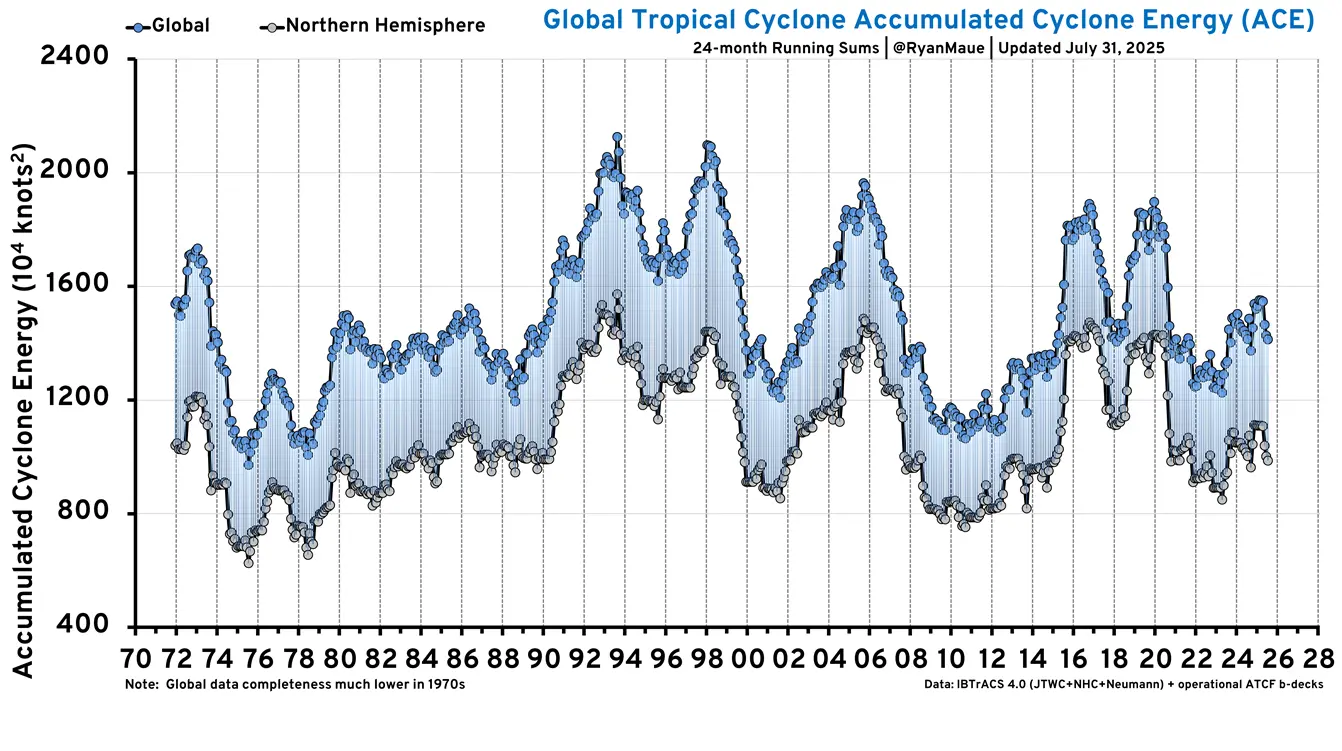
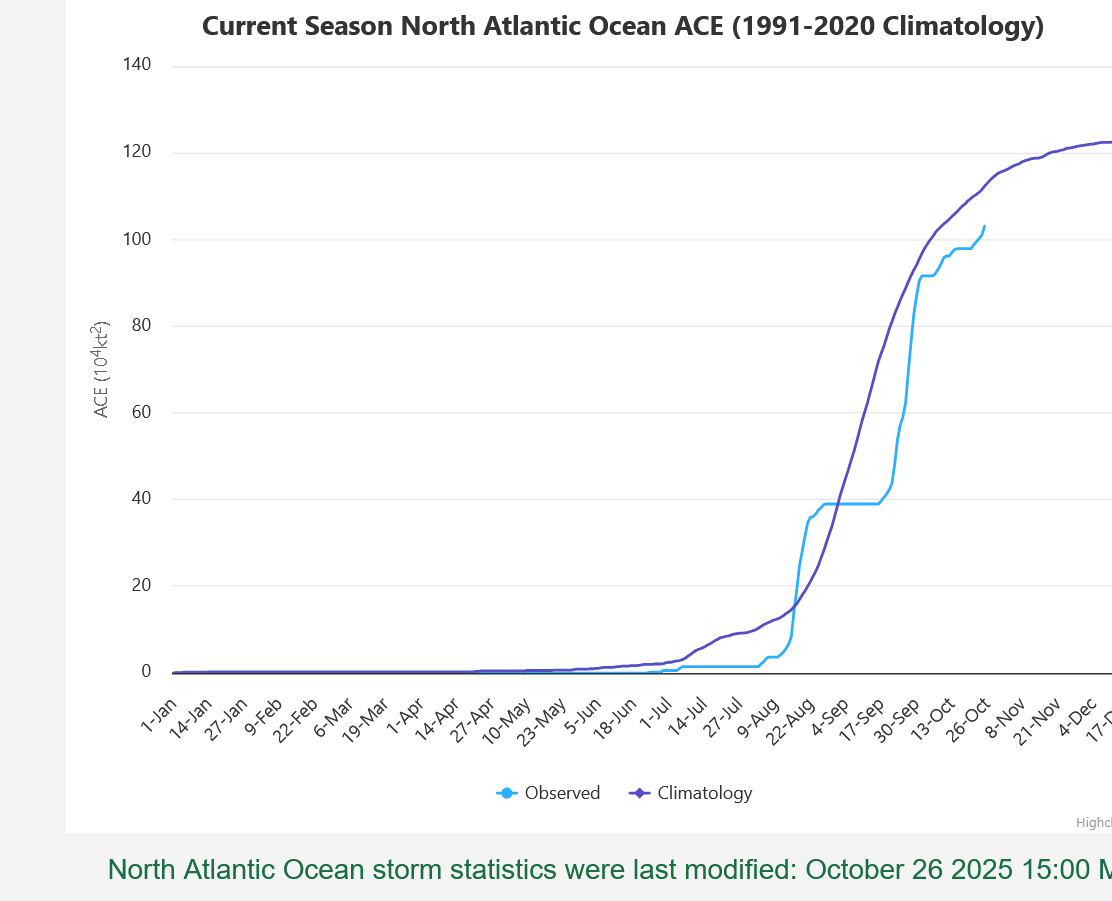
That ACE chart you showed will show the season to date making it to above the 1991-2020 avg of 122 by tomorrow night based on projections.
Thanks very much, Larry!
Yep, a cat. 5 hurricane generates a lot of ACE. Accumulated Cyclone Energy.
At 160 mph, peaking at 165 mph later today!
https://www.bpr.org/news/2017-09-10/hurricane-categories-missing-the-big-picture
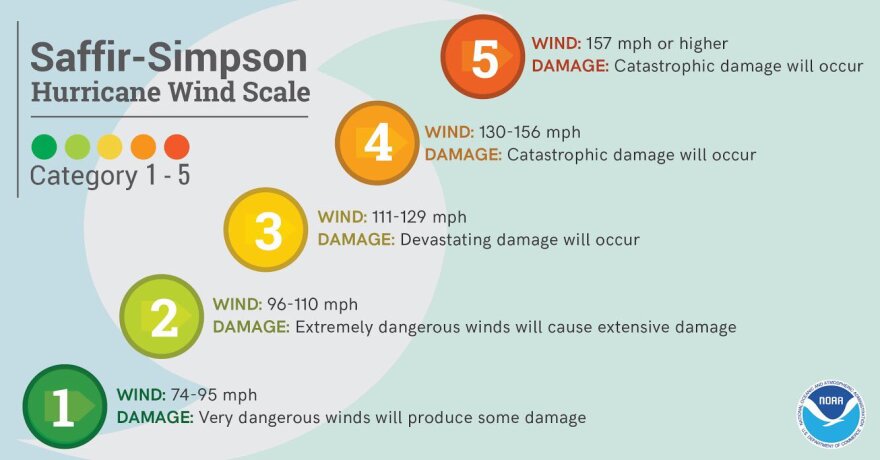
An increase in wind speed of 10 mph, increases damage on an EXPONENTIAL/LOGARITHMIC SCALE.
For instance, The added 10 mph, from 100 mph winds to 110 mph winds will DOUBLE the damage potential!!
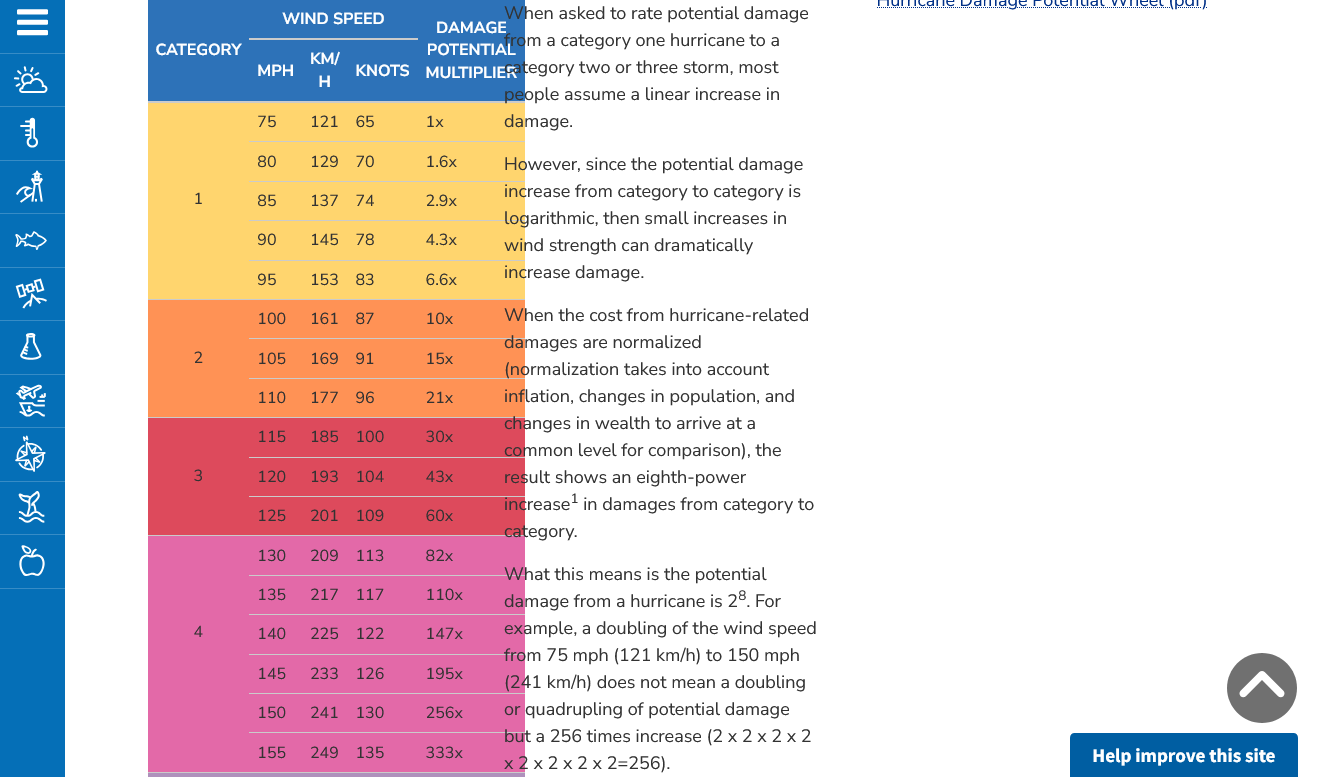
Get this:
The damage potential from a Category 5 storm with 160 mph winds, like Melissa at landfall, is roughly 256 times that of a category 1 storm with 80 mph winds.
Here's how that works:
https://www.noaa.gov/jetstream/tc-potential
Melissa has strengthened to 175 mph!
https://www.nhc.noaa.gov/refresh/graphics_at3+shtml/231447.shtml?cone#contents
https://www.cnn.com/weather/live-news/hurricane-melissa-jamaica-landfall-monday-climate
++++++++++++
Jamaica will be decimated
+++++++++++++++

 |

Go to the link for a loop:
https://www.ospo.noaa.gov/products/imagery/goes/trop-atl.html#set2-10
The strongest storms in terms of wind speed: Another metric used to rank hurricanes is their peak sustained winds. In most cases today, these winds are measured by reconnaissance aircraft missions, since these top-end hurricanes most often happen either in the Caribbean Sea, the Gulf, or the southwest Atlantic Ocean within reach of these aircraft.
1. Allen (1980): 190 mph
2-5. "Labor Day" (1935), Gilbert (1988), Wilma (2005) and Dorian (2019): 185 mph
6-9. Mitch (1998), Rita (2005), Irma (2017) and Milton (2024): 180 mph
Melissa strengthened to 185mph with surface pressure of 892 mb!
https://www.nhc.noaa.gov/refresh/graphics_at3+shtml/231447.shtml?cone#contents
++++++++++++
Lowest pressure
Melissa currently is tied for third strongest on record by pressure, with the 1935 Labor Day hurricane, behind only 1988's Gilbert and 2005's Wilma. Only seven Atlantic hurricanes have had a central pressure lower than 900 millibars.
1. Wilma (2005): 882 millibars
2. Gilbert (1988): 888 millibars
3. Melissa (2025), "Labor Day" Hurricane (1935): 892 millibars
5 (tie). Rita (2005): 895 millibars
5 (tie). Milton (2024): 895 millibars
7. Allen (1980): 899 millibar
++++++++++++++++
Another metric used to rank hurricanes is their peak sustained winds. In most cases today, these winds are measured by reconnaissance aircraft missions, since these top-end hurricanes most often happen either in the Caribbean Sea, Gulf, or southwest Atlantic Ocean within reach of these aircraft.
Melissa currently is tied for second on this list with four other hurricanes. Only nine Atlantic Basin hurricanes have had peak sustained winds of 180 mph or higher. This list includes all the hurricanes in the lowest pressure list, plus several other notable storms.
1. Allen (1980): 190 mph
2. Melissa (2025), "Labor Day" (1935), Gilbert (1988), Wilma (2005) and Dorian (2019): 185 mph
6. Mitch (1998), Rita (2005), Irma (2017) and Milton (2024): 180 mph
There are indications that there could be another strong tropical system in this same region in week 2, with Florida a potential target.
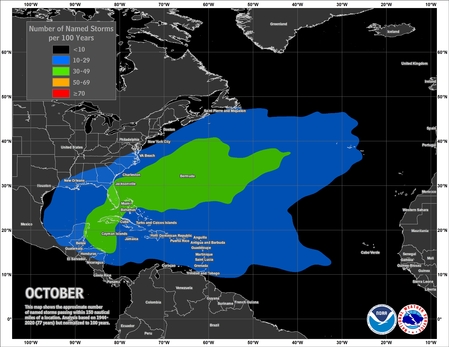
This is the November 8 forecast. Models have low skill at predicting this time frame but the European model is seeing favorable conditions for another hurricane at this time frame.
++++++++++++++++++++
Chances of a hurricane hitting Florida go way down in November but it can still happen"
https://www.nhc.noaa.gov/climo/
https://www.wunderground.com/hurricane/articles/late-season-major-hurricanes
| Rank | Name | Date | Winds (mph) | Location |
|---|---|---|---|---|
| 1. | Kate | 20-21 Nov. 1985 | 120 | Florida Panhandle |
| 2. | Wrong-way Lenny | 17-18 Nov. 1999 | 155 | Northern Lesser Antilles |
| 3. | Hurricane 7 | 17-18 Nov. 1912 | 115 | South of Jamaica |
| 4. | 1932 Cuba Hurricane | 5-10 Nov. 1932 | 135 | Cuba |
| 5. | Paloma | 8 Nov. 2008 | 145 | Cuba |
| 6. | Greta | 5-6 Nov. 1956 | 140 | Mid-Atlantic |
| 7. | Michelle | 3-5 Nov. 2001 | 140 | Cuba |
| 8. | Beta | 30 Oct. 2005 | 115 | Nicaragua |
| 9. | Hattie | 28-31 Oct. 1961 | 160 | Belize |
| 10. | Mitch | 25-28 Oct. 1998 | 180 | Honduras |
| 11. | Hurricane Nine | 29 Oct. 1867 | 130 | Northern Lesser Antilles |
| 12. | Fox | 26 Oct. 1952 | 115 | Cuba |
Today is October 28, 2025 so I assume that Melissa is on this list and should still be a major hurricane tomorrow, October 29, 2025 which might bump it up to #10 on the list for latest major hurricane.
But look at #1 on this list on November 20-21!!!
The next system, if it develops won't be nearly that late but a major hurricane hitting Florida in the 2nd week of November, although rare is a possibility here in 2025!!! See the map on the previous page!
The threat of another system in this same area developing in November is MUCH less on the latest runs.
Hurricane Melissa set to trigger $150 million Jamaica catastrophe bond to help rebuild
Hurricane Melissa was an historic storm and broke numerous records. Let's take a closer look.
++++++++++++++++++
https://www.sciencealert.com/how-record-breaking-hurricane-melissa-became-a-monster-overnight
Here's a couple of opinions on the impact of climate change on Melissa.
The AP Gets Hurricanes Wrong, Again, Melissa’s Intensity Is Not Proof of Climate Change
The National Oceanic and Atmospheric Administration’s Historical Hurricane Tracks database shows that hurricane activity fluctuates naturally, with the 1940s through 1960s being among the most active periods on record—long before modern fossil fuel emissions were significant.
Even the Intergovernmental Panel on Climate Change (IPCC) acknowledges that there is “low confidence in any long-term trends in hurricane activity.” The IPCC’s Sixth Assessment Report found no detectable increase in either global tropical cyclone frequency or landfall intensity. See the table below from the IPCC report and note the highlighted section on tropical cyclones:

+++++++++++++
https://www.cbc.ca/news/science/hurricane-melissa-climate-change-9.6960554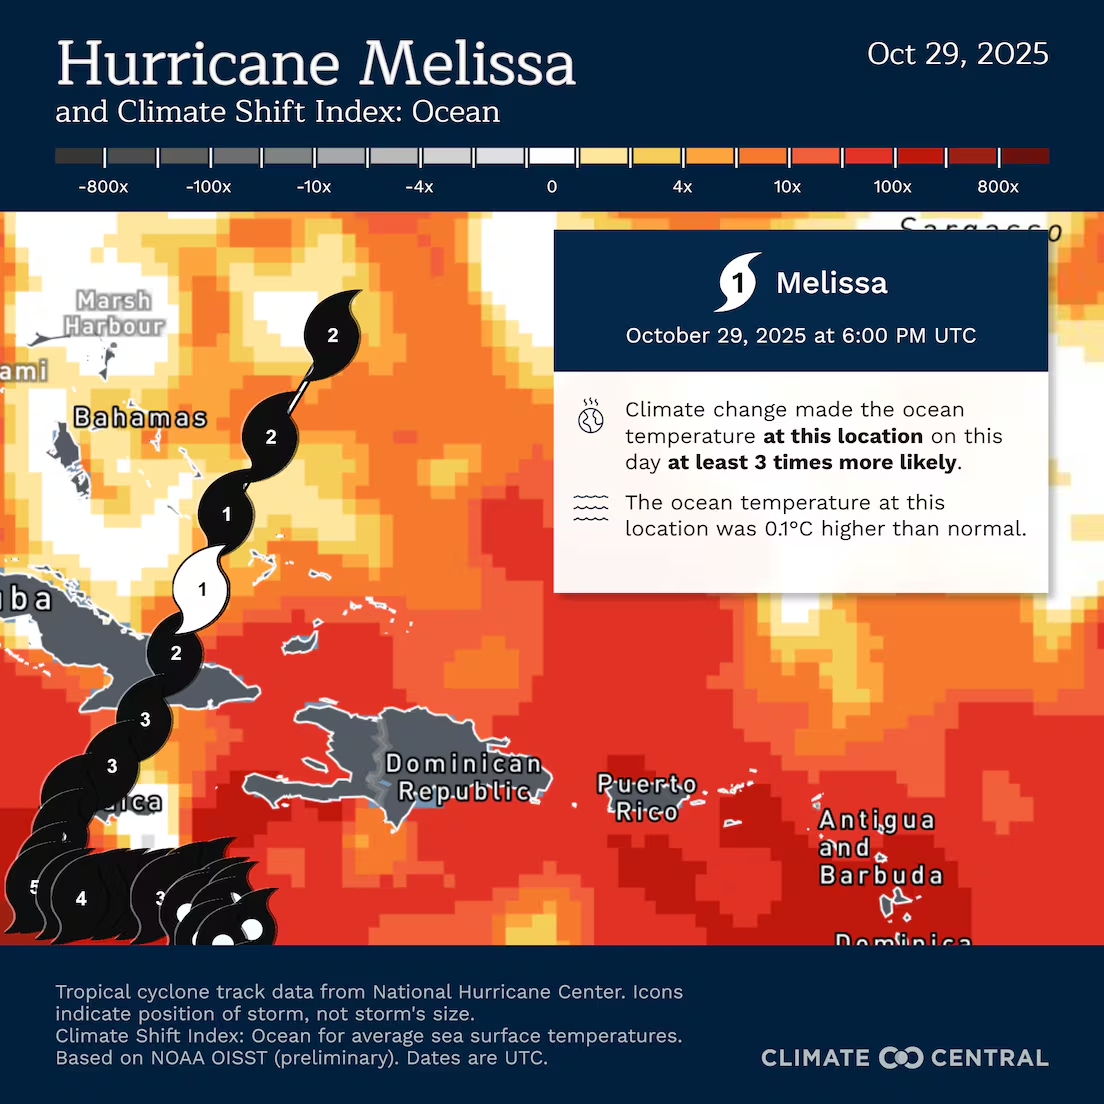
+++++++++++++
As an atmospheric scientist/meteorologist, I'll weigh in with some thoughts.
While not all the data based on observations is conclusive, there are a few physical principles that apply indisputably.
1. A warmer ocean/atmosphere causes weather systems to hold more moisture. +7% for each +1 Deg. C of warming. Hurricanes in this century are dumping more rains than hurricanes last century with this warming super imposed on them. Each hurricane is different and there are numerous other factors, however this is a law of physics/meteorology that is indisputable.
2. The tropical oceans have warmed up around 1 Deg. C the last 100 years. There is a strong correlation between water temperatures above 79 Deg F and hurricane intensity too. It's why we don't have hurricanes in the Winter in this hemisphere, because the water is not warm enough.
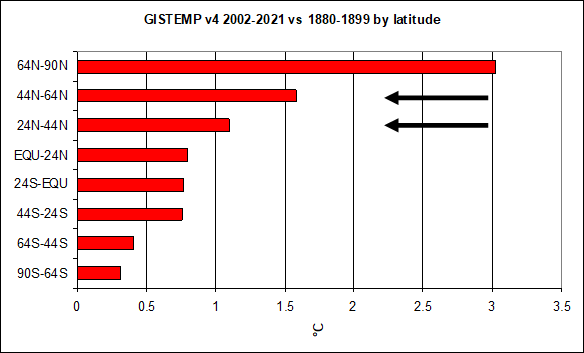
3. Global warming is impacting the highest latitudes of the Northern Hemisphere the most. It has warmed the tropics close to 1 Deg. C. However, it has REDUCED the temperature differential between the higher latitudes and the lower latitudes. This is reducing the temperature gradient which means less energy for storms outside of the tropics. This could possibly reduce the need for hurricanes to transport heat and exhaust heat to space to balance the heat disparity with latitude. This could be indirectly suppressing the number of hurricanes.
Meteorology 101 tells us what happens when the planet sees the temperature of the highest latitudes (coldest places, especially coldest time of year) warmed up the most. This is beneficial warming!
Weather becomes LESS extreme in several realms!
4. Common sense tells us that if the tropics are close to 1 deg. C warmer, then the hurricane zones will start their hurricane season earlier and end it later.
5. Anomalously warm water temperatures are a factor for hurricanes experiencing rapid intensification.
Global warming impacts many other realms on the planet. For the VAST majority of life on this planet, this is a wonderful climate OPTIMUM.
Slightly warmer oceans clearly are a negative for humans that live in the tropics. However, the increase in CO2 is indisputably resulting in at least a 28% increase in food production, just from the added CO2 fertilization. (+140 parts per million X 1%/5 ppm) and likely more from the better growing conditions added to that. Billions of poor on our planet benefit the most.
We are using LESS energy for heating and cooling.
We are having LESS deaths from extreme temperatures.
We are having LESS violent tornadoes.
Sea levels are increasing at a bit more than 1 inch/DECADE.
Heat waves are slightly warmer in some places but mostly from overnight temperatures and its been this warm before:
https://en.wikipedia.org/wiki/Holocene_climatic_optimum
A scientifically objective and honest person would acknowledge that for people that live in the hurricane vulnerable tropics of the Northern Hemisphere, even though this region is experiencing the LEAST WARMING in the Northern Hemisphere, the rising seas (along some coastlines) and potentially stronger hurricanes make the overall climate change consequences a big negative in some areas.
If you live in a coastal country suffering from widespread starvation, food may still be your most important priority. Outside of the tropics it IS your most important priority.
For the vast majority of the world of 8,000,000,000+ people, 28%+ more food by itself outweighs everything else. What is ironic is that the consequences of FAKE green energy(fossil fuels are the only REAL green energy as they massively green up the planet) are far worse than the FAKE climate crisis they are supposed to be helping to fix.
The impact of anti environmental, FAKE green energy also does tremendous environmental damage, the exact opposite of what we are told.
+++++++++++++++
In the aftermath of Hurricane Melissa in Jamaica, we should be sensitive to their needs and have compassion with assistance for them. At the same time, hurricanes as strong as Melissa happened a century ago with the old climate. The Labor Day Hurricane in 1935, for instance. Or Hurricane Camille in 1969 were 2 Cat. 5 hurricanes that hit the US during the "old climate" regime. Hurricanes like this will still happen, regardless of what humans do with CO2 emissions.
On the other hand, the 28% increase in food from the increase in CO2 is 100% indisputable. And we are still less than half the optimal level of CO2 in the atmosphere for life(which is around 900 ppm). Food and the cost of food is much more critical for the poor around the world...........BILLIONS of people.
Again, if you live in Jamaica right now, none of that matters. However, if you are honest, objective and balanced it should matter. If you rely on information from sources that tell you CO2 is carbon pollution (when its a beneficial gas-carbon is a solid) and that its killing the planet.......when its rescued the planet from dangerously low and damaging levels, then your source is speaking with fork tongue science!
Death by GREENING!
52 responses |
Started by metmike - May 11, 2021, 2:31 p.m.
https://www.marketforum.com/forum/topic/69258/#109795
++++++++++++++
One final note about hurricane intensity. An increase in top winds in an individual storm from 170 to 180 mph(or +10 mph at any magnitude) seems tiny when using a linear scale. However, potential wind damage increases on an EXPONENTIAL scale. For every +10 mph in wind strength the amount of potential damage goes up 100%.
No kidding!!!
By metmike - Oct. 27, 2025, 11:12 a.m.
By metmike - Sept. 6, 2023, 9:47 p.m.
Let's take a look at how hurricane frequency and intensity has changed and if that matches IPCC predictions.Dr. Matthew WielickiSep 5, 2023 https://twitter.com/MatthewWielicki/status/1699420781053165939 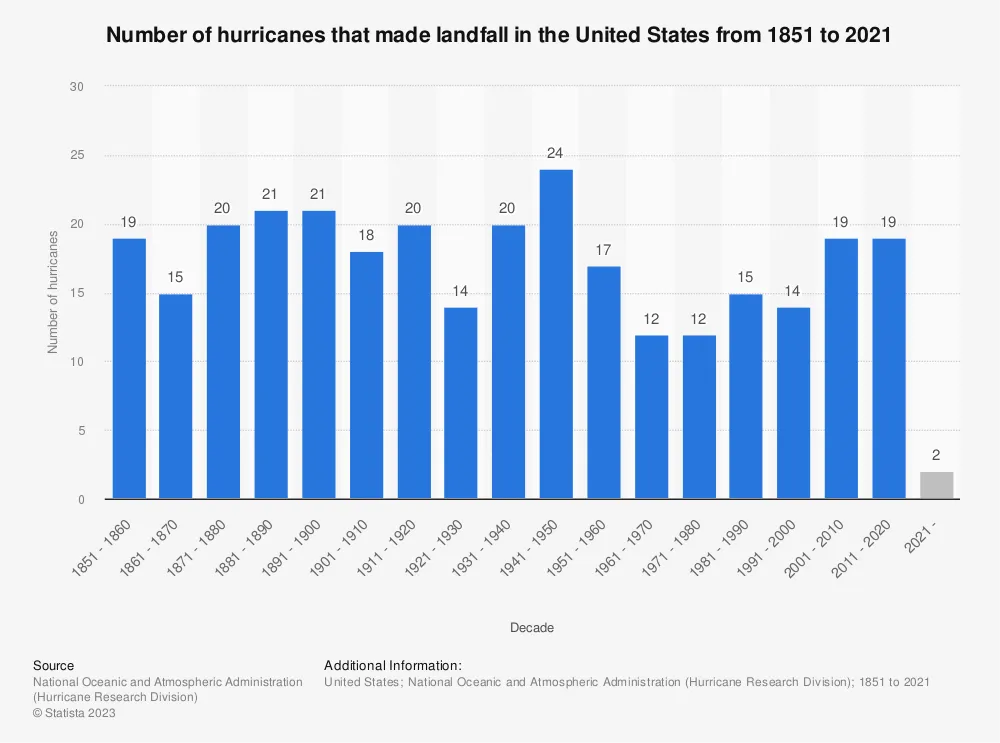 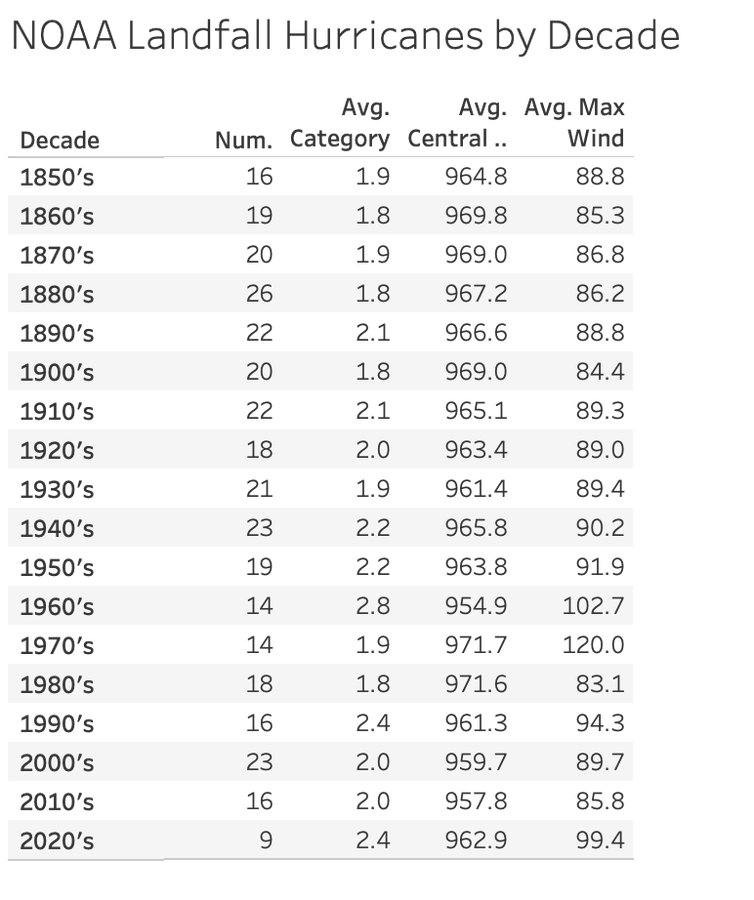 | Sept. 6, 2023, 9:47 p.m. metmike |
+++++++++++++=
Here in 2025, the United States had 0 landfalling hurricanes because they all tracked far to the east.
The long term average from above is around 2 hurricanes/year. There has not been an increase with climate change/global warming.
This isn’t new but it has the latest death toll in Jamaica:
Death toll from Hurricane Melissa rises to 45 in Jamaica, with 15 others still missing
The death toll is expected to rise, with officials still trying to reach two towns that remain cut off since the catastrophic Category 5 storm made landfall in western Jamaica on Oct. 28.
Helicopters have been dropping food and other basic supplies in those two communities, said Alvin Gayle, director general of Jamaica’s emergency management office.
He said the storm has displaced 30,000 households, with 1,100 people still living in 88 emergency shelters that remain open.
Thank you very much, Larry!
This has turned out to be one of the luckiest hurricane seasons in US history.
just one tropical storm. No hurricanes! Wow!
I'll have to check again but I thought this will end up tied with the weakest?
There were hurricanes but the tracks were all far out in the Atlantic.
Hey Mike,
Yes, the US has been very fortunate this year unlike Jamaica, Cuba, and parts of the Bahamas from Melissa. The Conus has had no H impacts 20% of the time going back to 1851. The last one was the very strong El Niño of 2015. Also, 2013, 2010, and the El Niño of 2009 had none. It is much more difficult for a La Niña season, like 2010 and 2000, to not have an H hit the Conus vs an El Niño season.
Not just no hurricanes but just 1 tropical storm this year!
Hey Mike,
Ooops, I missed that. Yes, only one TS hit is very quiet, especially for La Niña.
2013, 1990, 1981, were the last years with just 1 TS though none was La Niña.
One has to go all of the way back to 1973 and then 1890 to find the last La Niña seasons with just one TS landfall! And that’s it back to 1851. Will 2025 join those two seasons? Stay tuned. The year isn’t 100% over just yet although the chances of another TS hit are dwindling.
Larry,
You're the best when it comes to hurricane stats!
It's always interesting when we compare stats with those of 100+ years ago for severe weather.
Before hurricane hunters, we didn't have very good data of what was going on 100's of miles off the coasts.
In a recent tv interview on tornadoes for a Bismark, ND tv station, I was speaking about The Great Tri State Tornado on March 18, 1925. Biggest, strongest, longest lasting tornado in history. Those people had no clue that it was coming until they looked out the window or were in a building getting decimated.
We live in such an awesome age for almost everything regarding human history. At the top of the list is following the weather.
We can do it all day long in different ways.
When I spoke to hundreds of schools in the 1980s/early 90s, most of them studying the weather in their science class I told them I had the best job on the planet.
Looking at forecast weather maps is like having a crystal ball, being able to see the future..........of the weather. I know that you understand this better than anybody and share this exact same feeling/love.
I've been doing this for around 44 years now. On many days I spend more time looking at weather maps than doing anything else. Hours. I can't think of when it was that I didn't spend at least an hour in any day doing during the last 2 decades.
And there wasn't a minute of that time that it wasn't immensely enjoyable. The only exceptions were when I had a big weather market position on and the weather changed in the wrong direction.