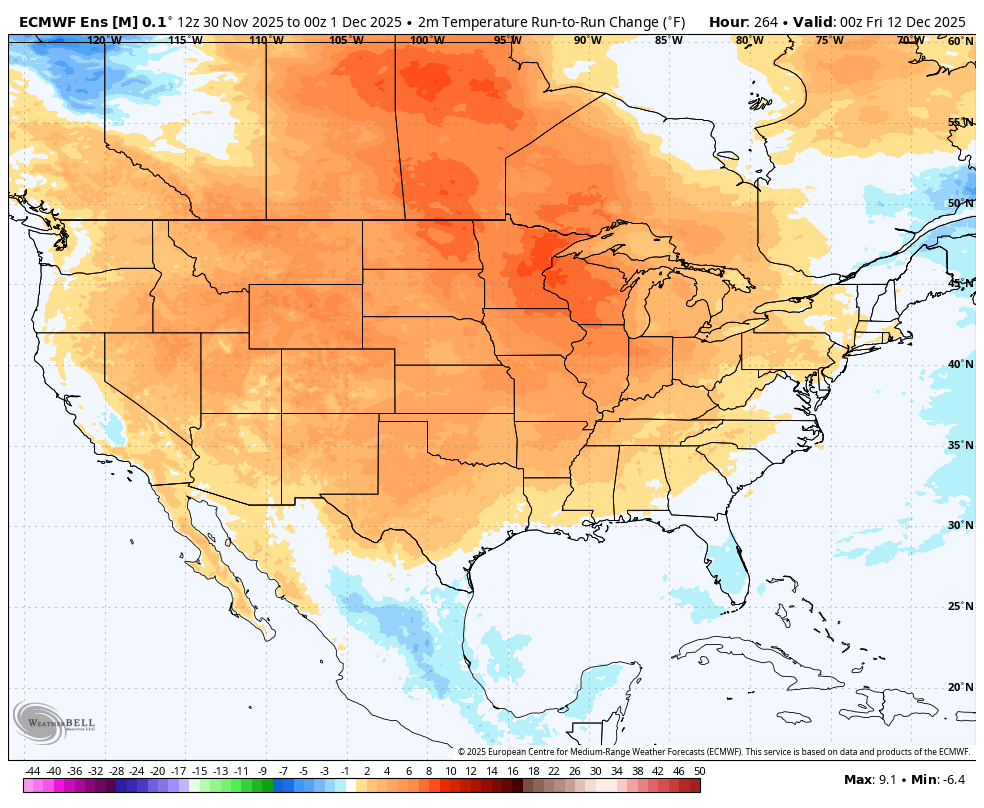
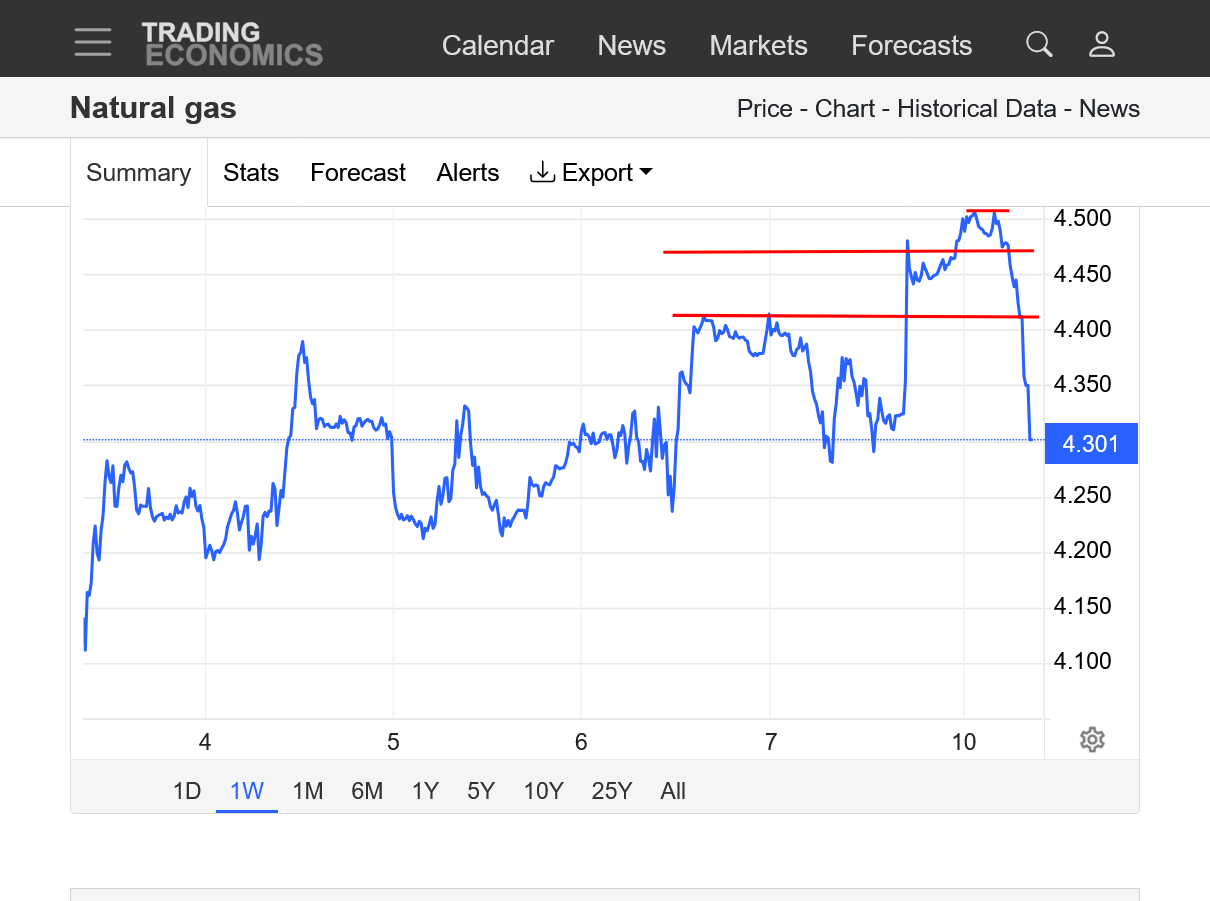
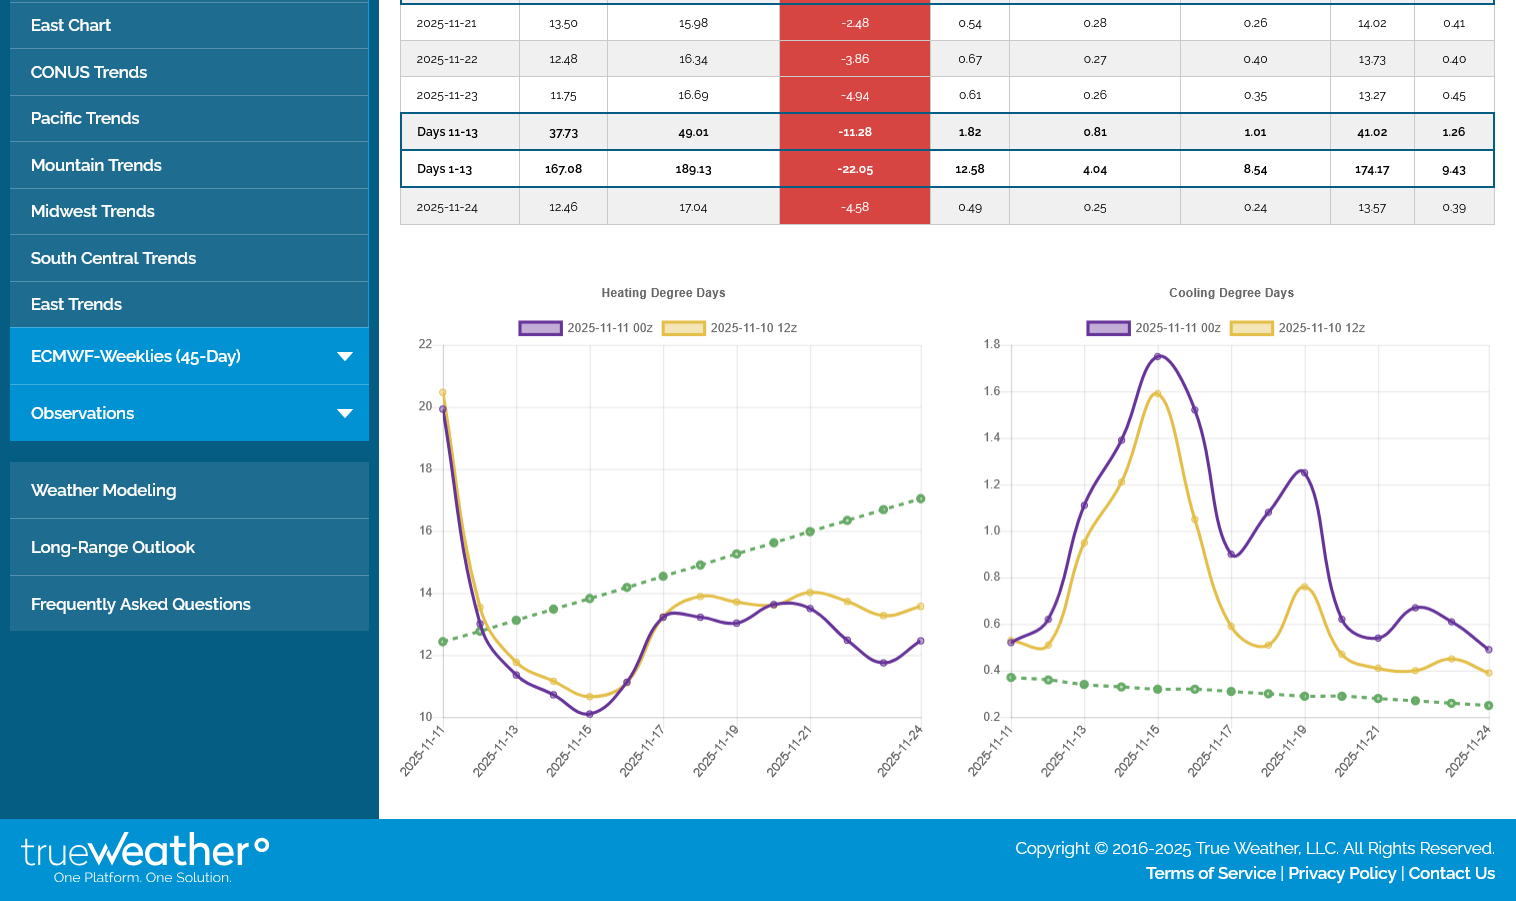
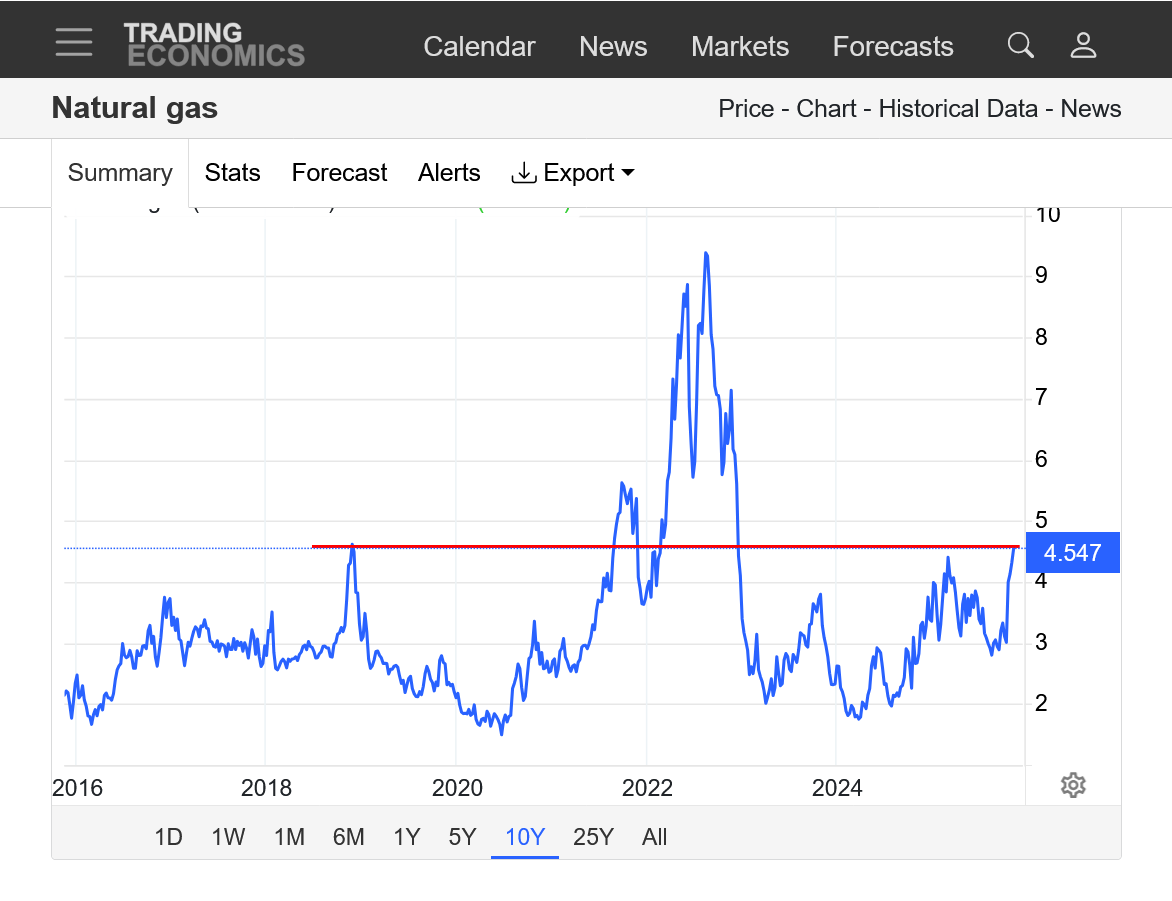
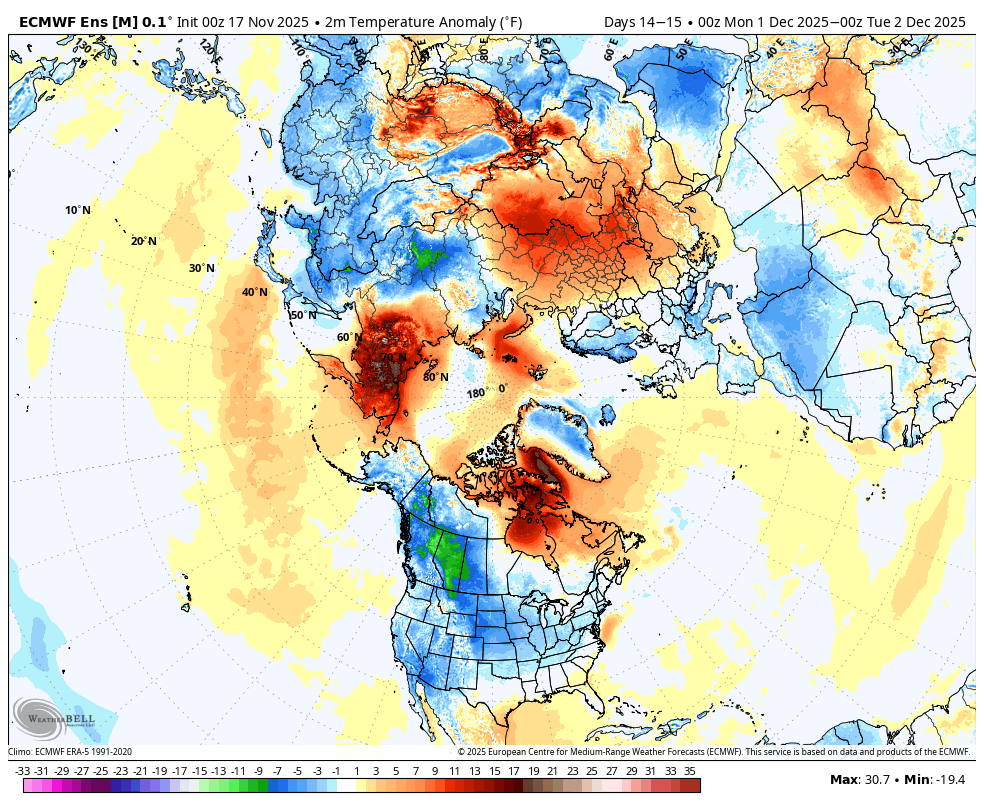
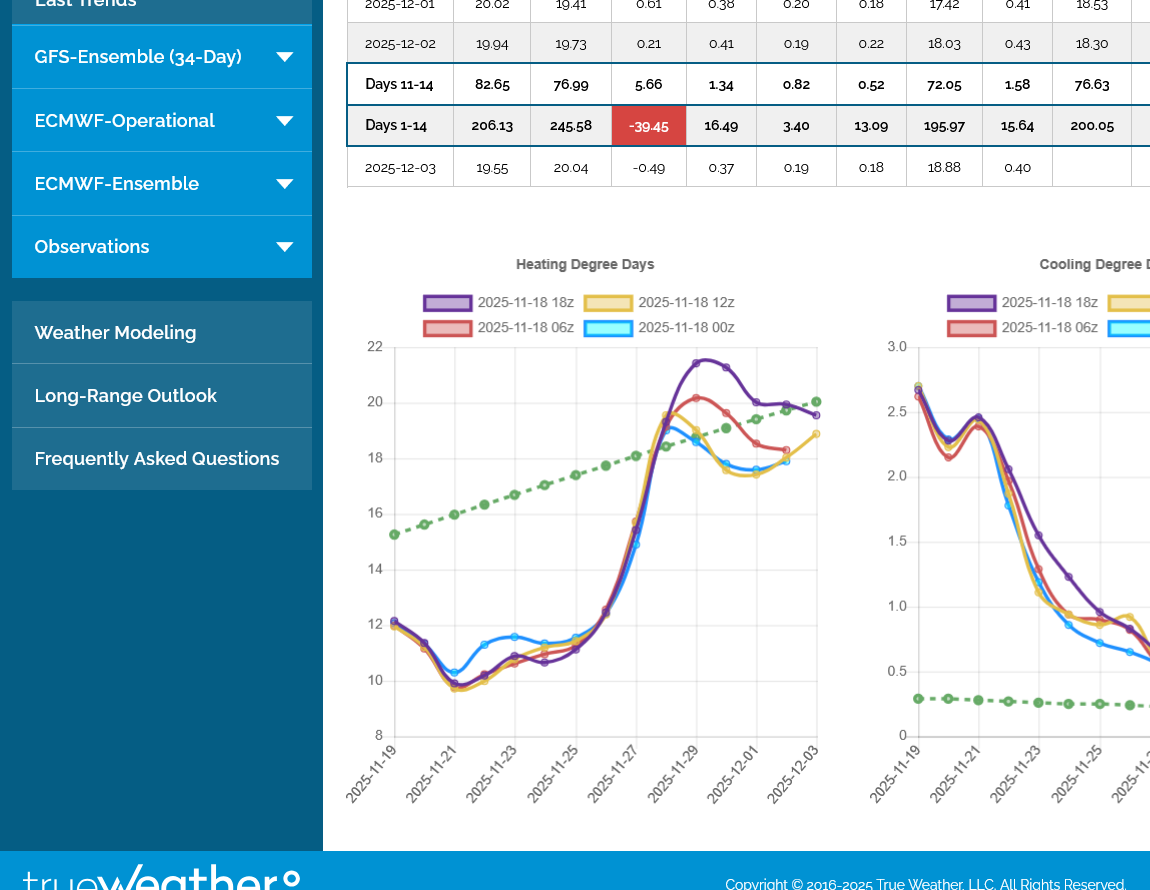
New thread time. NG plunged 4.7% as of 5:40-9AM CDT! Why so much? Granted the 6Z GEFS had 15 fewer HDD than the 0Z. But still, why that big of a plunge?
Thanks for starting the new thread, Larry.
I gave the explanation here:
By metmike - Nov. 10, 2025, 10:15 a.m.
Not normally that much, Larry.
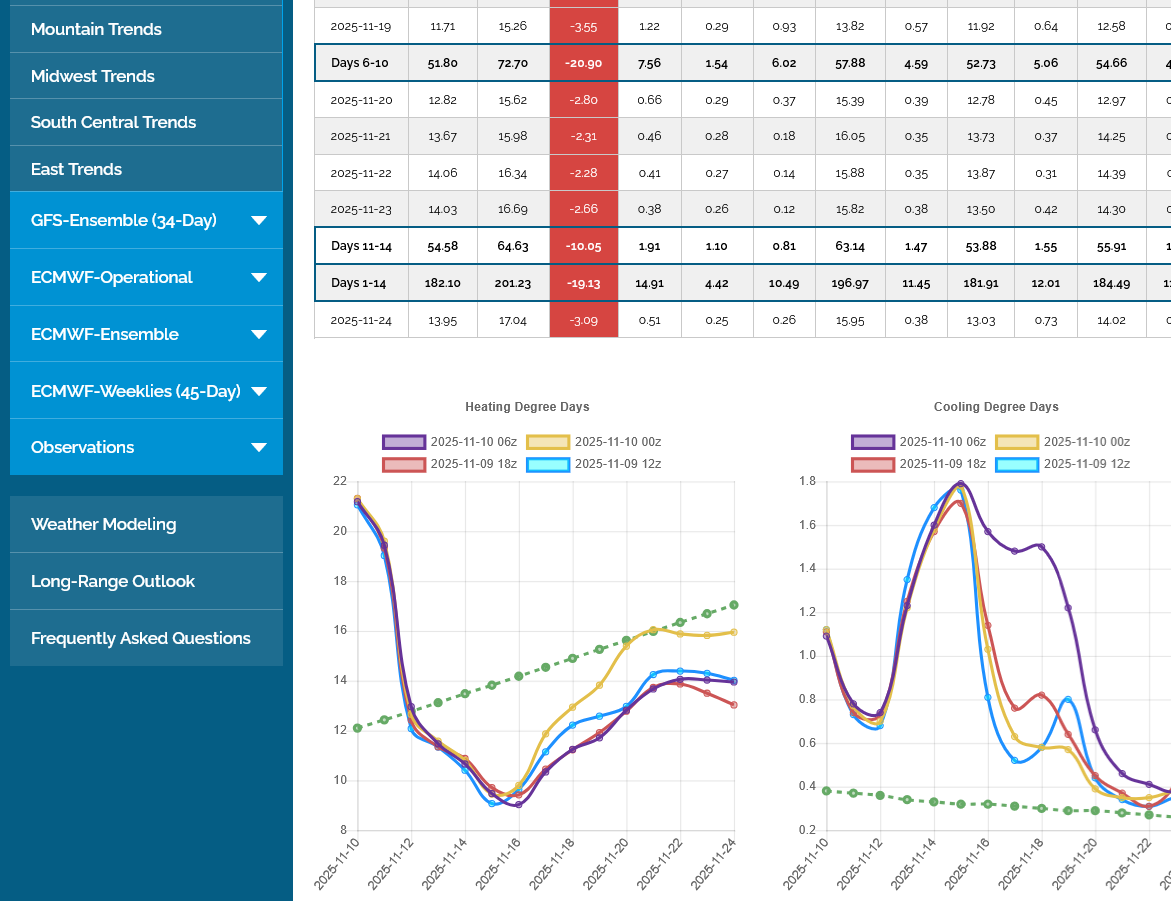
However, the 0z went from +15 HDDs to the 6z run of -15 HDDs vs the previous run.
That rarely happens and it did so at the very end of the markets huge move up on cold that had already been traded for weeks.
This was the classical/textbook ideal weather traders top picking set up, which I've been posting vehemently about since late last week.
I shorted a couple of times a bit early but WAS SLEEPING when THE OPTIMAL shorting signal/warmer weather signal hit. If not for being up well past 2am, I might have considered setting the alarm for the 6z GEFS and cashed in but its almost impossible to be up for every model run to not miss THE ONE that breaks the bulls backs!
The scenario leading up to this was well documented in these posts above BEFORE it happened.
The weather can turn sharply colder again, of course. However dropping $2,500/contract for the highs and filling the opening exhaustion gap has done massive technical damage to the charts with sell/top signals flashing on ng traders computers.
See the entire thread here:
NG 10/9/25-11/10/25
56 responses |
Started by WxFollower - Oct. 9, 2025, 6:36 p.m.
https://www.marketforum.com/forum/topic/115165/
+++++++++++++++
This post, a few hours ago, actually makes what happened crystal clear
By metmike - Nov. 10, 2025, 8:17 a.m.
7:10am
This last 6z GEFS gave all that cold back and was -15 HDDs and we sold off to new lows. The previous solution was an outlier?
I missed the short because I can't stay up 24 hours(was up until 2am) and have to sleep some time although 20 years ago when I traded for a living, I would set my alarm clock all night for when new models were coming out.
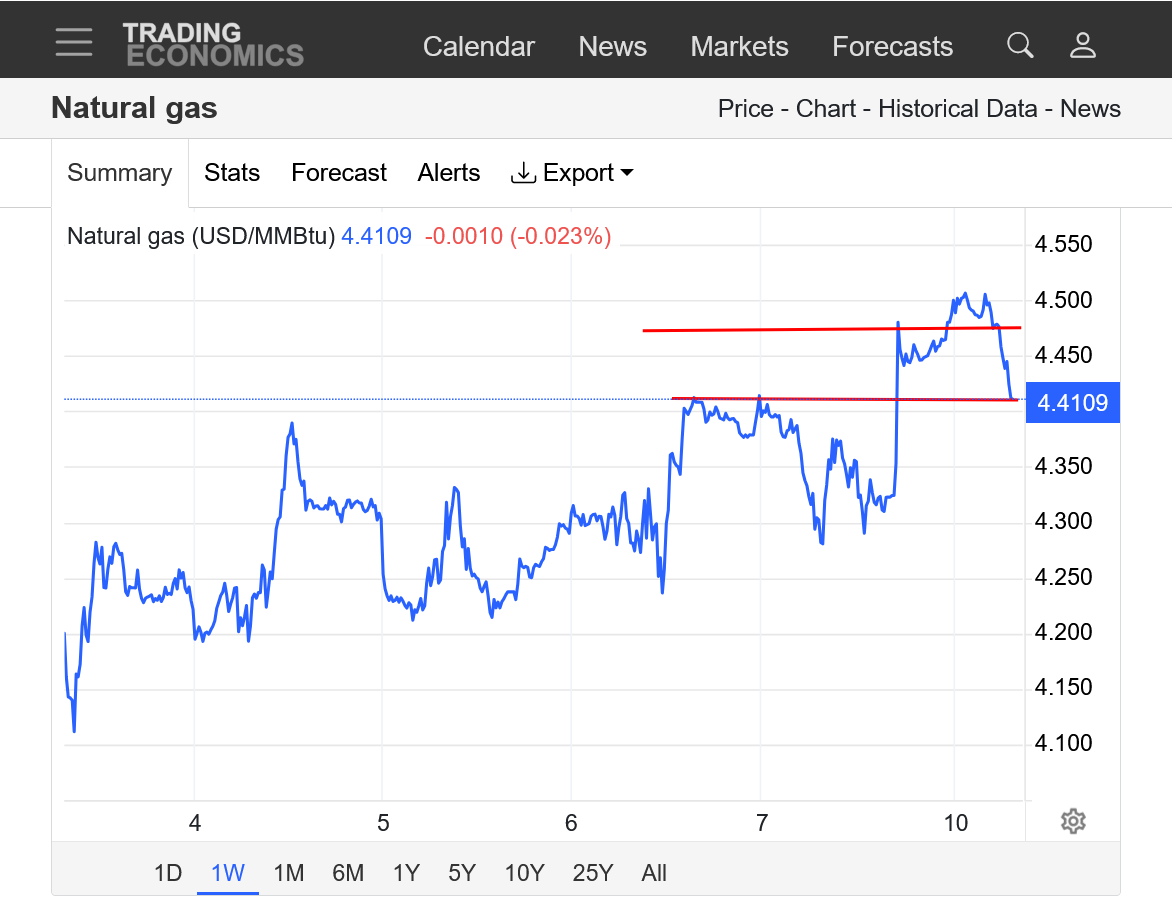
We just filled last nights gap, so its POTENTIALLY a gap and crap, buying exhaustion gap! Colder maps later today will negative that, just like this last models warmth, negatived the upside break away gap signature.
I will guess that the short term top is in........unless the next models runs are much colder. Sometimes markets will fill a gap than go back in the direction they gapped in.
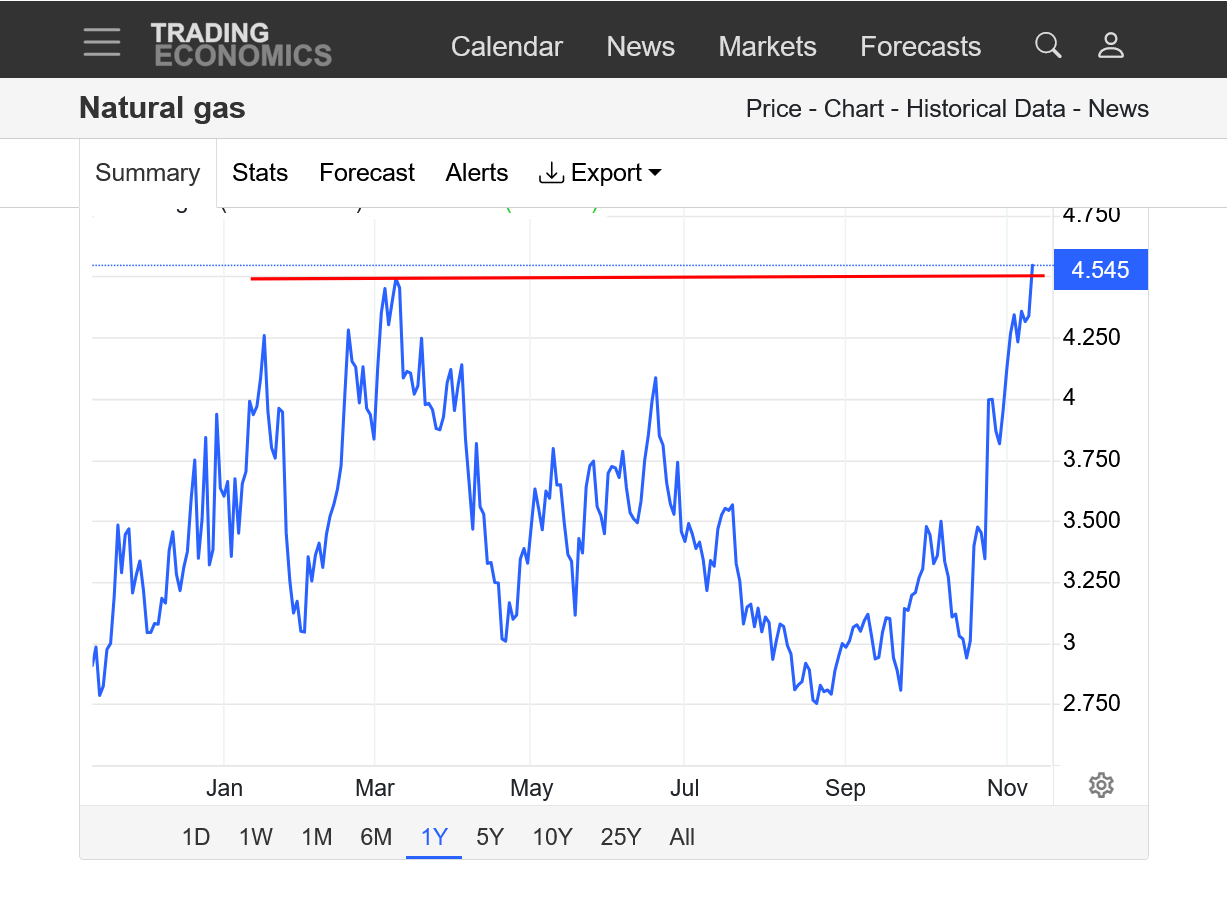
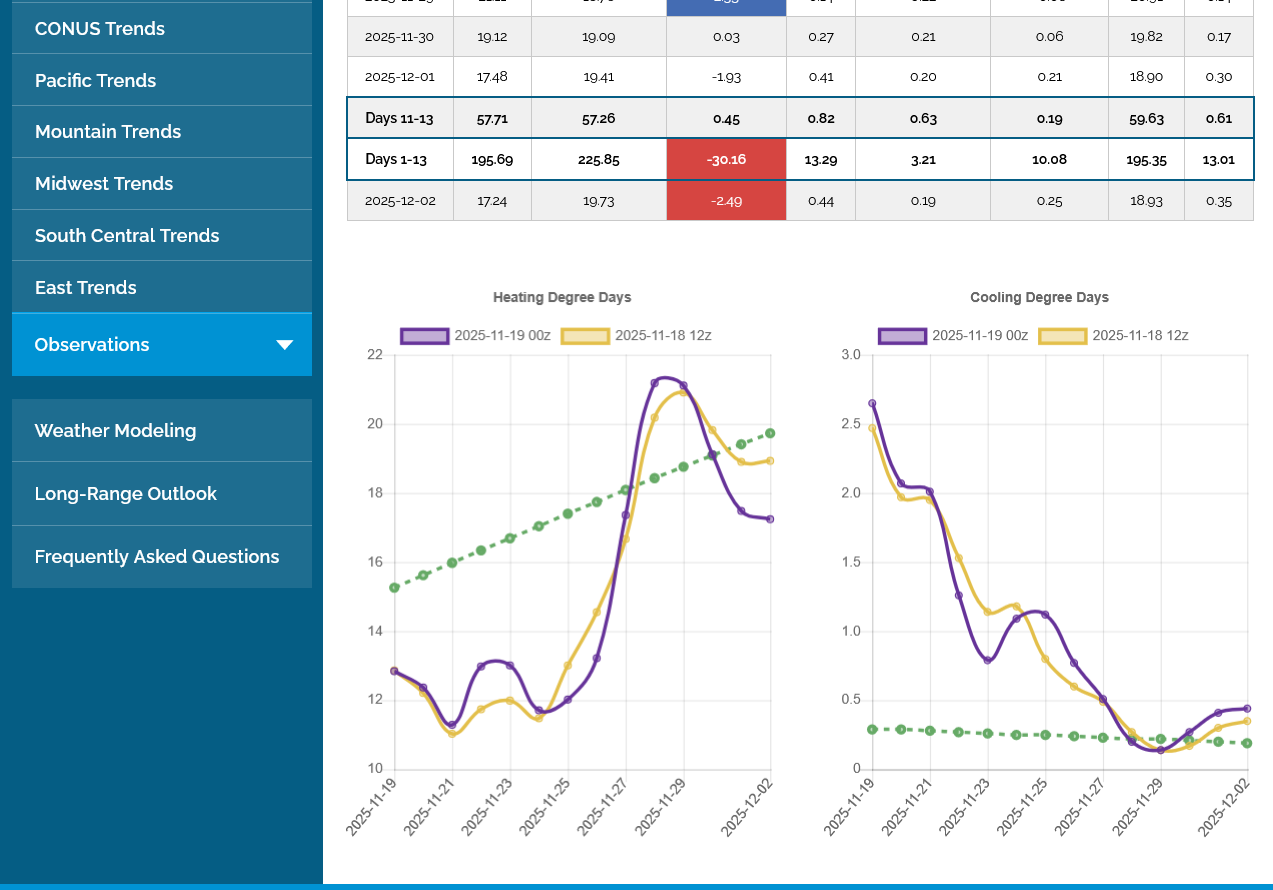
https://tradingeconomics.com/commodity/natural-gas
++++++++++++++
7:40 am
Follow thru makes the earlier call of a top one with more confidence: I missed the optimal selling time, around 5:30 am, when the much warmer 6 GEFS was just coming out because I was sleeping
I got lucky selling the Sunday Night open but missed the HUGE, selling opportunity from the exact set up I had identified, , shorting after 5am(from the warmer 6z GEFS) . Oh well, there will be hundreds of other opportunities. And weather trading for natural gas is still very early in the new cold weather season, right Larry?
++++++++++++++
8:40 am: Pretty safe to say now, just a couple hours later, that this was the short term top, if not THE TOP for this move and the year unless we get hit with much colder forecasts.
I found it interesting that last nights 0z GEFS with +15 HDDs could barely make new highs.
A market that can’t react much more to fresh bullish news after a,long move up has exhausted the buying!
MM, please let us know what NGI says today about the big rise at yesterday evening’s open as well as the big drop back this morning. They’re not necessarily the end all be all, but I’m still curious about their perspective on this already wild session!
Thanks, Larry!
I already showed you exactly what happened, when and why.
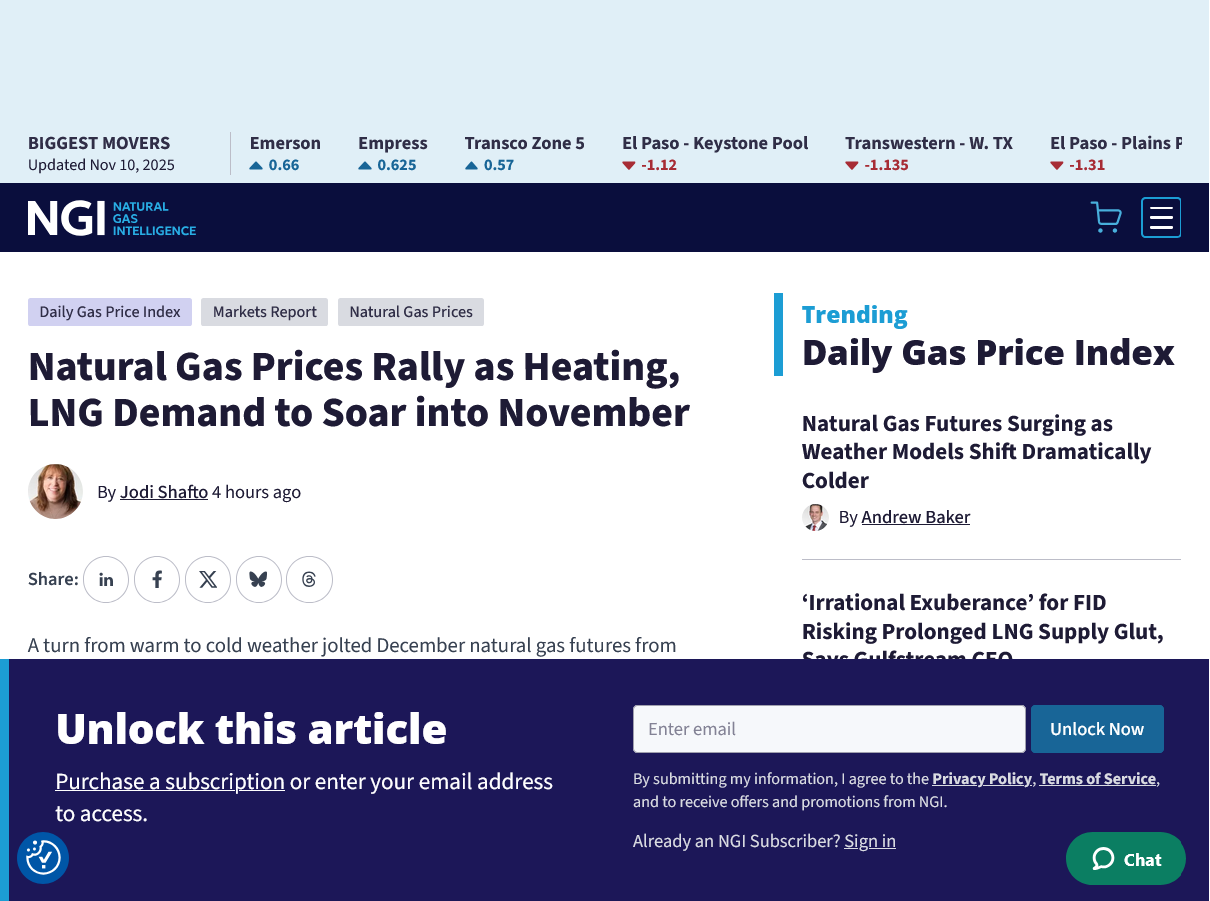
Funny thing is that on bread and butter weather trades like this, how many times Natural Gas Intelligence gets it wrong.
There job is to report an explanation. More often than not its correct but they don't actually trade and i can tell that when they report sometimes. They have pretty good sources most of the time and way better than mine on fundamentals.
But their weather sources are not always that good. I used to use them more often but it seemed frustrating to use them and contradict my own source on weather so often in the same post.
It's after noon now but we have this below from the latest report by them from 8am. Well after we crashed lower. They were still reporting what had happened BEFORE the 6z GEFS turned a whopping -15 HDDs and was especially warm looking on the last maps.
That's likely because they don't trade or follow live natural gas or else they NEVER would have posted that when they did because it was WRONG. It was RIGHT 3 hours before that when they were putting it together for their deadline as a reporter to do their jobs but WRONG when they posted it because their jobs don't require them to check the actual price when posting. It makes them look really bad to actual traders that read their stuff.
I'm not trying to bash them, Larry. They have tons of great stuff, the majority of it in fact. I'm just telling you how it is.
Maybe something else happened at exactly the same time?
In an extremely sensitive weather market, right when one of the biggest bearish (HDD) weather model changes ever came out. Right when the market was at a double top with the March high and exactly in the time frame when NG makes its seasonal high and exactly after a long lived rally on colder and colder models ...........suddenly turned MUCH warmer.
++++++++
12:30pm: There is no question that we can still blow thru those highs and then some if the forecasts get cold enough, especially this early in the season and ESPECIALLY after the numerous Arctic blasts last Winter caused the many big weekly drawdowns in storage and big price surges last Winter.
Today is just 1 day and the ng market is only responding strongly to the freshest updated weather information today compared to what it had previous to that.
Last evenings gap higher was a combination of the MUCH colder 12z EE and longer range models a bit colder which was the freshest/latest weather on the open.
Larry,
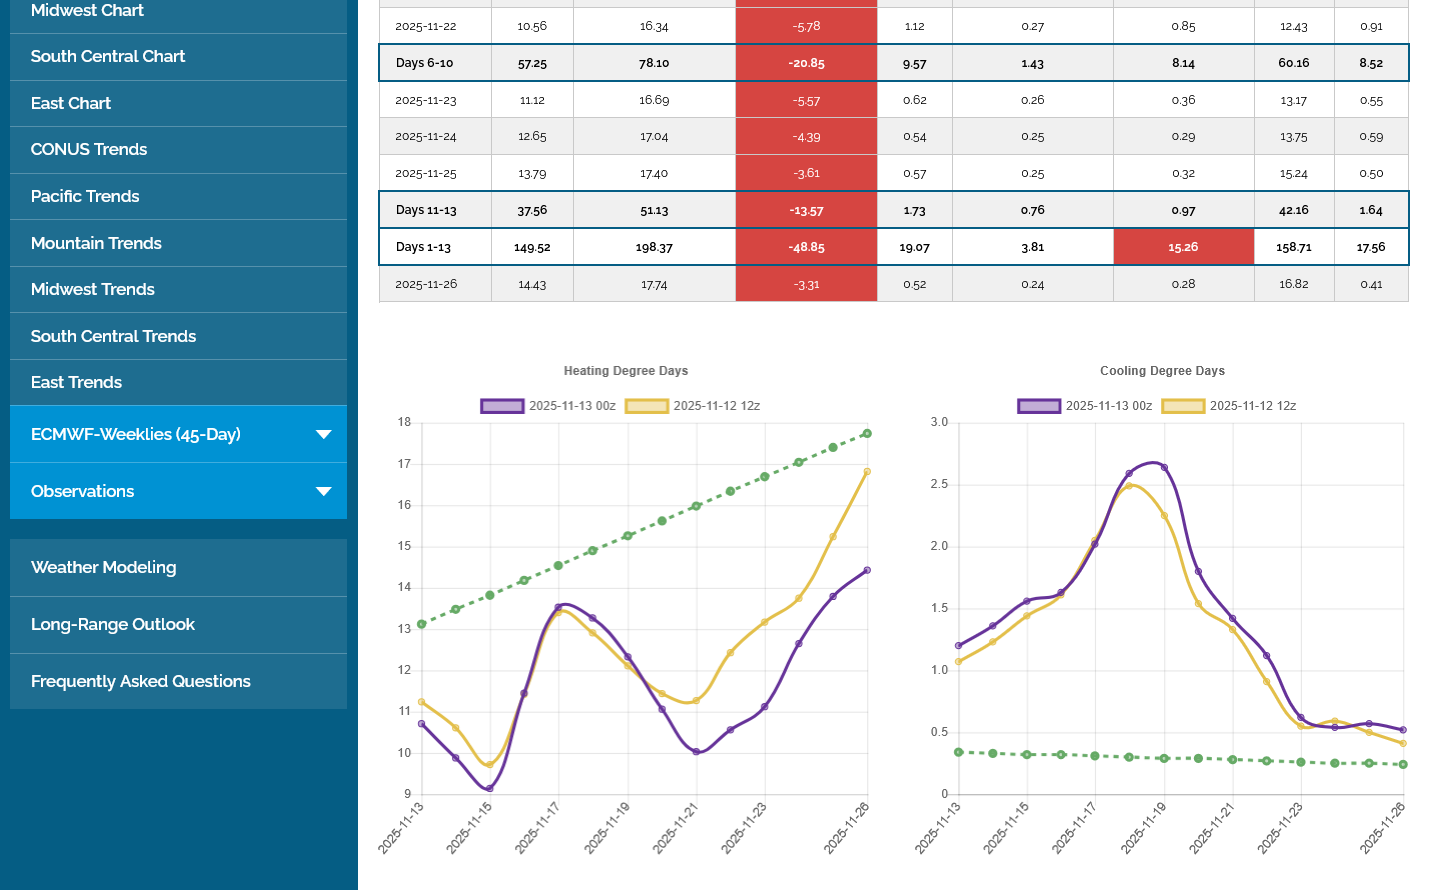
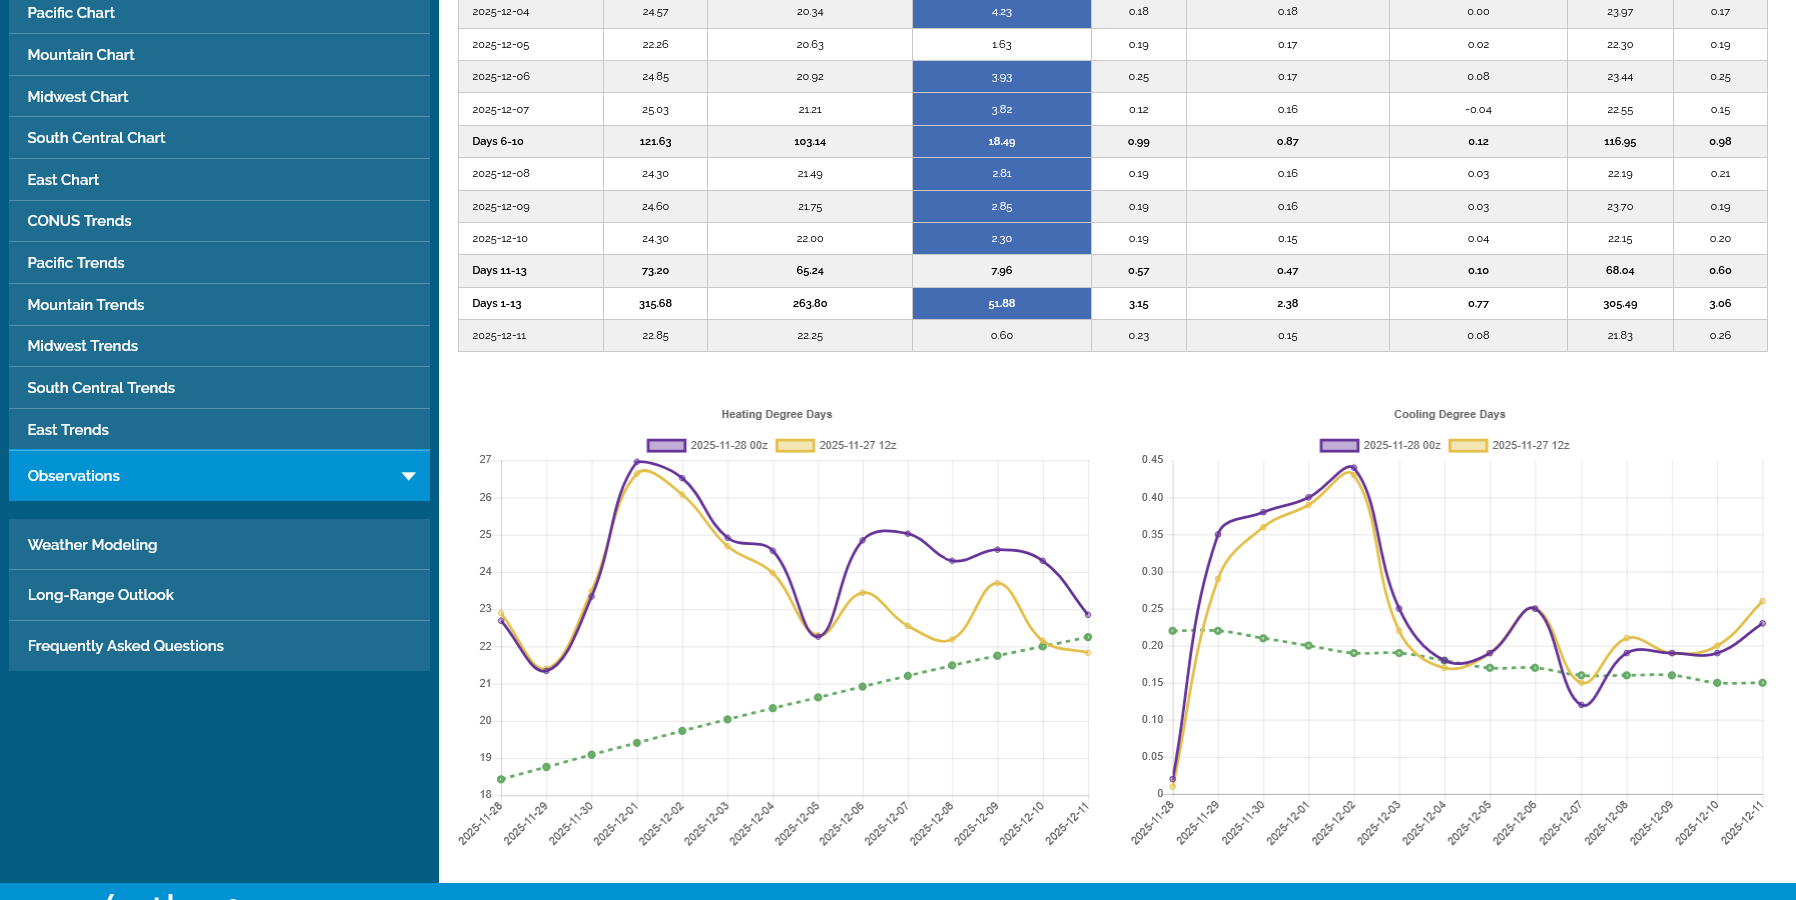
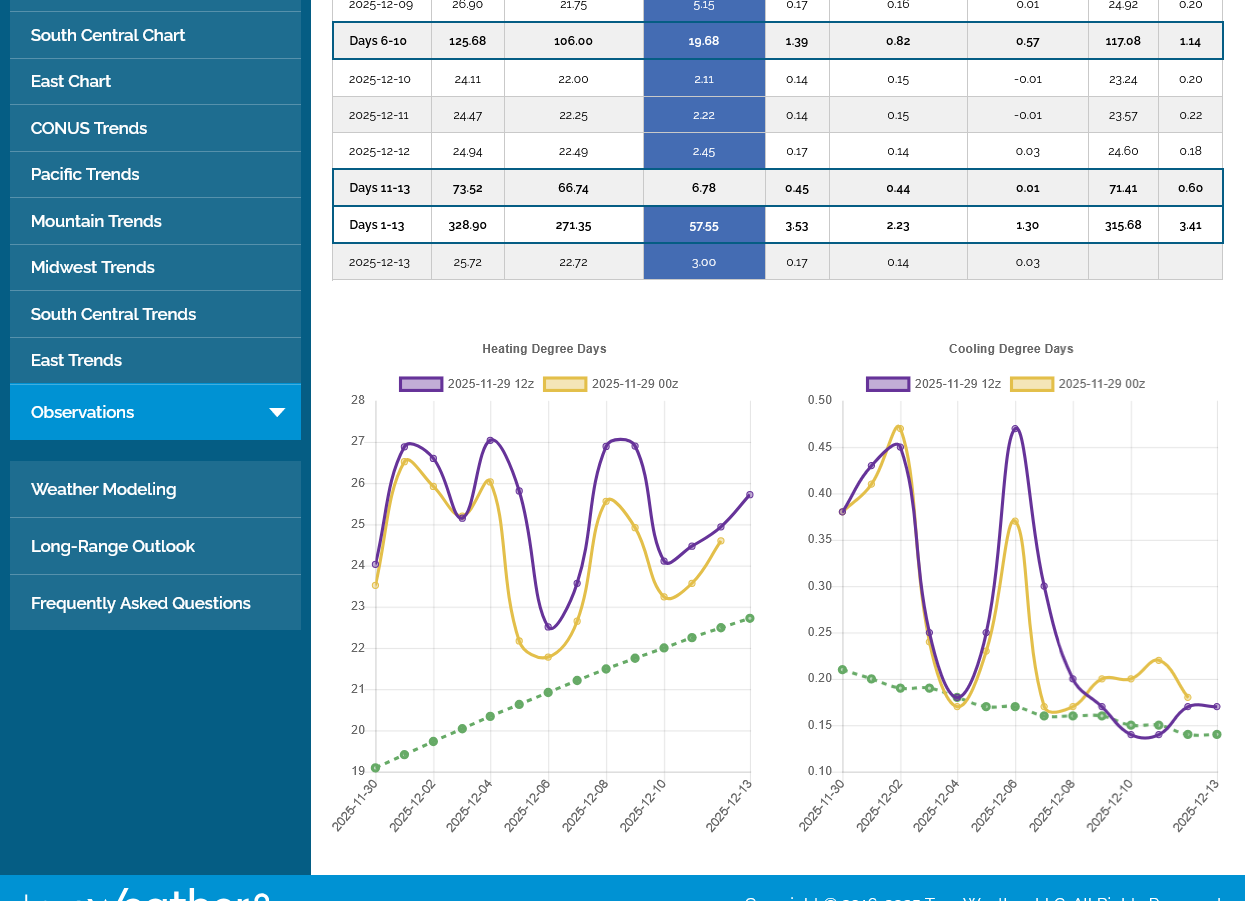
As you may have noticed from the 12z maps, the 12z GEFS was close to the previous solutiion but the later arriving 12z EE was ~+4 HDDs bullish.
Much of the increase was from 3 data points in the week 1 forecast which are just changes in individual days not the pattern. The trajectory of the line is still bearish at the end of the period.
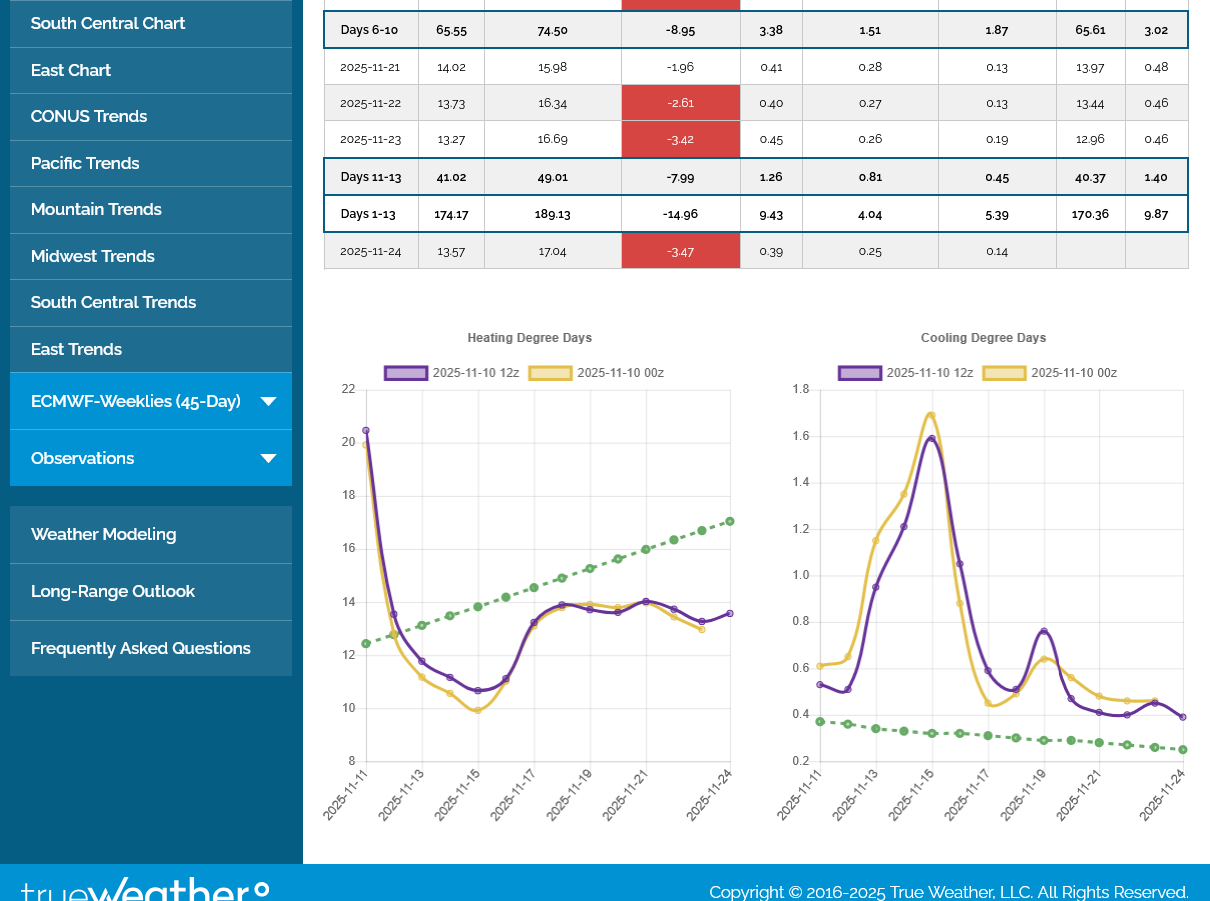
What added to the afternoon bounce that took us close to but not quite to a price approaching the midpoint of the daily trading bar was the late afternoon update of the European model weeklies which was COLDER. This is the end of week 1 in December:
Previous run from Sunday:
Things continue to line up for a shift to much colder in weeks 3 and beyond which will provide support.
+++++++++++++
https://tradingeconomics.com/commodity/natural-gas
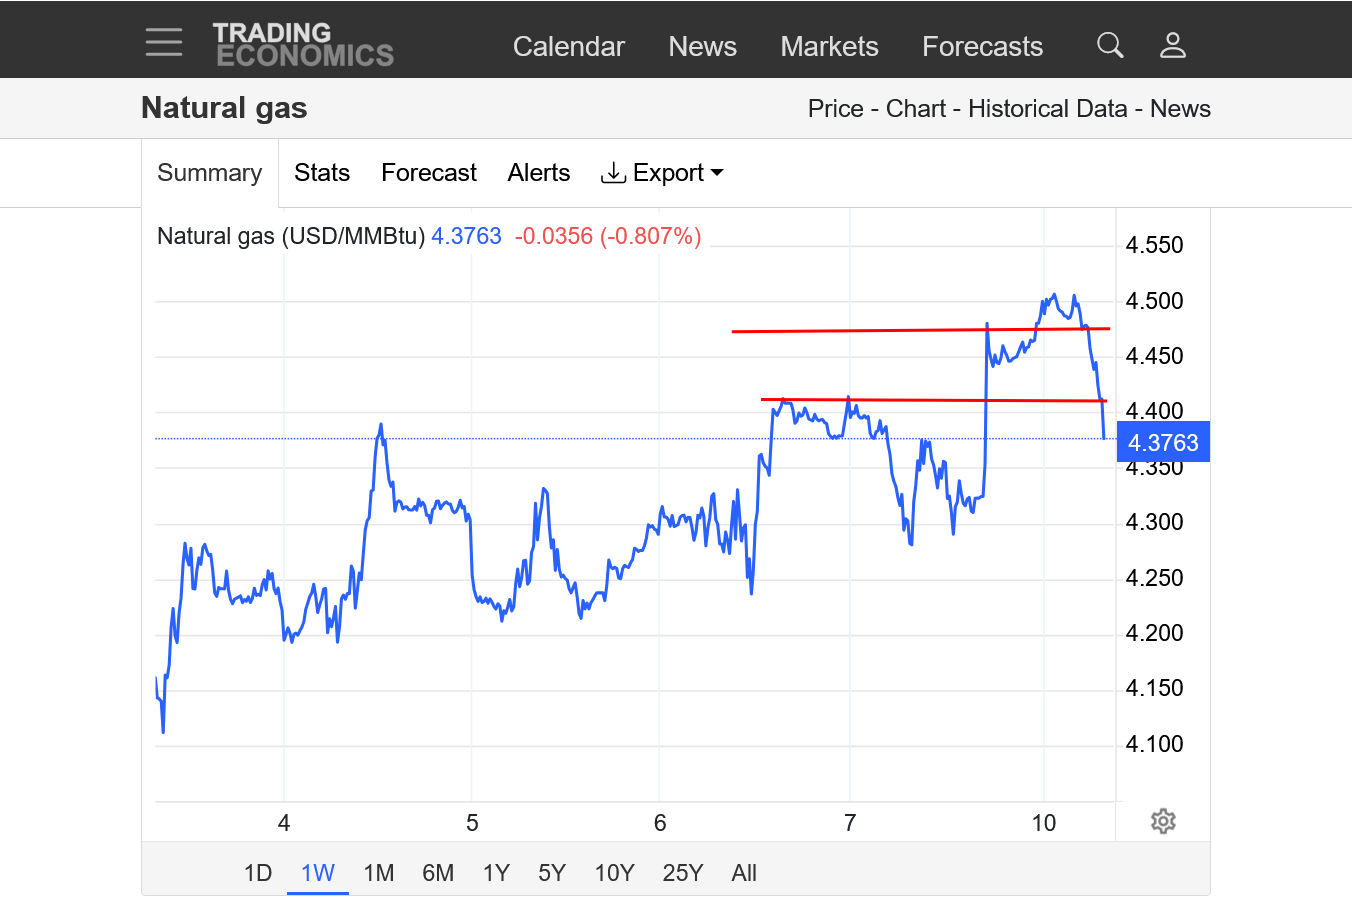
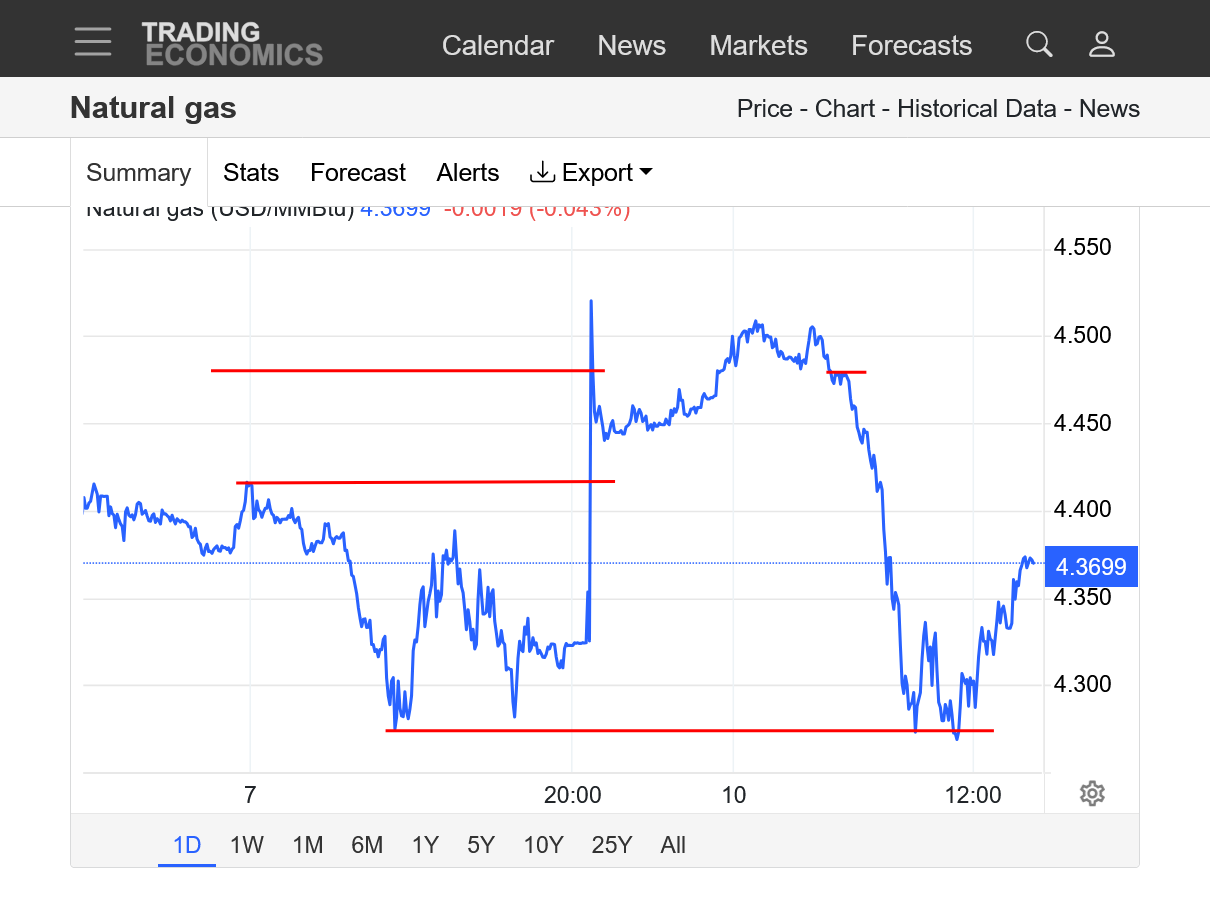
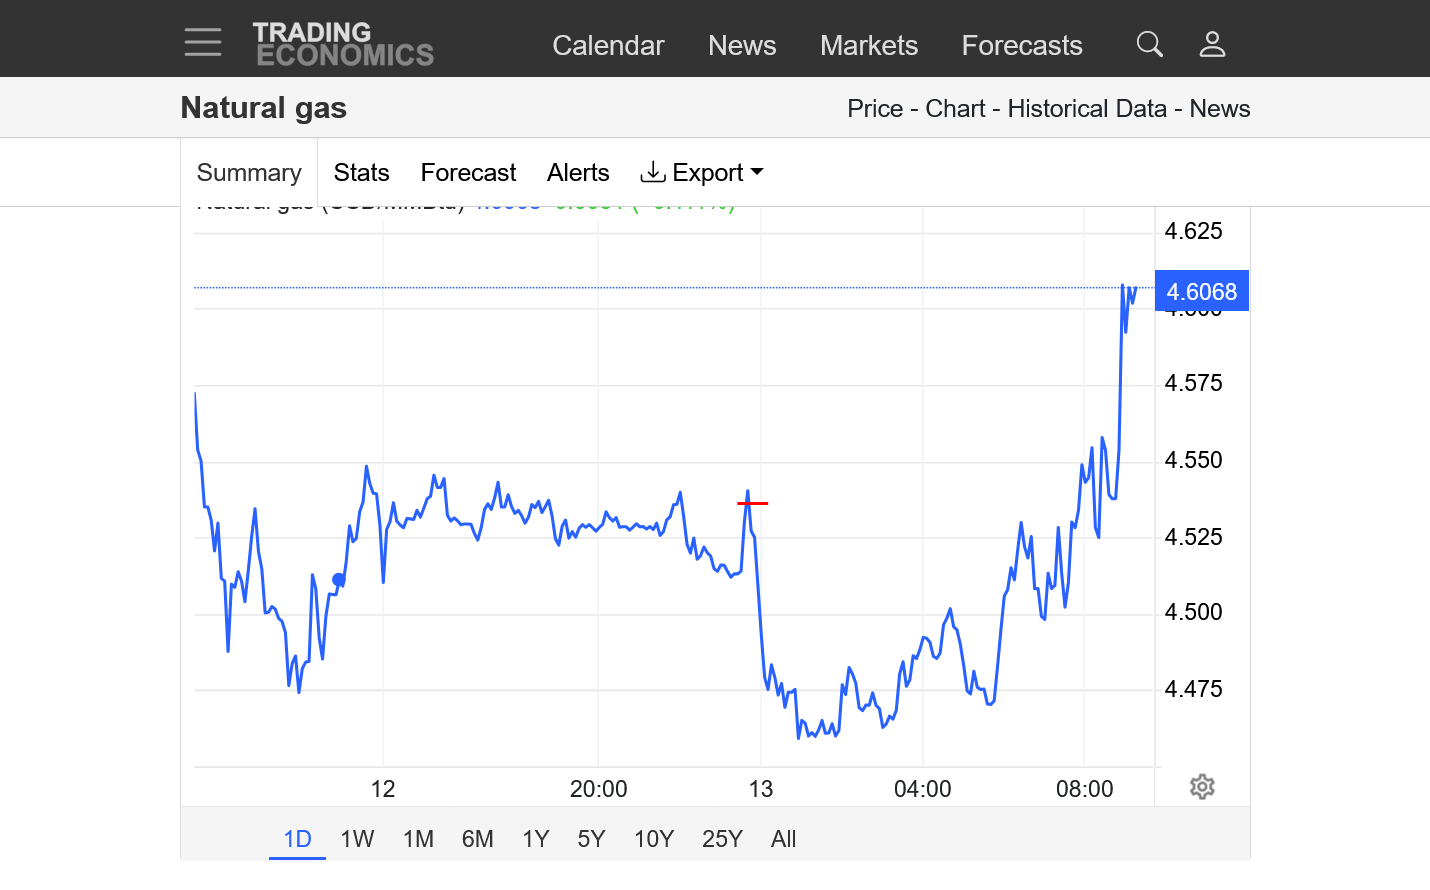
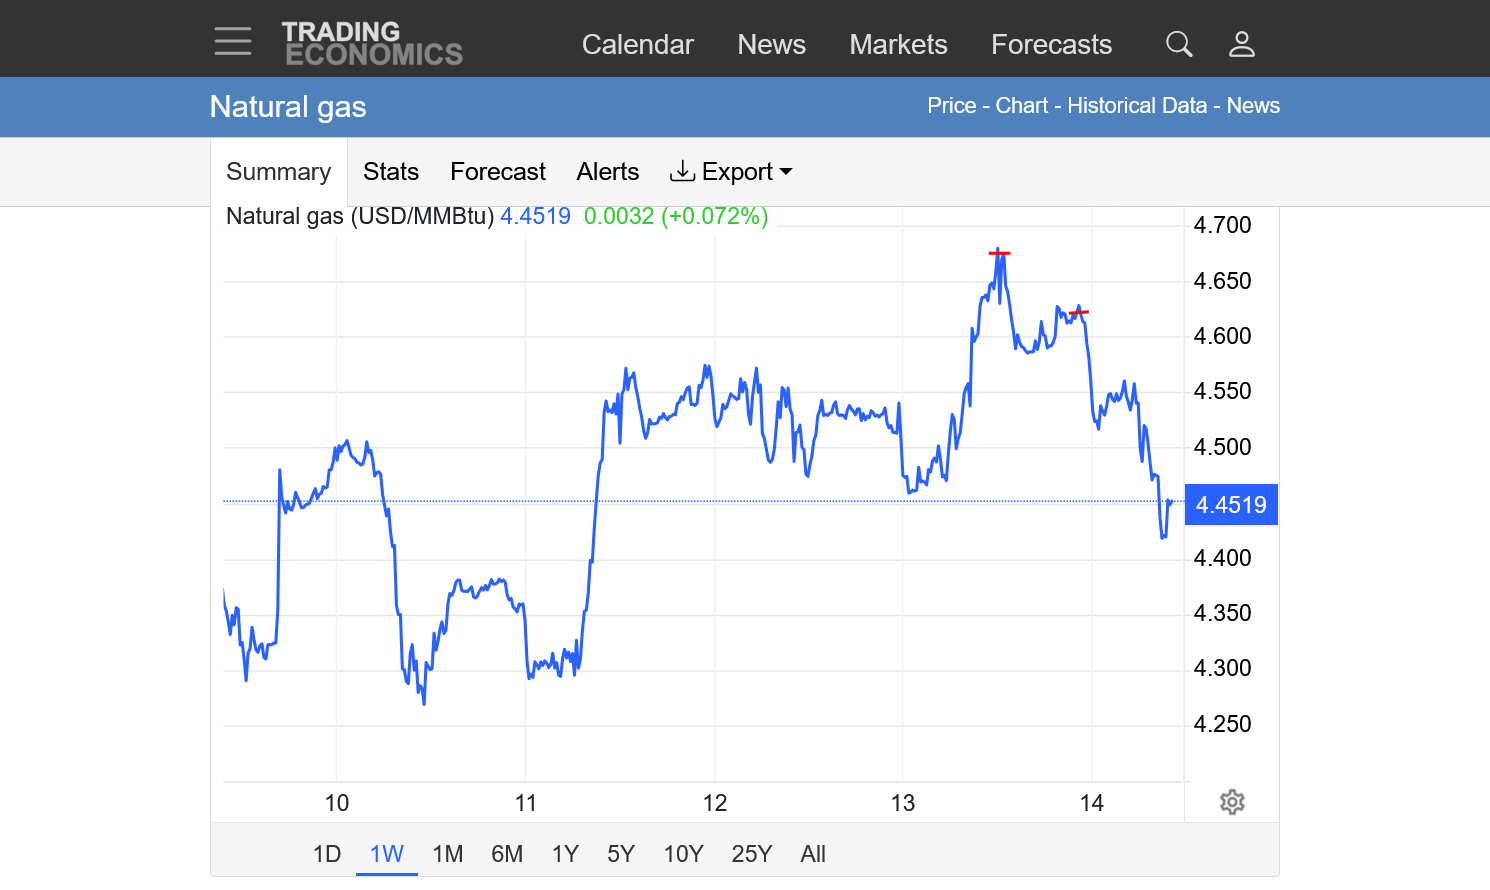
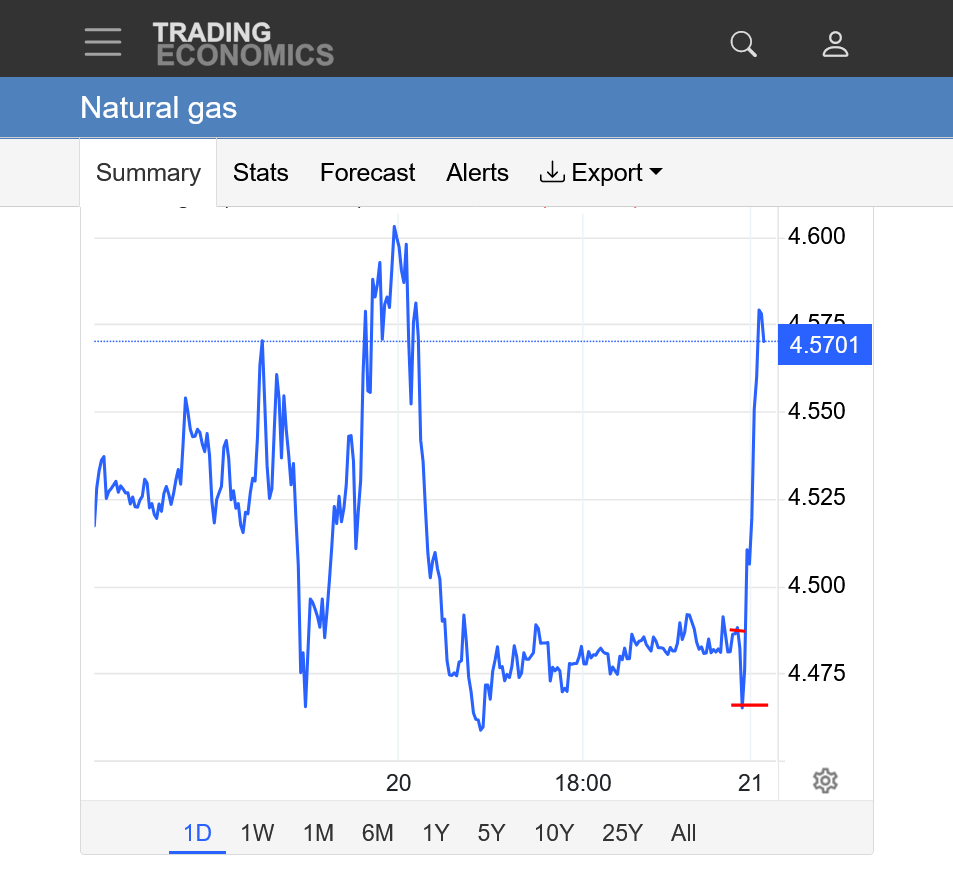
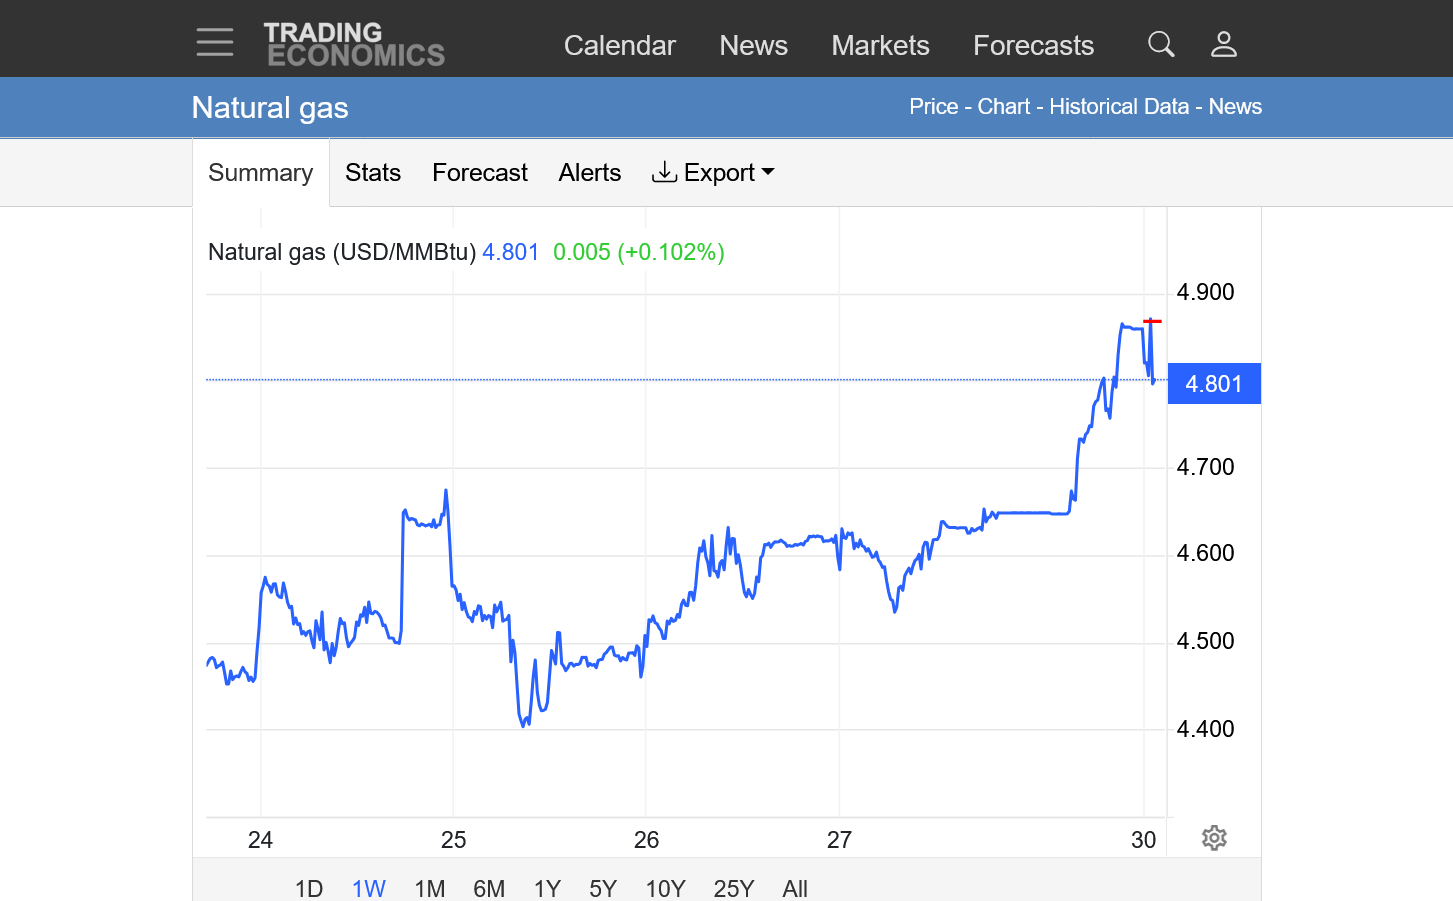
Lines on the left were the gap higher on Sundays open. Small red line top/right is exactly when the bearish part of the 6z GEFS started coming out. Ending up a whopping -15 HDDs vs the previous 0z run as shown above in my 7:10 am post. This triggered the price collapse! Bottom red line was the lows for both Friday and Today.
Prices are almost to mid-range with 1 hour to go.
Not surprisingly, Natural Gas Intelligence is clueless about how the mega bearish, -15 HDD change in the 6 GEFS run triggered the huge drop in prices.
This is not that unusual. These people DO NOT TRADE based on their articles and its their jobs to have an explanation every day for why the priced moved and nobody fact checks them. They don't actually look at the weather themselves.
Today is one of their worst reports. They posted earlier, after the crash about higher prices and now they don't acknowledge the weather in this extremely sensitive weather market.
I agree that the market was overbought, which was exactly one of the several factors I identified in the perfect trading set up for selling, that made it so vulnerable to the crash that was so far and fast ON THE WEATHER.
As you know, no market trades X in price for every Y in fundamentals on an hourly or daily basis.
Averaged over weeks and months, yes.
But in the short term, markets get way overdone in one direction and then correct with an extreme over reaction in the opposite direction when the actual trigger might not justify the actual magnitude of the correction.
NG is a perfect example. It went too high recently and for sure with the over reaction gap higher last night that really surprised me too. So it was ripe for a correction/spike down from the massive --15 HDD reduction.
NG trading when the weather models go back and forth can throw off faulty signals. Today's was a pretty powerful gap and crap exhaustion gap at the end and top for a long move higher that really took off almost a month ago.
But much colder weather can flip it back, especially since the MJO, La Nina and models are all in good agreement on the change to much colder later this month(after a 2 week warm up).
This cold blast right now will be extremely short lived and is not really part of a pattern. The one coming at the end of the month is likely to last MUCH longer into November/December.
Moderate that cold at all and I think today was THE top.
More interesting reactions to weather overnight.
https://tradingeconomics.com/commodity/natural-gas
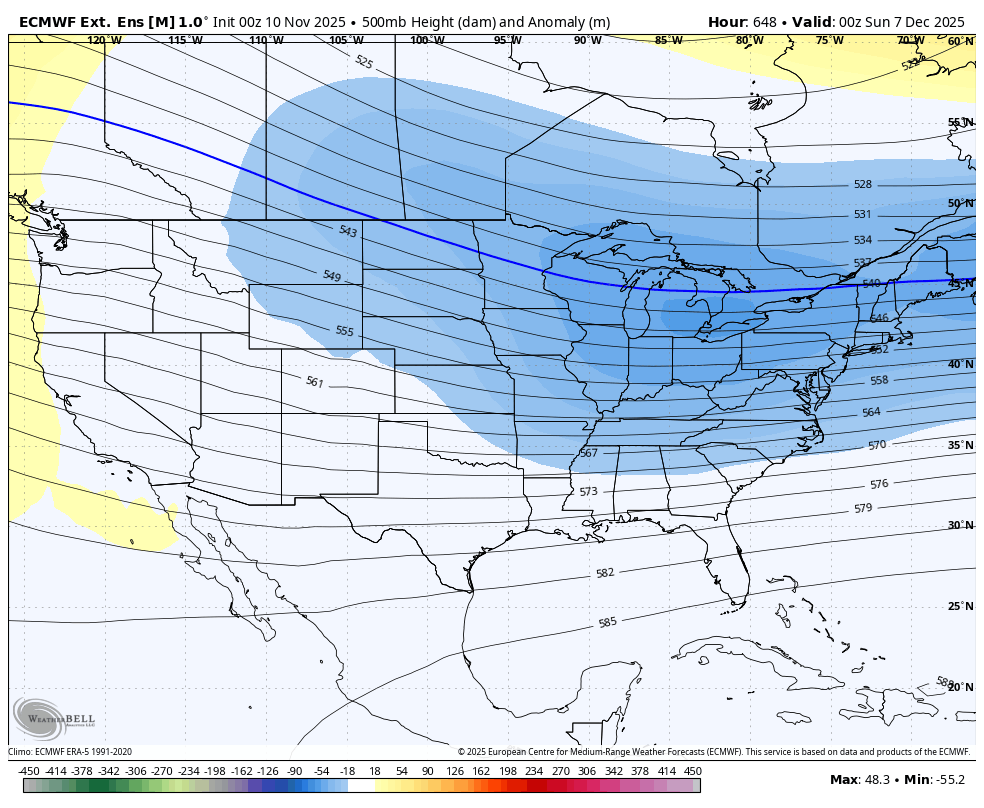
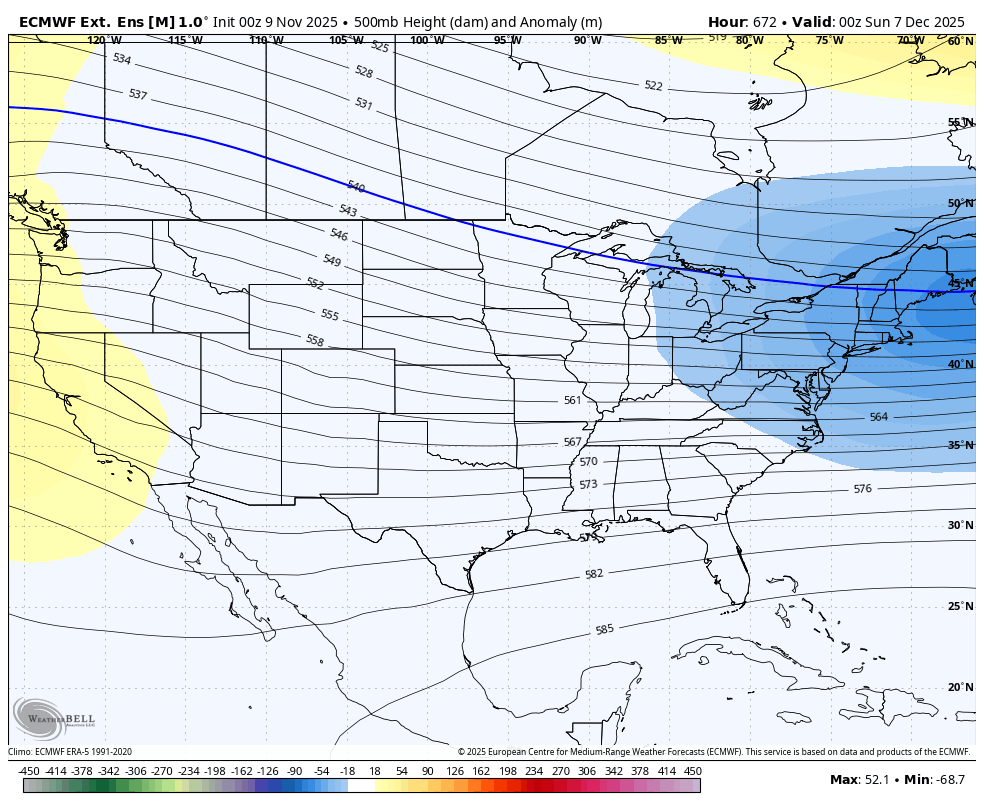
1. Center" 0z guidance came out MILDER. Especially the EE that was -7 HDDs. This spiked us down to support.
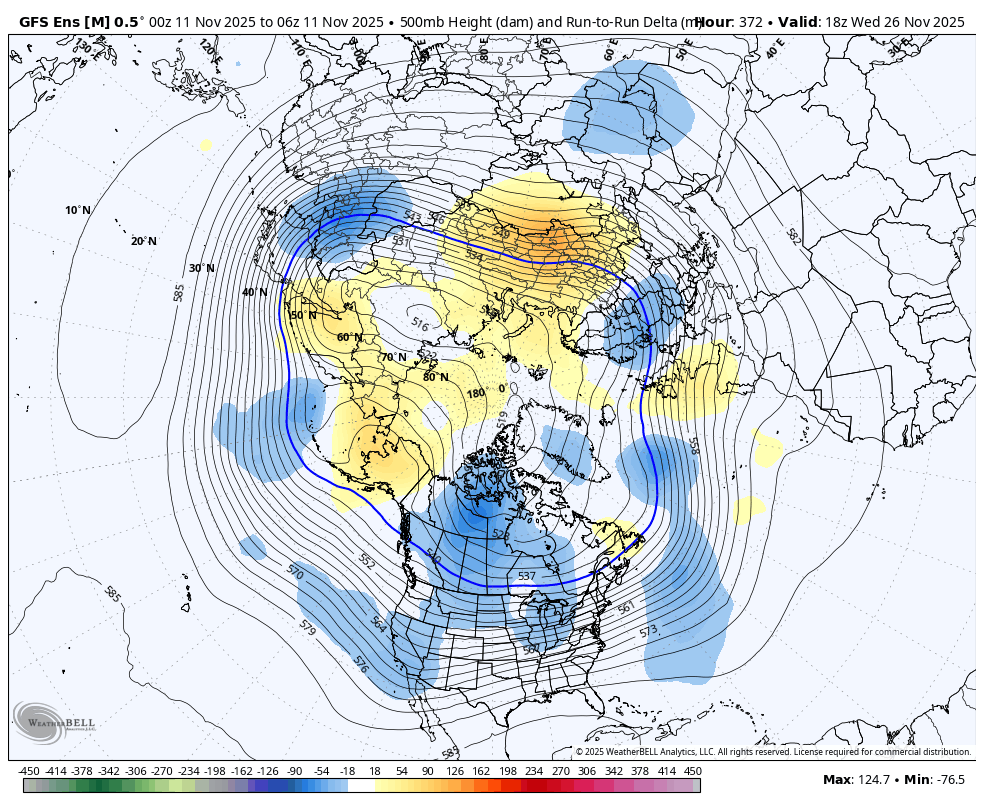
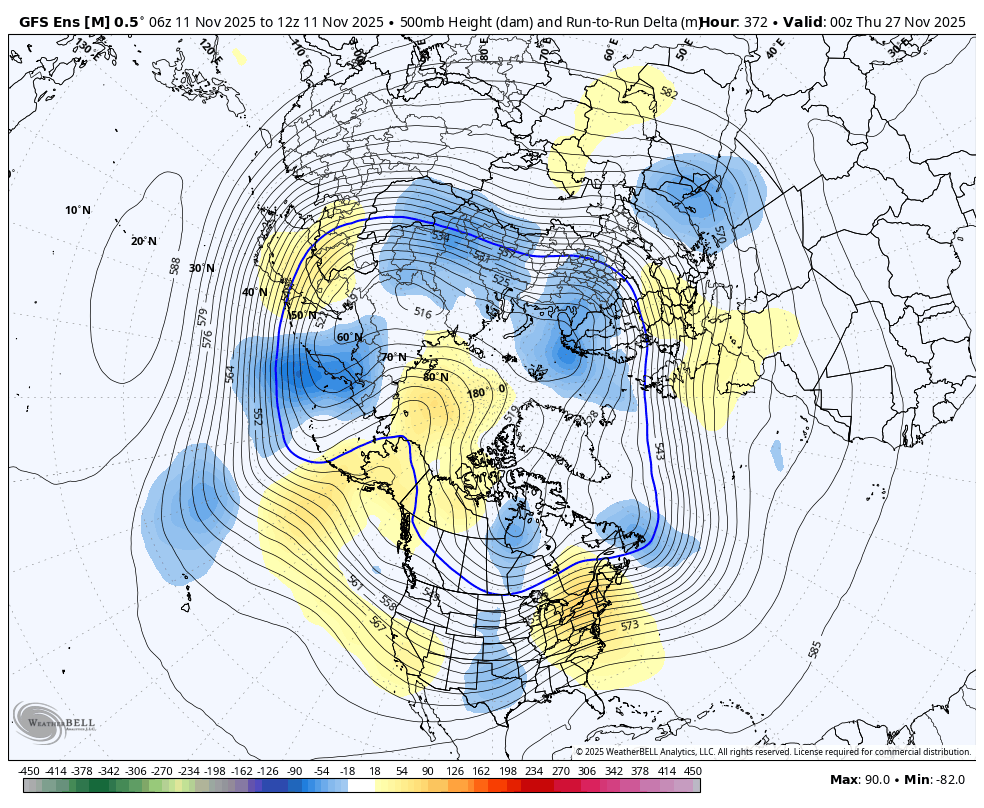
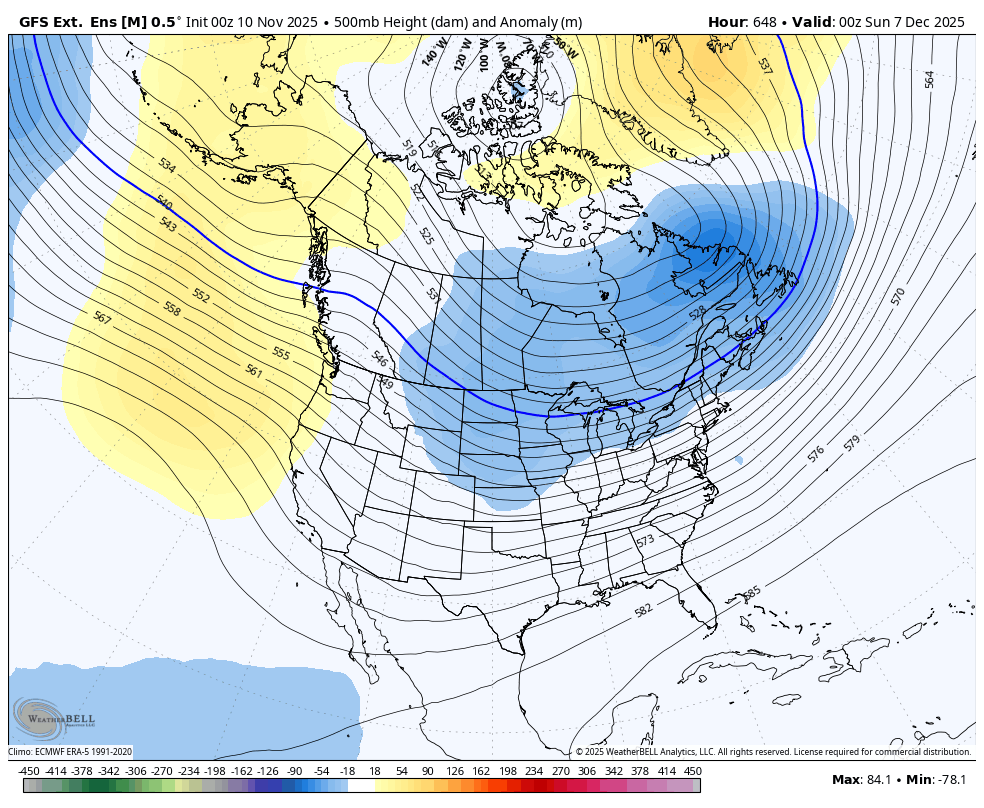
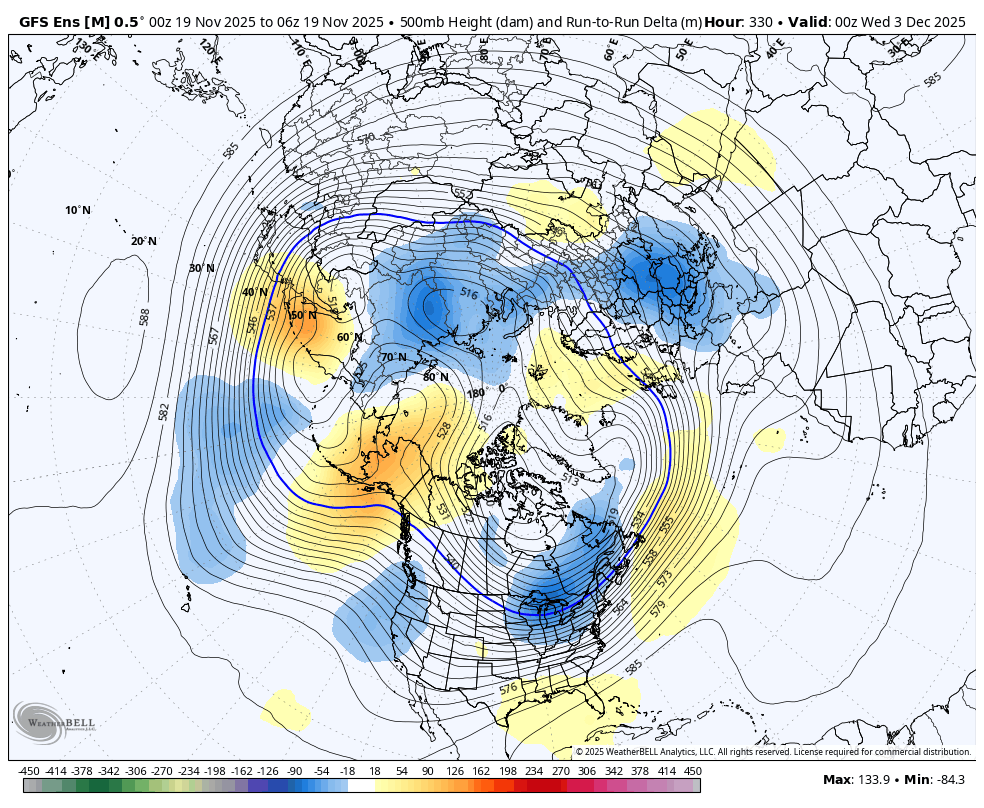
2. The 6z GEFS did NOT have more HDDs, but get a load of the solution for North America at the end of the model run, mainly Alaska/Canada at the bottom. This is a classical set up for cold air delivery into the US! This is THE ANTICIPATED change to MUCH colder which has been supporting ng for weeks. 2nd from bottom map.
3. This was the previous run that looked much milder then, very bottom map.
++++++++++++++++++++
Milder 0z EE that helped spike us lower but we held support after that.
++++++++++++
GEFS weather model at the end of 2 weeks below:
1. Last 6z GEFS: Here comes the Arctic blast set up. Ridge building in Alaska, heights dropping downstream in Canada(upper level trough digging south) to N. USA. This is potentially very bullish/cold week 3 weather implications. Very impressive. The colors are the changes vs the previous run 6 hours earlier. Yellows are increases in heights. Blues are decreases.
2. Previous 0z run: Not so amplified and not the same ridge-northwest/west-trough/southeast couplet at higher latitudes as the top image from the last run.
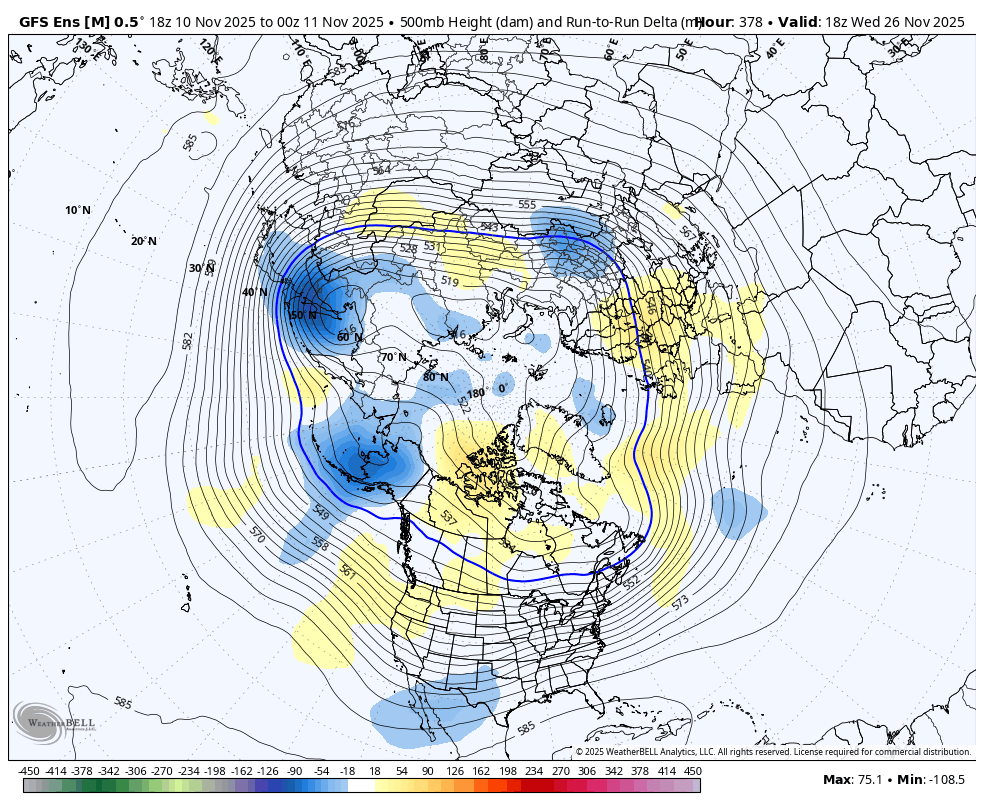
As mentioned yesterday after the powerful, gap and crap buying exhaustion and top formation. We can change overnight if the weather turns colder and the last 6z GEFS is looking mighty cold as we head into week 3, which is the long expected pattern change to much colder.
This has completely trumped yesterday's chart formation. In sensitive weather markets, the weather forecast MAKES the formations. When the weather forecast changes, NEW formations are etched out on the price chart. If the weather forecast flips from colder to warmer, then back to colder. The chart formations and signals will whipsaw position traders that key off of the signals they get from price chart formations.
When the weather forecast changes continue in the same direction, that's the best time to apply "the trend is your friend" on all time frames as well as use price formations to determine whether to be long, short or stay on the sidelines.
This WAS a selling set up for me last week and Sunday/early Monday but that short came to fruition with a huge spike lower on Monday Morning. It was based on being way overbought from cold weather forecasts for several weeks and the trigger was a model forecast that was MUCH MILDER. That happened with the 6z GEFS on Monday morning and we dropped $2,000/contract lower.
Since that has been completely negated with a very bullish, complete recovery on Tuesday and the last maps look very cold and I believe that it WILL turn much colder in week 3, I'm neutral but can't help but have a shorting bias from the set up(seasonal tops are frequent in November).
Only shorting if models turn decidedly less cold, like Monday's 6z run. Buying will be tough for me up here because everybody is already long on cold. However, major, long lasting cold early in the season can take us far higher than you might expect.
++++++++++++++++
10:12am:
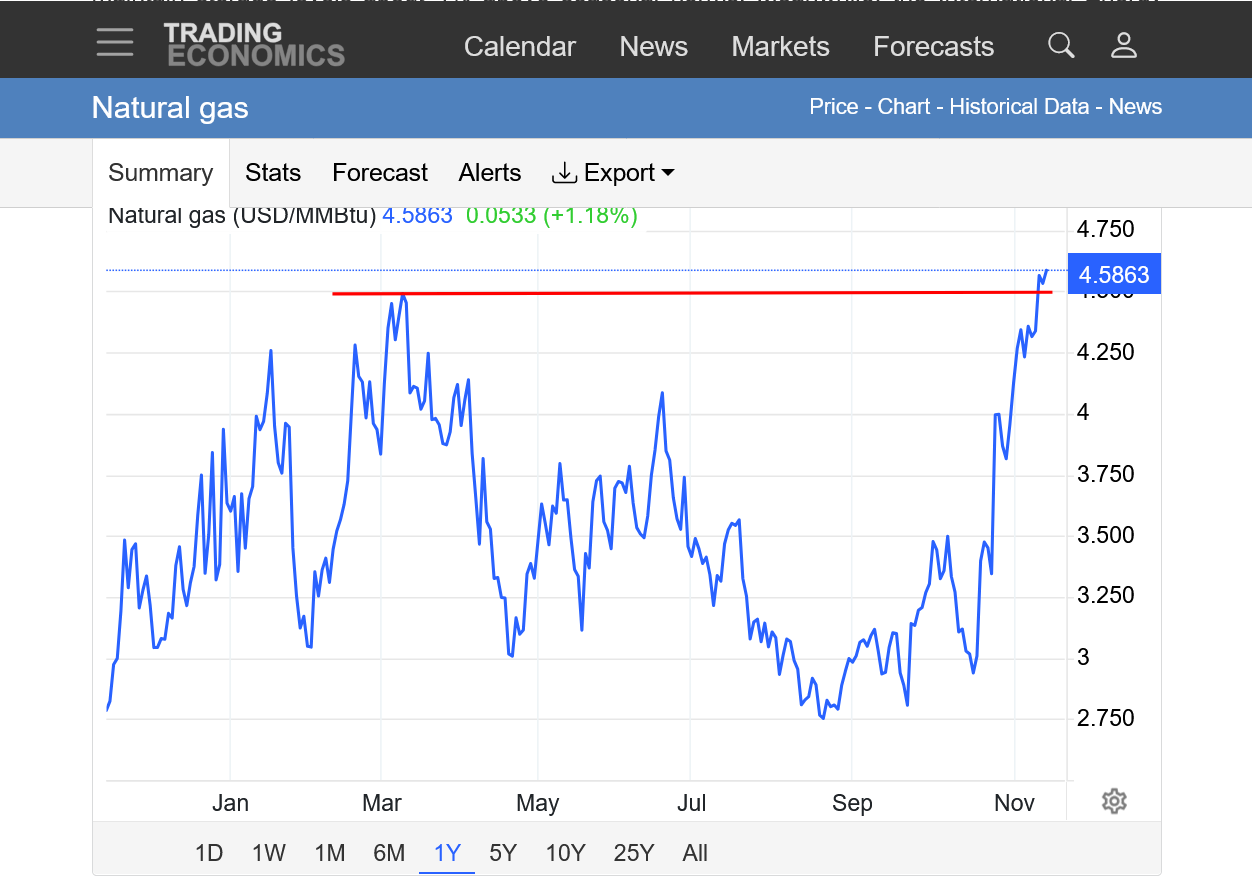
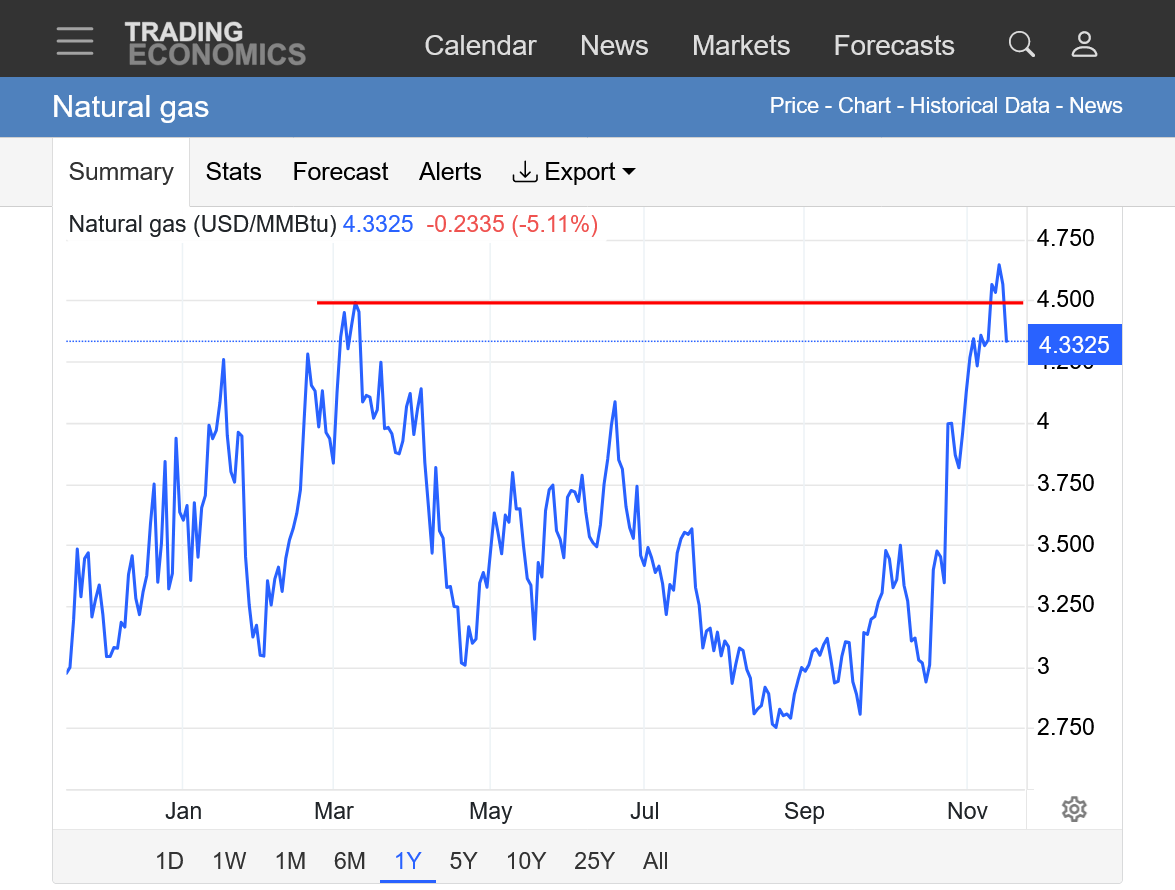
Potential upside breakout from longer term resistance!
The market is focused on a longer term pattern change to much colder towards the end of November.
https://tradingeconomics.com/commodity/natural-gas
1. 1 year
2, 10 years
Honestly, the key is always to remain open to the possibility of being wrong, especially in weather markets.
Posting here helps me to do that. Yesterday, for instance if I didn't post stuff here, my personal bias would have been pretty convinced the gap and crap buying exhaustion Monday meant that ng was toast and to look for a place to get short.
However, since I DO post and it very often causes me to think harder about things because people are reading them, it caused me to better appreciate the big picture weather outlook and Monday's spike low could have just been an anomalous, short term overbought spike lower.
greenman told me numerous times, 2 decades ago that this was a big reason for him to post trades here. He said it caused him toSp be more disciplined.
1 trader here posts to get attention as the worlds greatest trader, that's the opposite of what I'm referring to. Others do it to share their valuable insights.
For me, sometimes its a pain when I'm trying to actually trade. However, sometimes it causes me to think harder about what I say or type because other people are reading it and I want them to benefit, not get misled.
This can end up benefiting me too!
As a chess coach, this is the principle that I teach more than any others to kids, who are impulsive by their nature.
Before making your next move:
1. Place the most importance on what your opponent did last. That is your best clue about what they are thinking/planning.
2. If you see a great move immediately. DON'T TAKE IT right away!!! Take several minutes to find A BETTER MOVE! Sometimes you will find it and gain something BIG! If you don't find a better move, THEN take that move with nothing lost(unless you're playing blitz chess on a clock-which means you should move fast).
This also applies to everything in life. If we are having an emotional argument with somebody and say hurtful things in anger impulsively, even though you can apologize later, it hurts your credibility and it hurts the other person. Once those words come out, you can't take the hurt they cause away. Instead, keep them in your head and think about the consequences later on of saying hurtful things now.
With regards to actions like that. A golden rule to live by which makes all decisions easier. Only do and say things that make you proud of you!!! Even if nobody is watching/listening, if you do something good, it makes YOU feel GOOD. If do something BAD, like tell a lie, cheat, steal etc and nobody will find out, it makes YOU feel BAD.
If doing bad things makes you feel good, then this principle doesn't work and you have a serious problem with pathological behavior and lack of a good conscience and need work on that.
Is this a ng thread or what
Based on how NG has been acting, especially the last 12 hours at least I'm thinking that the pattern at the end of week 2 REALLY MATTERS right now.
This pattern change to MUCH colder at the end of November has been forecast for many weeks now. It started after end of week 4 or so and has been marching closer and closer with the progression of time but always based on lower skill indicators (EE Weeklies, MJO, La Nina).
This week for the first time it's inside the 384 hour forecast window of higher skill models.
I do believe the 6z GEFS was the first model to pick up on it at the end of the period and NG shot up like a rocket.
The updated 12z GEFS is even more impressive. This map is the start of week 3. The ridge in Alaska that extends north, well into the Arctic, coupled with the deep upper level trough in Central Canada that extends into the central US is a classic couplet for Arctic blasts from meridional(north to south) flow. Being so far out, this can still change but its EXTREMELY bullish if its still there in a week. Things can change but the odds are greater for it to AMPLIFY with time than to go away. If it goes away, I want to be short!
If it amplifies, the only way I can buy is if there is meteoric 1 run, bullish change that energizes the bulls to buy at the market and I am one of the first ones in that new surge up.
++++++++++++++++++++++
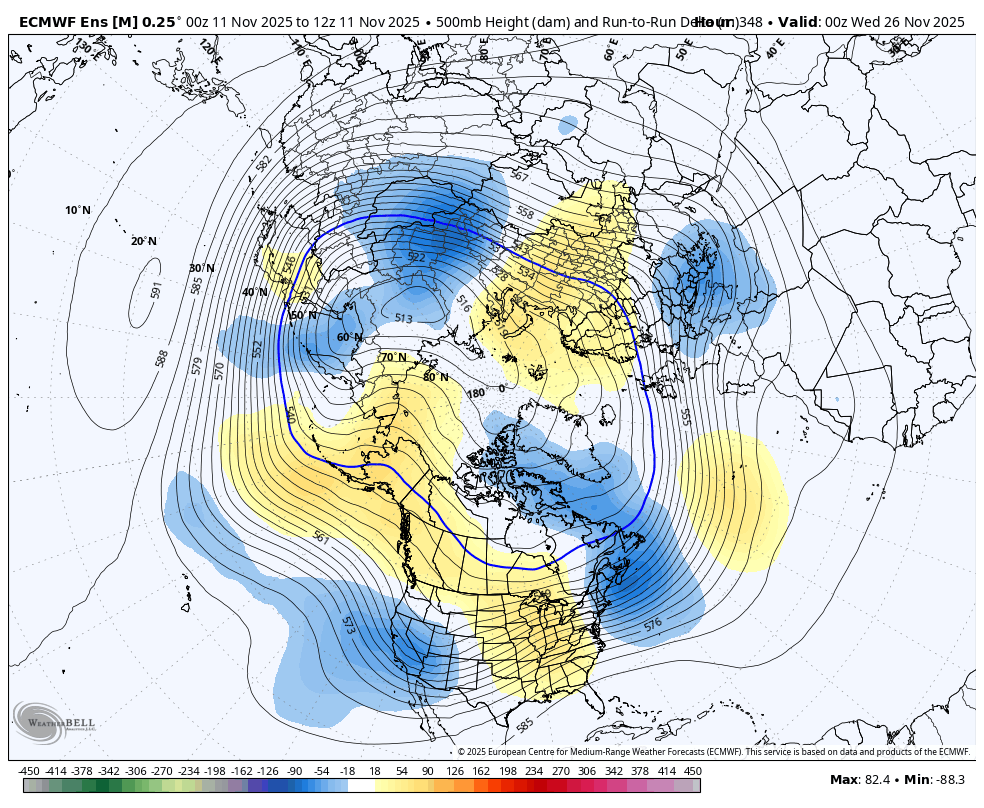
The last 12z EE model BELOW doesn't go out quite as far and doesn't have everything lined up as well as the last 2 GEFS runs but its likely going to follow the same path soon. They both have the upper level ridge building in Western North America. The EE has a strong Southern stream which is out of phase with the northern stream. It temporarily has a TROUGH-west/RIDGE east. However, this looks transient and the trough in the west, when it shifts to the east will sync the southern stream with the northern stream better.
Those maps are just THE START of a potentially much colder pattern. This evening's updated longer range GEFS for 11-11-25 for the end of the first week in December was the coldest yet.
These are the absolute anomalies compared to average(not the change from the previous model).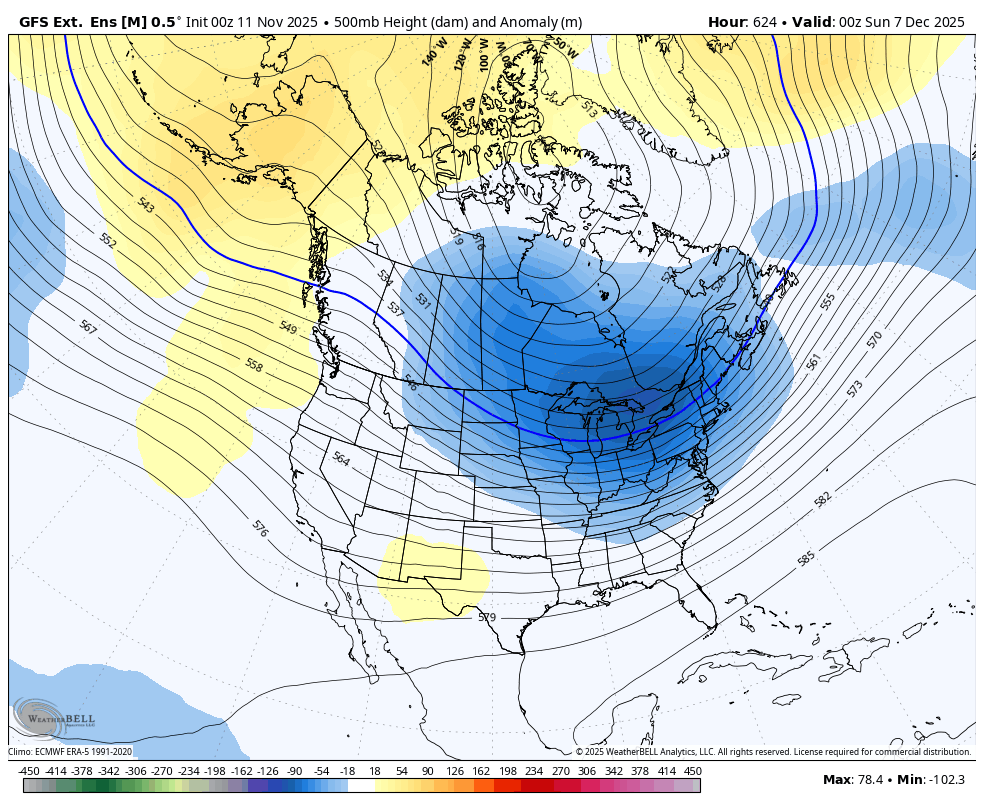
Same forecast from yesterday:
This is 624 hours from now, which is 26 days. A lot can change but if anything its been getting colder!
Some of the last 0z Canadian ensemble model, individual member solutions were EXTREMELY bullish!
https://weather.gc.ca/ensemble/charts_e.html?Hour=384&Day=0&RunTime=00&Type=gz
+++++++++++++++
What's extremely interesting is that the other overnight guidance, especially the EE HDDs was very bearish!!!
However, the market doesn't buy this because the overall pattern and indicators are strongly suggesting a change to extreme cold.
-9 HDDs below!! We spiked lower immediately but came roaring back.
https://tradingeconomics.com/commodity/natural-gas
Red line is when this bearish HDD guidance came out:
The updated 12z Canadian model has gone from being the coldest model already 12 hours ago to BEING EVEN COLDER. Holy Cow!!!
https://weather.gc.ca/ensemble/charts_e.html?Hour=384&Day=0&RunTime=12&Type=gz
https://weather.gc.ca/ensemble/charts_e.html?Hour=384&Day=0&RunTime=12&Type=pnm
The last 12z EE was a whopping +12 HDDs but seemed to have put in a buying exhaustion high afterwards. Left purple on the graphs below.
https://tradingeconomics.com/commodity/natural-gas
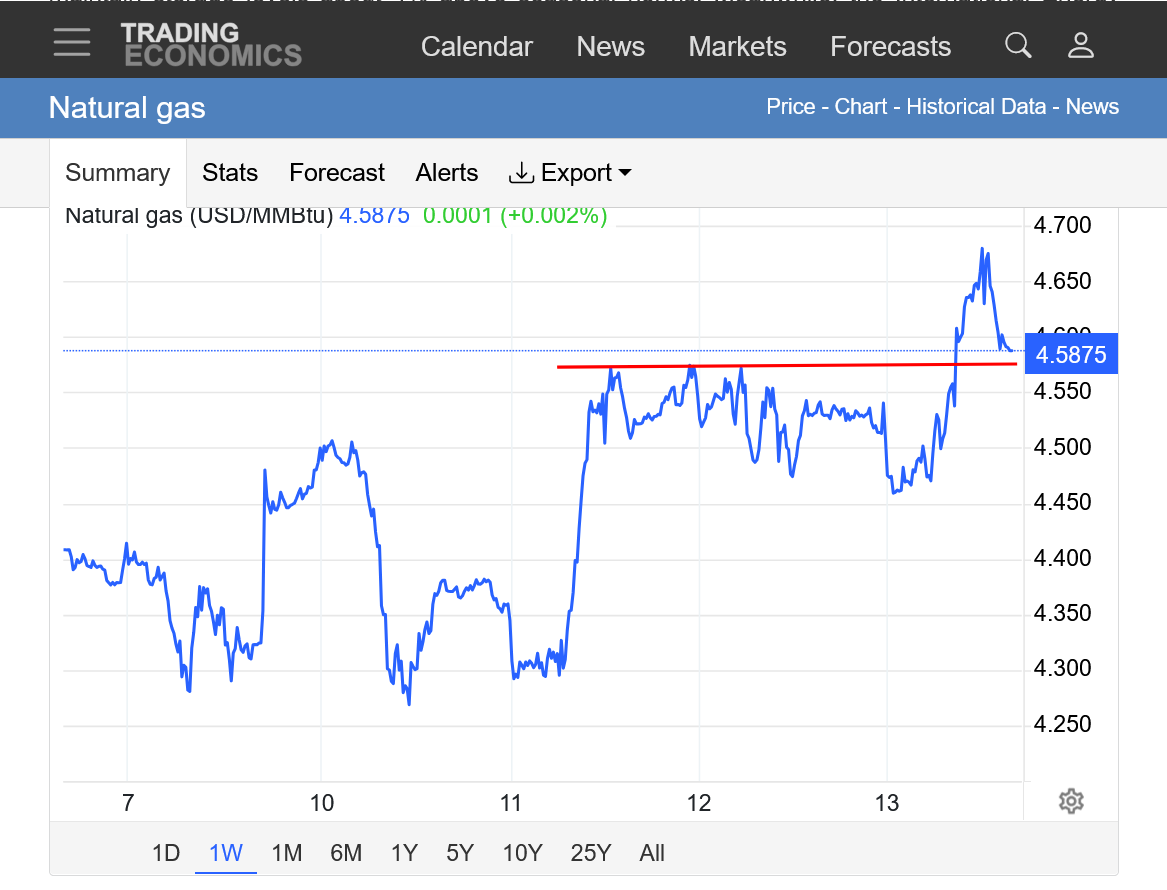
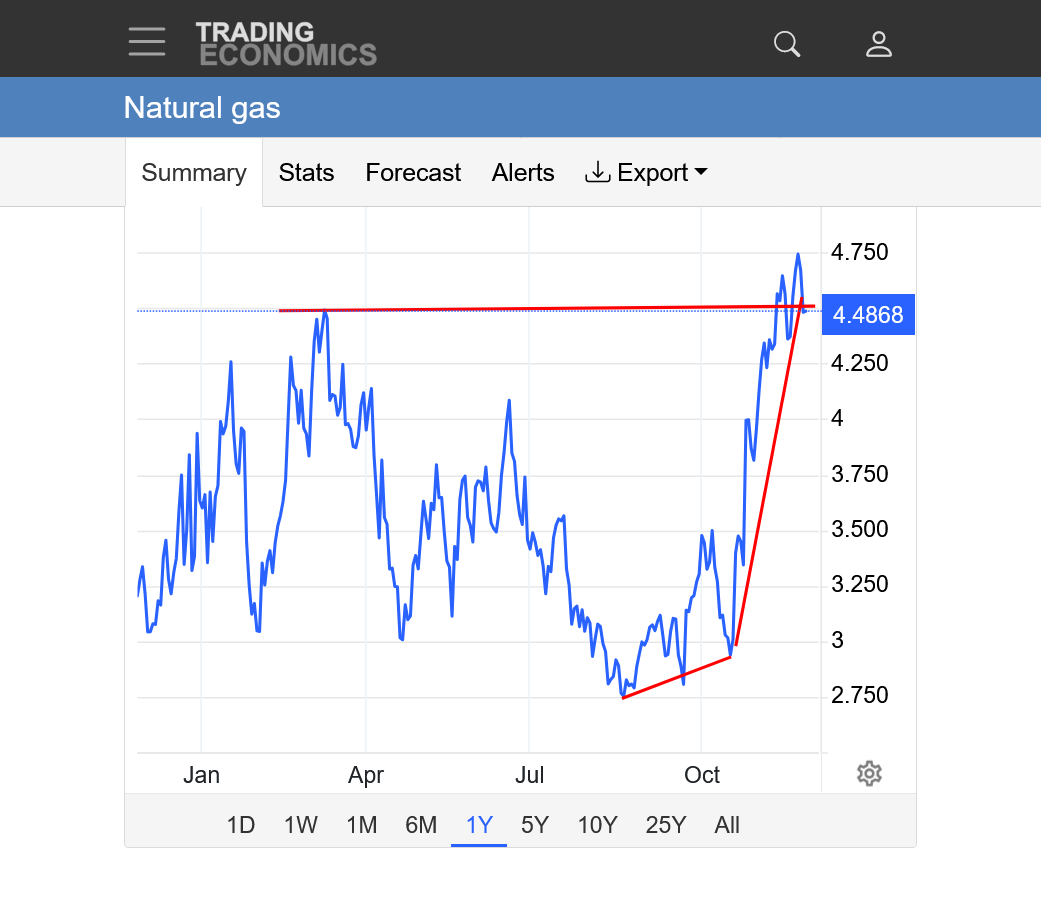
1. 1 year: Upside break out?
2. 1 week: Upside break out with potential short term exhaustion? That wasn't a great way for the market to behave after a +12 HDD forecast from the most important model! However, way up here, still 2+ weeks from the actual cold, it may be tough to keep going straight up(without big downward spike/corrections) after dialing in massive amounts of cold already.
This is a mega selling set up for me, for all the reasons mentioned before except now, EVEN MORE SO with additional risk/reward. If the cold coming late this month goes away, NG will plunge $5,000/contract fast!!
My earlier post repeated last weeks EIA report because I didn't realize its delayed 1 day this week because of the holiday. Sorry about that!
7 day temps for this NEXT weekly EIA storage report.
https://www.cpc.ncep.noaa.gov/products/tanal/temp_analyses.php
I'm thinking that next week will be the first drawdown of this heating season!
9pm: Just added this. Long term resistance and highest price in almost 3 years!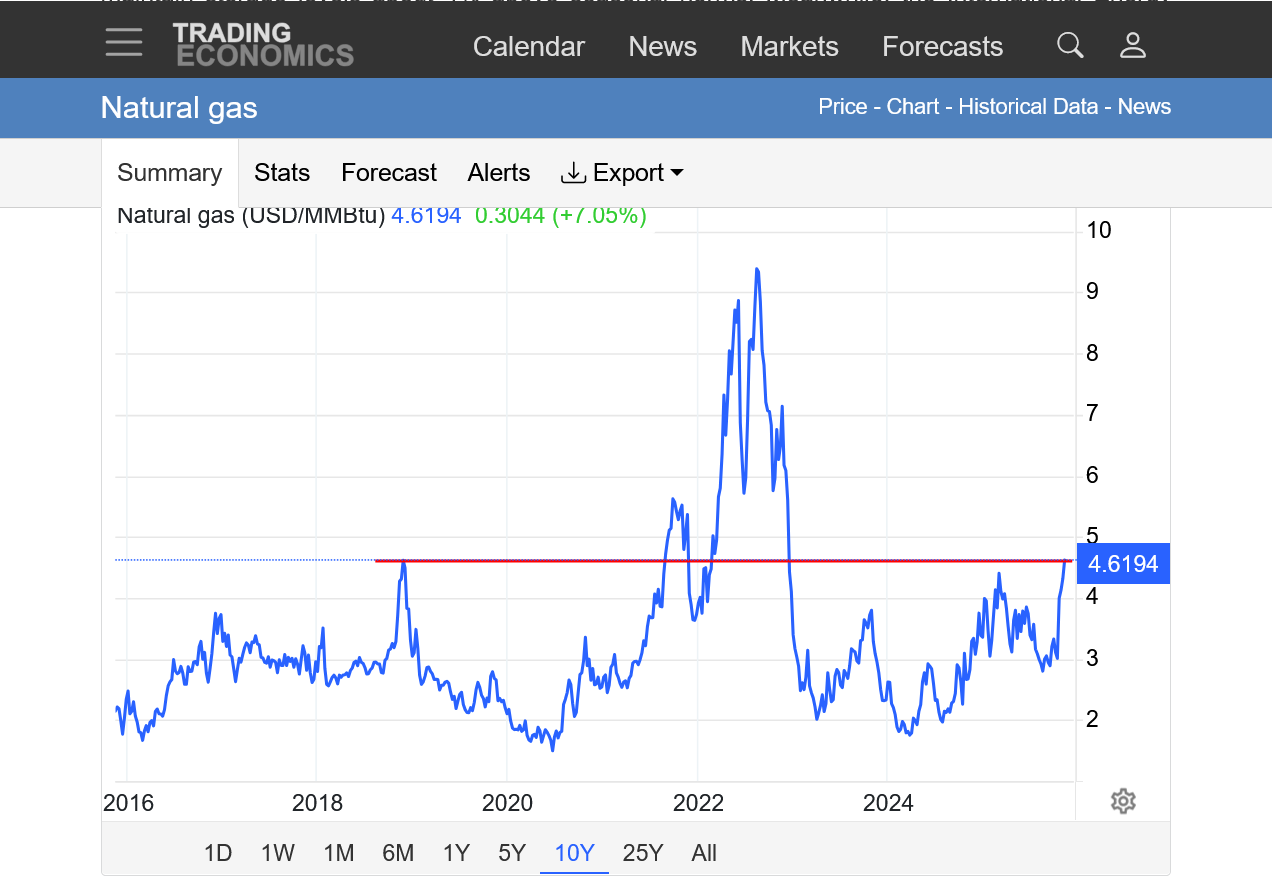
There could be something else going on too. Trump killing green energy, which has reduced wind energy and might increase the demand for natural gas and we are pushing ng exports???
Mr. cheap fossil fuels isn't looking so great in the natural gas market right now or with the bullish EIA report below.
++++++++++
This was 10 months ago and price projections like this tend to display poor skill anyway:
https://www.eia.gov/todayinenergy/detail.php?id=64344
+++++++++++++
Nat Gas Intelligence reporting this, makes me especially wanting to SELL!
Release Date: November 12, 2025
NG is having a massive down day for 2 reasons mainly.
1. Yesterdays buying exhaustion signal we showed you. The 12 EE came out MEGA bullish and the market actually sold off after that. 1st red line below. Bull markets that can't go higher anymore on the most bullish news yet have exhausted the buying.
2. The following 0 EE below came out SUPER MEGA bearish and down we went. 2nd red line below. I wanted to short this but the initial reaction down had already happened and couldn't sell it down there.
https://tradingeconomics.com/commodity/natural-gas
-19 HDDs on this last 0z European Ensemble model in purple on the left compared to the much more bullish previous run shown above when it came out Thursday(and the market failed to react bullishly to). That's about as bearish of a model to model run as I've ever seen!!!
By metmike - Nov. 13, 2025, 4:25 p.m.
+++++++++++++
I'm inclined to think that this was not THE top if the long range maps are correct and we turn brutally cold at the end of November with a pattern change that lasts in early December.
Take that away and this WAS the top. NG is well known for gaps on Sunday Night, just like the gap higher this past Sunday. This is a situation where the chance for a gap higher or lower is greatly amplified. The one thing that reduces that chance is the fact that our range today is EXTREMELY WIDE. ......$2,700/contract.
I'm thinking too that since that frigid pattern is still valid, unless the 12z models change to much less cold ,that we could close in the upper part of the range today. .....despite the massive drop.
This will be the most important weather weekend for ng since, at least last Winter, maybe longer. I was short for a tiny profit daytrade last Friday and considered being short just 1 contract over the weekend and would have been crushed on the open Sunday Night with my shorting bias. Instead, getting lucky and shorting 5 contracts on the Sunday Night open(highs for the evening) lucked me into a small profit.
So timing IS EVERYTHING!!! If I had been short over the weekend, I would have been looking to buy it back on Sunday evening to reduce my loss. Instead, I did the opposite by shorting Sunday evenings open and covering with a profit.
This is what happens in an extremely weather sensitive market WHEN THE WEATHER FORECAST CHANGES! When the weather forecast stays the same, position traders make the most money by using "the trend is your friend" and letting the continuous bullish or bearish forcing from weather keep the price going in the same direction overall.
Overall, despite these violent, short term corrections from a milder model run(s), the trend is still SOLIDLY UP!
+++++++++++++++++
Considering how brutally cold the models look for early December, I'm actually more inclined to be LONG over the weekend and DEFY the huge selling set up. If it does turn this cold, I feel confident that NG could spike up another $10k/contract and could start next week with a gap higher.
However, too much of that cold is in the market and everybody knows about it and has been trading it for so long that if the weather models do what weather models sometimes do..........change, especially over a weekend to milder, the bulls covering by itself will contribute to $X,000/contract lower in a flash and it will gap way lower on the open.
Another way to look at it from the bullish side that is powerful. On Sunday, 2 mild days at the front end of the forecast will be replaced by 2 MUCH COLDER days at the end of the forecast. In other words, 2 days closer to the frigid pattern. I don't care how much we've gone up the past month, if that much cold really hits, with near 100% certainty we still have a long way to go up as it gets closer and closer. +$10k/contract is reasonable if it lasts for 2 weeks.
I forgot about the EIA being delayed a day.
+45 Bcf in early November is pretty bearish!
https://ir.eia.gov/ngs/ngs.html
![]()
for week ending November 7, 2025 | Released: November 14, 2025 at 10:30 a.m. | Next Release: November 20, 2025
| underground storage, Lower 48 states Summary text CSV JSN | |||||||||||||||||||||||||
|---|---|---|---|---|---|---|---|---|---|---|---|---|---|---|---|---|---|---|---|---|---|---|---|---|---|
| Historical Comparisons | |||||||||||||||||||||||||
| Stocks billion cubic feet (Bcf) | Year ago (11/07/24) | 5-year average (2020-24) | |||||||||||||||||||||||
| Region | 11/07/25 | 10/31/25 | net change | implied flow | Bcf | % change | Bcf | % change | |||||||||||||||||
| East | 914 | 909 | 5 | 5 | 942 | -3.0 | 917 | -0.3 | |||||||||||||||||
| Midwest | 1,117 | 1,105 | 12 | 12 | 1,139 | -1.9 | 1,106 | 1.0 | |||||||||||||||||
| Mountain | 290 | 288 | 2 | 2 | 291 | -0.3 | 242 | 19.8 | |||||||||||||||||
| Pacific | 321 | 318 | 3 | 3 | 312 | 2.9 | 285 | 12.6 | |||||||||||||||||
| South Central | 1,318 | 1,296 | 22 | 22 | 1,282 | 2.8 | 1,238 | 6.5 | |||||||||||||||||
| Salt | 353 | 341 | 12 | 12 | 345 | 2.3 | 332 | 6.3 | |||||||||||||||||
| Nonsalt | 965 | 955 | 10 | 10 | 938 | 2.9 | 906 | 6.5 | |||||||||||||||||
| Total | 3,960 | 3,915 | 45 | 45 | 3,966 | -0.2 | 3,788 | 4.5 | |||||||||||||||||
| Totals may not equal sum of components because of independent rounding. | |||||||||||||||||||||||||
Working gas in storage was 3,960 Bcf as of Friday, November 7, 2025, according to EIA estimates. This represents a net increase of 45 Bcf from the previous week. Stocks were 6 Bcf less than last year at this time and 172 Bcf above the five-year average of 3,788 Bcf. At 3,960 Bcf, total working gas is within the five-year historical range.
For information on sampling error in this report, see Estimated Measures of Sampling Variability table below.

Note: The shaded area indicates the range between the historical minimum and maximum values for the weekly series from 2020 through 2024. The dashed vertical lines indicate current and year-ago weekly periods.
++++++++++++++++++++++
The JOURNALIST from Nat. Gas Intelligence's price reaction description after the report got it exactly............WRONG!
The U.S. Energy Information Administration (EIA) on Friday reported an injection of 45 Bcf natural gas into storage for the week ended Nov. 7. The result exceeded expectations and the five-year average build of 35 Bcf. Nymex natural gas futures struggled to find their footing after the print.
++++++++++++++
What REALLY happened is that upon the very bearish release, NG spiked down for just SECONDS and was already on the way back up less than a minute later and has been going up since then.
As mentioned previously, these REPORTERS don't actually trade and they are paid to SAY SOMETHING, often with no accountability when it comes to the price reactions and reasoning for them.
https://tradingeconomics.com/commodity/natural-gas
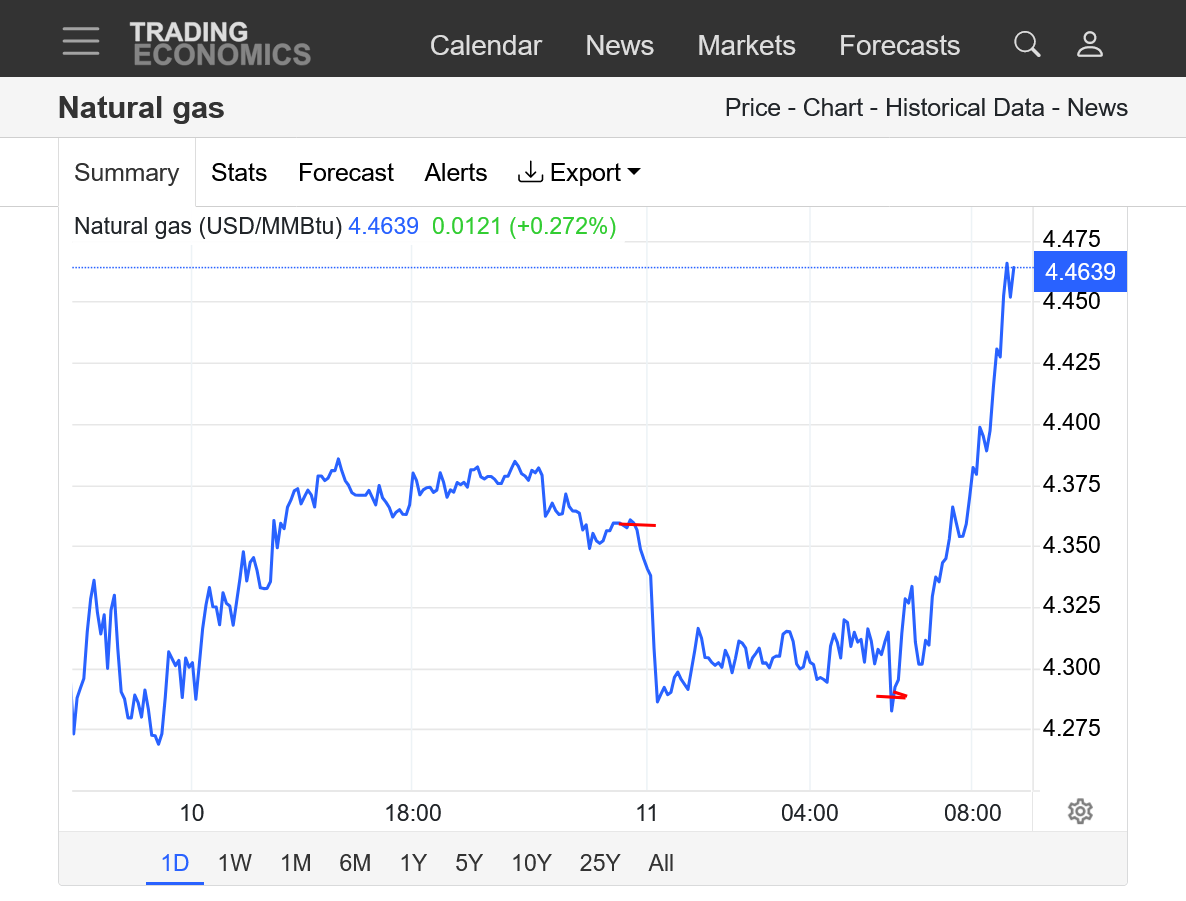
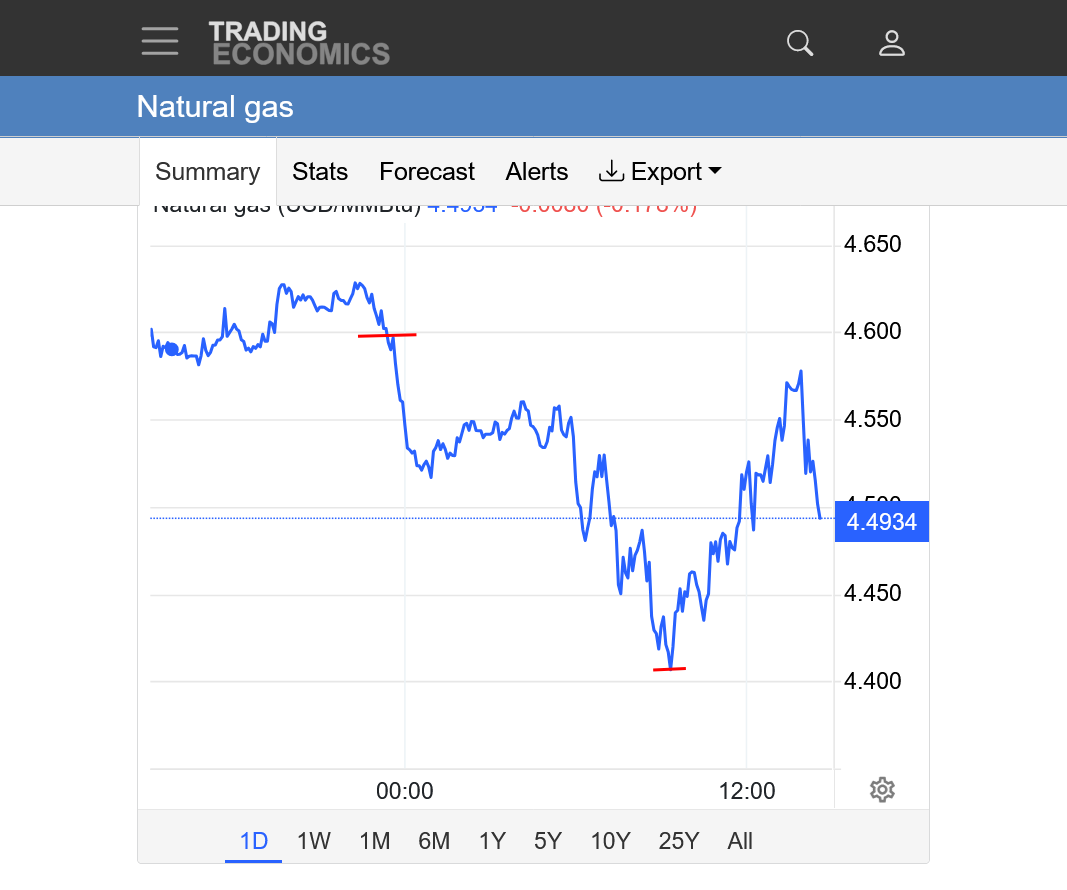
1. 1 day chart. Red line at the top is when the much milder(less HDDs) 0z models starting coming out.
Red line at the bottom was THE low which happened a few seconds after the EIA was released at 9:30am..........and it was UP after that.
This will mean EVERYTHING to the market price next week as that period will be WEEK 2 in the forecast next week.
This has been traded for almost a month. There were be 2 huge factors that will be different.
1. The cold will be getting 1 day closer with each turn of the calendar page.
2. The forecasts might stay the same OR more likely there will be deviations from the previous day(s). Those deviations will determine the price direction and magnitude.
https://www.cpc.ncep.noaa.gov/products/predictions/WK34/
++++++++++
One reason that the upcoming pattern MIGHT be especially cold is that it might not just be Northern Canadian/Arctic cold but the Canadian model especially and many of the GEFS ensembles here have CROSS POLAR FLOW. The coldest air on the planet in the Northern Hemisphere Winters brews in Siberia. If this flow taps into that it would be especially cold.
Note some of the streamlines on this 12z GEFS average that are aimed into Western Canada, originate from the other side of the Northern Hemisphere. This map is for the end of November.
I almost went long before the close on Friday with moderate confidence that the cold being 2 days closer would cause a higher open on Sunday Night and chance the forecast will get even colder for the last few days that were predicted already on Friday.
This last run of the 0z GEFS and 0z Canadian model have gone the OTHER way.......a bit milder. That can change quickly tomorrow. Having the WRONG position when weather models change over a weekend wrecks the enjoyment.
I'm having a wonderful weekend with no positions and hope that you are too! The last 0z run for HDDs is in purple on the left. The milder number is just from changes for individual days.
At the end of the forecast period, the trajectory is still rising on a very steep upward slope. That's what will matter the most to traders next week. What comes after this??? That trajectory is the best indicator for week 3.
This is not the best set up for cold air delivery to the East and especially the Southeast where a lot of people using natural gas to heat their homes live. Cold in those locations is especially powerful for increasing demand and when its in the forecast, its bullish. When its not, its not as bullish.
Comments on graphs below:
1. The huge positive anomaly north of Alaska at the top is potentially very bullish but needs a strong downstream negative anomaly in the right location to complete the bullish couplet. This is NOT the ideal location below. The downstream negative is a bit too far west(so the cold will hit the West/Upper Midwest but then encounter another modest positive anomaly in the East/Southeast which will cause the Arctic blasts AT THE SURFACE to MODERATE as they track below unfavorable upper level conditions(for pushing them deeply southeast.
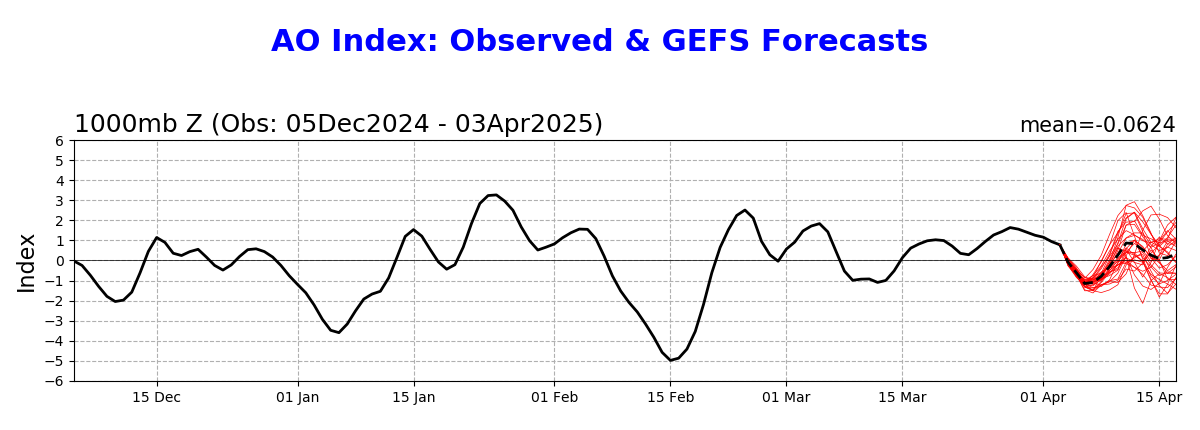
2. The Arctic Oscillation is negative(which indicates cold moving from high latitudes to mid latitudes) with a wide range that tells us of great uncertainty. To maximize this indicator it should be -2 or lower. The are several that low and this is possible but they are the minority.
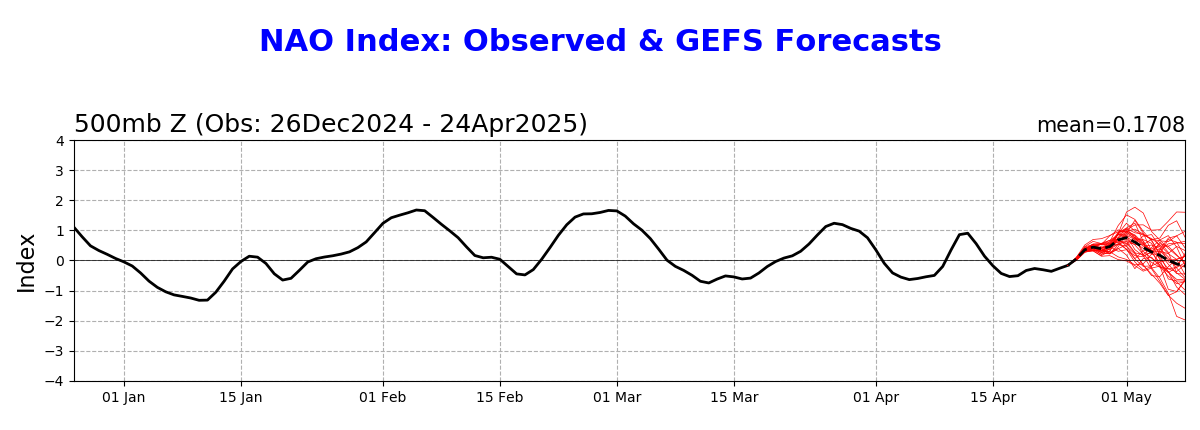
3. The North Atlantic Oscillator is around 0. It's key for major, long lived cold in the East to have this strongly negative. Currently, its unfavorable for anything but shallow, near surface and moderating cold waves.
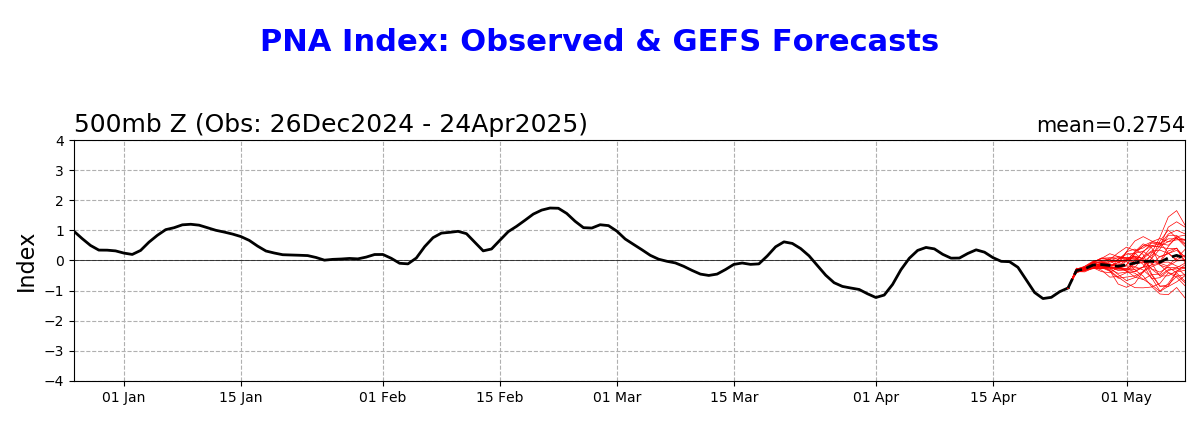
4. The PNA is solidly negative. This is UNfavorable for cold in the Southeast and FAVORABLE for cold in the West to Upper Midwest. It needs to be positive for cold air masses to penetrate deeply south in the Southeast.
5. Back to the top map. The Upper level ridge in the Southeast/East from the Southern Stream is messing everything up for the ng bulls. It's blocking the cold. The Northern Stream has tremendous potential if that Southern Stream ridge gets out of the way. This solution is A SNAP SHOT of December 1st. which is basically the first day in the week 3 forecast. As the pattern evolves, some of these features will move and change in magnitude, so the direction and amount of cold will change over time. This could still turn more bullish in week 3 or get even less bullish compared to expectations.
This guidance was from last nights 0z GEFS run. The latest 12z run, just coming out now is in fact is coming out with some colder changes. Stay tuned.
Make that MUCH colder changes at the end of the period.
https://www.marketforum.com/forum/topic/83844/#83949
https://www.psl.noaa.gov/map/images/ens/ens.html#nh
NCEP Ensemble t = 360 hour forecast 
NCEP Ensemble t = 360 hour forecast 
Arctic Oscillation Index, North Atlantic Oscillation Index, Pacific North American Index.
https://www.cpc.ncep.noaa.gov/products/precip/CWlink/daily_ao_index/ao.shtml
https://www.cpc.ncep.noaa.gov/products/precip/CWlink/pna/nao.shtml
https://www.cpc.ncep.noaa.gov/products/precip/CWlink/pna/pna.shtml
After the guidance has been coming out milder for several runs, this last 12z GEFS run was MUCH colder at the end o the period, which is the one that matters the most because its the period featuring the big pattern change.
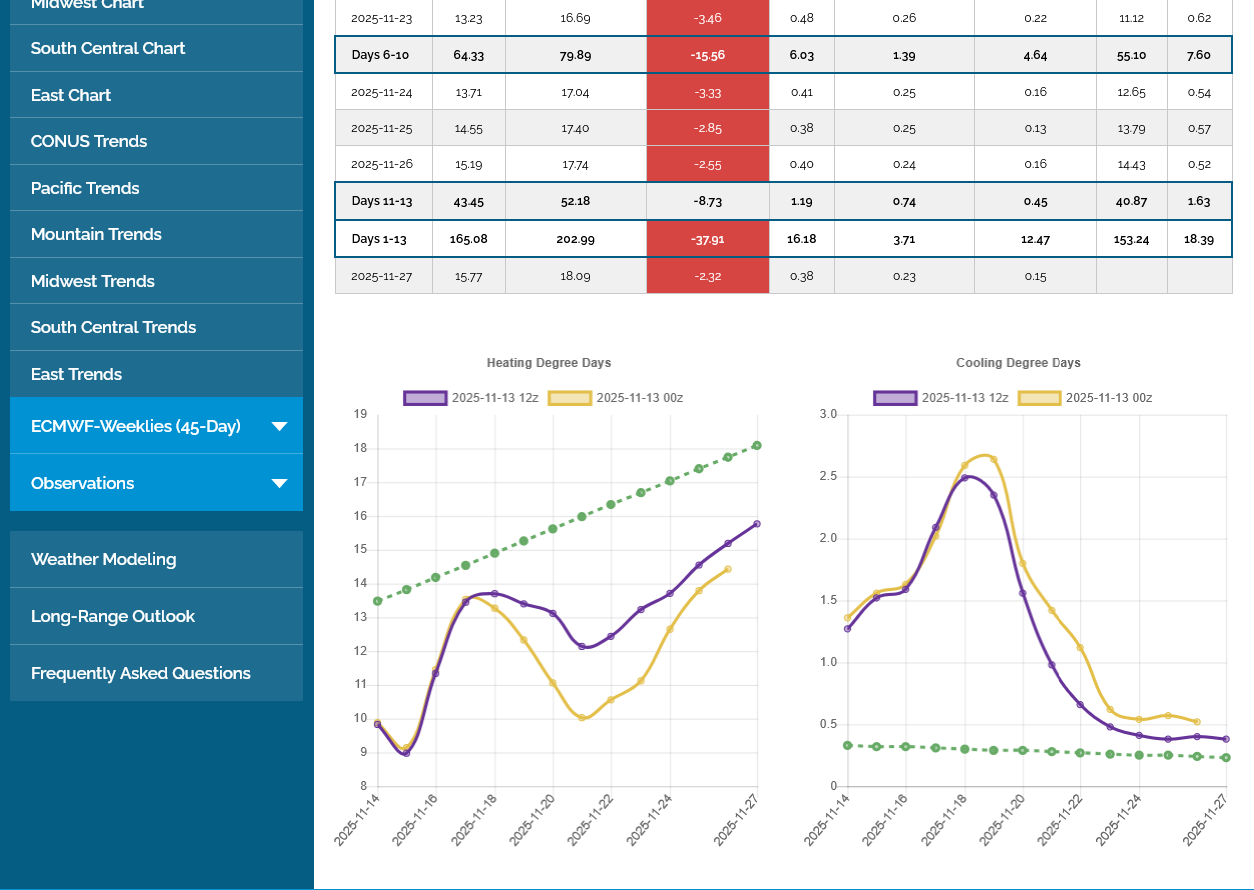
HDDs were +9 compared to the previous 6z run(which was the mildest run of the weekend), all from week 2. Its the purple line on the left. The 12z EE model is still coming out but it looks EVEN COLDER!!!!
WOW, what a shift in 12 hours! The EE model weakens the positive anomaly in the Southeast that was shown to block the cold on the previous run!!! The ridge northwest North America, trough downstream couplet is more favorable for cold deeply into the US. The negative anomaly extends to the Northeast on this December 1st solution. This will allow the cold to penetrate much farther east and deeper into the US!!!
Before this run, I would have called the natural gas open tonight lower to sharply lower. This changes things a great deal. The 12z HDDs for this EE model won't be available from my source for over an hour but I will guess they are something like +12 or even more. What do you think, Larry?
3pm: As suspected, the 12z EE HDDs were MUCH higher/bullish compared to the bearish 0z run 12 hours earlier.
A whopping +14 HDDs, purple line on the left below!
The bullish 12z runs saved NG from a huge gap lower, instead opening a tad higher than the late pm close and now just below that amd making lows for early trading. Considering this is natural gas on sunday evening with an extreme weather pattern change coming up, its incredible to open so close to the Friday 4pm close.
Model changes like the last several this week will create tremendous volatility and potential price gyrations if they contrast with previous weather guidance.
If this was 1995 and I had a satellite dish on the roof getting weather data before everybody else, I could more than double my money in a month by loading the boat on sharp weather model changes.
But it’s 2025 and there are weather savvy natural gas traders with that critical Information seconds before me.
Most of the time, I just report what THEY did and why now!
++++++++++
If the 12z runs were outliers and we go back to less cold, NG could collapse lower. To stay supported we need at least that much cold and preferably more for the bulls.
What do I think? On Friday I thought they would get colder and they got warmer on Saturday and Saturday night Instead. Then today THEY DID get colder.
So I don’t know and don’t pretend to have great insight into the next run. These changes are in week 2 and the data they are using to forecast that is coming from 2 different streams that are thousands miles away.
It’s the butterfly effect! The models use hundreds of thousands of mathematical equations and data that represent the physical laws of the atmosphere. With some pattern changes an experienced meteorologist with gifted analytical skills can sometimes whoop the models……..and at other times, the same person can get whooped.
++++++++++++++
7pm:
The red line was the open tonight, 2 hours ago.
https://tradingeconomics.com/commodity/natural-gas
Timeline using red lines.
1. Coldest EE yet came out with 12z run on Thursday just after noon and we went DOWN, suggesting a buying exhaustion.
2. Next EE run, 0z model came out MILDER just after Midnight/Friday AM, which started the crash lower.
3. 6z GEFS came out and day time big traders enter the market.
4. Spike low exactly at 9:30am on Friday with the release of the bearish EIA storage report. Big recovery after that.
5. Sunday 5pm open. Around $220/contract higher than the Friday 4pm close, thanks to the 12z Sunday models being sharply colder to offset milder weekend model solutions prior to that.
This last 18z GEFS in purple/left that finished an hour ago was -2.5 HDDs compared to the MUCH colder 12z that saved ng from a sharply lower open (so it was slightly less cold)
Hey Mike,
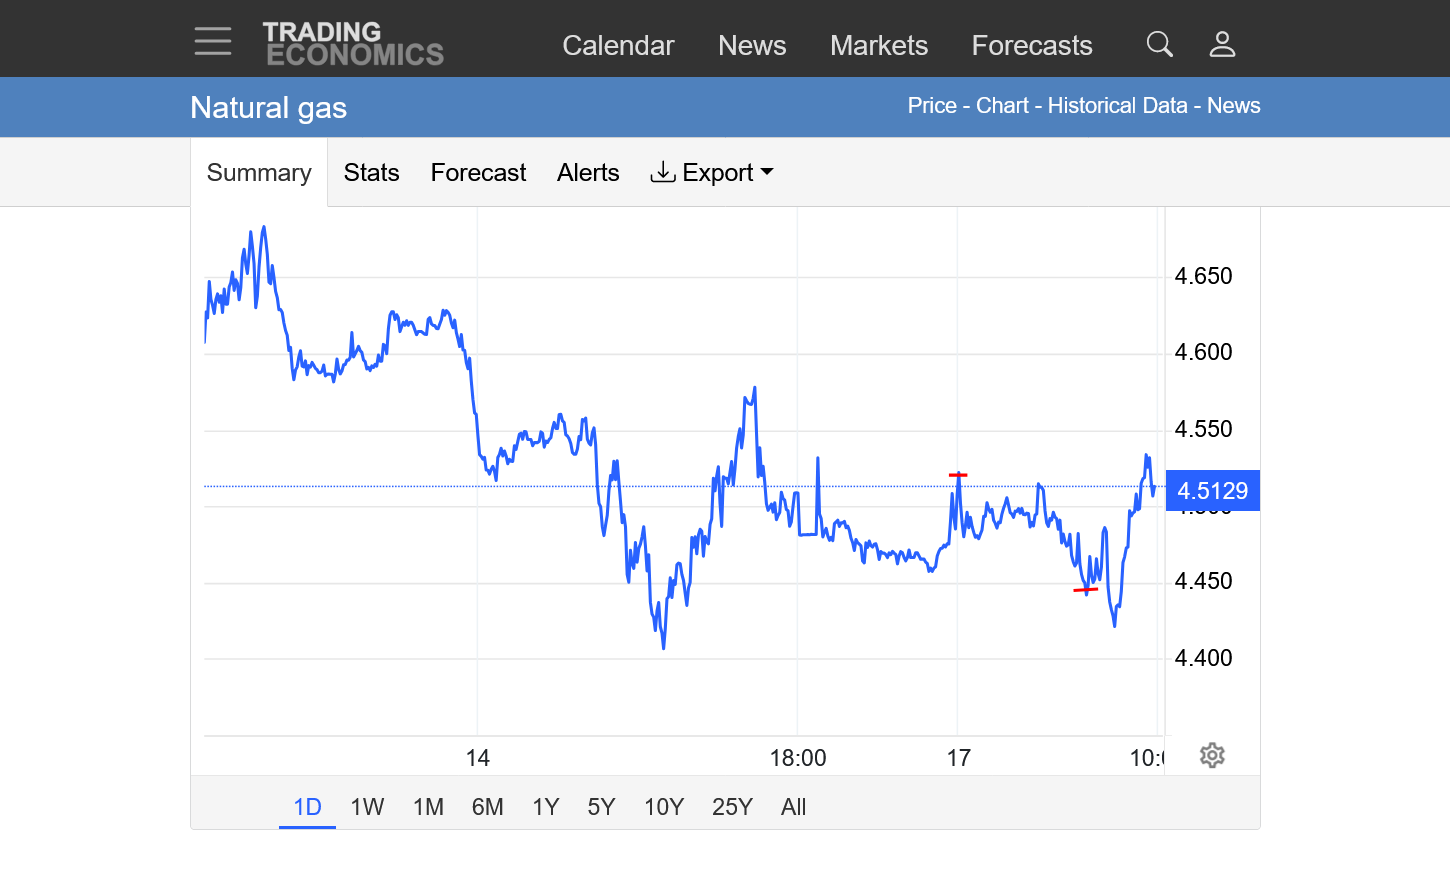
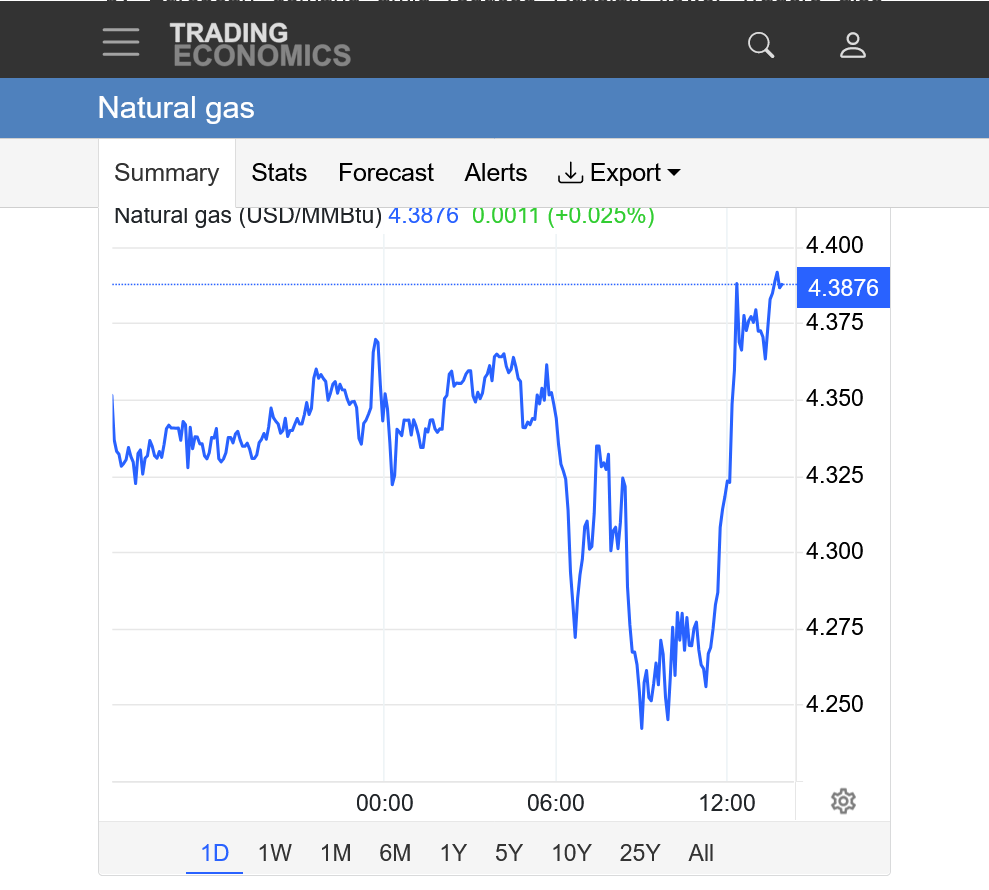
I’ve been watching in real-time as WxBell much colder 0Z GEFS week 2 have been coming out. This run is undoubtedly going to add a good # of HDD! I was curious if NG were rising and I see it has been as it rose from 4.474 at 11:34 PM CST to 4.515 at 11:46 PM, or a rise of 1% in just 12 minutes.
Then I saw that it fell sharply over 80% of that rise to 4.481 in just 4 minutes! Next the roller coaster shot back up from 4.484 at 11:55 to 4.517 at 12:01 AM and 4.522 at 12:04AM!
As we get further into late week 2, one can see that the colder in the E US will end shortly.
The market may have been looking at that because NG once again dropped sharply from 4.523 at 12:05AM to 4.477 at 12:12AM, a drop back of 1% in 7 minutes!
————-
*Edit for 6:50AM (all times CST) update (just after waking up):
NG sold off to new session lows from ~a session tying high point of 4.523 just after 4:05AM to session low of 4.438 just after 6:30AM, ~2% selloff during that period, which includes the time the 6Z GEFS maps are released. Looking at 6Z GEFS, it’s not clear to me why it would go to a session low then because it doesn’t look mild hour 276+, which is similarly colder than 18Z then though perhaps not quite as cold as 0Z then. Selloff seems counterintuitive, but NG sometimes makes what seems like counterintuitive moves to me as regards to wx models.
*Edit: new session low of 4.41 at 7:51AM: why?
Larry,
I was following too in real time when the 0Z models came out and watched the price gyrating up and down from changes in the 2 main models at different time frames. This is a nightmare for somebody like me wanting to buy on the cold, then seeing the cold just lasting for several days and it turning warm at the end and then the EE came out less cold. Then at the end of the runs........there was bullish and bearish parts of each model and it was impossible to discern a strong overall signal.
This is what caused the confusion.
The 0z GEFS was +9 HDDs which is pretty bullish.
The 0z EE was -4 HDDs which is bearish but the EE model almost always gets the most weighting.
The 6z GEFS was another +1.2 HDDs on top of the bullish previous run which trumped the 0z data and reversed us higher.
https://tradingeconomics.com/commodity/natural-gas
1. 0z data came out
2. 6z GEFS came out
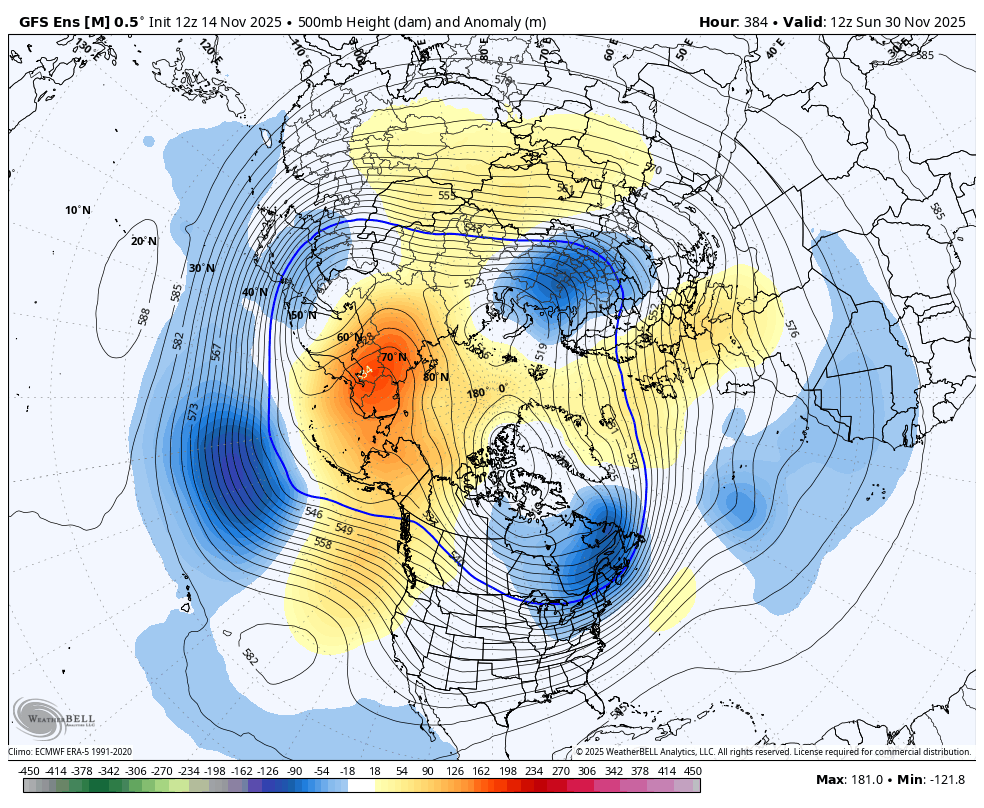
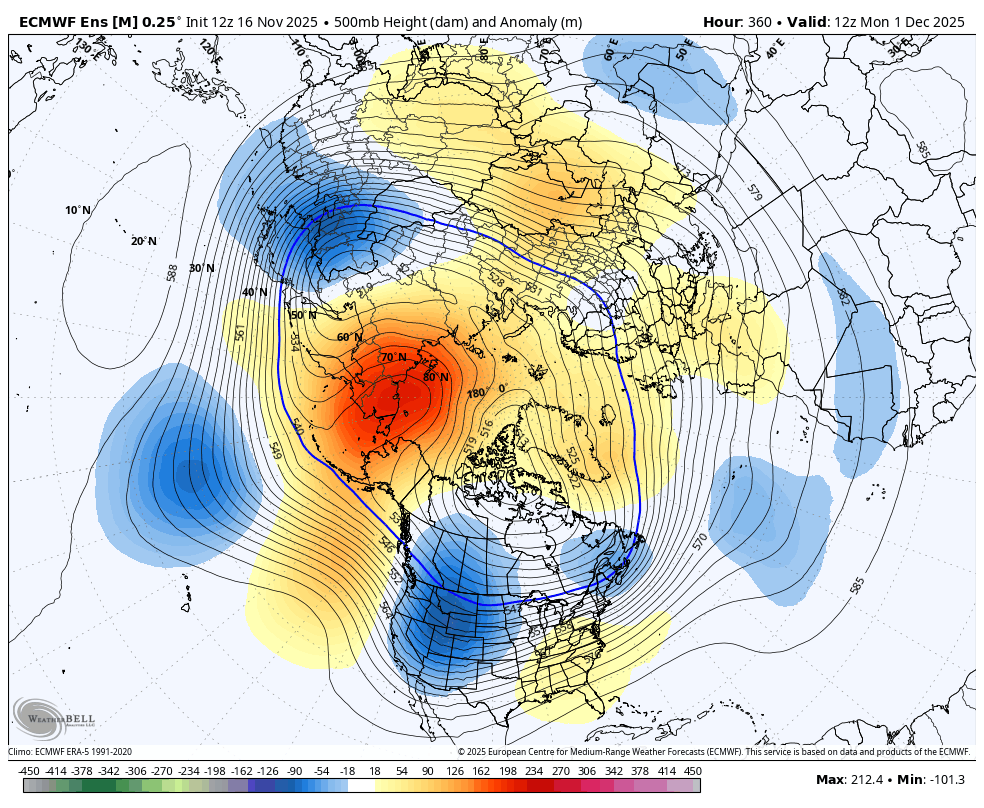
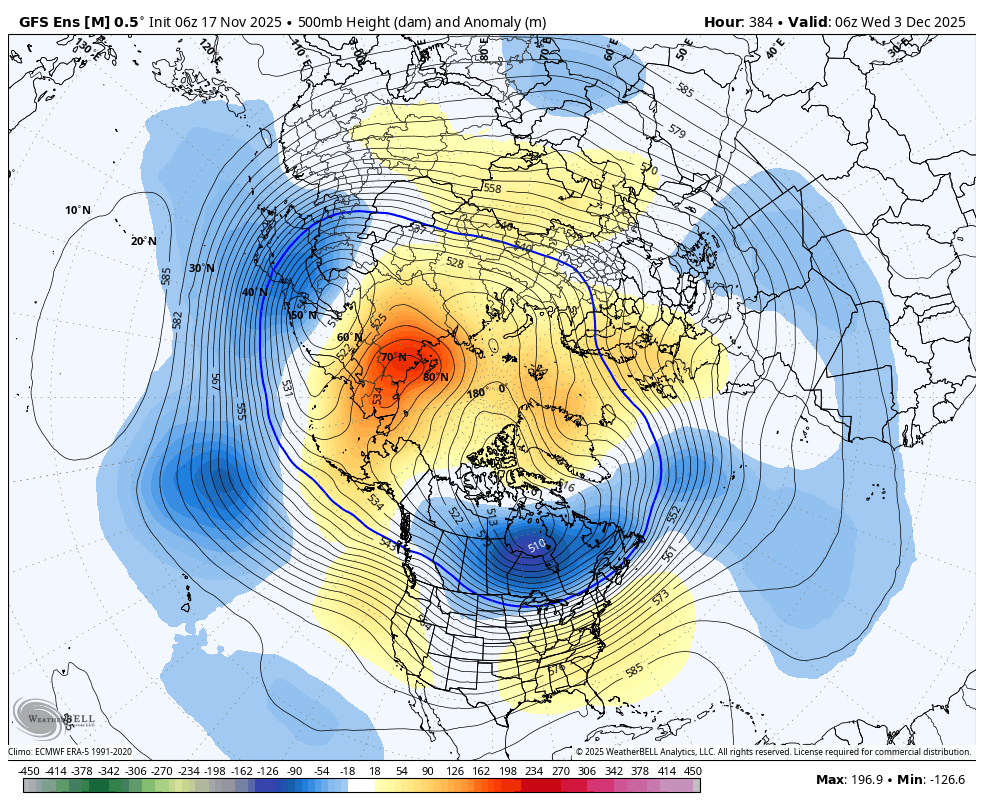
Look at the last maps of this last 6z GEFS!
1. 500 mb: Near ideal ridge/trough(polar vortex) couplet for cold air delivery into US
2. Temperatures: Widespread cold, except the deep south.
This suggests that week 3 is going to potentially be FRIGID! But the market has been trading that for a month and this is exactly the time frame most likely to put in a top for ng and why its a selling set up for me(and many ng traders right now).
MM said,
The 6z GEFS was another +1.2 HDDs on top of the bullish previous run which trumped the 0z data and reversed us higher
Mike,
As I said in my prior post, it looked to me like NG fell during much of the 6Z GEFS release. It didn’t bounce back some til the majority of it was out.
Agreed, Larry that's why I showed the very last map of that run.
Different parts of different runs and different models have been colder and warmer, so its been almost impossible to discern a signal that lasts more than X hours because of the uncertainty.
The indicators that I showed on Sunday are being updated every day 1 times. Today's update was even MORE bearish than yesterday's assessment.
By metmike - Nov. 16, 2025, 1:01 p.m.
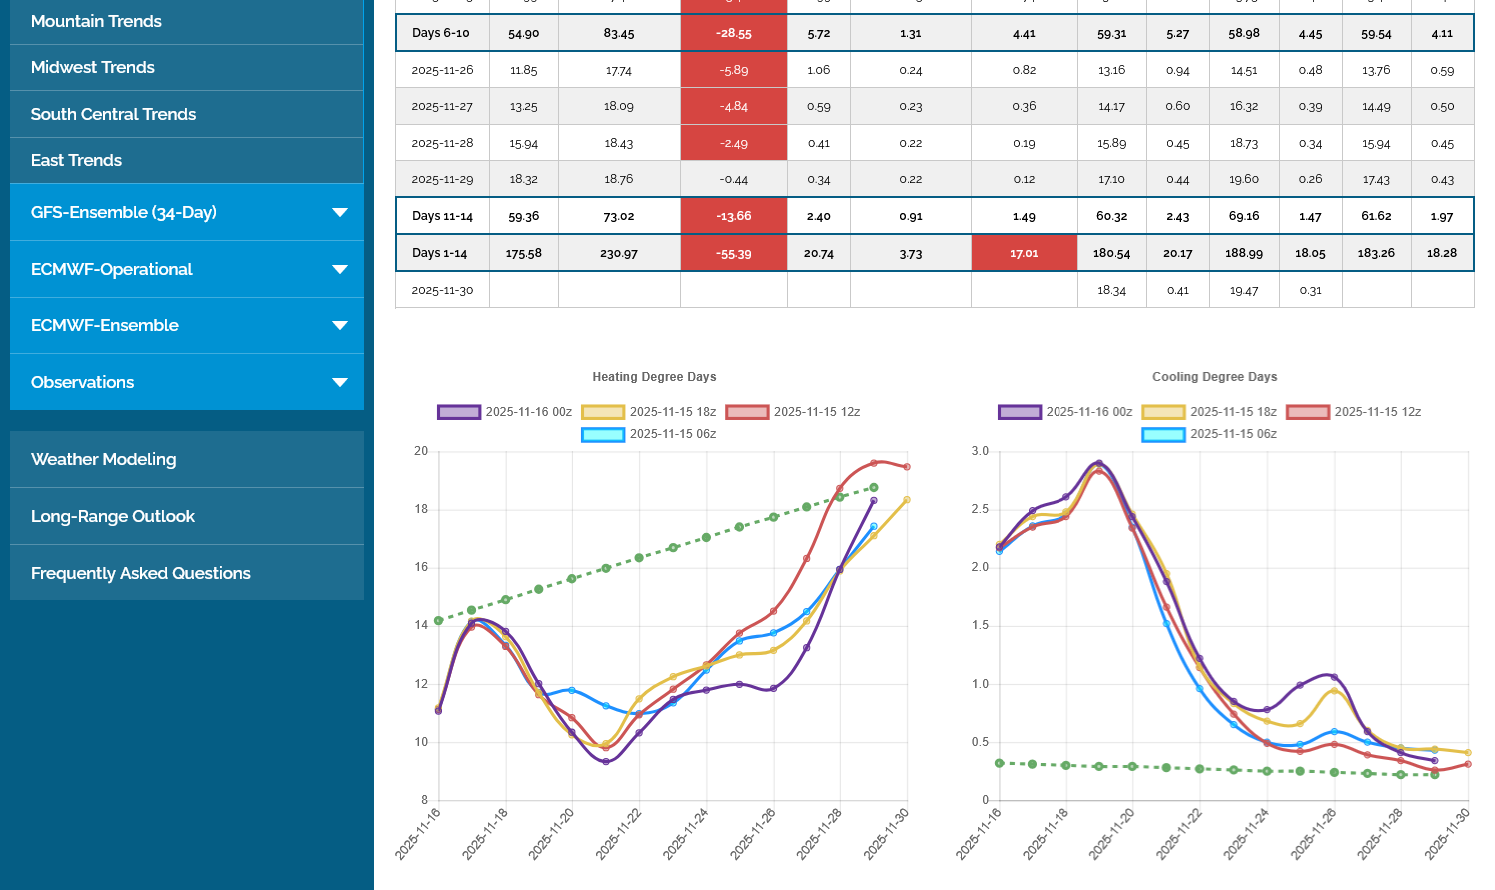
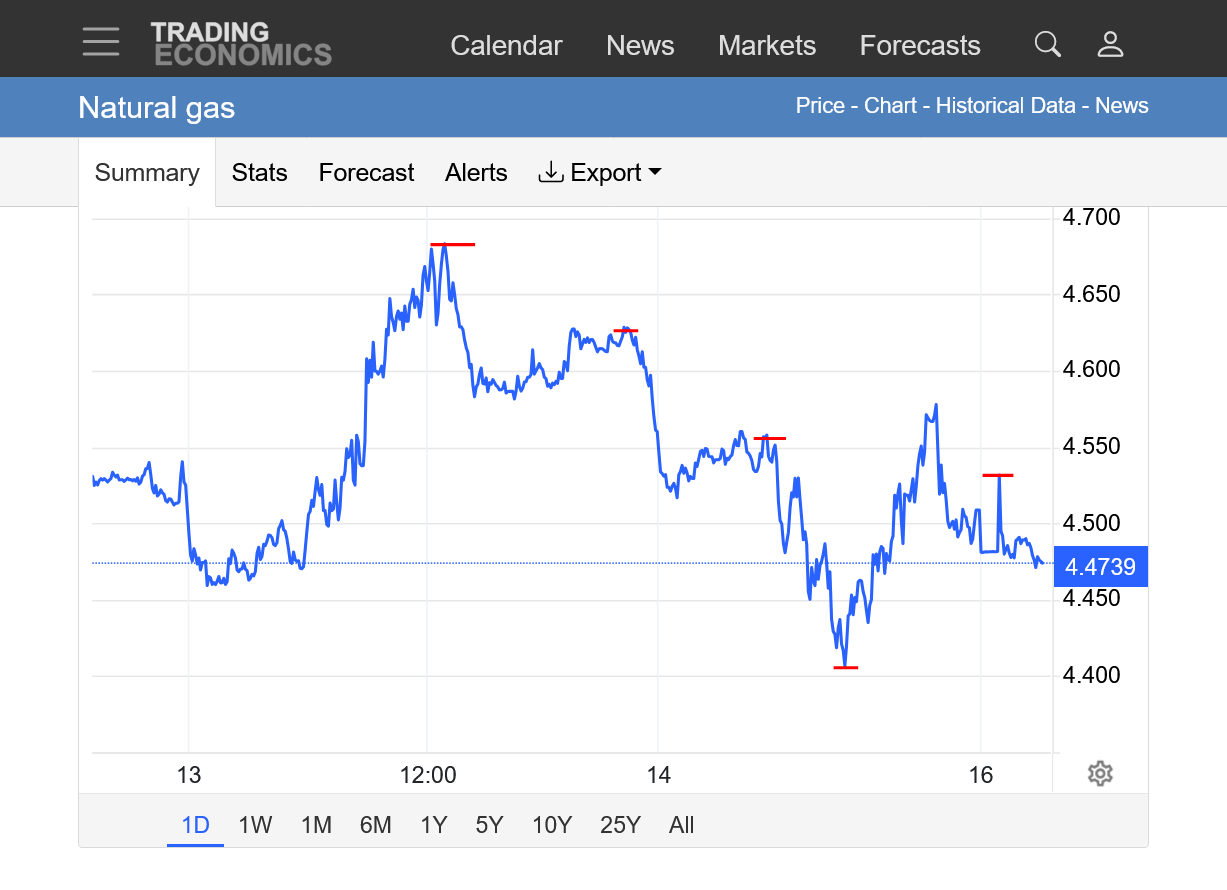
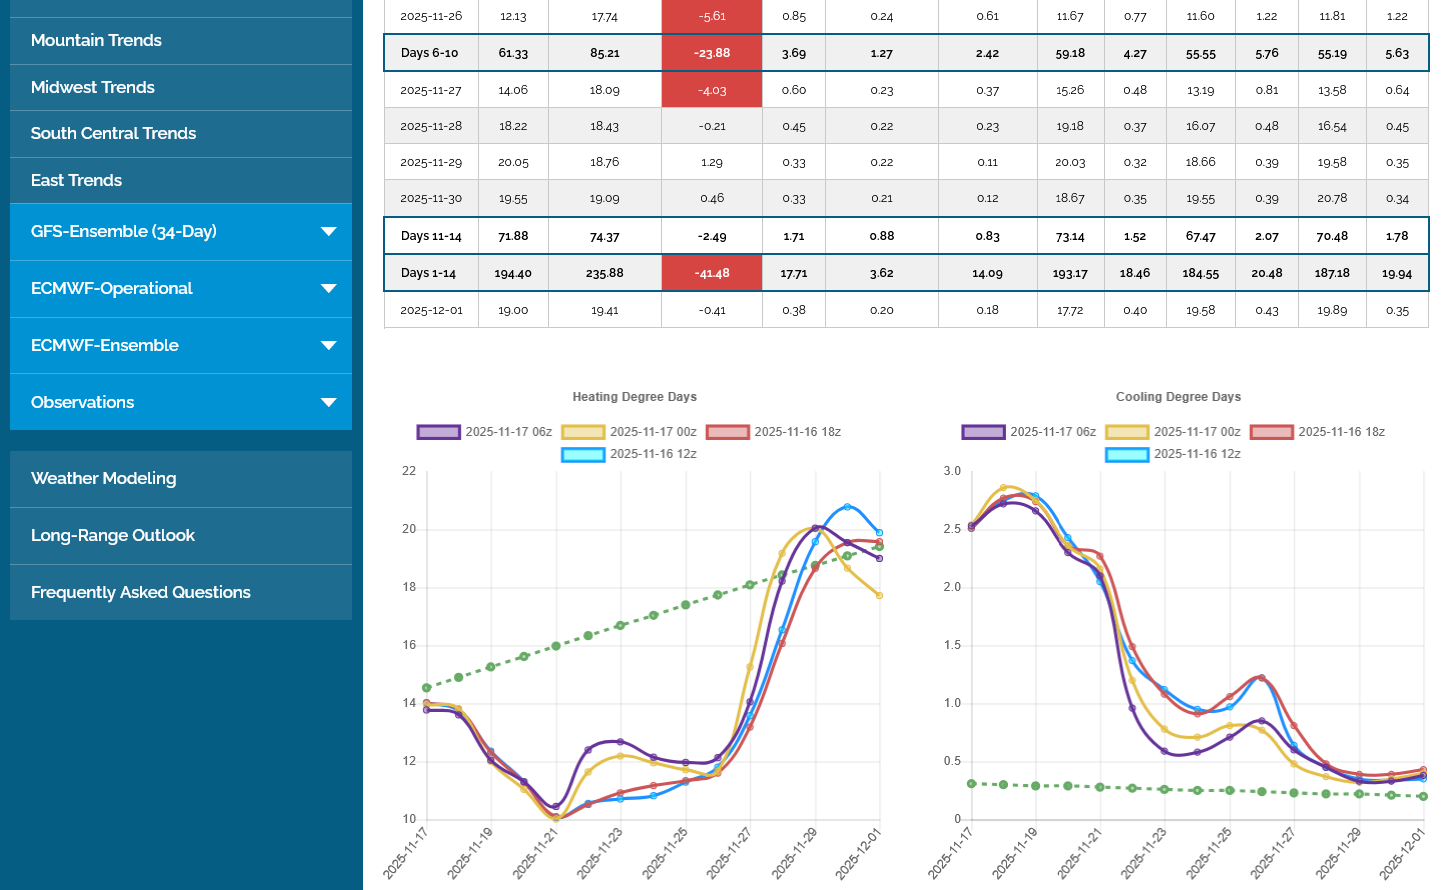
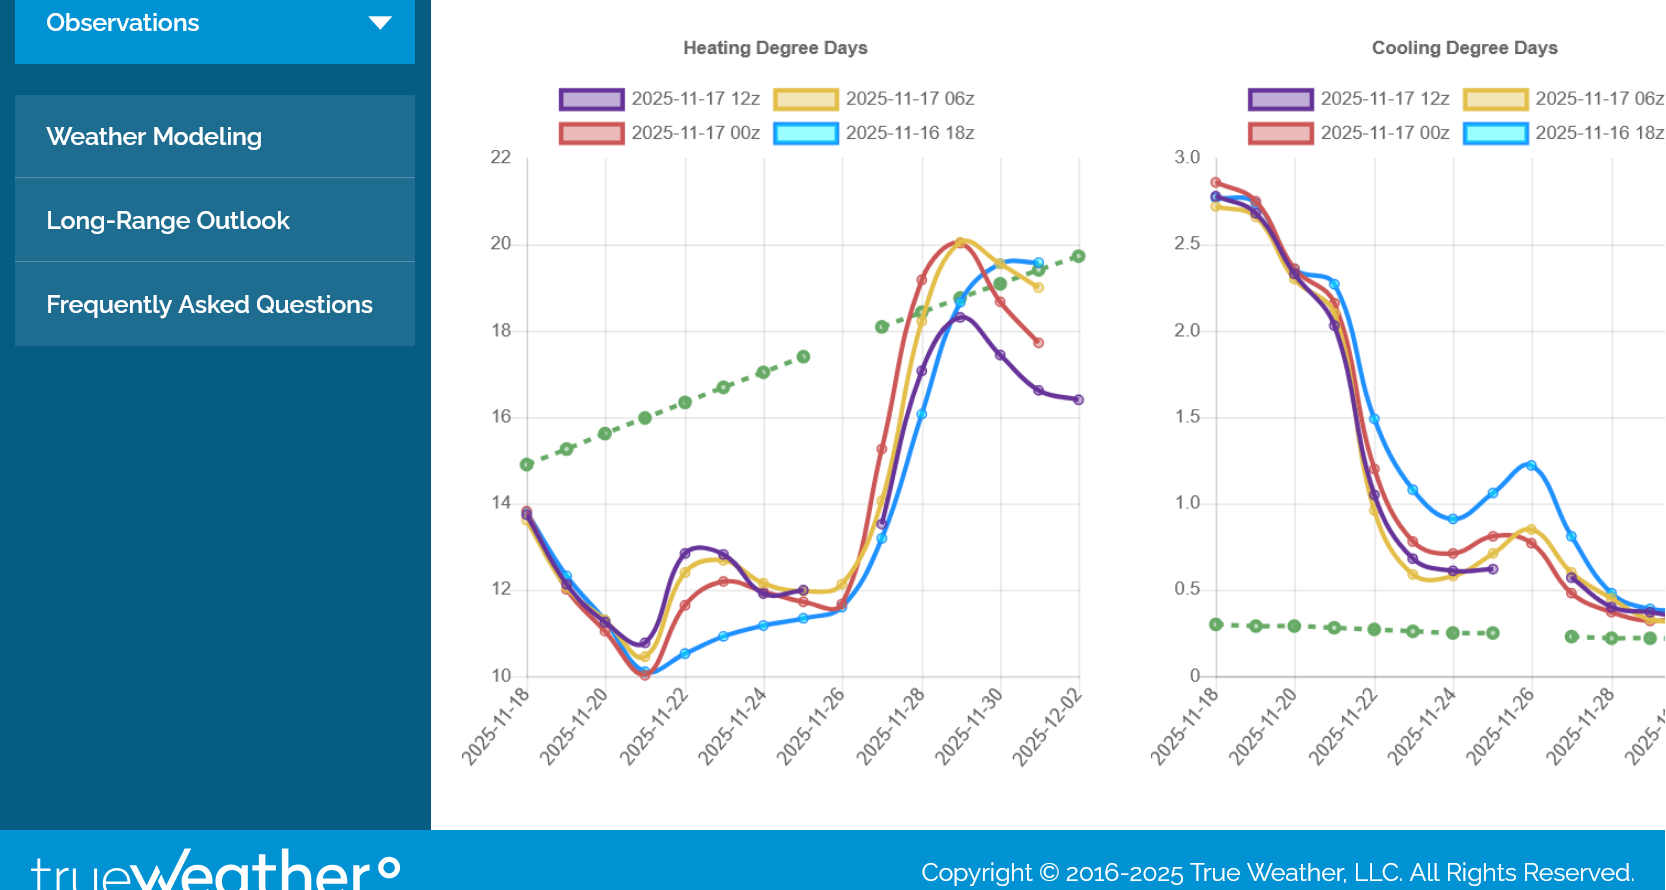
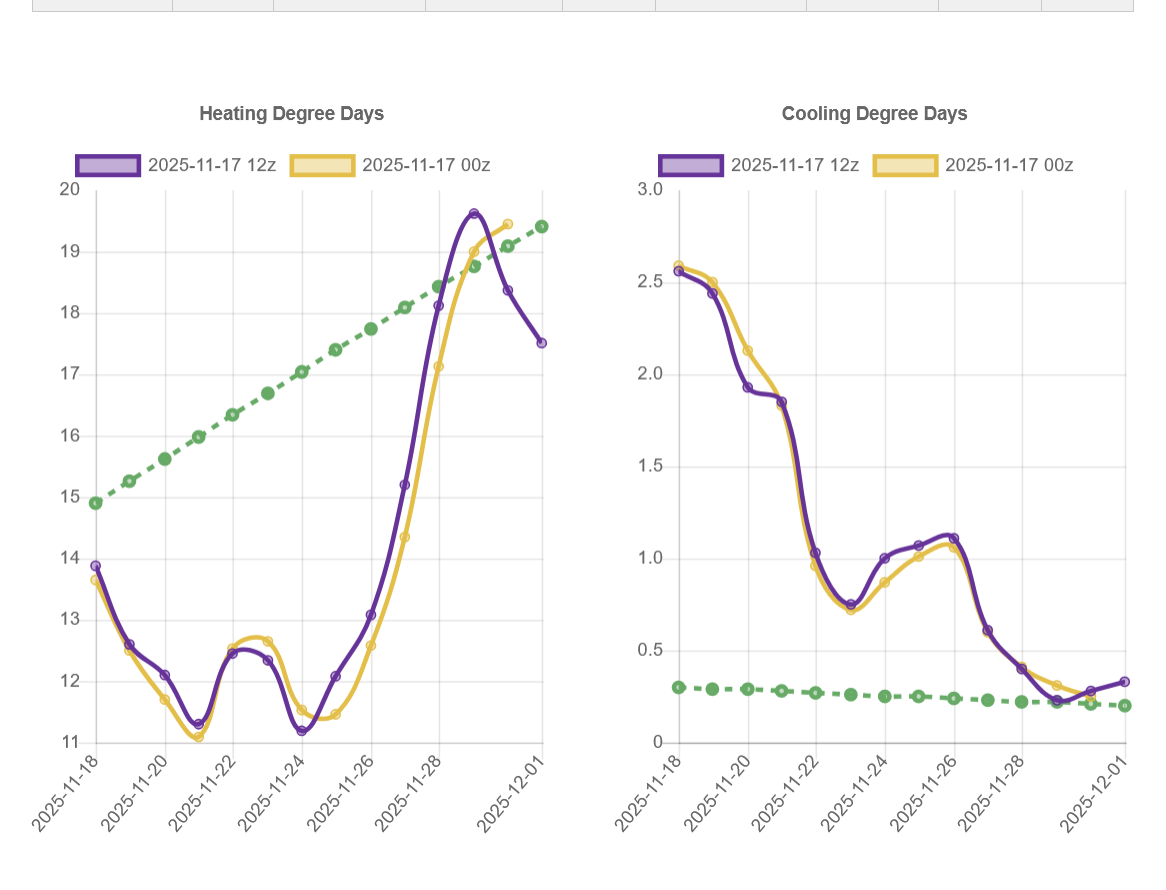
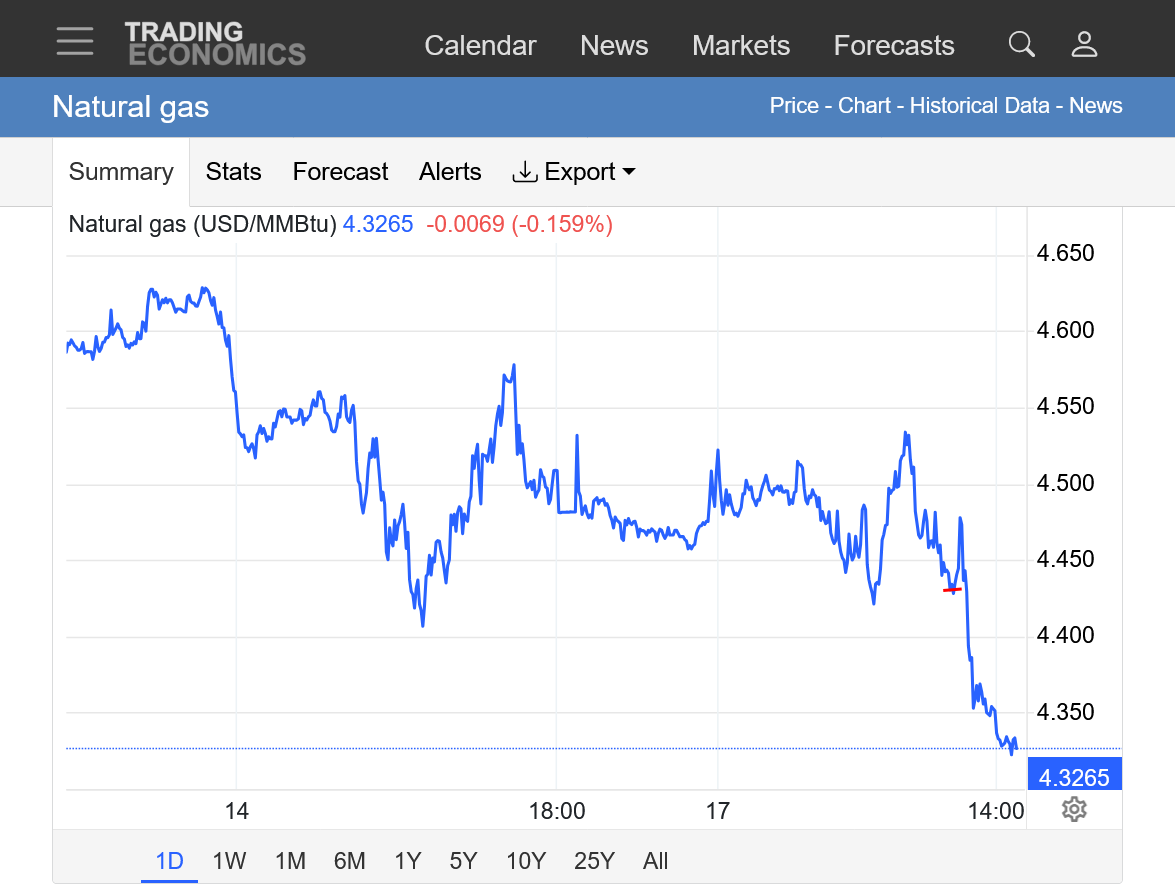
This last 12z GEFS was VERY bearish(less cold). NG has crashed to -$2,000/contract. The highs are in unless this trend towards milder and milder reverses.
This is almost impossible to trade because a model run that comes out colder can spike us up $1,000, even if its an outlier and goes back to milder. In fact, that has been happening. This cold is still so far out but is the entire focus of the market right now.
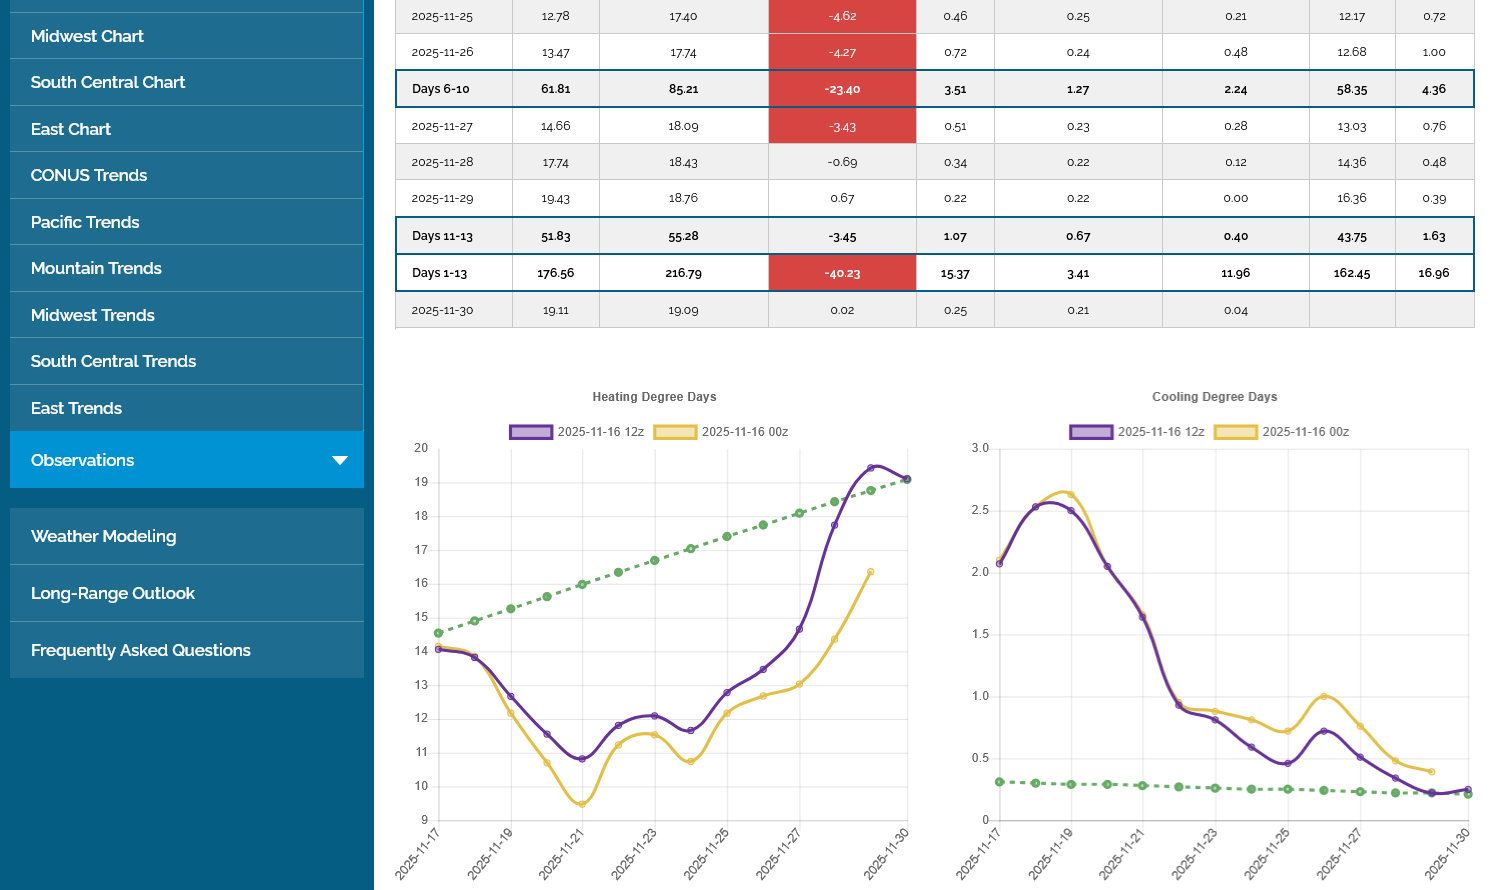
The HDDs data did not all come in for the 12z GEFS but this is what we got. Purple/left was the last run.
++++++++++++
The last 12z EE was actually +3 HDDs(left-purple). However, this was from individual days. Look at the trajectory at the end, WHEN IT MATTERS THE MOST for the purple, last run.
Instead of getting even colder, it does a sudden dive to LESS cold from the last 2 data point, which takes us to a MILDER start for week 3. The market is trading a much COLDER pattern in week 3. Note the 12z GEFS above, does the same thing with the last 3 data points. VERY BEARISH TREND.
+++++++++++++++++++
https://tradingeconomics.com/commodity/natural-gas
1. 1 day: Red line: EE came out with +3 HDDs but the last several maps were extremely bearish and the brief spike up collapsed lower.
2. 1 year: Double top
+++++++++++++
Despite this having every indication of a double top and if the maps don't shift to much colder soon, it will mark major short term top with tremendous downside potential if models continue milder.........the heating season is just beginning. The market has dialed in a tremendous amount of cold risk early and when that comes out, it comes out in huge chunks like today.
However, if December ends up very cold, which is likely we can still go higher.
Story of the Day
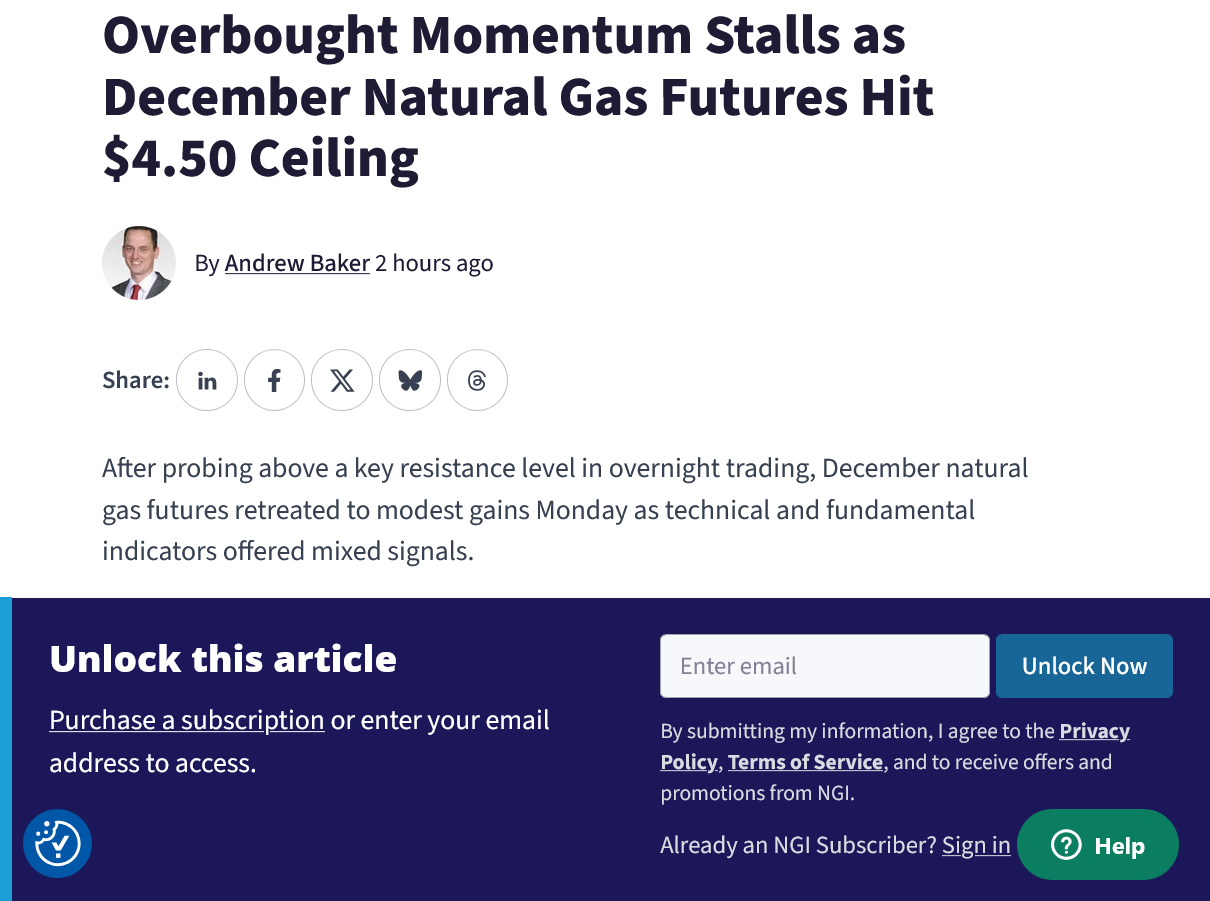
Mixed Weather Outlook, Abundant Supply Send Natural Gas Futures Tumbling
Fresh off a winning week driven by the prospect of chilly weather ahead, natural gas futures lost ground on Monday as traders assessed stout supply and a choppy near-term demand outlook.
++++++++++
Another example of the JOURNALISTS at Natural Gas Intelligence, at times having no clue about what caused natural gas to move in a sensitive weather market. Again, they don't trade. They don't look at weather forecasts. Their job is to FIND SOMETHING to explain why prices moved and nobody is fact checking them.
They might be right on the majority of days but on days like today, they are REALLY wrong!
I'm not right 100% of the time but I show you, dozens of times in each thread what the weather showed and how the market reacted.....over and over. Since I made numerous posts in the last 24 hours doing that FOR FREE, you would think this guy that's getting paid to tell readers what happened would have picked up more on it.
+++++++++++++++
I feel bad having to bash this person that might be a great guy but just want readers to be aware of this fact.
He speaks fluent Spanish, and holds a B.A. in journalism and mass communications from the University of Minnesota.
He is a journalist! Journalists can be wonderful, informative people too when they report authentic facts but they usually don't make good traders.
Hey Mike,
NG rose nearly 1% from 4.336 at 11:13PM to 4.372 at 11:44 PM CST during release of some colder day 8-11 maps of the 0Z GEFS.
Then as some warmer GEFS maps started appearing shortly after, NG reversed from 4.372 to 4.341 the next 15 minutes.
You are totally on this, Larry!
And it makes it almost impossible to trade or keep a position thru a model that changes like you and I describe.
Unless you're somebody that gets this a few seconds before everybody and sometimes put on a position and seconds later, take it off or reverses.
However, as we've seen, sometimes a model run will be decisively in just 1 direction.
In those cases, the first ones taking a position on that data are the ones that get the best prices.
However, if the data abruptly changes in the middle of the model run, you could have a big deficit quickly if staying in.
One way that I've tried to control that is to get in quickly and immediately put a stop in that trails any profits.
The vast majority of times, I get stopped out. Sometimes reversing back in direction for me to make money...........but I've been stopped out. Sometimes saving me from taking a loss.
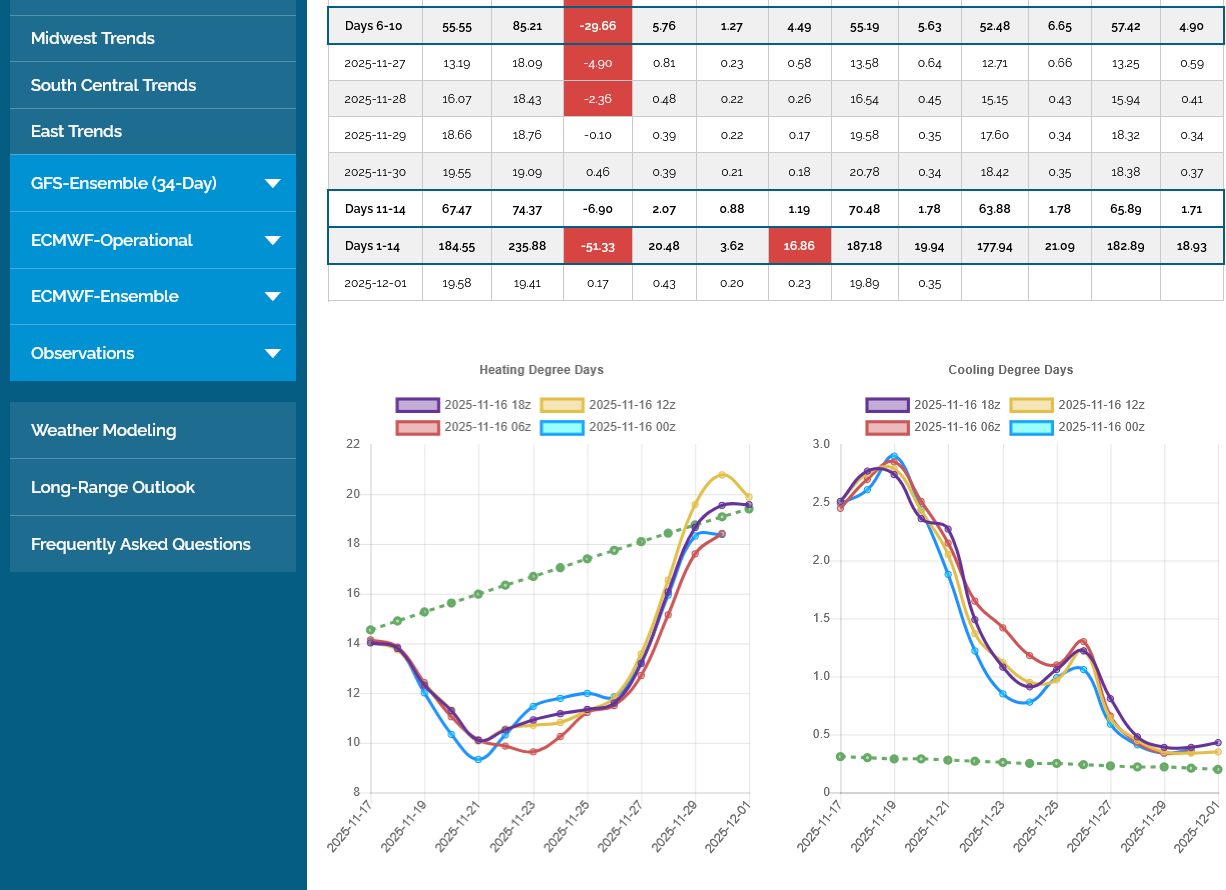
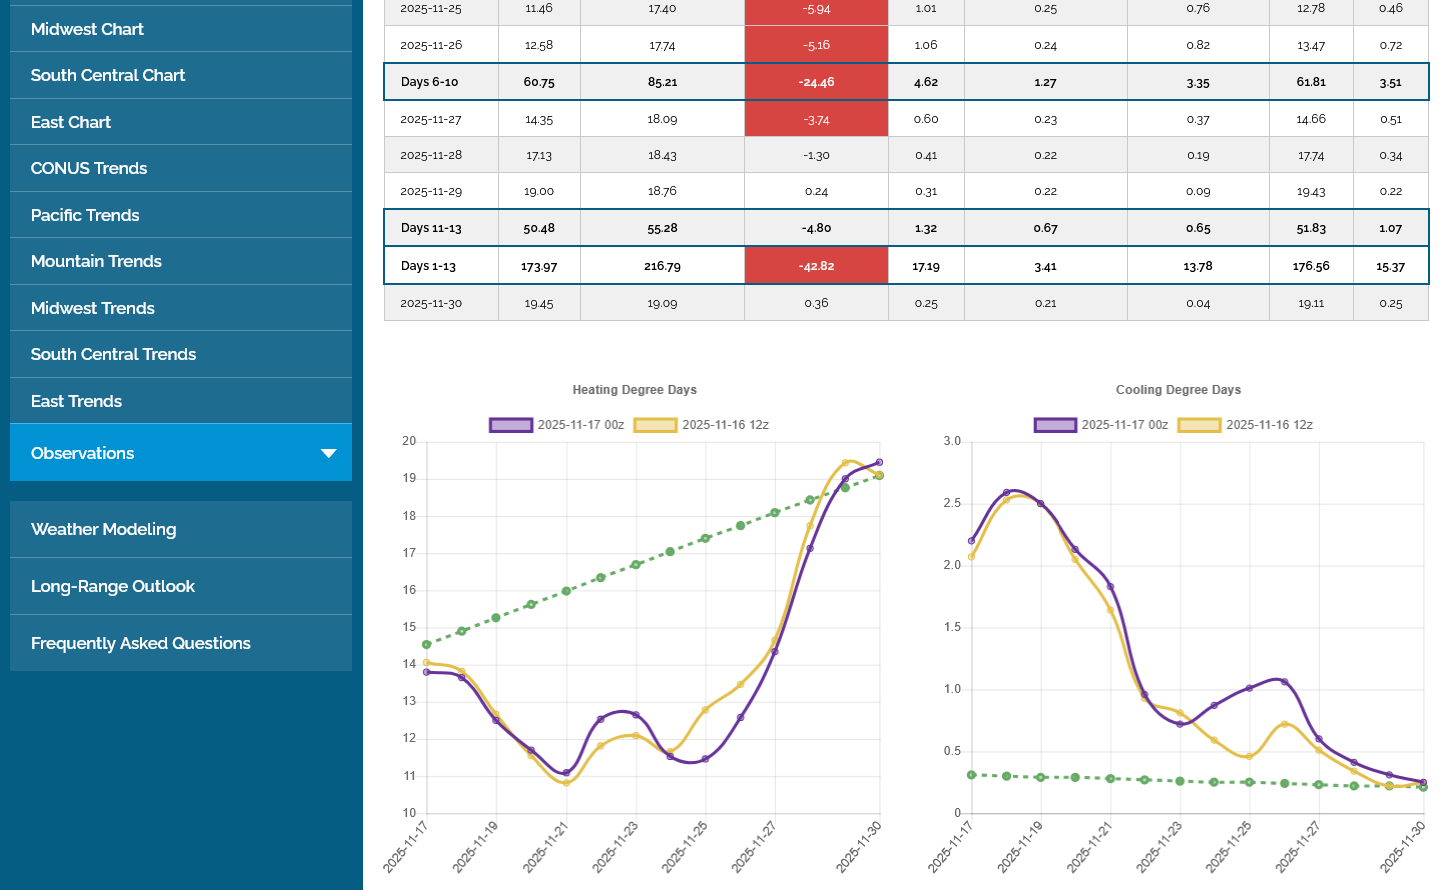
There were a few MORE HDDs overnight overall but NG still went lower. This suggests the top formation/time of year and cold being old news is trumping individual colder days.
I will speculate that SHARPLY colder models can still resurrect the bull, just as LESS cold or similar cold will reinforce the weakness.
The 12z GEFS was -4 HDDs and slightly bearish but the 12zEE was OMG colder, starting day 6. The HDDs won't be out for another hour or so but I will guess up to +16 HDDs after the first few days in the forecast!
We can see what that did to prices below:
1. 1 day: Here's the thing. The market reacted, starting at aroun 11:20 am, well before the EE was coming out much colder. Somebody had that information more than 30 minutes ahead of most of us.
2. 1 week. We're still lower for the week.
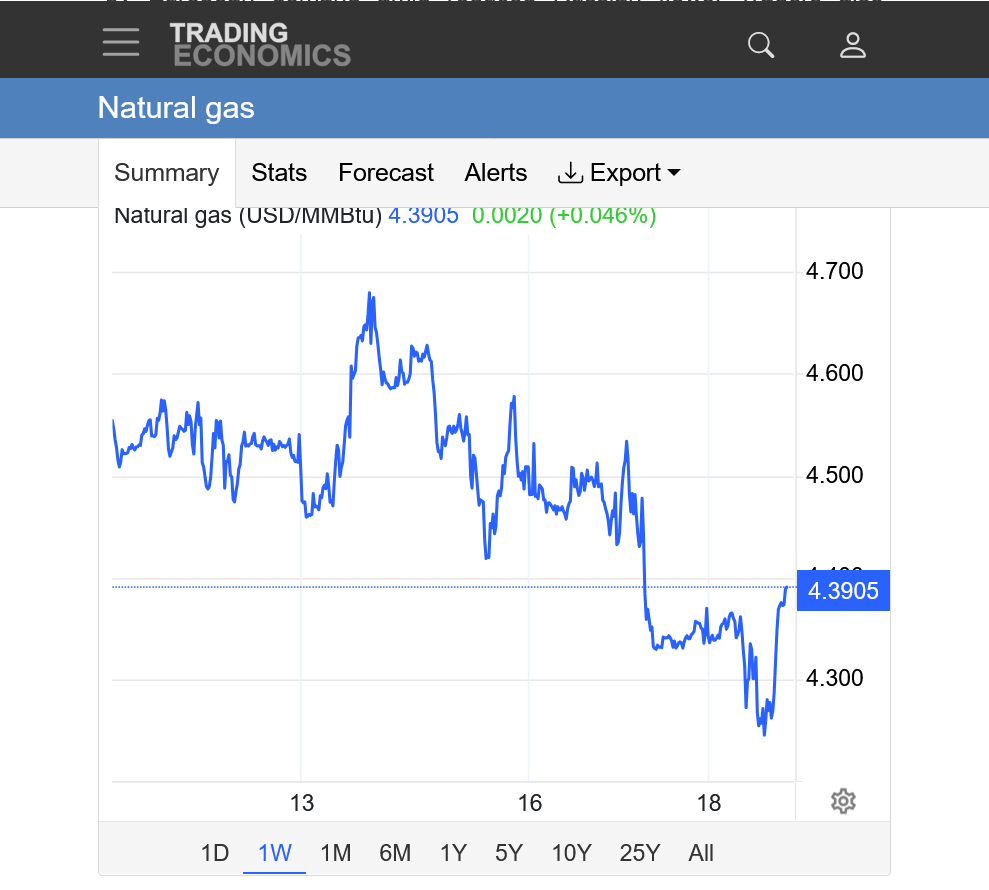
++++++++++++
It looks like, after day 5 there were +12 HDDs and +11 HDDs over all. However, if we add the last/new data point from the new run(that isn't in the total HDD comparisons), that would be close to +15 HDDs after day 5!!!!
MM said,
Here's the thing. The market reacted, starting at aroun 11:20 am, well before the EE was coming out much colder. Somebody had that information more than 30 minutes ahead of most of us.
Thanks, Mike!
Respectfully, I don’t see how it’s possible that someone had 12Z EE data as early as 11:20AM CST. I mean the operational Euro is just starting around then and is out only a few days at most that early. Therefore, I don’t think NG was rising starting at 11:20AM CST due to actual 12Z EE data or maps. OTOH, I suppose it’s possible that NG traders were educatedly guessing/anticipating that it would come in colder than the 0Z EE based on recent colder model consensus trends for the weekend after a thanksgiving. Or maybe there was some other bullish factor then.
Larry,
I am not saying that it was the EE data, sorry for misleading, that was my fault entirely.
They run their own in house models as I described before. The global models take a zillion times more super computer time to run for the entire planet.
I believe that by just running the data for a region on an in house model, they can cut way back on that by several orders of magnitude. Today was the perfect example of what I have been saying about somebody knowing what a model(s) would show BEFORE it came out.
I've watched it happen 100+ times the past decade. It's for real. My theory is just an educated, very plausible theory based on following and explaining this use everything that i know but still missing a few pieces in the puzzle.
A coincidence would explain a handful of times. But today was the exact example of what I was posting to you about this a month or so ago. I'll try to find those posts.
What do you think?
+++++++++++++
This was that previous discussion, starting with the first post. Scroll down for the rest of it. Today was the quintessential example of this in real time.
The GFS operational was much colder than the previous run but only +3 HDDs vs the 0z run. You can see that they reaction happened all at one, then paused (did not go any higher) when all of us were getting the much colder 12z EE model solution. In house models used by big firms/traders must have front run the global models that most of us get.
Re: Re: Re: Re: Re: NG 10-19-25
By metmike - Oct. 22, 2025, 4:03 p.m.
Hey Mike,
Your theory of a colder in-house model running faster and getting a significant number of traders to buy NG can’t be ruled out since it could explain the early rise, but what in-house model and issued by what company(ies)? I know when I was trading that Freese-Notis and Maxar used only the GFS, Euro, and CMC suites as their main model input into their 2 week energy forecasts 99%+ of the time. I can’t imagine, for example, the excellent pro-met Brad Harvey of Maxar also using an in-house model for input. Maxar had a models page, but it had no in-house.
My thinking is that instead it’s more likely that some energy firms run something that tries to predict if an upcoming GEFS/EE run will be warmer or colder than the prior run. I recall Maxar actually having model run predictors going back many years though I never subscribed to them.
Edit: Weather Bell does have their “Pioneer” model” but it isn’t taken seriously by anyone I read or talk to. I can’t see enough people taking an in-house model seriously.
Thanks Larry,
I respectfully disagree with that.
These are big firms that spend a ton of money for the in house model, using AI and NEVER share the data or what they're doing.
Now that I think about it, you remember Dave in KC, that was an active and very informed NG trader here. He had inside contacts in the business.
Just before we switched to the new forum(in 2017) I remember one of his last posts on this topic was about how the rest of us didn't have a chance trading natural gas on weather models anymore because of what I'm describing. I wish the archives from the old forum were not gone forever.
And this wasn't necessarily getting a significant number of traders to buy natural gas.
There were a small number of HUGE traders with massive market orders that hit all the selling prices going up in order to get filled.
I experienced this on a smaller scale back when grains first started trading overnight in the late 90's and volume was thin. If I had a buying set up and was interested in buying 200 contracts of corn, for instance I would ask for the depth of the RESTING selling orders to see how high up I needed to go in order to get filled.
My order alone could make the market go up 10+ ticks quickly and I had to decide on a limit to how much I would pay.
In this case, these traders might control many thousands of buy orders that over whelmed the standing sell orders, even in the middle of the very active day session. But their objective is different. Their 1 huge advantage is having this information an hour before everybody else. Jumping in long aggressively at cheap prices, then when the information was getting to the rest of us.........covering some or most of that as the rest of us bought on the information they were already long for(buy the rumor, sell the fact for them).
There are numerous variations of how this would work depending on the situation. Maybe they keep some of those longs when they are in the direction of big move up?
On a day like today, when it looks like we've topped, this is just a knee jerk reaction to 1 model run.
I actually did the same thing in the 1990's when I was getting the data on my satellite dish before everybody. Make some trades day trades based on the NGM, midday model changes that I had first and were huge. Keep some trades longer and even turn them into position trades.
My favorite was a soybean trade in the Summer of 1999. I made $90,000 in less than 90 minutes. In and out entirely from the NGM showing a huge increase in rain amounts when the crop was very dry and the market was hanging on every model change like it was Gospel.
I celebrated by taking my 20 year old daughter to the D. Patrick Ford dealership in Evansville and paid cash for a nice car for her.
Of all the models and times that have the least impact on trading, it's consistently the 18z GEFS. It was coming out much colder with the red line below.
It just came out a whopping +10 HDDs colder(left/purple-previous milder 3 models in other colors) and ng has reacted with a tiny blip higher, then drifting to new lows for the new session.
The huge traders with in house models don't trade the 18z GEFS model. For one thing, there isn't enough volume. There usually isn't much price movement either. The EE model only goes out a few days.
https://tradingeconomics.com/commodity/natural-gas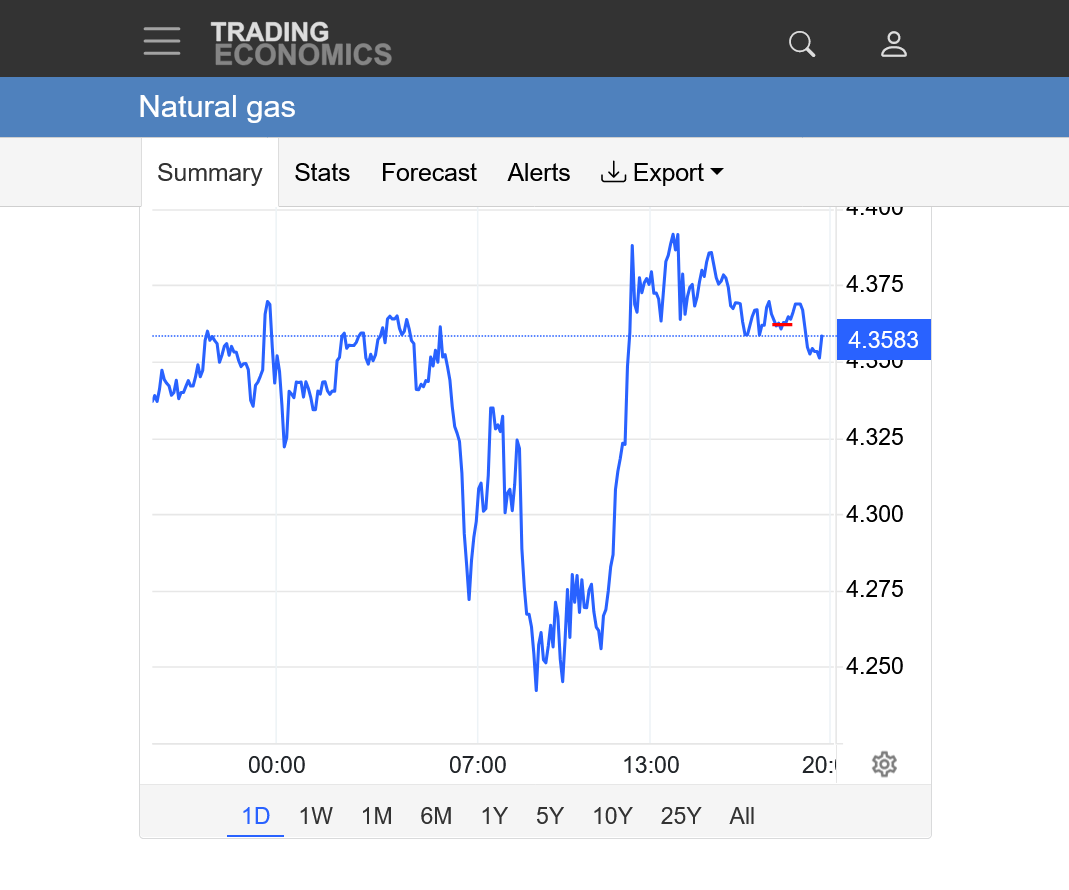
I think this run is very supportive though.
9pm: We actually did have a nice bounce to new highs shortly after that post. Odd that it was such a delayed response.
Natural gas futures traded lower through much of Tuesday against a solid supply backdrop. But the prompt month stemmed the bleeding by midday as buyers stepped in for bargains
+++++++++++++++++++
More evidence that the journalists at NGI are paid to say SOMETHING, even when they don't know what is really moving the market. They can't possibly be traders. According to them, buyers just suddenly stepped in all at once and placed aggressive buy at the market orders for 50 minutes, chasing the price up +$1,300/contract
++++++++++++
Bargain hunters price their orders with lower prices, they dont chase the price much higher with at the market orders.
0z GEFS below in purple/left was another +3 HDDs compared to the bullish 18z run but the 0z EE is going to lose several HDDs vs the very bullish 12z run. 
My rough guess based on looking at WxBell 2m temp maps is that there was only a small change up or down in HDDs of 6Z GEFS vs the bullish 0Z with some days warmer and others colder (mix). Mike, what does your source show for 6Z vs 0Z?
However, assuming I’m correct about the small change, the 6Z holding pretty close to the bullish 0Z GEFS (bullish since it was a few HDD higher than the quite bullish 18Z) seems to have been all that was needed to propel NG sharply higher from 4.397 at ~5:45AM CST to 4.519 just before 7AM, a rise of 2.8%! That’s one of the sharpest rises that fast I can recall analyzing this season so far. Looking at the price chart before 5:45AM, prices had been pretty steady overall/little changed in the session vs the opening price all the way til then despite the bullish 18Z/0Z GEFS and slightly bearish 0Z EE. So, I think this could easily have been a sort of delayed buying from that earlier bullishness.
Thanks very much, Larry.
You nailed the 0z EE HDDs and I was off. They were almost the same as the 12z run(that was extremely bullish so it confirmed the bullishness).
The thing that jumped out at me about the 6z GEFS was the humongous late week 2 changes.. This map shows the RELATIVE CHANGES from the previous run, not just the absolute anomalies. Note that huge increases in the positive and negative anomolies that really strengthen the high latitude ridge/middle latitude trough downstream couplet. This is the northern stream determinant in how powerful the cold air delivery will be. In this case, the magnitude of the anomalies is getting pretty extreme.
Follow the streamlines upstream to see where the source region of our air masses will and you can see its from SIBERIA. The cold place on the planet in December.
Natural gas made a short term top late last week. Then a short term bottom Tuesday afternoon.
https://tradingeconomics.com/commodity/natural-gas
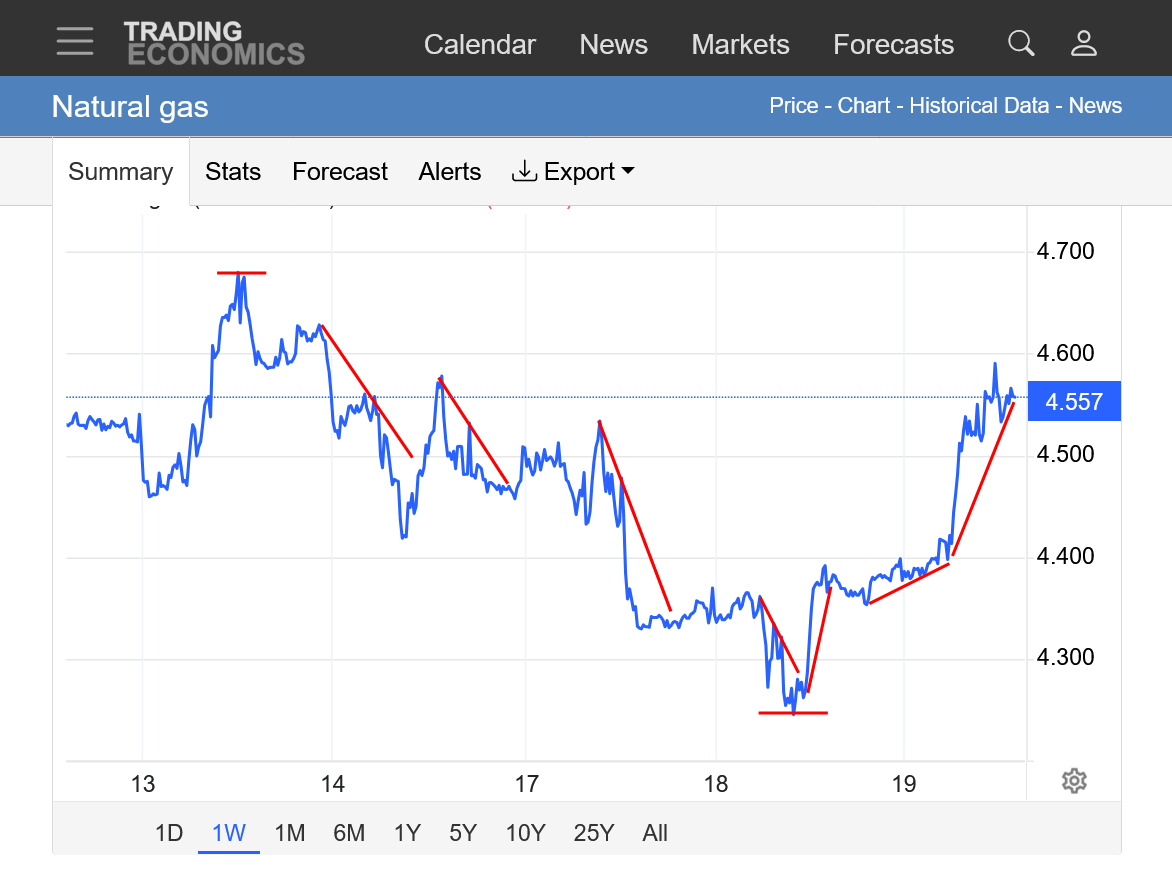
1. 1 week: Horizontal red lines show the top late last week and the bottom yesterday. The DOWNslope lines were mostly knee jerk reactions to MILDER weather models. The UPslope trend lines were mostly knee jerk reactions immediately after/during COLDER weather models.
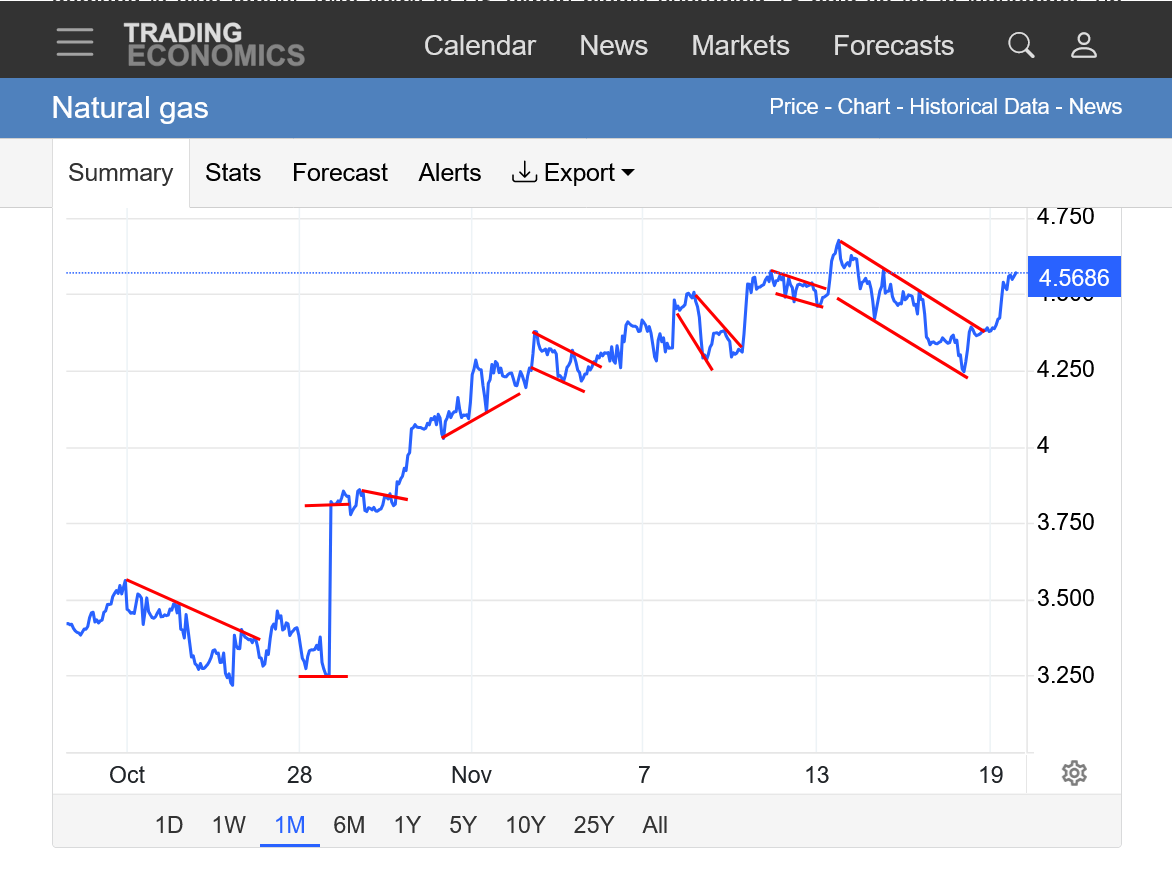
2. 1 month: The red HORIZONTAL lines are not actually a price gap but instead, when the lower priced front month, November rolled over to the higher priced December. The rest of the lines are a bunch of BULL FLAGS/WEDGES, which are price continuation formations/signatures. Most of the upside break outs from the bull flags came from a colder weather model. This last, much longer bull flag formation came from milder model solutions that lasted for numerous days. Now, we're back to colder and are apparently breaking out to the upside again. NEW HIGHS are needed to confirm another bull flag instead of a top.
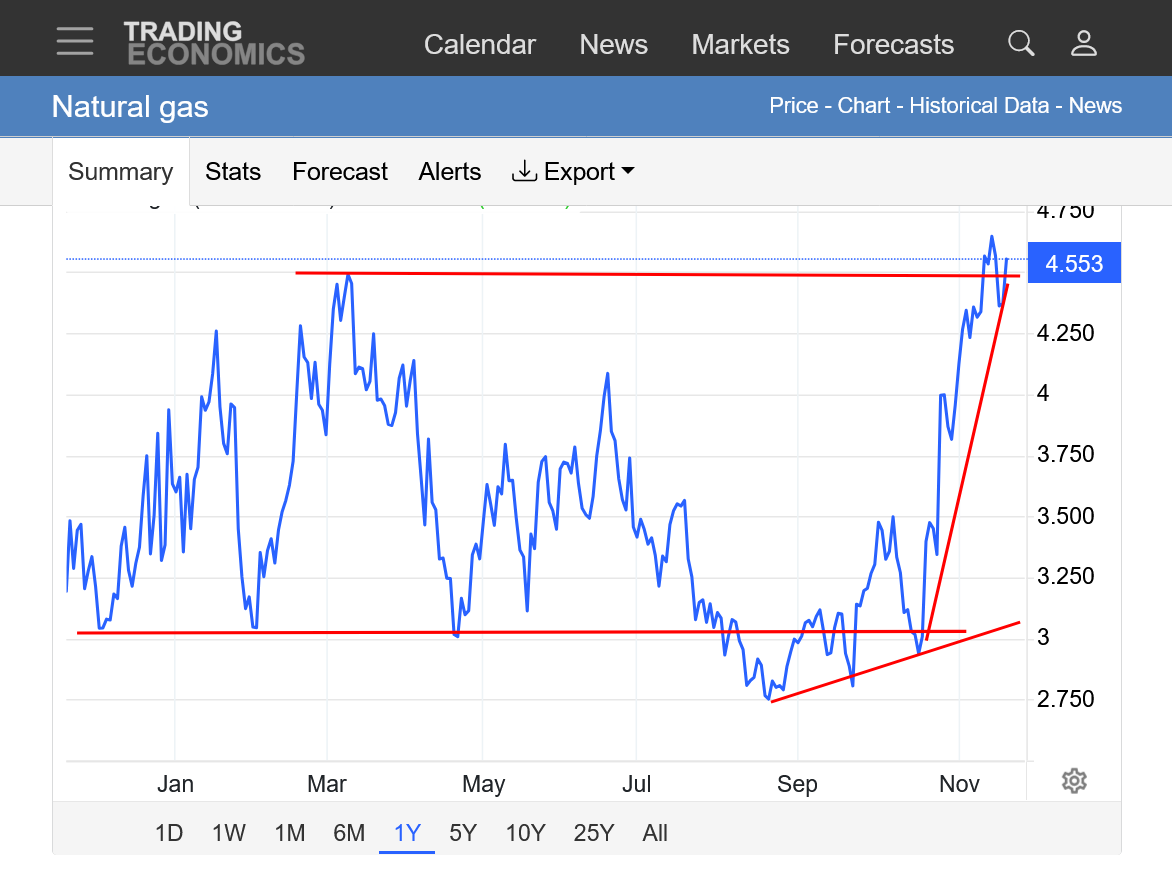
3. 1 year: Crystal clear bottom and huge price increase ahead of this long expected pattern change to MUCH, MUCH colder coming later this month. Current prices are close to the price we spiked to at the end of last years COLDER than average Winter, which caused huge drawdowns in storage.
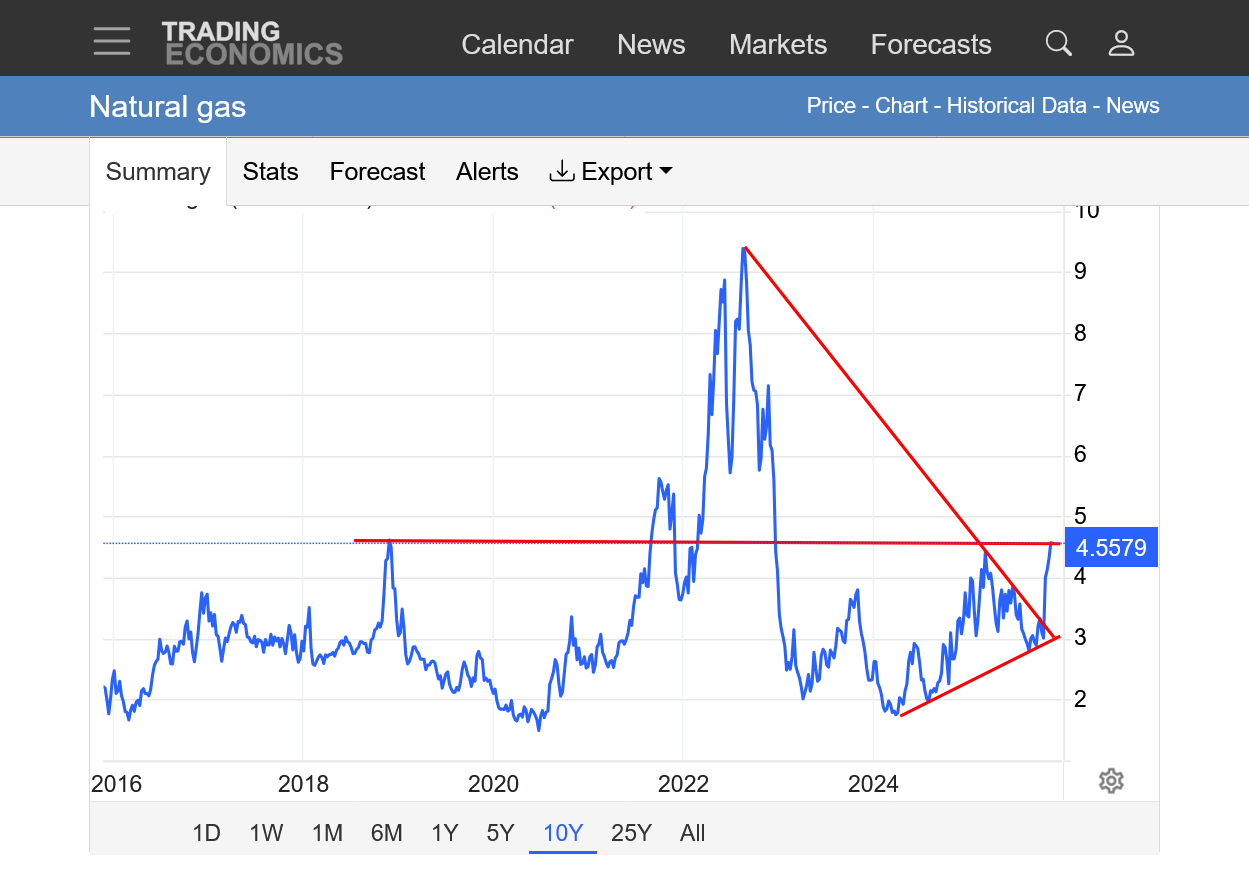
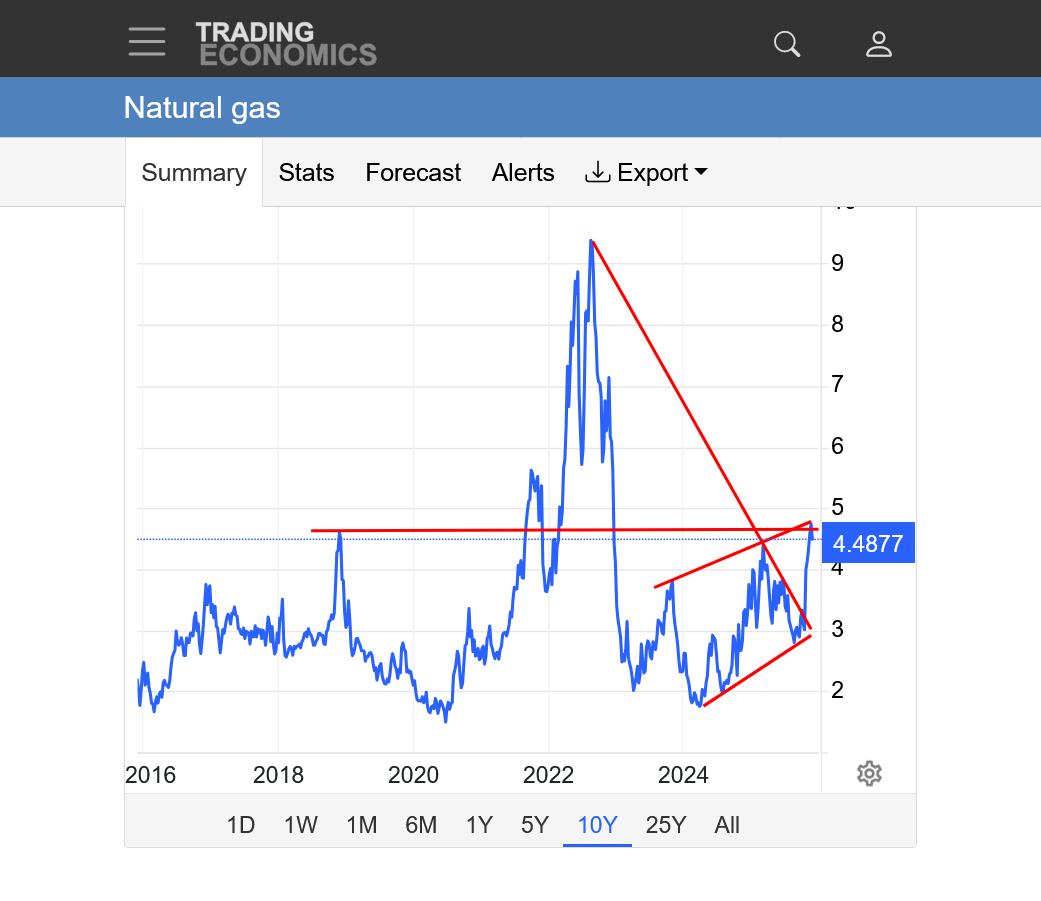
4. 10 years: Big upside break out from a longer term symmetrical triangle(lower highs/higher lows). Right at major resistance.
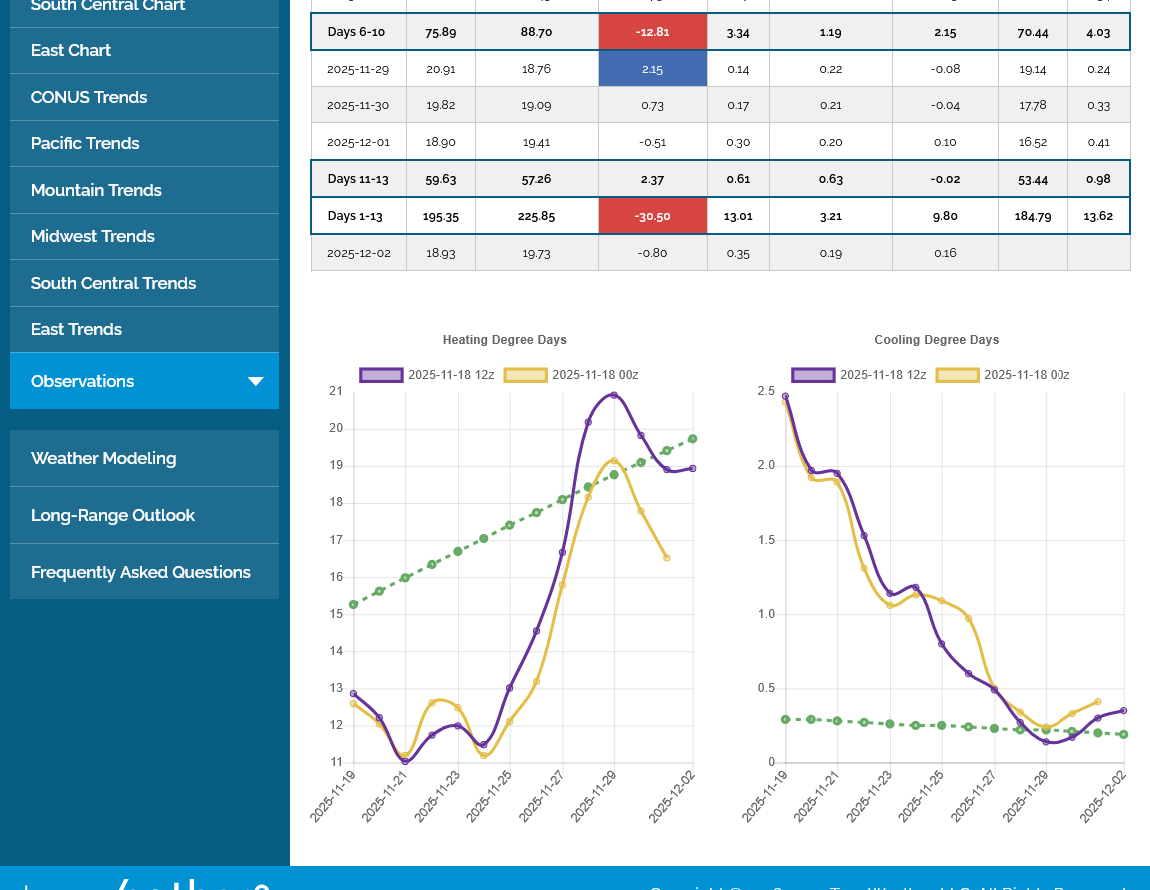
Today's just update NWS week 2 outlook cooled dramatically compared to previous days, This has been expected but the intense cold was moved up several days and really penetrates much deeper than previous models thought.
Tuesday's 12z EE model was the one that first picked up on this(the price spiked $1,000+ in a flash, actually BEFORE the model was out)
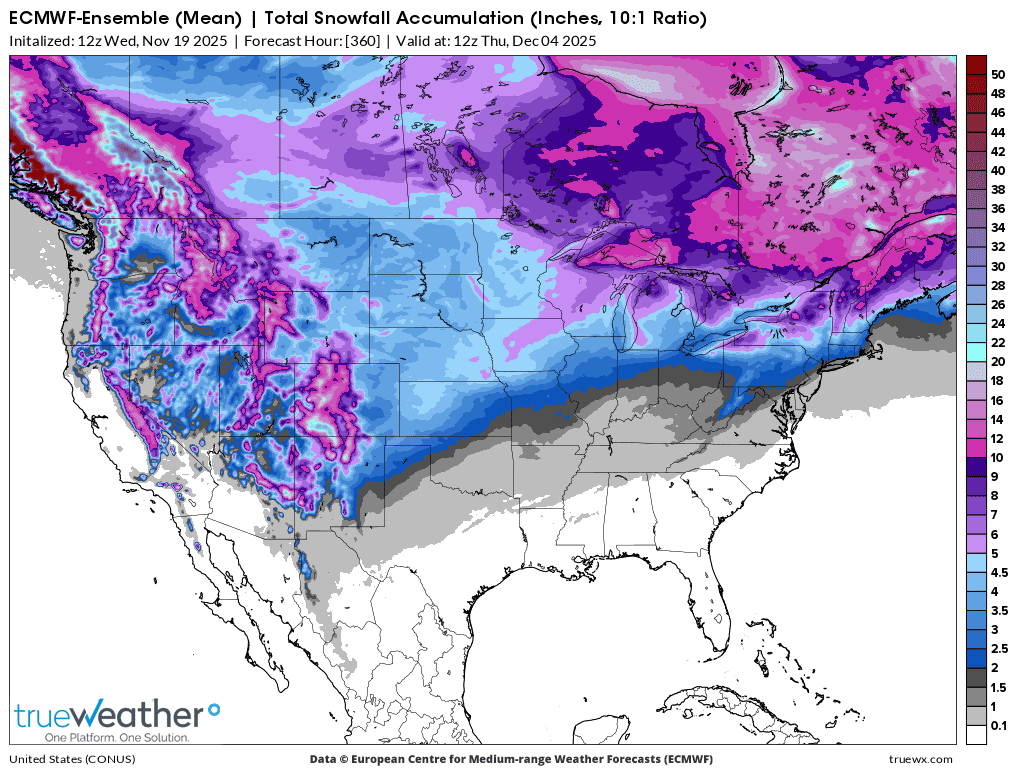
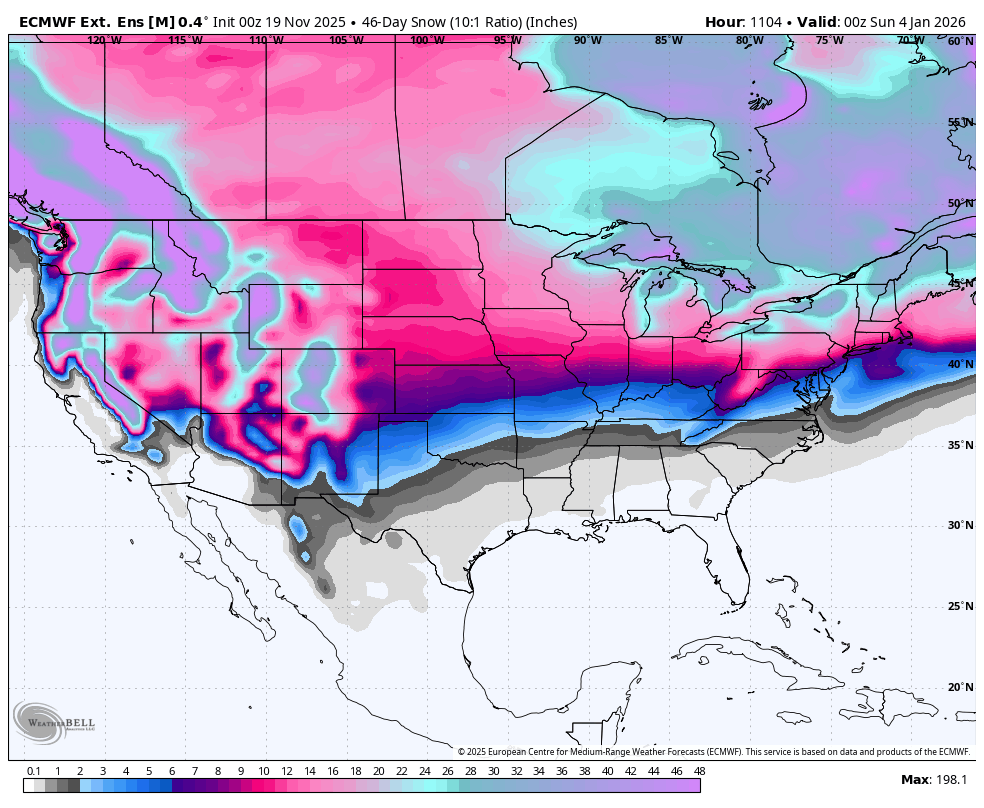
Total snow, almost all of this is week 2! Once we have a snow covered ground, the air masses don't moderate as much headed southeast, especially with the low angled sun as we approach the Winter Solstice and the shortest day of the year with the weakest sun of the year in the Northern Hemisphere.
+++++++++++++++
This is total snow between now and January 3, 2026.
The pink areas are 10"+. Could be a White Christmas for most of the northern 1/3rd to even the northern 1/2 half of the country!!!1
Warm West, Chilly East. First draw down, small one?
https://www.cpc.ncep.noaa.gov/products/tanal/temp_analyses.php
First, small drawdown. Based on the markets muted reaction, no surprise.
It's possible to have another small injection next week??
Some huge early season drawdowns coming up in December! We've trading that expectation for a month now. How much premium is already in the price for that cold? If history plays out, it's still likely that when the cold gets closer, natural gas will have some big spikes up on days with colder forecasts. It's only when the cold pattern looks to change definitively to milder that we can be more confident of any tops that hold with this current move up.
That could be right now, if the guidance morphs less cold even more. Or it might be awhile if the cold pattern dominates the month of December.
https://ir.eia.gov/ngs/ngs.html
![]()
for week ending November 14, 2025 | Released: November 20, 2025 at 10:30 a.m. | Next Release: November 26, 2025
| Working gas in underground storage, Lower 48 states Summary text CSV JSN | |||||||||||||||||||||||||
|---|---|---|---|---|---|---|---|---|---|---|---|---|---|---|---|---|---|---|---|---|---|---|---|---|---|
| Historical Comparisons | |||||||||||||||||||||||||
| Stocks billion cubic feet (Bcf) | Year ago (11/14/24) | 5-year average (2020-24) | |||||||||||||||||||||||
| Region | 11/14/25 | 11/07/25 | net change | implied flow | Bcf | % change | Bcf | % change | |||||||||||||||||
| East | 905 | 914 | -9 | -9 | 933 | -3.0 | 916 | -1.2 | |||||||||||||||||
| Midwest | 1,112 | 1,117 | -5 | -5 | 1,140 | -2.5 | 1,109 | 0.3 | |||||||||||||||||
| Mountain | 292 | 290 | 2 | 2 | 293 | -0.3 | 241 | 21.2 | |||||||||||||||||
| Pacific | 322 | 321 | 1 | 1 | 313 | 2.9 | 285 | 13.0 | |||||||||||||||||
| South Central | 1,316 | 1,318 | -2 | -2 | 1,290 | 2.0 | 1,249 | 5.4 | |||||||||||||||||
| Salt | 352 | 353 | -1 | -1 | 347 | 1.4 | 337 | 4.5 | |||||||||||||||||
| Nonsalt | 963 | 965 | -2 | -2 | 943 | 2.1 | 912 | 5.6 | |||||||||||||||||
| Total | 3,946 | 3,960 | -14 | -14 | 3,969 | -0.6 | 3,800 | 3.8 | |||||||||||||||||
| Totals may not equal sum of components because of independent rounding. | |||||||||||||||||||||||||
Working gas in storage was 3,946 Bcf as of Friday, November 14, 2025, according to EIA estimates. This represents a net decrease of 14 Bcf from the previous week. Stocks were 23 Bcf less than last year at this time and 146 Bcf above the five-year average of 3,800 Bcf. At 3,946 Bcf, total working gas is within the five-year historical range.
For information on sampling error in this report, see Estimated Measures of Sampling Variability table below.
Note: The shaded area indicates the range between the historical minimum and maximum values for the weekly series from 2020 through 2024. The dashed vertical lines indicate current and year-ago weekly periods.
WOW! The 0z GEFS came out MUCH warmer in the 8-11 day period and we dropped $200.
Then in 30 minutes immediately following that it shot up like a rocket by +$1100 with the end of the week 2 forecast being colder....AND the middle of the European Ensemble model, simultaneously came out MUCH colder.
That last run is in purple on the left:
+++++++++++++++++++
https://tradingeconomics.com/commodity/natural-gas
The short red line was when the milder 4 days started coming out. The long red line is when the cold end of the solution came out AND the middle of the European Ensemble model, simultaneously came out MUCH colder. Wild!
I've not pulled the trigger on any trades this week but would have been tempted to sell when the milder days just started coming out. Even if I was the first one in the market, selling, holding that short position for more than 10 minutes without a trailing stop would have been costly during the spike up
The 12z GEFS was about the same but the 12z European Ensemble average was a whopping -13 HDDs vs the previous 0z run from 12 hours earlier.
We can see the step change down that lasts for the last 6 days and is still going at the end. This is likely just from the boundary of the cold air being shifted north or northwest by X miles and staying there compared to the previous run.
Models have lots of ups and downs but appear to be a bit milder to me vs Friday so I'll say a LOWER open tonight.
Front month, December expires this week(and it was WAY stronger on Friday than January). and we have Thanksgiving.
Dec was up over $1,000/contract but Jan was only up just over $600/contract.
Did that mean traders were exiting short positions ahead of expiration of the front month?
We did open lower. Not quite a gap lower but close to the lows on Friday and we are a bit below that.
Too low to even be lose to my sell order. That's the thing with these Sunday Night opens in natural gas. The magnitude of the changes are amplified by the passage of time from weather model changes that go more in 1 direction than the other.
Also, on the open I think we often have people that banked on a different weather pattern change that get out on the open at the market. Without as many offsetting orders on the open, they have to penetrate thru alot of depth to find the number of contracts to satiate the other LOPSIDED side.
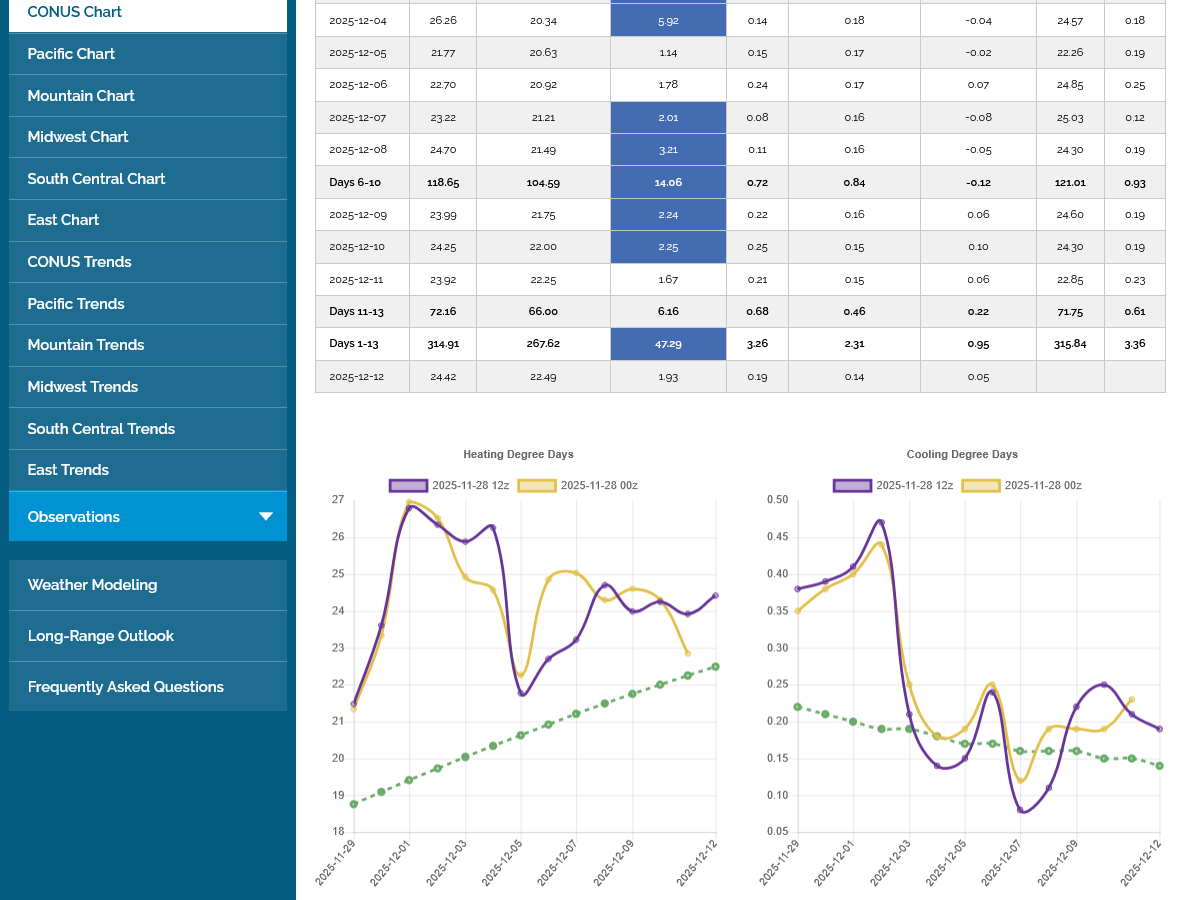
0z GEFS was much colder than the previous runs in week 2. Can you tell when it was coming out below at the far right when we shot up $1,200/contract
https://tradingeconomics.com/commodity/natural-gas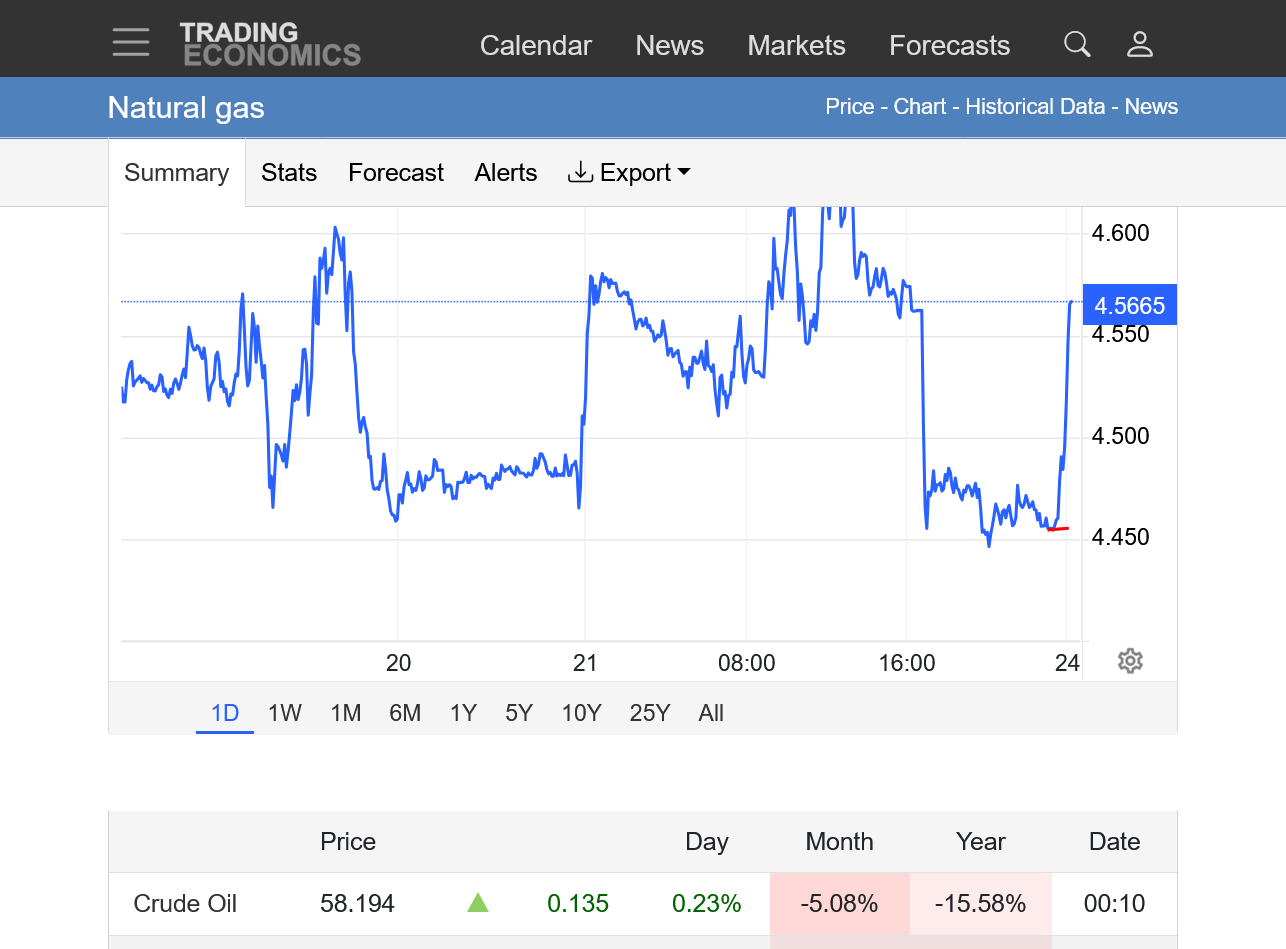
9am: The 0z European Ensemble model was simultaneosly coming out a whopping +16 HDDs!!
+++++++++++++
This is actually expected with the current pattern that features such an extremely steep meridional(north to south) temperature gradient and we have big shifts in model runs for the strength and location of weather systems.
Re: 11-21-25 Much colder pattern coming up!
By WxFollower - Nov. 23, 2025, 4:04 p.m.
++++++++++++
Re: Re: 11-21-25 Much colder pattern coming up!
By metmike - Nov. 23, 2025, 5:40 p.m.
Mild temps, except the Northeast probably means another very late season injection.
https://www.cpc.ncep.noaa.gov/products/tanal/temp_analyses.php
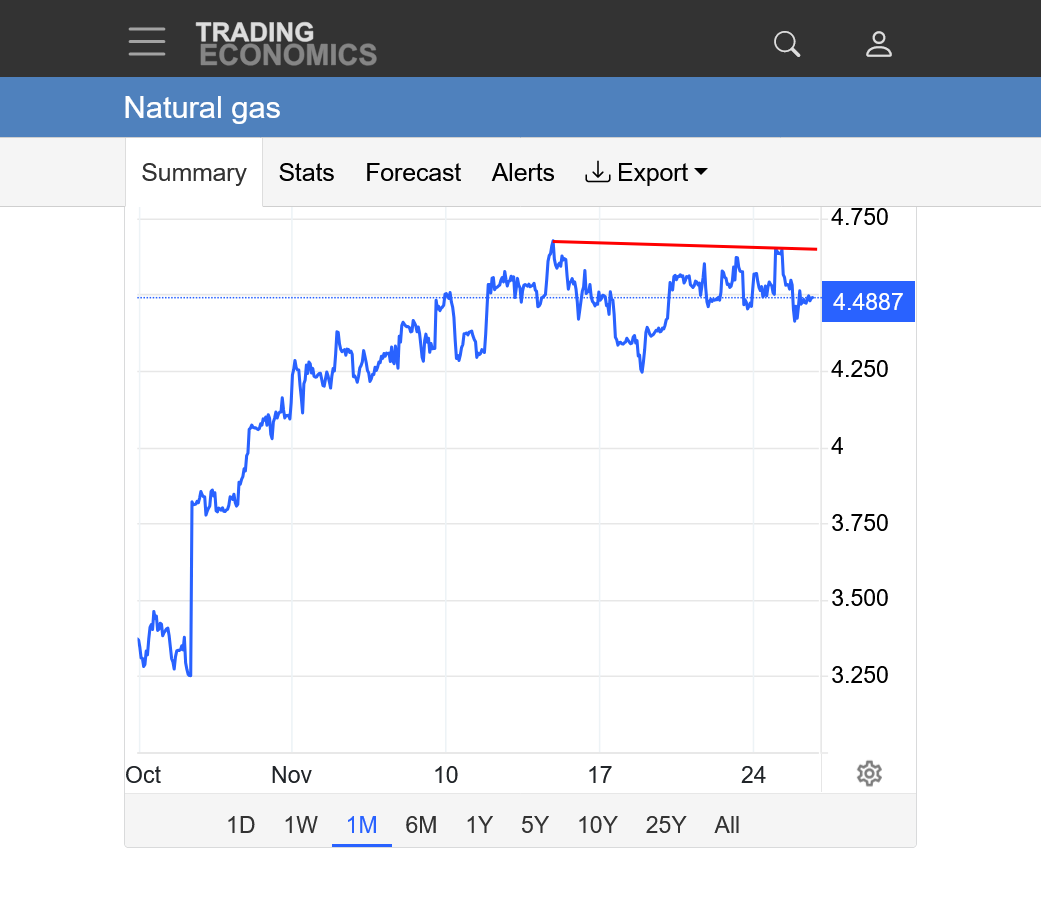
https://tradingeconomics.com/commodity/natural-gas
1. 1 month: Double top with November 13 high.
2. 1 year: Double top with late March 20, 2025 high.
3. 10 years: Top at long term resistance. Top at the top of upchannel. Previous upside break out earlier this fall from longer term downtrend after 2022 high.
++++++++++++++++
The EIA report comes out at noon today!
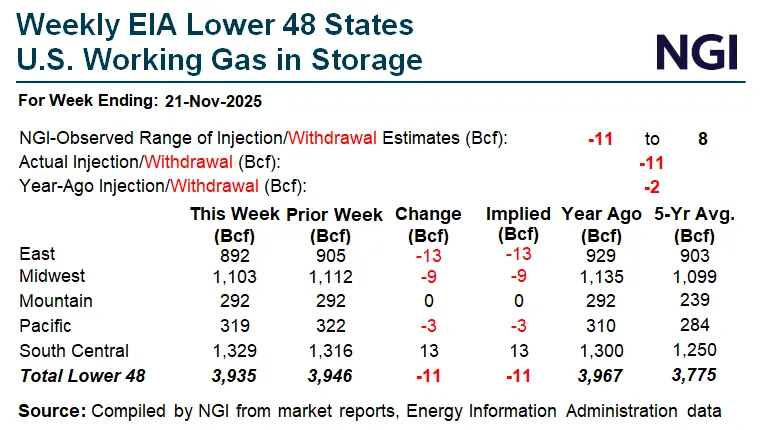
It was another small drawdown. Bullish vs expectations. Next week's EIA report will be for a holiday week which often decreases demand(bearish). The week after that will feature the first robust drawdown from the current cold wave's impact the next week.
![]()
https://ir.eia.gov/ngs/ngs.html
for week ending November 21, 2025 | Released: November 26, 2025 at 12:00 p.m. | Next Release: December 4, 2025
| Working gas in underground storage, Lower 48 states Summary text CSV JSN | |||||||||||||||||||||||||
|---|---|---|---|---|---|---|---|---|---|---|---|---|---|---|---|---|---|---|---|---|---|---|---|---|---|
| Historical Comparisons | |||||||||||||||||||||||||
| Stocks billion cubic feet (Bcf) | Year ago (11/21/24) | 5-year average (2020-24) | |||||||||||||||||||||||
| Region | 11/21/25 | 11/14/25 | net change | implied flow | Bcf | % change | Bcf | % change | |||||||||||||||||
| East | 892 | 905 | -13 | -13 | 929 | -4.0 | 903 | -1.2 | |||||||||||||||||
| Midwest | 1,103 | 1,112 | -9 | -9 | 1,135 | -2.8 | 1,099 | 0.4 | |||||||||||||||||
| Mountain | 292 | 292 | 0 | 0 | 292 | 0.0 | 239 | 22.2 | |||||||||||||||||
| Pacific | 319 | 322 | -3 | -3 | 310 | 2.9 | 284 | 12.3 | |||||||||||||||||
| South Central | 1,329 | 1,316 | 13 | 13 | 1,300 | 2.2 | 1,250 | 6.3 | |||||||||||||||||
| Salt | 360 | 352 | 8 | 8 | 352 | 2.3 | 340 | 5.9 | |||||||||||||||||
| Nonsalt | 969 | 963 | 6 | 6 | 947 | 2.3 | 910 | 6.5 | |||||||||||||||||
| Total | 3,935 | 3,946 | -11 | -11 | 3,967 | -0.8 | 3,775 | 4.2 | |||||||||||||||||
| Totals may not equal sum of components because of independent rounding. | |||||||||||||||||||||||||
Working gas in storage was 3,935 Bcf as of Friday, November 21, 2025, according to EIA estimates. This represents a net decrease of 11 Bcf from the previous week. Stocks were 32 Bcf less than last year at this time and 160 Bcf above the five-year average of 3,775 Bcf. At 3,935 Bcf, total working gas is within the five-year historical range.
For information on sampling error in this report, see Estimated Measures of Sampling Variability table below.
Note: The shaded area indicates the range between the historical minimum and maximum values for the weekly series from 2020 through 2024. The dashed vertical lines indicate current and year-ago weekly periods.
++++++++++++
The last 12z European Ensemble mean was a whopping +12 HDDs compared to the run 12 hours earlier. So NG finished the shortened season near the highs and +$1,000 from the morning spike low at 7am, after some overnight guidance confirmed a much milder, NEW pattern emerging late in week 2 and dropped us for 6+ hours.
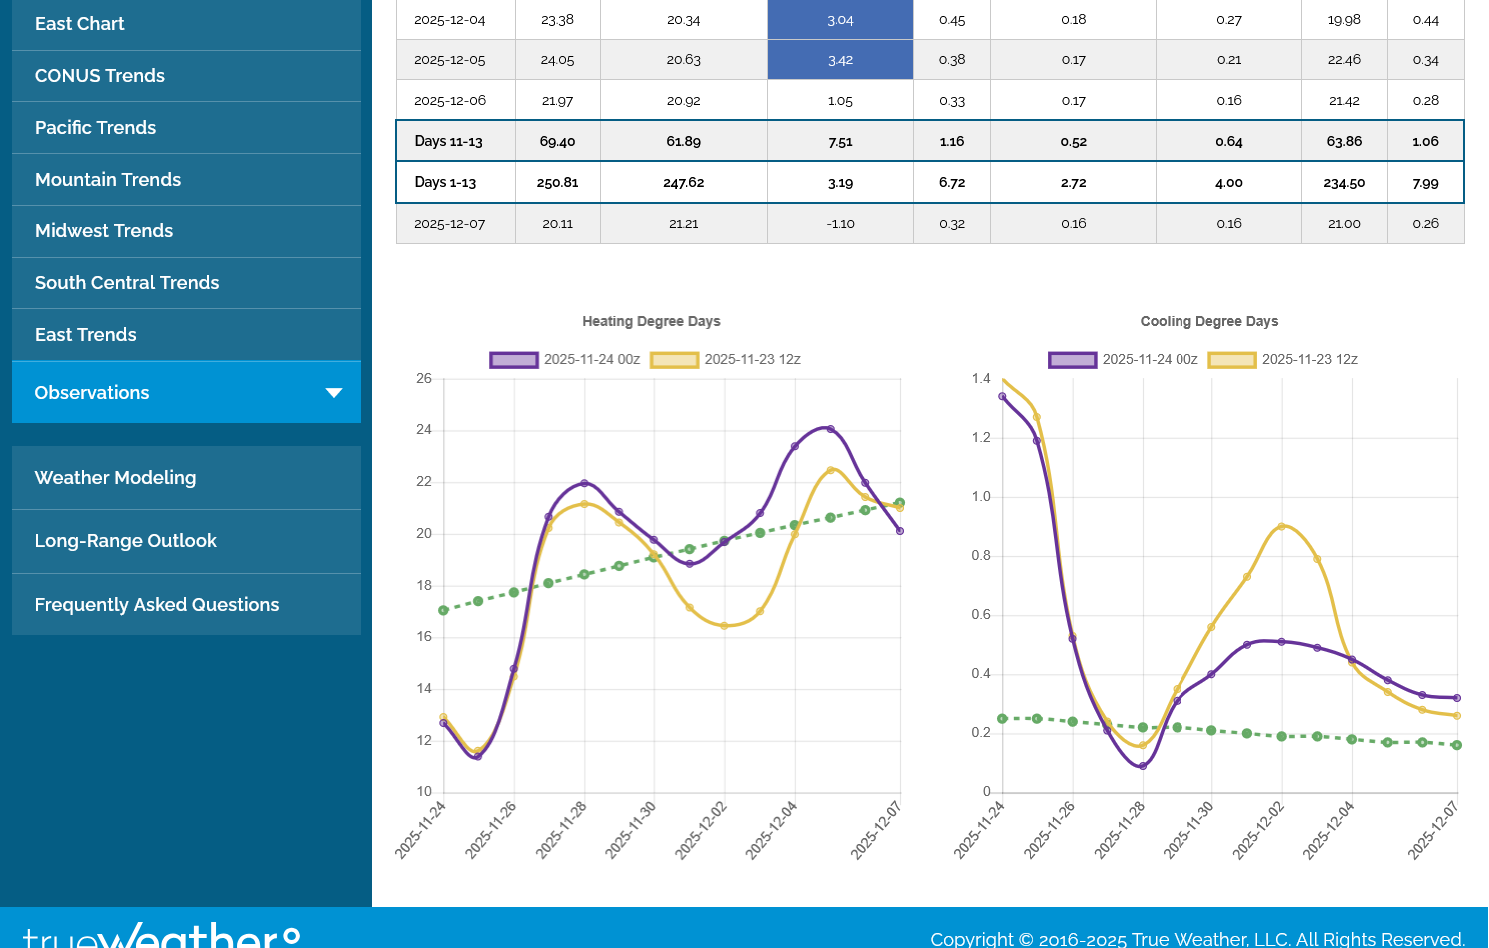
I’m looking forward to Mike’s assessment of how much colder today’s 0Z EE is vs yesterday’s 12Z, which he already told us was a whopping 12 HDD colder than yesterday’s 0Z EE. I’m guessing it’s ~10 HDD colder. If so, that would be a 22 HDD colder vs 24 hours ago!
The last 0z EE overnight was another +10 HDDs with NG trading an abbreviated session being +$1,800/contract compared to the Wednesday close. It's the purple line on the chart to the left. These were all COLDER individual days and NOT a pattern change compared to previous guidance.
We should note the trajectory and slope is DOWN. Unless this changes, the lines will cross below the average and become bearish at the end of week 2(extent of this forecast).
It's weather and can change and recent model forecasts have had a strong tendency to get colder with time.
I guessed 10 HDD colder 5 minutes before your post! I bet you missed my post.
Larry, YOU NAILED IT!!!
Are you sure that you weren't doing the Vulcan Mind Meld on me from a couple states away?
Actually, its not shocking that we would both be thinking of the same thing at the same time because our minds are synchronized so often on natural gas and weather.
https://www.youtube.com/watch?v=p_5Dt-kNgz8
Thanks, Mike. 12Z GEFS is going to be sig. colder than prior runs.
Yes I'm seeing that in real time just like you!
++++++++++
Larry, this last 12z GEFS, in purple on the left, exactly as you stated was +12 HDDs compared to the previous 6z GEFS.
Last night's 0z EE was ahead of the GEFS on this.
NG is +2,400/contract from the Wednesday close!
This chart below is a bit misleading. It shows only the continuous price that doesn't take into account the rolling over of the front month to a NEW contract when the old one expires.
We are trading January natural gas right now.
The contract high for JANUARY natural gas was on November 13, 2025, 15 days ago. We are still just below that.
The price chart below was plotting the price of DECEMBER natural gas on November 13, 2025 which was LOWER than January's price.
But this puts us in a profoundly interesting place, technically. The markets closed early today, with NGF26 +$3,000 from the previous close(+$600/contract more than the previous post) and almost at the highs.
The chart formation and indicators for this particular commodity (known for big price gaps on Sunday Night) are all screaming out for a gap higher open on Sunday Night which would be an upside break away gap, gapping above previous contract highs..........profoundly bullish.
However, the setting is actually a selling set up for me because of the longevity of this move higher on cold (long in the tooth) and speculative buying is at a stage where it can become exhausted.
Most importantly, whenever 1 extreme weather pattern flips to something much less extreme(in a weather sensitive market)........the price will respond in the opposite direction.
As mentioned a couple of weeks ago when it looked like we topped. If we add enough cold we will go higher again. That happened. The same thing will happen if we add even more cold in early December. We can go higher yet.
The earlier it is in the weather trading season, the bigger the speculative moves can be, all things being equal. Near the end of the season means we're running out of time to make a substantive difference in storage as HDDs run out. This is DEMAND SIDE fundamentals.
Same thing in the grains with weather but instead, we run out of time to hurt the crop which is a supply side aspect of the impact on prices.
https://tradingeconomics.com/commodity/natural-gas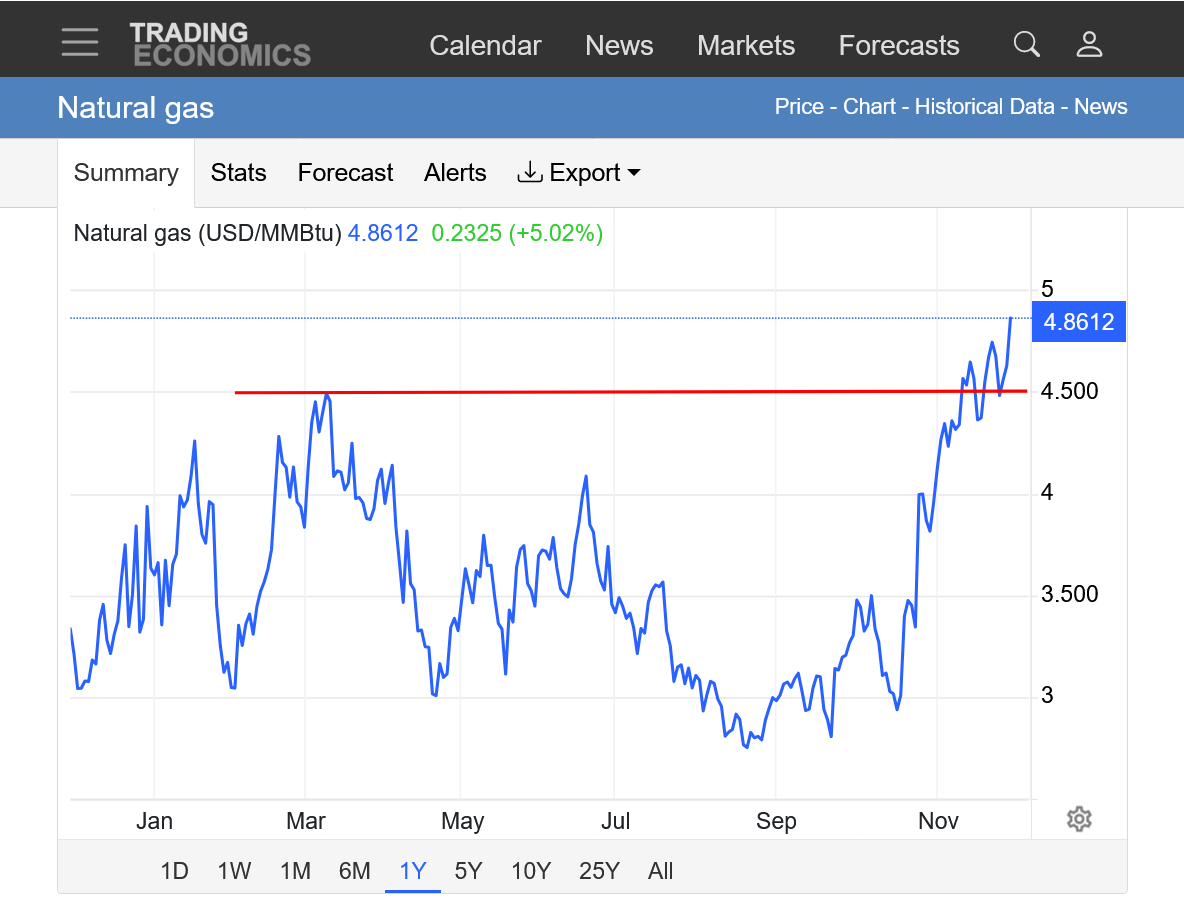
The last 12z EE actually had -1 HDDs but it confirmed the previous much colder one:
Please note the trajectory over all................DOWN even as the green dashed line which is the historical average (climatology) in increasing. This is a selling set up for me.
The big problem is that the models, the past 2 weeks have shown horrible skill forecasting the cold.
They've been ADDING more and more cold short term(individual days) and EXTENDING the cold pattern longer and longer.
This has allowed NG, after putting in what looked like a typical early heating season high to come roaring back.
The colder/much colder model solutions continues!
This last European Ensemble model was another +13 HDDs!!
Uncertain about the open in a couple of minutes. Maybe up a tad?
I would be a seller here, if anything.
++++++++++++++
We did actually open several ticks higher but then sold off. The late week 2 and beyond part of the forecast looks like a pattern chance to milder which would be BEARISH to demand from residential heating and prices. However, forecasts similar to that the last several weeks have repeatedly gotten colder.
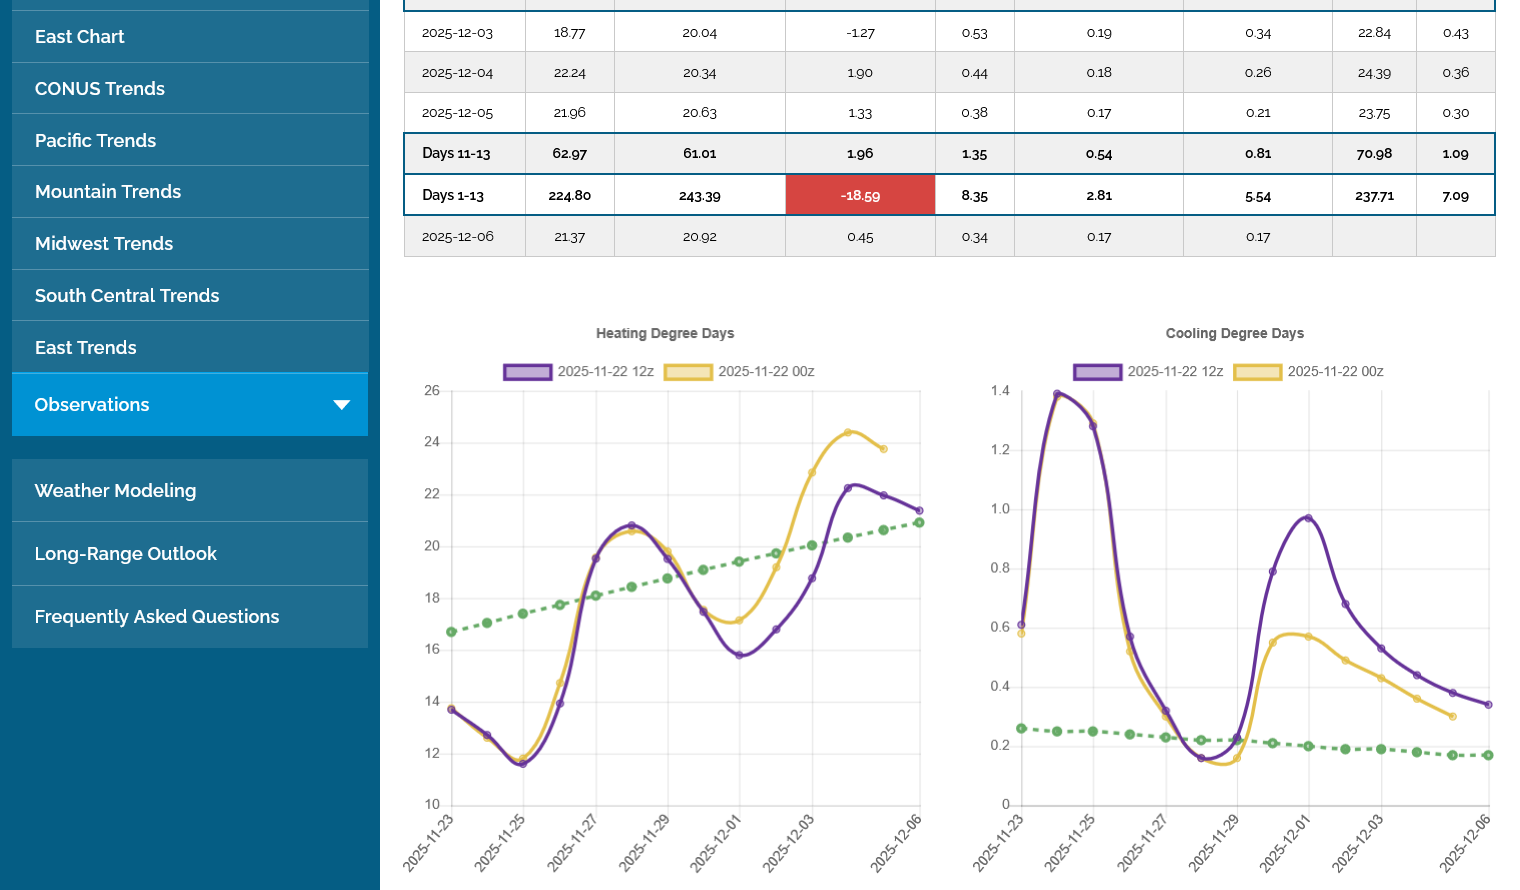
Forgot to add the chart with this last post. The red line at the top/right was tonights open.
There were prices the past week.
This last 18z GEFS came out milder until the last several days which were COLDER. It ended up with the same total HDDs.
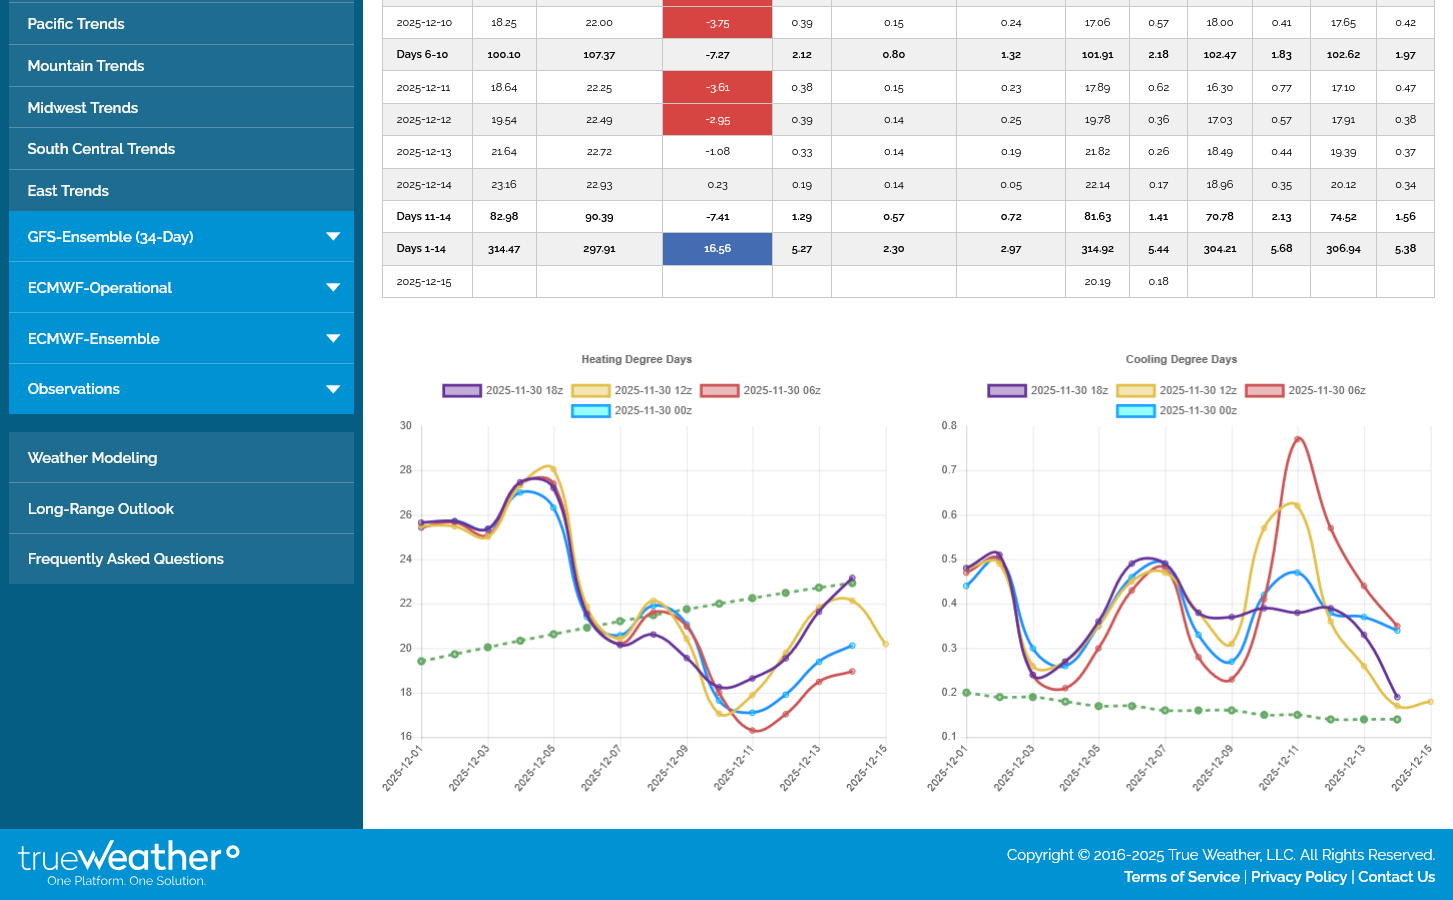
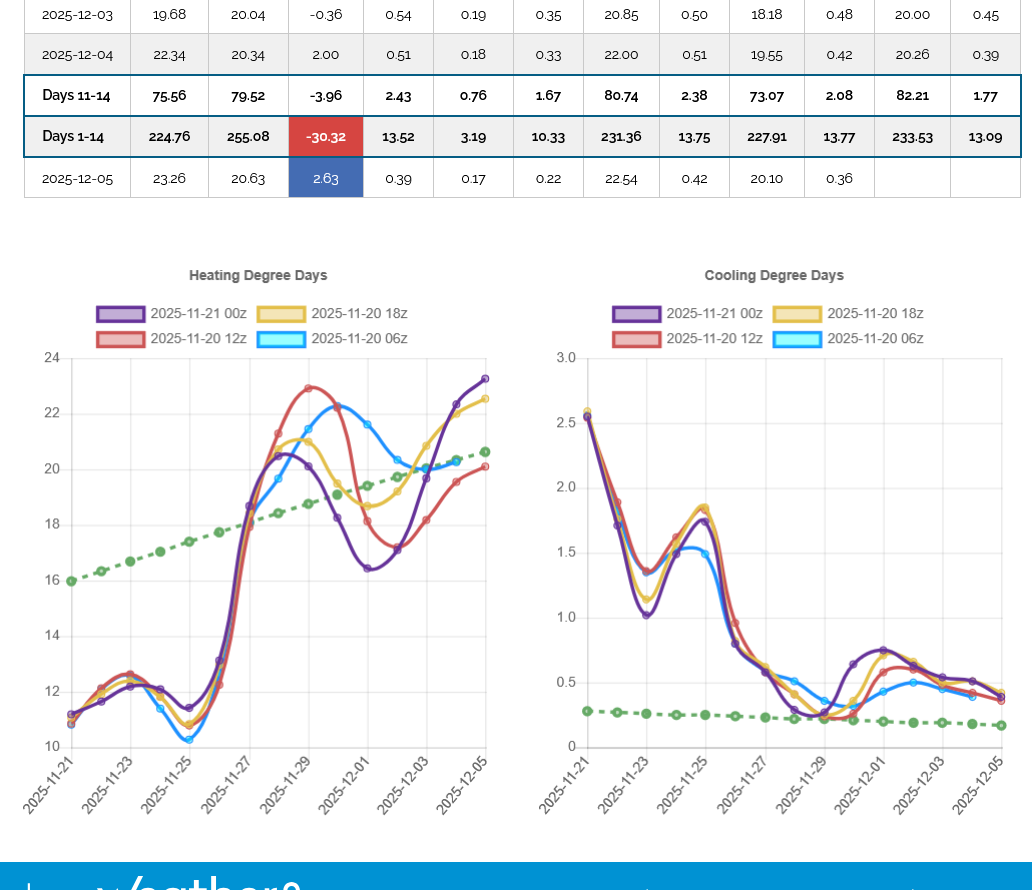
The 0z European Ensemble came out MUCH milder. These are temperatures compared to the previous, 12z run on day 11!!!
Much milder Pacific air has spread across the entire country.
The HDDs are not out yet but they must be at least -12 HDDs changed from 12 hours earlier. There were some colder days earlier in the forecast, otherwise the magnitude of the total change would have been even greater.