I hate to part ways with what was probably the best trading forum thread or any thread at MarketForum EVER going back 2+ decades.
Several posts of the week and Hall of Fame posts by several posters.
However, that one was also near record length and its time to move on.
Stock Market 10-24-25
74 responses |
Started by metmike - Oct. 24, 2025, 9:42 a.m
https://www.marketforum.com/forum/topic/115443/
+++++++++++++=
I'll start this new thread off, with the last message on the old thread:
1 like
By metmike - Nov. 10, 2025, 7:27 a.m.
Everybody posting in this thread shares the same love of ANALYSIS AND BEING BLESSED WITH ANALYTICAL MINDS!
Trading provides a wonderful challenge for us to exploit our analytical minds. Making money is the objective and also the metric to judge our success but it goes beyond that! It's something inside of us that drives how we think. Many human beings thrive on competition and trading provides that opportunity to compete against and in the market with the "Composite Man" as Wyckoff referred to as everybody in the market's thinking and acting combined at one time.
tjc has mentioned this aspect of trading that drives his love for it.
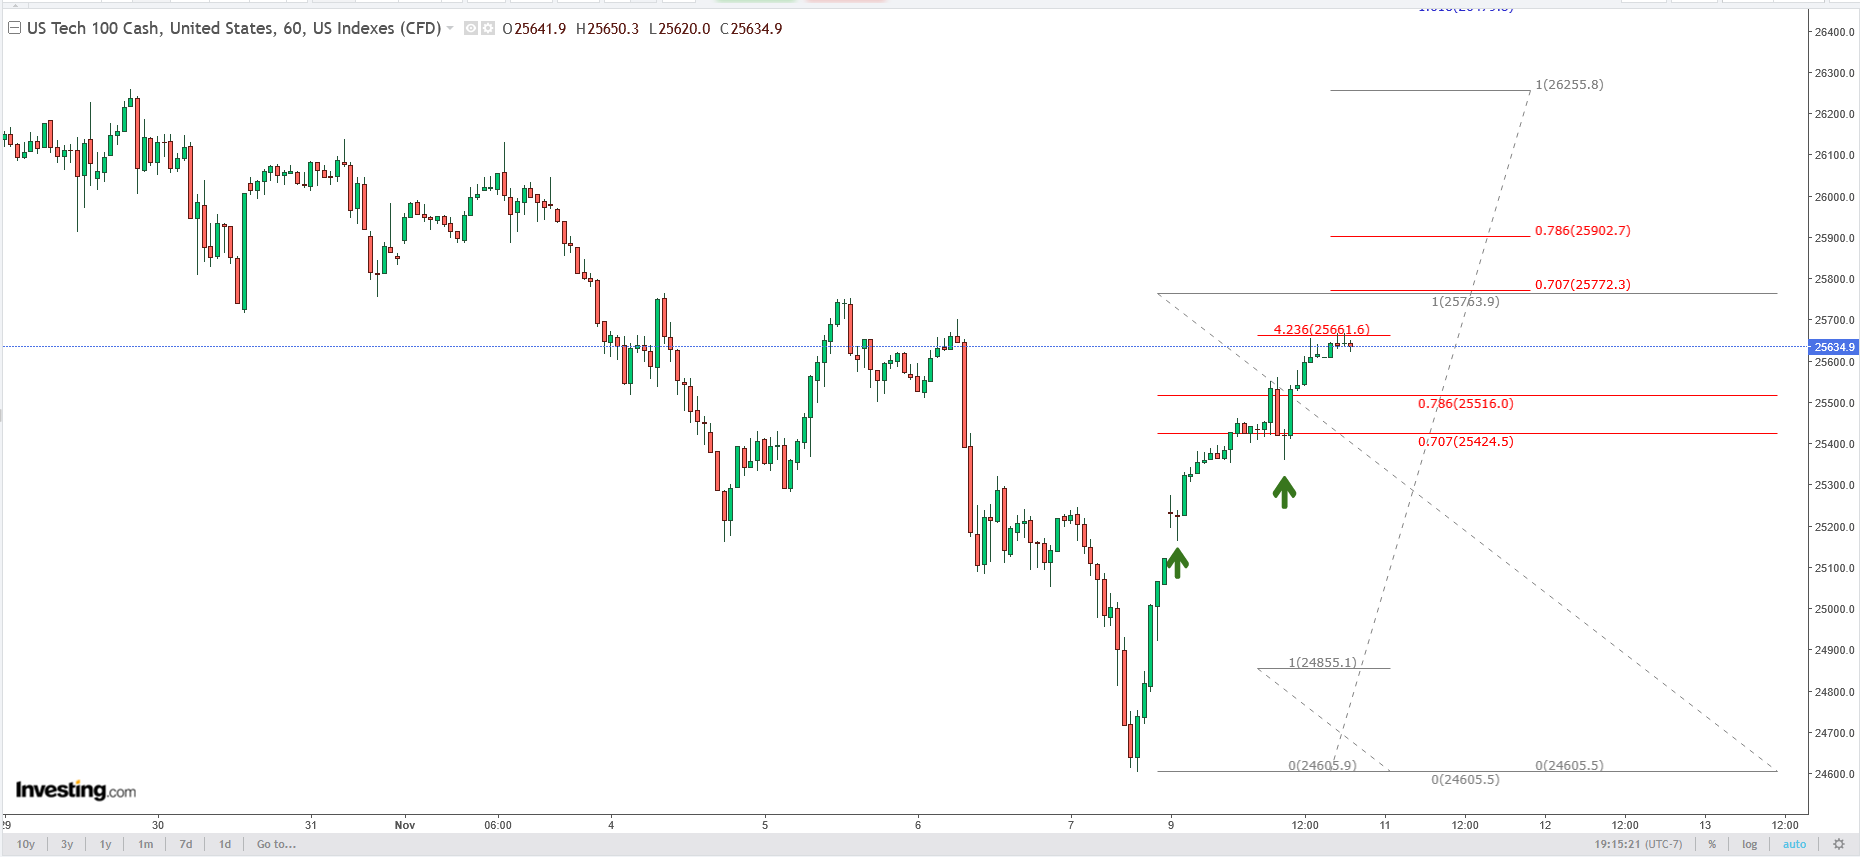
The above chart is the NQ hourly as of right now.
The gap up on Sunday's globex session was simply a continuation of the buy thrust from Friday; buying on Friday continued strongly in the futures market after the cash close (that was your "sign")
The NQ is currently pausing after hitting the 4.236 extension from the early Friday thrust, we may see a bit of a correction since we are definitely in overbought territory, notice however how we blew through the initial 0.707 and 0.786 retracement levels = bullishness
Still a bad time to go short here imho.....
We may have a possible temp short coming up as I'll explain with the next chart
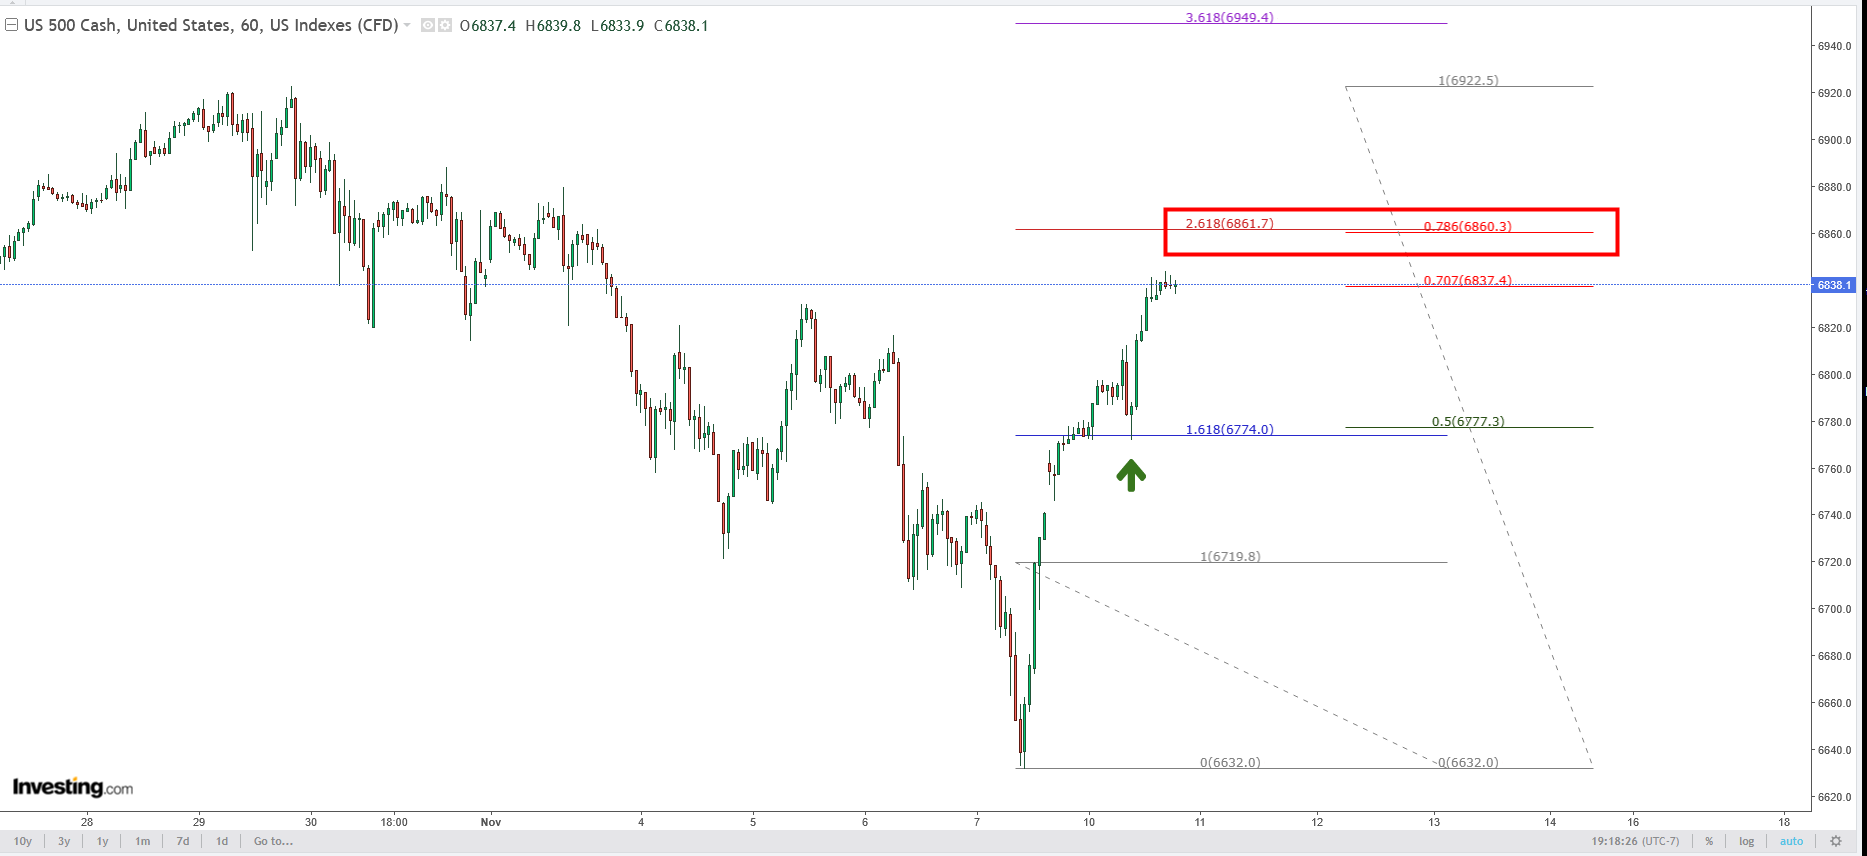
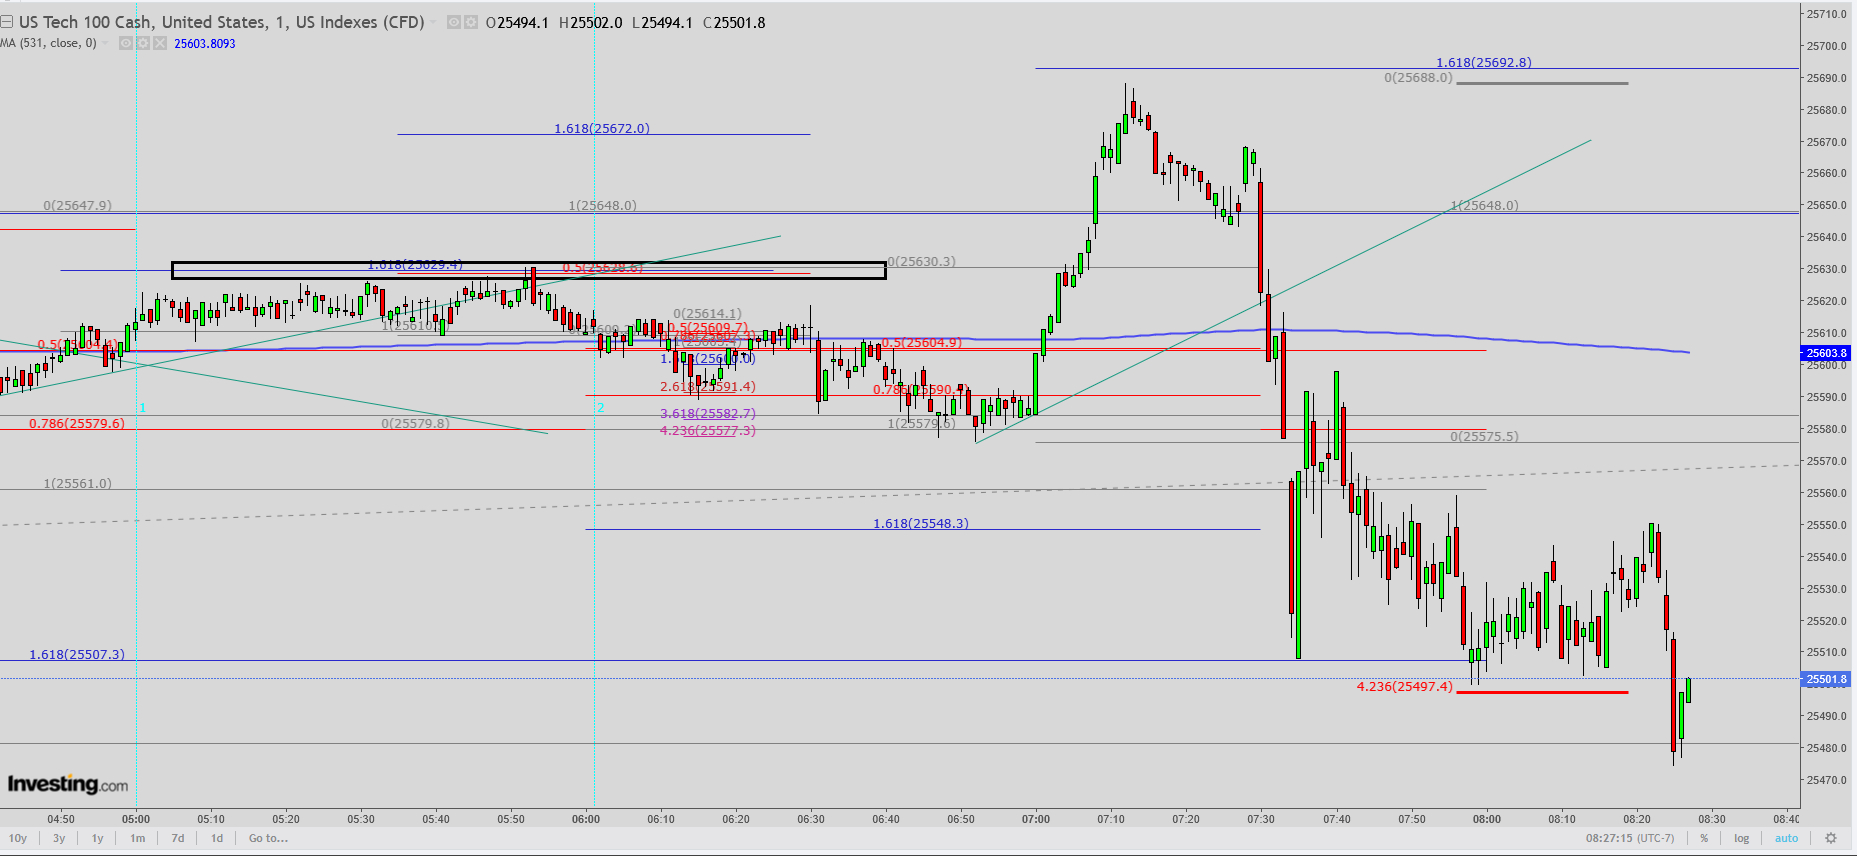
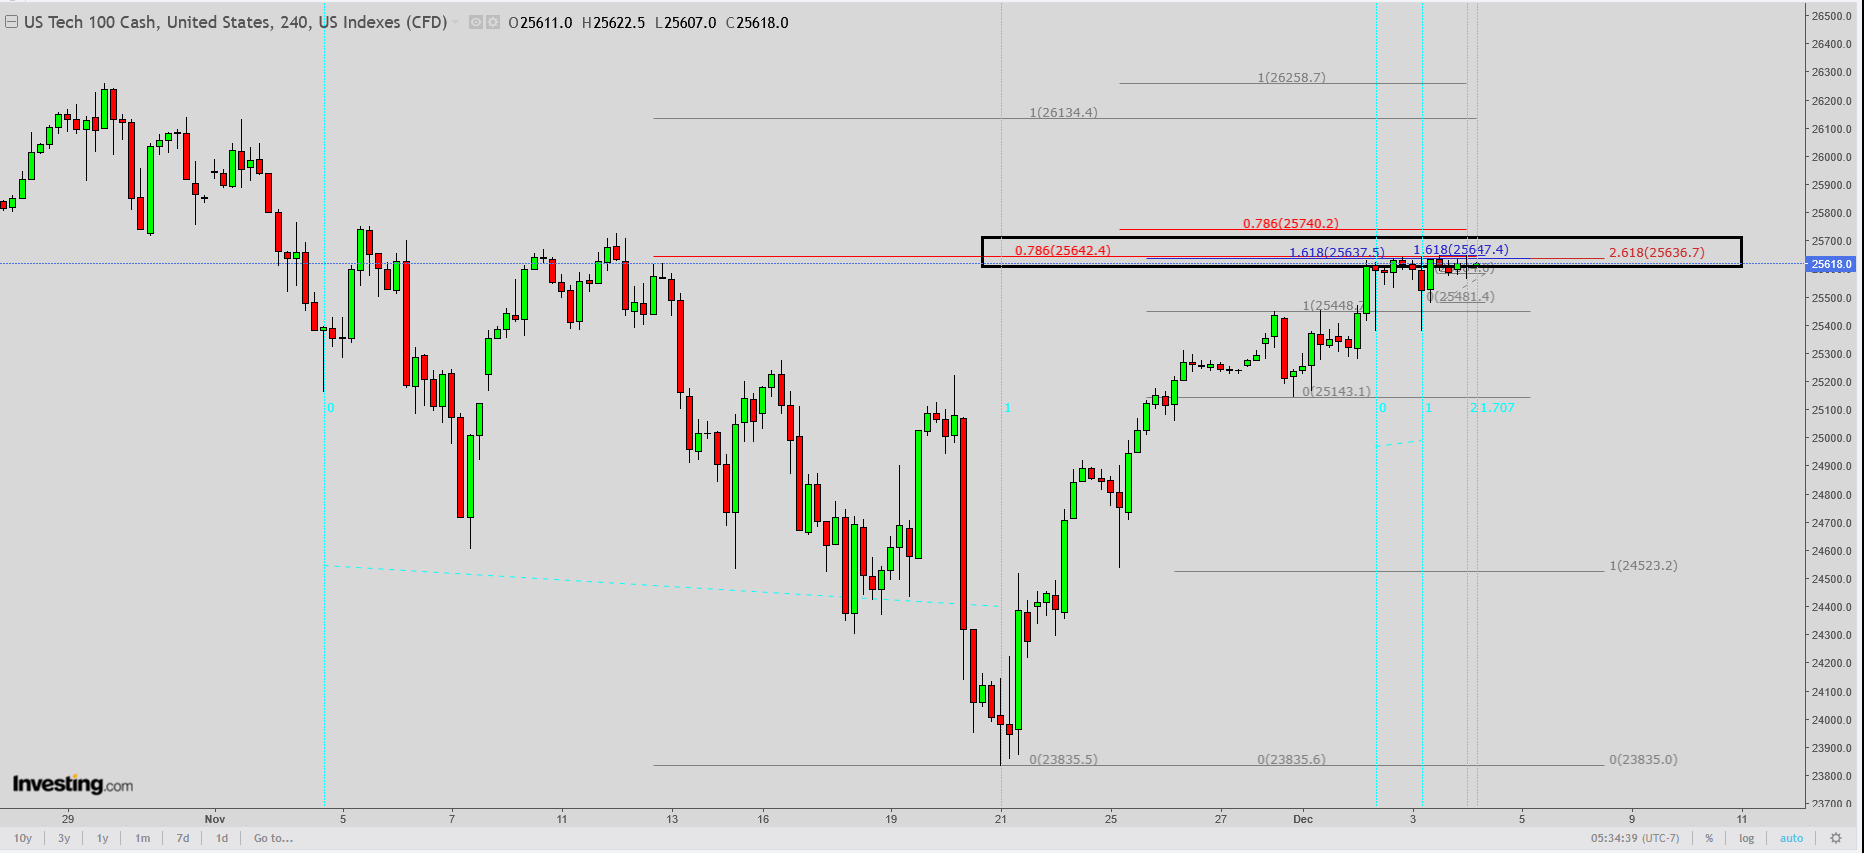
The above chart is the ES hourly
After the Friday upthrust we gapped up here as well
We again saw a powerful upthrust in the morning when the market came back to test the 1.618 extension level from the Friday lows, coinciding with the 50% retracement from high to low (ding ding ding ...)
There is a point of interest on this chart at the 0.786 retracement and 2.618 extension confluence roughly within a point and a half from one another
That may provide the first selling point in this upthrust ....
I still would be hesitant to go heavily short though, we're not at that point yet imho
Trade safe my friends !
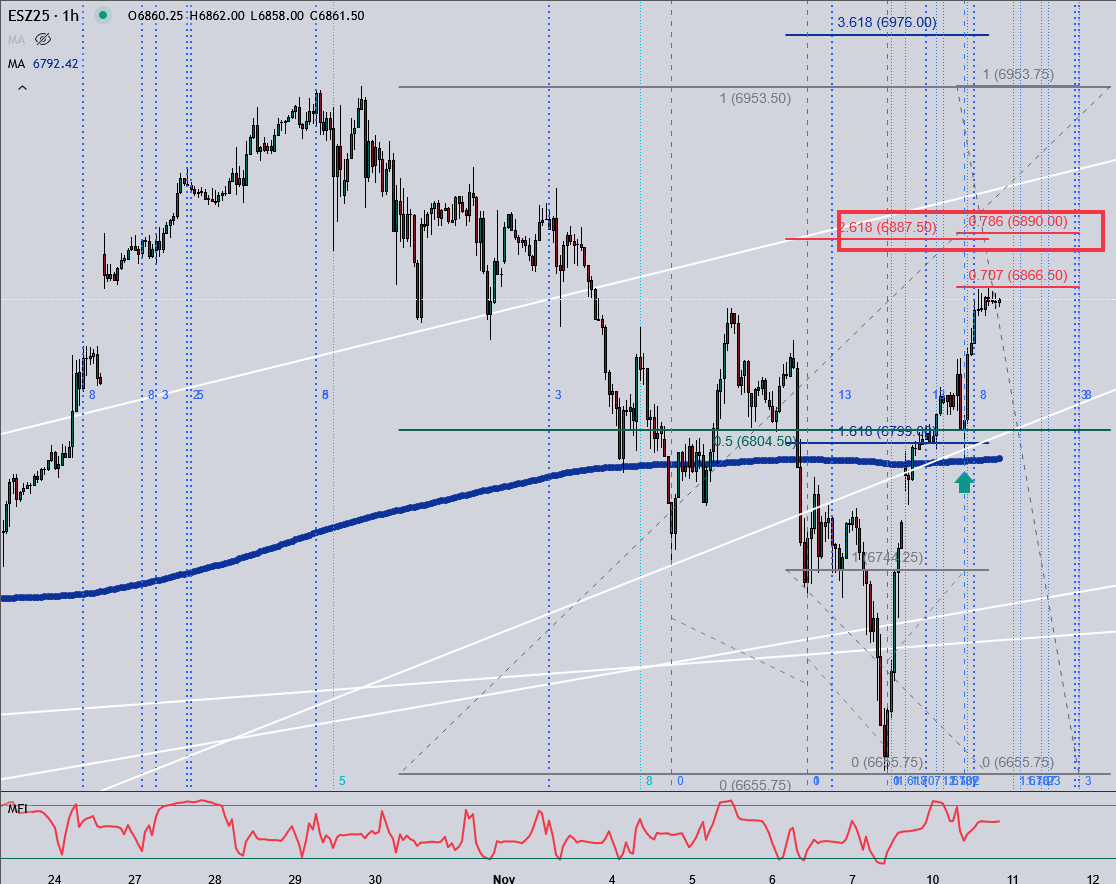
The above chart is the ES December contract showing the same area highlighted on the ES continuous contract above it, just for reference ...
Thanks for the comprehensive update, kris!!!
https://www.fool.com/investing/2025/11/13/stock-market-soar-if-court-rejects-trumps-tariffs/
President Trump warns of an economic disaster similar to the Great Depression if the Supreme Court rejects his authority to impose tariffs
However, Trump may have exceeded his authority because the IEEPA does not explicitly authorize tariffs. Indeed, three different courts have already ruled the tariffs illegal, including the U.S. Court of International Trade, the U.S. Court of Appeals for the Federal Circuit, and a federal district court in Washington, D.C. The issue now sits in front of the Supreme Court.
Maybe Trump bragging about how he's caused the stock market to make 49 highs this year on Wednesday evening, including yesterday(according to him) was the kiss of death
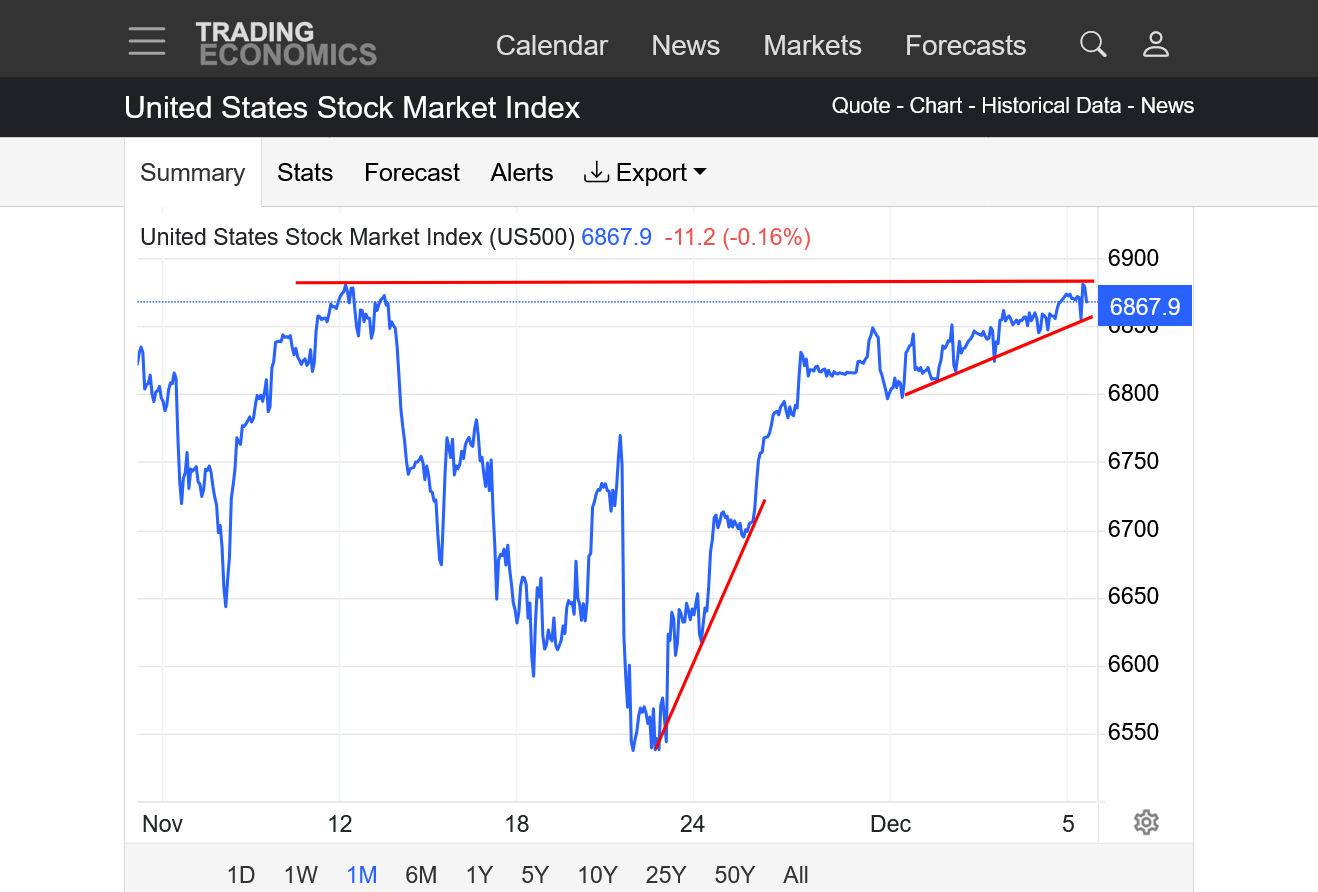
https://tradingeconomics.com/united-states/stock-market
https://finance.yahoo.com/news/stock-market-doing-something-does-114900450.html
Above is the current state of the Nasdaq hourly and daily [continuous contract], charts are pretty self explanatory ...
We may see a reaction to the upside at today's cash open ...
Trade safe my friends !
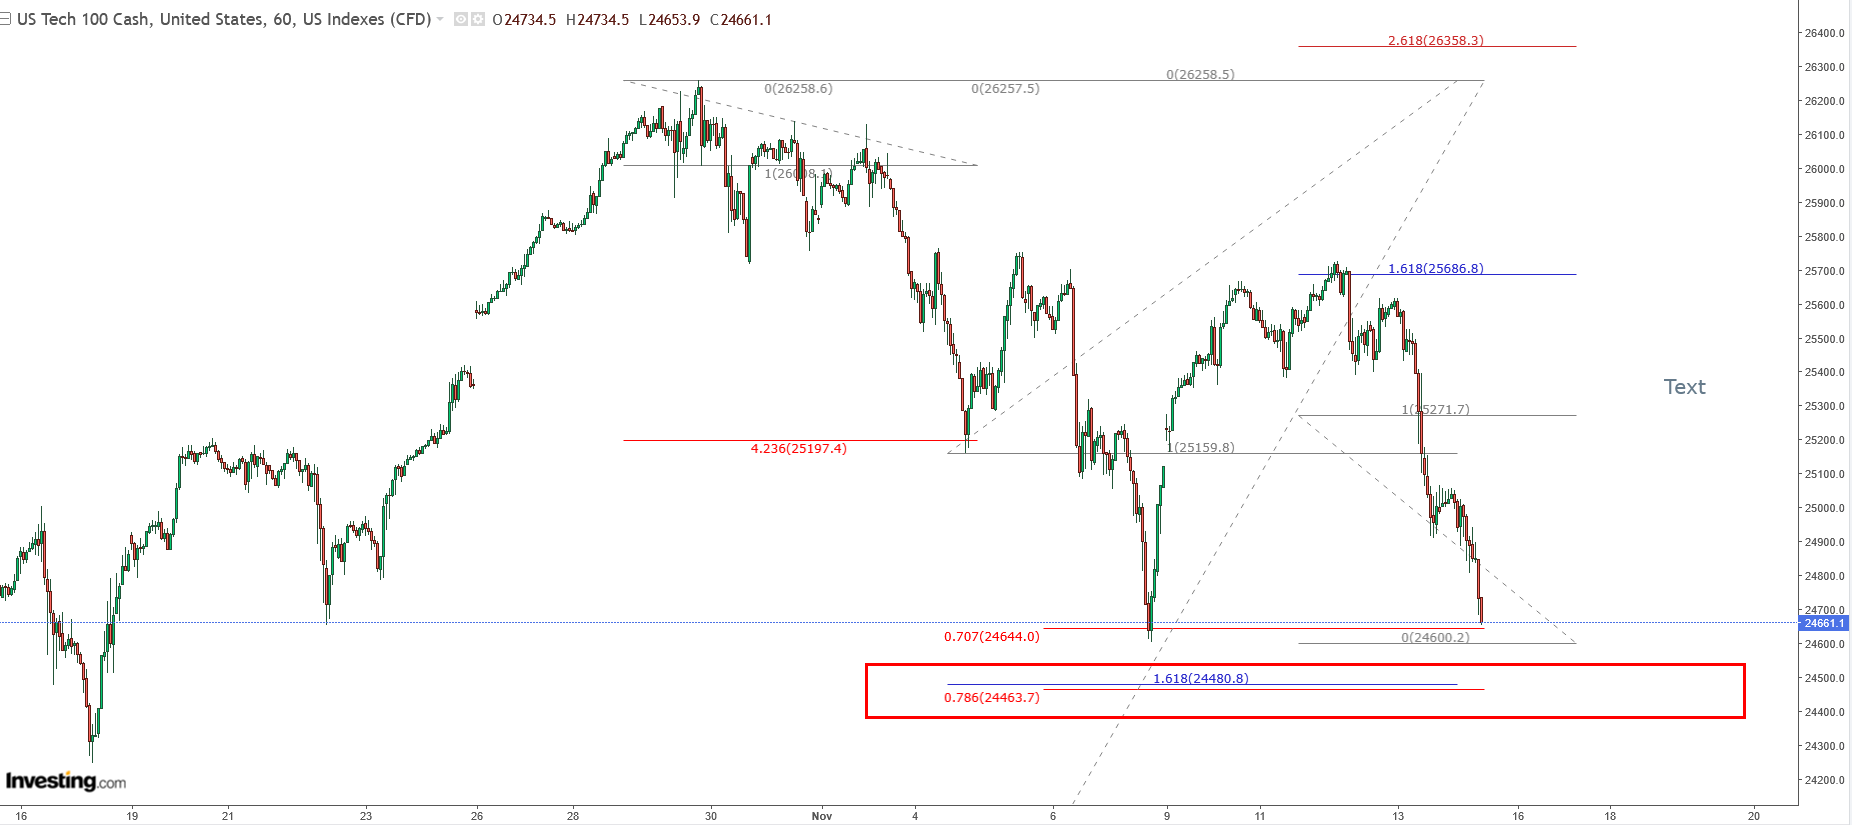
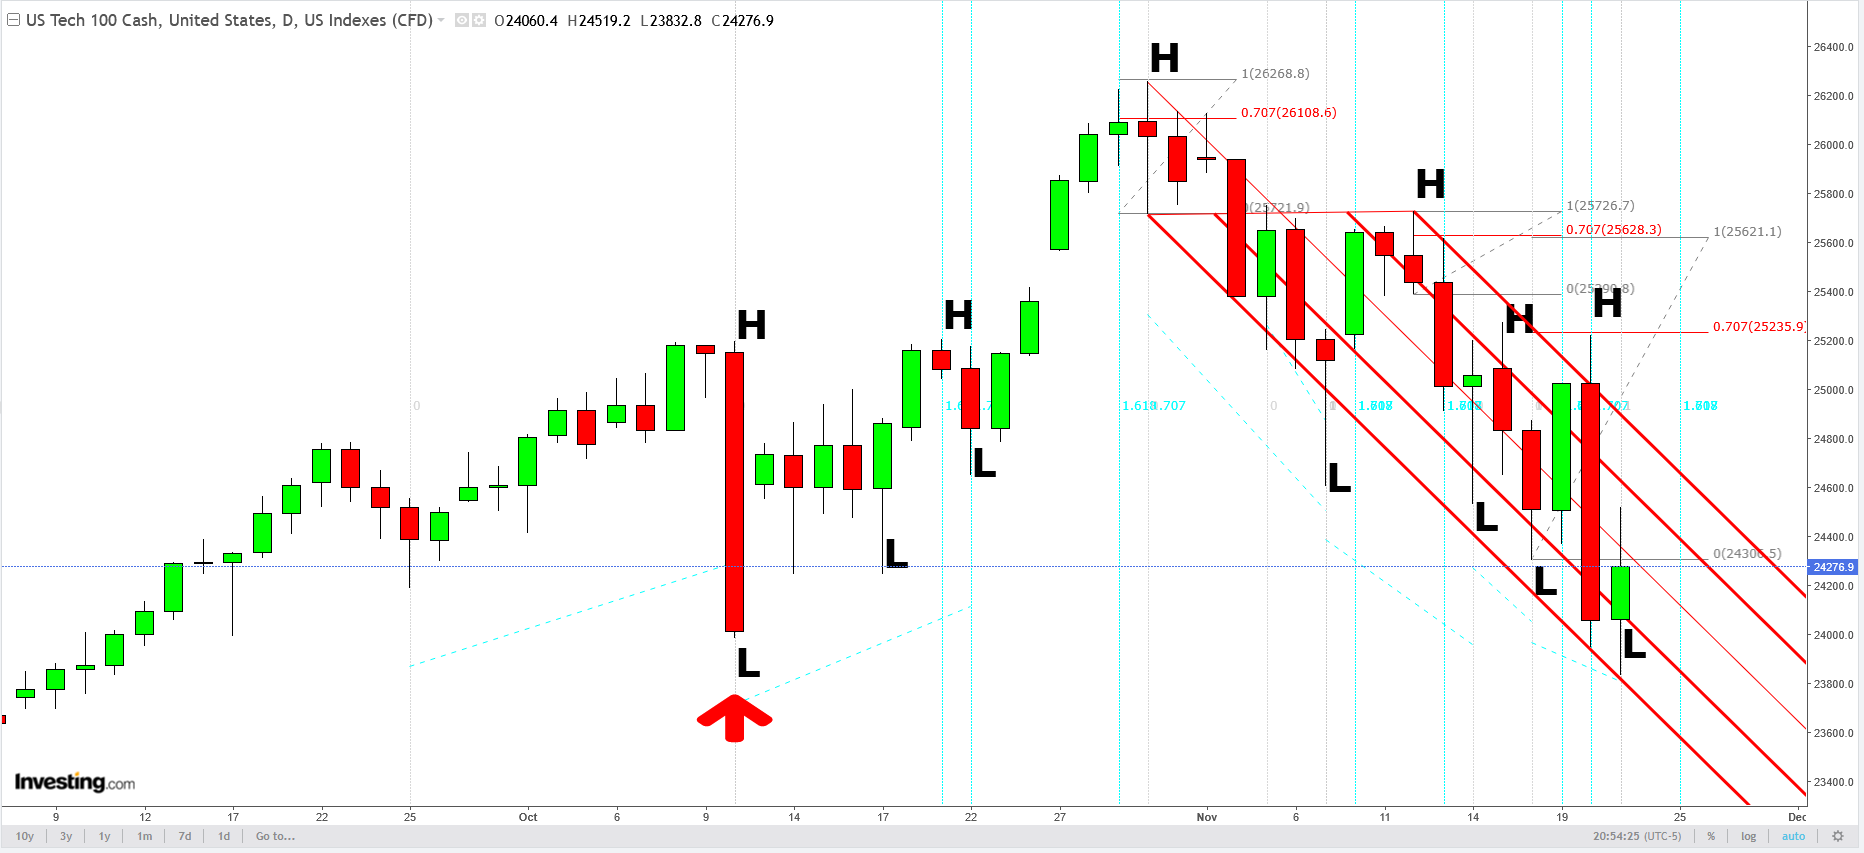
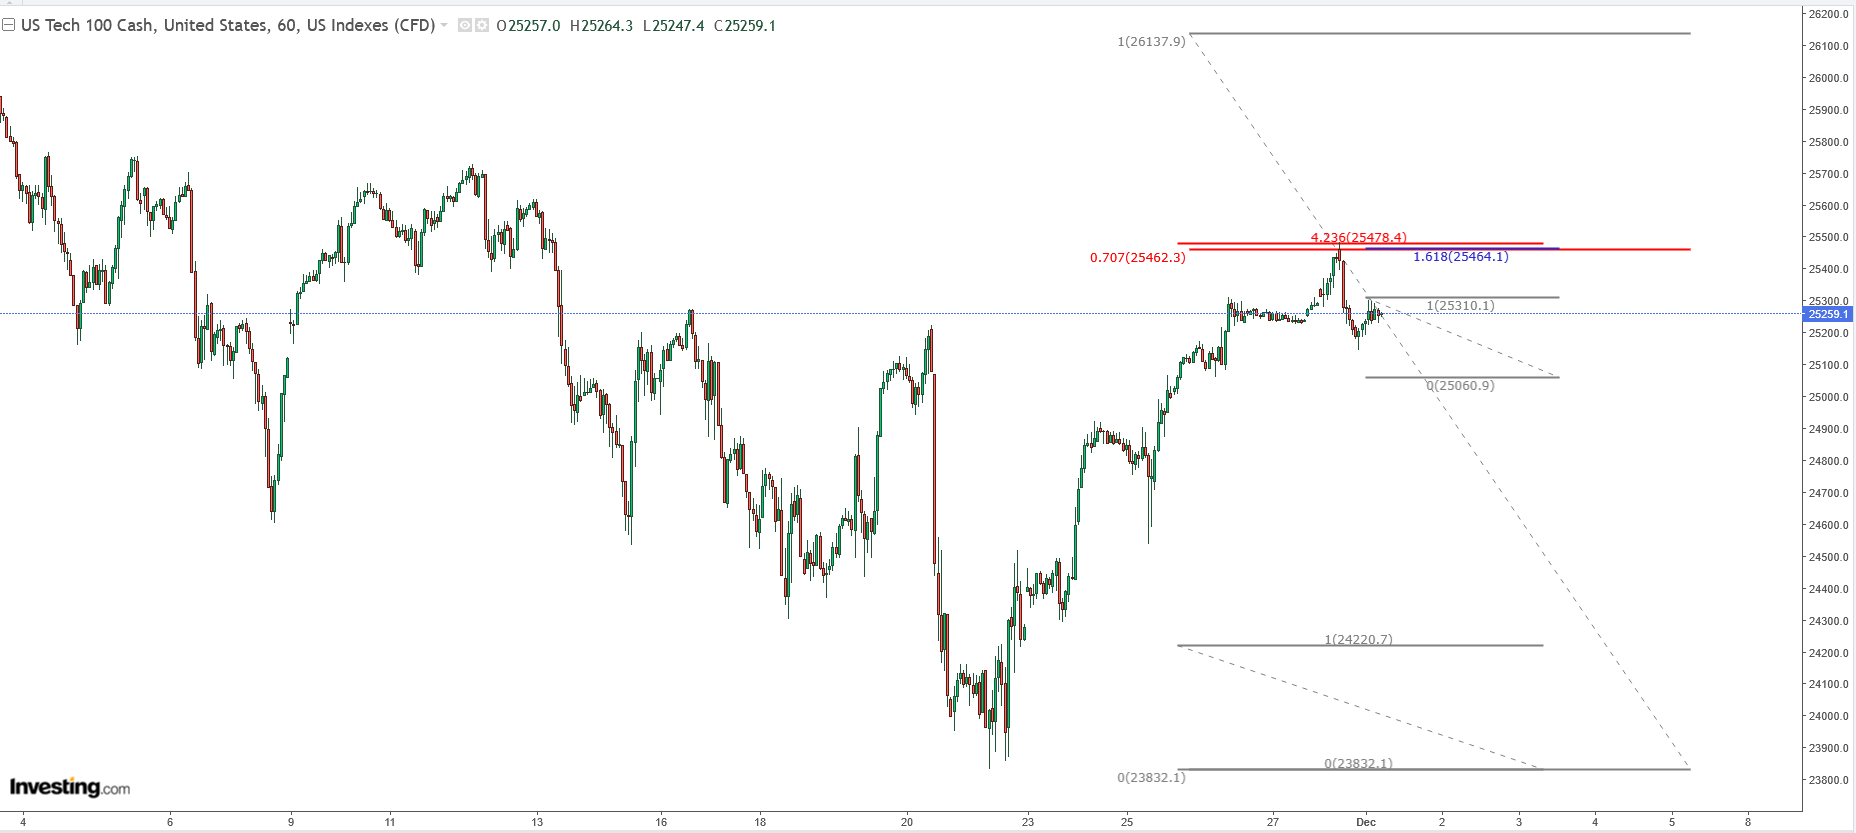
The above chart is the NQ December contract
Until and unless we close above the retracements and extensions on the chart the trend will resume down
We do have what looks like a bull flag formation but be wary of traps (up or down) !!!
I mention at times that the markets like round numbers: the December contract is at 25300 while the continuous contract is at 25200 ..... !?!
Thanks very much kris!
I'm amazed that the way over valued, self fulfilling prophesy, rich person's ponzi scheme refuses to die!
metmike, I too view forced participation in Social Security a ponzi scheme. BUT, what's a pour girl to do?
Looking at the chart ya have to ask? Would Jessie Livermore be long the market?
I'd like to update the chart posted last Aug. 25th (note; adjusted fib anchor pts. to reflect actual high/low)
Friday's spring, I'm looking for the uptrend to continue as long as we stay above the blue shaded wick.
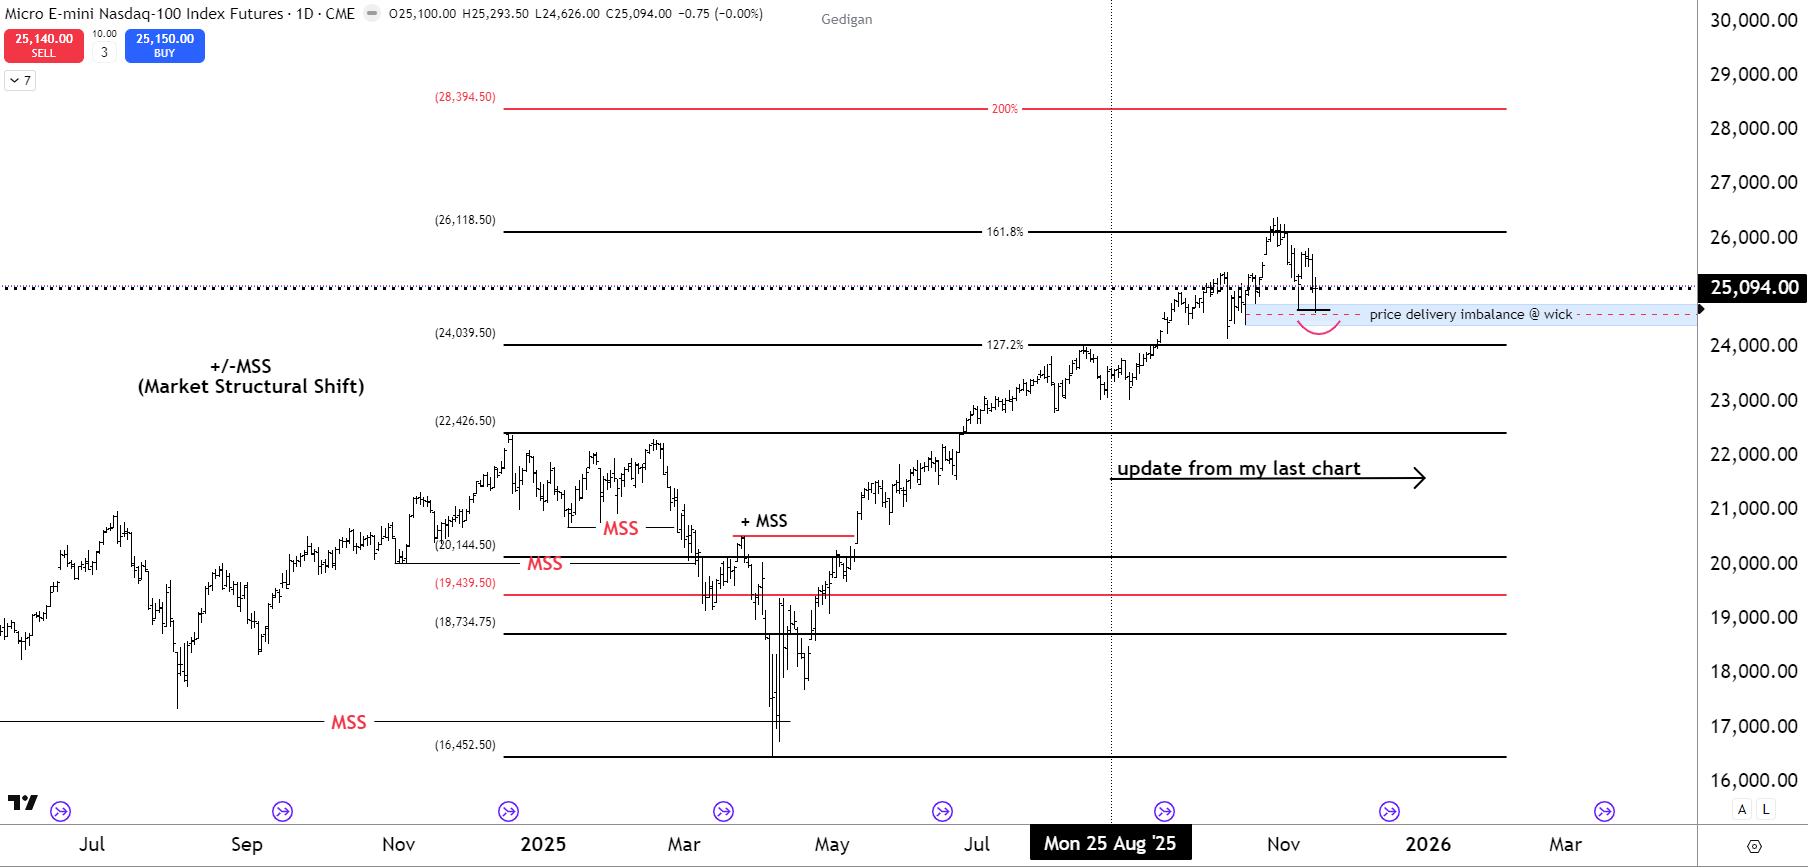
Thanks, gedigan!
The trend is your friend and it's still up which would seem to be the most likely direction, especially considering the markets resilience in the face of so many reasons to go down.
If a market refuses to go down on bearish news, it's telling you something. However, even the stock market has a limit for ignoring bearish news and there's plenty more to come.
Regardless, I'm an energy/crops trader and you're the expert on the stock market. Your wonderful contributions are greatly appreciated.
Thank you, I appreciate that. Expert is too strong a word for what I do. I'm here to share what I see and understand, so others can gain value.
Things could get pretty ugly here! Unless the self fulfilling prophesy, speculative troops come to the rescue again at key support..........which they have been doing over and over and over.
If not, the stock market cat bull with 9X lives finally dies.
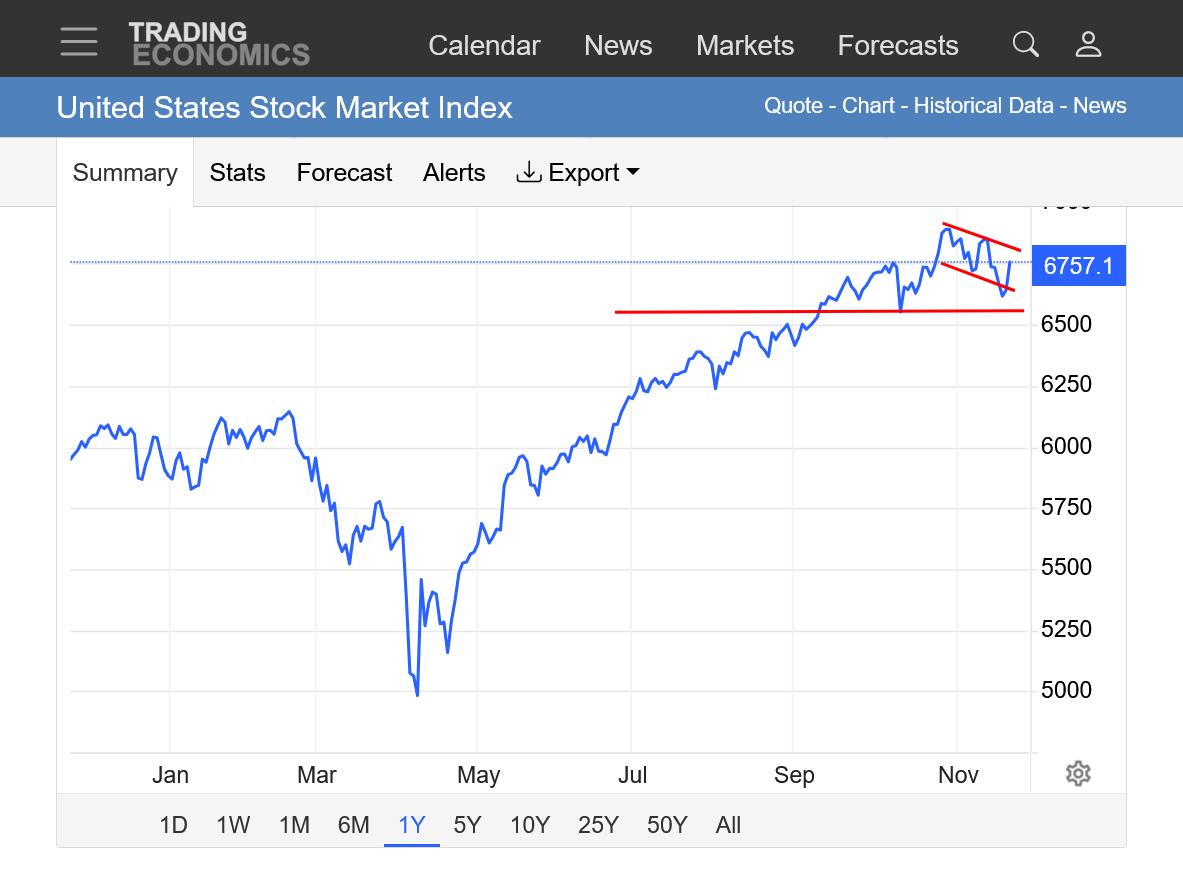
1. 1 year
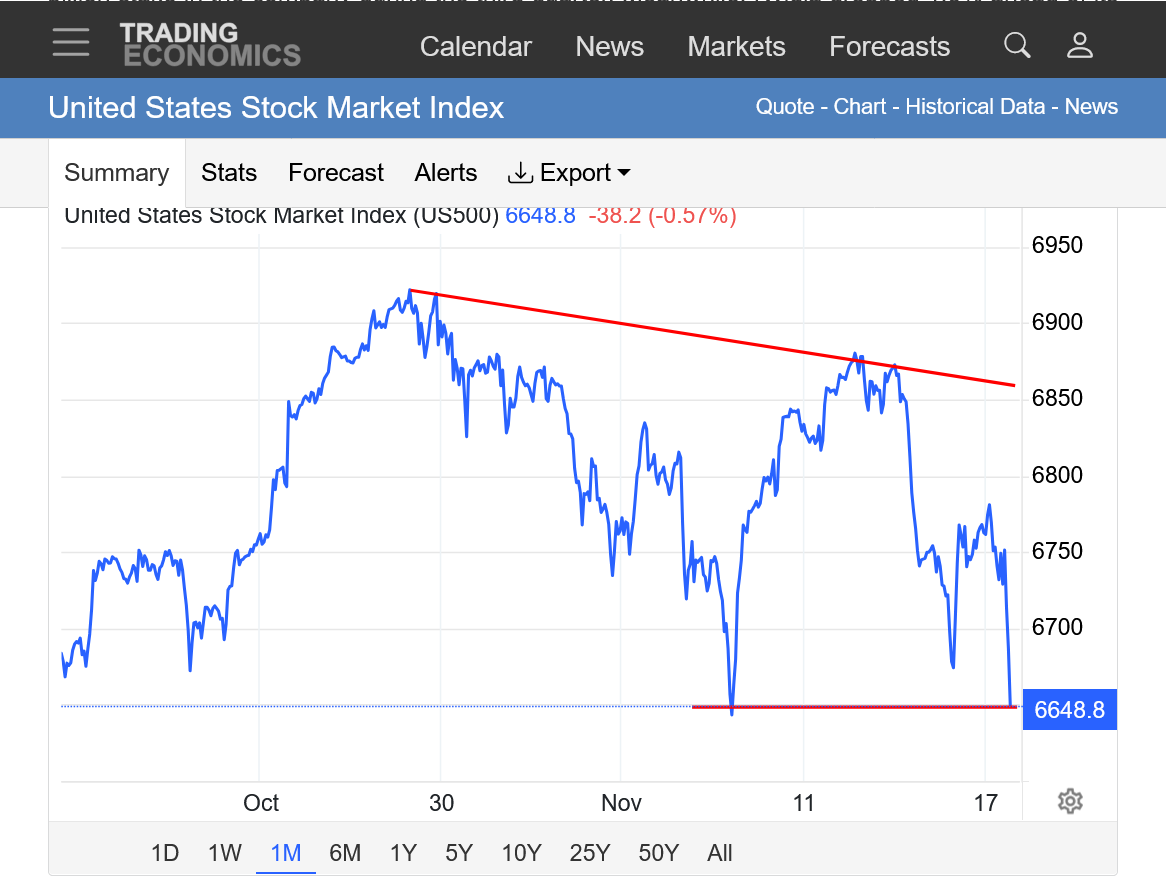
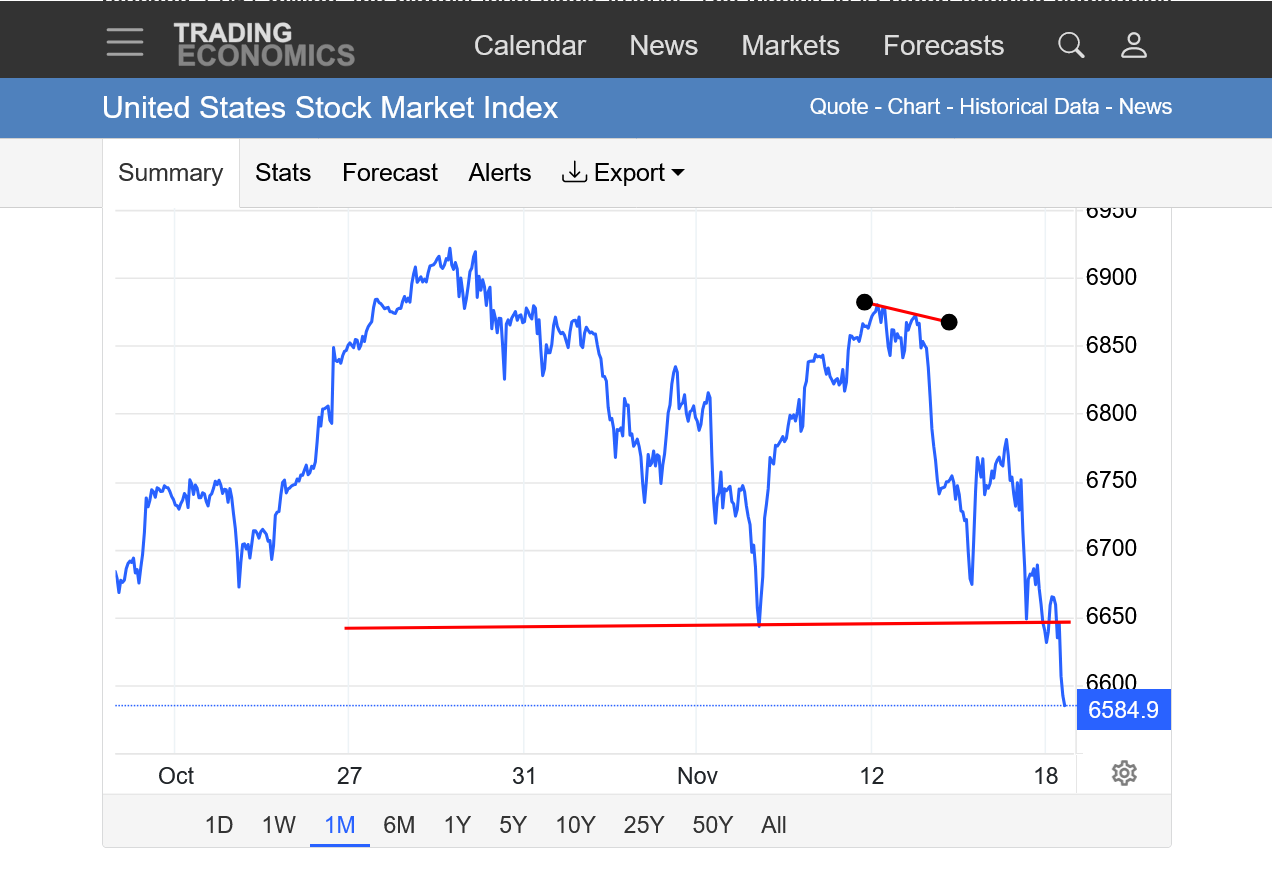
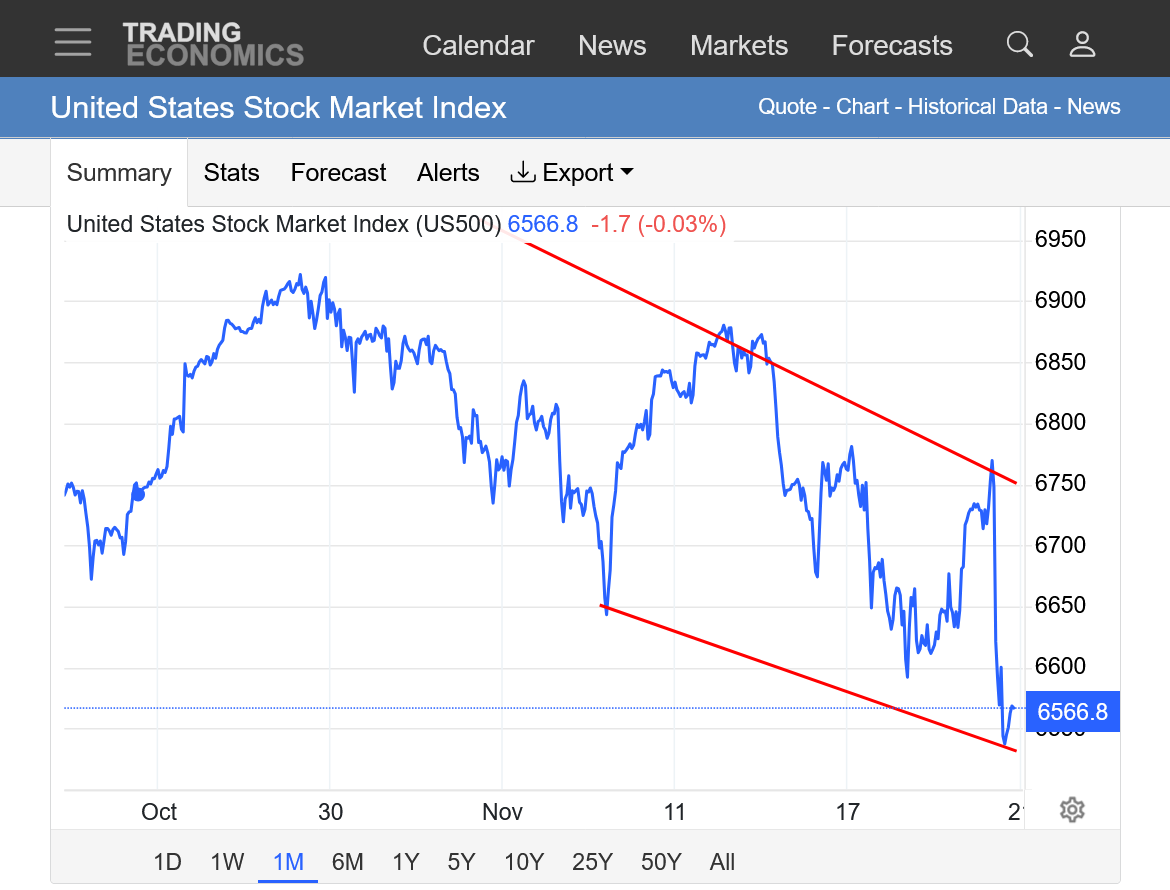
2. 1 month
https://tradingeconomics.com/united-states/stock-market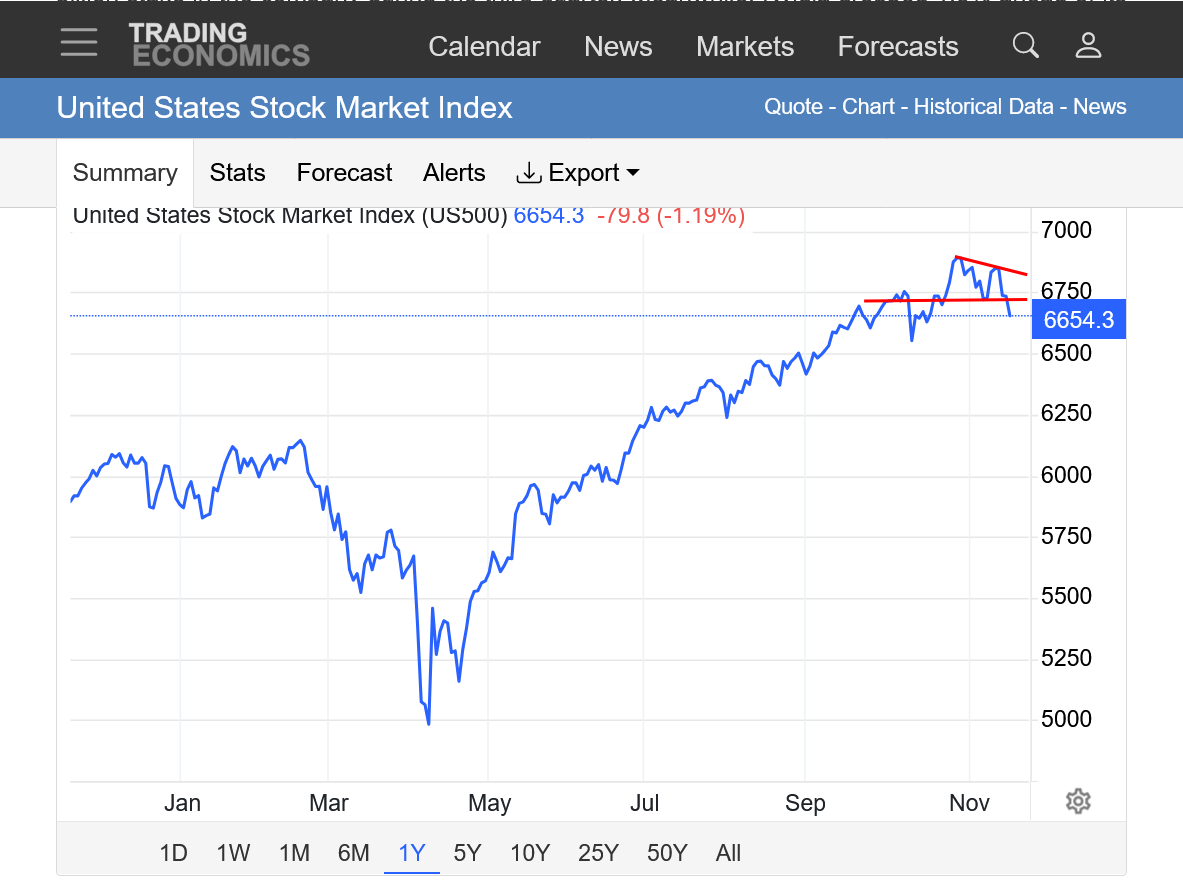
https://tradingeconomics.com/united-states/stock-market
joj had speculated on the potential of the stock market putting in a buy the rumor, sell the news type top early last week and it appears that he was right(a couple of days later).
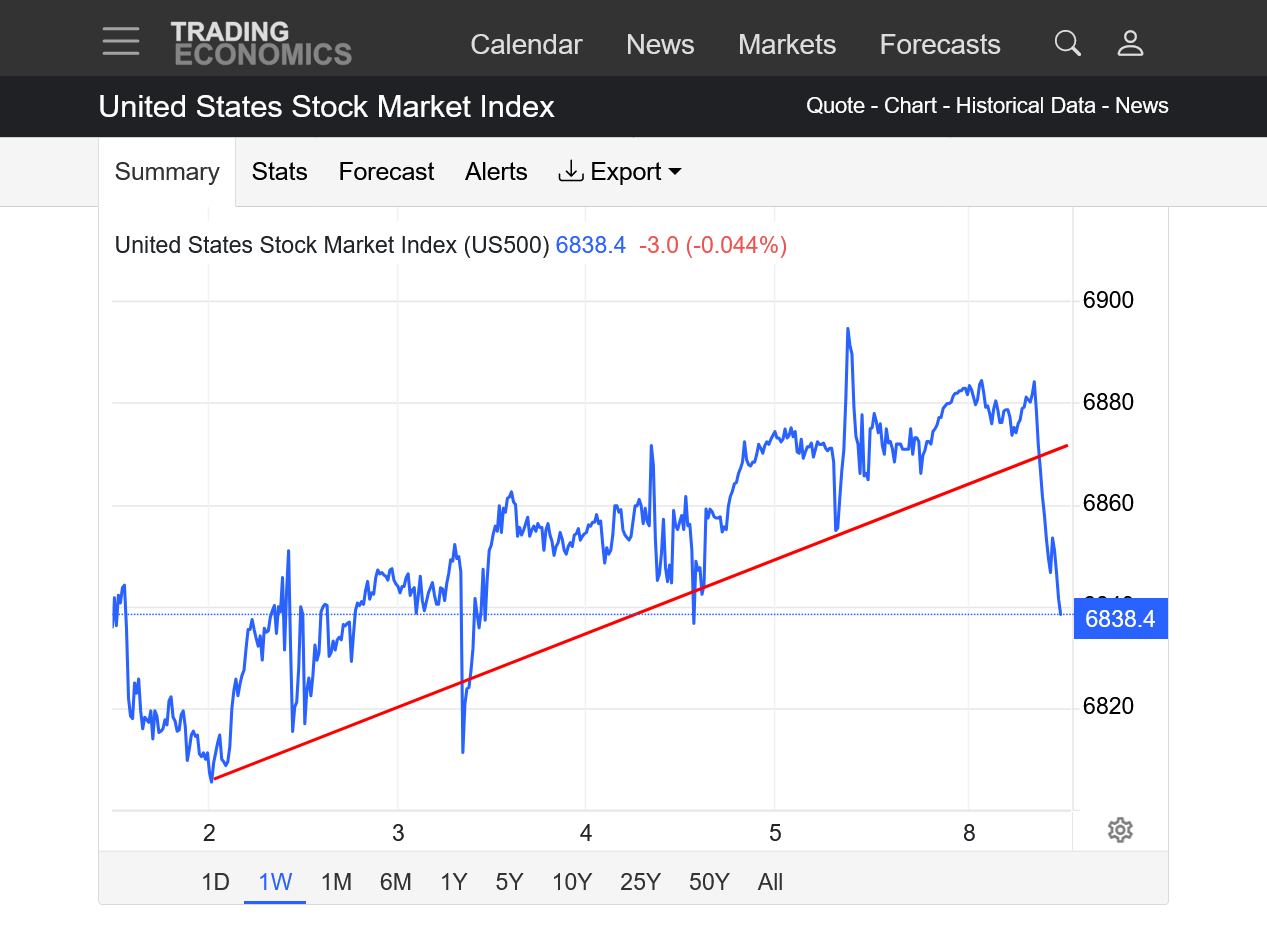
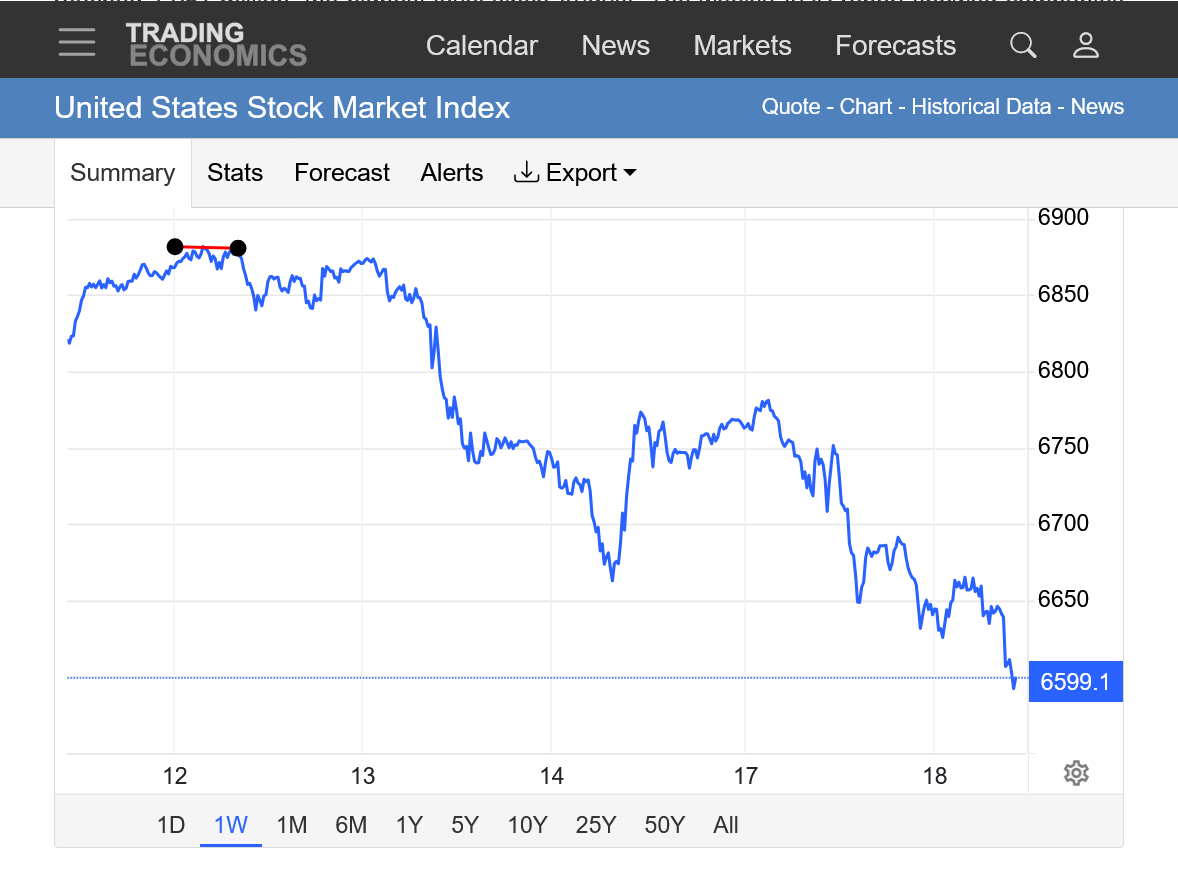
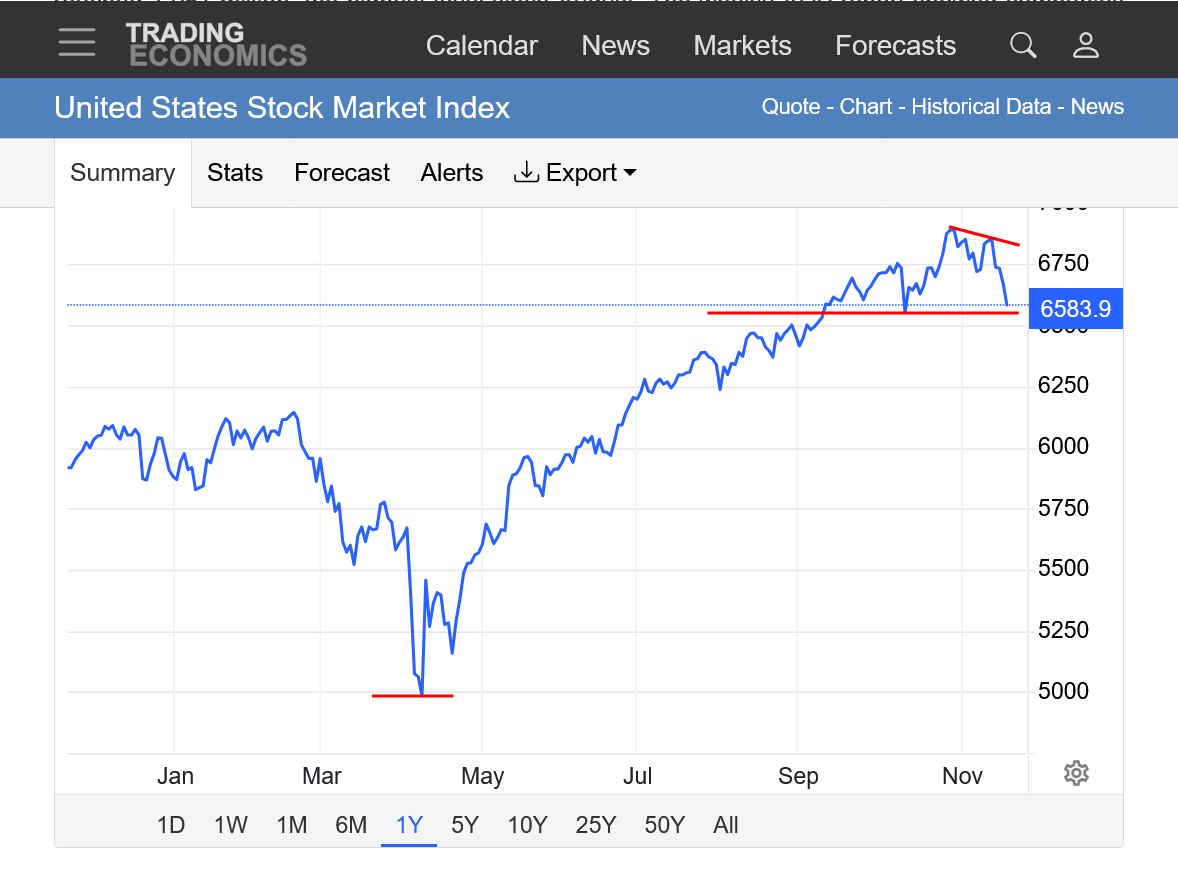
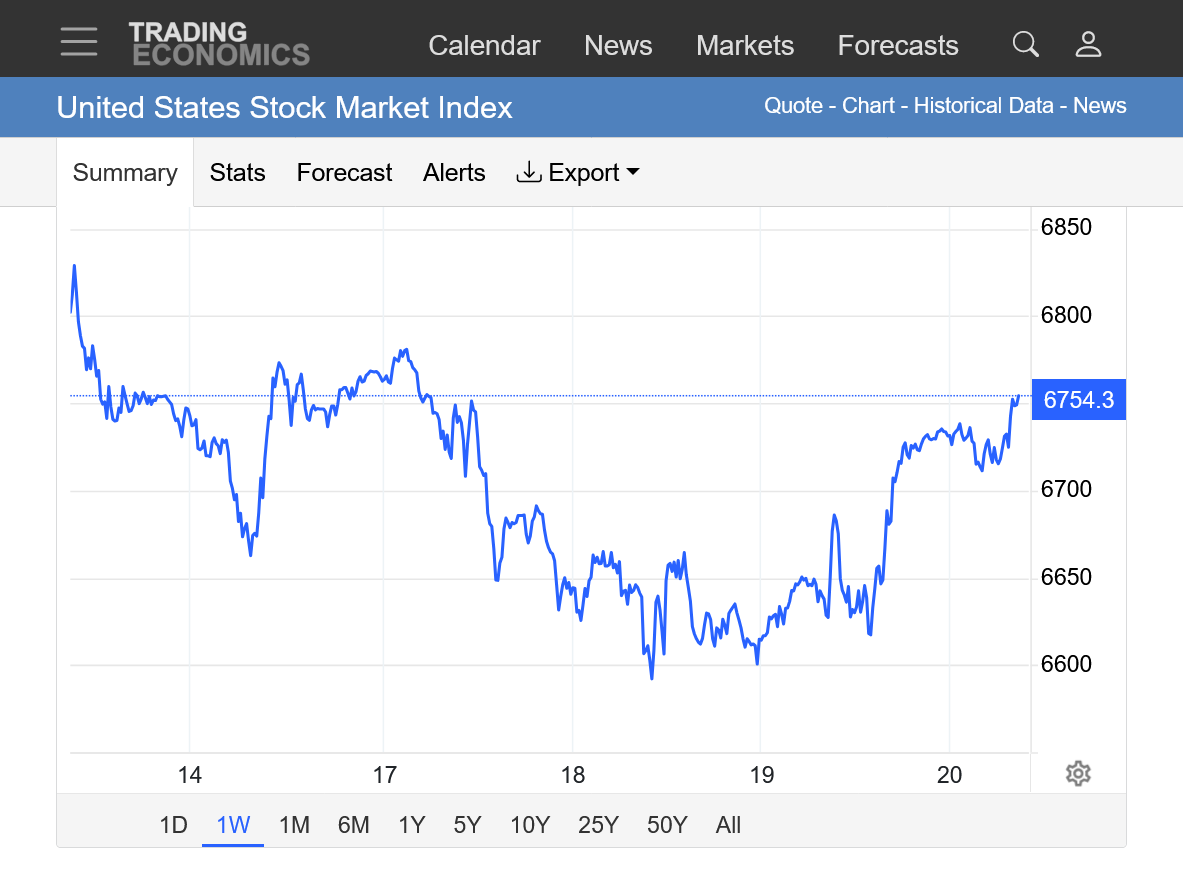
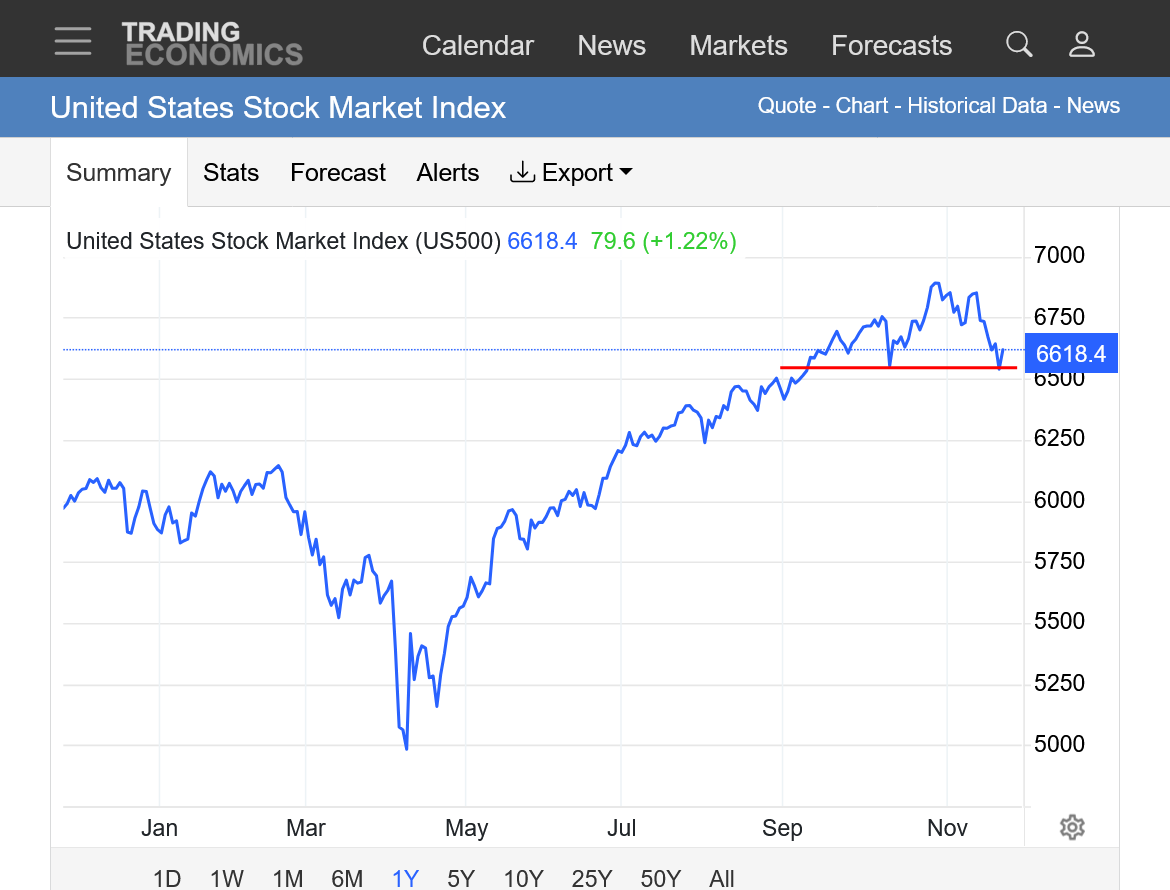
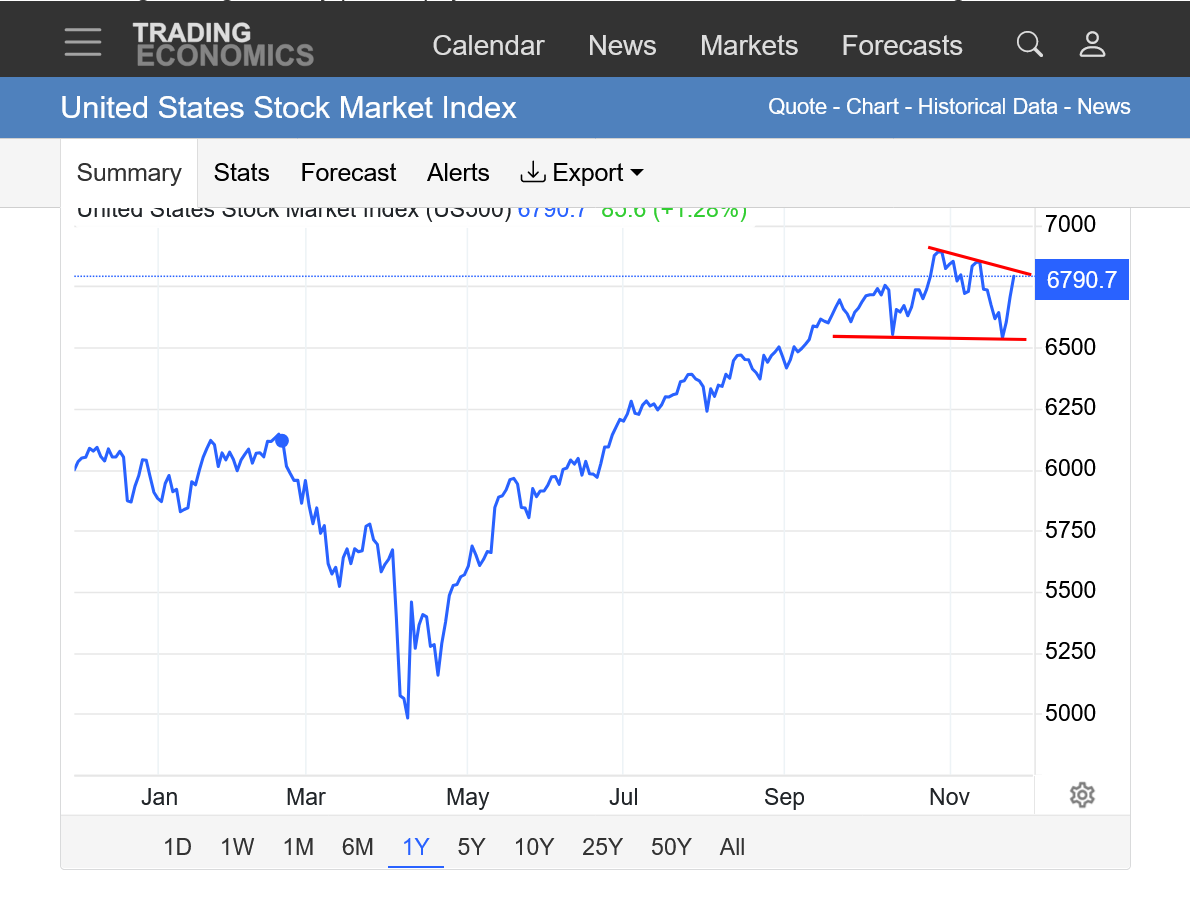
1. 1 week: Top/left, Trump signs bill to open the government and brags about his policies causing 49 new highs in the stock market this year, including that day. And the market has gone DOWN every since!
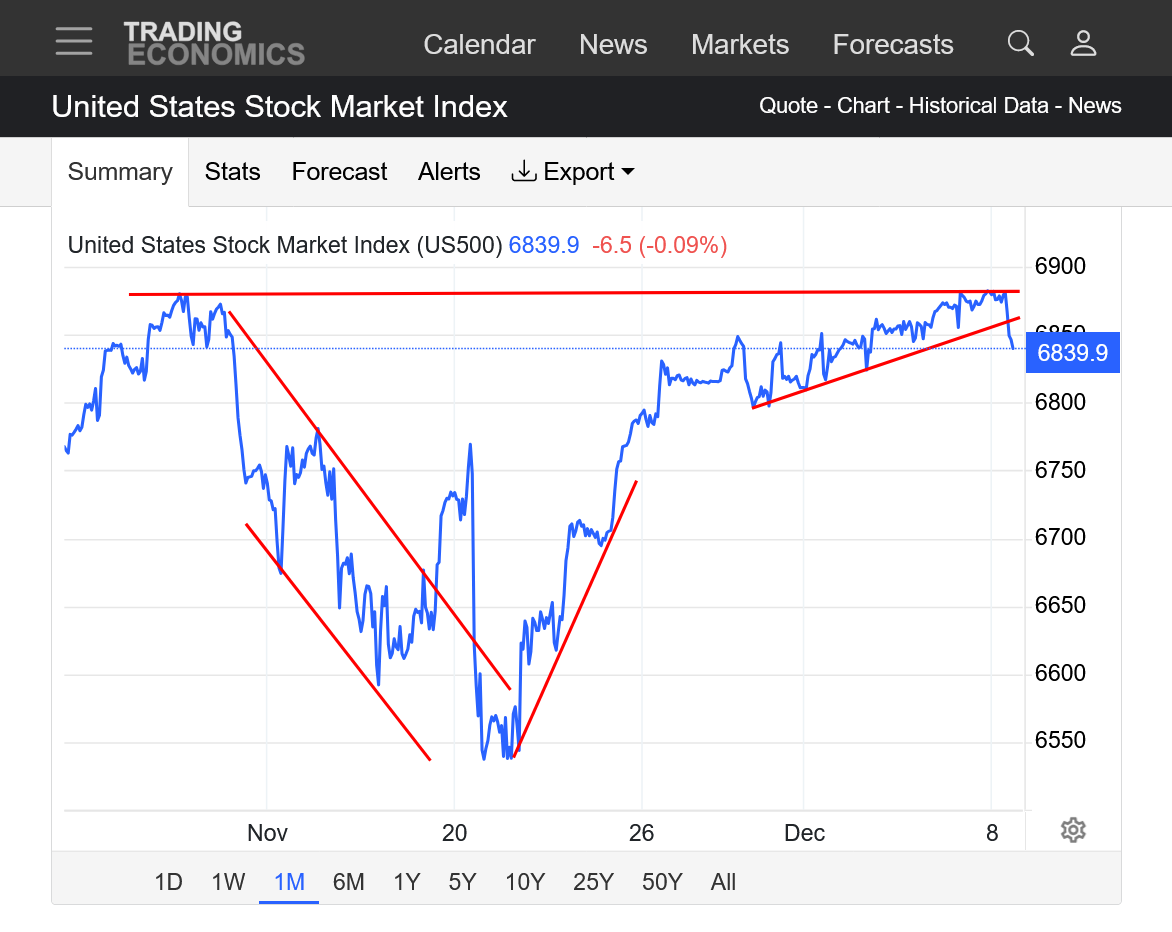
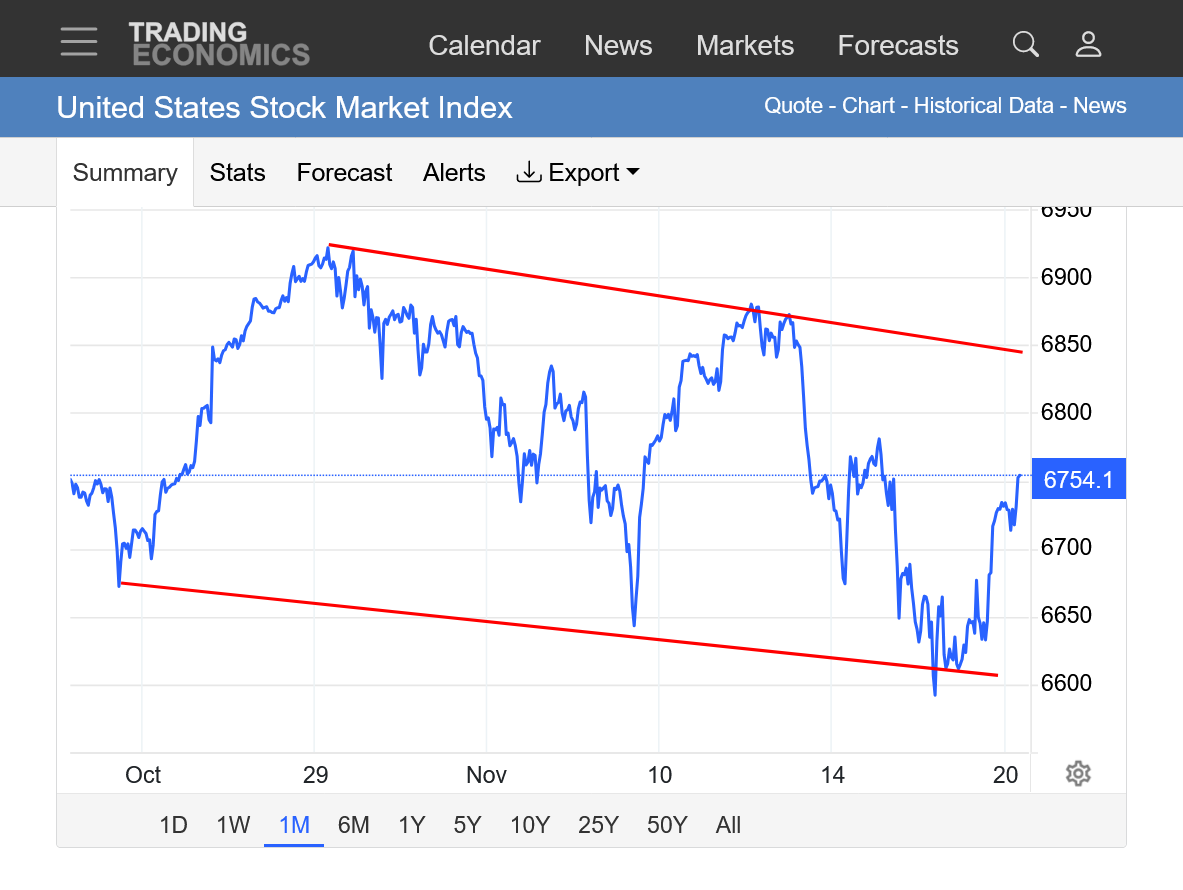
2. 1 month: Breaking down, follow thru from top formation. (LOWER top last week after news that the government was opening back up ).
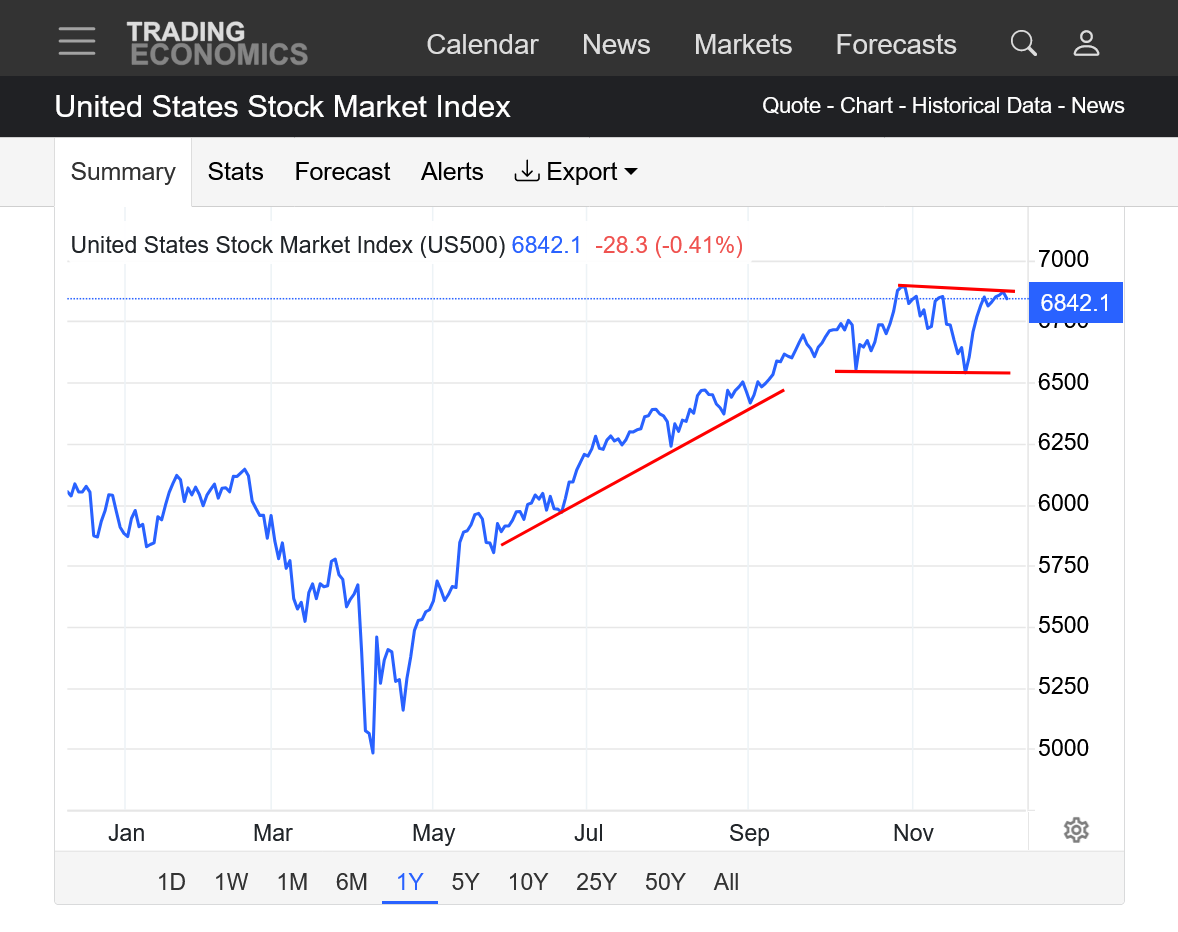
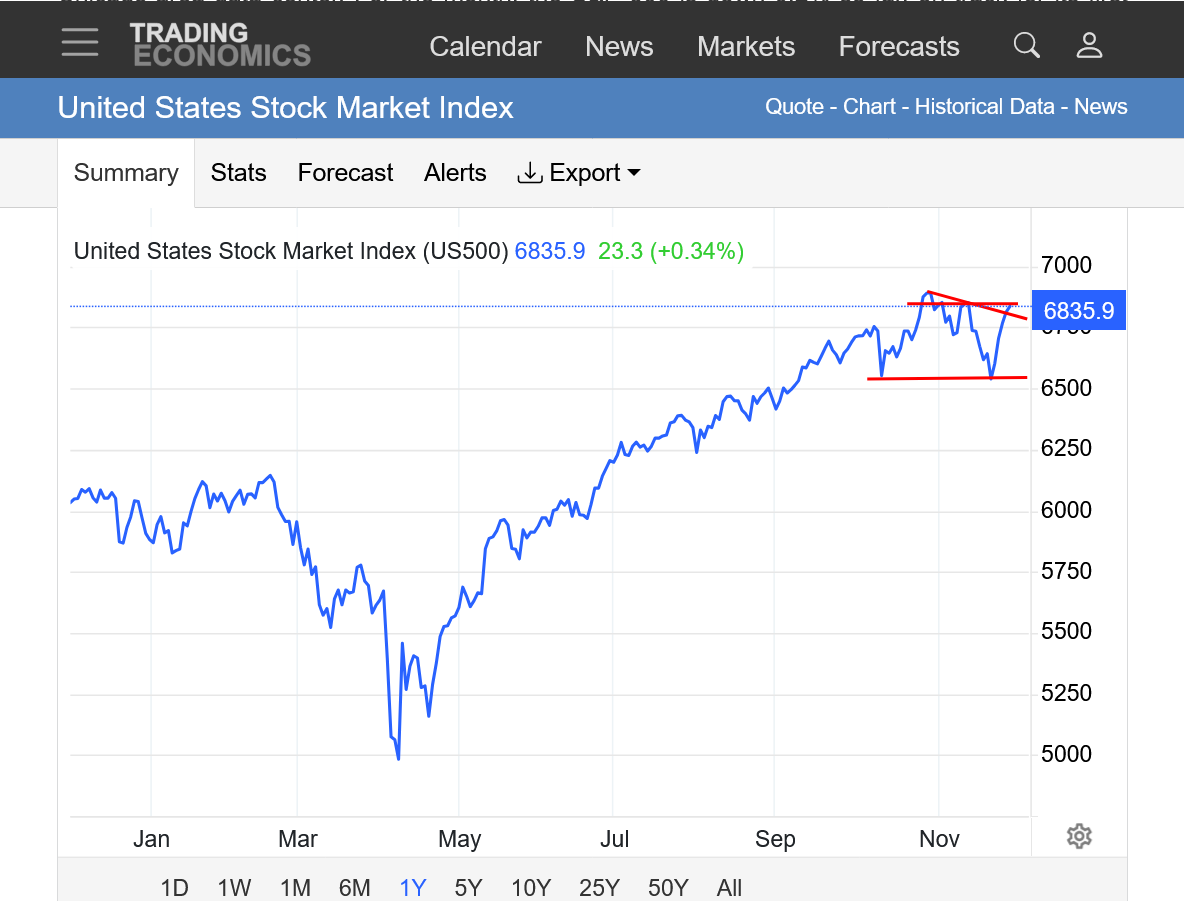
3. 1 year: Major top formation? Left/bottom spike low: Trump announces ruinous tariffs policy April 2, 2025.
4. We could still hold here and start the next move up, with this "correction" being just another bull flag in a very long lived continuation pattern.
https://www.economist.com/interactive/trump-approval-tracker/economy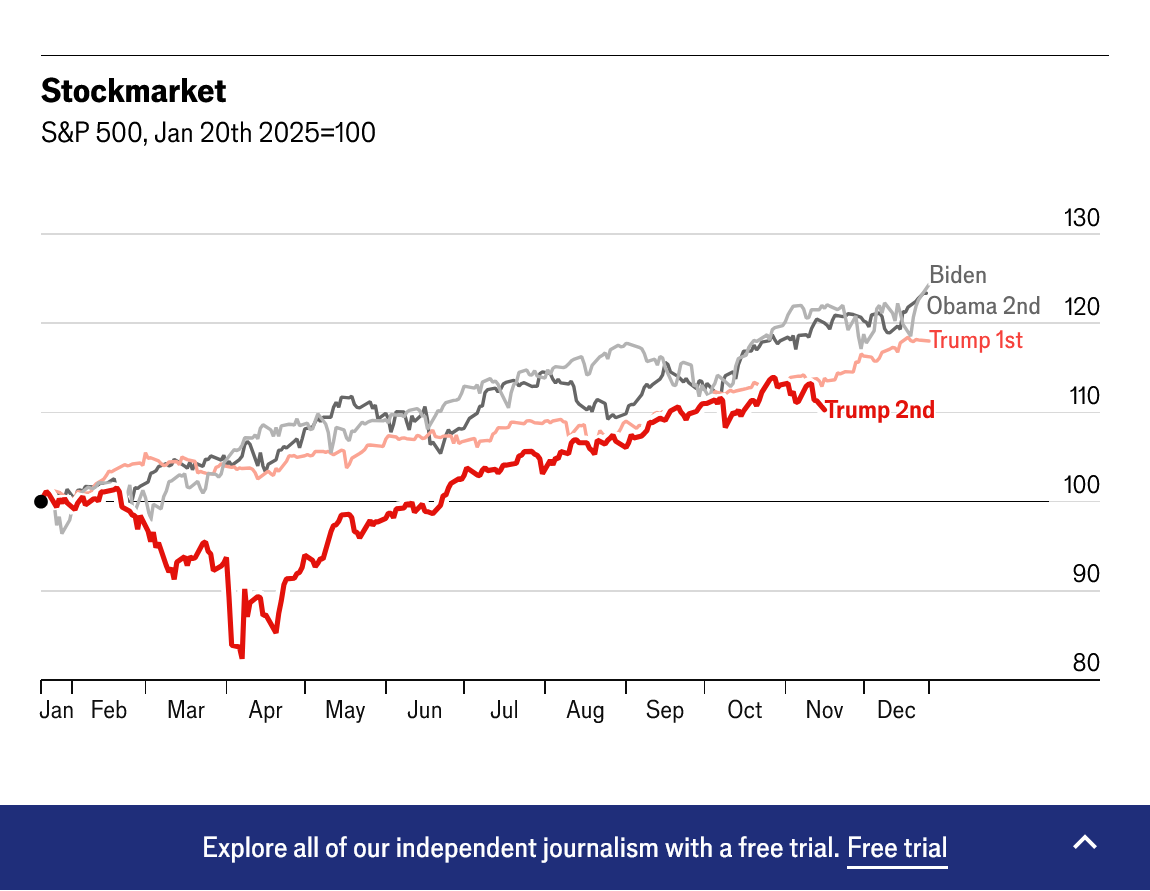
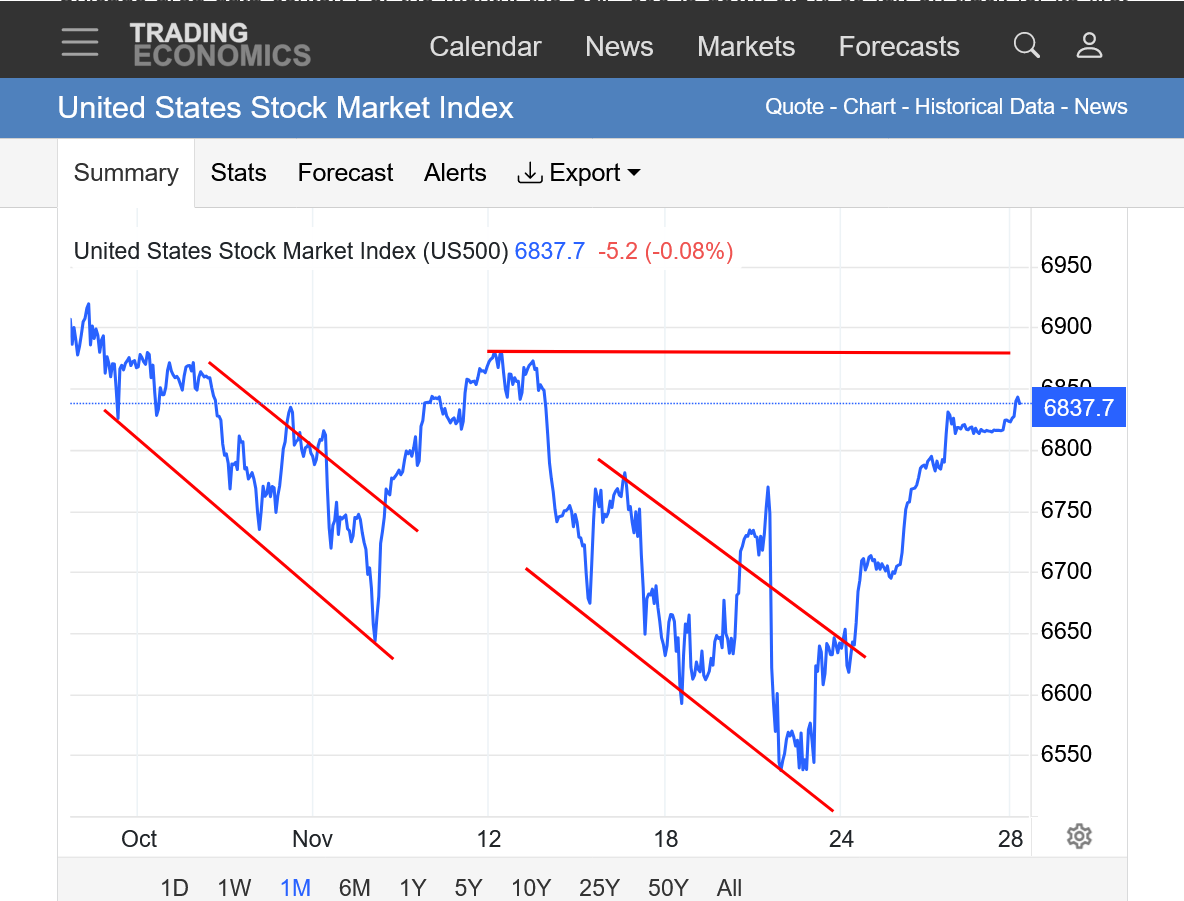
https://tradingeconomics.com/united-states/stock-market
1. 1 week. Huge rally today. Are the short term lows in? Was this just another bull flag? Dead cat bounce?
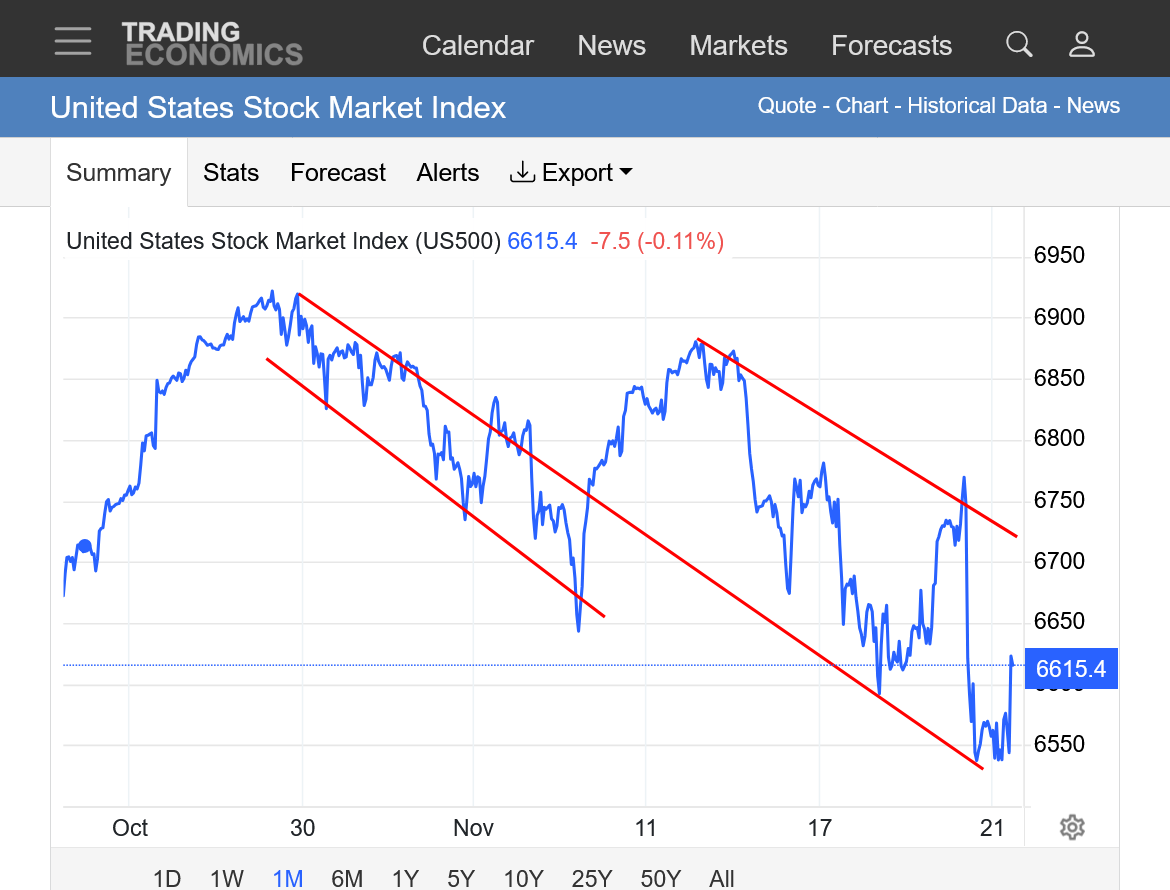
2. 1 month: Potential bull flag or a potential top and this is the new downtrend channel. The recent history favors the bull flag which will need new highs to verify.
3. 1 year: Held major support. Bull flag? Downtrend channel? Red lines on a graph can only tell us how the market reacted in the past to the current price. There is more than 1 potential outcome and right now, one can make a case for the bears or the bulls still.
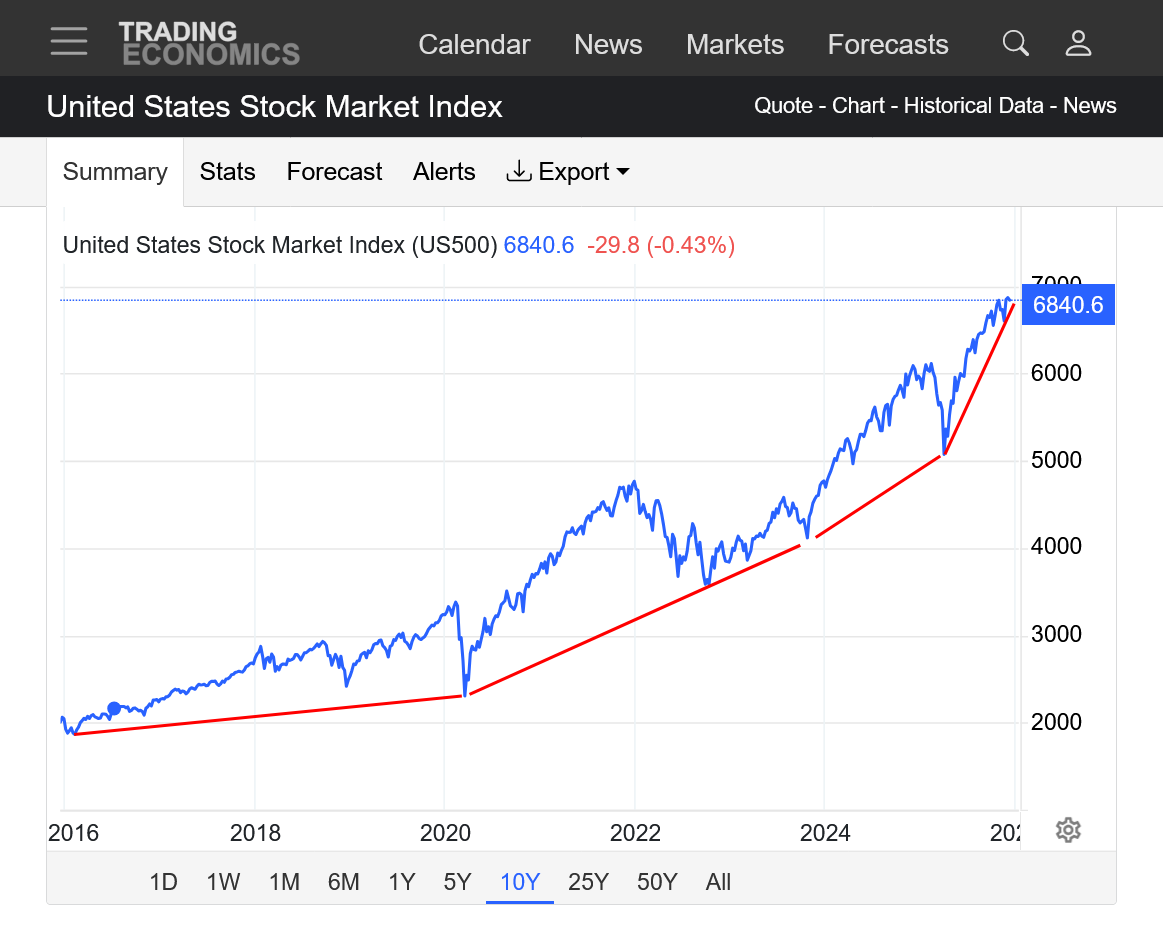
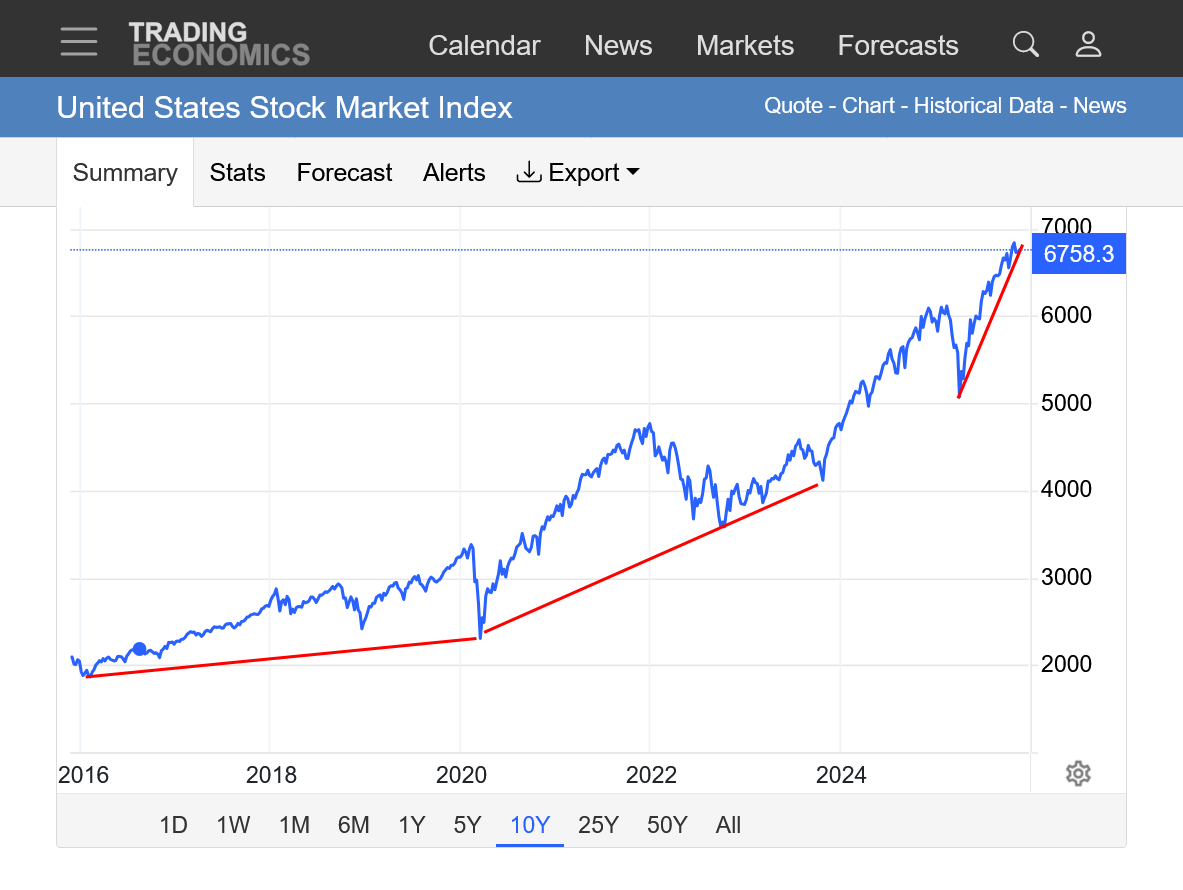
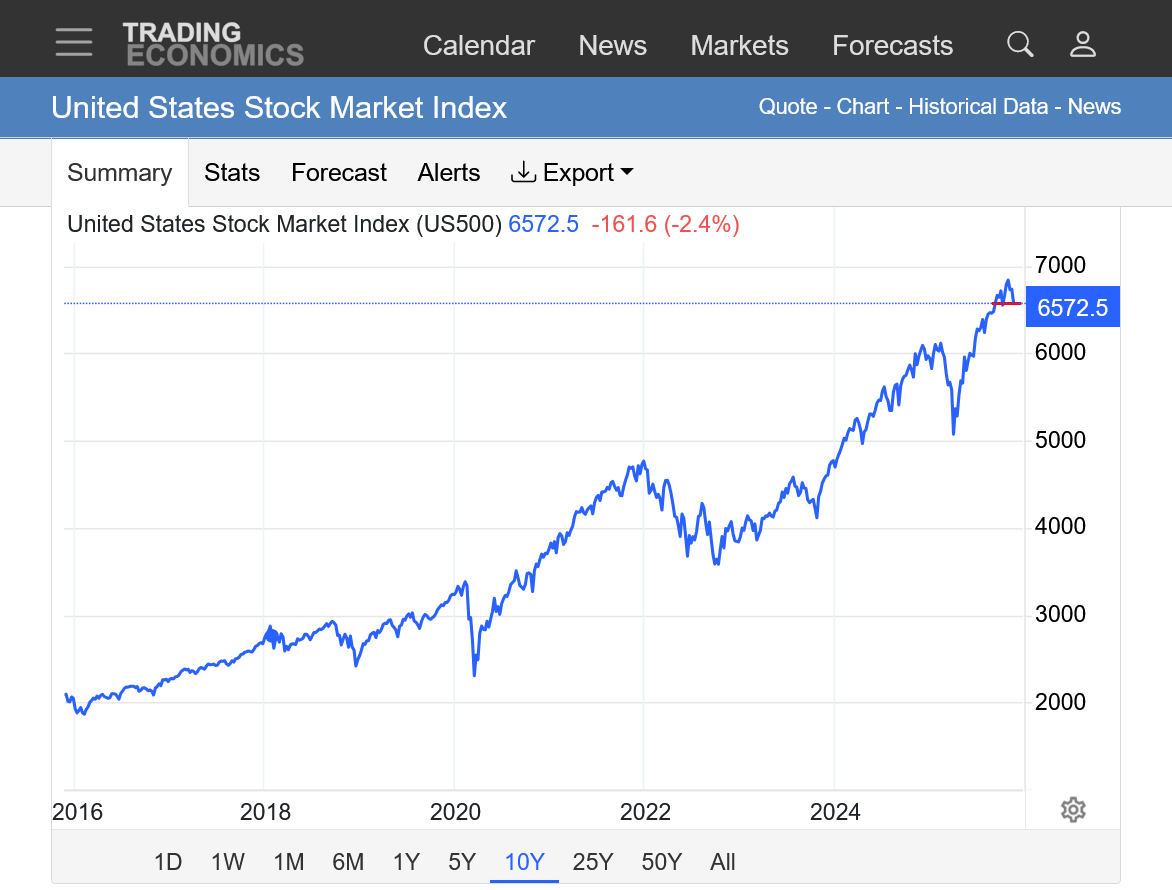
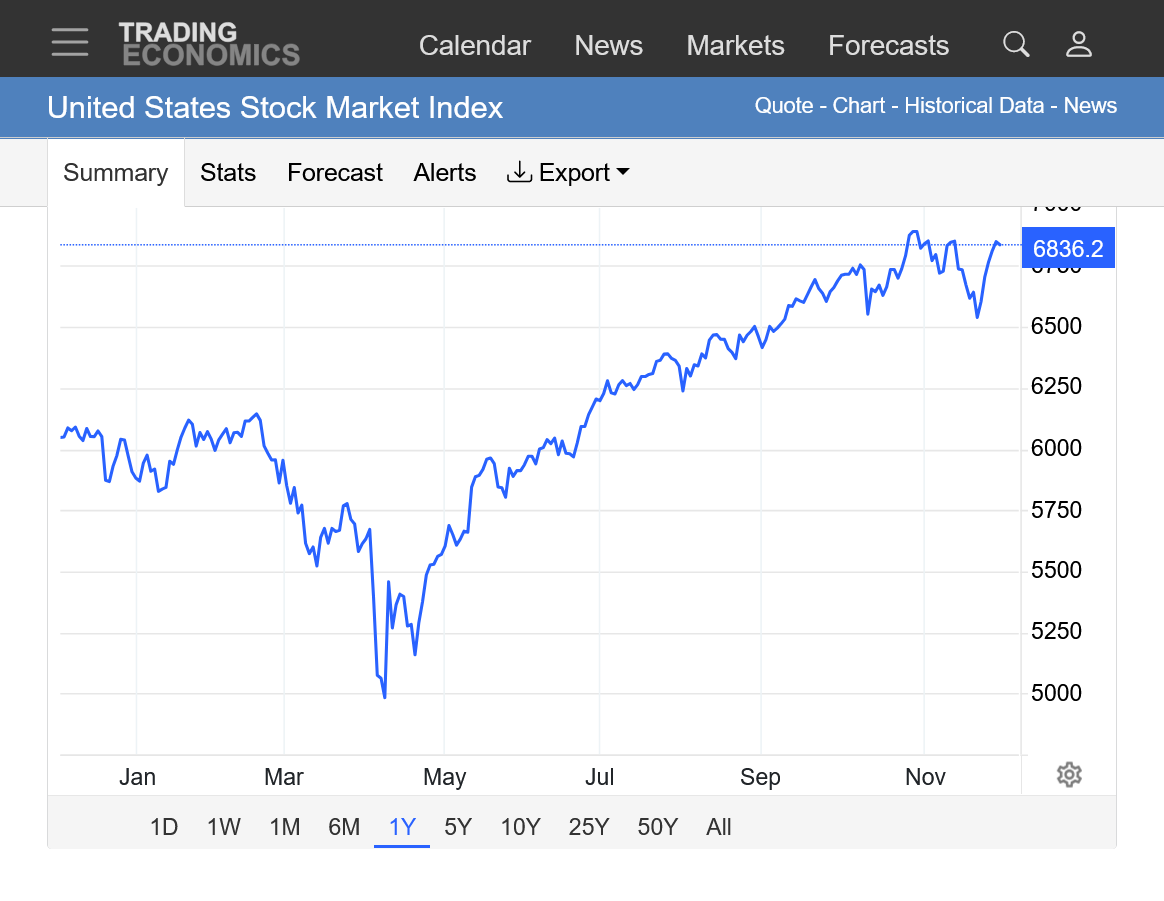
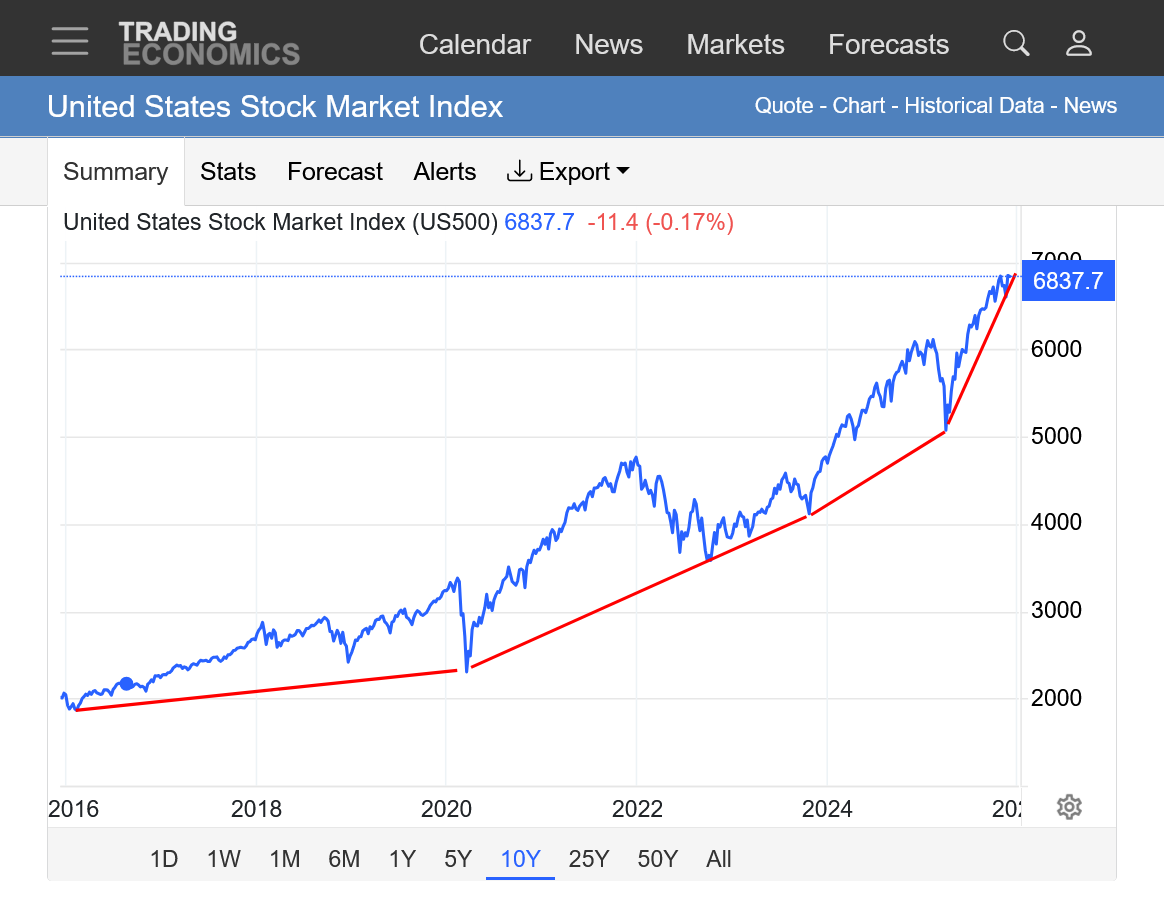
4. 10 years: Parabolic, exponential move(steepening slope up of the move) that can't go on forever as it distances itself from authentic intrinsic valuations and ignores bad economic reality news.... but it can go on indefinitely as long as money keeps flowing in.
I believe the bulk of today’s rally is being supported by NVDA’s very bullish earnings/revenues report released yesterday after close.
Thanks, Larry! All good thoughts like this are welcome.
The market has spoken. The charts tell us the highs are in and the bears have control and this was a dead cat bounce.......until further notice:
https://tradingeconomics.com/united-states/stock-market
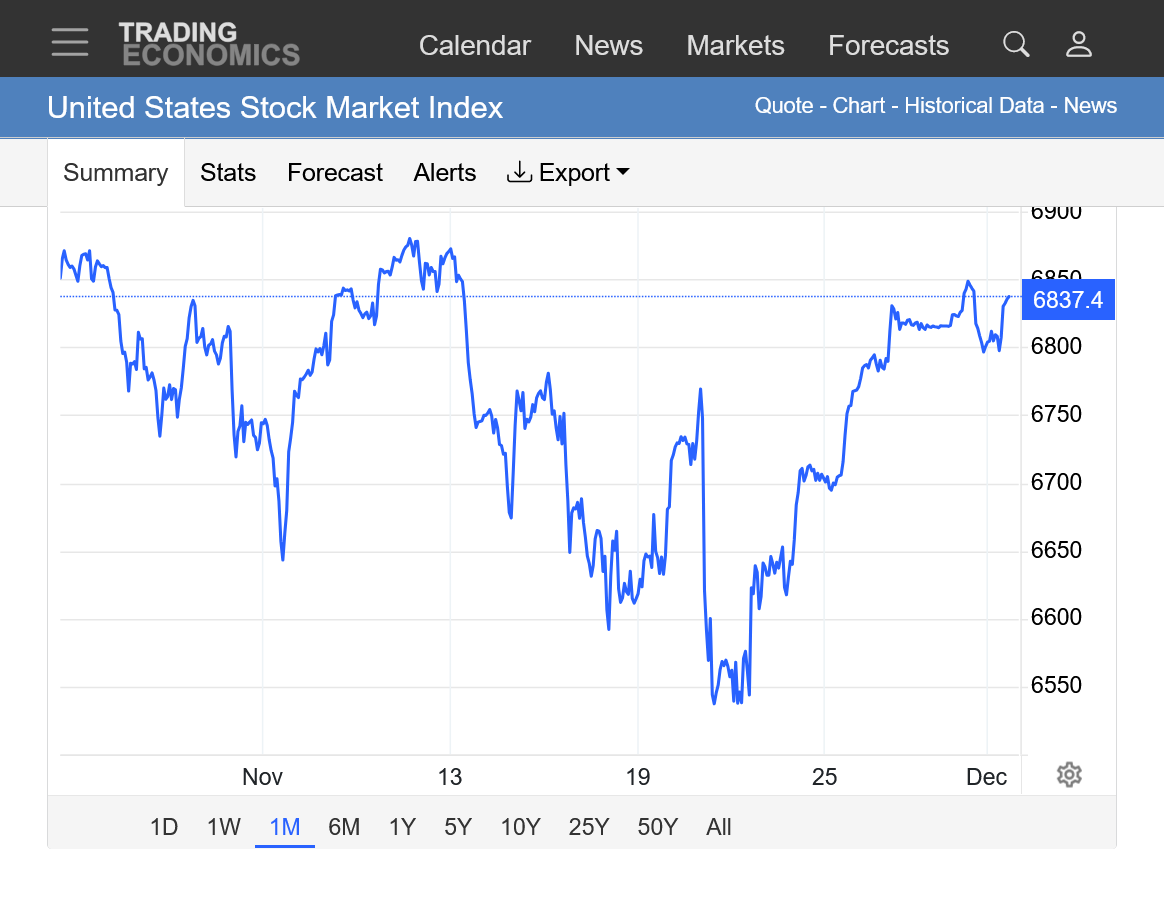
1. 1 month: Apparent downtrend channel.
2. 10 years: This drop is still just a small blip at the top. It still could be just another bull flag and continuation pattern. However, as I've been pointing out for 3 months now, the stock market has some really bad ju ju going against it. I've been surprised that its been holding up this well! Regardless, despite my big bearish personal bias, I might be wrong and will never let the personal bias impact the chart analysis.
NVDA earnings report was bullish. Mkt opens higher and tanks. That's classic bearish action.
Thanks, joj!
Great point. I trust your instincts and analysis of observations on the stock market a great deal.
https://tradingeconomics.com/united-states/stock-market
1. 1 year: A longer term bull could get excited about today's bounce higher. Maybe this is another bull flag and we just bounced off of support???
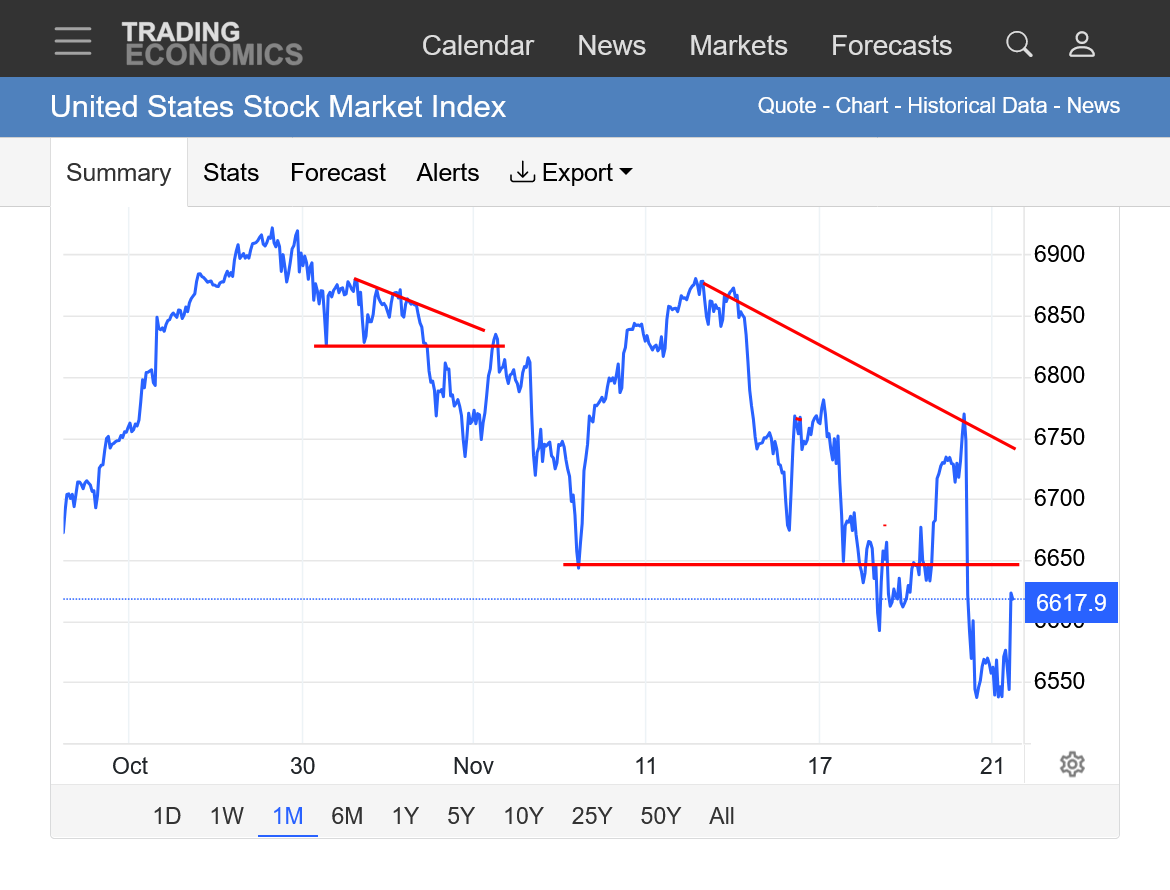
2. 1 month: Don't include me in that group, even though that is still possible. Every single bounce the past month has resulted in selling kicking in at lower prices.
3. 1 month: Instead of bull flags, I see a bunch of short term BEAR flags/wedges with selling that kicks in at lower and lower prices. One can see numerous "waves" going down with lower crests dominating. I used red lines to show just 2 of the bearish wedges/triangles the past month.
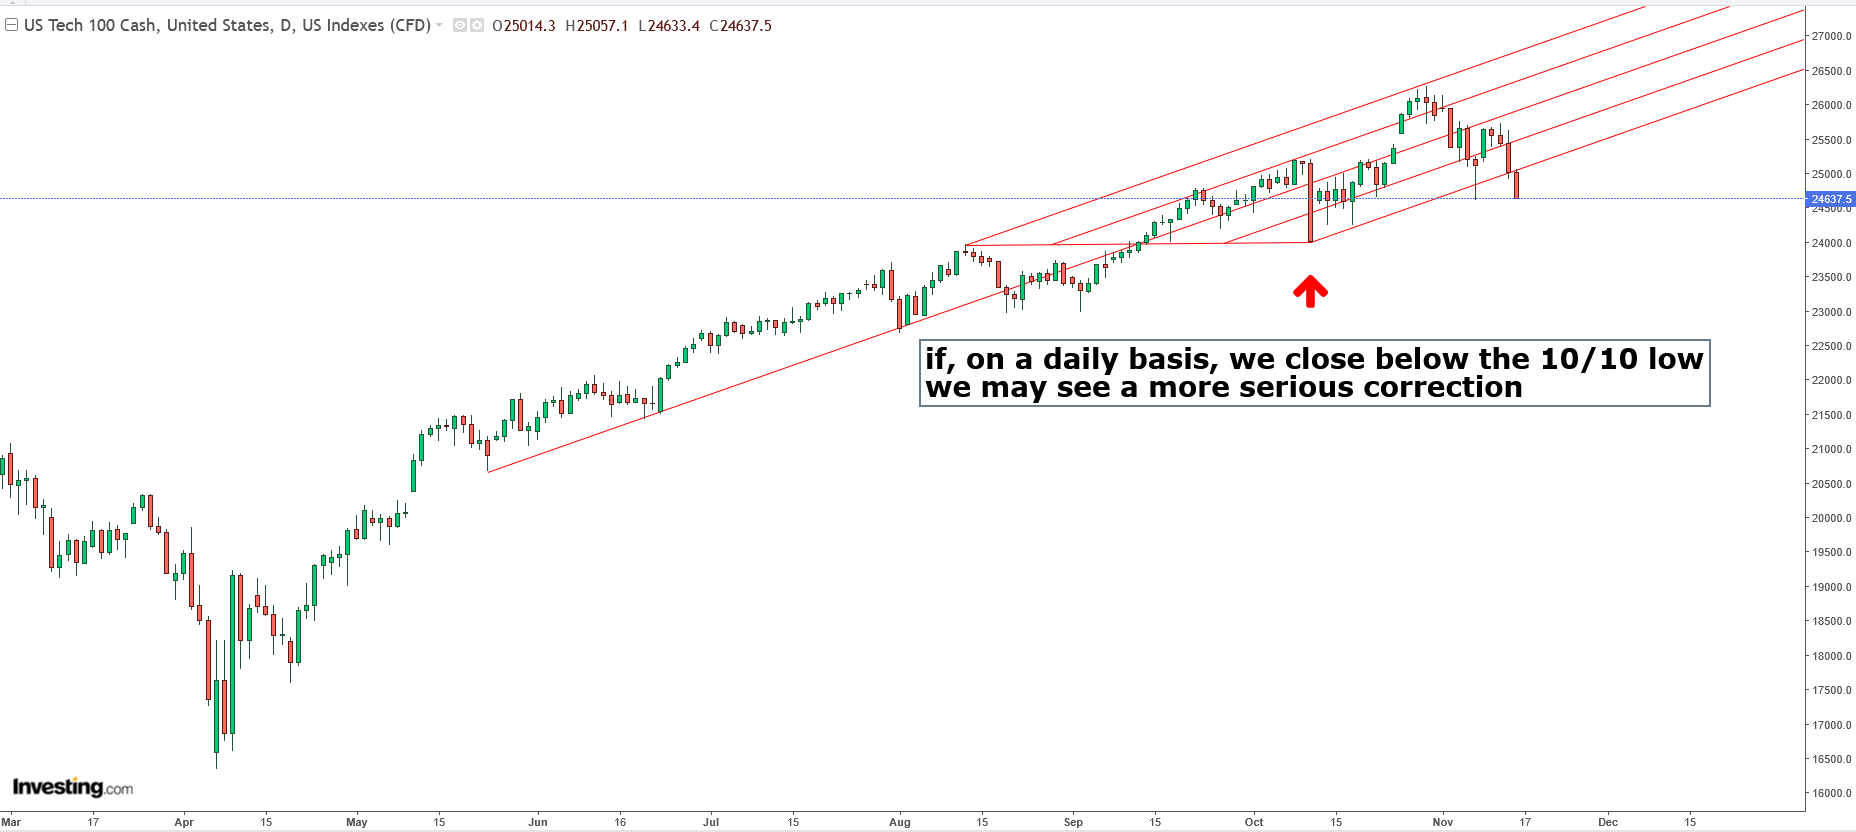
The above chart is the NQ daily, we still have not closed below the 10/10 low but we're getting close
The market has traded within the pitchfork and I suspect that more downside is to come ...
Trade safe friends !
Thanks a ton, kris!
We are totally in sync with our views, along with joj!
Been a big week for the bulls so far!!
At this stage in this extremely long move with continual record highs, only new record highs with upside break outs give us solid confirmation of the uptrend resuming. And that's been repeating over and over and over even with so much bad news.
https://tradingeconomics.com/united-states/stock-market
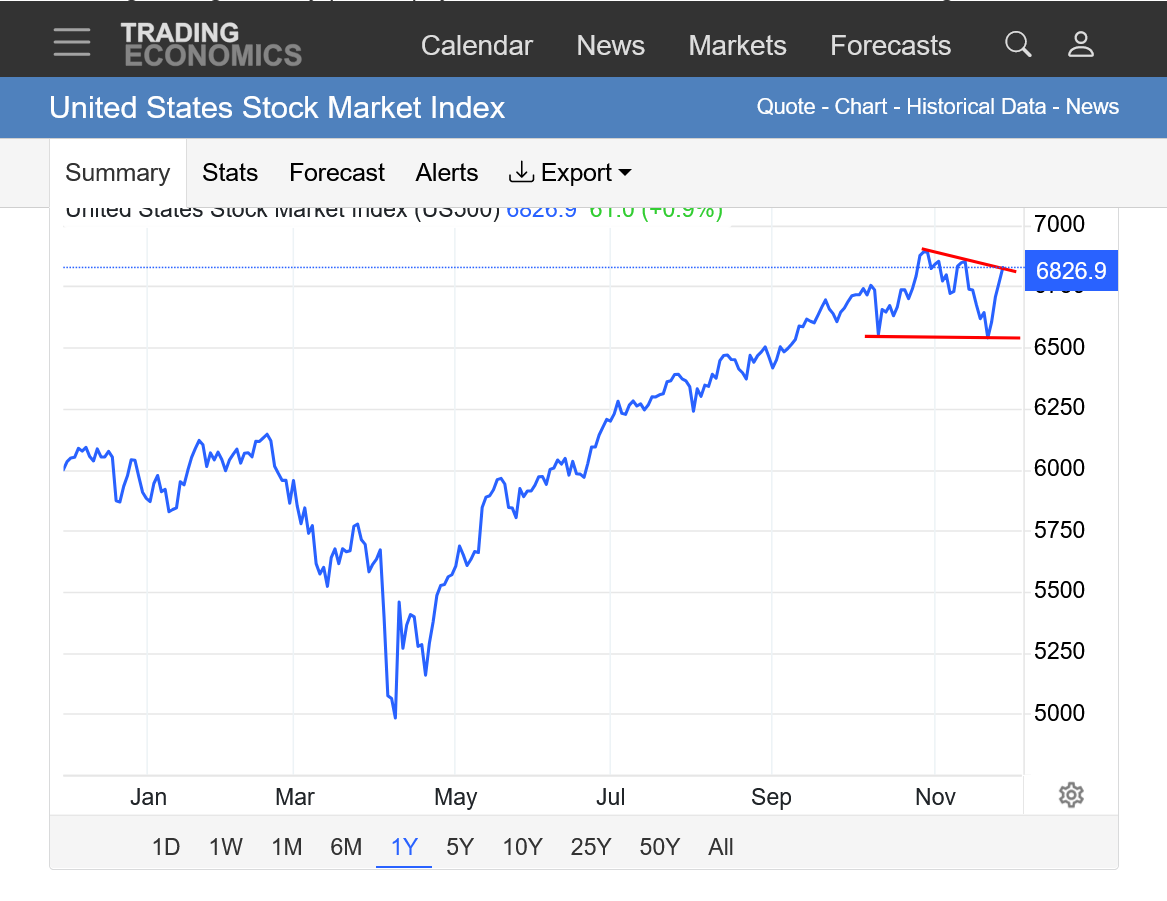
1. 1 month: Red lines galore! Breaking out of down channel of the last 2 weeks. Breaking above the last 2 minor highs/minor resistance the last 10 days. Or, still below the Oct high to LOWER November high downtrend line.
2. 1 year: Another bull flag(continuation pattern) or a top? We just held at the support from the October lows.
What do you guys think???
Yes, so far this week has been bullish, today could change all that though ... stay nimble !
Thanks, kris!
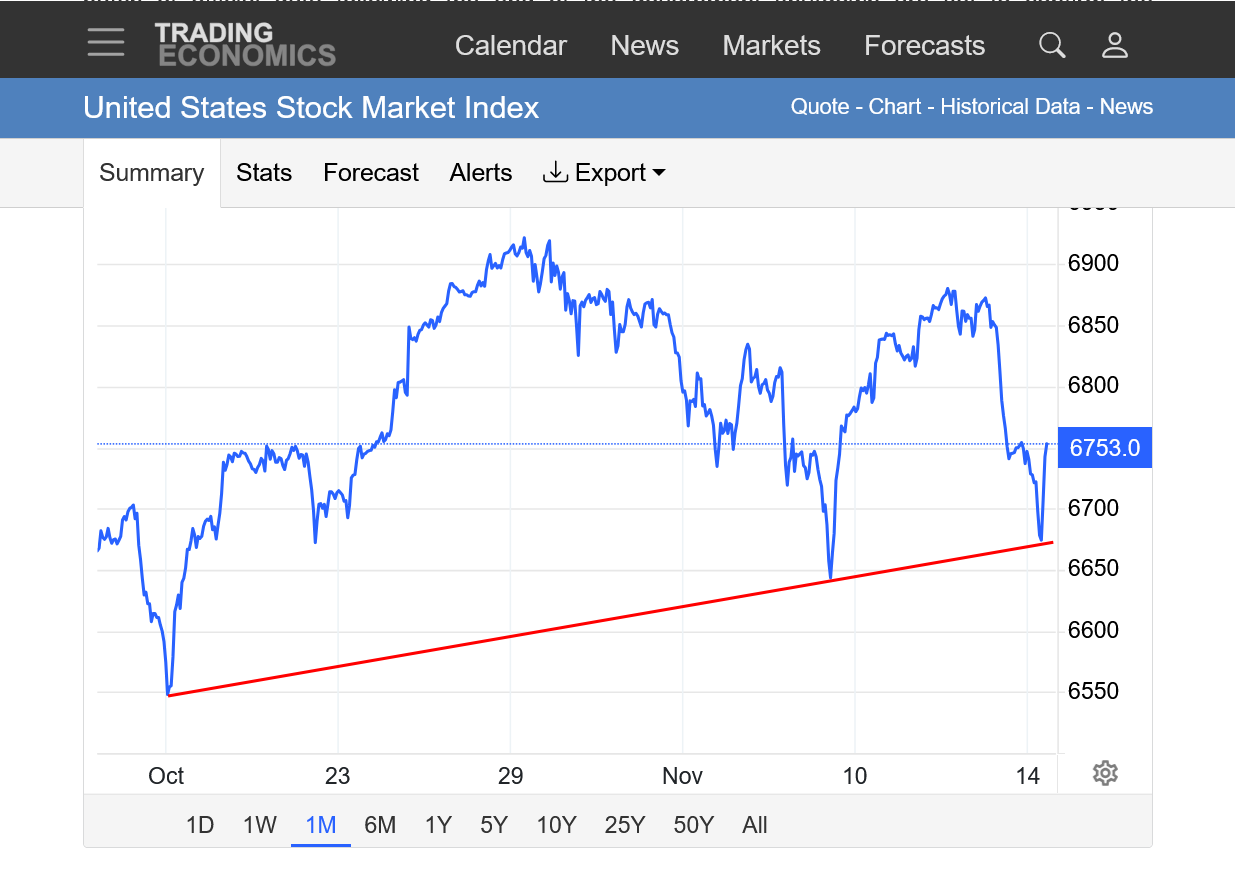
https://tradingeconomics.com/united-states/stock-market
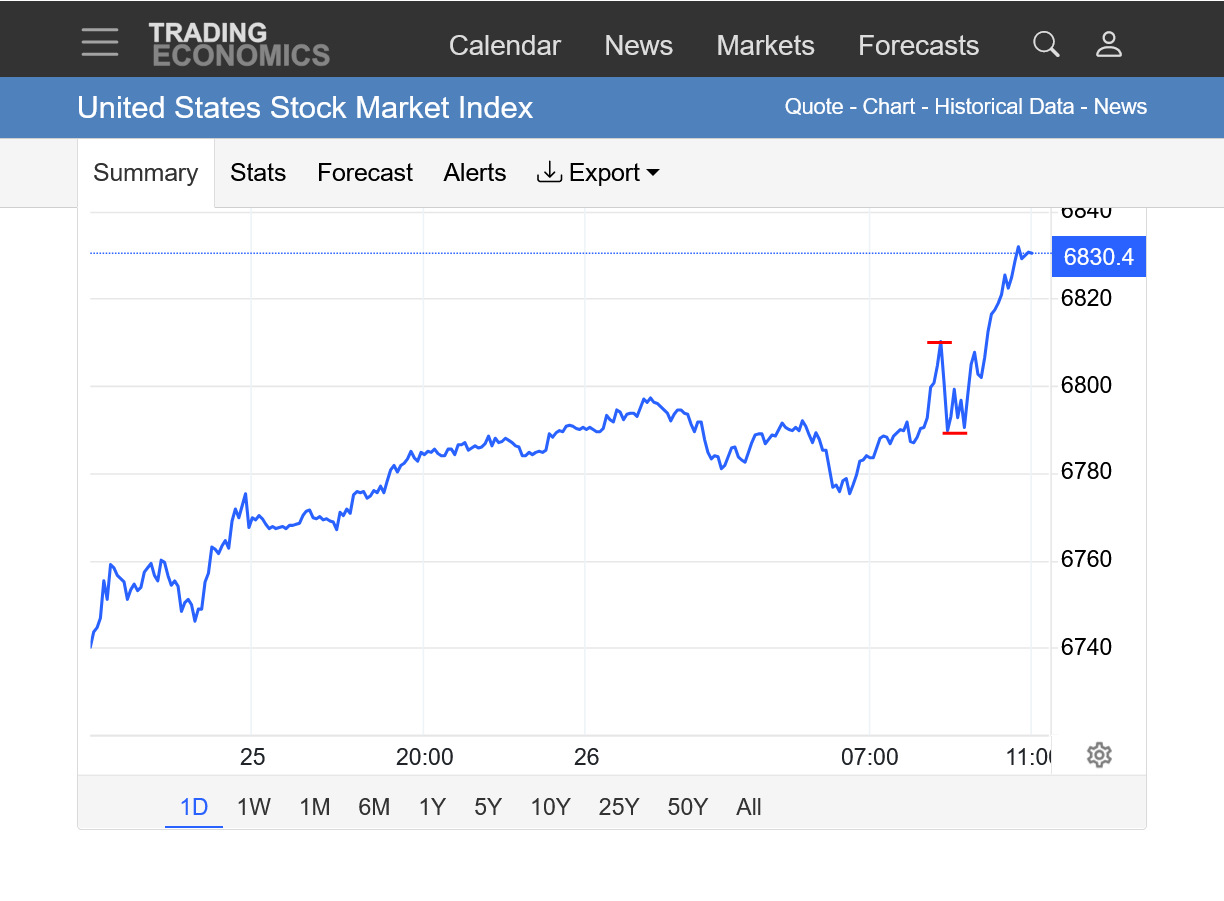
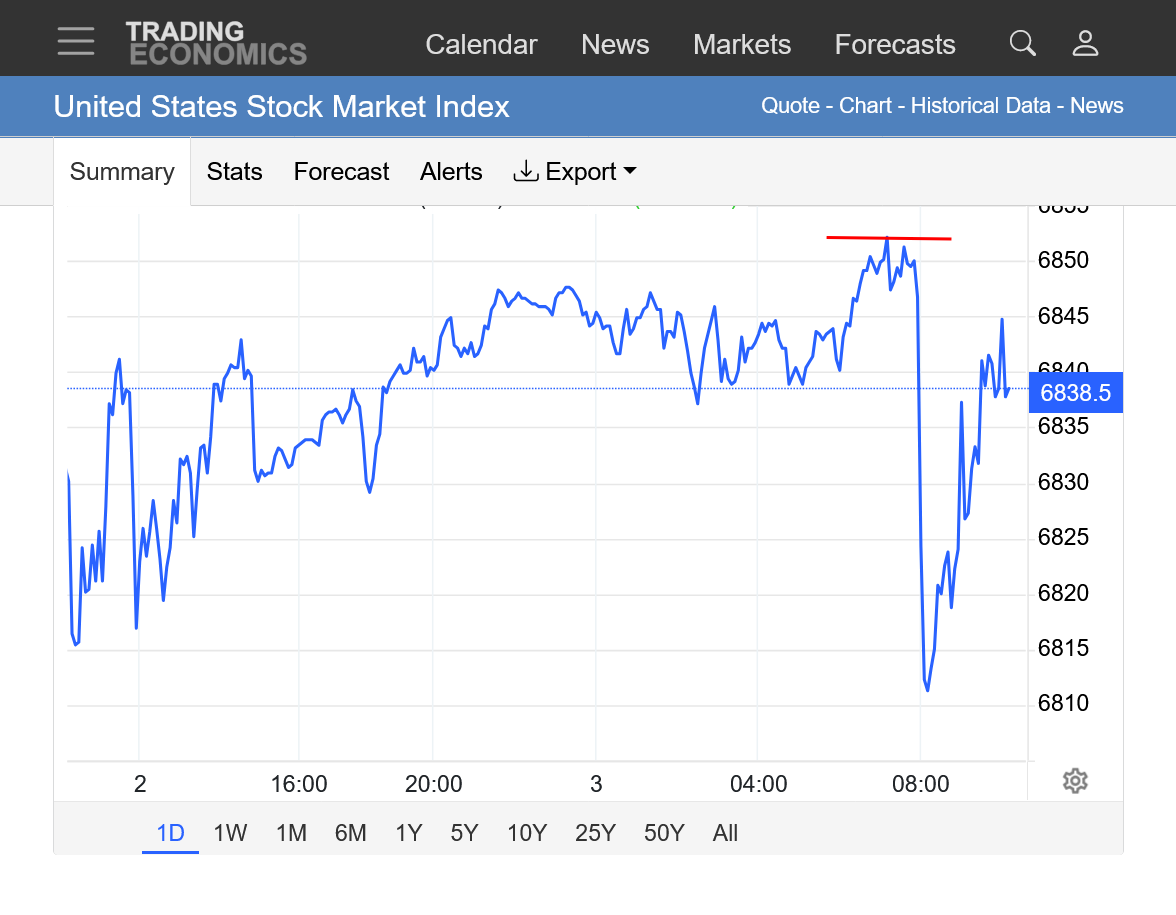
1. 1 day: We had a spike down after the bell (red lines below) that likely threw off a lot of long day traders and enticed some shorts............then reversed back up again.
2. 1 year: Hitting resistance the will make or break the interpretation of the charts. Pre-holiday trading is probably not as reliable as an indicator.
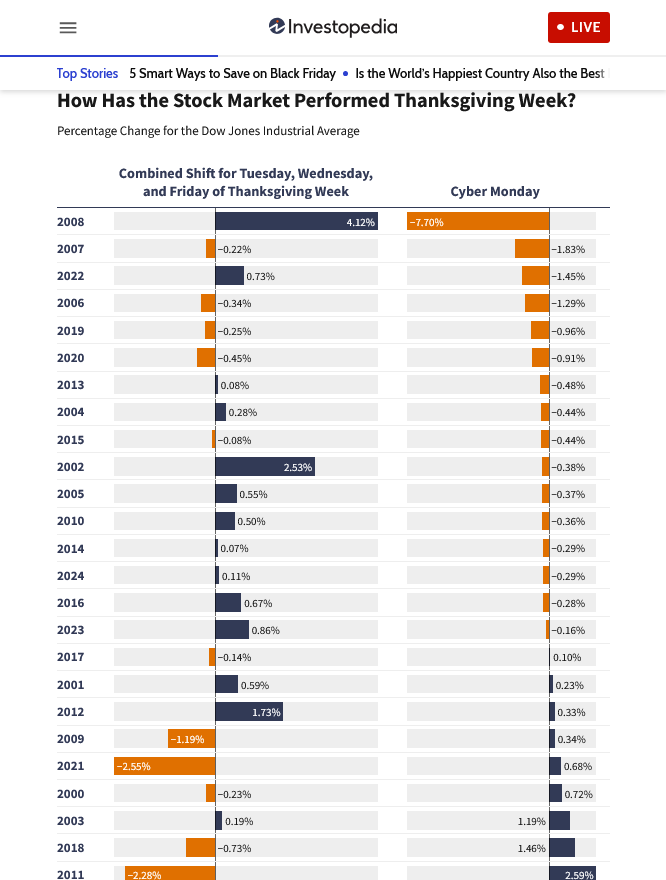
https://www.investopedia.com/thanksgiving-season-and-the-stock-market-11854727
I have a bearish personal bias which doesn't impact my analysis or chart formations which favor the BULLS right now.
Breaking out of a BULL flag type formation (breaking out of short lived downtrend channels) but still below the previous highs which keeps the potential bearish outlook alive.
https://tradingeconomics.com/united-states/stock-market
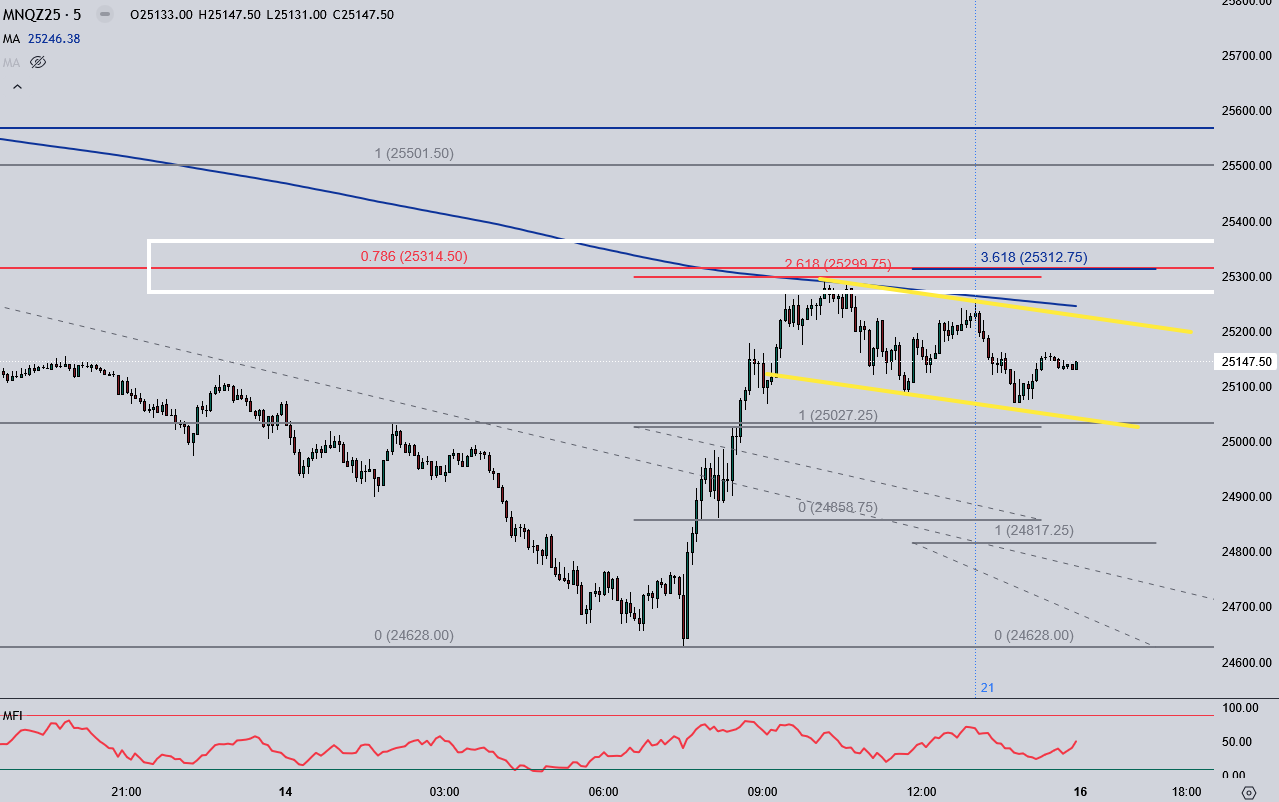
The above chart is the NQ hourly as of now, notice how the selling started right at the Globex open ...
My call last week (don't go long) was obviously wrong (first time ever I've been wrong ) /s/
This week I would definitely watch the downside potential more than anything
Trade safe friends !
Thanks a ton, kris!
I'm an operational meteorologist/weather man. We are wrong..........for a living
There is another way to look at this in my business and a lesson to learn, since you brought it up with humble recognition.
Let's say there's a big weather event coming up in a 7 days and this is the skill of the weather forecast AFTER the event is over.
Day 7: wrong
Day 6: wrong
Day 5: wrong
Day 4; wrong
Day 3: wrong
Day 2: RIGHT because you realized that your forecast philosophy the previous 5 days was wrong and immediately changed the forecast.
Day 1: REALLY RIGHT for the 2nd day but only because your mindset during the first 5 was to look everyday for reasons that you might be wrong, then changed it to RIGHT ASAP.
People will most remember the last 2 days in the forecast, especially if you tell them reasons for why you might be wrong in the more extended outlooks.
In trading, your LAST decision (exit price) often matters the most because it's the one that reacts to the latest market dynamics, NOT what you thought when you entered the trade.
Markets are fluid/dynamic. Speculative, especially short term traders are wrong a lot. As joj and I discussed recently, principle #1 in trading is having a plan TO CUT LOSSES when you are wrong. The absence of that can turn a small loss into a catastrophic loss which can wipe out your account!
The added leverage for your money trading commodities is isially 20 times what it is when investing money in the stock market.
some day trading platforms give you over 100 times the leverage value of your money in the account.
With the stock market investment, to invest $10,000, you need $10,000 to have that position.
When day trading something like soybeans, my firm and platform allows me to put on a position 10X the margin required for overnight positions and that one is still only around 5% of the value of the soybeans that I’m long or short on paper.
With that day trading platform, however if I’m margined out and the position goes against me by 50% of the account value, it automatically gets liquidated at the market and I am forced to take that huge loss. That hasn’t happened using this,platform.
what you never want is having somebody else intervening and taking control of your account. That keeps them and you from,losing all your money but it means you are unable to use risk management effectively on your own.
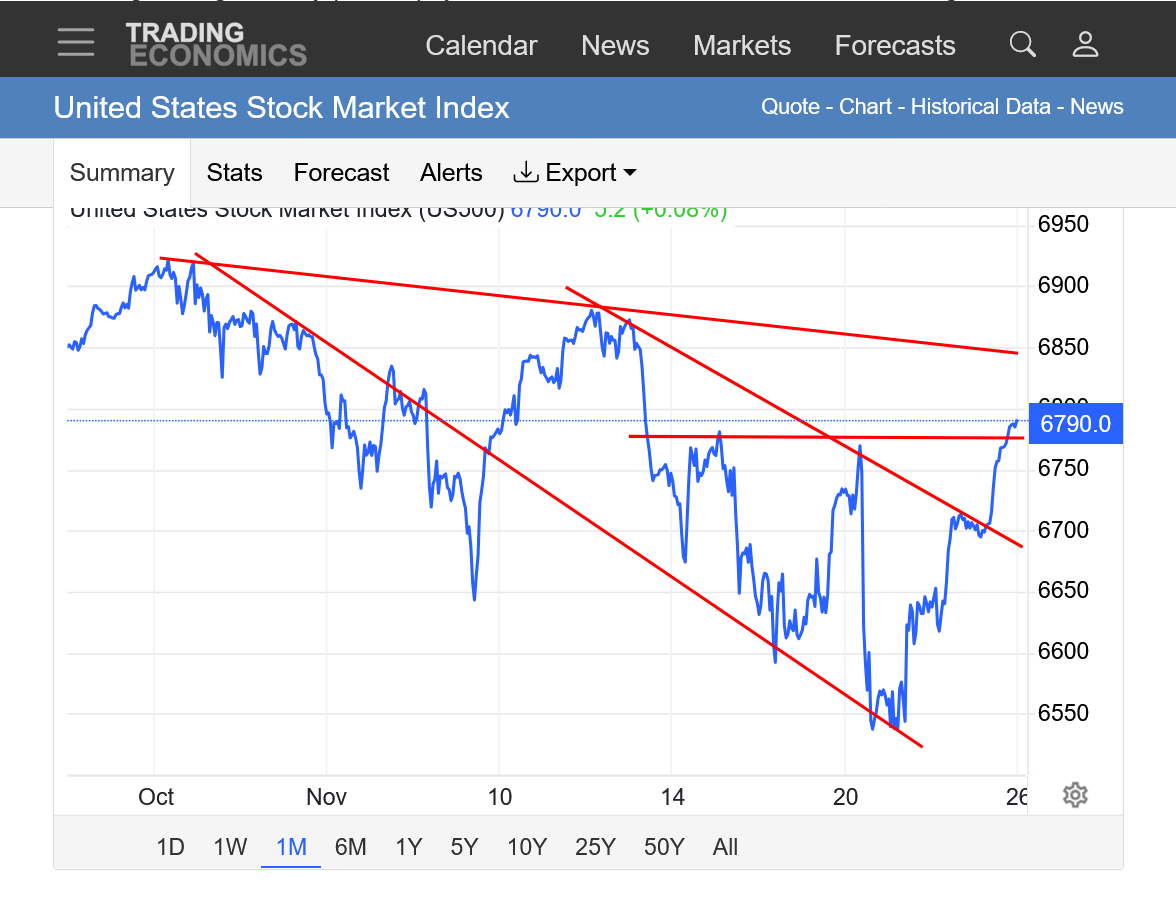
I can draw half a dozen red lines going up' down and sideways on these charts, some bearish, more bullish but they really are not going to add great insight, rather than more clutter.
Anything is possible here with very negative fundamentals and valuations battling the law of self fulfilling prophesies with the big money ignoring all the things that say that we should be going lower.
The long term trend is still up, despite so many shorter term indicators and fundamentals screaming loudly that there would be a sharp correction lower.
https://tradingeconomics.com/united-states/stock-market
1. 1 month
2. 1 year:
3. 10 years: Exponential, parabolic move up. NOT linear. Steepening slope to the uptrend with time. Can't go on forever and corrections down have lots of overbought fuel from longs covering and selling to regain balance but it can (has) continued going up longer than what makes sense.
Shorting today ....
Trade safe friends !
I hope this works out for you, kris!
I continue to be amazed at the resilience of the stock market.
https://tradingeconomics.com/united-states/stock-market
1. 1 Day: Well defined resistance! Good place to define risk for shorts.
2. 1 month: Incredible drop in volatility with a tightening ranges in prices with time recently. We assume from price uncertainty and lack of traders taking positions(staying on the sidelines). Coiling pattern. Maybe a symmetrical wedge/triangle(higher lows and lower highs. Maybe an ascending triangle(higher lows, same highs).
3. 1 year: Bull flag? Which is a continuation pattern. Well defined support that held as double bottom. Testing resistance RIGHT NOW!
Yesterday's short was (very) short lived ....
Another try today, the chart shows why, still haven't closed above these price points, the last 0.786 retrace sits about another 100 points higher and we could still get up there, time will tell ....
Jobless claims in a little while ...
Gone with the wind ....
Positive econ news re.: jobless claims ... !
Thanks for sharing your thoughts, kris!
From the cash open it was down again, we'll see how far they want to take this move, sure getting interesting and the final catalyst will probably be the Feds' rate decision next week
1 month chart below: Pretty bullish chart formation. Ascending wedge/triangle with potential upside break out above all time highs. Just below MAJOR resistance which are all time highs.
https://tradingeconomics.com/united-states/stock-market
I continue to be amazed at the stock market's resilience in recent months but continually OBJECTIVELY acknowledge WHAT THE MARKET(Composite Man from Wyckoff) is saying which is the only thing that counts in the short term for traders.
However, I'm convinced that the stock market can't continue on this path, even as its defied the negative economic and other news in 2025 because rich people are using their money to accomplish their self fulfilling prophesy.
Why do I know this?
How many markets have continued with this parabolic/exponentially increasing slope forever in the past? Especially when they represent a massive OVER priced valuation.
https://tradingeconomics.com/united-states/stock-market

Answer..........ZERO!
We can still go higher for X amount of time but eventually, the stock market will be forced to correct back to the real world.
Donald Trump is the biggest reason for the overvalued stock market and his policies are the reason that the downside is growing greater and greater when the inevitable crash occurs. 89% that Trump will not finish his 2nd term and when his demise becomes inevitable, I can't imagine prices NOT crashing. Probably long before that.
https://www.fool.com/investing/2025/12/06/3-catalysts-can-spark-a-stock-market-crash-in-2026/
Added 12-7-25: When back-tested to January 1871, the average multiple of the Shiller P/E is about 17.3. In late October, when the broad-based S&P 500 hit its all-time high, the Shiller P/E peaked at 41.2. The only time the market has been pricier is in the months leading up to the bursting of the dot-com bubble.
History shows that every time the Shiller P/E has surpassed 30 over the last 155 years, a decline of at least 20% has eventually followed for one or more of Wall Street's major indexes. While this valuation indicator isn't a timing tool, it does have a flawless track record of foreshadowing downside for the stock market.
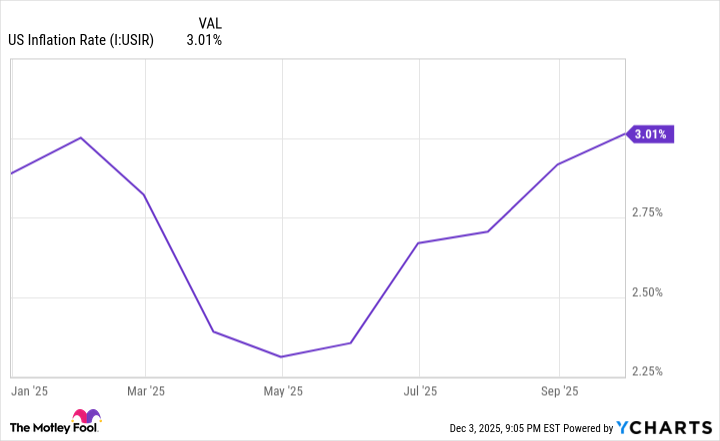
The U.S. inflation rate has been modestly climbing since President Trump implemented global tariffs. US Inflation Rate data by YCharts.
Will indexes correct? Yes, but NOT before another vigorous, call it Christmas rally. Buy a Sunday night/Monday dip. Very possible 7000 sp and 27000 nasq before Santa!
Thanks, tjc!
This is a graph of the Fed Funds rate in brown vs the S&P in blue.
I assume that lower interest rates(interest bearish investments earn less) are more bullish stocks and higher rates are more bearish but using the chart below to see this inverse relationship is a bit tricky.
The recent increase in interest rates, after 2020 for example didn't dampen enthusiasm for buying stocks.
Also, drops in interest rates correlated stronger with a weakening economy(reason to drop rates) at times and this correlated with both the interest rate going lower and the stock market going lower.
S&P 500 vs Fed Funds Rate
This chart compares the S&P 500 index to the Federal Funds Rate back to 1955.
https://www.macrotrends.net/2638/sp500-fed-funds-rate-compared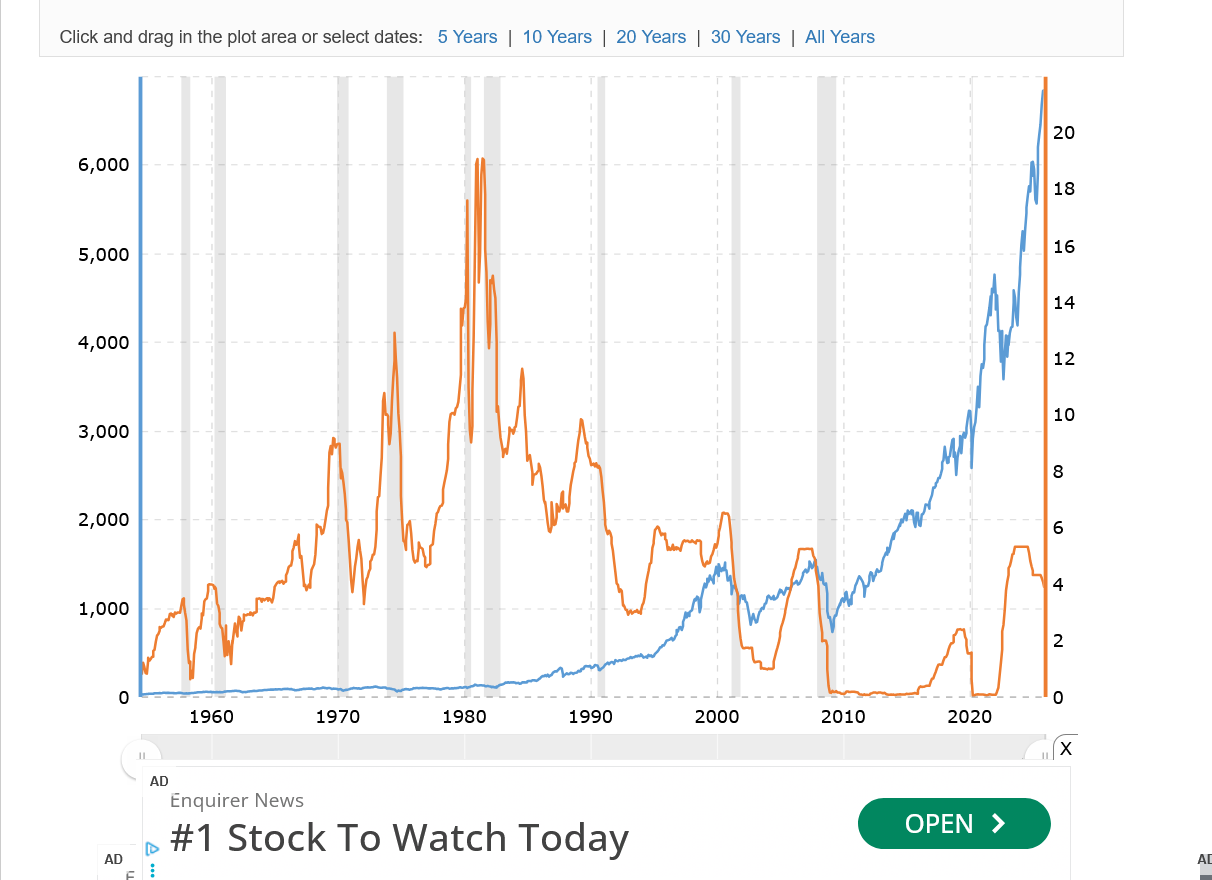
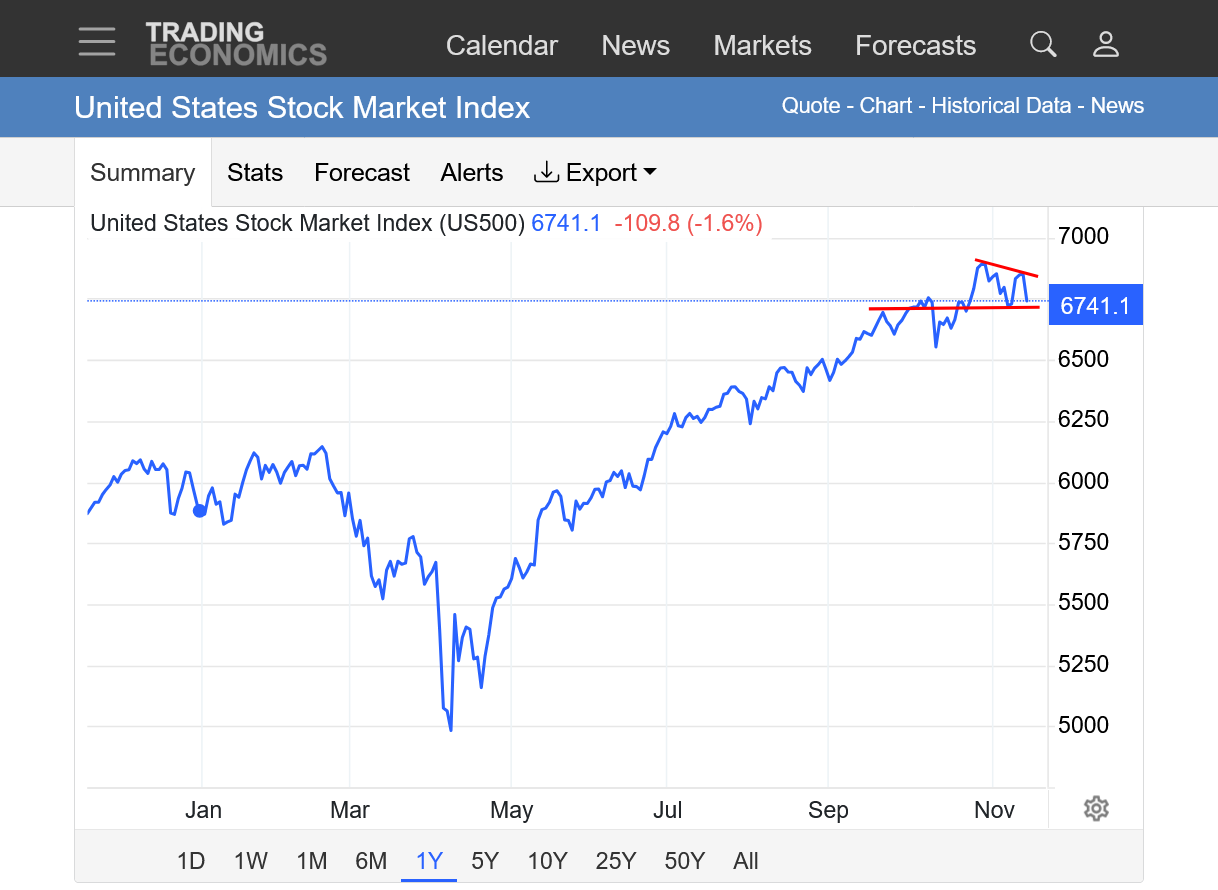
Bearish start to this week so far. Like always, I'm just doing objective technical/chart analysis and identifying the formations and patterns NOT making specific predictions as I don't trade this market.
I have an admitted downside bias because of the negative fundamentals pounding this market and the economy right now............that doesn't matter if the big money is convinced that we are going higher and keeps the Ponzi Scheme going.
https://tradingeconomics.com/united-states/stock-market
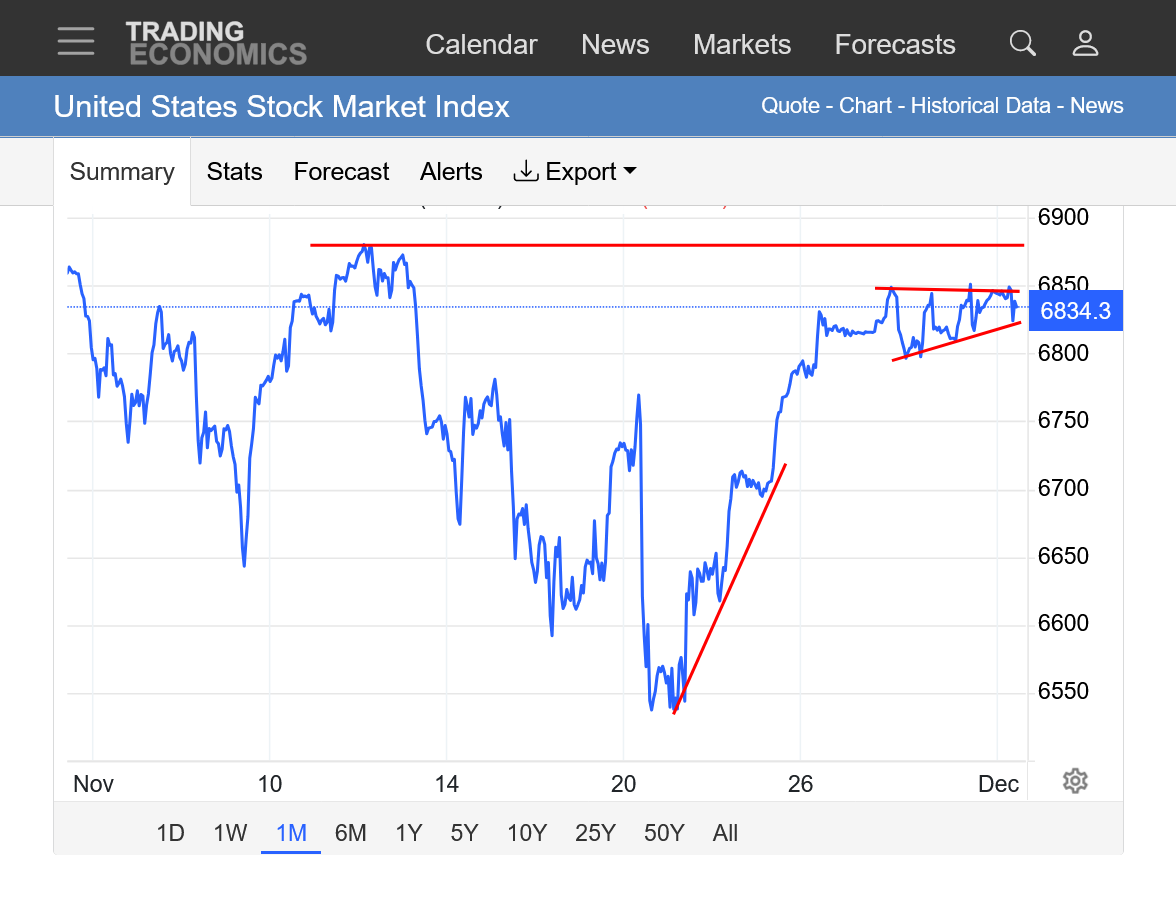
1, 1 week: Breaking below the uptrend
2. 1 month: Double top formation, breaking out to the downside from an ascending wedge/triangle that.
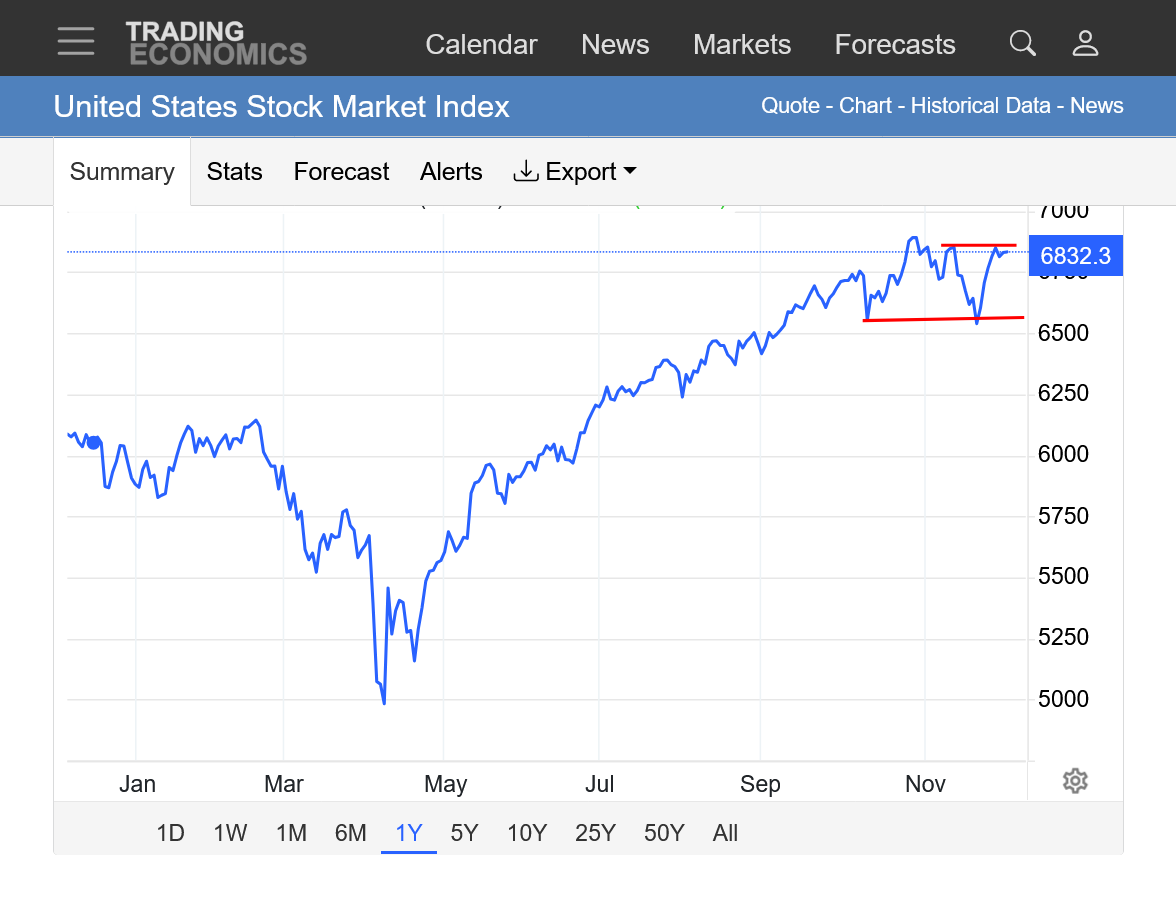
3. 1 year: Double or even triple top formation? This could also end up being a bull flag which is a continuation of the trend pattern. Only a decisive break out and close to new record highs will confirm that interpretation.
4. 10 years: Parabolic/exponential move higher (steeper and steeper uptrend). The only thing we can say for certain it that it can't go on forever.