Heating oil is especially used in the Northeast part of the country for residential heating. The place in the country with some of the coldest weather the next 2 weeks is the Northeast.
https://www.marketforum.com/forum/topic/83844/#83852
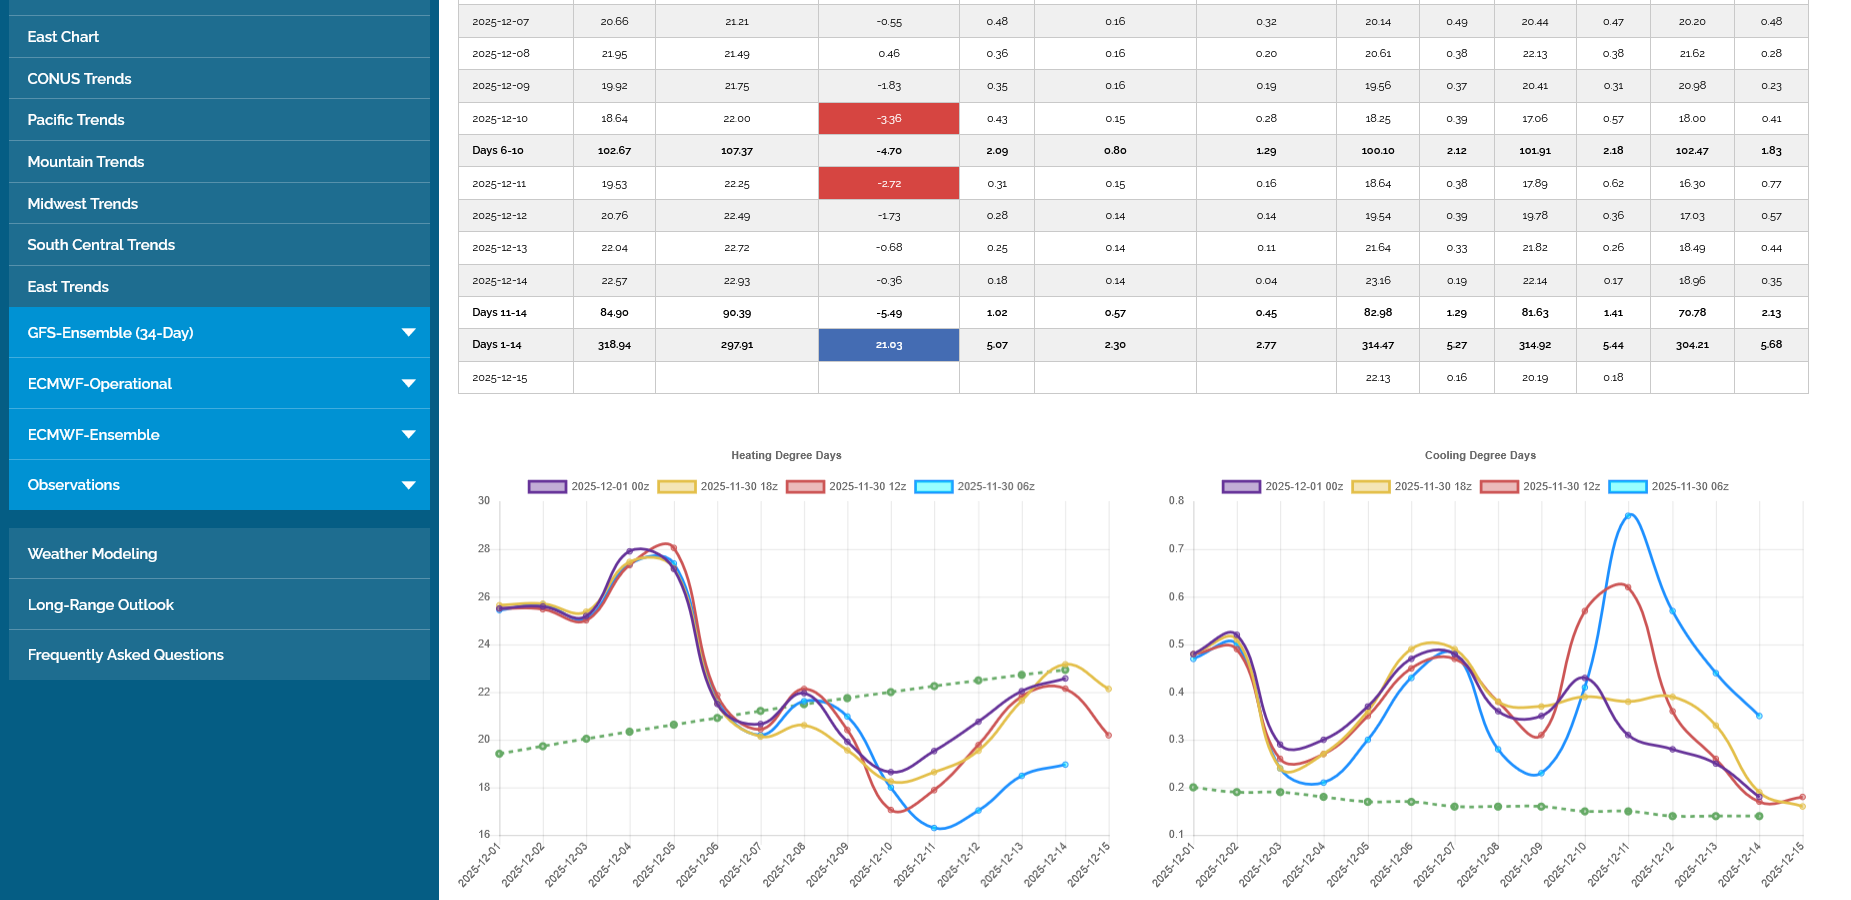
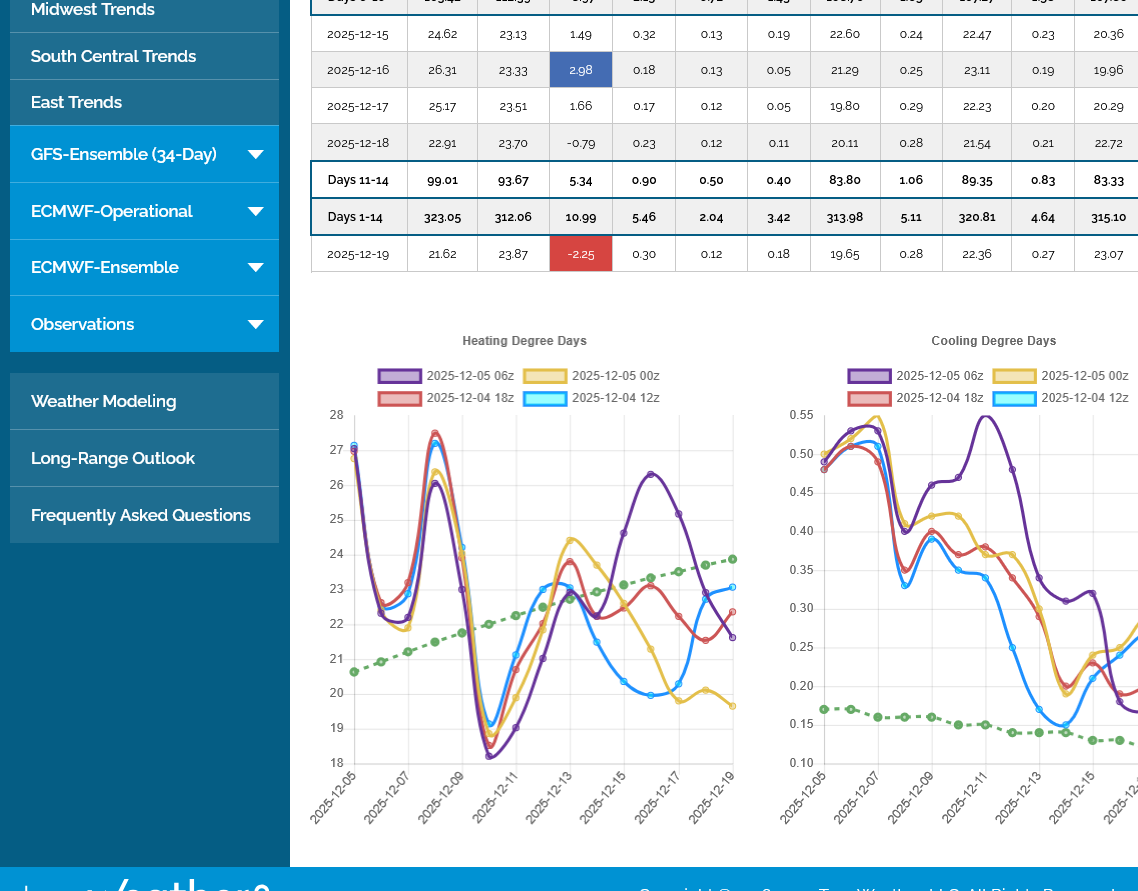
These are the HDDs for just the East.
The last 0z GEFS in purple, on the left is up a whopping +14 HDDs compared to the previous 18z run from 6 hours earlier. That purple line rises back above the green average HDD line!
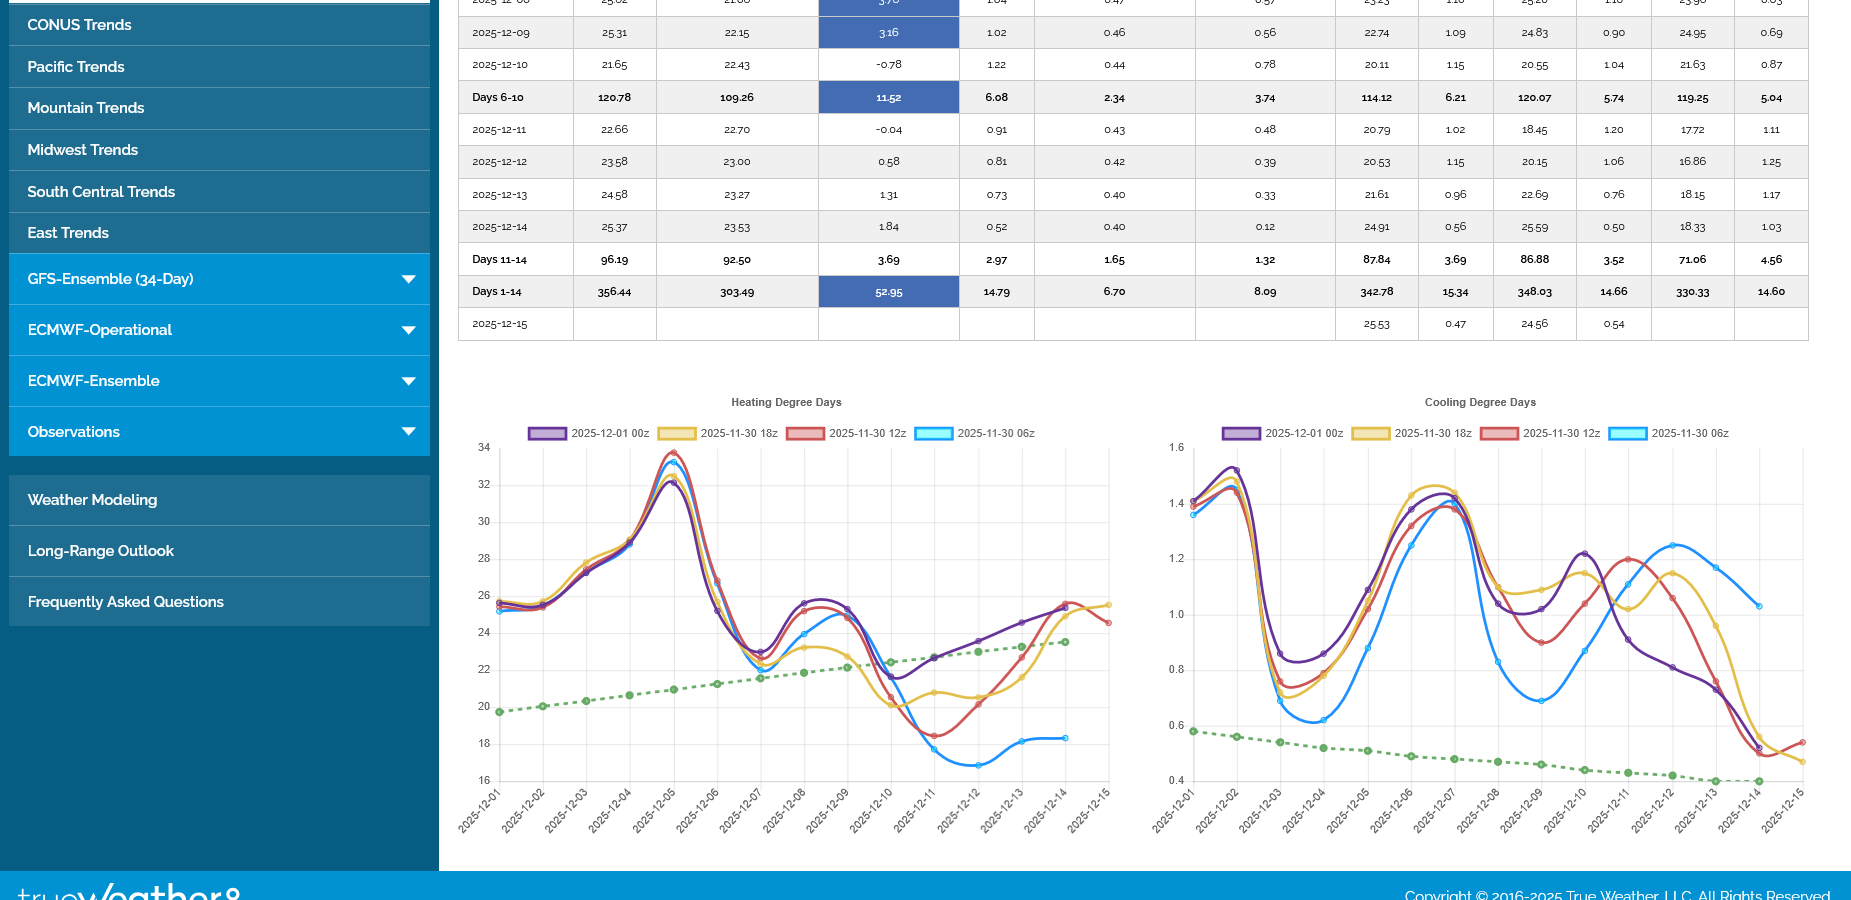
The HDDS for the entire country below were just +4 HDDS compared to the previous run. We can see that the purple line below stays BELOW the green average HDD line in week 2 because of the milder temperatures coming into the West and spreading into the Midwest, as cold deepens in the East.
After the 0z GEFS above came out, the European Ensemble model came out MILDER. This caused NG to plunge and the HO to give up around 1c of the evening 5c+ spike higher than Friday's close.
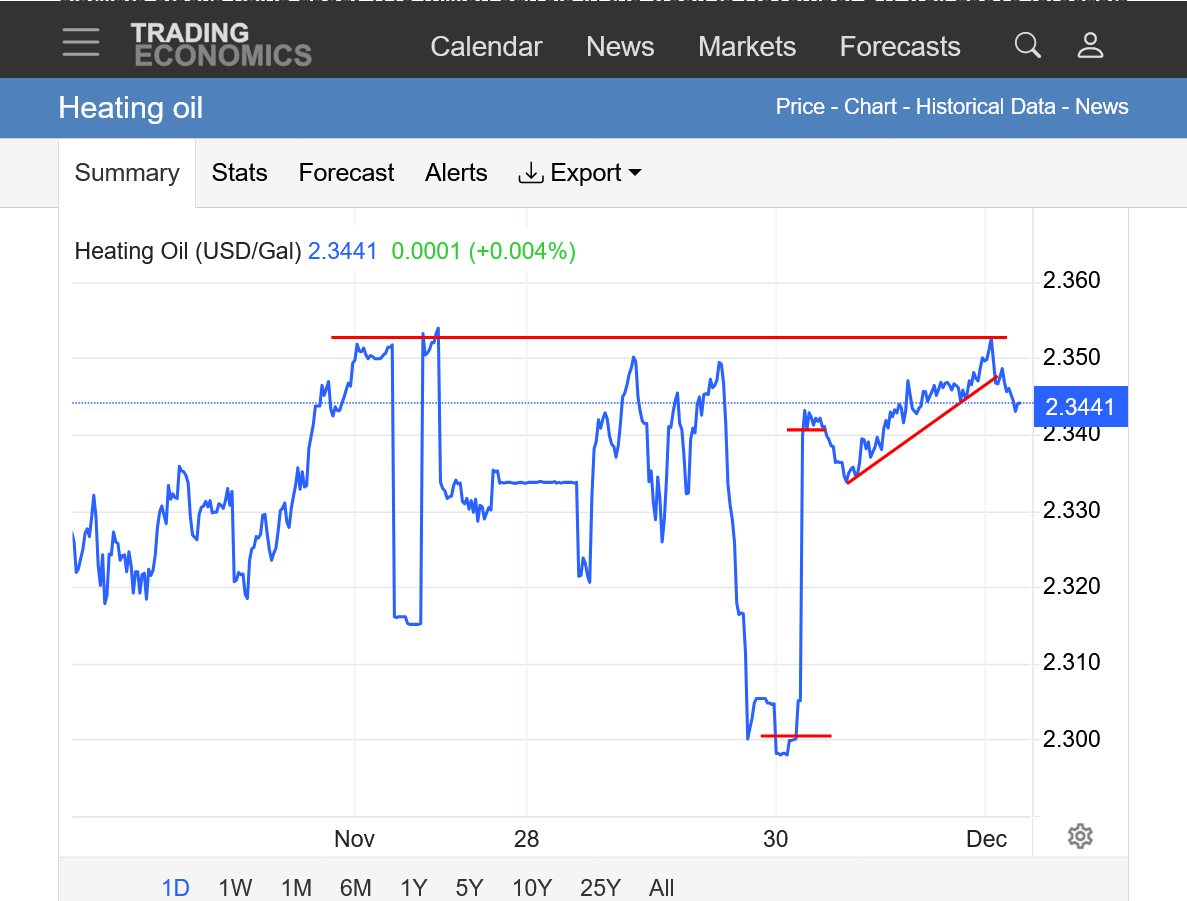
https://tradingeconomics.com/commodity/heating-oil
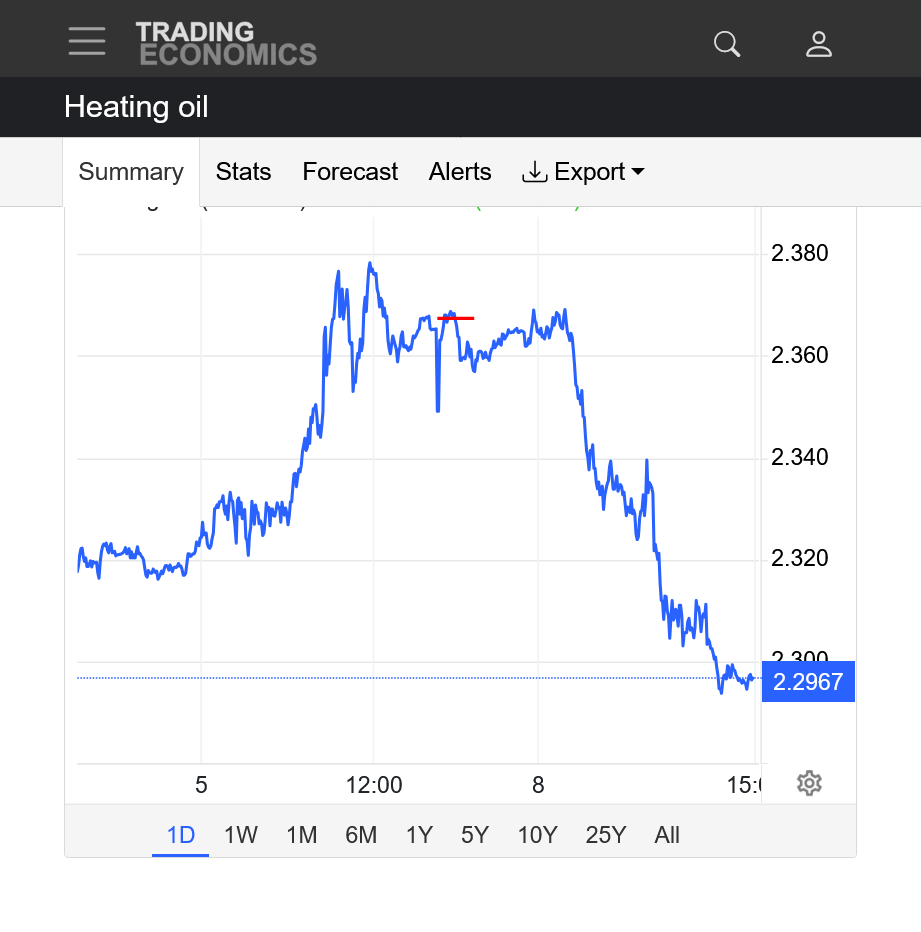
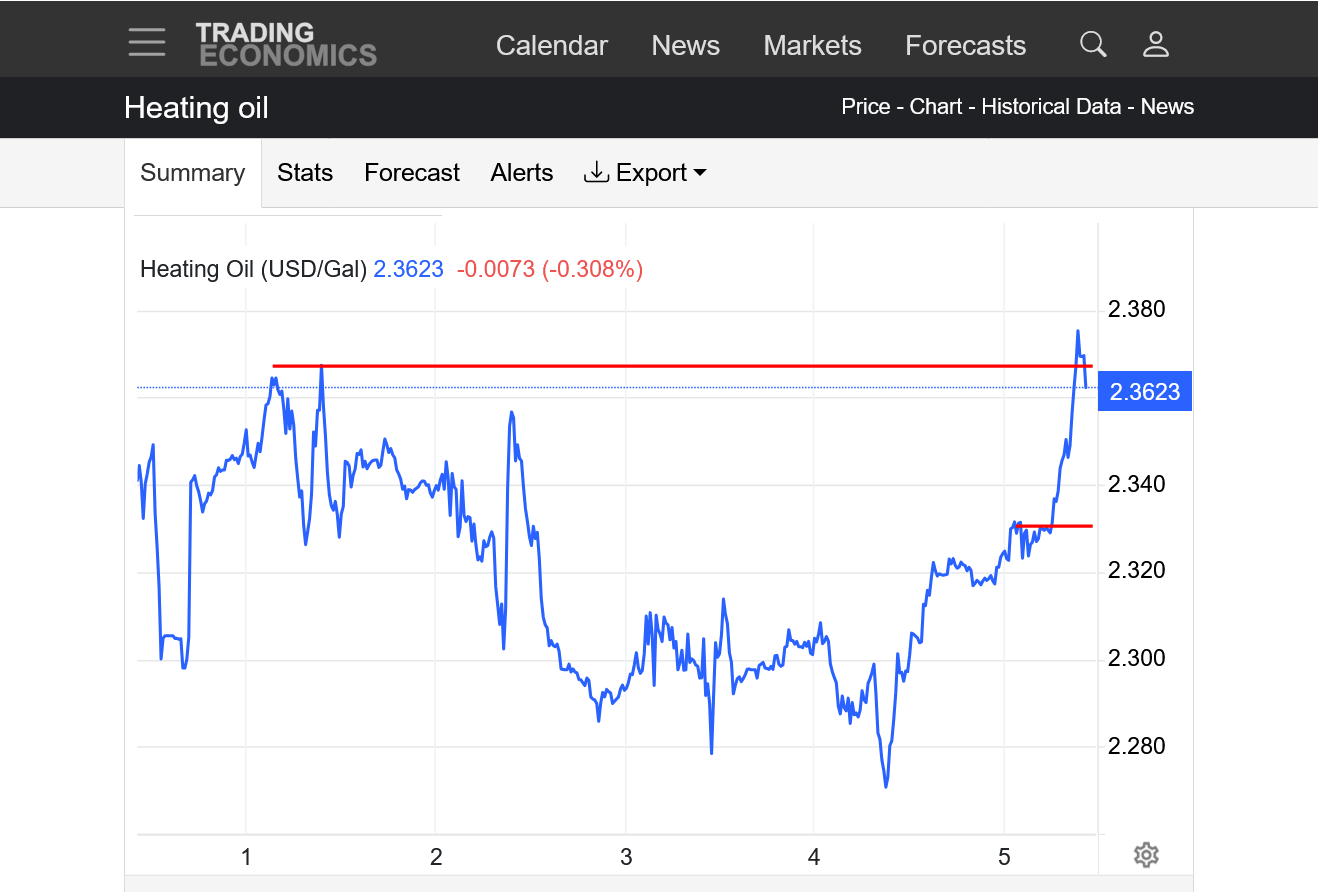
1. 1 day: The bottom horizontal line was the close on Friday. The horizontal line above it was the higher open this evening. We were having a steady move up for several hours, then the European Ensemble model came out milder and we've spiked down over 1c after testing resistance(top horizontal line).
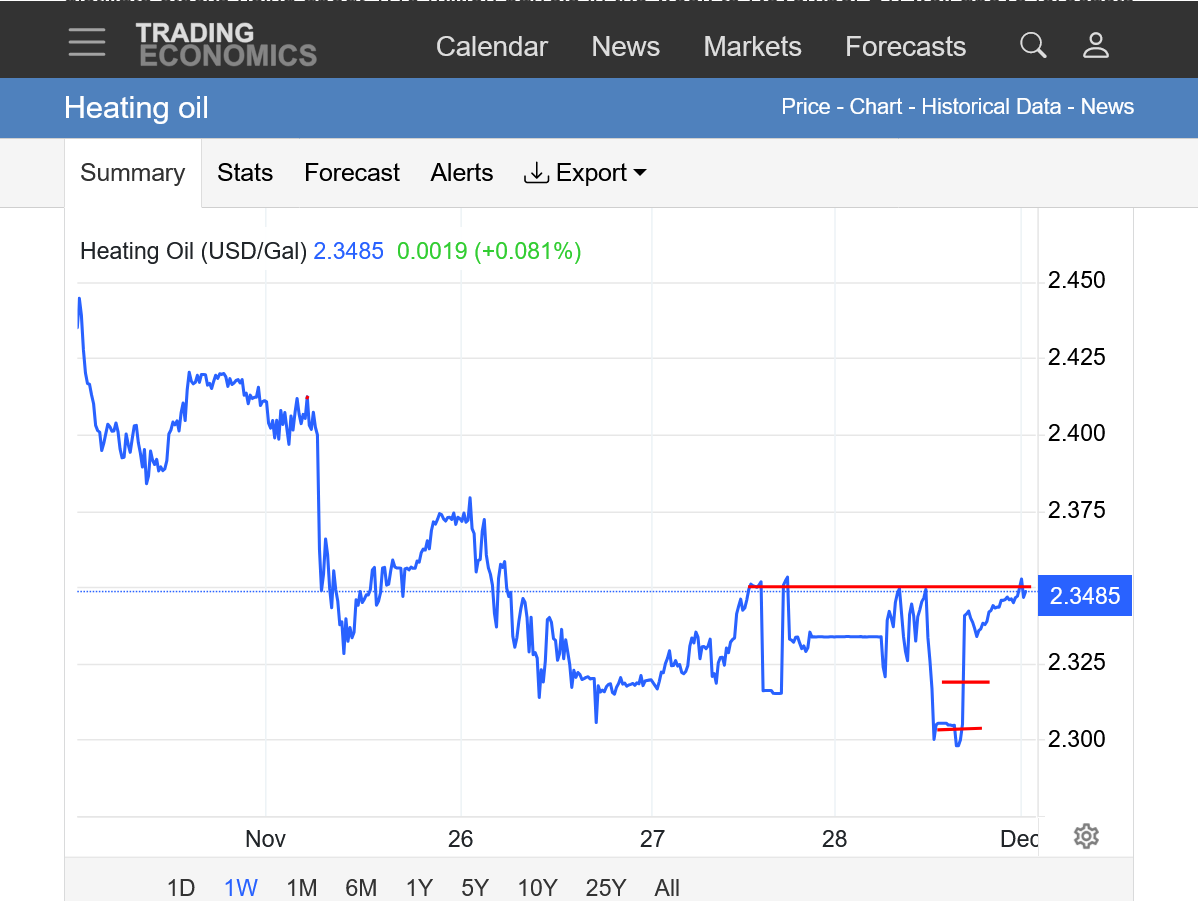
2. 1 week: Rounding bottom? from the colder weather pattern? Or is this a bear flag/pause in the downtrend?
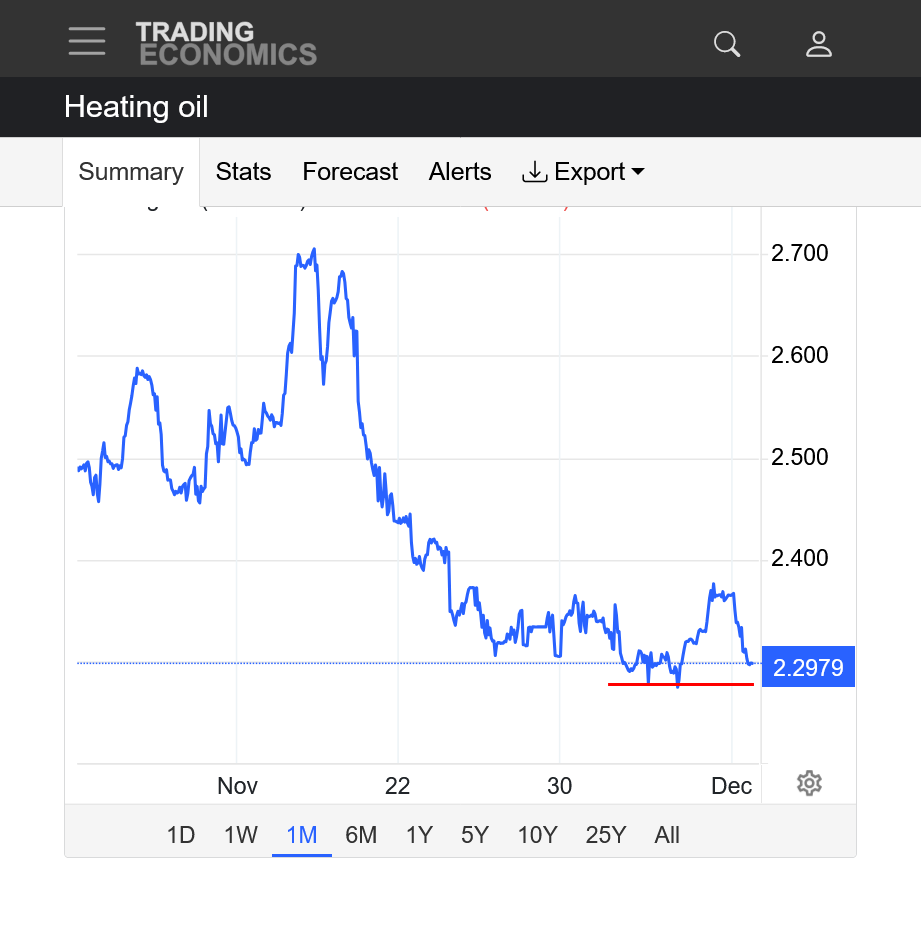
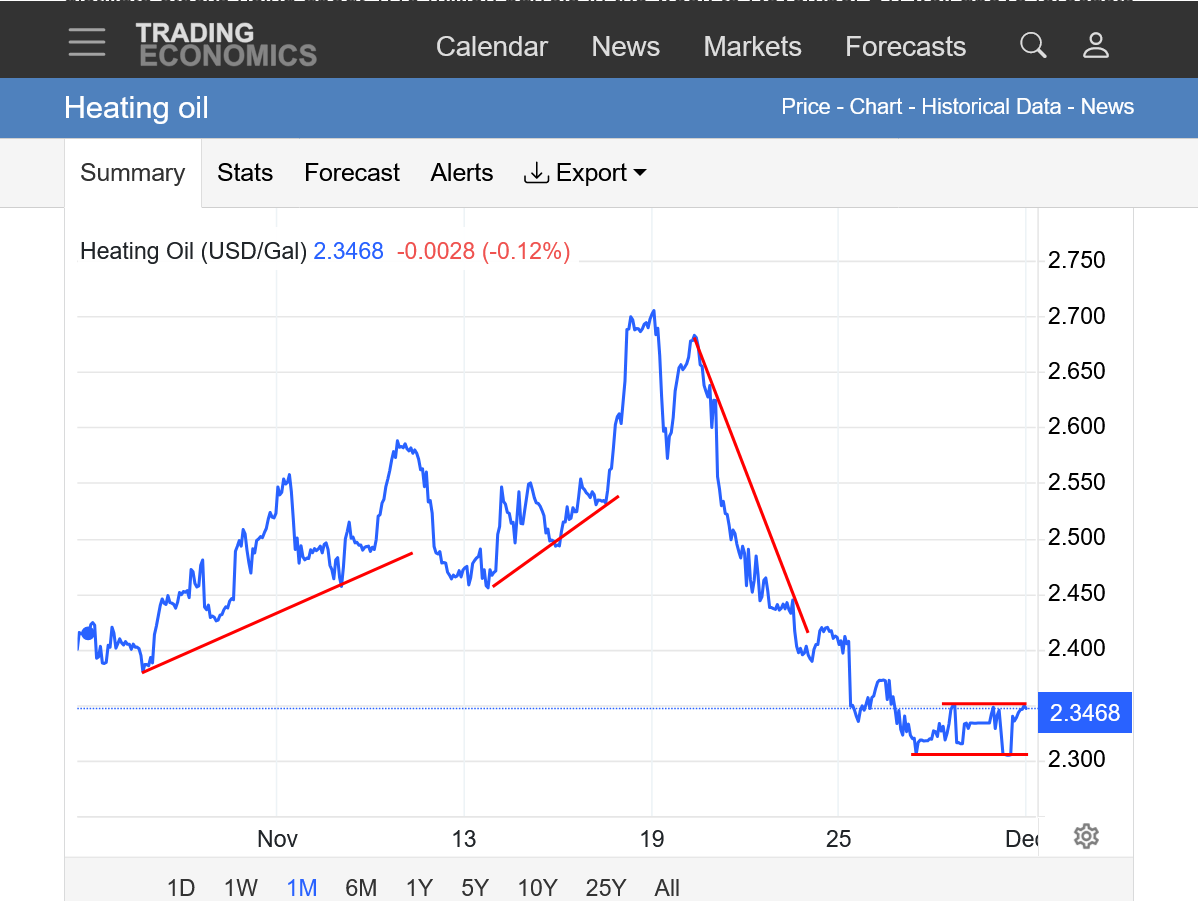
3. 1 month: Major top on November 19, then a drop plunge of 40c! This could be a bear flag or it could be a bottom.
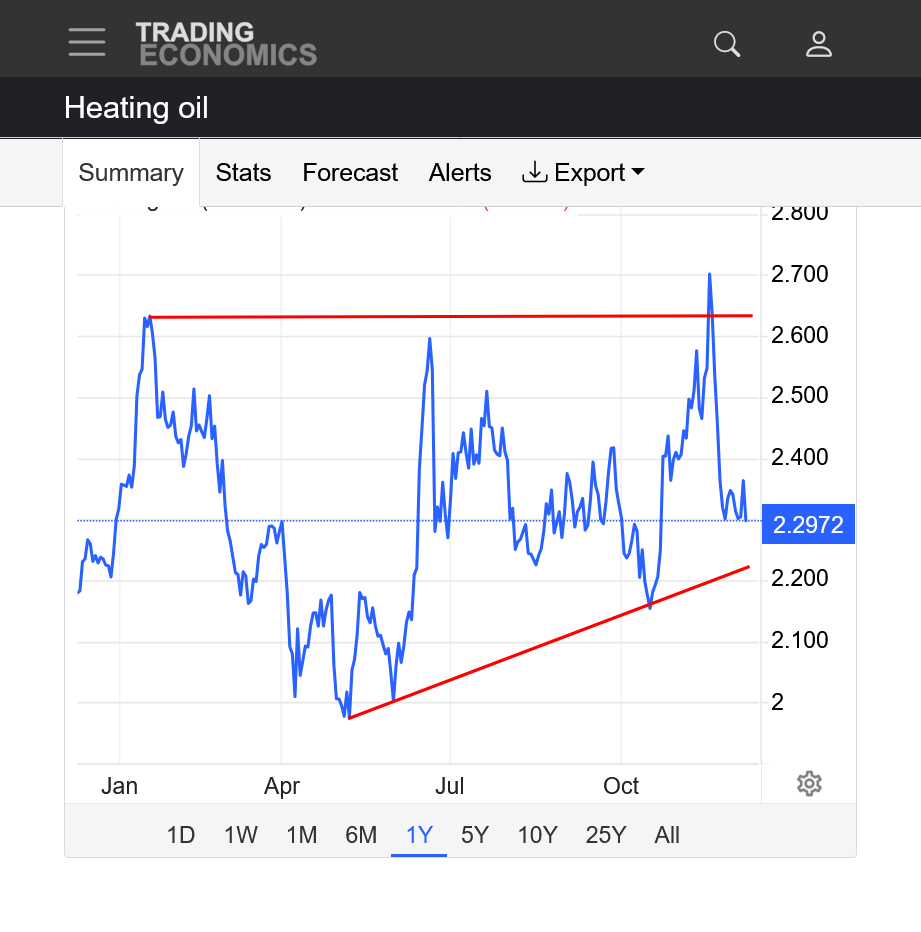
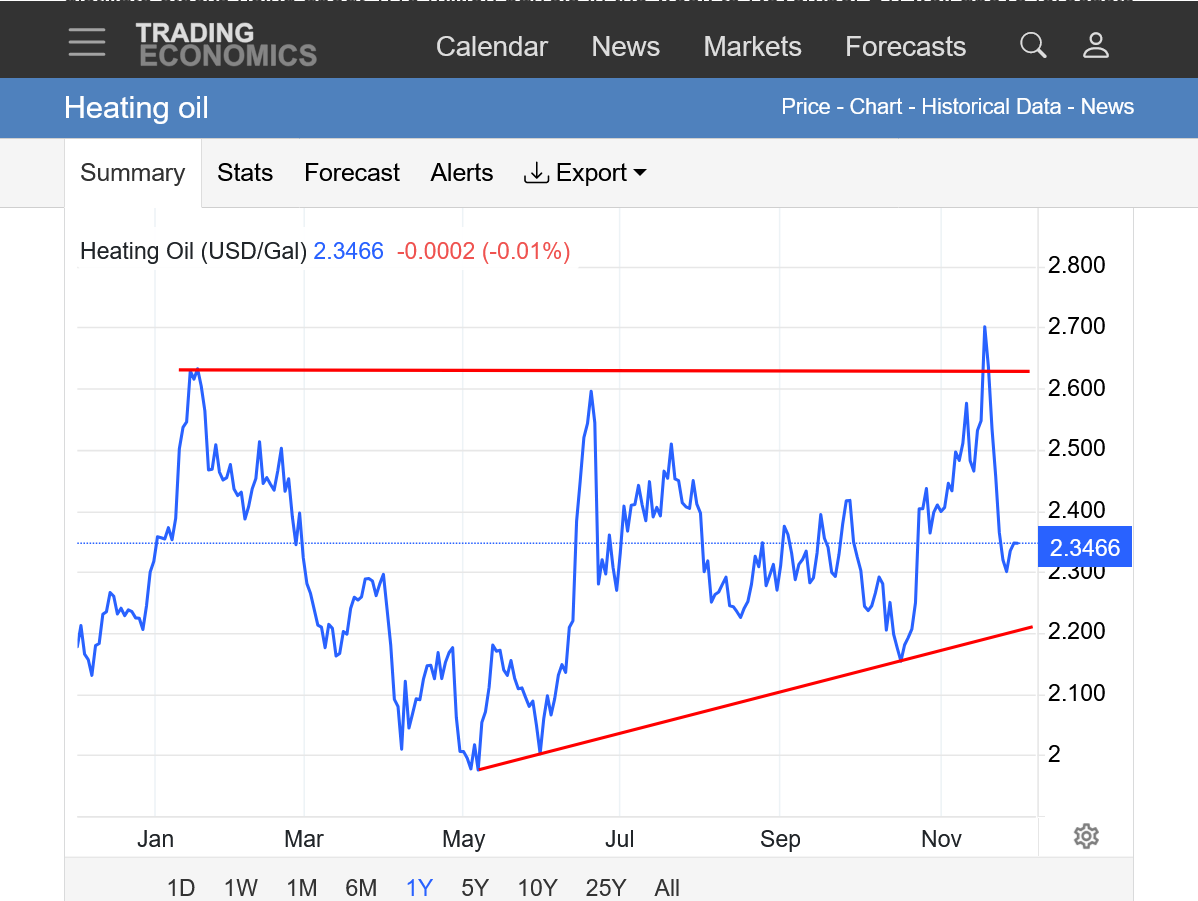
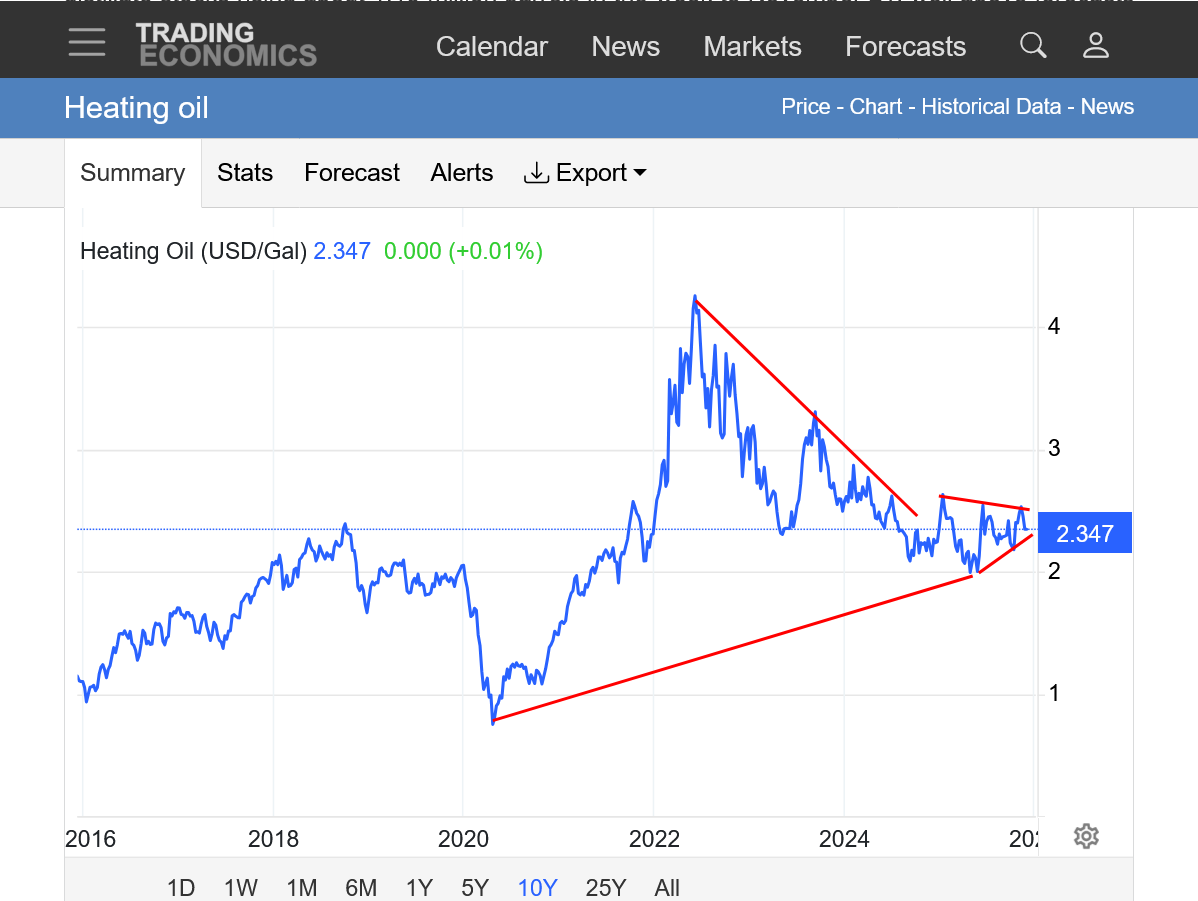
4. 1 year: Ascending triangle/wedge
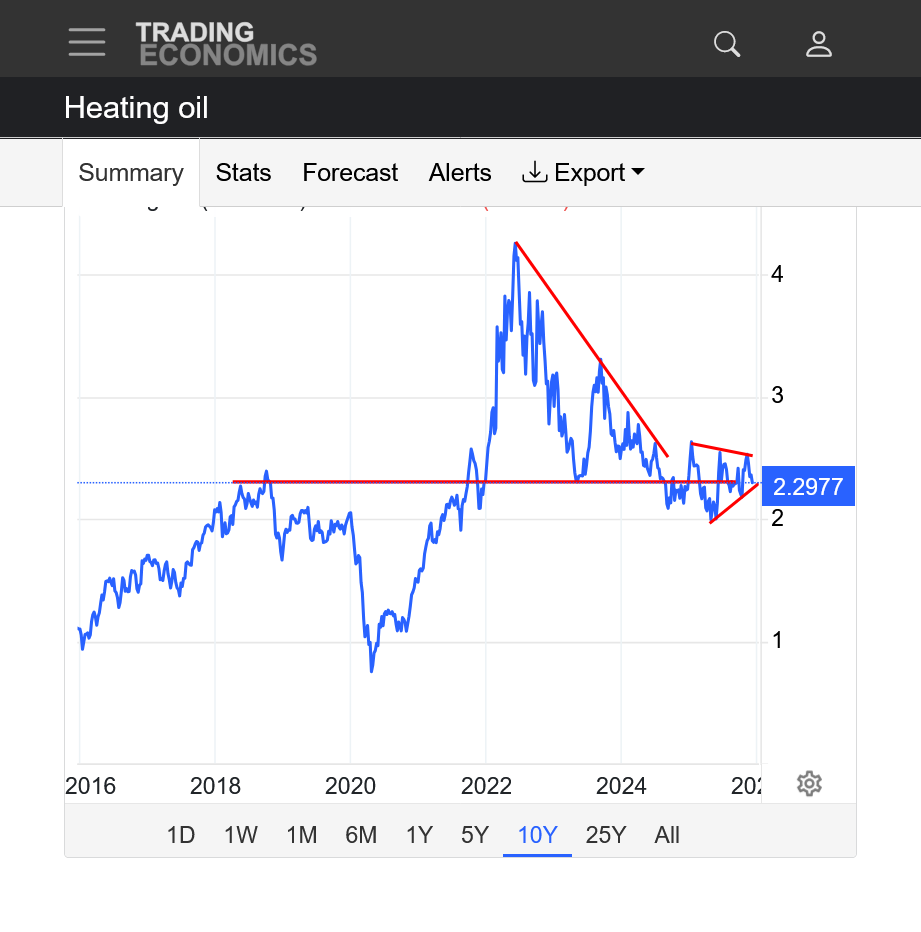
5. 10 years: A long term symmetrical wedge/triangle (higher lows and lower highs) and a shorter term one too!
HO has gone the complete opposite direction as gasoline/RB.
HO is 3.5c off the highs and near the lows, while RB is on the highs.
Heating oil. Open last night is the red line. Currently near the daily LOWS.
https://tradingeconomics.com/commodity/heating-oil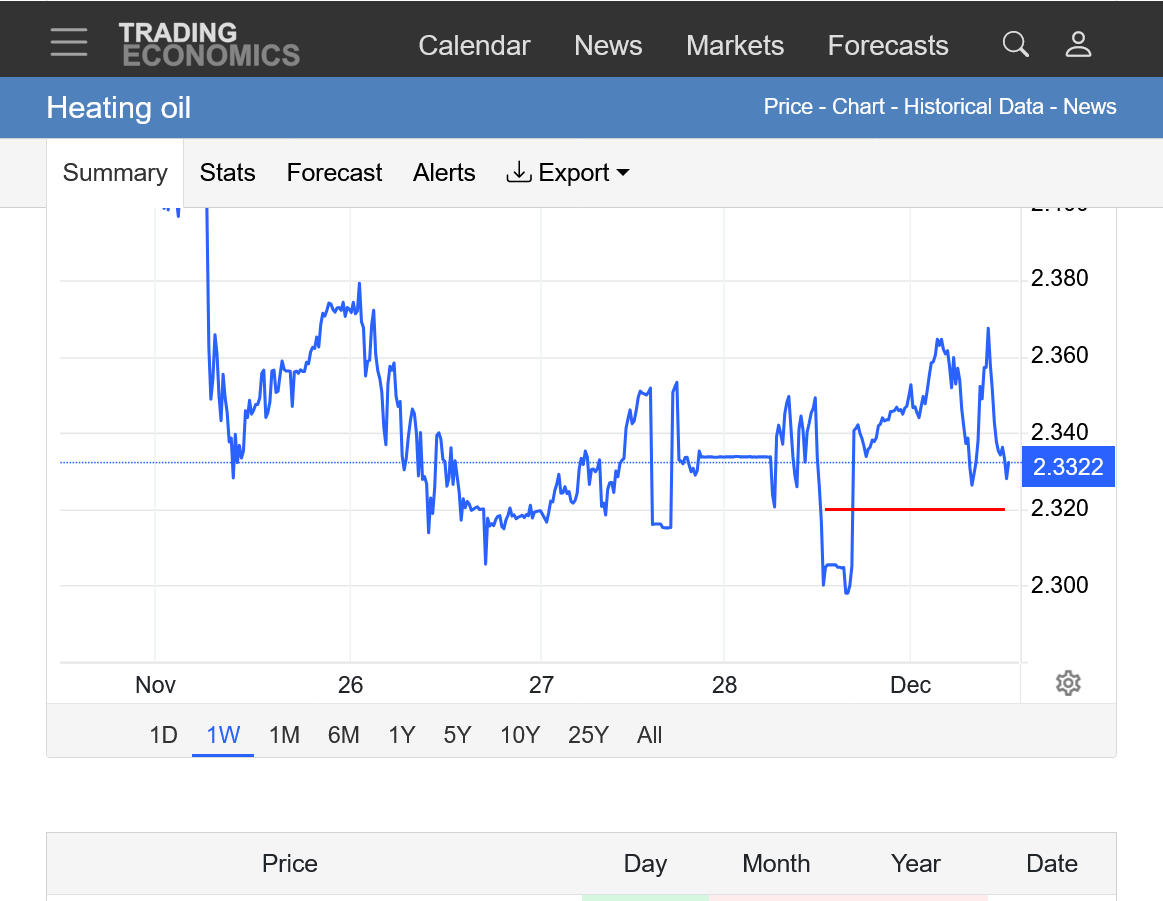
Gasoline/RB below. Open last night is red line: Currently near the daily HIGHS.
https://tradingeconomics.com/commodity/gasoline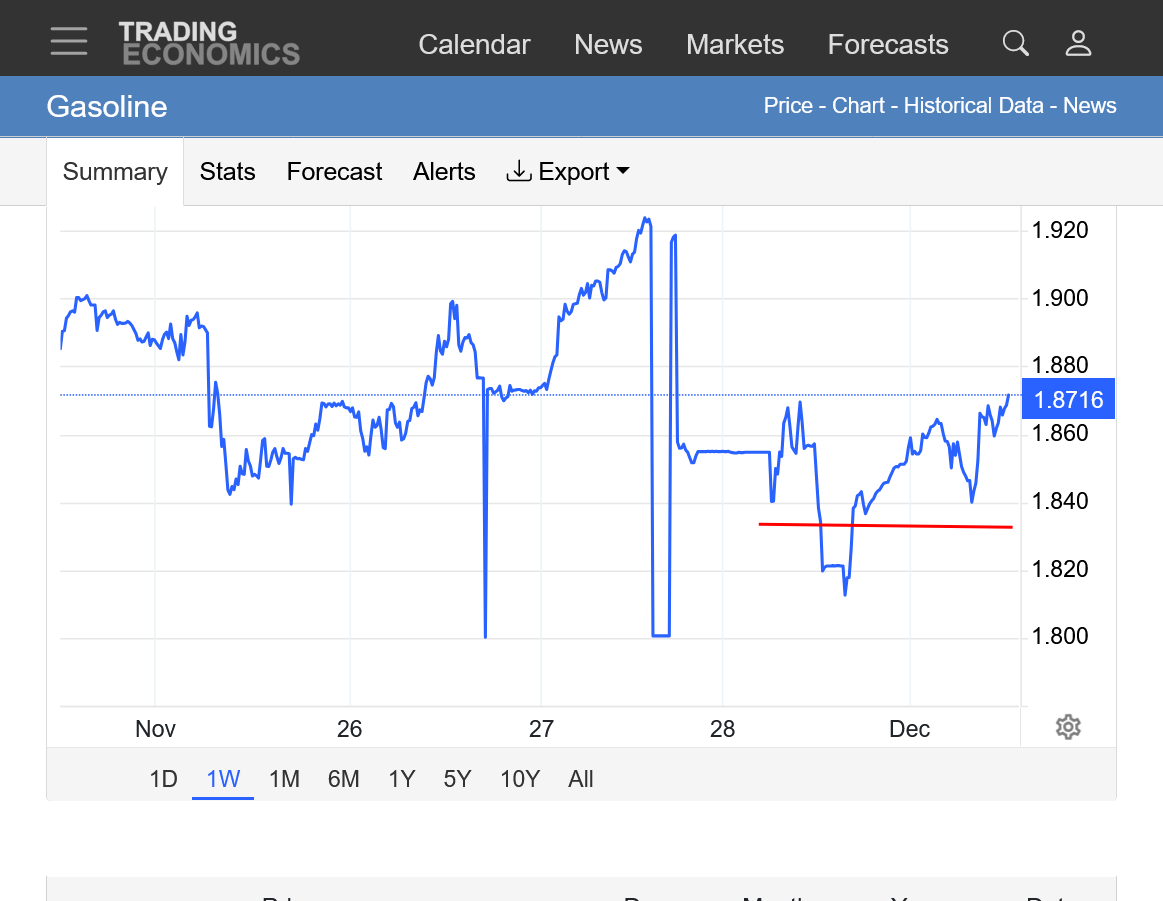
The traders buying the gas and selling the heating oil RB/HO bull spread are making a killing today!
The 6z GEFS came out incredible colder than previous guidance which caused BOTH NG and HO to take off like a rocket, especially NG. As Larry knows, HO is not always the best weather market because other factors can impact crude which is where HO comes from.
I'll copy the discussion from our natural gas thread below that has a comprehensive explanation of this trading/weather dynamic. We can see how NG reacted bullish all week but the HO was only bullish to start the week, and now bullish again at the end of the week. Only now, challenging the highs of the week, while NG is $8,000/contract higher than we started the week.
1. 1 week: Very strong start to the week(Sunday Night) but then we sold off, despite the forecasts remaining cold on Tue/Wed/early Thu. The short red line on the right was when the Frigid 6z GEFS model came out.
+++++++++++++++++++++++++++
Re: Re: Re: Re: Re: Re: NG 12/1/25-
By metmike - Dec. 5, 2025, 10:31 a.m.
We were trading in a range all night, then the 6z GEFS came out with a MUCH, MUCH colder pattern(+10 HDDs doesn't tell the entire story-purple line/left) and NG took off like a rocket!
In around 3 hours, NG has soared around $3,500/contract!
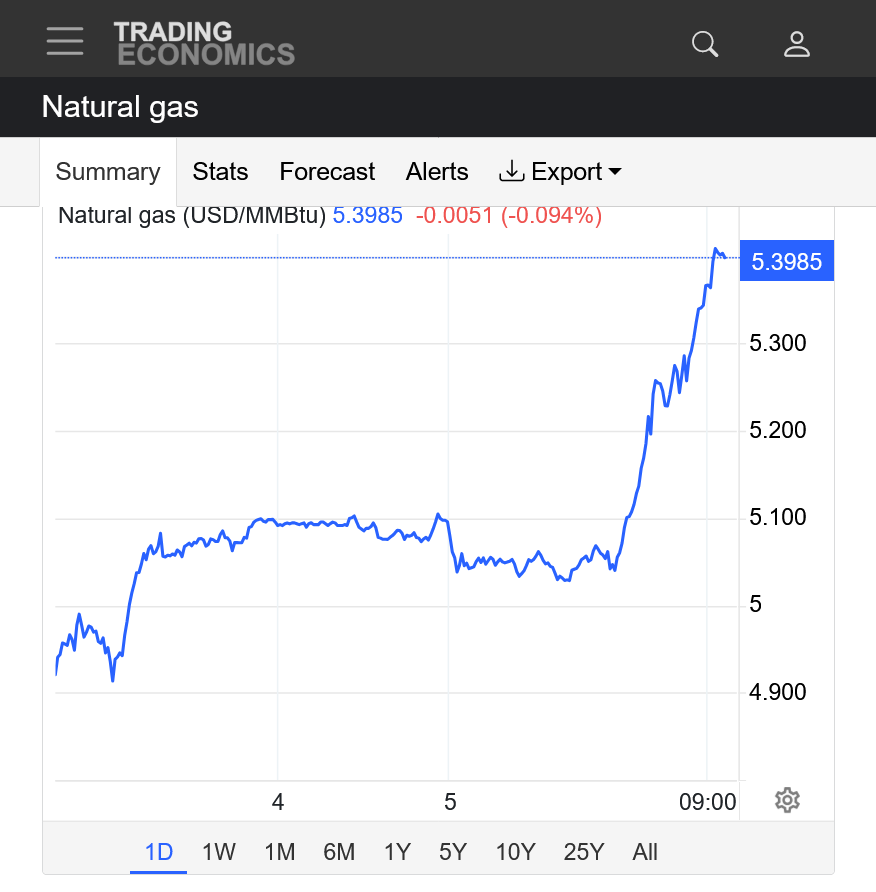
https://tradingeconomics.com/commodity/natural-gas
1. 1 day
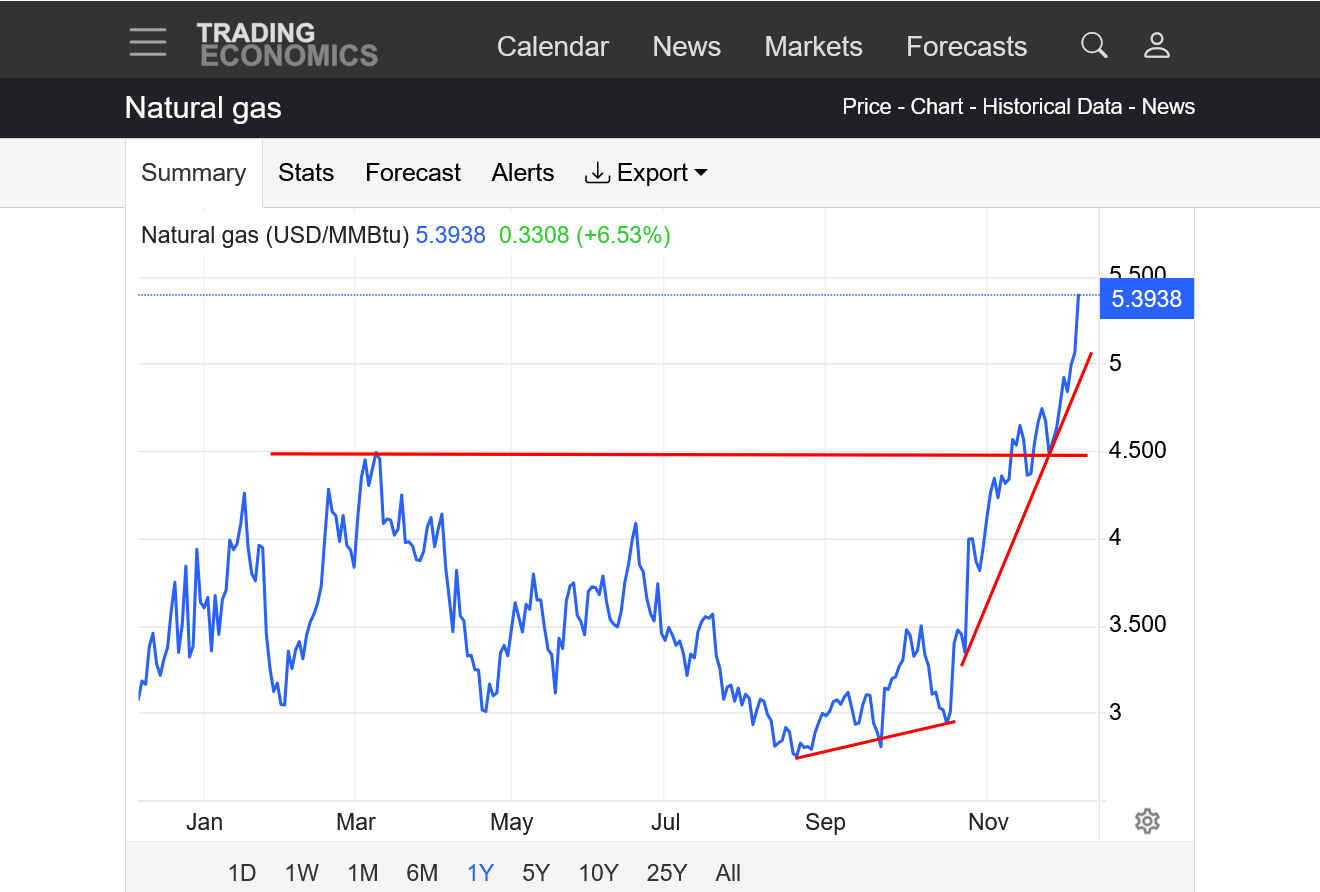
2. 1 year: Bottom in Sept after the record cool spell from this same pattern caused a huge REDUCTION in CDDs. Upside break out above the March highs.
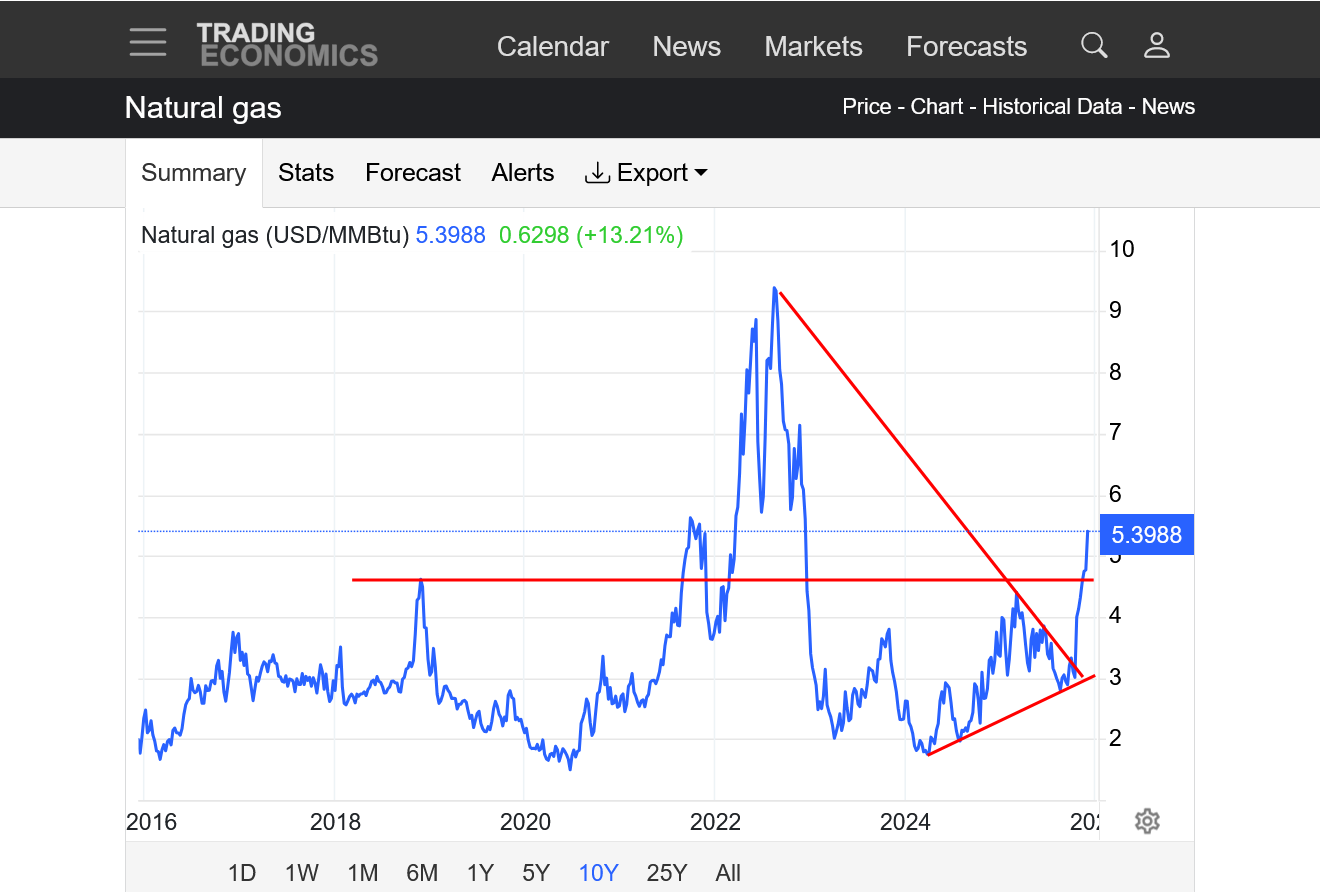
3. 10 years: MAJOR upside breakout from a symmetrical triangle/wedge(higher lows-lower highs). AND above long term resistance. Very bullish.
++++++++++++++
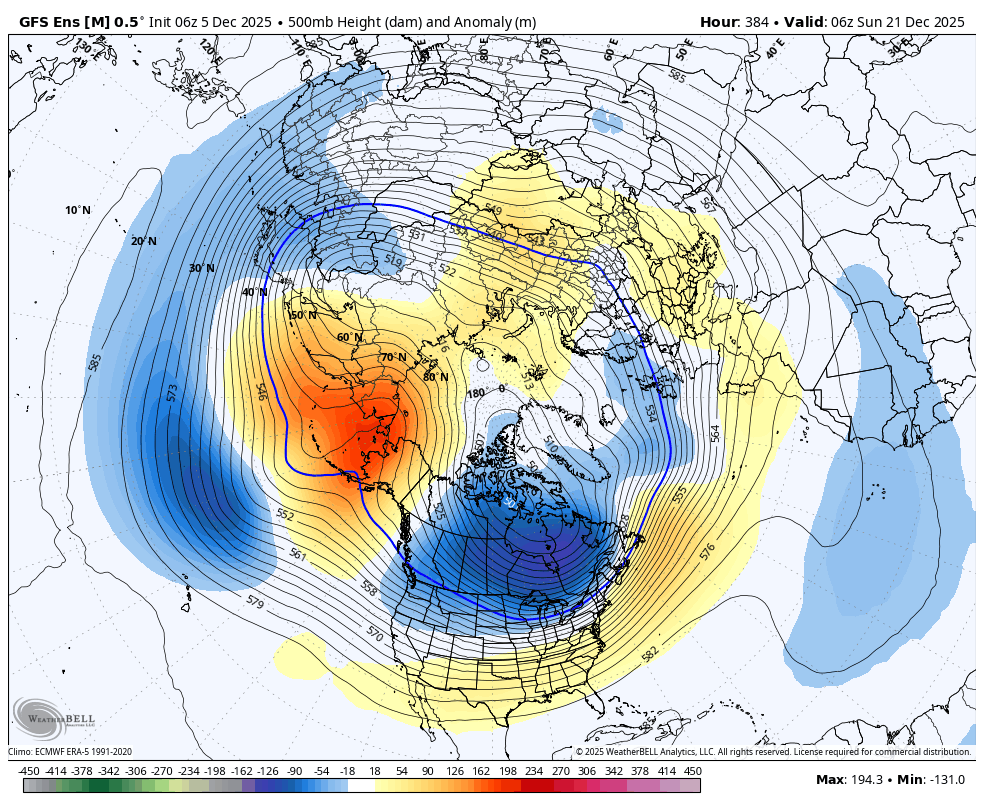
This was the last map on this last 6z GEFS solution that has fired up the ng market. This is Dec 21st.
The colors are anomalies compared to the average. Warm colors are above average. Cold colors are below average. Note the extreme high in Alaska to extreme low downstream in Canada to the northern US, where the Polar Vortex will be displaced unusually far south. This extreme couplet will feature cross polar flow, as seen by the streamlines between the couplet. Its an optimal set up for frigid air at high latitudes(Siberia-the coldest place in the Northern Hemisphere Winter in this case) to be transported south to the middle latitudes. The far southern US still has slight positive anomalies but this is the 500 mb map at around 18,000 feet(mid way in the atmosphere). Extremely cold air masses plunging south NEAR THE SURFACE will UNDERCUT the jet stream from huge Arctic highs that push the colder air deeply into the United States, even into the South.
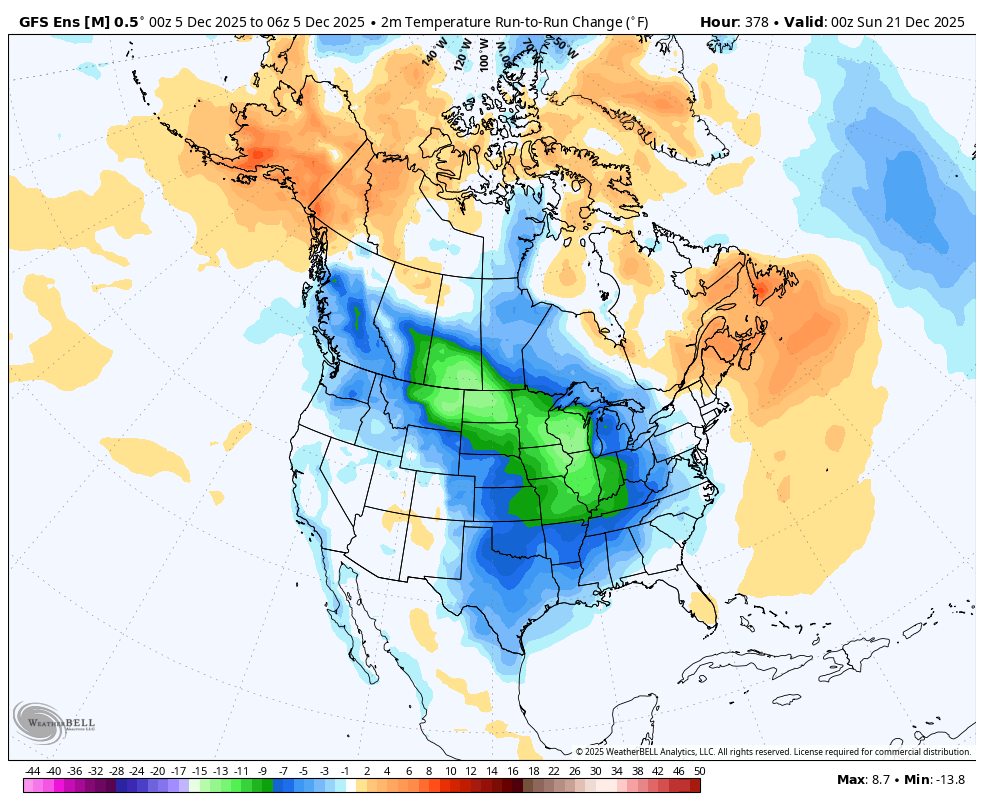
Below was the surface temperature change compared to the previous 0z run at that time frame:
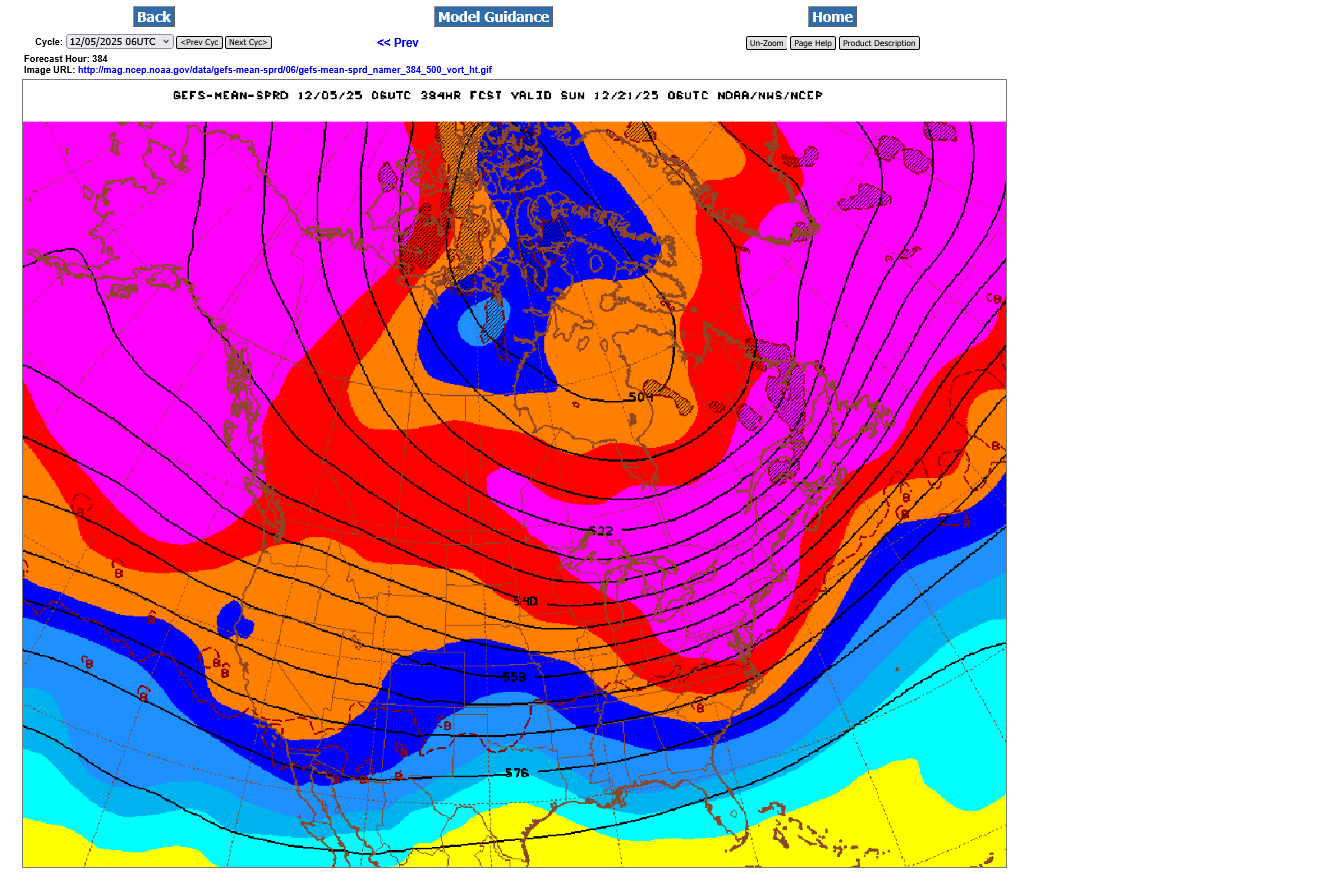
Here's another source for the same data that doesn't show the entire Northern Hemisphere like the top map does. Note the tightly packed streamlines in Northwest Canada. Those will be like channels that act as steering currents for air masses. They have an extremely strong north to south component and they originate, on the other side of the hemisphere in Siberia! This is where air masses in the flow will be coming from! The closer the lines are to each other, the stronger the winds. Follow those lines farther south and we can see them dumping air masses from Siberia south of the US/Canadian border, where surface highs/winds will push them even farther south. We can see the center of the Polar Vortex over the Hudson Bay, which is displaced south of its usual position :
Like NG today, HO is getting crushed from the big weather pattern change to milder on models over the weekend.
Down almost 7c and $3,000/contract lower.
See NG threat for the explanations. Scroll down from here:
By metmike - Dec. 5, 2025, 2:15 p.m.
HO charts later if I have time.
https://tradingeconomics.com/commodity/heating-oil
1. 1 day. Red line was the open Sunday Night. We didn't collapse lower until just after midnight, after the 0z models were coming out.
2. 1 month: Still just above December lows but down a whopping 40c in less than a month( -$17,000+/contract).
3. 1 year: Ascending wedge/triangle which is still potentially bullish with higher lows.
4. 10 years: 2022 spike highs after the Ukraine war started, followed by a steep decline. Most recent formation is a symmetrical triangle (higher lows and lower highs). We're right at some major long term support/resistance.