New thread time!
Thanks again, Larry!
You're the man when it comes to knowing when scrolling down half way to China on a natural gas thread means it's time to start the next one. 66 posts below........that was my football number in high school!
Previous thread:
NG 11/10/25-12/1/25
66 responses |
Started by WxFollower - Nov. 10, 2025, 10:14 a.m.
https://www.marketforum.com/forum/topic/115827/
+++++++++++
Much more to come but I'm focused a bit on this next weather system too:
Snow event (light) December 1 & 2, 2025
Started by metmike - Nov. 29, 2025, 11:27 p.m.
https://www.marketforum.com/forum/topic/116271/
+++++++++++++
And heating oil, that's often not the greatest weather market, has come alive!
Heating oil is the upside leader to start the week
Started by metmike - Dec. 1, 2025, 1:24 a.m.
Thanks, Mike!
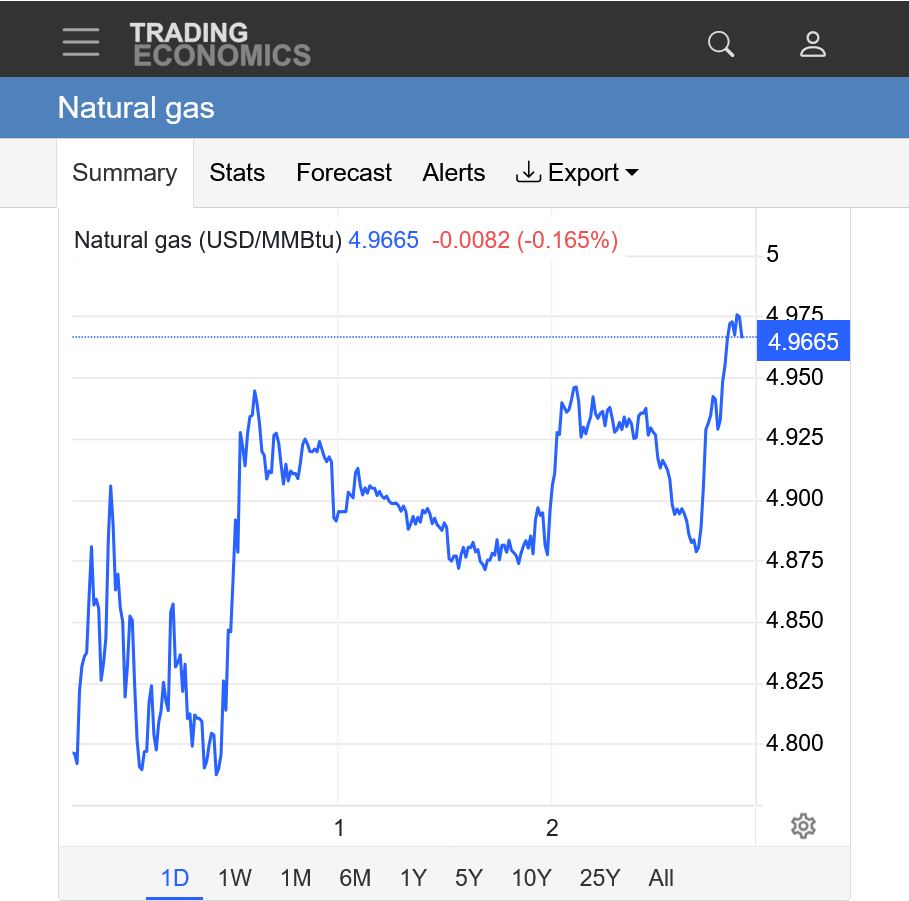
NG rose a sharp 3% in just 40 minutes (11:55AM-12:35PM CST) bringing it to its highest since way back in Nov. of 2022! Interestingly, it appears to my eyeballs that the # of HDD of the 12Z EE didn’t go up much, if any, and could have even dropped a little.
However, the late 12Z EE maps suggest a new supply of very cold air will develop in W Canada, which is in a position to plunge down into the C US soon after. This wasn’t on the prior runs for the comparable period. I suspect that that was a big contributor to the 3% rise.
Larry,
I think you really nailed what seemed like a very confusing reaction by the natural gas market(spike up $1,500 to new highs suddenly) to what was a release of BEARISH HDD data.
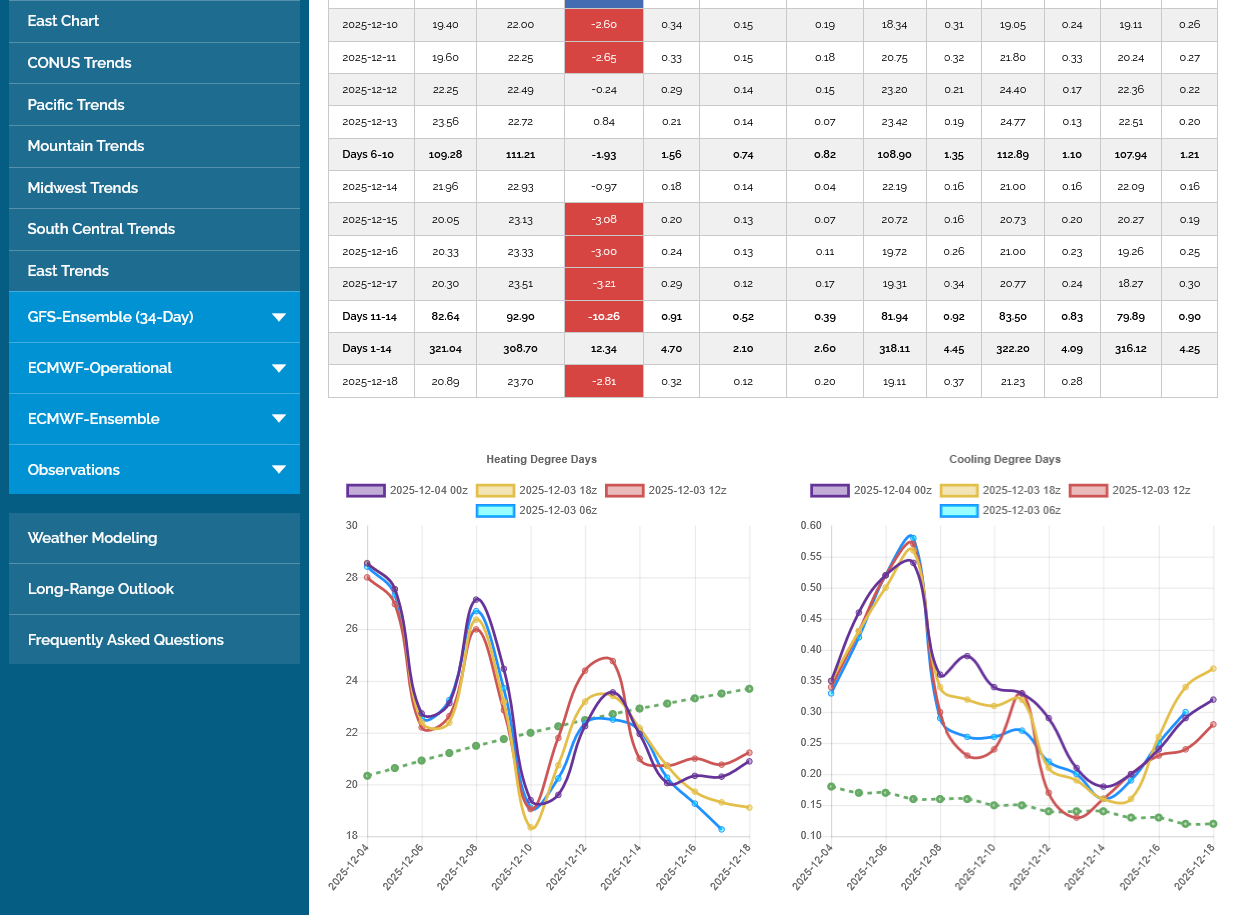
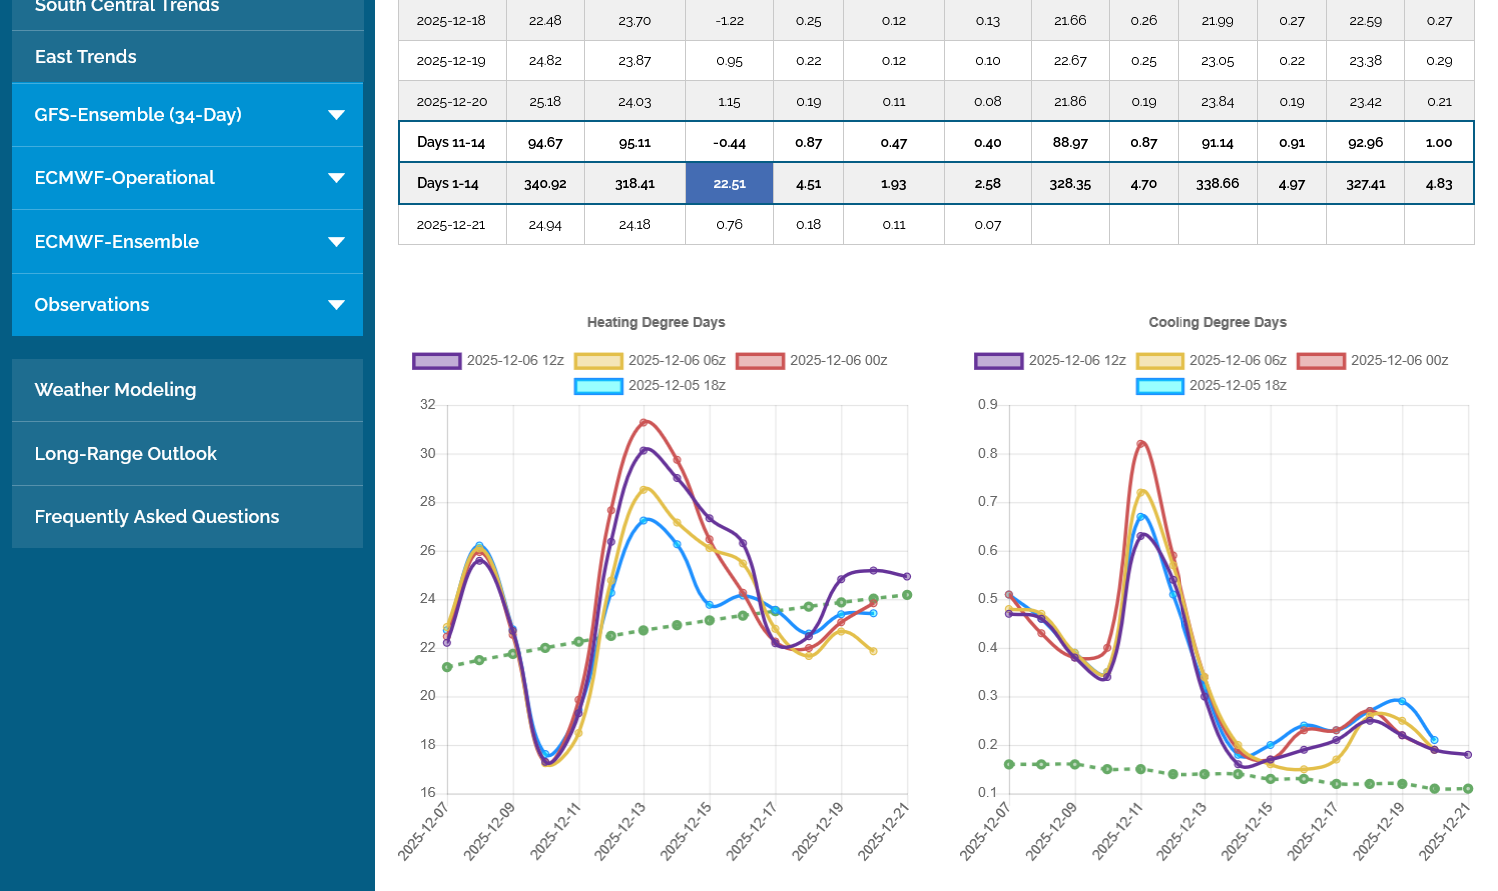
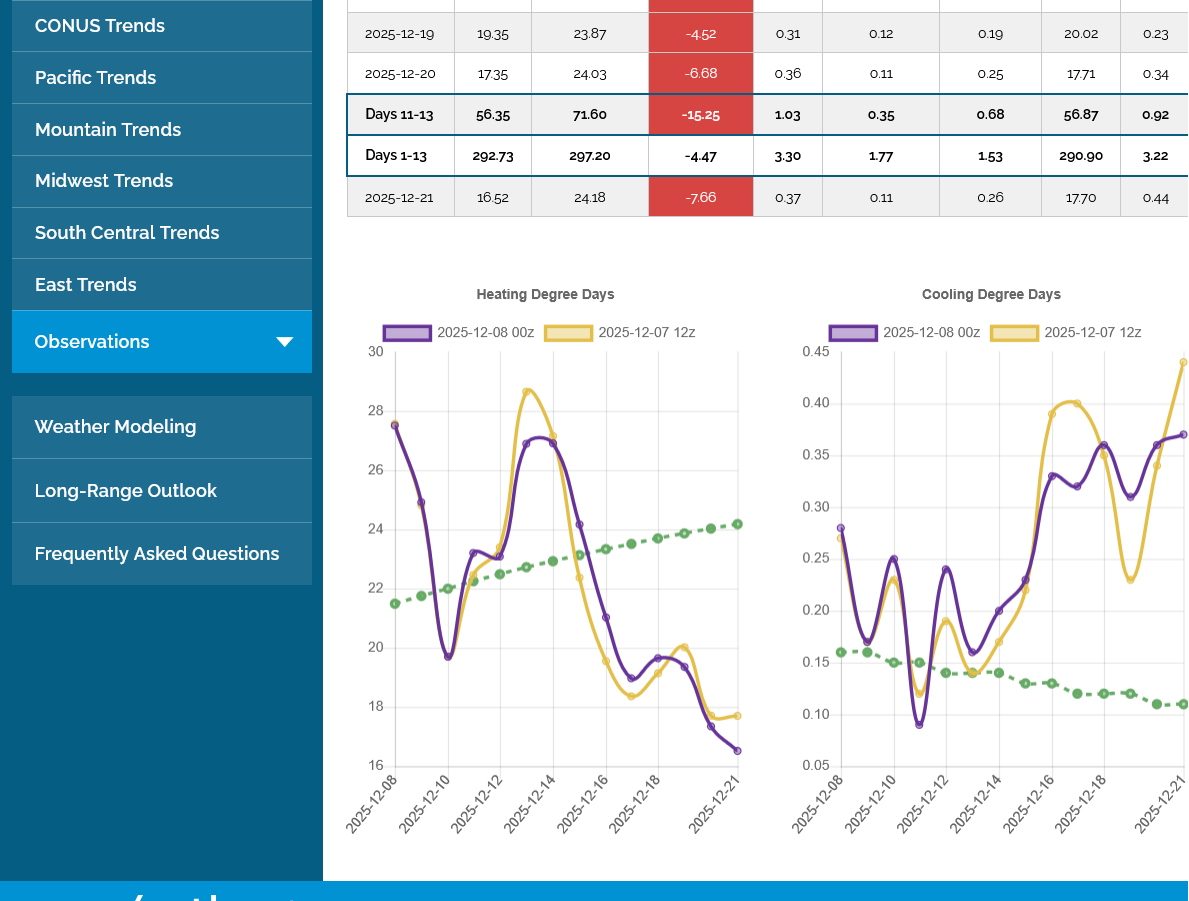
Let's start with the almighty European Ensemble model(that averages 50 different members to give us a superior, more consistent product-which takes out all the extreme outliers) that the market worships........because it really does have the best forecasting skill of them all.
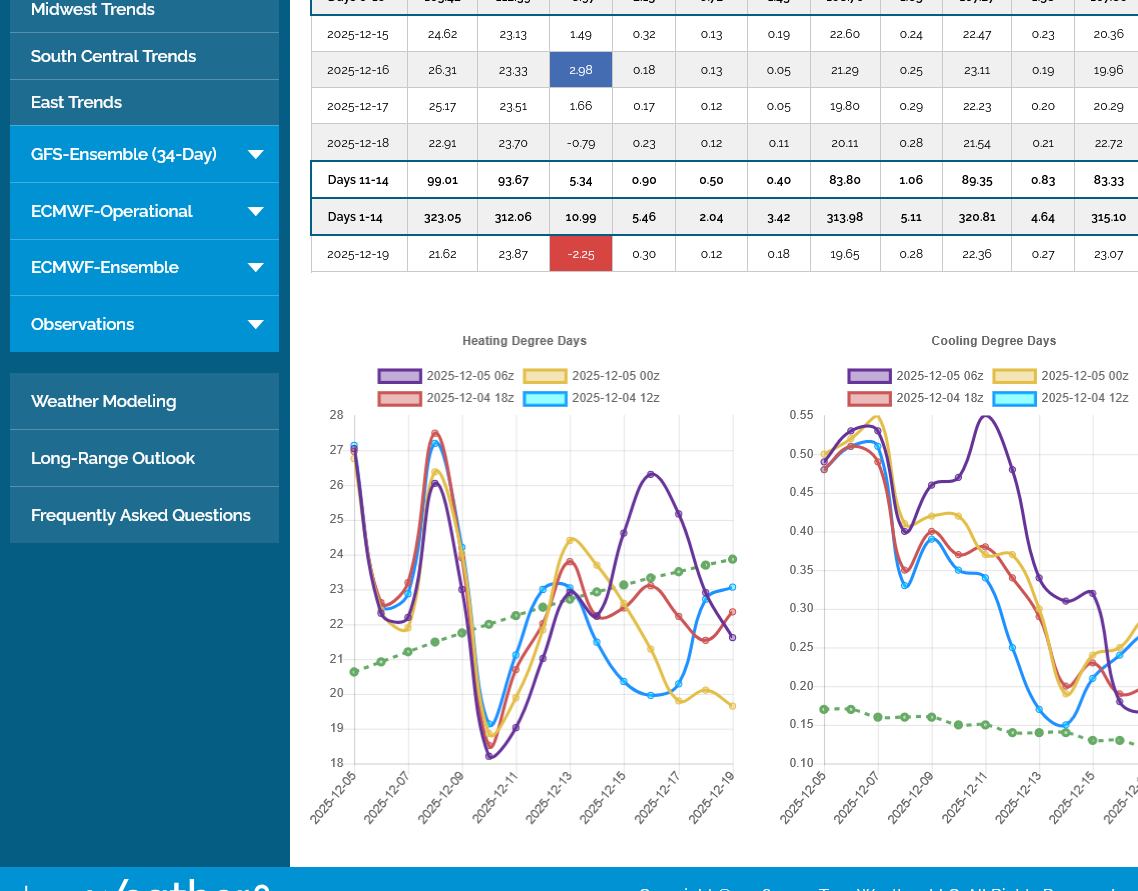
1. EE HDD's in purple were LOWER, -4.5 compared to the previous one. And the trajectory is DOWN!. If I knew ONLY this an hour earlier, I would have been tempted to be short Luckily that was not the case!
2. The GEFS(American model that has similar individual ensemble members averaged to 1 product) below it shows the same thing. -5 HDDs.
3. Look what NG did when that data came out!!! After an initial, small dip, it took off like a rocket to new highs. New highs for the day and move!!!!
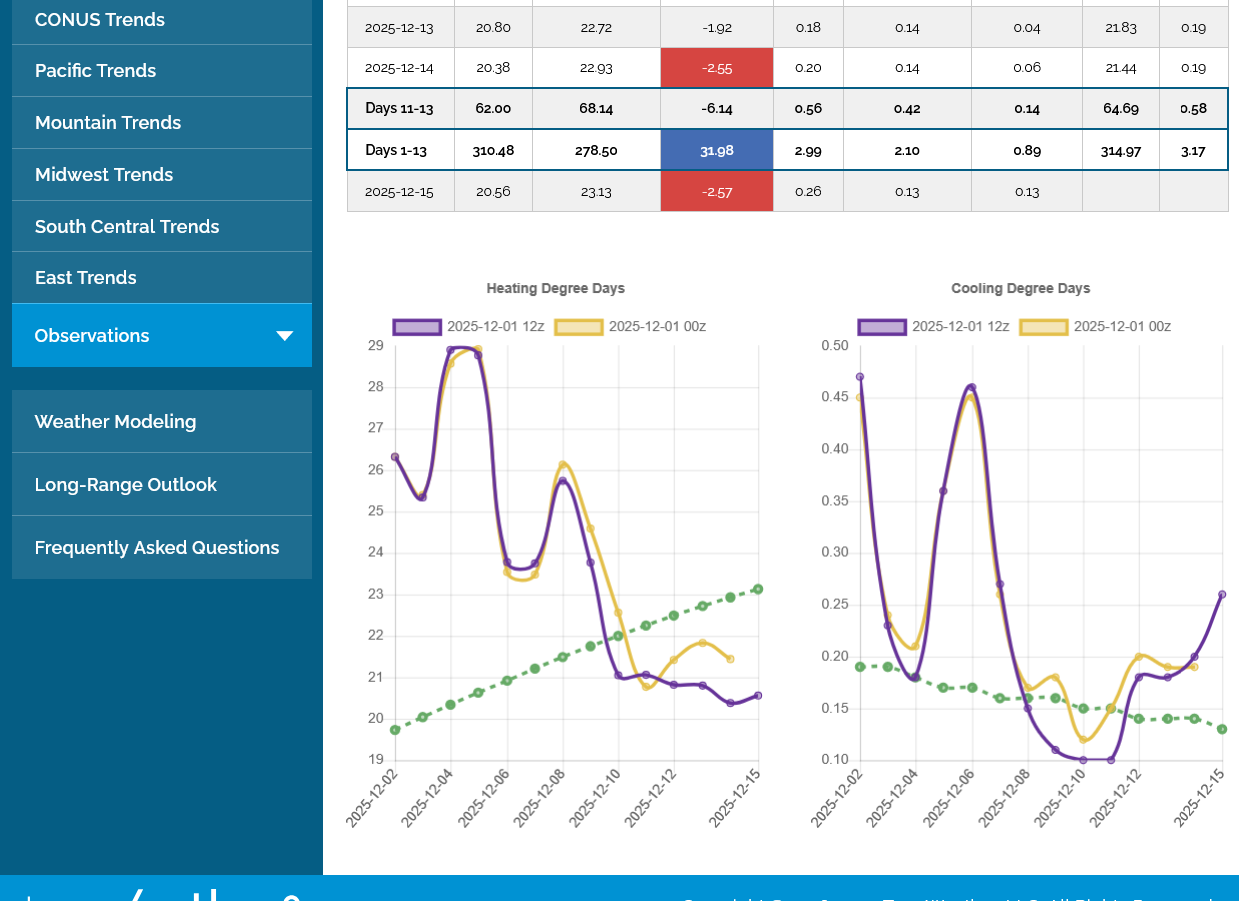
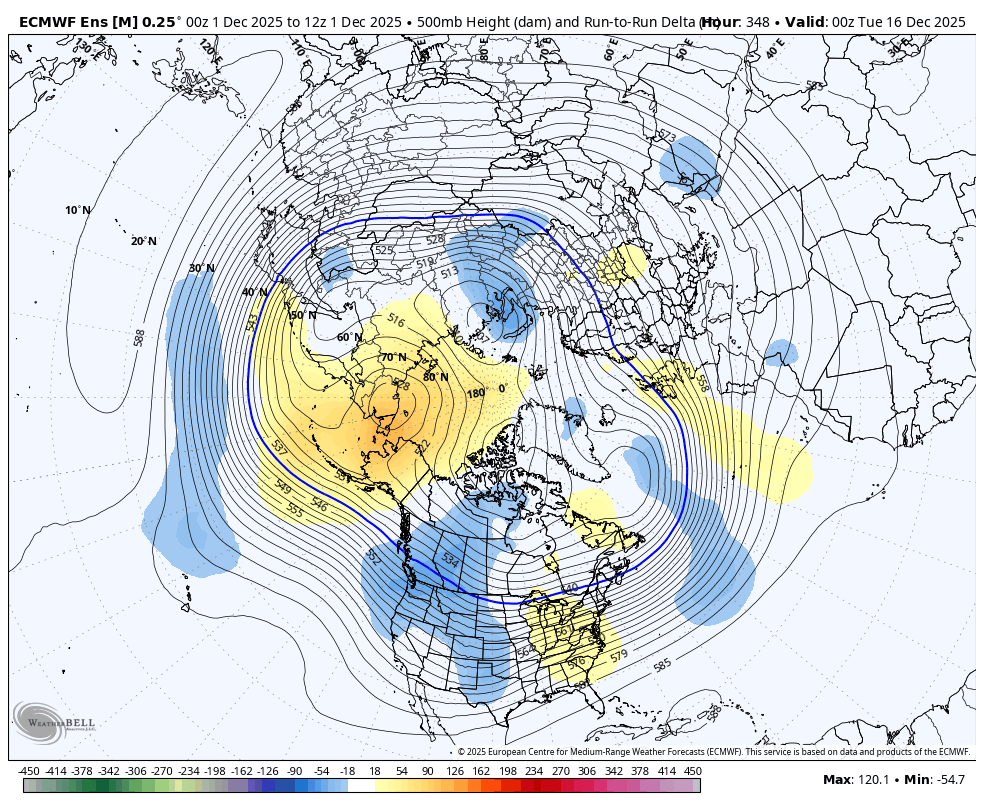
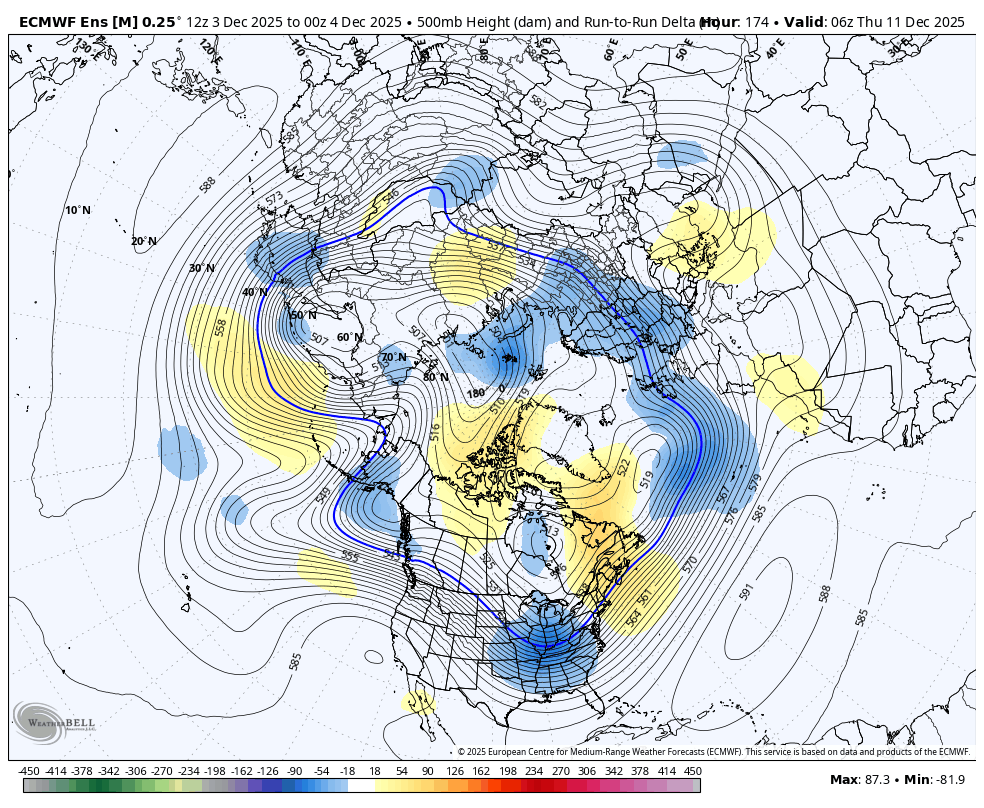
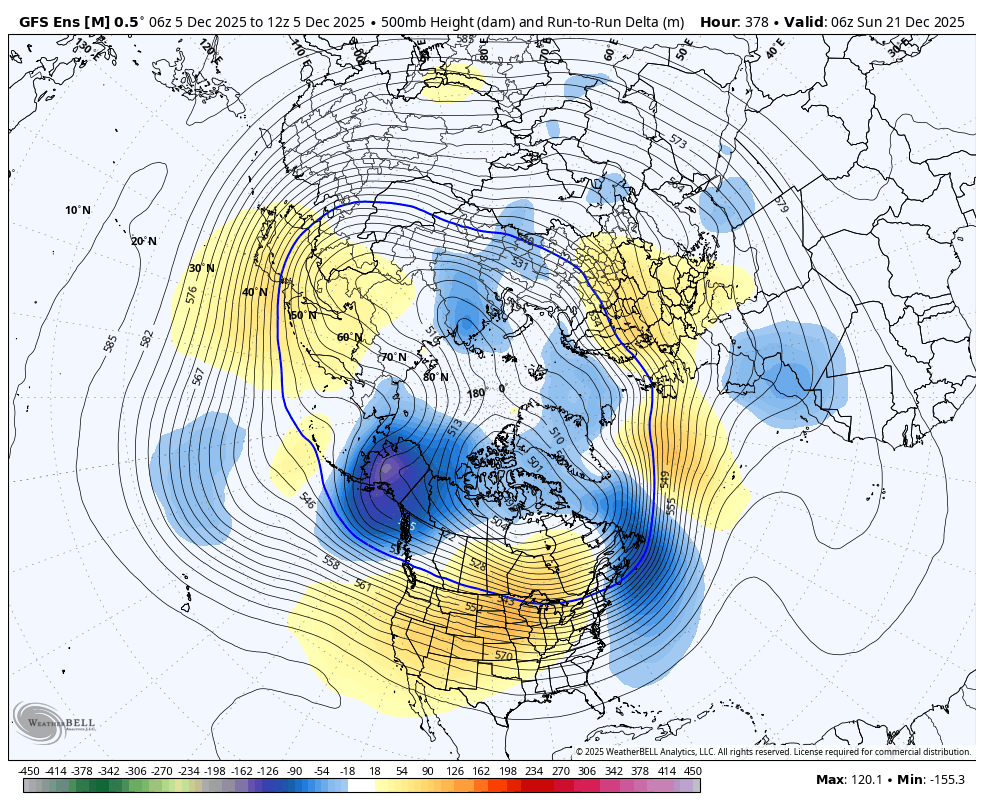
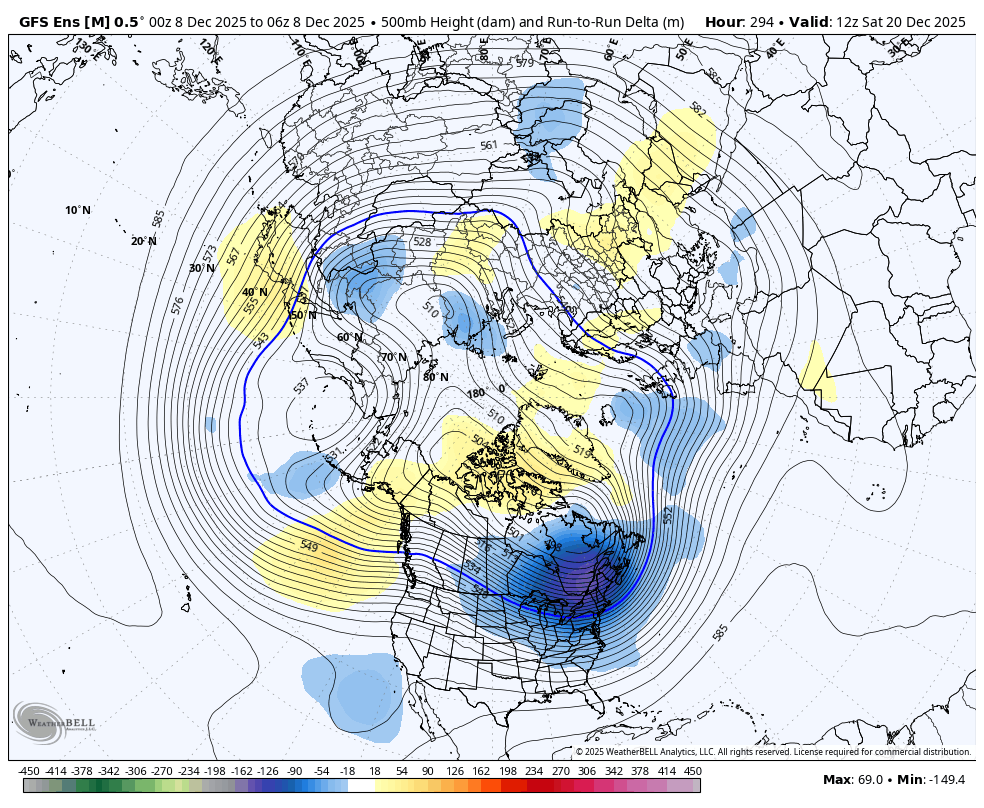
Here was the last map from the EE model that you referred to of the upper level heights with colorized changes from the previous run.
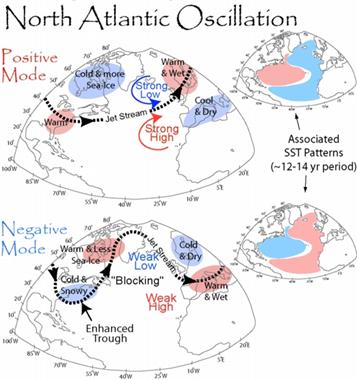
The foundation of this cold pattern has been the upper level high around Alaska and upper level low downstream in Central Canada with a trough dipping into the US. This couplet is ideal for transporting cold air from high latitudes to the mid latitudes.
Even though this is 2 weeks out, and the most likely to change its also our biggest clue about..........WHAT's COMING NEXT, which is week 3 weather.
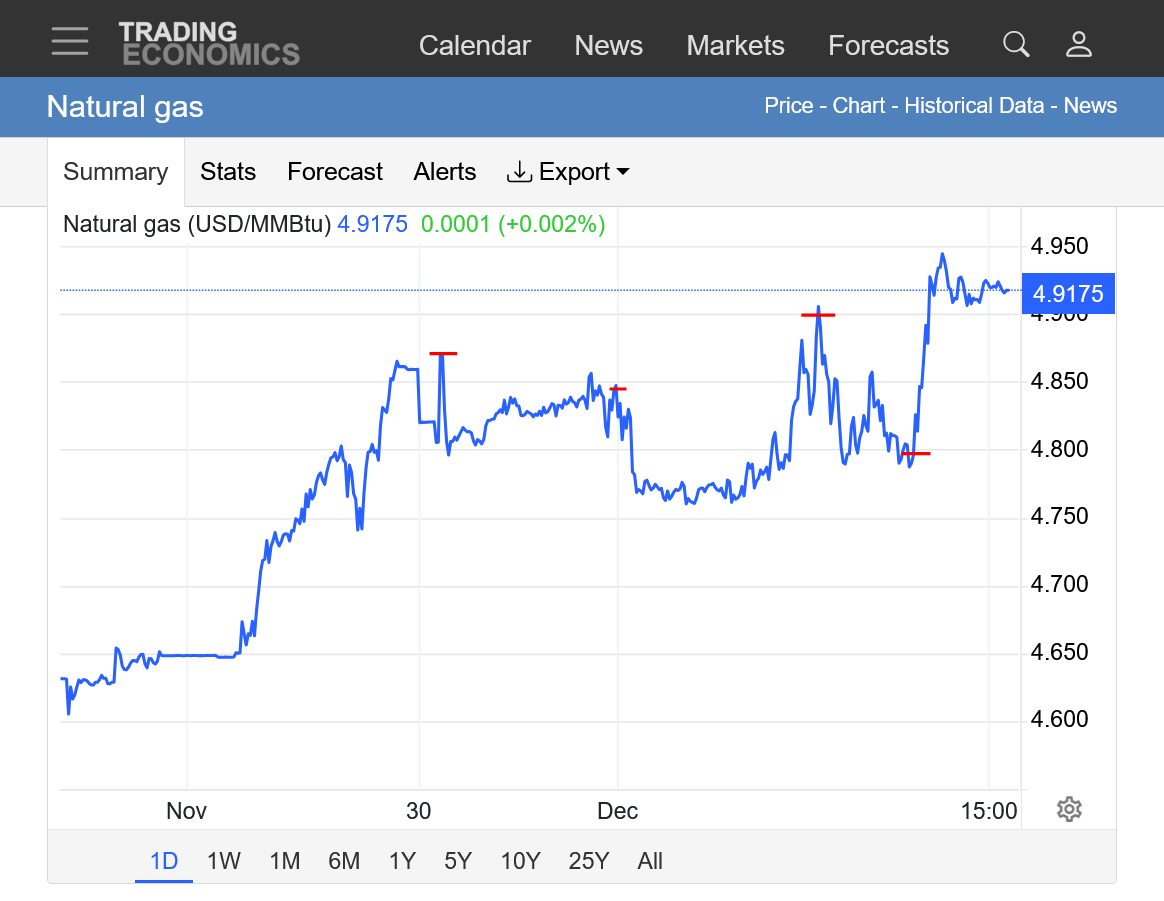
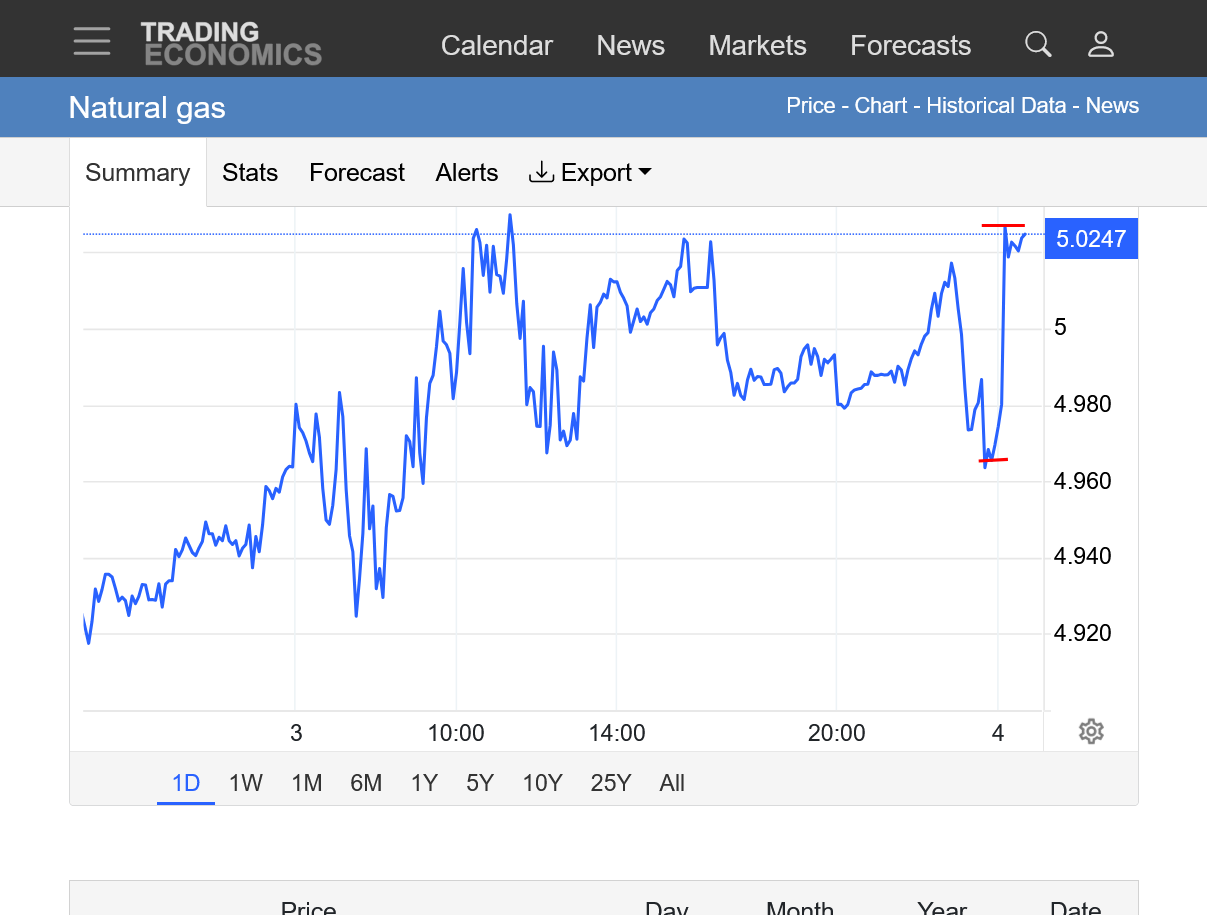
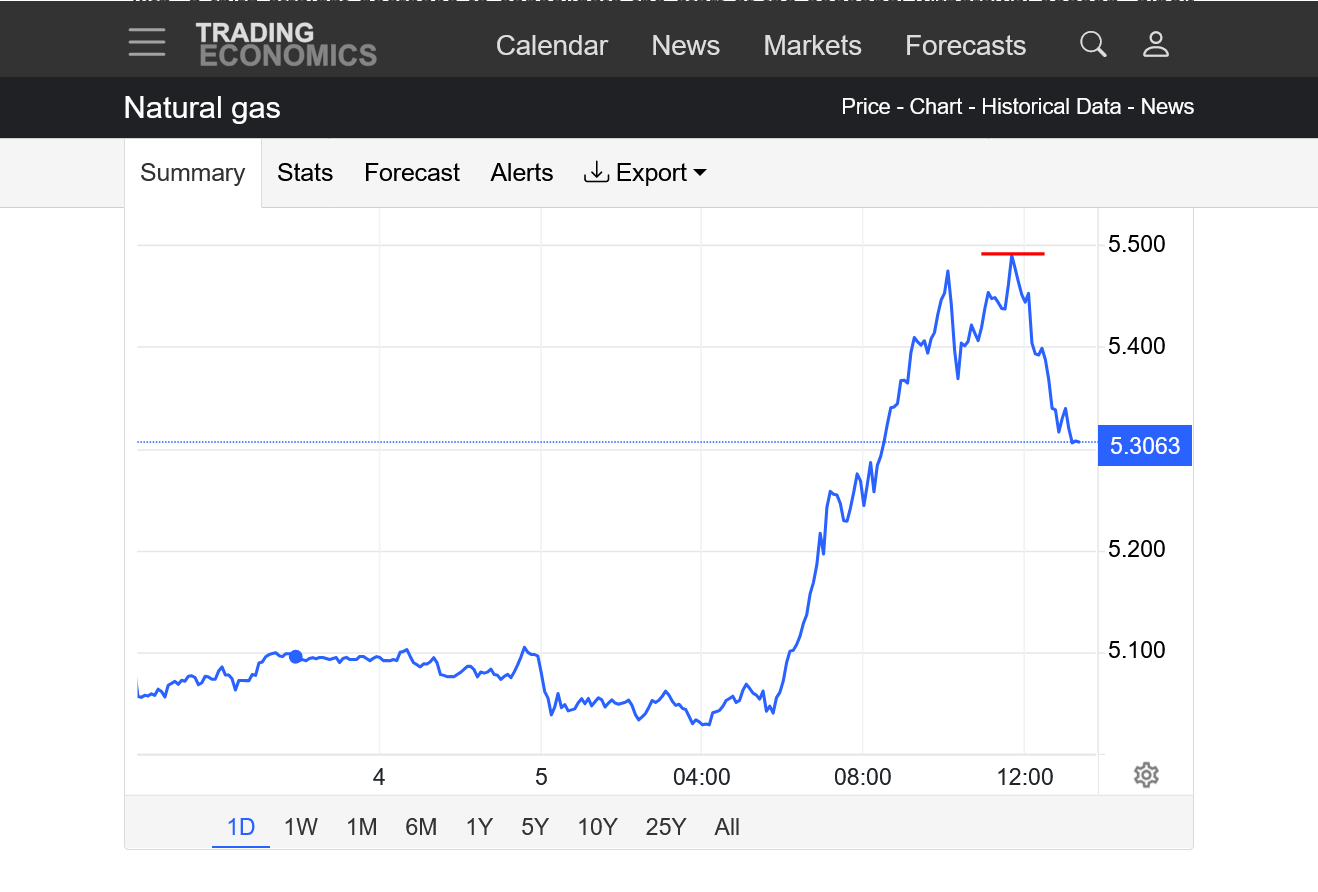
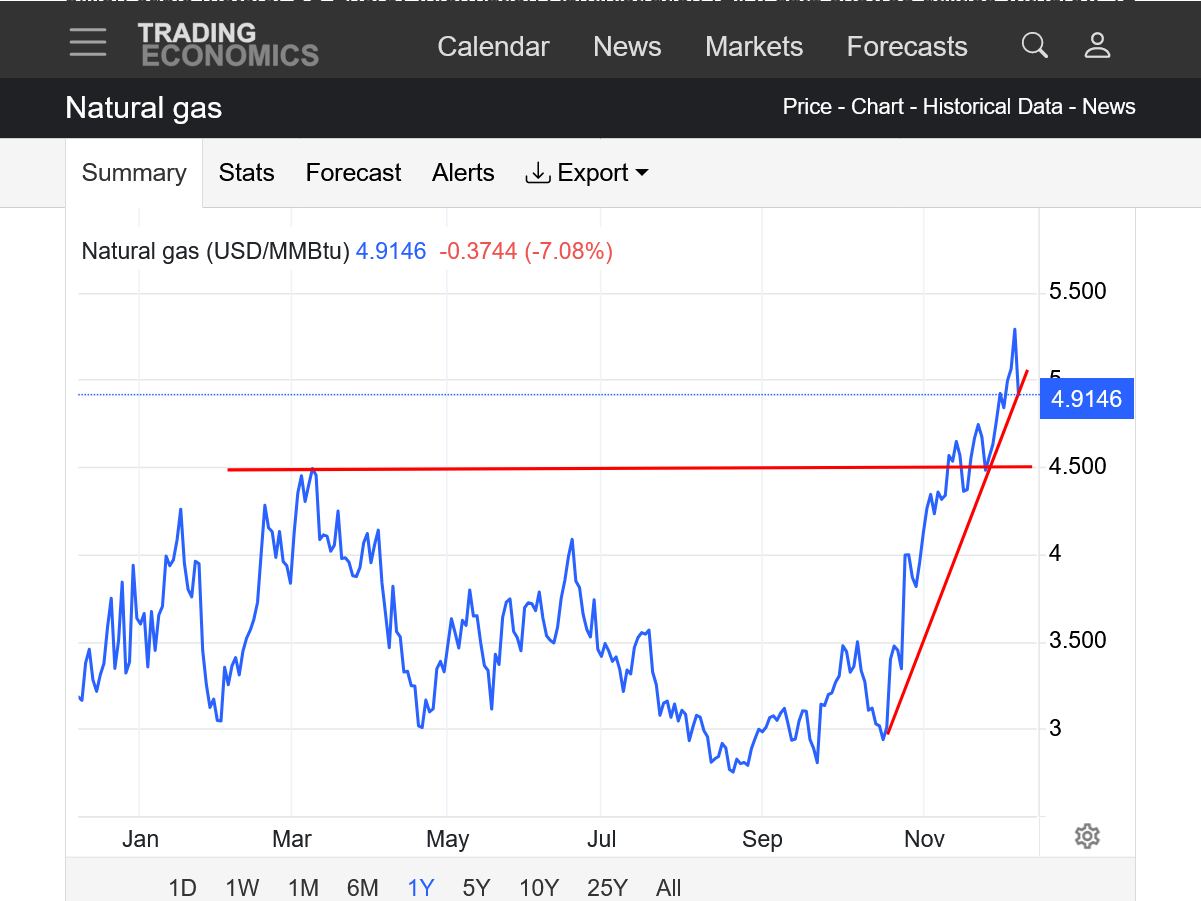
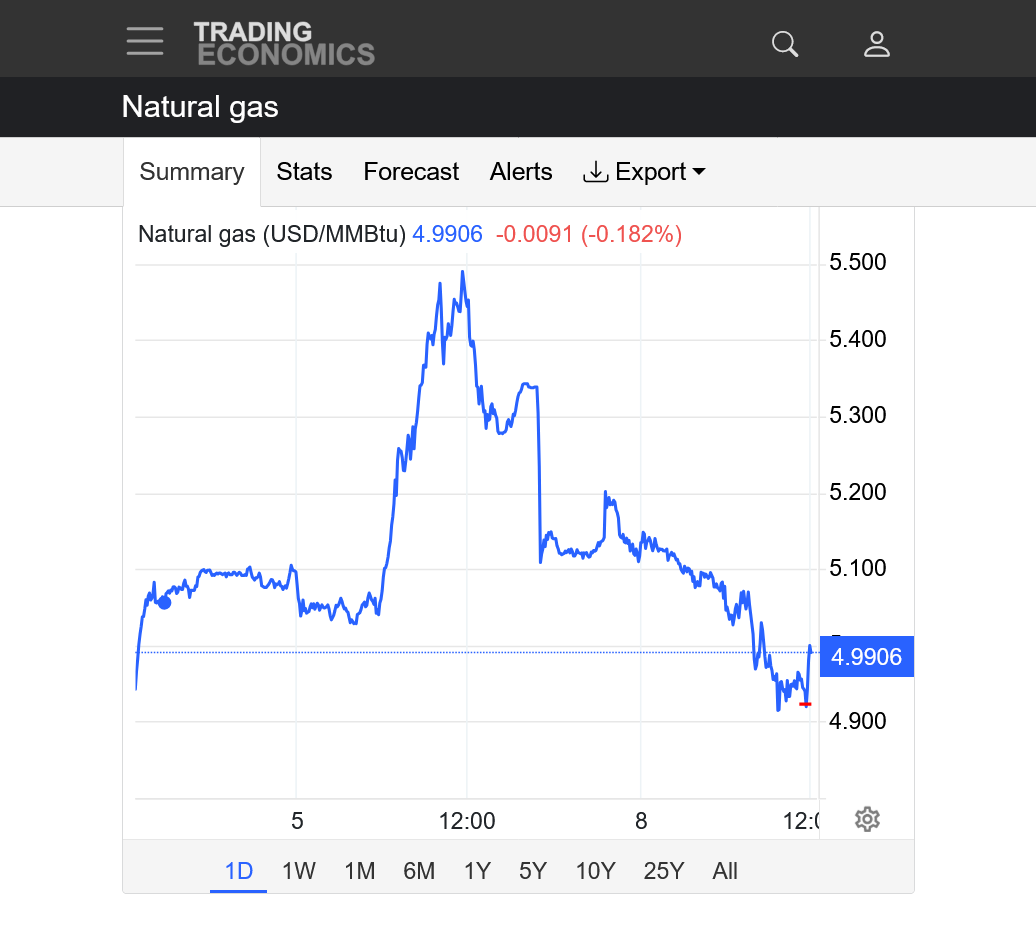
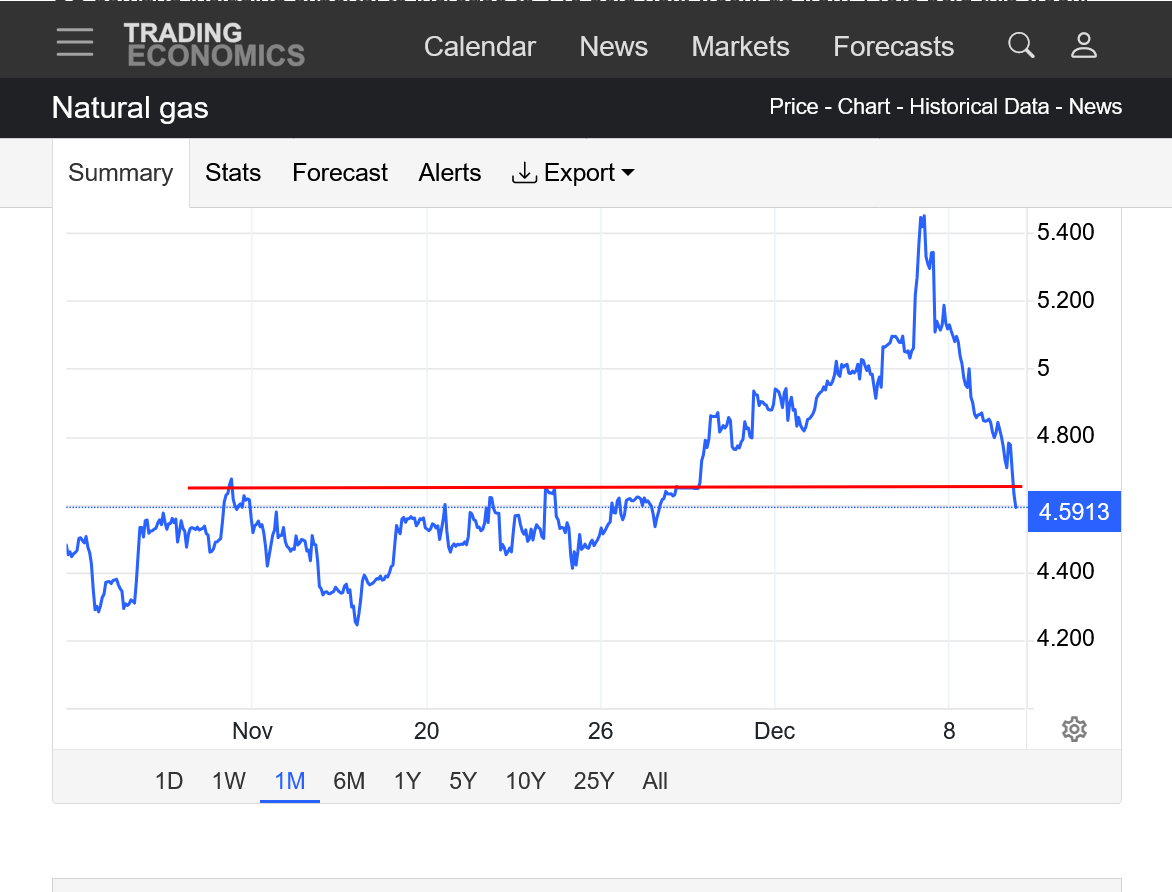
Here's the latest prices charts:
https://tradingeconomics.com/commodity/natural-gas
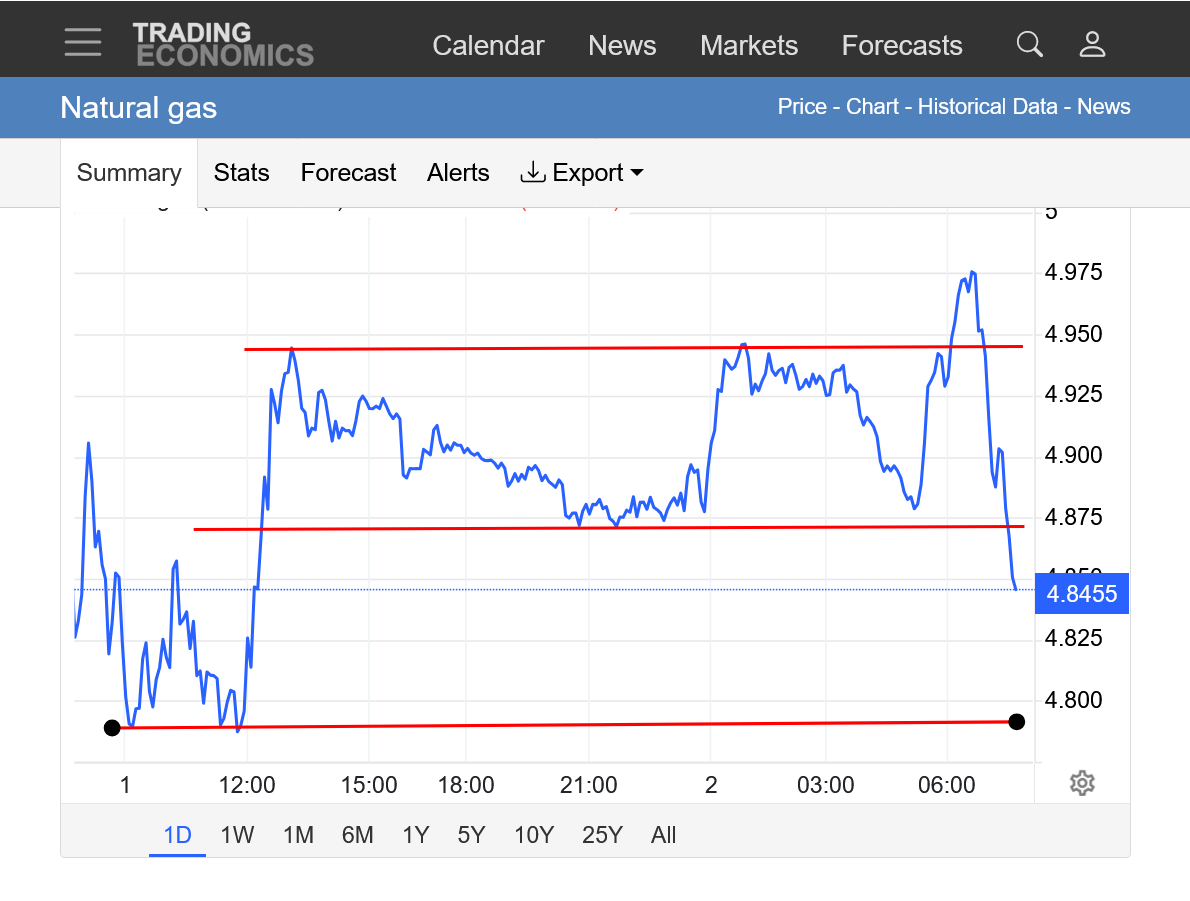
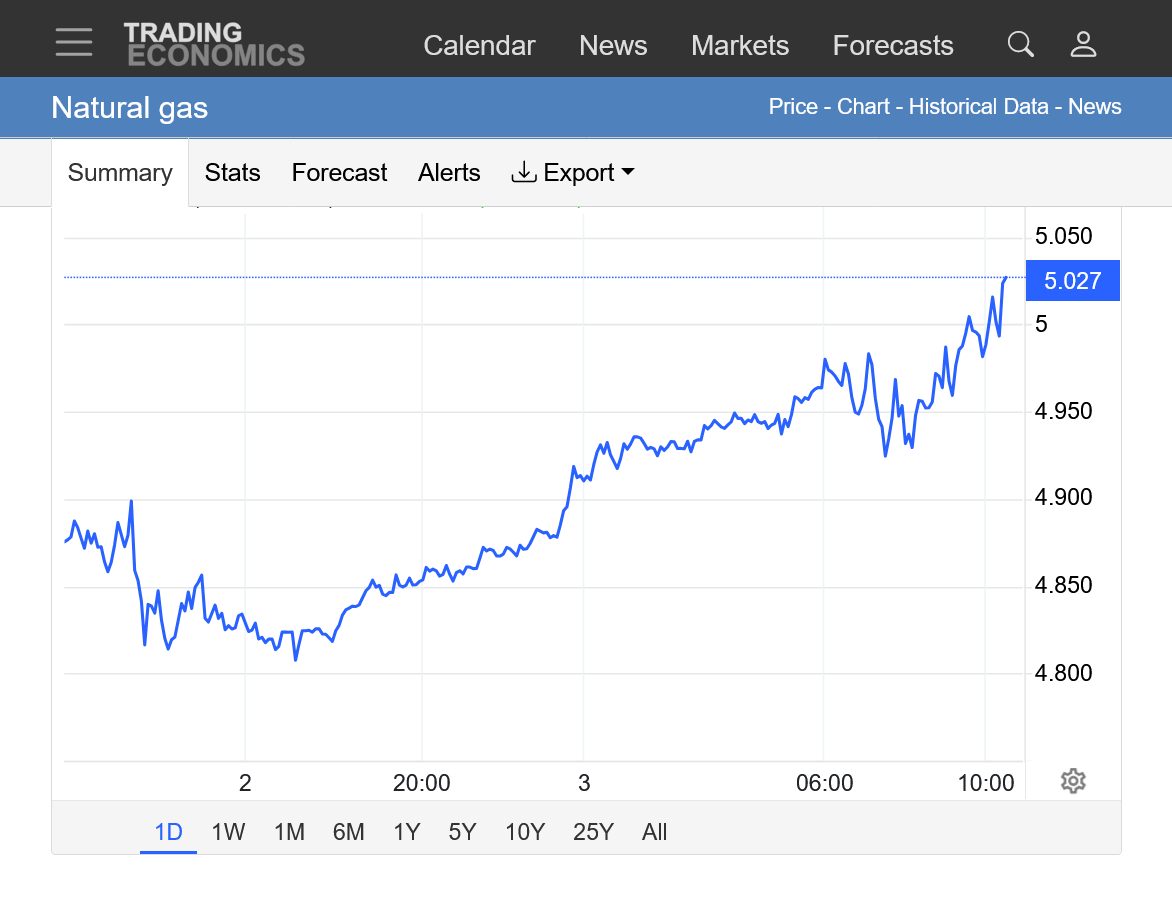
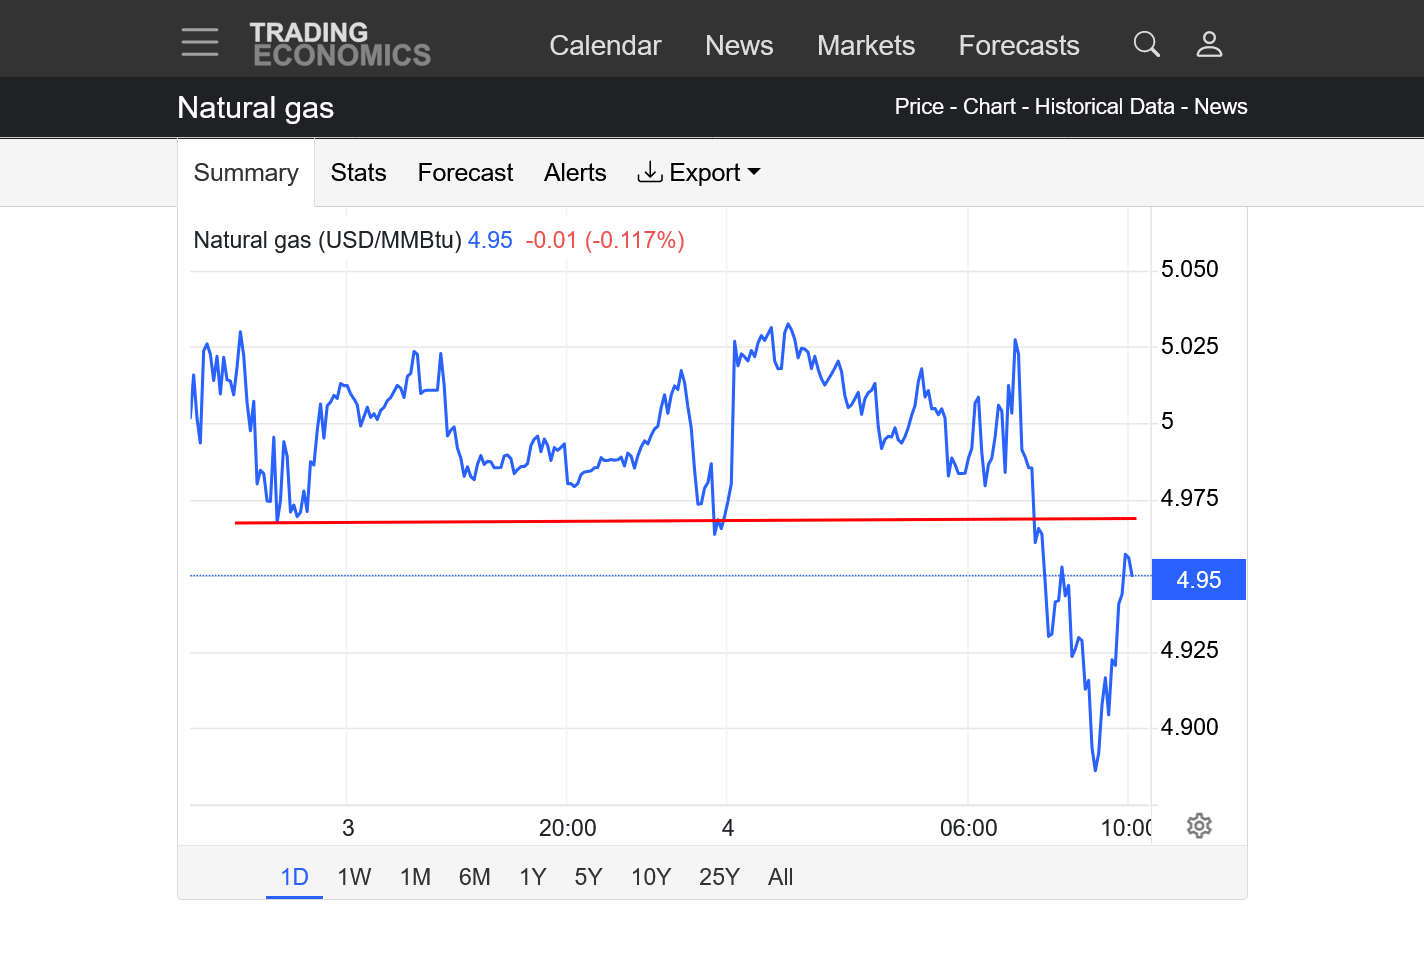
1. 1 day: Red lines are significant times . a)Last nights open. b)midnight c)8am d)Noon. Note the big spike up at Noon, despite the bearish HDDs......explanation above.
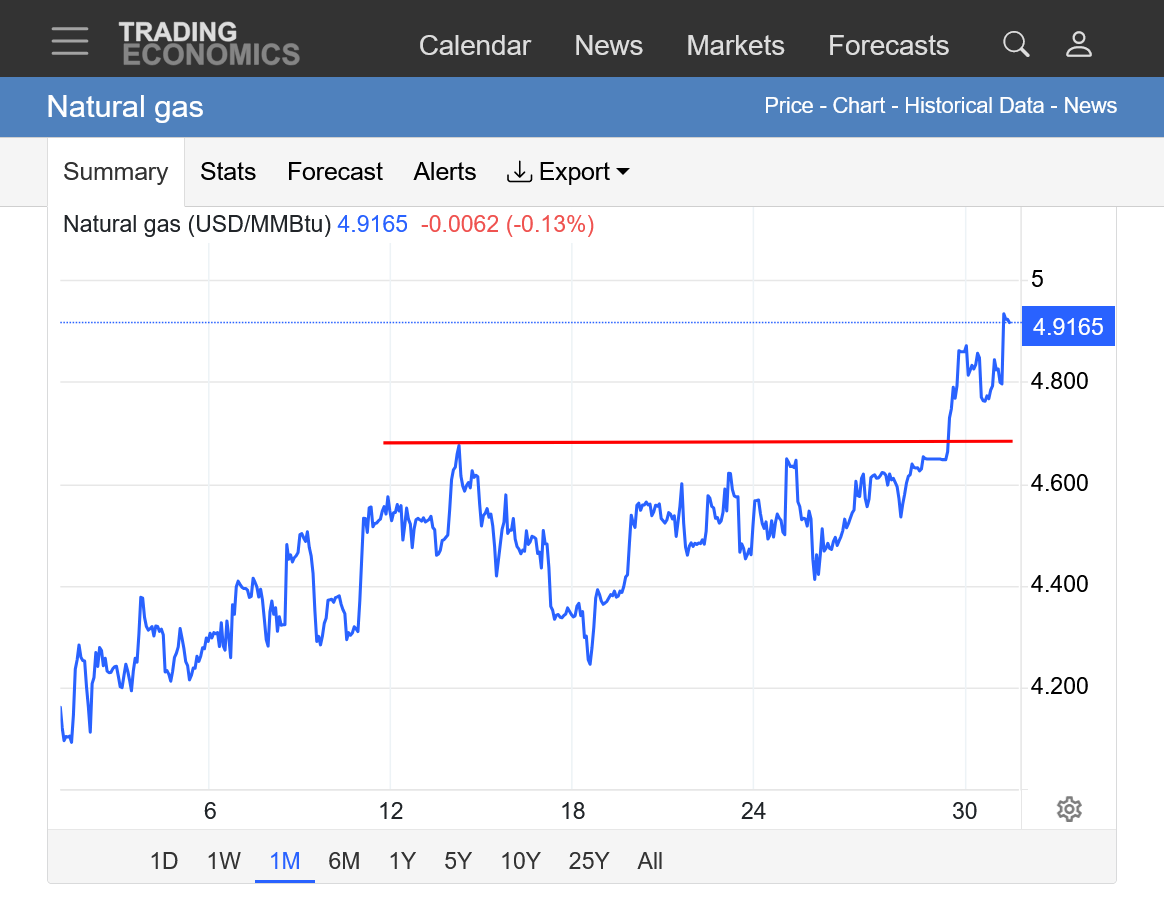
2. 1 month: Upside breakout!
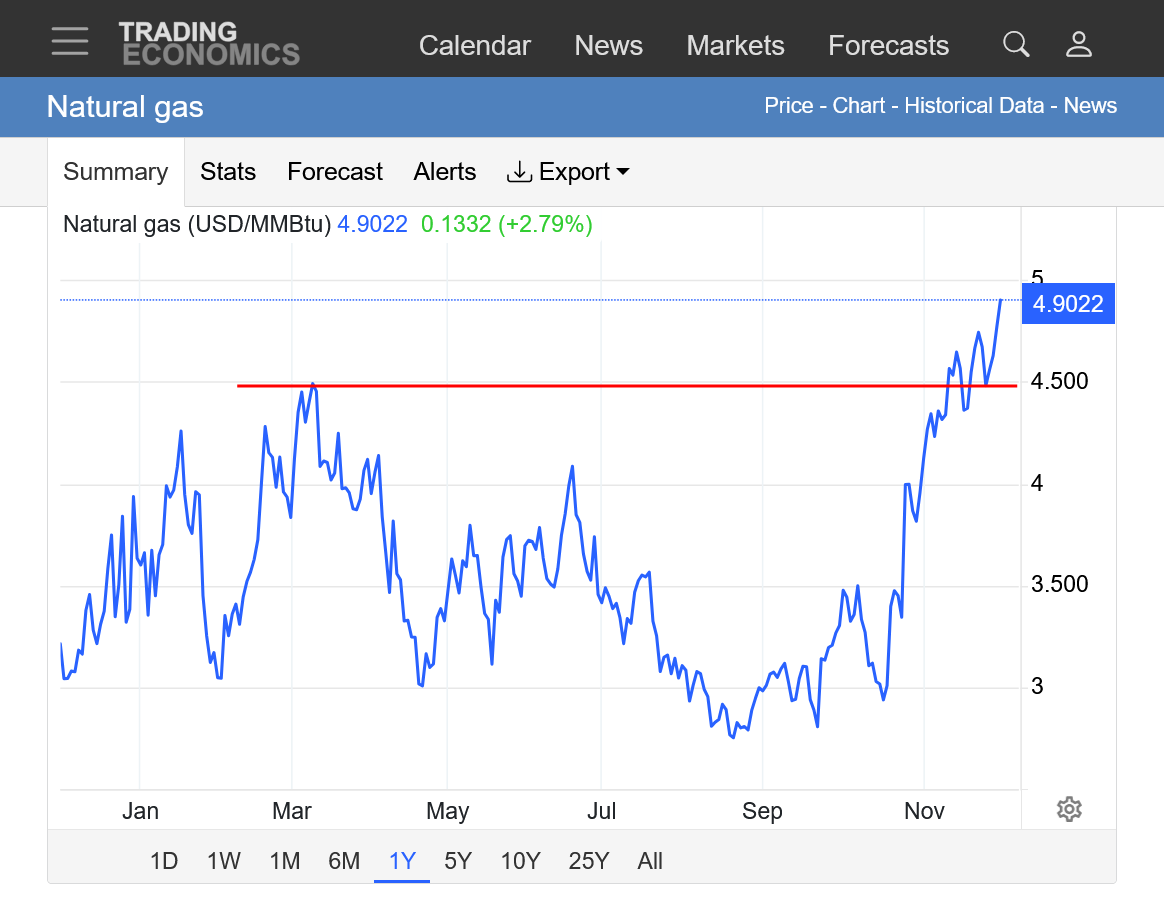
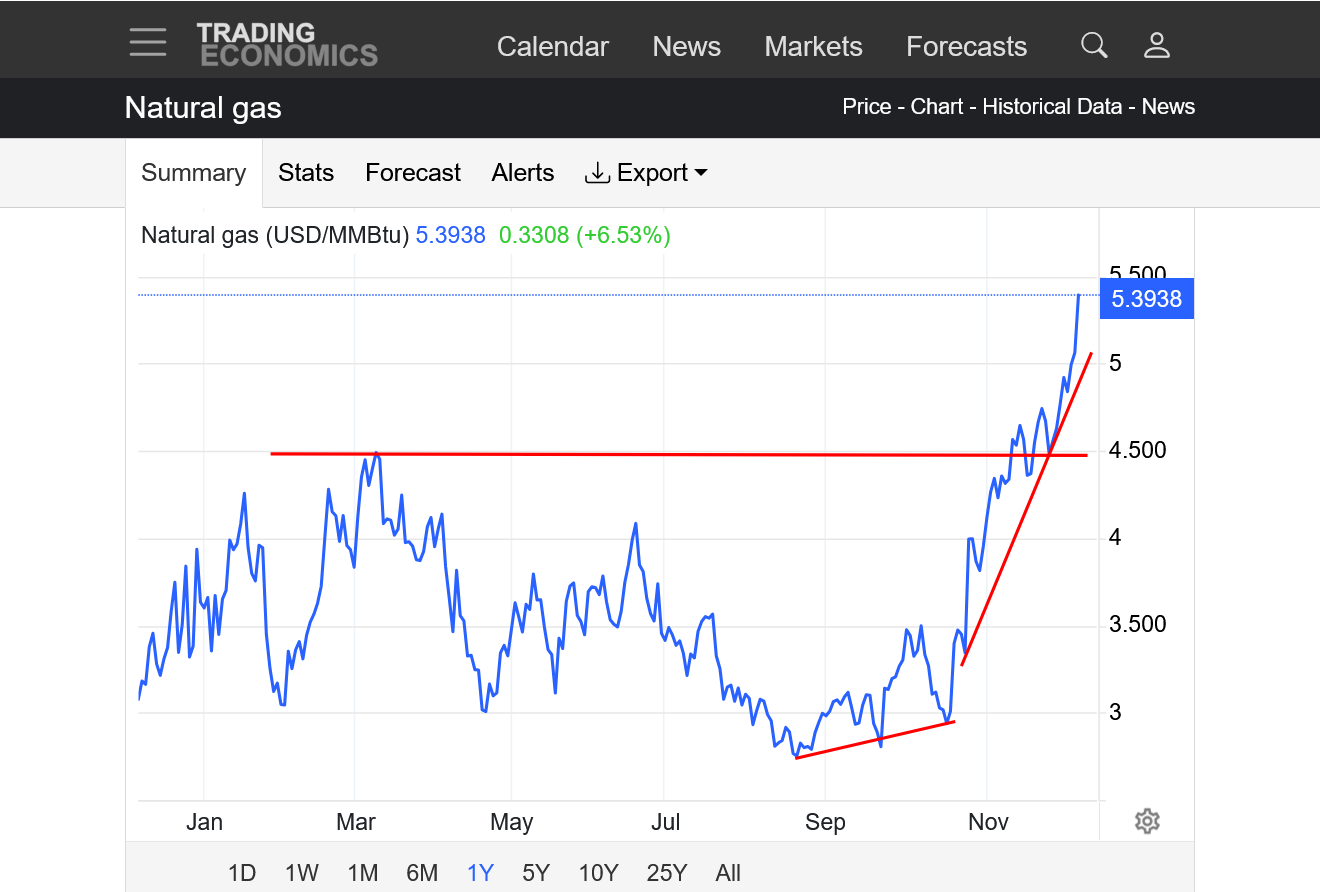
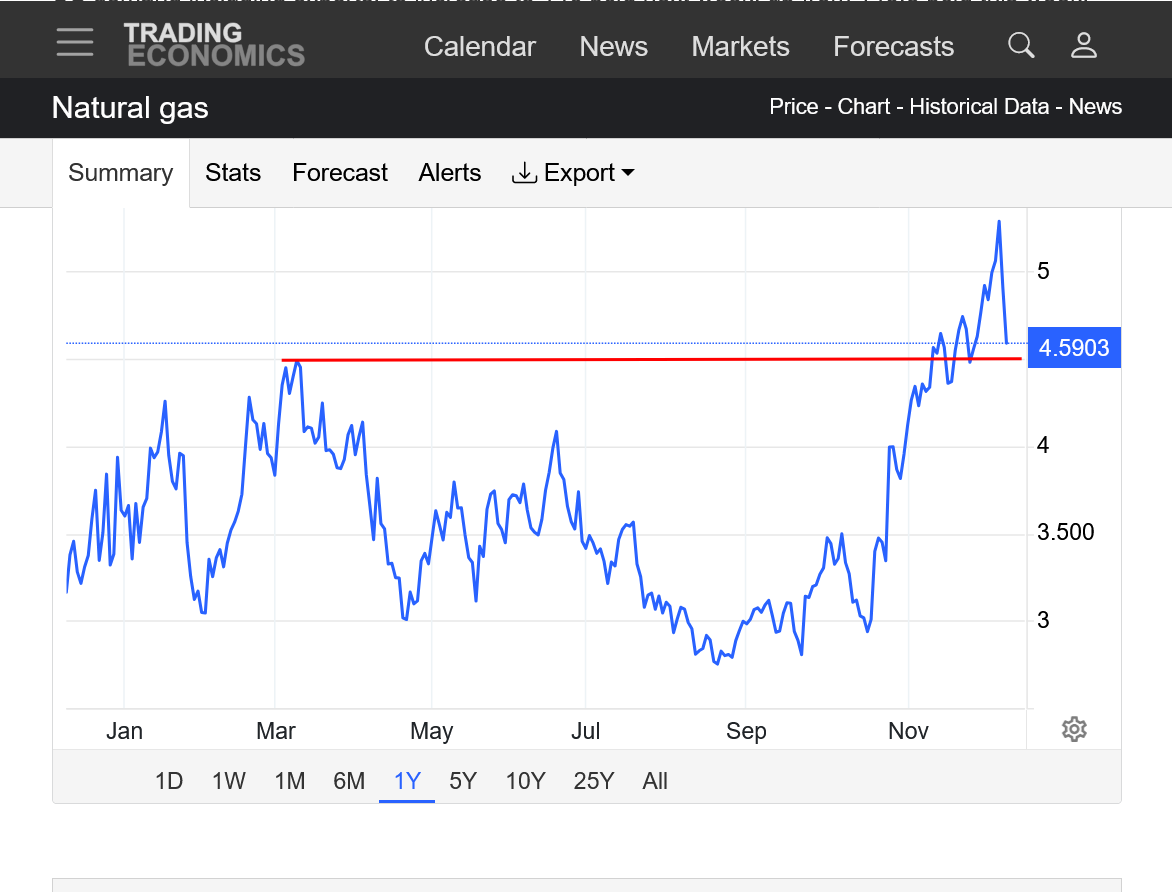
3. 1 year: Upside break out! Well above the March 2025 highs caused by last Winters cold pattern that caused numerous large weekly drawdowns to storage.
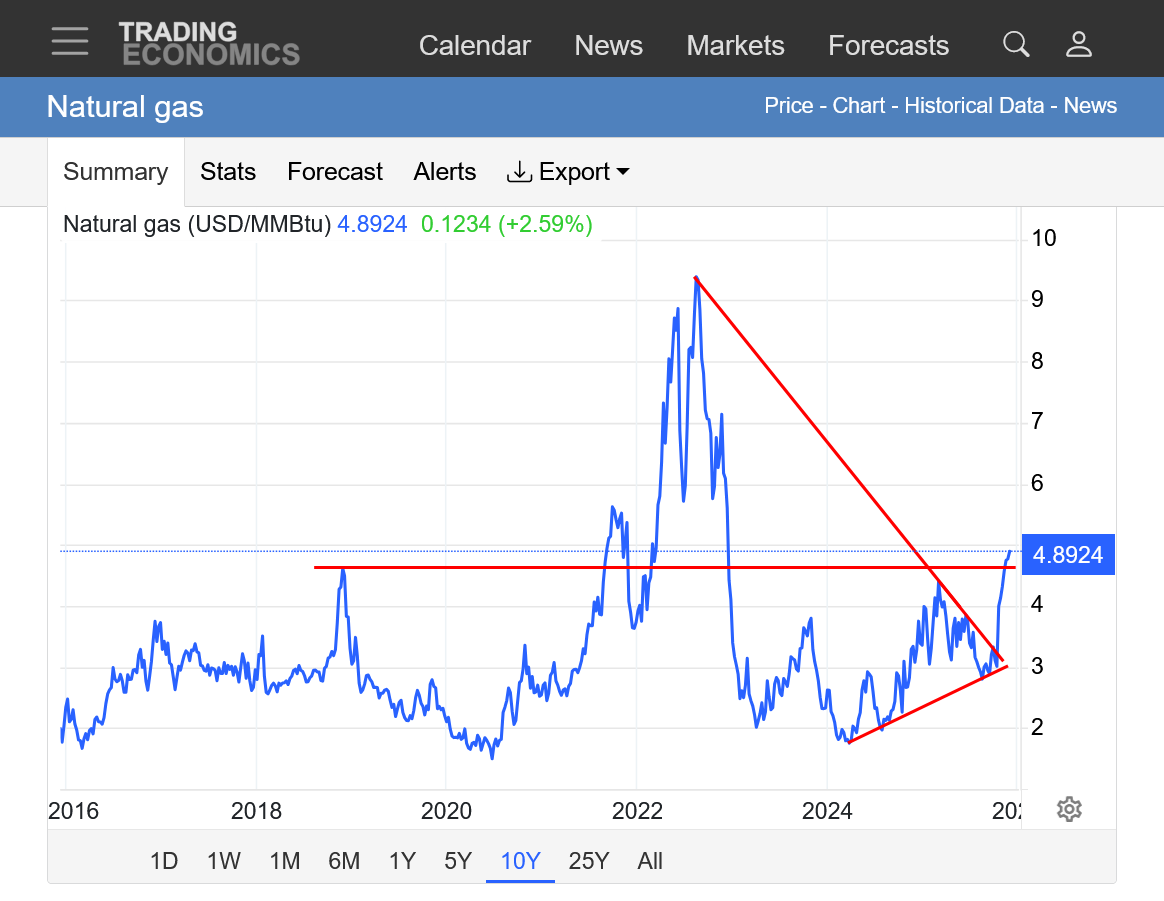
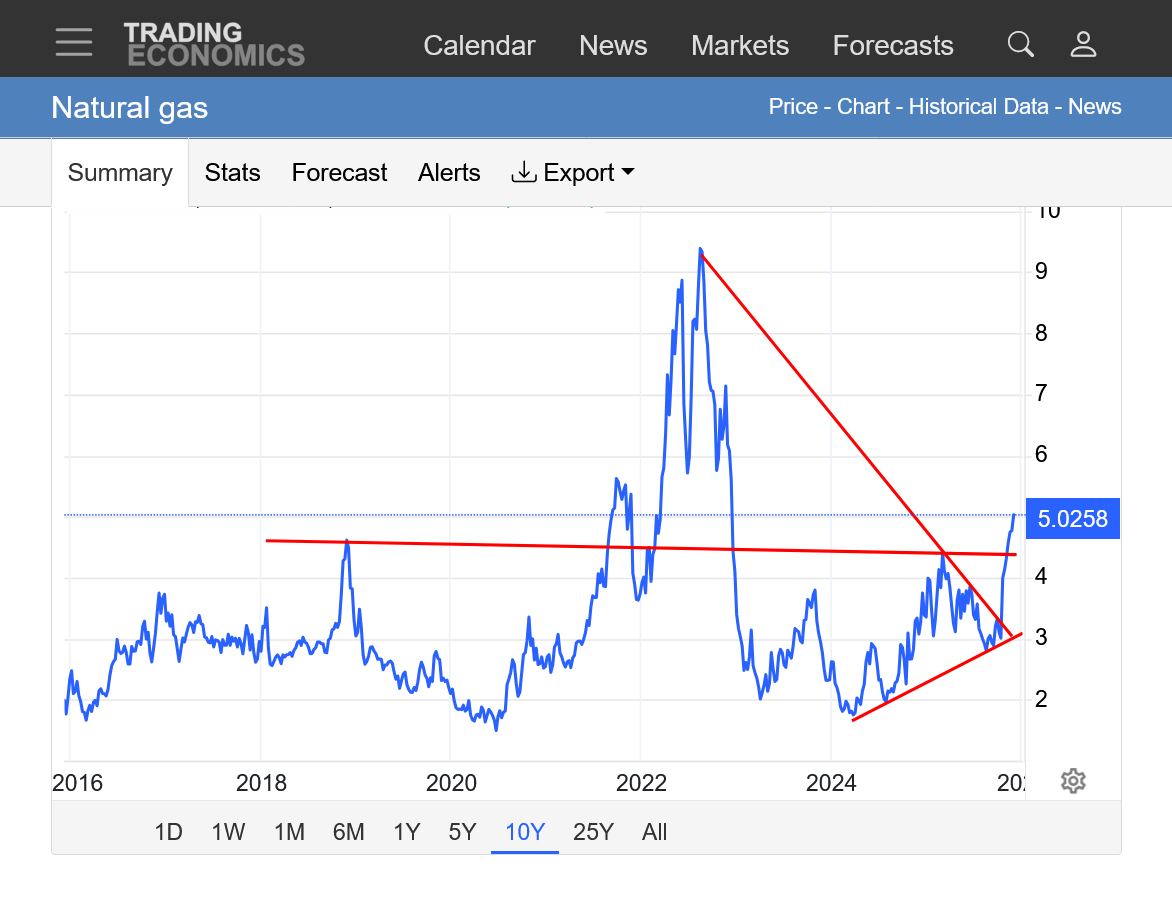
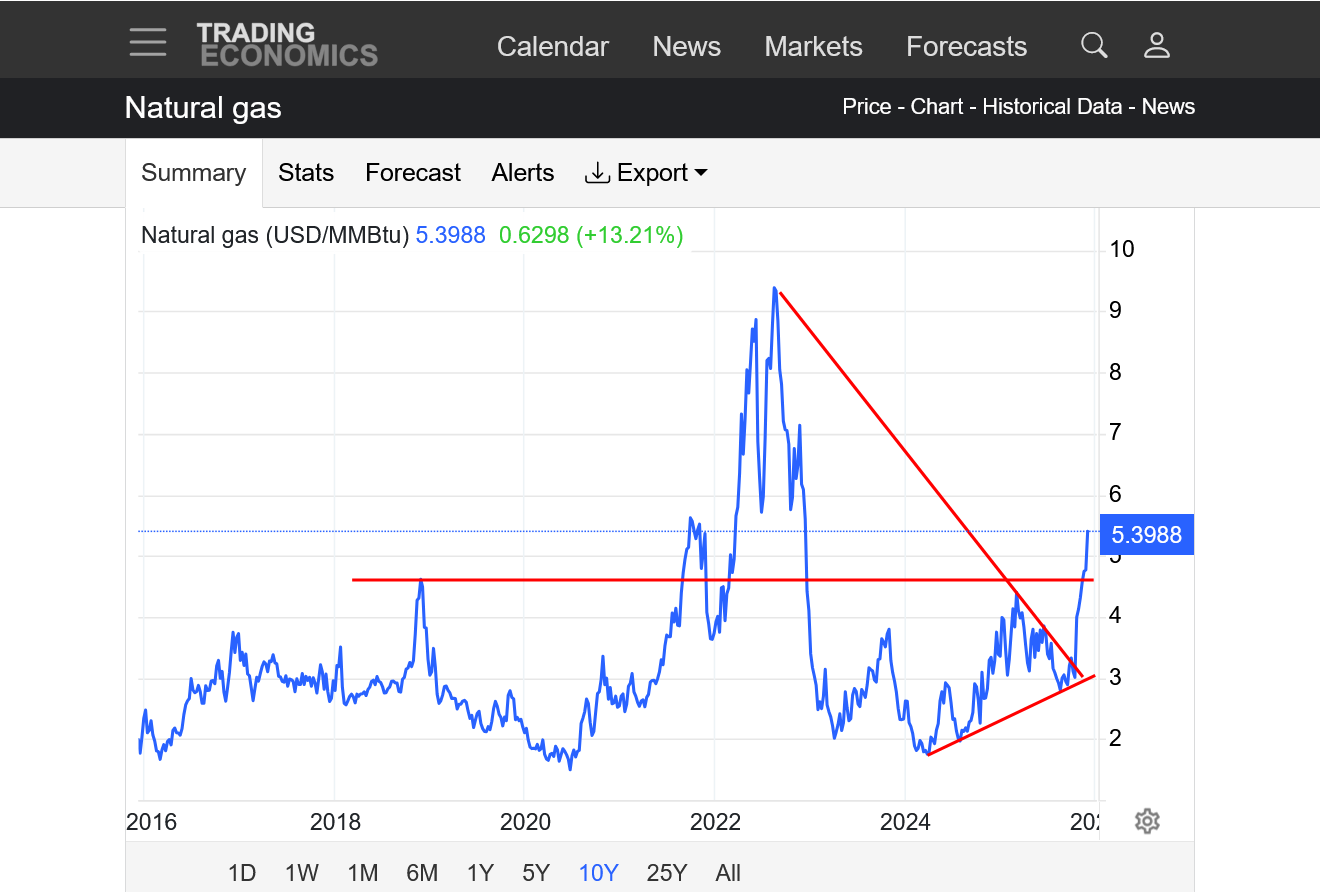
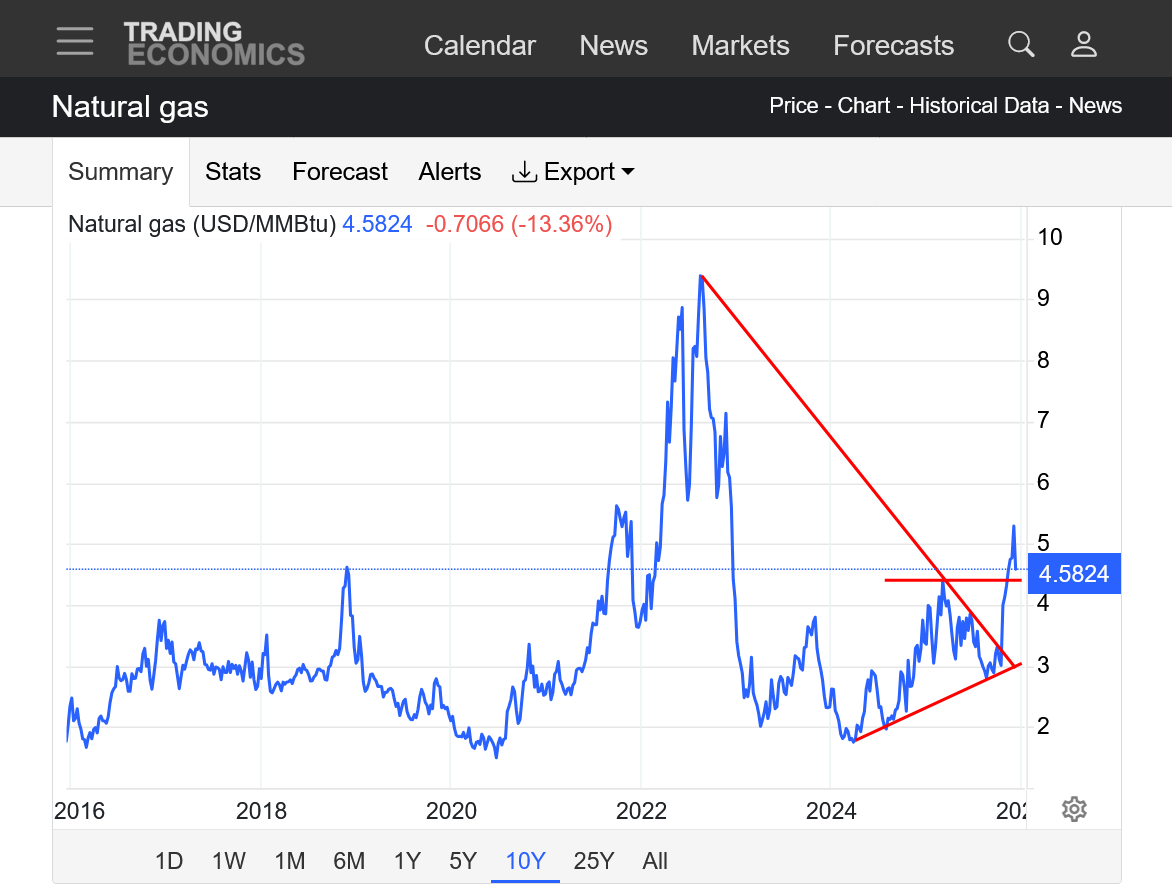
4. 10 years: Upside break out above long term resistance. Earlier upside break out from a symmetrical wedge(higher lows and lower highs).
The next EIA natural gas weekly storage report should be BEARISH compared to the seasonal average because of the widespread mild weather across the country. This reduced the residential heating demand. Natural gas is used for much of this and natural gas is also burned to generate electricity(for Summer AC cooling too).
This report comes out at 9:30am on Thursday.
Larry,
Do you know what early estimates are?
We might have an unusual, very small injection instead of a typical withdrawal??
https://www.cpc.ncep.noaa.gov/products/tanal/temp_analyses.php
Mike,
NGI indicator is -18. Don’t forget that this is for the EIA week including Thanksgiving as well as the Mon-Wed prior, when many are off work. Thus, similarly to other major holiday weeks. the EIA typically ends up 20++ more bearish than that which would be indicated for non-holiday weeks. So, despite the -18 NGI indicator, a small injection wouldn’t be a shock.
Yes, excellent point, Larry.
This is also why I'm thinking its possible for a tiny injection. If it does end up a drawdown, it will be unseasonably small.
just a question
Wouldn't the same Thanksgiving slowdown from less work-related use have happened the previous years, making that a non-factor?
cutworm,
I think that Larry was comparing it to NON holiday weeks not previous Thanksgivings.
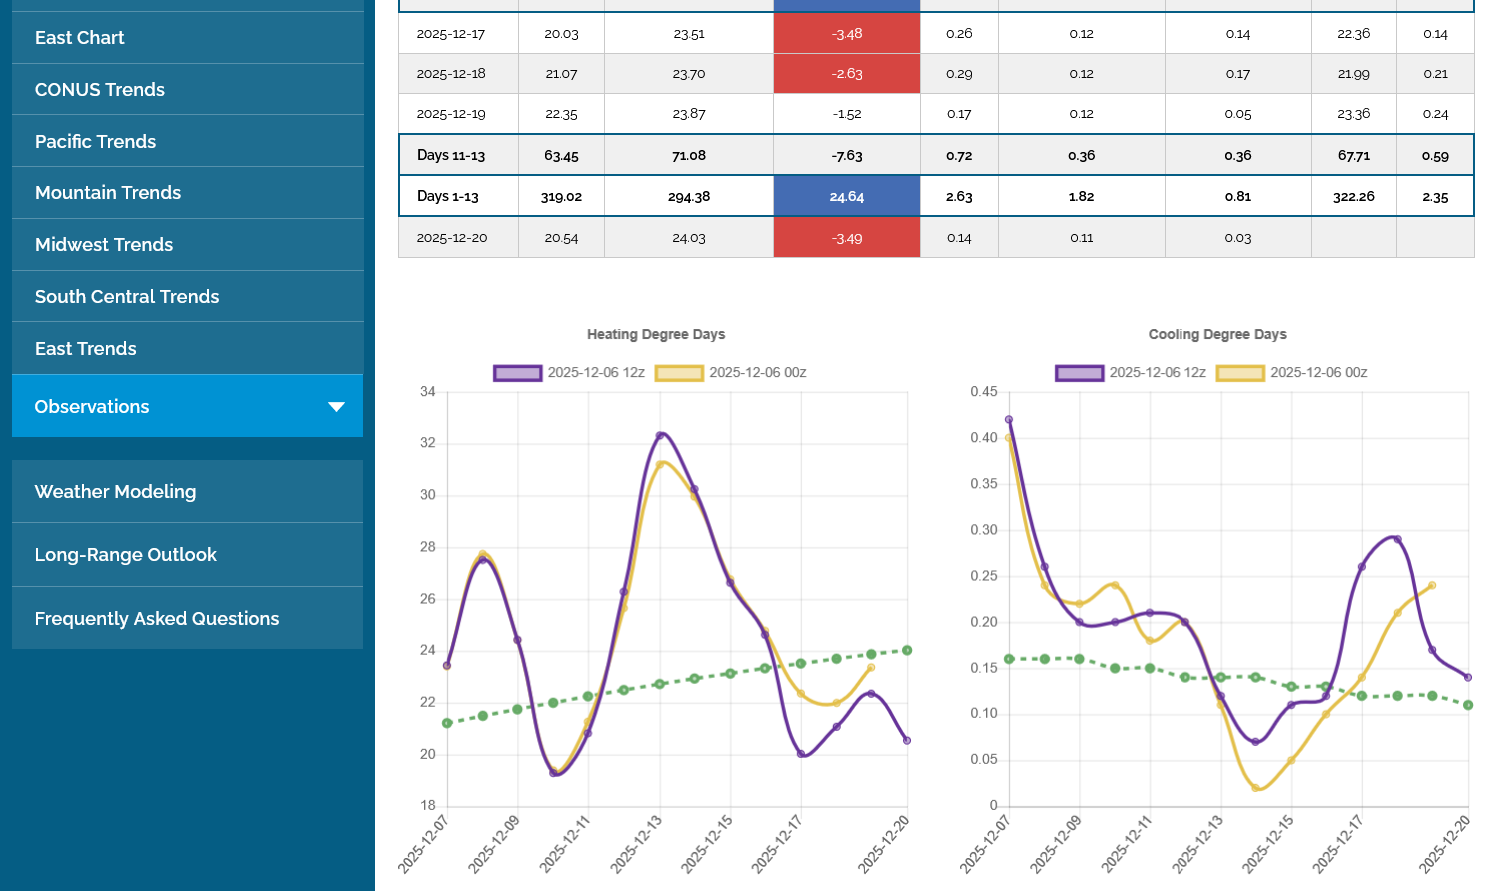
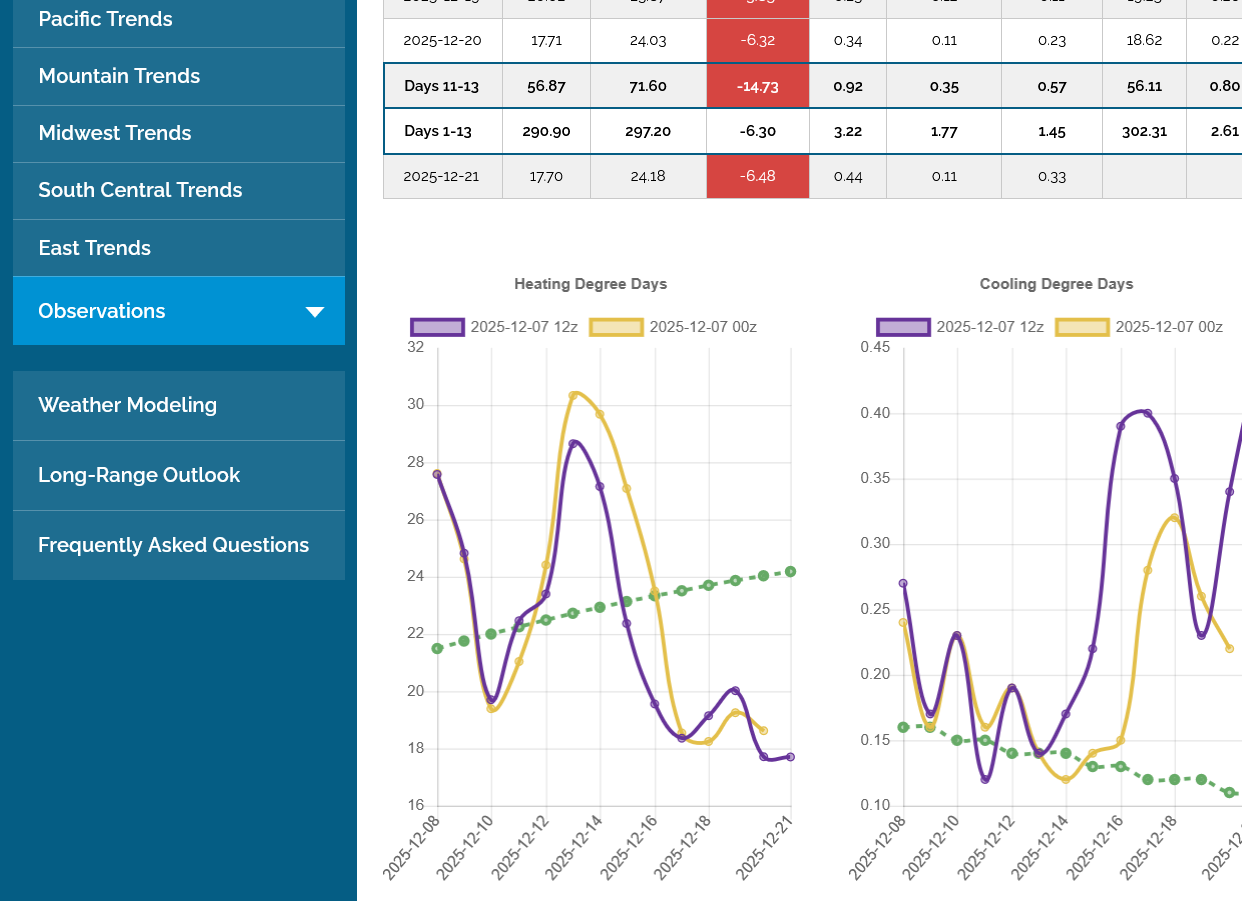
As has been the trend in recent weeks, the models got colder overnight.
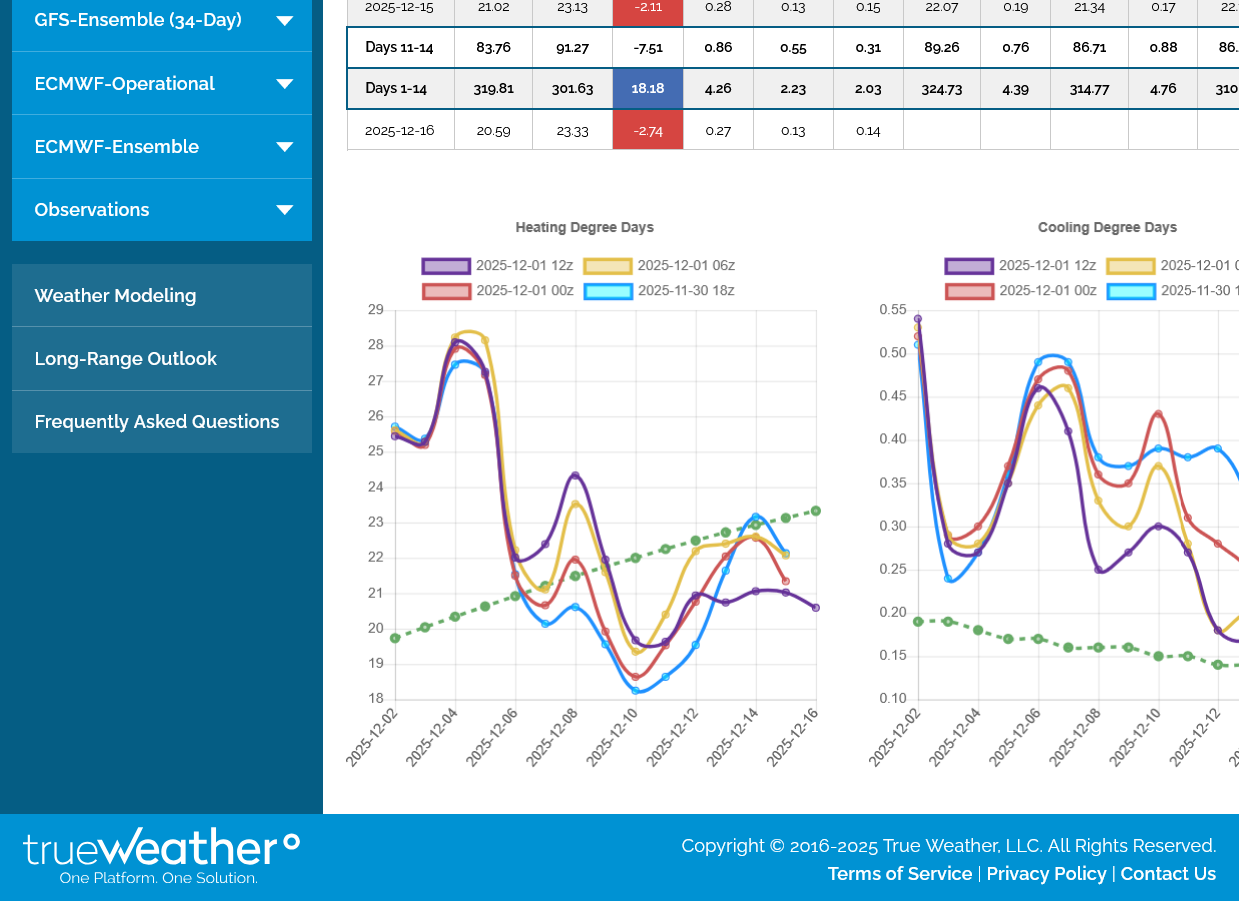
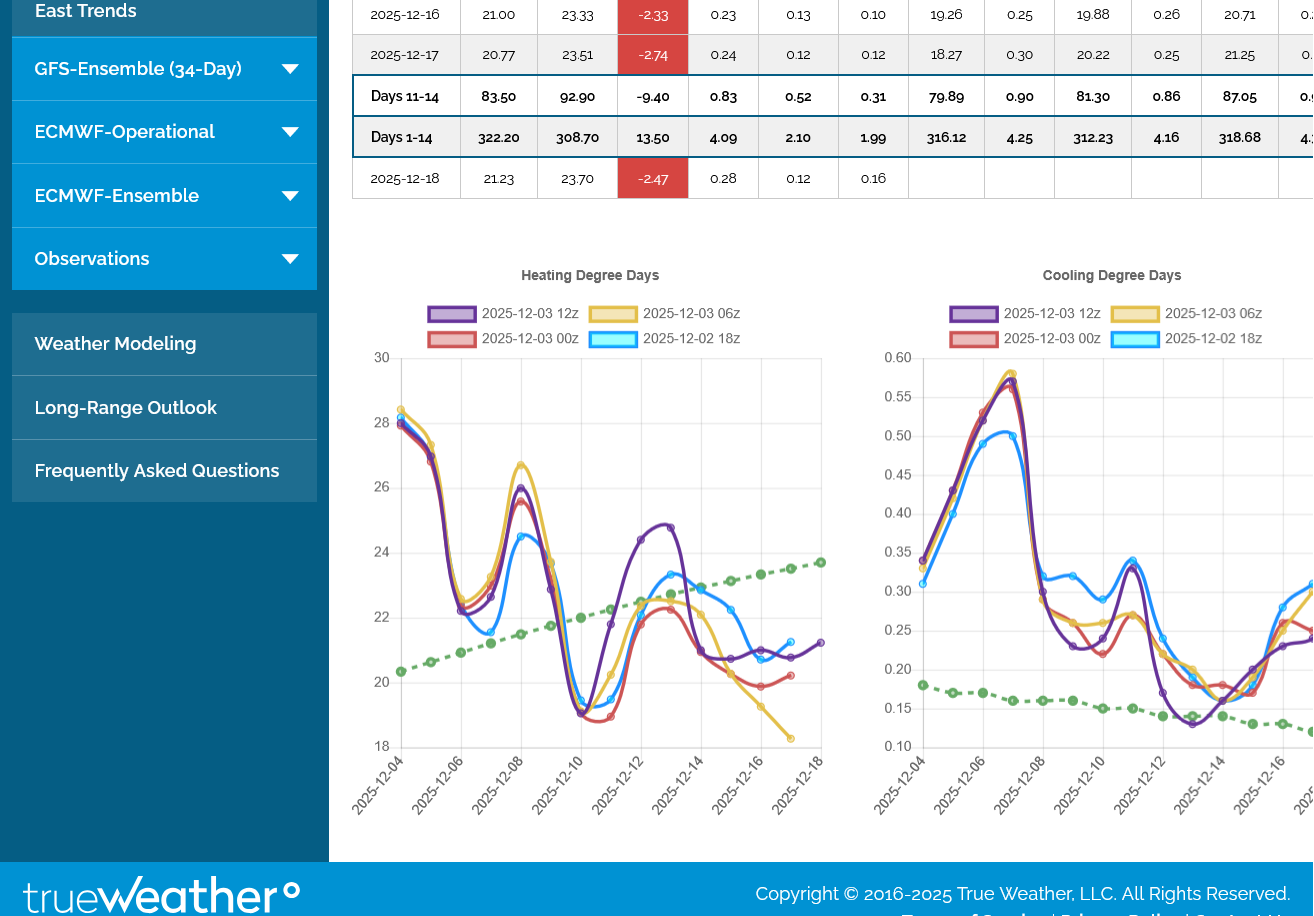
This last 0z European Ensemble run was +7 HDDS. This was all from colder individual days with the same pattern and same trajectory (down) below in purple on the left.
 ++++++++++++++++++
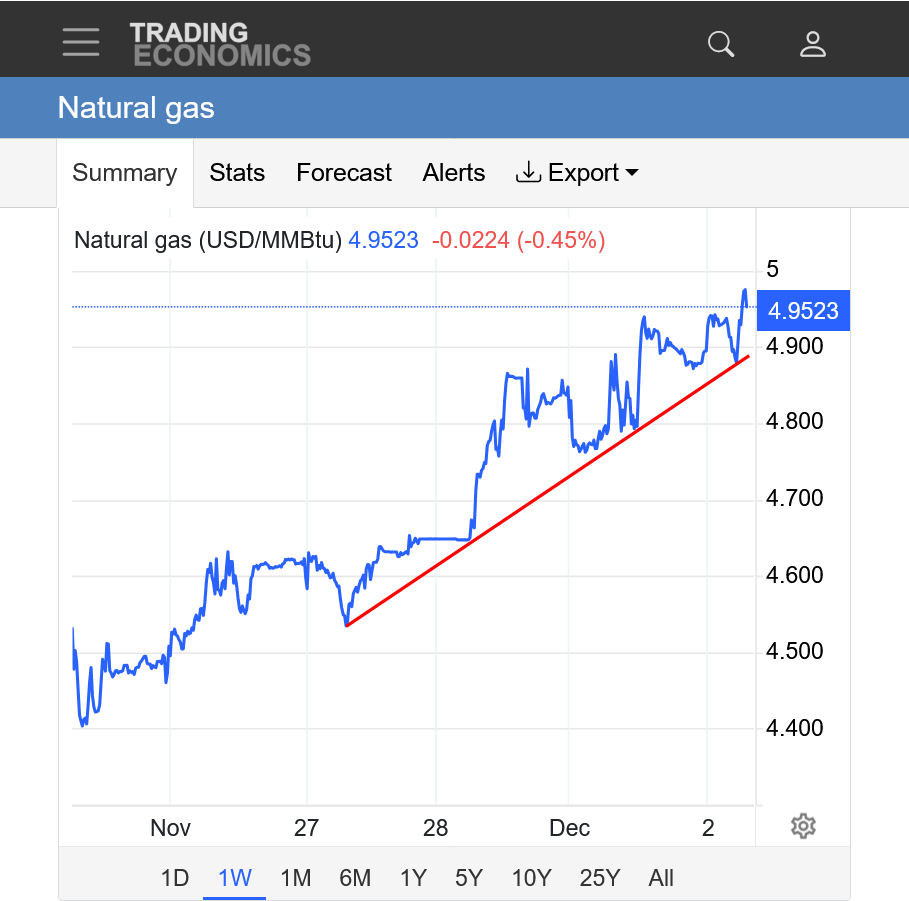
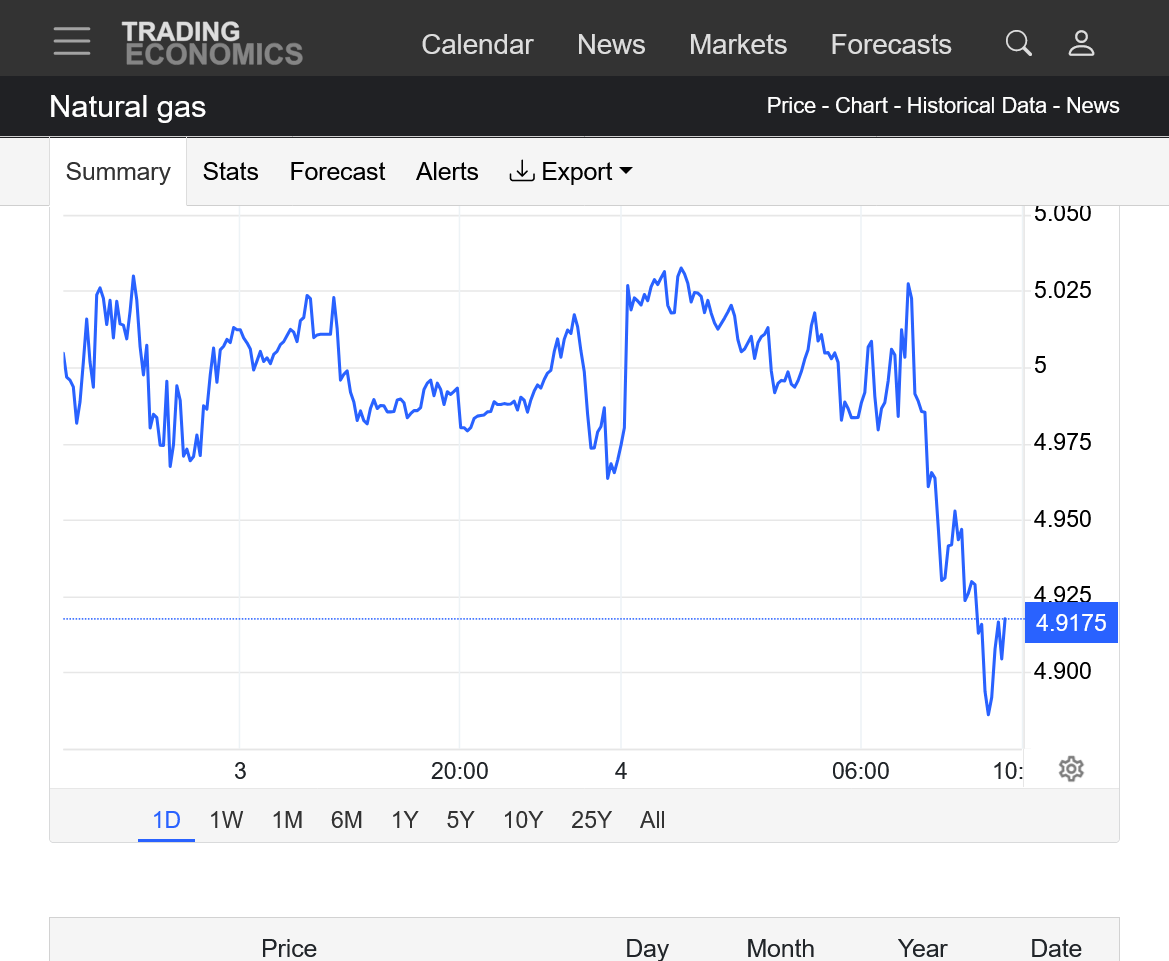
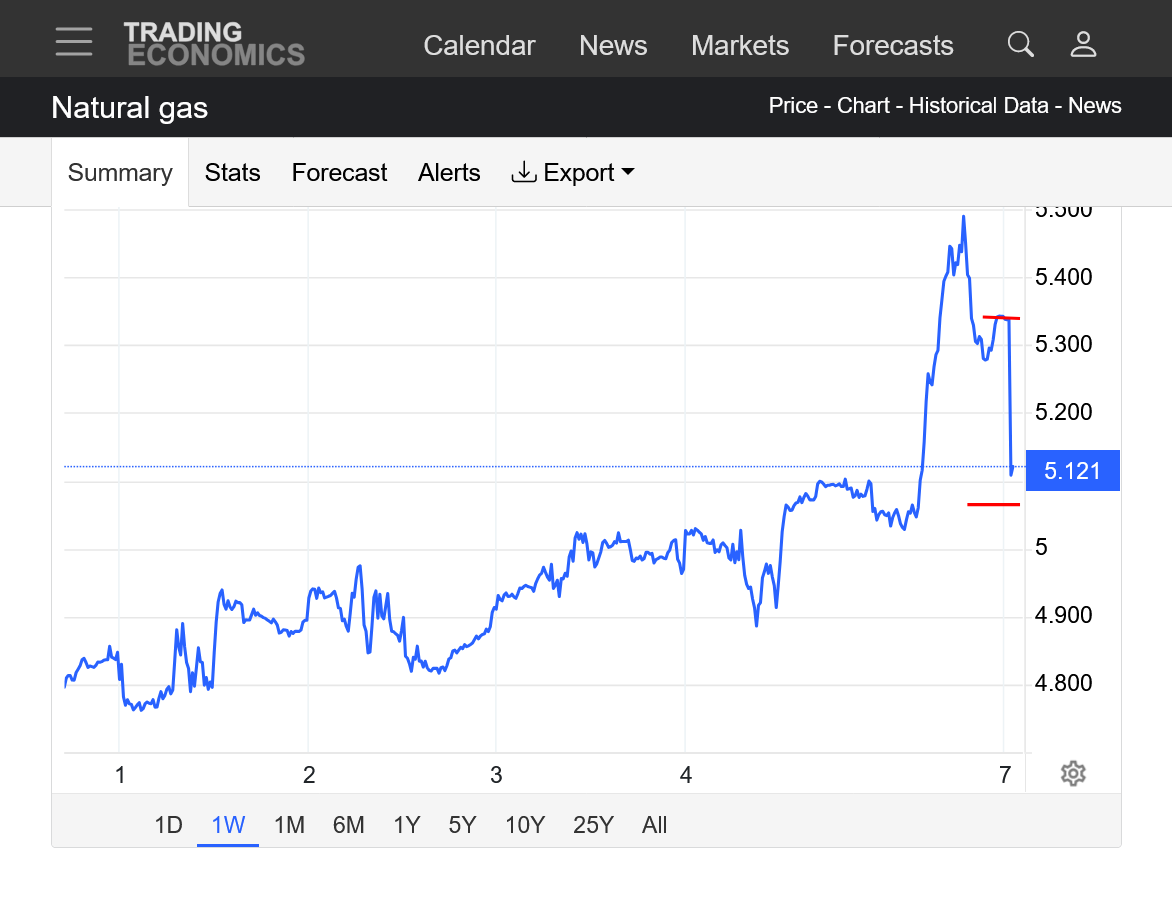
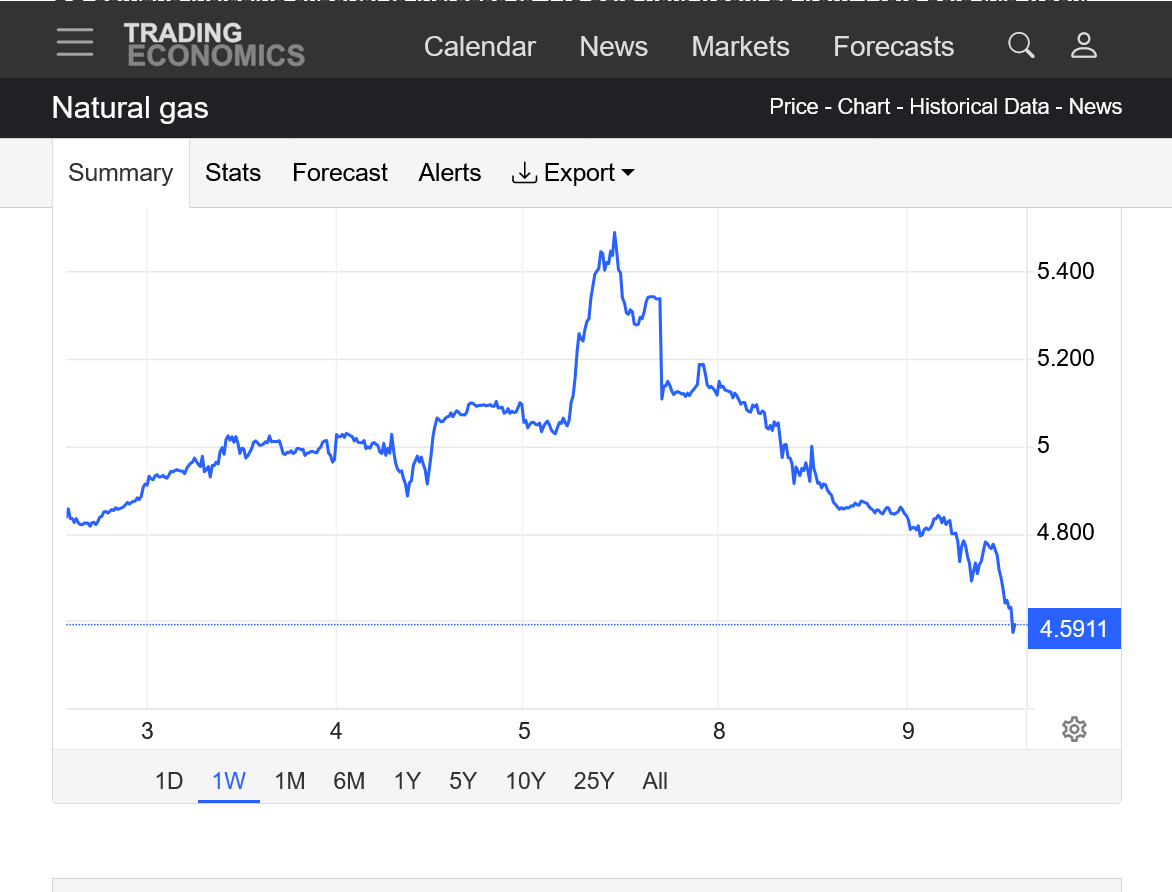
https://tradingeconomics.com/commodity/natural-gas
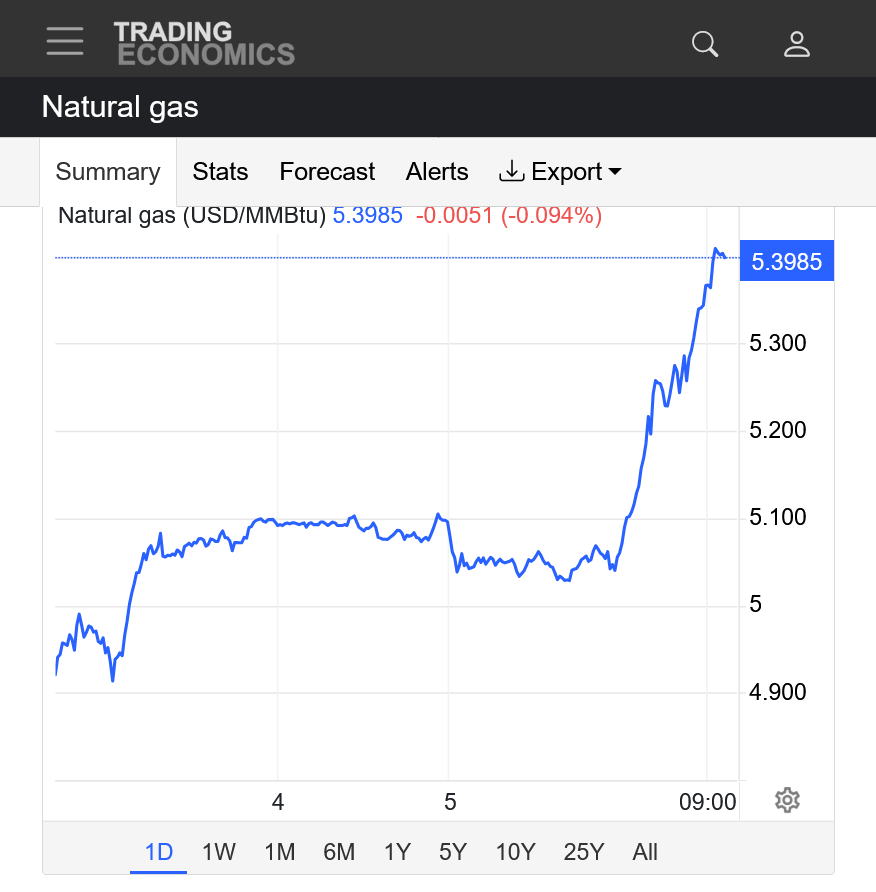
1. 1 day: Prices have been GYRATING up and down but mostly up the last 24 hours!
2. 1 week: Strong uptrend. Prices up almost $6,000/contract since early last week!!!
+++++++++++++
7:30 am: We may have just put in a top! in the last 40 minutes, NG has plunged over $1,000/contract, with a potential short term triple top and buying exhaustion.
As a weather trader, how would you play this one?
By watching and not risking money. Too many up and down, unpredictable gyrations.
I've indicated this as being an ideal selling set up........but only when models show a pattern change to much milder. That pattern change looks like it will be coming..........but the models keep adding cold and spiking us to new highs.
It would have been impossible to know it was time to sell any of the spikes higher, especially with colder forecasts causing them. Doing so would have been more of a gamble and failed the first 2 times.
Doing nothing, cost nothing. Waiting for a better opportunity(there will be dozens this Winter) cost nothing.
7:42 am, the spike down off the highs continues. Up here, with prices being the highest in 3 years, the volatility has spiked way higher. If it gets cold enough, we can still go higher. However, milder models will make me confident that the highs are in for this move!
7:47 am: Down $1,400/contract in the less than an hour!!!
The 12z models coming out now will likely determine the direction we go in.
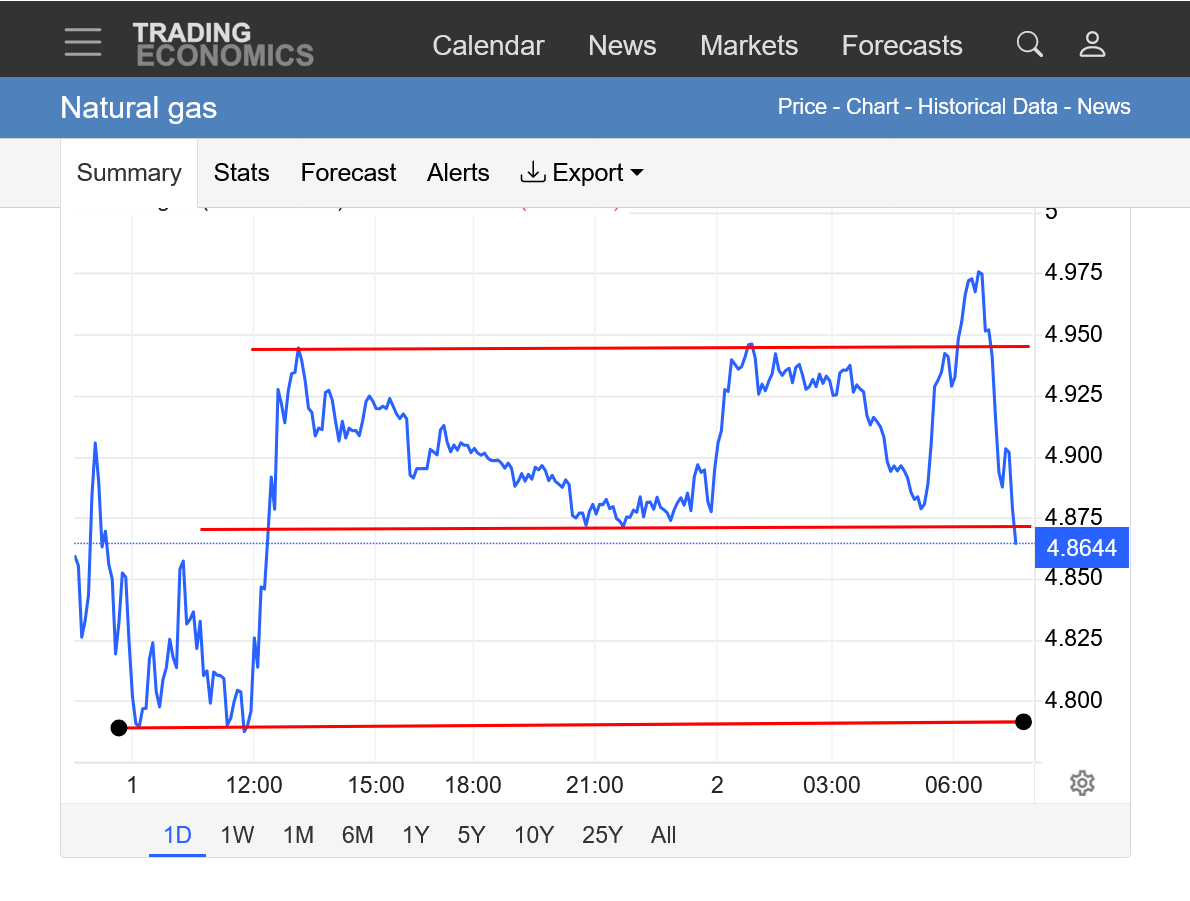
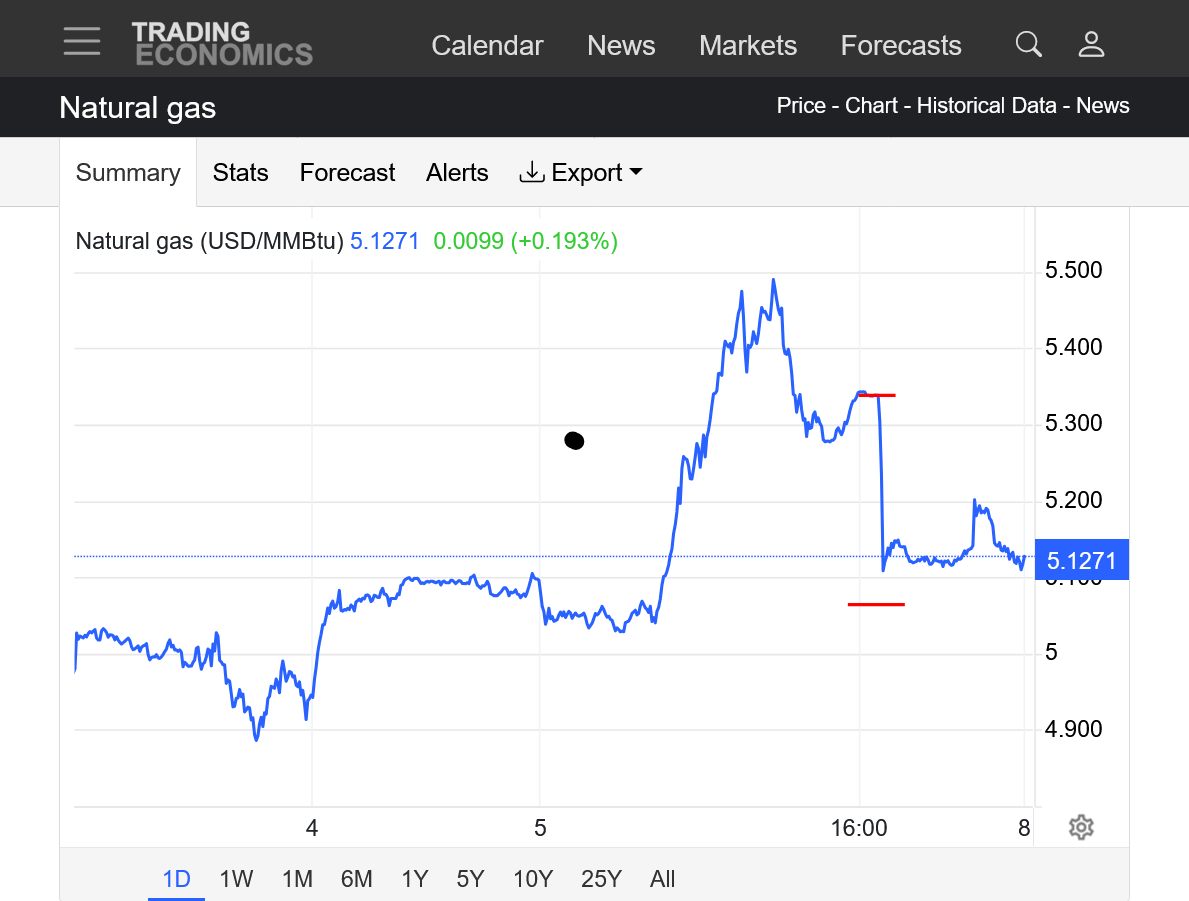
https://tradingeconomics.com/commodity/natural-gas
1. 1 day: Lines of support. We also have a symmetrical triangle/wedge with lower highs and higher lows this morning.
The 18z GEFS, like recent guidance came out a whopping +15 HDDs colder.
The models were struggling with a similar pattern back in August, when the Polar Vortex did an amazing shift south to the Upper Midwest.
The models were struggling with a similar pattern back in August, when the Polar Vortex did an amazing shift south to the Upper Midwest.
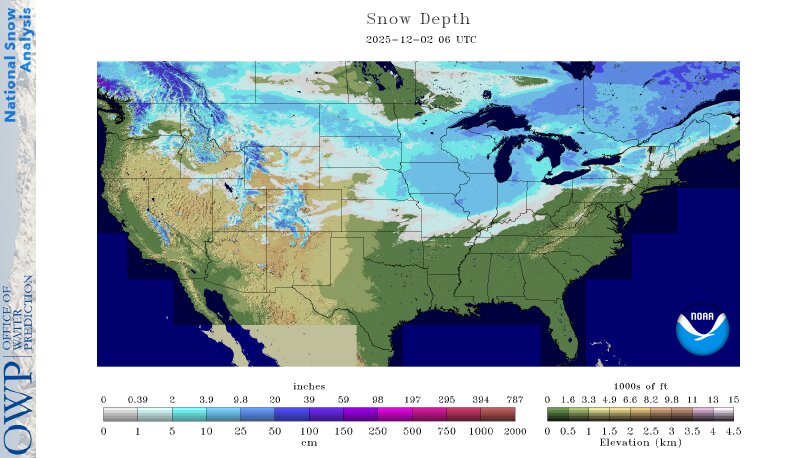
Adding to the extra chill is an unusually extensive snowpack for early December. This is keeps it cool in several ways.
1. Snow pack reflects shortwave radiation from the sun back to space.
2. Snow pack radiates longwave radiation from the surface better than bare ground which results in colder nights too.
3. It take alot of heat energy to melt snow.
4. Frigid Arctic air masses moderate quicker over bare ground. Less so over snow pack.
https://www.nohrsc.noaa.gov/nsa/
This map below doesn't have todays snow in the East.
Daily Snow Extent - December 2, 2025 (Day 336)
https://climate.rutgers.edu/snowcover/chart_daily.php?ui_year=2025&ui_day=336&ui_set=0

The blue is a positive snow anomaly below for this date. That is ADDING a positive reinforcing element to the below average temperatures in this same are as described above.
This is a map for the entire Northern Hemisphere. That's a pretty large area that normally doesn't have snow or doesn't have this much snow in early December.
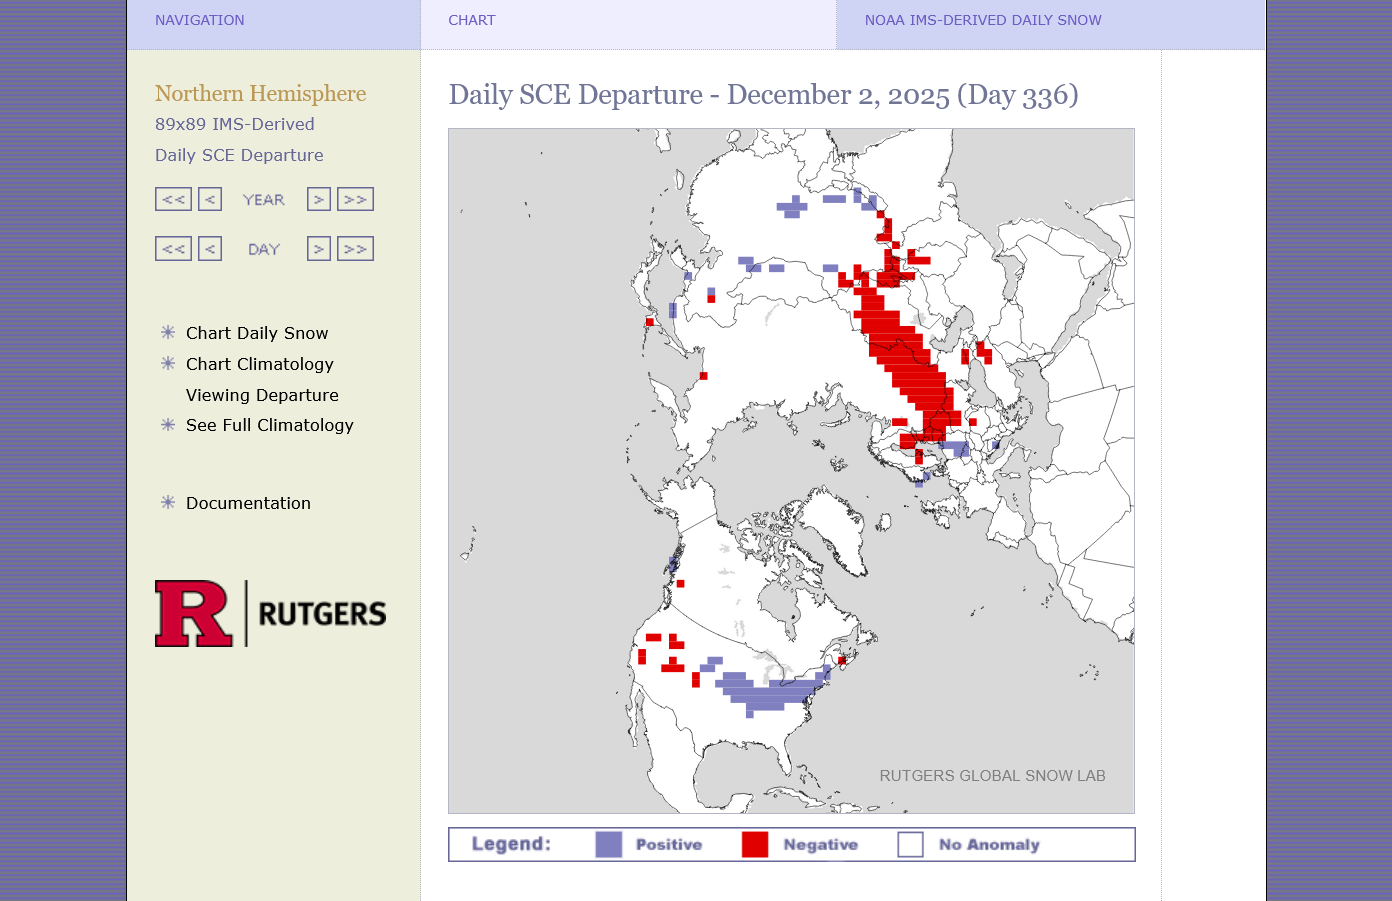
The current forecast, thru week 2 is not favorable for melting much of this snow. In fact, we are dumping more in the Northeast right now and tomorrows snow anomaly will be greater in the Northeast:
https://www.marketforum.com/forum/topic/83844/#83852
The 18z GEFS was COLDER and started NG moving upward yesterday evening. The next 0z GEFS was MILDER and I shorted, with a small profit with a very tight, trailing stop to protect profits.
However, at the moment when I was putting in a new buy stop, the EE model came out mega COLDER/BULLISH and my buy stop was 1 tick BELOW the spiking up market price and it was rejected(buy stops must be ABOVE the market price). This left me short and vulnerable to the spike up, putting a new stop just above the highs, which got hit, so I lost $1,460 in a flash, instead of making money.
Putting the buy stop in for 99% of markets would have given me plenty of time. As Larry knows from watching the market when the weather models come out, there are incredible spikes up and down when big changes in temperatures show up.
The last 0z EE below was a whopping +16.3 HDDs compared to the previous 12z run. It has the same milder pattern with time but, as has been the case recently, it substantially cooled individual days compared to the run before. The models are doing HORRIBLE, UNDER forecasting the magnitude of this cold pattern.
My reason to short was that the 0z GEFS actually being MILDER, in a market that's way overdone to the upside from being bombarded from colder models for the past month would spike us lower. Great strategy...........but the king of the weather models (in the markets mind) the EE came out MUCH colder and sabotaged that exactly when I was moving my buy stop......to protect small profits. OUCH! Good thing I was only short 5 contracts because I wanted to trade 10!
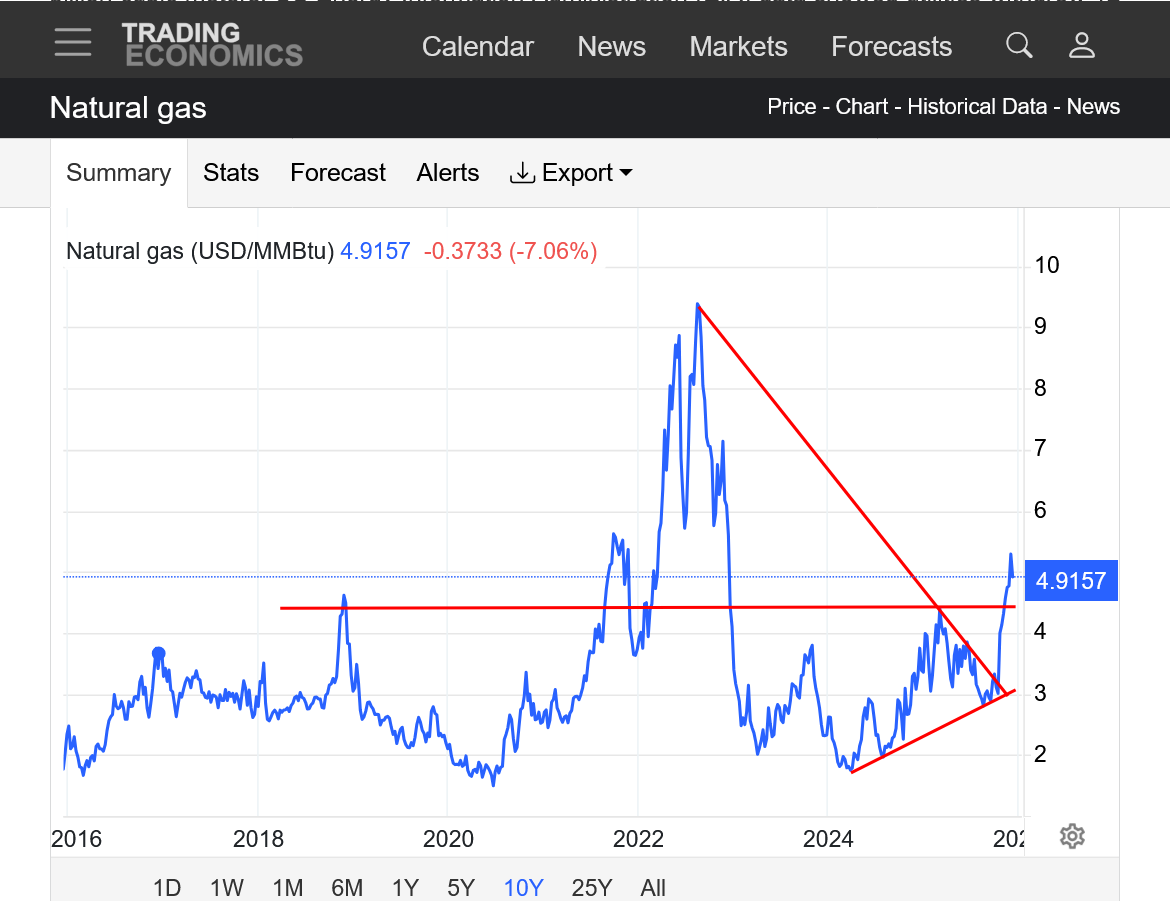
https://tradingeconomics.com/commodity/natural-gas
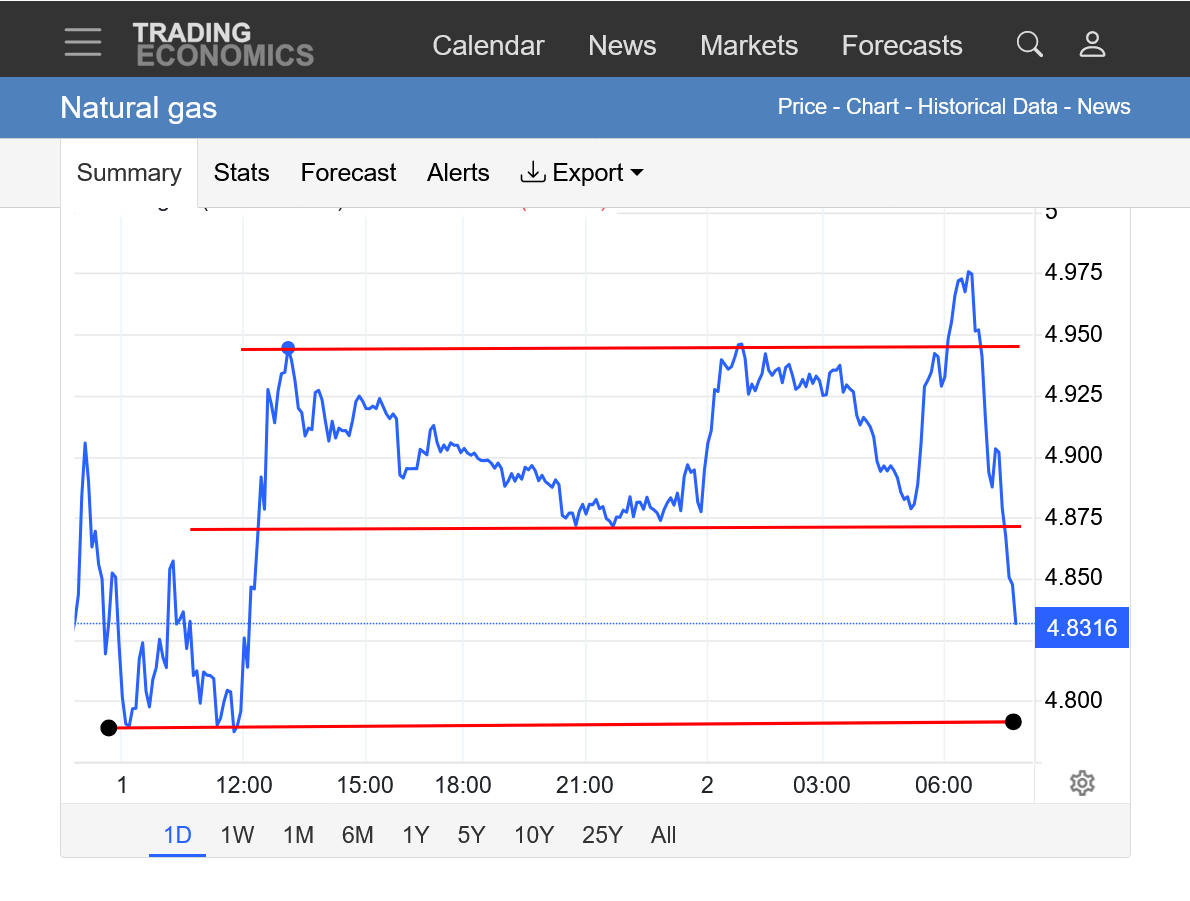
1. 1 day: Marching higher, with some minor spikes by natural gas standards.
2. 10 years: MAJOR upside breakout from a symmetrical triangle/wedge(higher lows-lower highs). AND above long term resistance. Very bullish.
I watched NG in real time sell off from 5.003 at 12:30PM to 4.975 at 12:39PM (CST) on warmer E US 12Z EE maps from ~hour 234 to ~hour 288.
————
Wild guess time: 12Z EE will come out a net 2HDD warmer than 0Z due mainly to a slightly warmer NE US. So this would be only a very minor warming for the US, which would essentially be holding on to the major cooloff of the 0Z.
Mike, please let me know when you get the 12Z EE HDD if you don’t mind. Thanks.
Thanks, Larry.
I'll have those for you but it won't be for at least 4 hours. I'm working on chess stuff today and we have a 2 hour practice for grades 7-12 later this afternoon and need to leave shortly:
Chess for beginners 12-3-25
Started by metmike - Dec. 3, 2025, 1 p.m.
https://www.marketforum.com/forum/topic/116355/
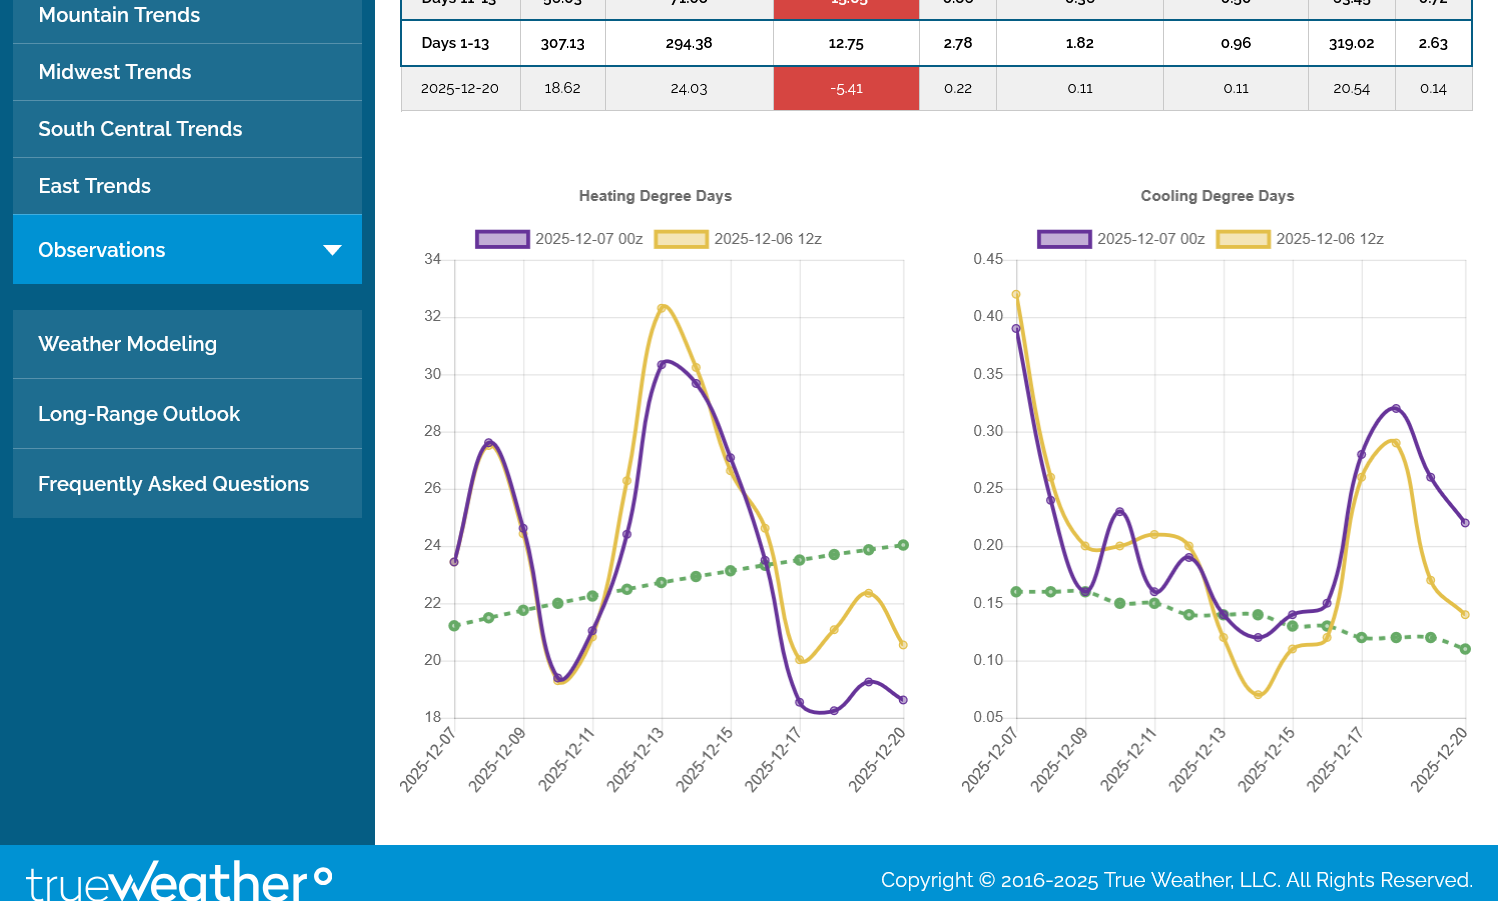
The last 12z GEFS below was +6 HDDs vs the previous 6z and +10 HDDs vs the 0z before that. The last map looks like the setup for some extreme cold in week 3.
Here you go, Larry.
The 12z EE had almost the exact same amount of HDDs as the previous 0z run!
Thank you for the 12Z EE HDDs, Mike!
I just saw that NG dropped 1% the last 20 minutes on warmer E US 0Z GEFS maps.
But now, as of 11:25PM, I’m expecting some bounce back as the maps are now looking kind of bullish at 252.
Edit: It did, indeed, bounce ~1/2% during the bullish maps. But then they turned back bearish and brought it back down 11:41-5PM.
Hey Mike, The Desk’s mean/median are at -17 bcf:
The Desk Survey Avg: -16.8 Bcf The Desk Median: -16.8 Bcf
The Desk Survey Range: -33 to -8 Bcf Major Survey’s Avg: -17 Bcf Standard Deviation: 5.6
Number of Forecasts: 34 Lowball Est. Robry825: -8 Bcf Highball Est. Tim Evans, EoE: -33 Bcf
Thanks, Larry!
NG spiked up $600/contract in 6 minutes! 12:11pm to 12:17pm!
The overall GEFS was +3 HDDs.
The amount of time that it took for ng to go from the bottom red line to the top red line +$600/contract) was 6 minutes.
Somebody that was long 10 contracts would have made $6,000/6 minutes.
https://tradingeconomics.com/commodity/natural-gas
This happened when the almighty EE started coming out much colder in week 2.
The colors represent CHANGES compared to the previous model run. MUCH deeper trough in the Eastern US with the blues.
Pretty substantial price weakness ahead of the EIA report. I think the draw down will be LESS than the -18 estimate but can only guess. The last 6z GEFS was actually a bit bullish. The last map shows distinctive cross polar flow into Canada which would dump some bitter cold air into Canada that would be poised to cross the US border with the passage of cold fronts.
What matters most is the weather forecast and how much of the upcoming cold is already dialed in.
The EIA was just -11 Bcf, so bearish vs the expectations.
https://ir.eia.gov/ngs/ngs.html
![]()
for week ending November 28, 2025 | Released: December 4, 2025 at 10:30 a.m. | Next Release: December 11, 2025
| Working gas in underground storage, Lower 48 states Summary text CSV JSN | |||||||||||||||||||||||||
|---|---|---|---|---|---|---|---|---|---|---|---|---|---|---|---|---|---|---|---|---|---|---|---|---|---|
| Historical Comparisons | |||||||||||||||||||||||||
| Stocks billion cubic feet (Bcf) | Year ago (11/28/24) | 5-year average (2020-24) | |||||||||||||||||||||||
| Region | 11/28/25 | 11/21/25 | net change | implied flow | Bcf | % change | Bcf | % change | |||||||||||||||||
| East | 888 | 892 | -4 | -4 | 916 | -3.1 | 888 | 0.0 | |||||||||||||||||
| Midwest | 1,088 | 1,103 | -15 | -15 | 1,118 | -2.7 | 1,080 | 0.7 | |||||||||||||||||
| Mountain | 288 | 292 | -4 | -4 | 289 | -0.3 | 236 | 22.0 | |||||||||||||||||
| Pacific | 315 | 319 | -4 | -4 | 310 | 1.6 | 281 | 12.1 | |||||||||||||||||
| South Central | 1,345 | 1,329 | 16 | 16 | 1,309 | 2.8 | 1,248 | 7.8 | |||||||||||||||||
| Salt | 371 | 360 | 11 | 11 | 361 | 2.8 | 344 | 7.8 | |||||||||||||||||
| Nonsalt | 974 | 969 | 5 | 5 | 948 | 2.7 | 904 | 7.7 | |||||||||||||||||
| Total | 3,923 | 3,935 | -12 | -12 | 3,941 | -0.5 | 3,732 | 5.1 | |||||||||||||||||
| Totals may not equal sum of components because of independent rounding. | |||||||||||||||||||||||||
Working gas in storage was 3,923 Bcf as of Friday, November 28, 2025, according to EIA estimates. This represents a net decrease of 12 Bcf from the previous week. Stocks were 18 Bcf less than last year at this time and 191 Bcf above the five-year average of 3,732 Bcf. At 3,923 Bcf, total working gas is within the five-year historical range.
For information on sampling error in this report, see Estimated Measures of Sampling Variability table below.

Note: The shaded area indicates the range between the historical minimum and maximum values for the weekly series from 2020 through 2024. The dashed vertical lines indicate current and year-ago weekly periods.
+++++++++++++
This caused a brief spike down to new lows and we are bouncing a bit but its been less than 10 minutes. 1 day chart below.
The last 0z EE was +2 HDDs compared to the previous one at 12z which had no change from the 0z run before it which was a whopping +16.3 HDDs.
The bounce after the slightly bearish EIA report continues.
We were trading in a range all night, then the 6z GEFS came out with a MUCH, MUCH colder pattern(+10 HDDs doesn't tell the entire story-purple line/left) and NG took off like a rocket!
In around 3 hours, NG has soared around $3,500/contract!
https://tradingeconomics.com/commodity/natural-gas
1. 1 day
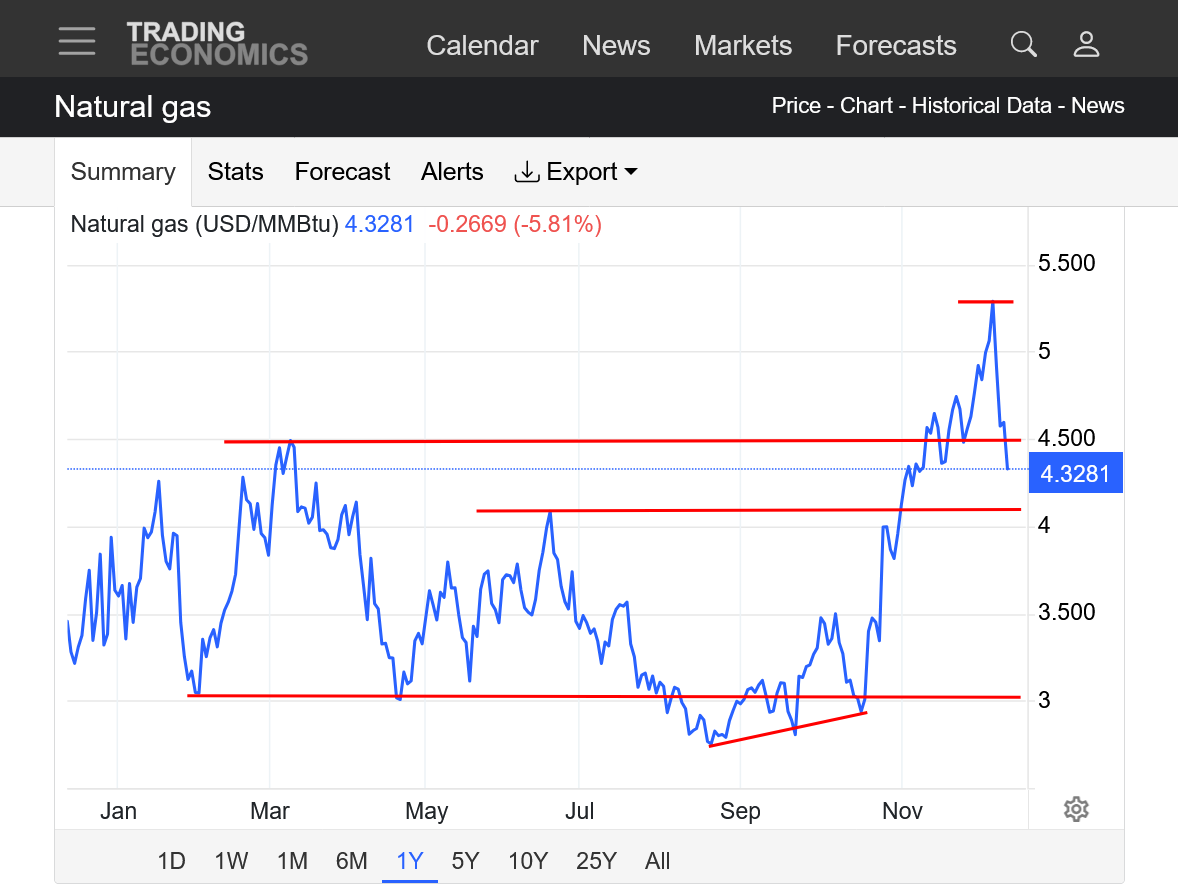
2. 1 year: Bottom in Sept after the record cool spell from this same pattern caused a huge REDUCTION in CDDs. Upside break out above the March highs.
3. 10 years: MAJOR upside breakout from a symmetrical triangle/wedge(higher lows-lower highs). AND above long term resistance. Very bullish.
++++++++++++++
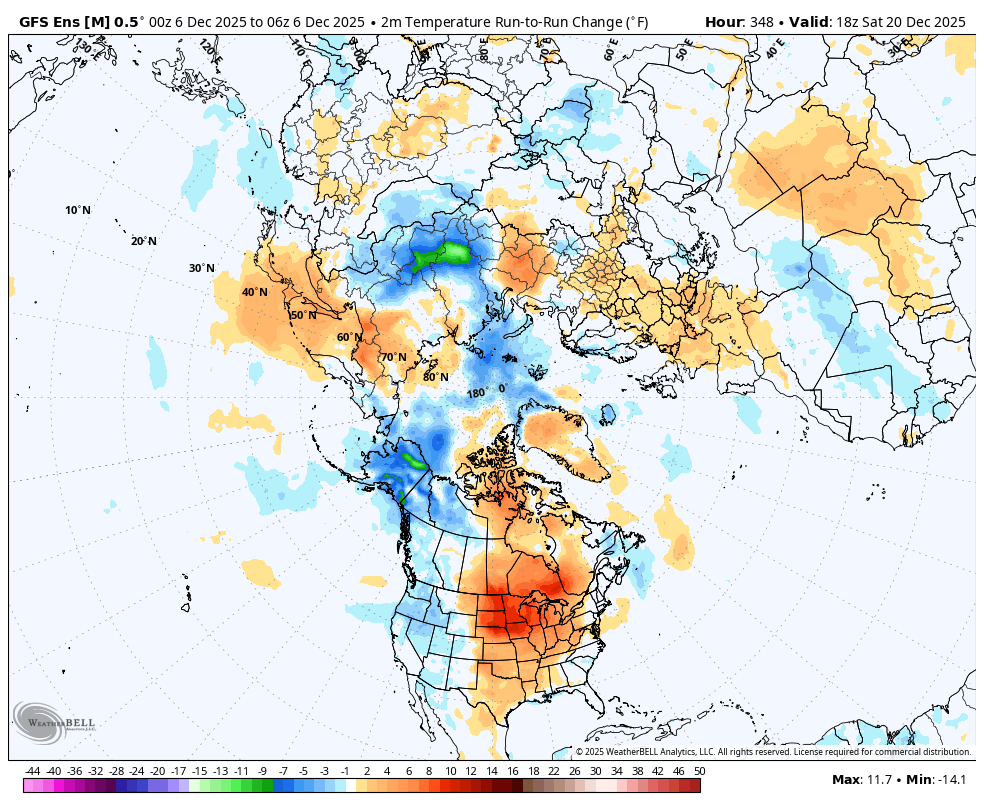
This was the last map on this last 6z GEFS solution that has fired up the ng market. This is Dec 21st.
The colors are anomalies compared to the average. Warm colors are above average. Cold colors are below average. Note the extreme high in Alaska to extreme low downstream in Canada to the northern US, where the Polar Vortex will be displaced unusually far south. This extreme couplet will feature cross polar flow, as seen by the streamlines between the couplet. Its an optimal set up for frigid air at high latitudes(Siberia-the coldest place in the Northern Hemisphere Winter in this case) to be transported south to the middle latitudes. The far southern US still has slight positive anomalies but this is the 500 mb map at around 18,000 feet(mid way in the atmosphere). Extremely cold air masses plunging south NEAR THE SURFACE will UNDERCUT the jet stream from huge Arctic highs that push the colder air deeply into the United States, even into the South.
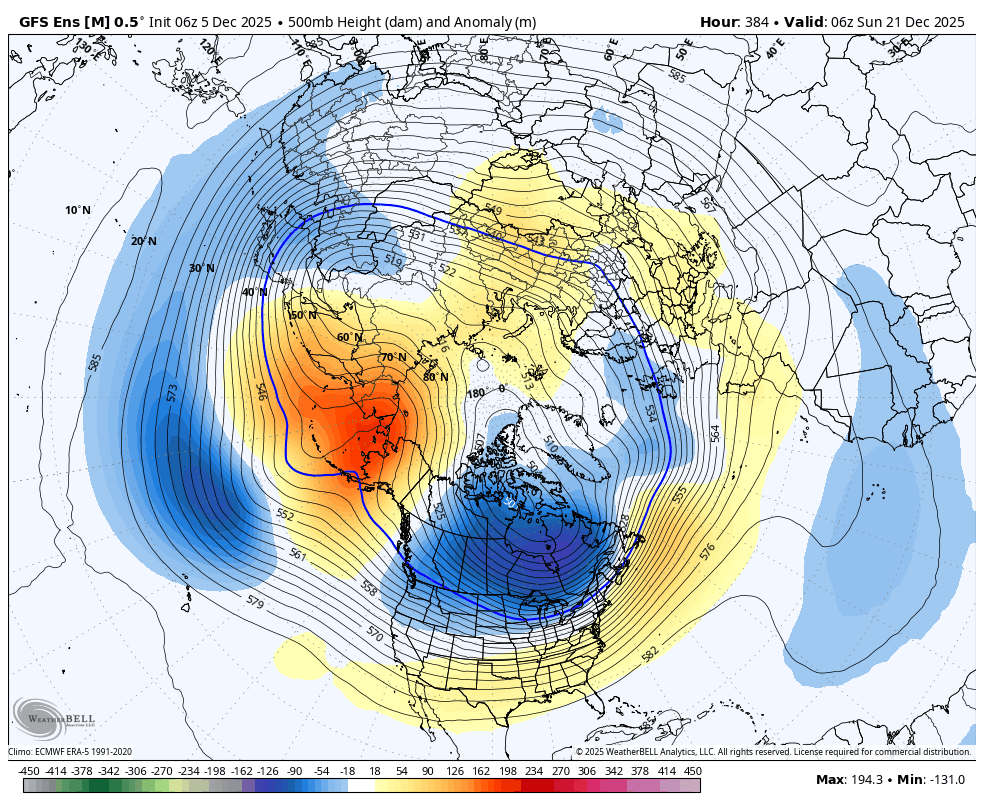
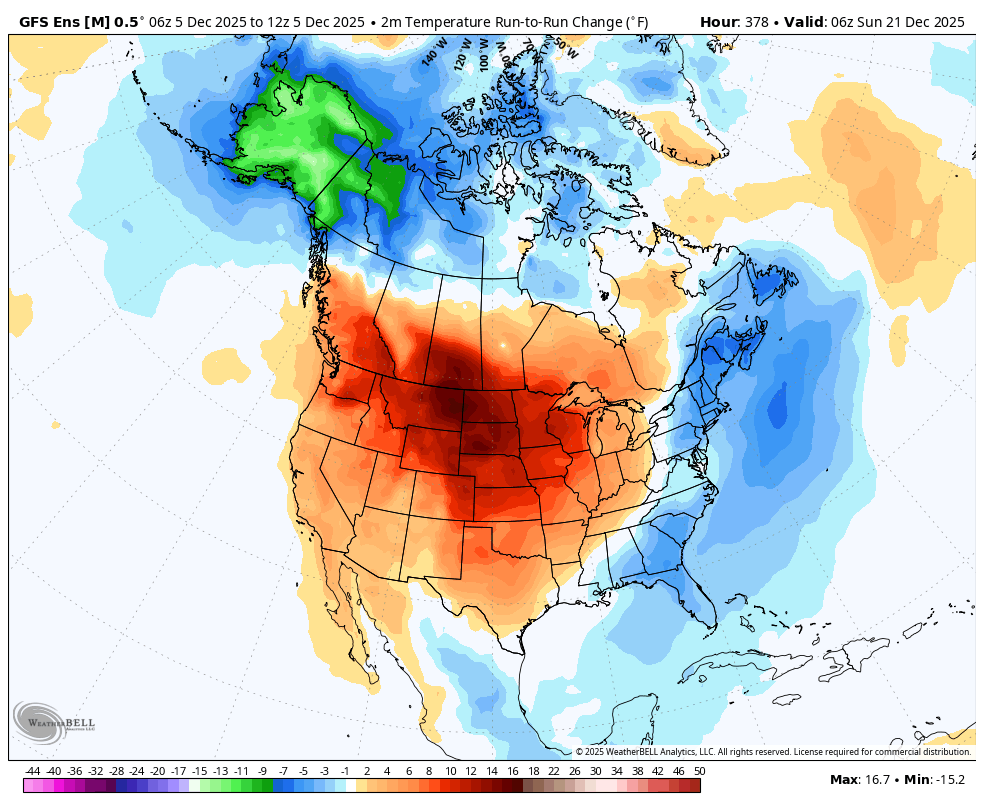
Below was the surface temperature change compared to the previous 0z run at that time frame:

Here's another source for the same data that doesn't show the entire Northern Hemisphere like the top map does. Note the tightly packed streamlines in Northwest Canada. Those will be like channels that act as steering currents for air masses. They have an extremely strong north to south component and they originate, on the other side of the hemisphere in Siberia! This is where air masses in the flow will be coming from! The closer the lines are to each other, the stronger the winds. Follow those lines farther south and we can see them dumping air masses from Siberia south of the US/Canadian border, where surface highs/winds will push them even farther south. We can see the center of the Polar Vortex over the Hudson Bay, which is displaced south of its usual position :
Hey Mike,
It looks like to my eyeballs that NG sold off notably first due to a 12Z GEFS that was warmer than prior runsz. It was at 5.496 at 11:40AM CST to 5.329 an hour later. That’s a 2.5% sell-off on what appears to be due to warmer maps through most of the 11-15 day period. Soon after, the EE also had a warmer 11-15, which reinforced the selloff. Still, NG is up strongly for the day (>5%).
Exactly, Larry!
The volume for just the front month, January is currently over 290,000 contracts!!!
I think we just had a blow off top.........unless the Polar Vortex pays a visit later this month.
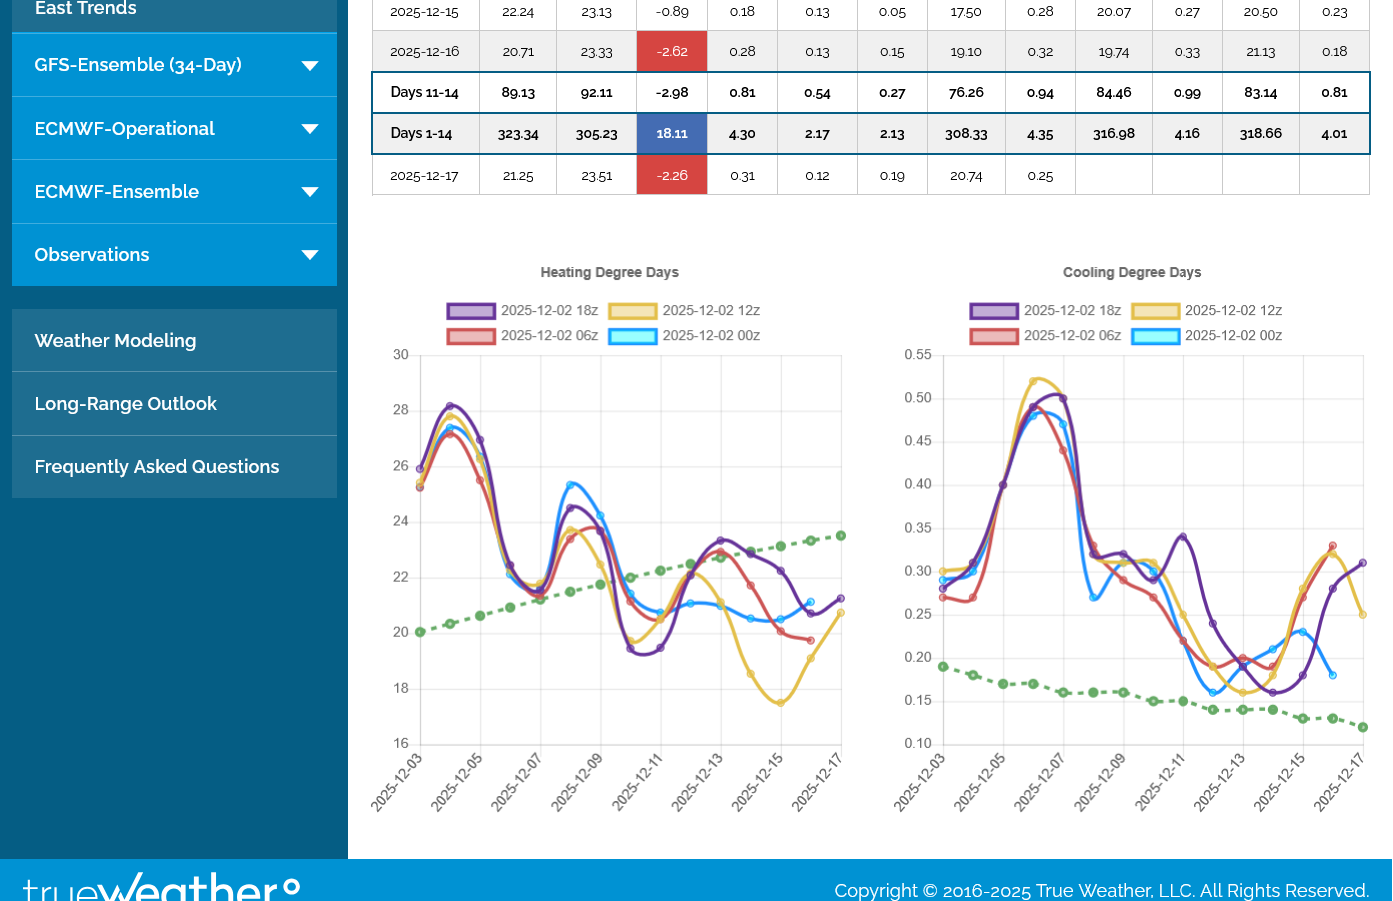
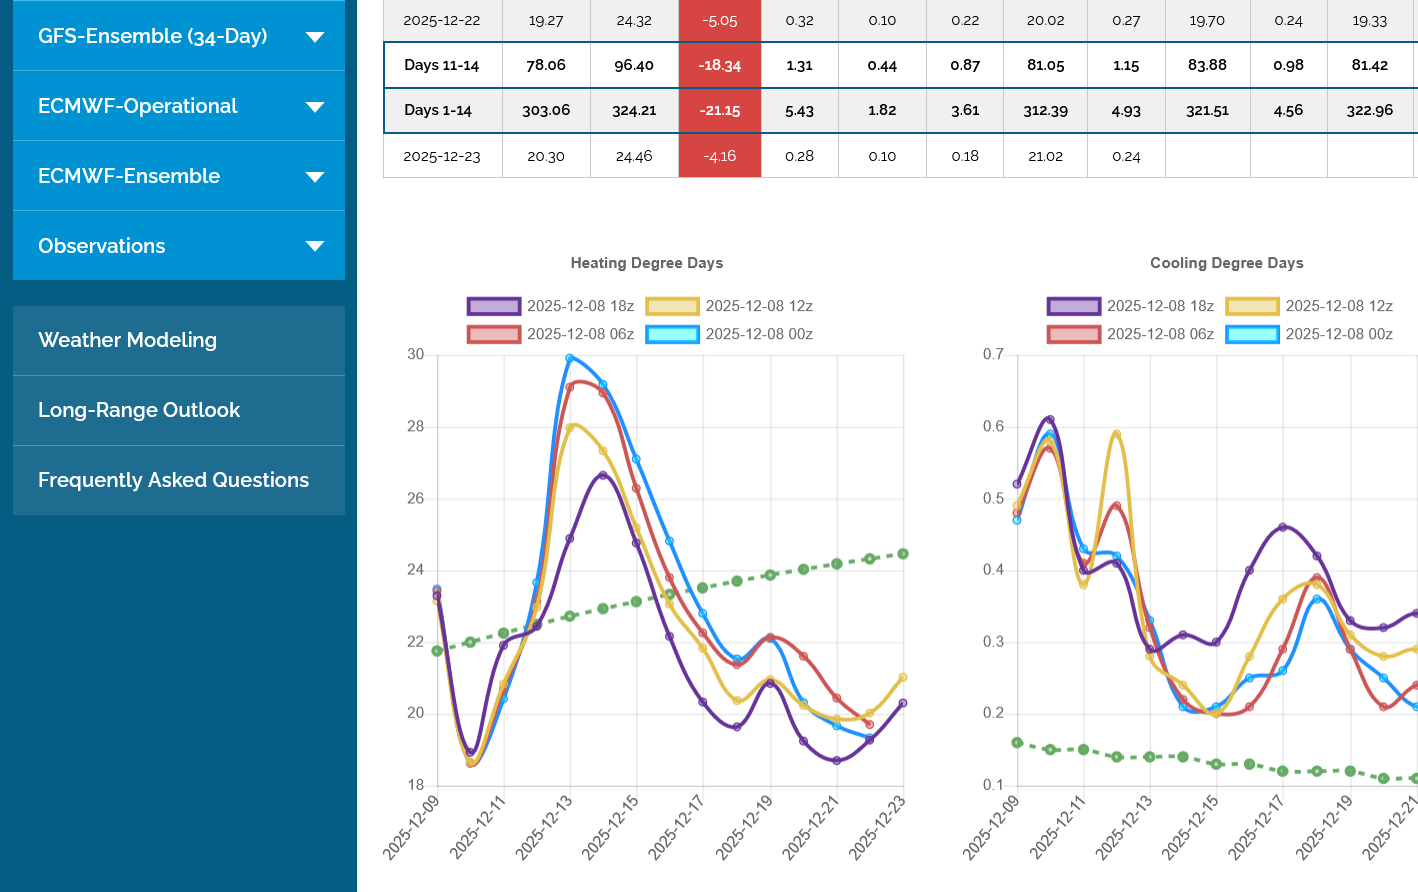
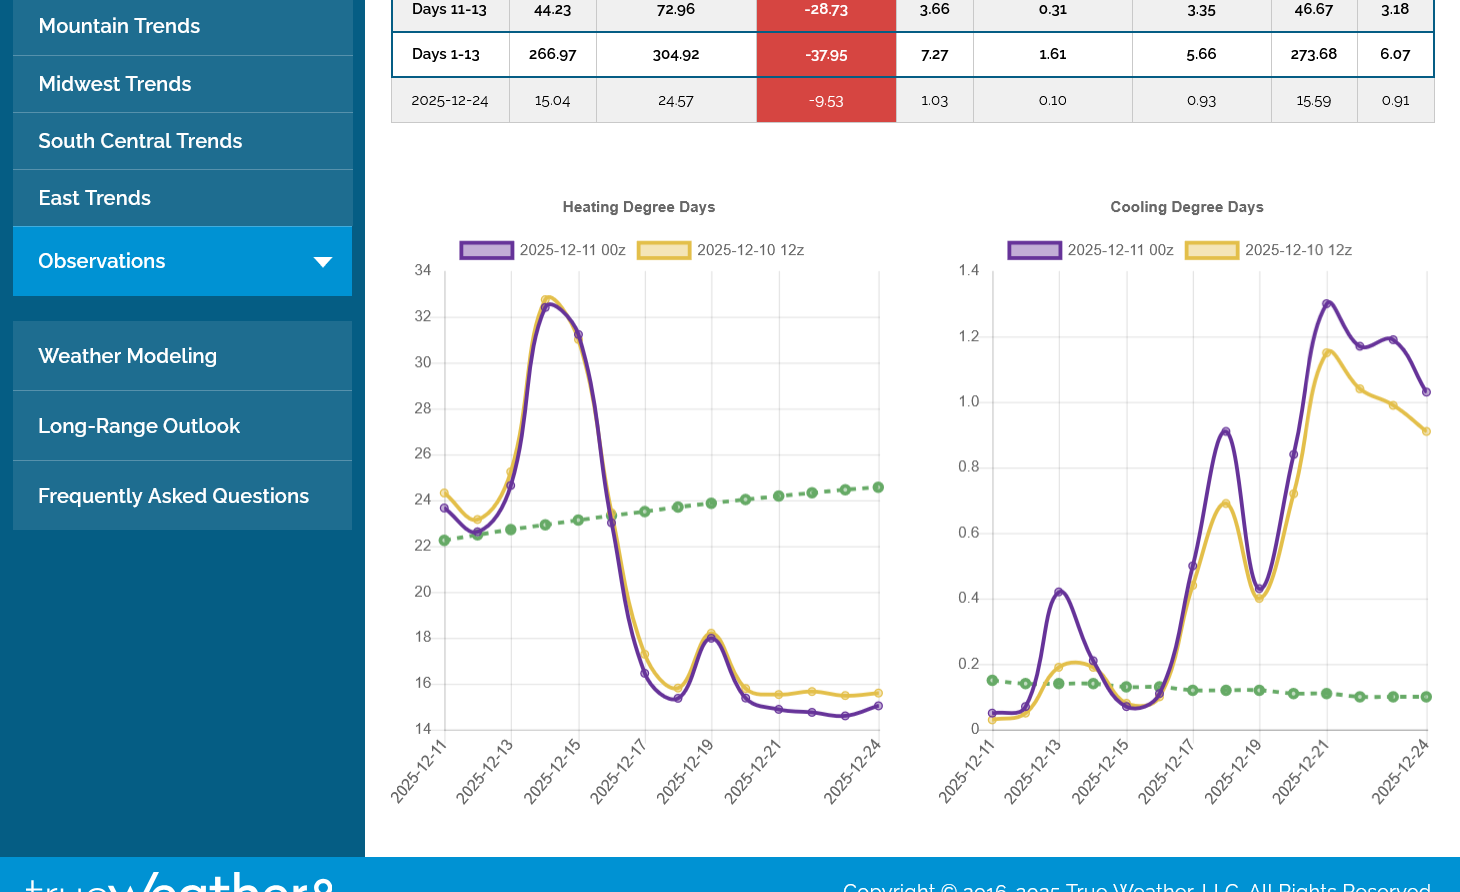
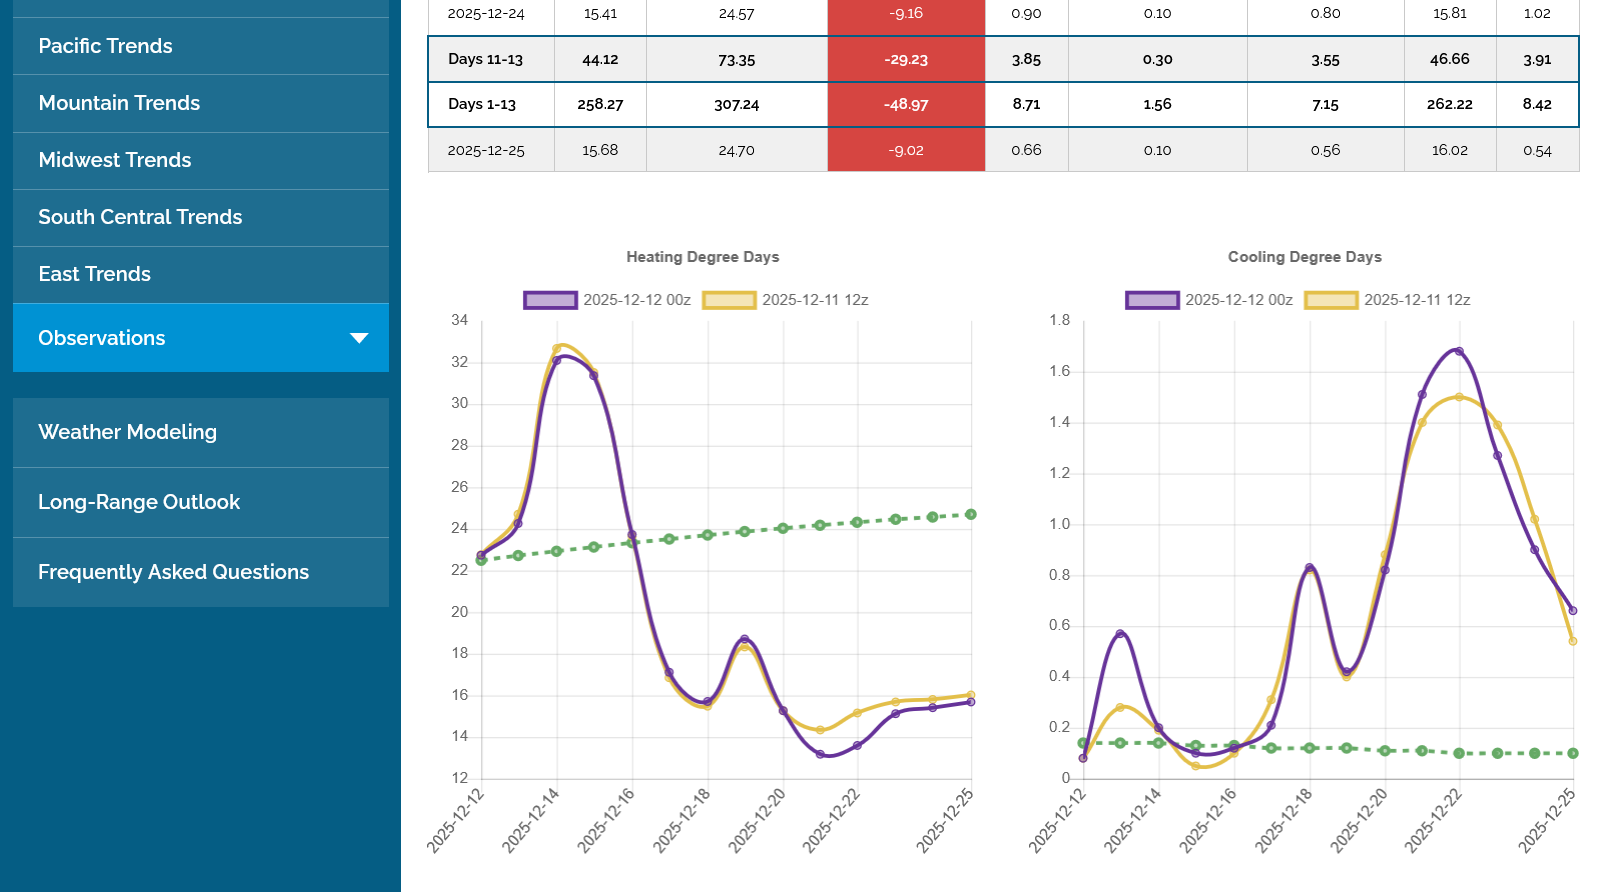
Heres the last HDD graph from the GEFS, the purple on the left being the last 12z run. I'll be at McCutchanville Elementary chess practice when the HDDs for the EE model come out but will pass that on later today.
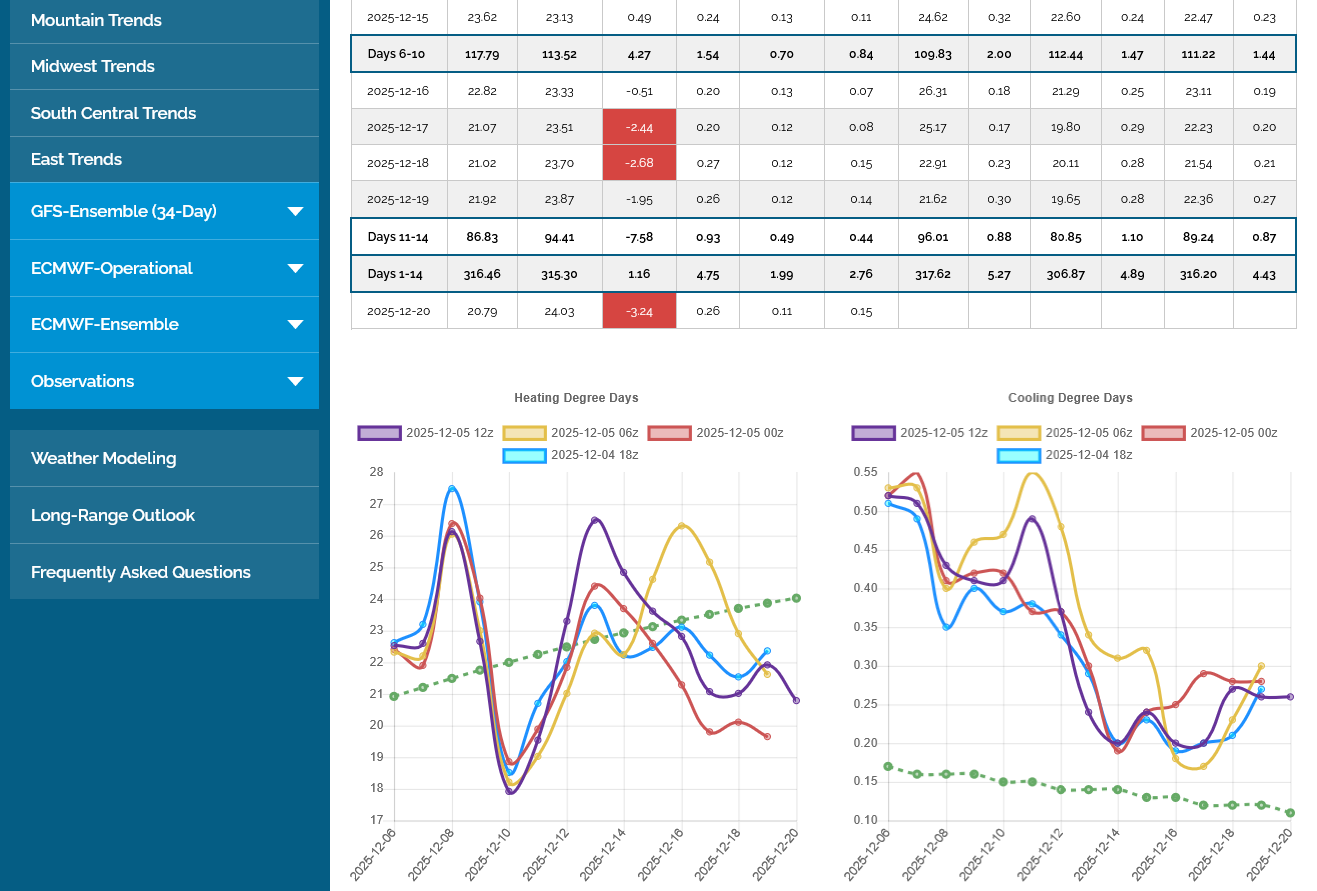
You can see on the graph below when the milder guidance started coming out
https://tradingeconomics.com/commodity/natural-gas
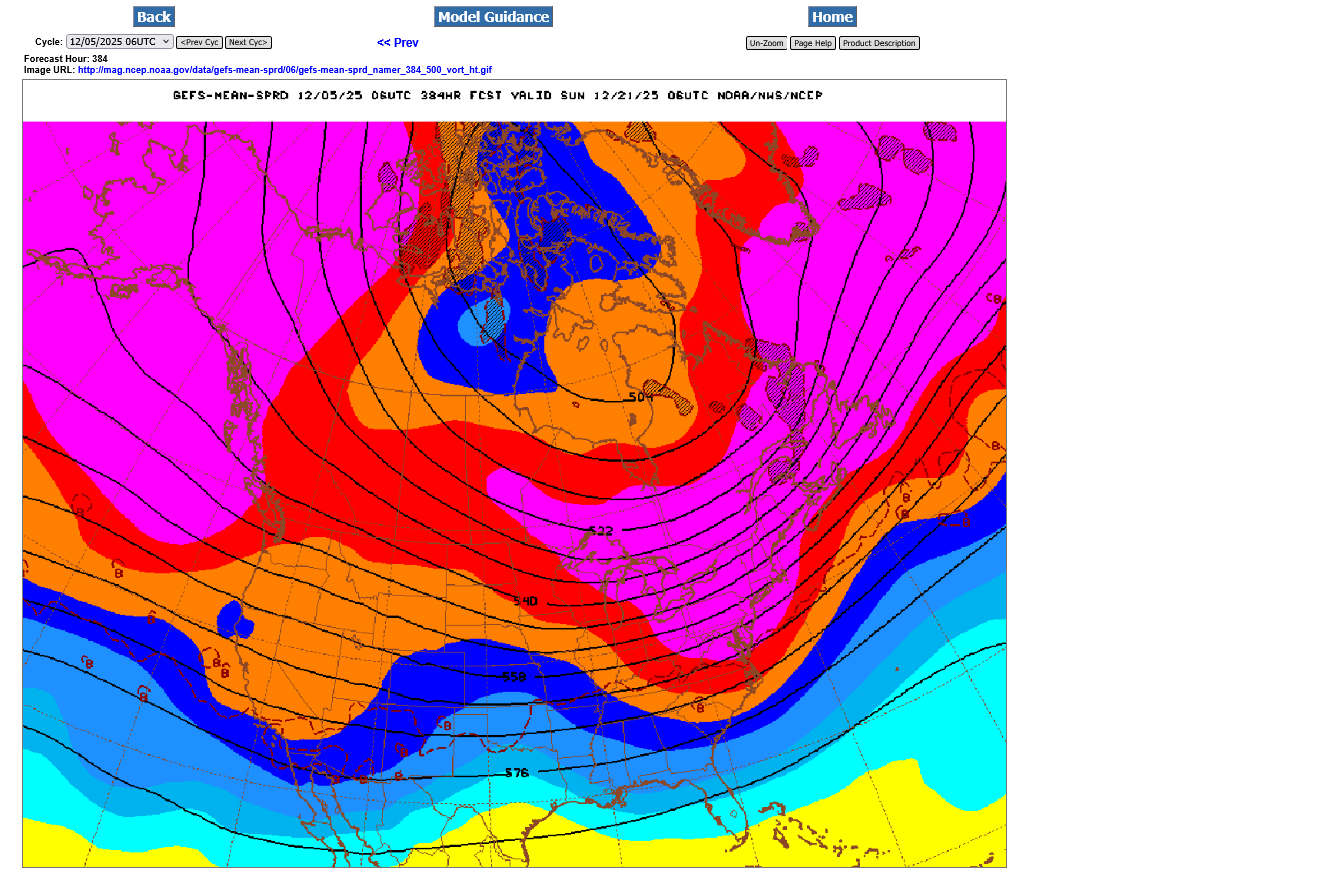
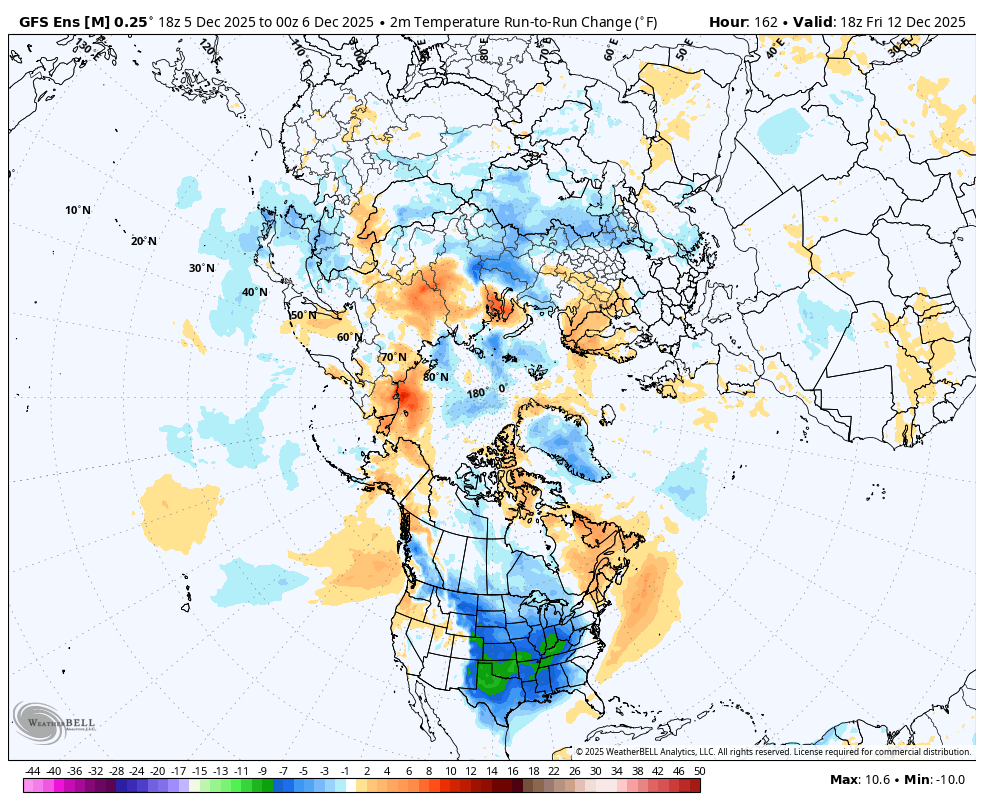
This map below from the last 12z run is the last map in the 2 week forecast. Same as the one in the previous thread above except the colors IN THIS CASE represent THE CHANGES in height values compared to the previous 6z run.
1. These are huge changes in a very uncertain time frame and this particular run WEAKENS the couplet described above. There is still cross polar flow, however its not aimed at the US anymore. The Polar Vortex is 500 miles FARTHER NORTH! The previous run had it over the Hudson Bay in very favorable position to deliver Arctic blasts to the US.
2. This is the temperature difference on the last 12z model compared to the previous one. Warmer US!!!! Colder NWestern Canada/Alaska because the previous run, drained all the cold in W. Canada into the US and it was replaced by milder air. This run, has cross polar flow from Siberia that STAYS IN NW.CANADA AND ALASKA.
1:30pm: Update on volume. 317,000 for just the January contract. WOW! I think we blew out all the shorts and had panic buying with a likely buying exhaustion. Of course enough frigid weather increasing can cause us to go even higher but the 6z GEFS solution at the end of week 2 was about as cold of a pattern that we ever get.
15 minutes later and we're up to 324,000 at a time in the afternoon when the volume normally drops off.
+++++++=
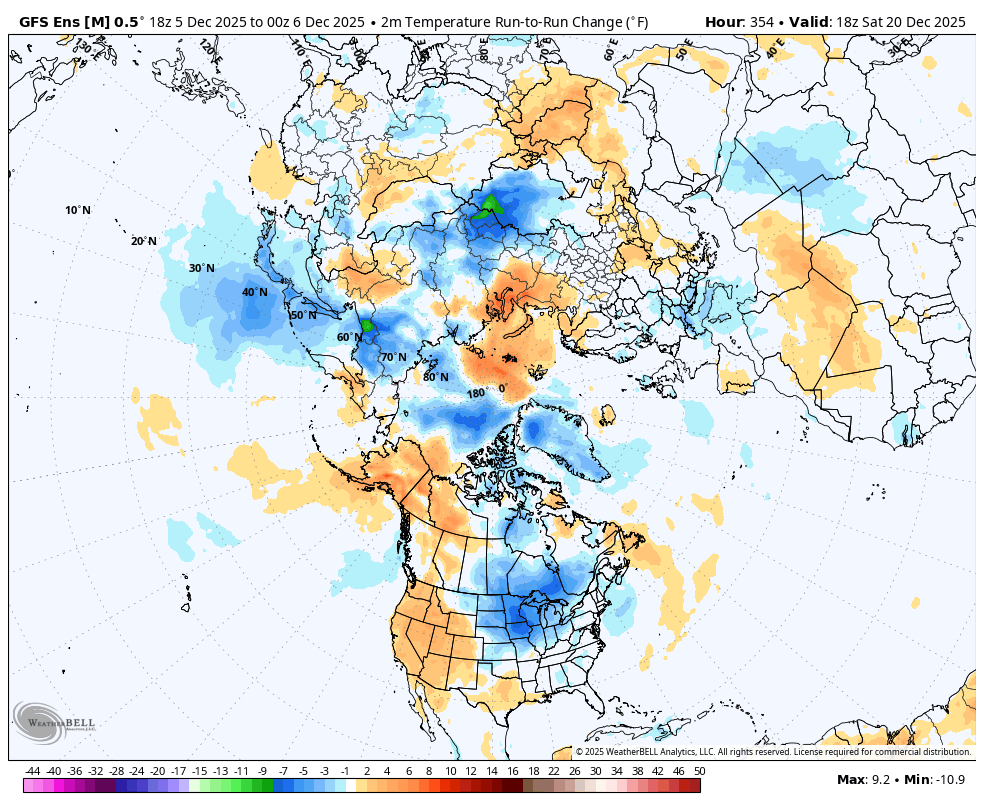
This was the more bearish EE from 12z. Considering the enormous changes that we're having in model runs, sometimes just 6 hours apart, a model run on Friday means diddly squat for Sunday Evening when NG opens again at 5pm.
We can see the incredible warm up at the end of 2 weeks on the last model. Compare that to the run just 6 hours earlier for the same time frame.
I'm showing this again because I can't remember a bigger flip flop. The reality, is the last forecast above is probably closer to the one from the previous day and the extremely cold one below from 6 hours ago, that launched NG prices should be seen as a potential outlier.
It's basically the La Nina signature.
https://www.cpc.ncep.noaa.gov/products/predictions/WK34/gifs/WK34temp.gif
MM,
Natural Gas Storage Survey for 12/11/25
"survey conducted on 12/5/2025
Average
Median
Range
No. of Estimates
-169.40
*Risk Lean for Next Week's EIA Report: Bigger Draw
If NG were trading overnight, it would have risen sharply due to much colder 0Z ensembles 12/12-18!
For sure, Larry!
The yellow line below was that previous 0z GEFS run. The last one on the left is the 6z run that has backed off on the intensity of the cold.
This extreme variation in model to model runs started with the 6z run Friday morning. It's completely tied to a small but incredibly important element in the steering currents that will determine how much of the frigid air dumping from Siberia, from cross polar flow(which is a feature on EVERY run) into Canada will get flushed south, penetrating deeply into the US or does the lions share stay in Canada, with only a shallow penetration that mainly impact the northern US?
The location of a potentially displaced southward polar vortex means everything. The farther south that it is(with any southward troughing), the more of the frigid air will be diverted south into the United States.
At the same time, as you mentioned, we have an atmosphere that wants to build upper level heights in the southern US.
As mentioned last month, the temperature gradient in this sort of pattern is incredibly tight. Very small adjustments in the key features that impact the position of the horizontal temperatures are resulting in something like 10+ degree temperature swings for large swaths of terrain in some places for several days.
Below is milder 6z GEFS late in the period shows this change from the much colder 0z run that you pointed out in your previous post.
We should also note how much COLDER it is in Western Canada. The WARMER solutions like this will all be COLDER in Western Canada with the Siberian cold being more trapped there. All the COLDER solutions for the United States will show Western Canada being much WARMER from that cold air dumping into our country(and milder air replacing the cold that was in Western Canada. These are CHANGES from the previous run below.
+++++++++++++++++
1. The previous 0z run that you mentioned had an extreme cold air dump AT THE END OF WEEK 1 as depicted below that gets flushed deeply south.
2. The 2nd map is near the end of week 2, the period similar to the map above. Note that it coincided with milder(less cold) air left behind in Western Canada. The cold, in essence is being flushed out of Alaska and Western Canada into the Midwest. Even though this pattern can persist longer, the source region isn't being given the chance to build up more cold.
At this time of year, there is ZERO solar radiation in the highest latitudes. With 24 hours a day of losing heat(long wave radiation( the large land masses in the Arctic just get colder and colder with time. Siberia is the place that brews the coldest air in the Northern Hemisphere during our Winters.
Siberian air masses that get transported here from cross polar flow are always the coldest because of this. However, when this happens, the coldest air that tooks weeks to build up in Siberia is DRAINED southward and milder air from surrounding areas replaces it. As a result, this can moderate the intensity of the coldest air masses with time(if they can't rebuild).
Not to be ignored is climate change, which warms the highest latitudes of the Northern Hemispheric during WInters because the air is so dry. They lack H2O, so the overlapping absorption bands for long wave radiation(between H2O and CO2) that are saturated already by H2O in the more humid places(that don't warm as much from added CO2 that does nothing) are not facing this saturation because there is very little H2O. As a result, the CO2 does more absorbing of the long wave radiation going out from the surface.
What this means is that the COLDEST air on the planet, during the coldest times of year in the Northern Hemisphere is not AS COLD by numerous degrees. So air masses in the type of pattern that we have right now will also not be AS COLD when they hit us.
Right now, is almost the most extreme cold pattern that exists for cold air delivery and it features WAY below average temperatures but the fact is, the impact of climate change/global warming is actually the GREATEST right now. And the impact is making it LESS COLD by a greater temperature magnitude than at any time of year.
In the Summer, for instance climate change might make some air masses a degree or 2 warmer but its extremely limited because those air masses are humid and the CO2 long wave radiation bands for absorbing heat ARE ALREADY SATURATED by the H2O.
As mentioned above, the CO2 is able to greatly warm the coldest, DRIEST air masses the most. So Siberian or Arctic blasts might be 4-6 degrees LESS COLD in our Winters. This is LESS Extreme and for most life, especially humans a tremendous BENEFIT from climate change.
The first map below, shows the Siberian cold being exhausted, the a week later on the 2nd map its starting to build up again.
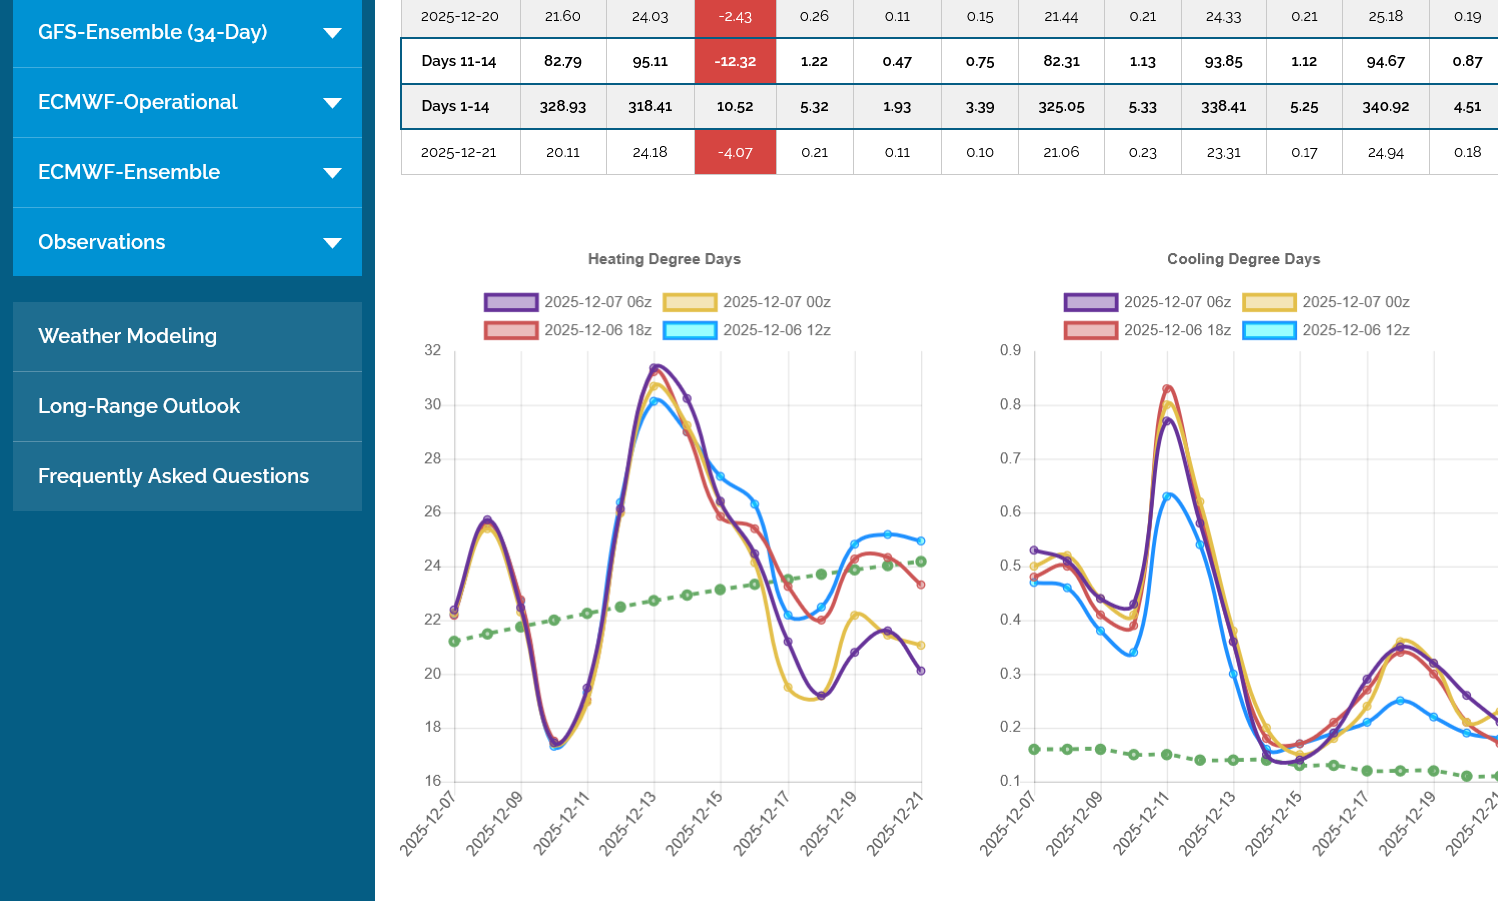
The 12z models continue with extreme solution potential.
The 12z GEFS was actually COLDER than the 0z run that Larry mentioned, mainly from late period cold changes . The LESS cold European Ensemble model was even LESS cold -3 HDDs but has the similar mid period, extreme cold outbreak.
 ++++++++++++
Yeah, Mike, I see that the model consensus is suggesting the realistic chance for a big dump of Arctic air, possibly from two big consecutive Arctic highs, to include pipe-busting cold deep into the SE US with the cold centered on 12/12-18.
This is very believable considering it would be during an EE progged longest MJO phase 8 in 50 years, the coldest phase on avg in the E US in Dec, along with by far the highest % Dec 5th snowcover in the Midwest since at least 2002.
Great,points, Larry!
This last 0z EE was double digits warmer than the previous one 12 hours earlier.
8am: The HDDs were not out yet on the previous post. They were -12 HDDs(purple left) compared to the previous run from 12 hours ago. So we are getting warmer(LESS COLD) now.
The 0z GEFS was even LESS COLD at -13 HDDs(tan line).
The last 6z run(purple) was +3 HDDs but that still makes it -10 HDDs compared to 12 hours ago.
We should especially note the SEPARATION of those lines BELOW the previous lines for the last 5 data points, like on the EE chart above, where the purple line makes a big drop for the last 4 data points.
This is a NEW trajectory from a much milder week 2/end of forecast pattern, which starts week 3 milder and not just milder individual days. If that pattern continues, the highs in ng are likely in.
MetMike/Larry
When is the release of the next forecast? Will this be the last release prior to the open? TY
Hi tjc,
We still have the complete 12z guidance from every model that will be coming out the next 3 hours.
There is a long range EE model that comes out after that which is not as important.
Knowing your trading set ups on weather (that are very similar to mine but I never use options) this is the classical set up for picking the top and being short..........which is my set up right now.
What are your thoughts, please? Are you long puts yet? Friday might have been a wonderful day to purchase them. The only thing is that this extreme volatility has probably jacked up the IV (implied volatility) part of the price but that's sometimes a part of making extreme price tops like this one.
Thank you, Mike
Currently no ngas position, but 'love' the dialog between you and Larry.
Based upon cycles, looking to get short crude and/or ngas toward end of week, probably Friday. Charts 'tell' me recent highs not in for these energy products. Near term, buy dip; more likely to try to exploit a put.
PLEASE keep us posted.
Thanks a ton, tjc!
You're experienced insight is always much appreciated.
This last 12z European Ensemble model was -12 HDDs.
That would be -24 HDDs cumulative for the last 2 EE model runs. I'll say we open LOWER tonight and unless we go back to colder again, Friday was a blow off topic that included panic buying from short covering and others.
However, we've seen this sort of thing before and the weather models reversed colder again and NG came back. That's still very possible but we've come along way on extreme cold forecasts.
Huge rallies come easier in the first part of the heating season when sustained cold has the MOST TIME to erode storage. This extreme cold pattern, if it stayed would likely result in even higher prices though.
Needless to say, this Thursday's EIA weekly report at 9:30am is likely to be one of the biggest for that week in history.
https://www.cpc.ncep.noaa.gov/products/tanal/temp_analyses.php
Taking it all in, I'll repeat my morning opening call LOWER this evening from the MILDER week 2 forecast. The main reason that it probably won''t be a GAP lower is that the range on Friday was an incredible $4,700/contract and we closed to the highs.
We would have to open WAAAAY lower for it to be a gap.
I'll say at least -$1,000/contract on the open vs the last price Friday.
Maybe -$2,000+
We did open over -$2,000 below the close on Friday. The top red line was the close and the bottom red line was the low so far in 5 minutes. This graph is messed up because we hit 5.066 and it doesn't show it.
We've bounced back to $5,120 from that the MUCH lower open.
This is another example that to make money on changes over the weekend in weather in the ng market you MUST hold a position after the close Friday and be right about the weather change on the model forecasts.
If you are wrong, you get your clock cleaned and its likely they HUGE changes on Sunday night opens are traders the were wrong getting out at the market!
+++++++++++
In the morning, I had wishful visions of shorting the open on the milder outlook but then reality hit as I appreciated the fact that everybody else knows the same thing I do and the price to sell (or buy) is BEFORE everybody else knows or BEFORE the reaction.
The BEST time to sell would have been last night, for instance when the biggest LESS COLD changes were just hitting the eyes of traders and prices were still elevated from the blow off top on Friday. But the markets were closed.
++++++
We've bounced $800/contract from the huge spike low open. So selling the open would have been THE WORST TRADE OF ALL. I'm guessing this will be limited by whatever the updated guidance shows overnight, with the current assumption still being a blow off top on Friday. Negated only by the coldest weather models yet.
+++++++++++
Already 7,000 contracts traded in less than 30 minutes!!
For comparison, CL has 1106 contracts traded and HO just 220 for the front months.
So NG has more than 30 times the volume of HO so far!!
++++++++++++
Total trading volume for the entire trading session of the front month of thinly traded OJ on Friday was 1103 contracts! I wasn't watching the volume of NG on the open but we probably traded that much volume in the first few minutes!
MetMike and Forum
My comments are NOT trading advise, just a 'traders' observations after AT LEAST ONE HOUR OF TRADE:
One might want to consider, buying new daily highs ngas, crude, bonds, dollar (fade foreign currencies)
"Try" to pick bottom metals and index (index bottom might be in).
Do not ignore possible sb, ct, lum, cc, oj longs. Possible kc short
Other than above, I have no comments--haha
Remember what you paid for these comments!
Suggested now Long 5.15 per buy stop---i am watching
Thanks, tjc!
Good luck with that but you're trading against the weather pattern change
Maybe the models will change for you tonight.
I have no idea why we suddenly spiked up to 5.2 but it was met with tons of selling. There's no weather justification to go higher.
The close on Friday and low so far tonight are where the red lines are drawn. We dropped to 5.066 right after the open.
ADDED THIS GRAPH that I forgot late last night.
+++++++
5am: i forgot to include the chart.
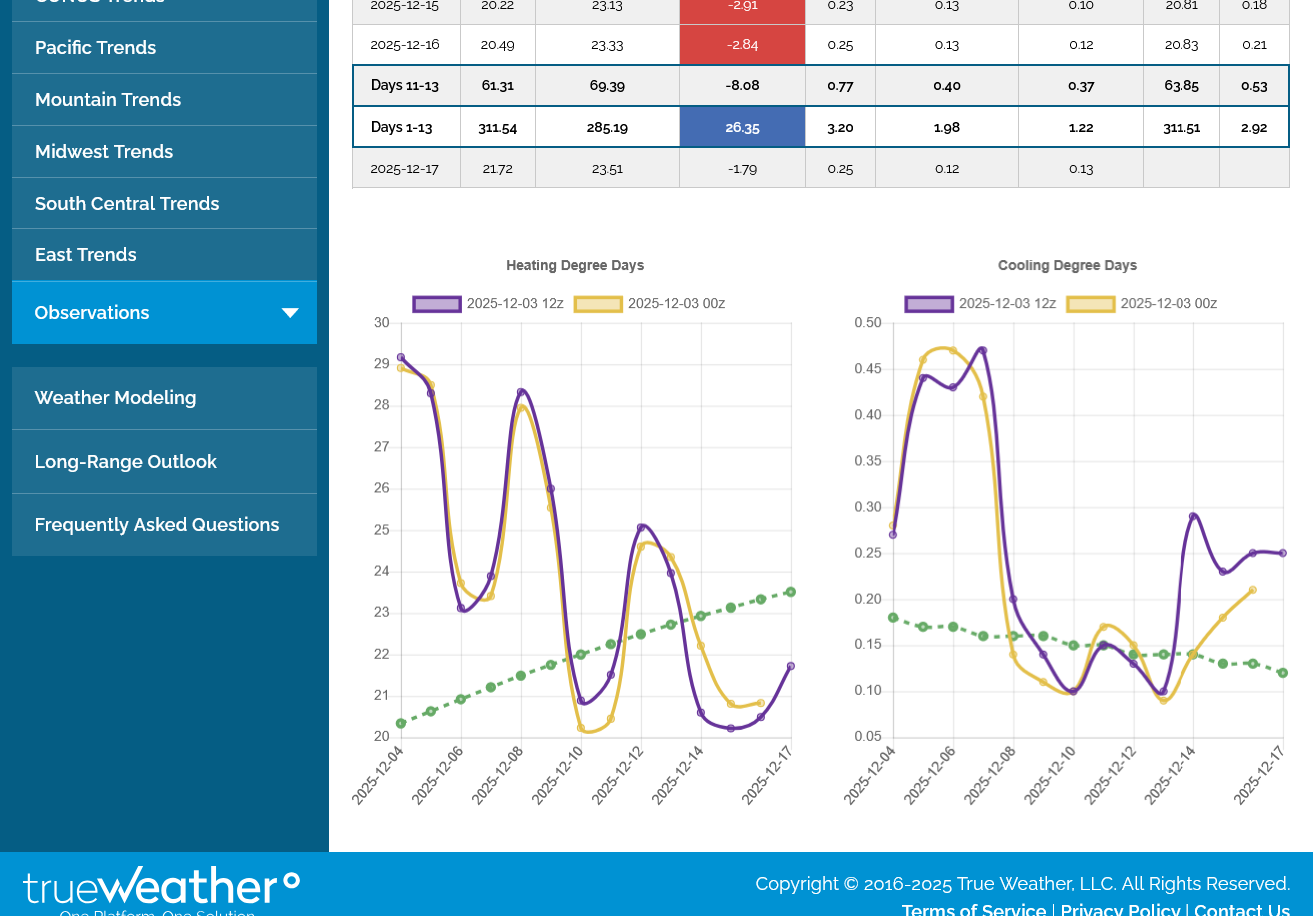
The overnight HDDs were a tad colder from individual days but it doesn’t matter because the market is trading the pattern change to much less cold in week 2. Note the latest HDDs maps that the trajectory in week 2 is DOWN.
Added: This was the last 0z European Ensemble model. It was +2 HDDs....but this was only from individual days being colder. Look at the trajectory of the lines on the left....STRAIGHT DOWN. That's the new milder pattern at work!
This last 6z GEFS is coming out much colder in week 2.
++++++++++++++++++++++
9am: This only caused some colder days in the East, which only delayed the big pattern change to milder I've been pointing to which is what has been pressuring the market lower.
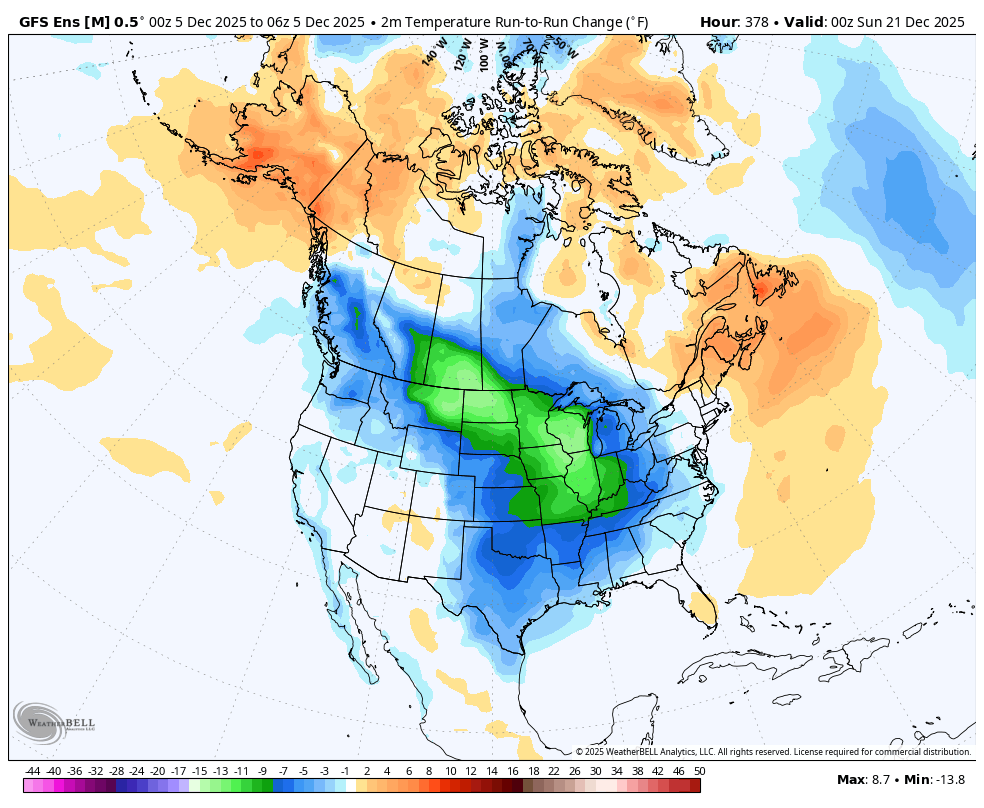
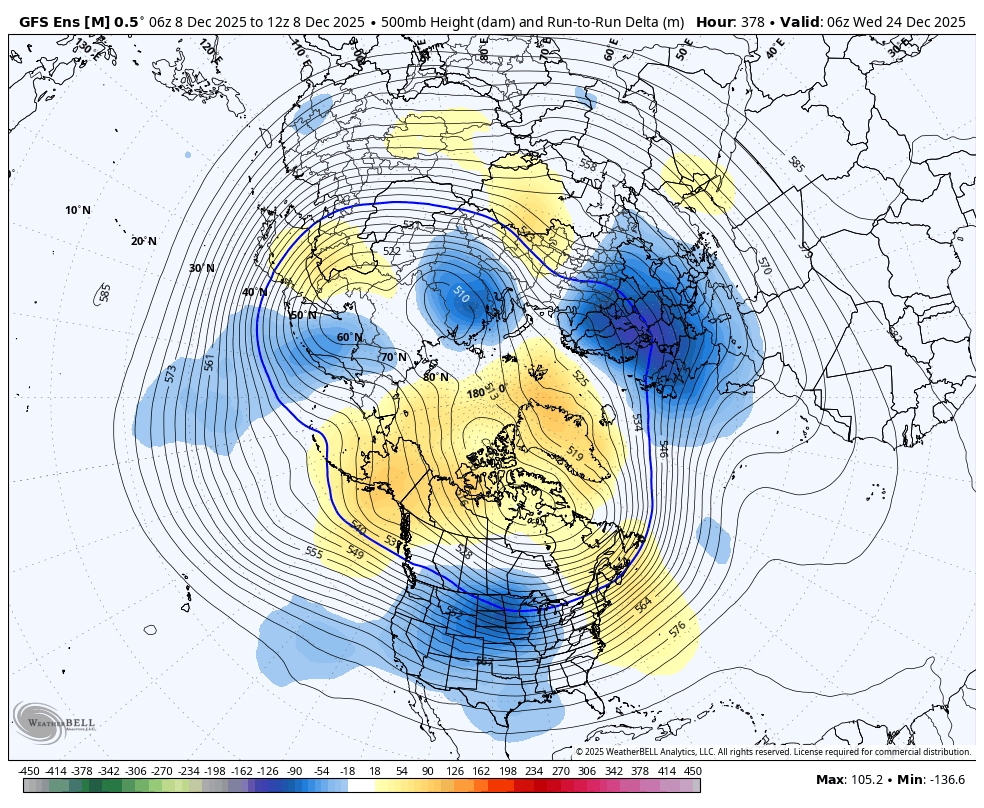
This was the week 2 change I was referring to at the top of the post. The colors are the changes from the previous model.
This is a snap shot at 294 hours
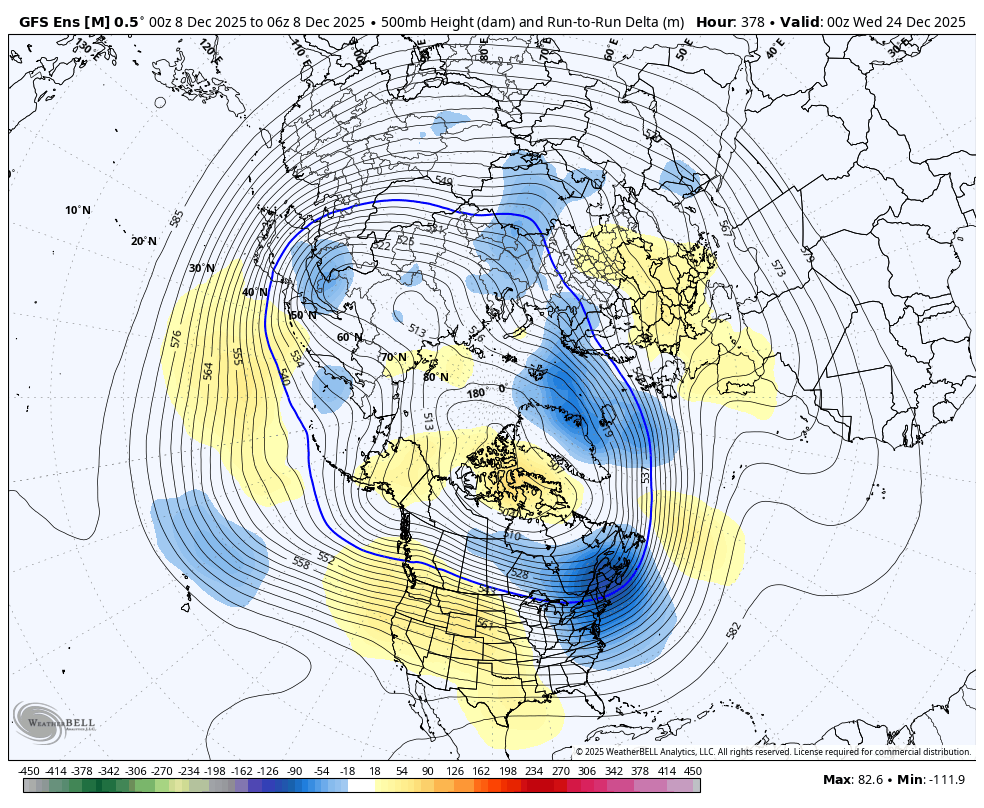
This was the last map at 378 hours. Only the Northeast is still colder as the strong Pacific flow gushes mild air from west to east and ushers out the cold in the new pattern.
Now that we have the overnight session in the rear view mirror we can clearly see that Friday's price action, was in fact a blow off top, panic/exhaustion buying spike higher.
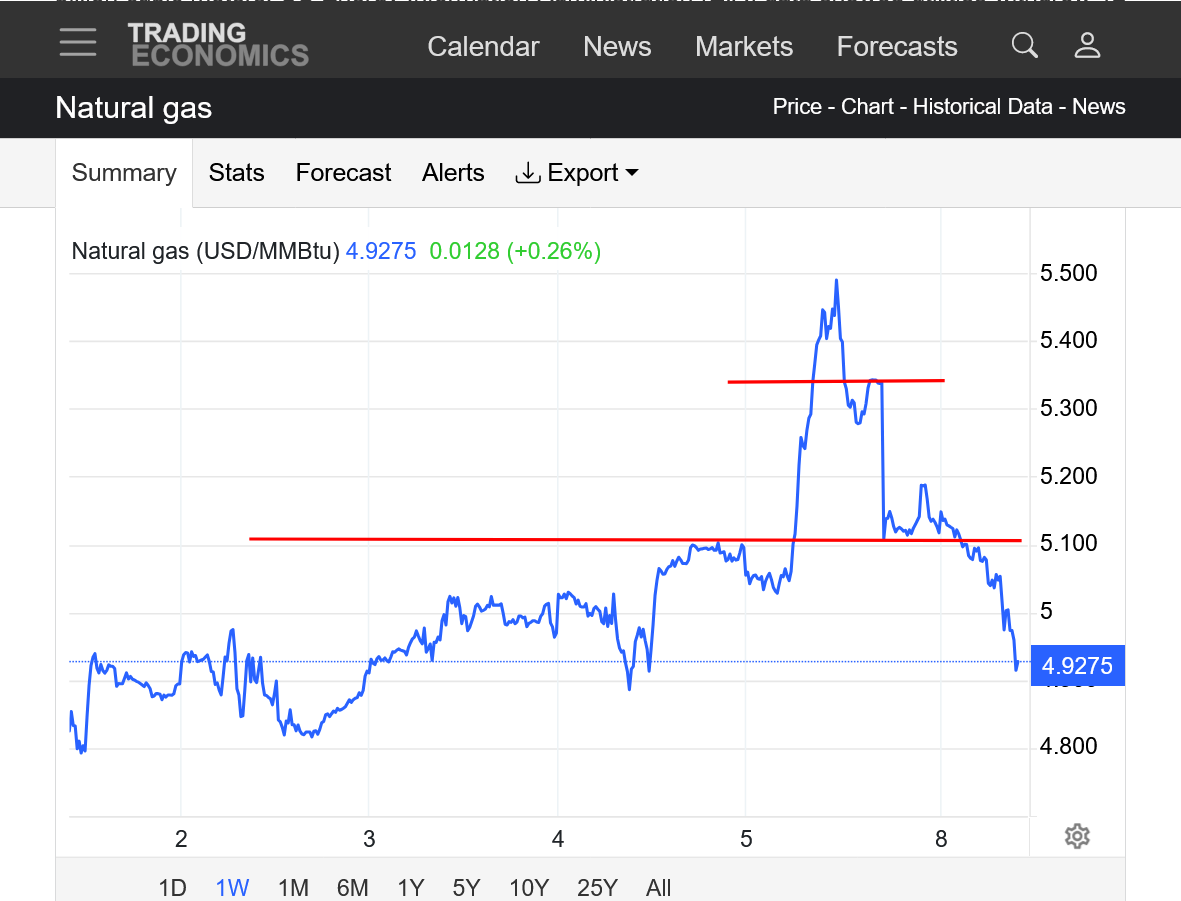
https://tradingeconomics.com/commodity/natural-gas
1. 1 week: Red line at the top was the close on Friday, after the massive spike higher from the blowoff top(from the coldest weather models yet). The lower red line was the SHARPLY LOWER open last night, right at some support but the result of the weather models doing a complete metamorphose with the week 2 pattern being MUCH MILDER. There was a blip/little spike higher to 5.2 yesterday evening to new highs for the session that I can't explain, possibly some sort of news but it was a dead cat bounce because WEATHER FORECASTS RULE NG trading/prices in December.
2. 1 year: We're still WAY above the upside break out level. The previous high was in March of this year. Despite the CONFIRMED blow off top on Friday.
3. 10 years: Still well above the upside break out from the well defined, long term symmetrical triangle(higher lows and lower highs) and at 3 year highs in prices, despite the CONFIRMED blow off top on Friday.
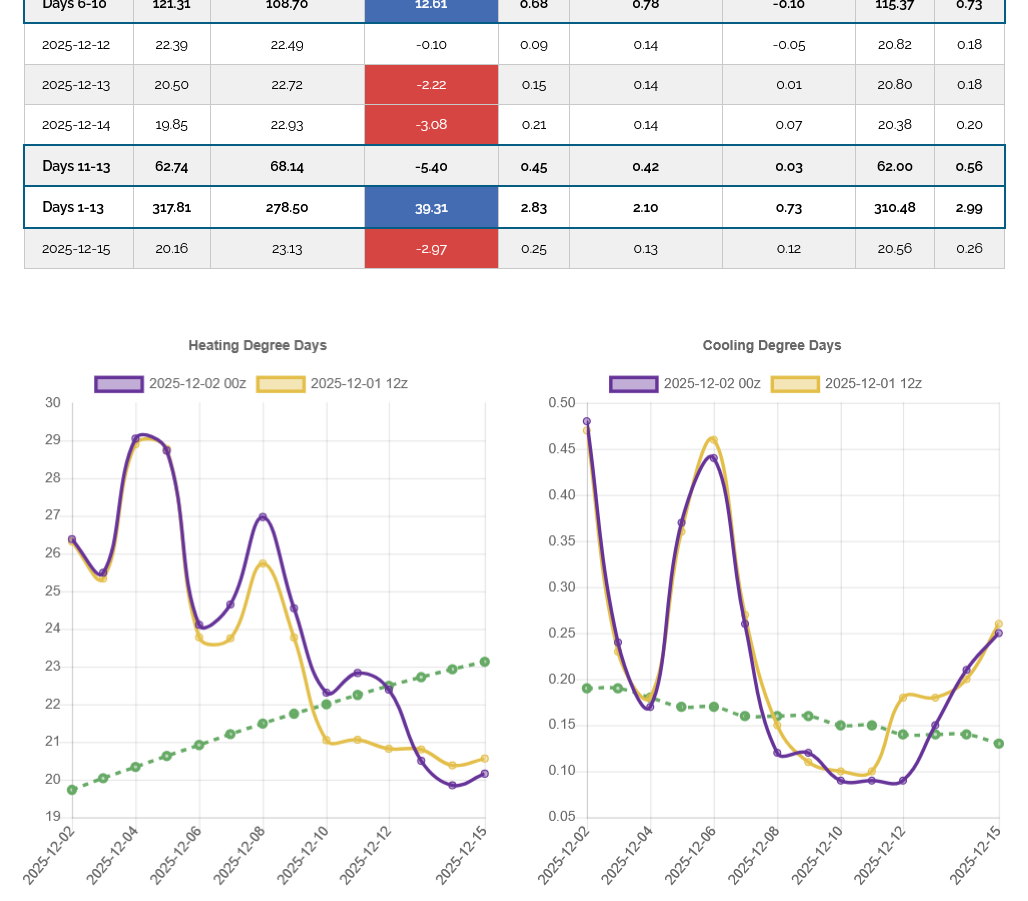
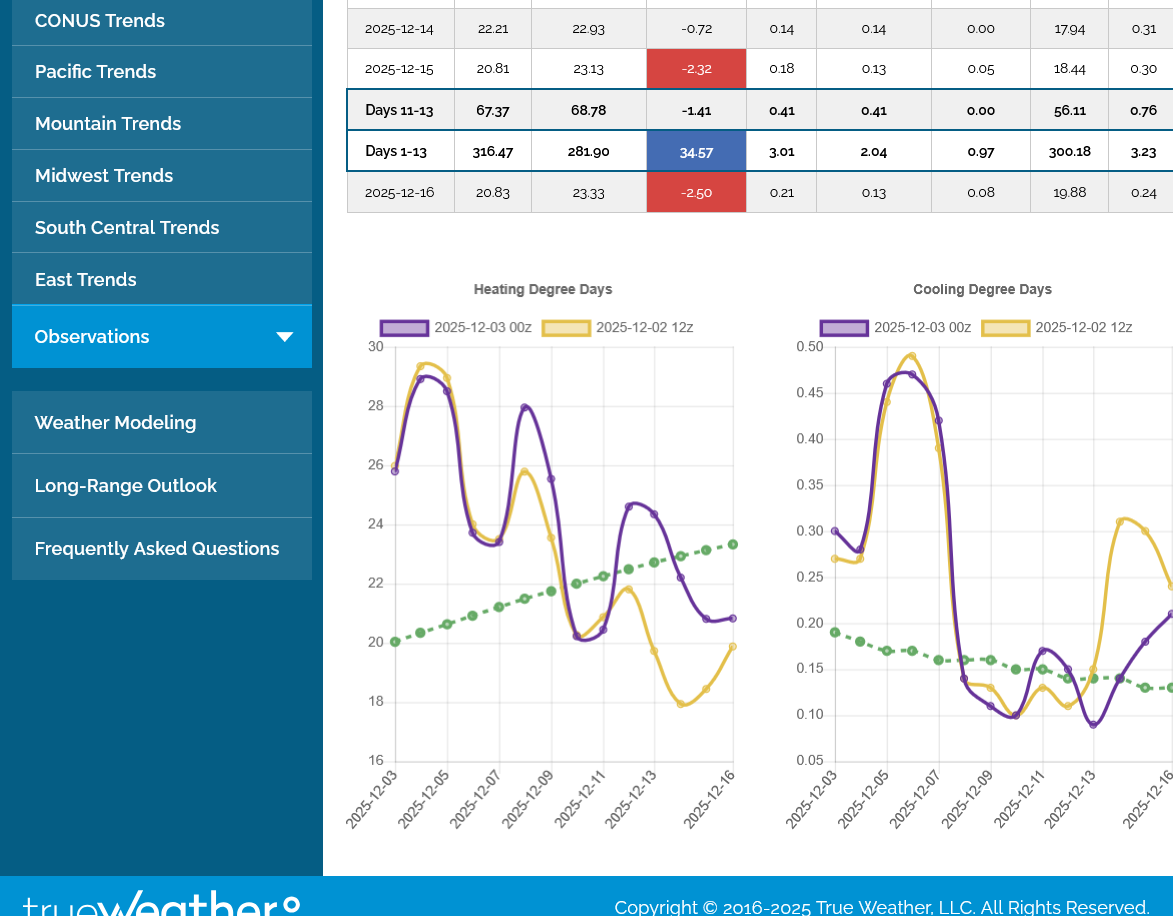
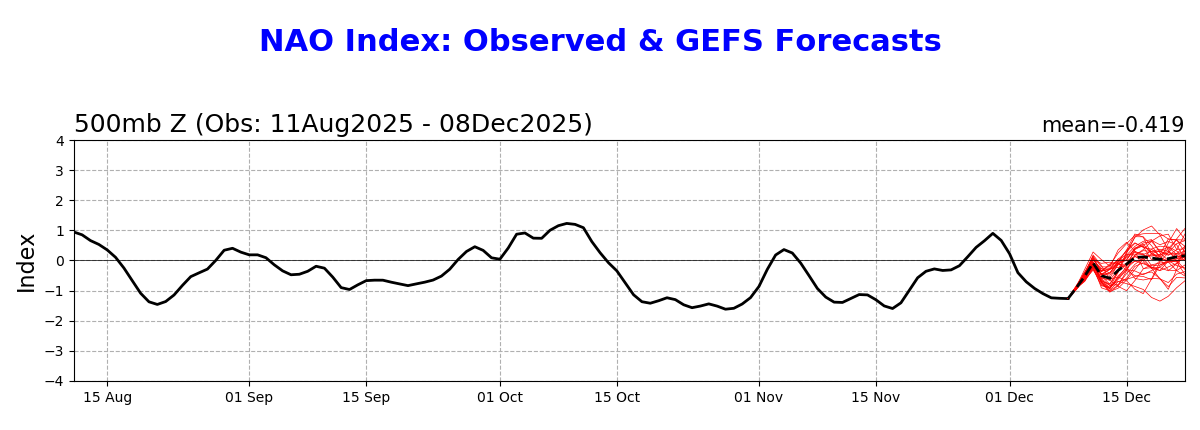
The natural gas market, which is down sharply (6%), currently feels the prospects for a warmer pattern Dec 16th and beyond have increased as Mike so well explained and showed clearly on the 0Z EE HDD chart. But we’ll have to see whether or not this will finally verify well as the EE has been too warm for the last 3 weeks as it has continually been correcting colder as the periods get closer.
Big reasons the models have been much too warm for week 2 in the E US on many of the last 3 weeks of runs are the horrible NAO/AO progs with this one from just 11 days ago having it go + just 1 week later:
11/28 GEFS AO prog for today: ~+1
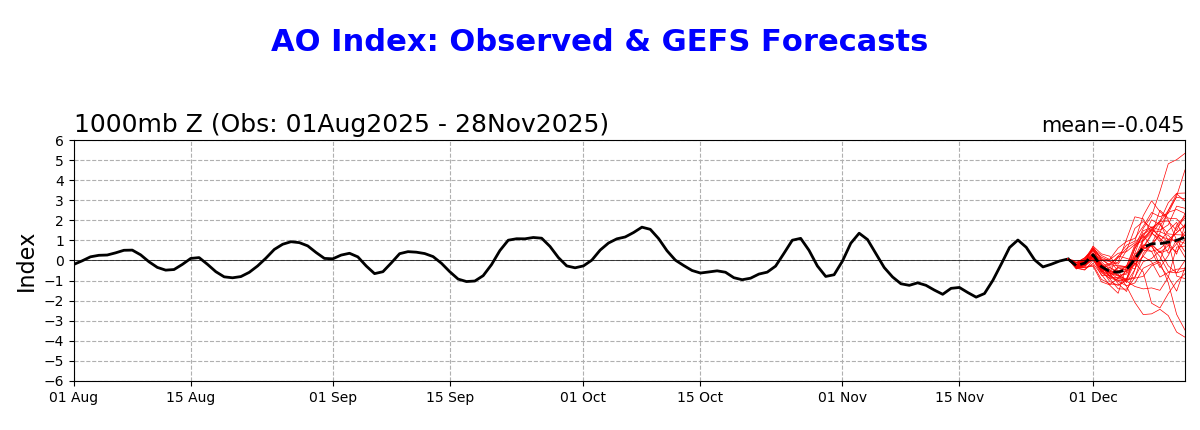
But, today’s AO verified way down at ~-2 (strong -AO) meaning a +3 miss:
—————
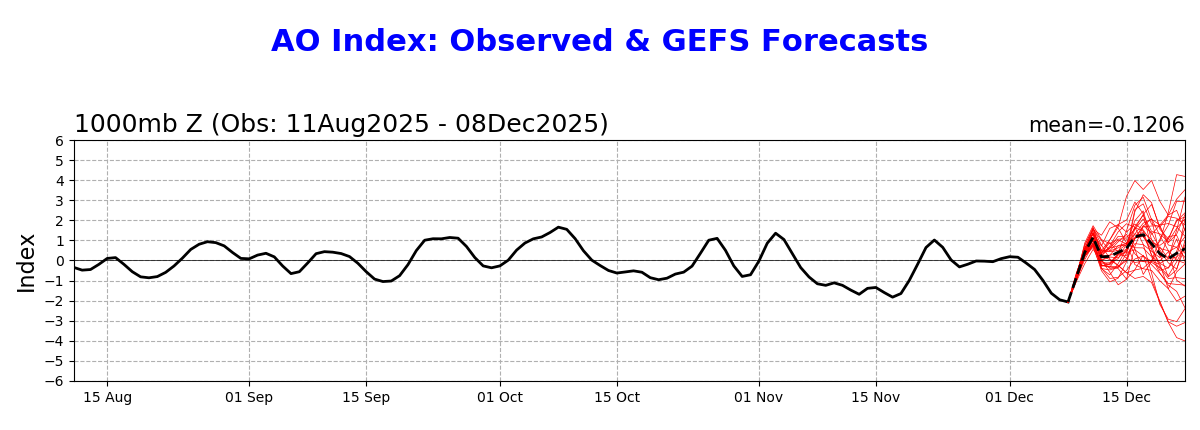
There was a similar big miss for the NAO:
11/28 GEFS NAO prog for today slightly positive (~+0.2):
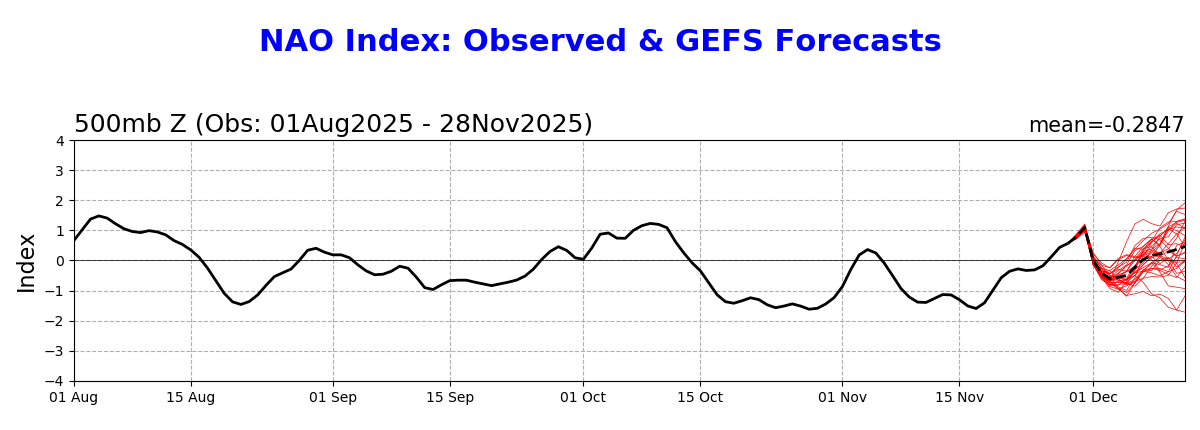
But today’s NAO verified way down at -1.2 (strong -NAO), meaning a +1.4 miss:
Larry,
You are RIGHT ON THE MONEY with this analysis!!
Good for our post of the week!
12-8-25 Post of the week-WxFollower
Started by metmike - Dec. 8, 2025, 12:09 p.m.
https://www.marketforum.com/forum/topic/116449/
++++++++++++++++++
One of the features that I (and others like you) look at every morning is the updated AO and NAO to help us decide on how much cold is coming up with the pattern.
Every morning over the past month, I've looked at the forecast for these indices and thought "this isn't very cold!!!" After a couple of weeks of NOT verifying from being too positive, like you showed, I thought, "this forecast indicator is busted!"
http://appinsys.com/globalwarming/ao_nao.htm
AO BELOW
++++++++++++++
HOWEVER, this time might be different and the pattern change to milder might be REAL!!
The models have really busted badly on the northern stream and higher latitudes which have missed the magnitude of the powerful high in Western North America, trough in Central/Eastern north America couplet
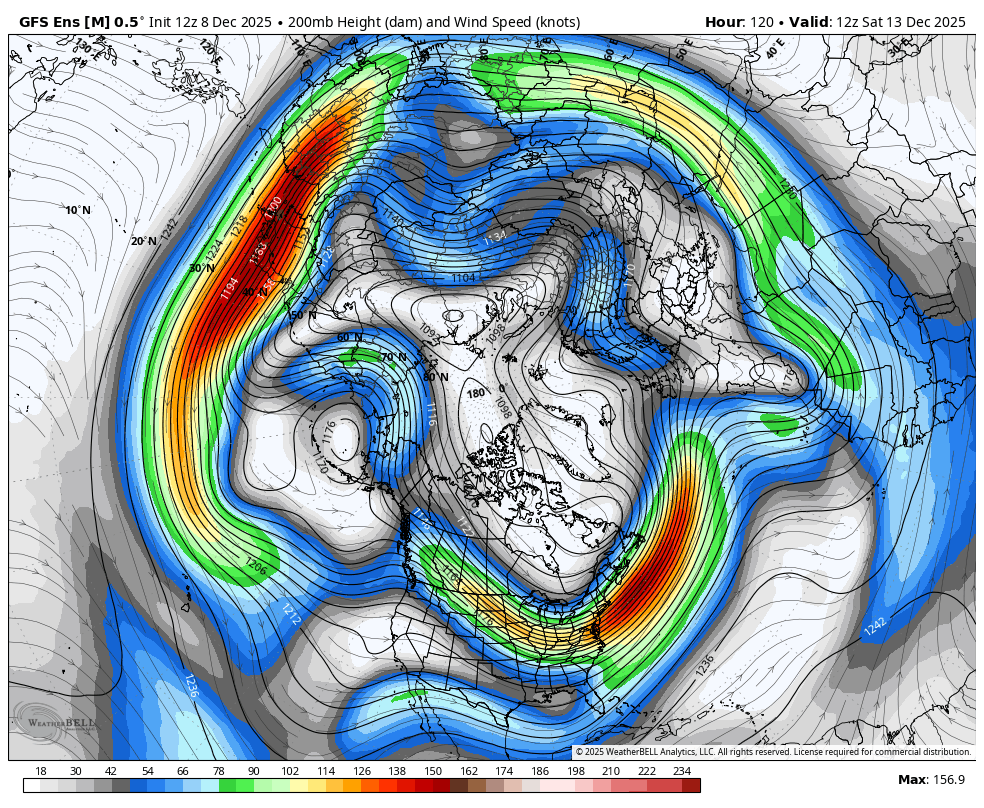
1. This is what it will look like in 5 days, from the last 6z GEFS, with its LAST GASP. This is the jet stream at 35,000+ feet above the ground. Note that this high/down stream low/trough couplet features a strong north to south component in the steering currents, transporting Frigid air from high latitudes south to the middle latitudes. This has been the dominant UNDER forecast flow the past month.
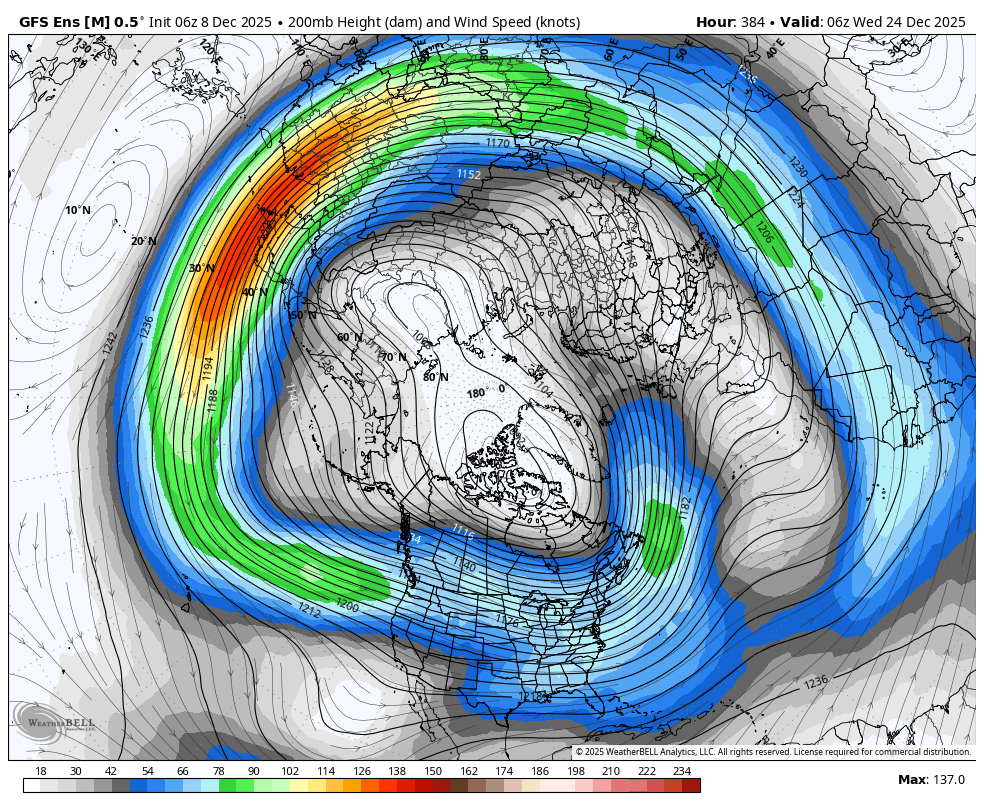
2. This is the same forecast going out to day 16 at the end of the period. A profound change in the flow!! The NEW pattern will feature mild, oceanic origin air masses blowing Pacific air from west to east across the country. The northern stream and cold air connection from the couplet on the first map is completely gone. It's a huge pattern chance! I'm believing it this time because its so definitive on all the models despite all the models UNDER forecasting the northern stream for a month.
Even while the models were busting badly on their forecasting the AO and NAO too high, their ensembles always had at least several members that had it exactly right. The European Ensemble model, for instance has 50 different members, separate solutions with a few of the mathematical equations(that represent the physical laws of the atmosphere) tweeked to get 50 different opinions.
The last 12z Canadian model with its individual members at the link below have ZERO solutions that take us back to the colder pattern we've had.
That sort of completely united, 100% consensus lends great credence to the much milder forecast.
https://weather.gc.ca/ensemble/charts_e.html?Hour=384&Day=0&RunTime=12&Type=gz
+++++++++++
That being said, the LOW SKILL operational GFS just came out with a 12z forecast, last 500 mb map at 16 days that looks like this.
Normally this would be completely ignored as an outlier.
However, considering how badly the models have done via UNDER forecasting cold the past month, I'll give this a small amount of weighting even though it deserves to be ignored.
I'm going to guess that's what caused a quick spike up off the lows of $800/contract.
The red line below was the price before the map(s) above came out.
12:30 am:
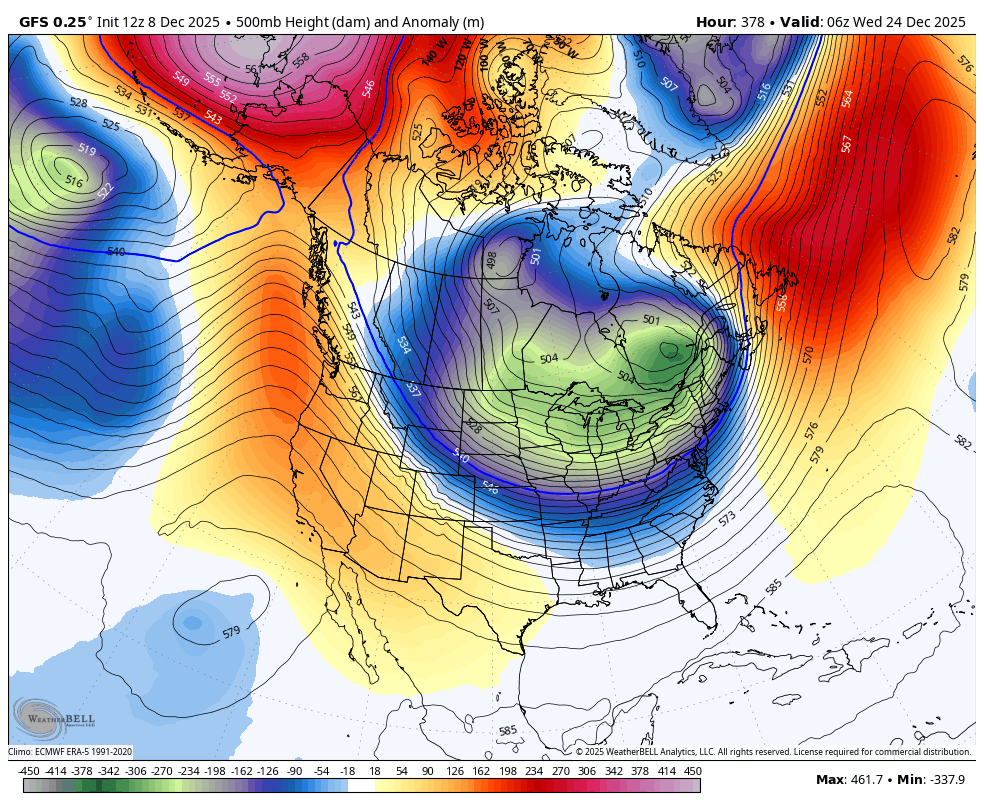
This map at the end of the 12z ENSEMBLE from the GFS model is interesting. This is how the colder changes has started in the past. Positive anomolies growing again in Alaska, negative anomalies increasing in the United States at the other end of the cold couplet.
Maybe we morph back cold at the end of 2 weeks and back to the long lived couplet again if this is right?? I give it some weighting but with skepticism right now.
Now, the HDDs have been getting more and more bearish, the opposite of the last month.
Purple on the left was the last 18z GEFS, -9 HDDs vs the previous run.
The 0z GEFS HDDs were a whopping +15 HDDs from colder individual days(temporarily stopping the crash lower). Then the 6z GEFS was an even more whopping -18 HDDs bearish and we crashed to new lows.
NG continues to collapse lower from Friday's blow off top that featured panic buying/short covering AT THE MARKET on record obliterating volume. We are down $10,000/contract in the last 2 trading sessions from Friday's spike high!!!
See the detailed analysis of that above while it was developing and interpreted above BEFORE it was confirmed with the current enormous price drop.
I only made a tiny bit of money being short Sunday Night(using the WEATHER set up and big pattern change to milder that I described) and didn't want to make tjc feel bad by posting it after he told us that he went long on Sunday Night.
https://tradingeconomics.com/commodity/natural-gas
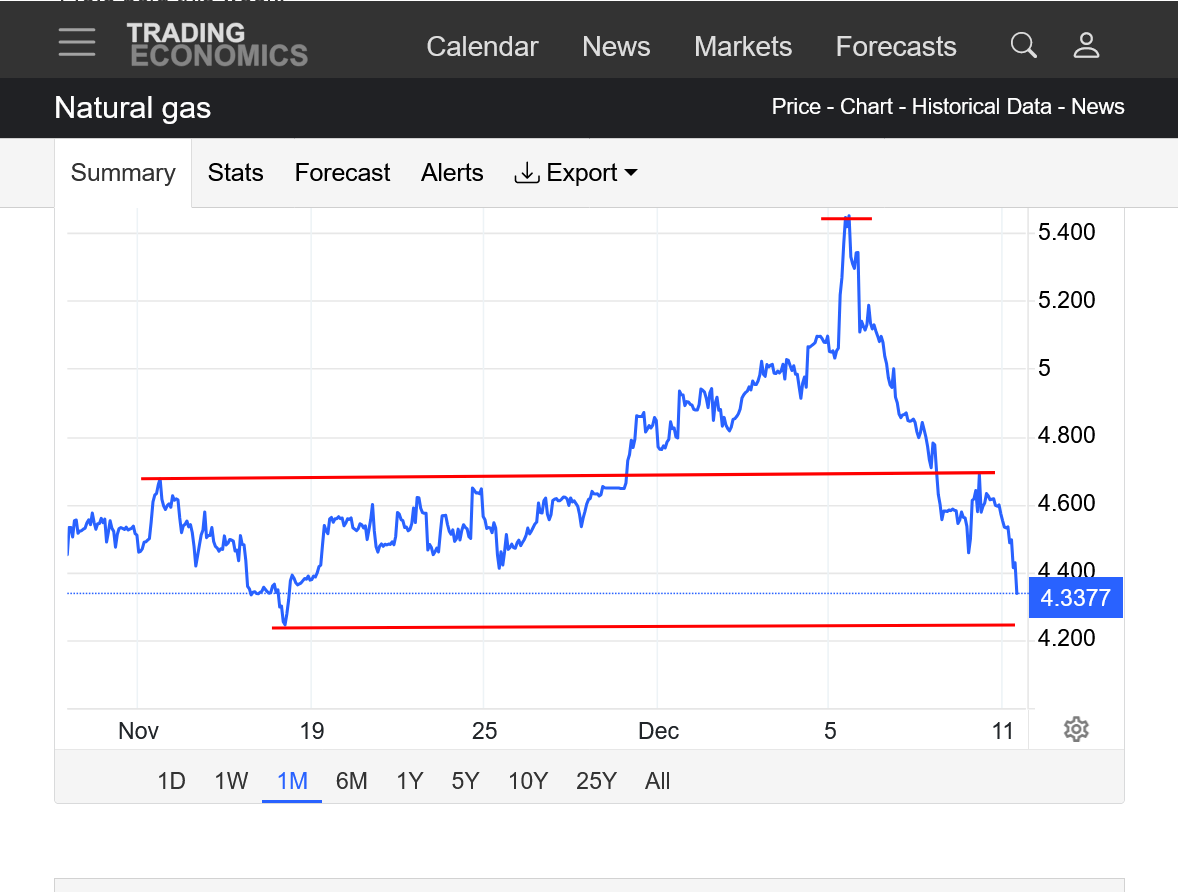
1. 1 week: WOW! Blow off top from the most extreme cold on models Friday. Collapse lower from an incredible change to milder that started overnight Saturday. -$10,000/contract since the top!
2. 1 month: Blow off top on Friday. Now dropping below some old resistance and previous November highs.
3. 1 year: Still above the March 2025 highs.
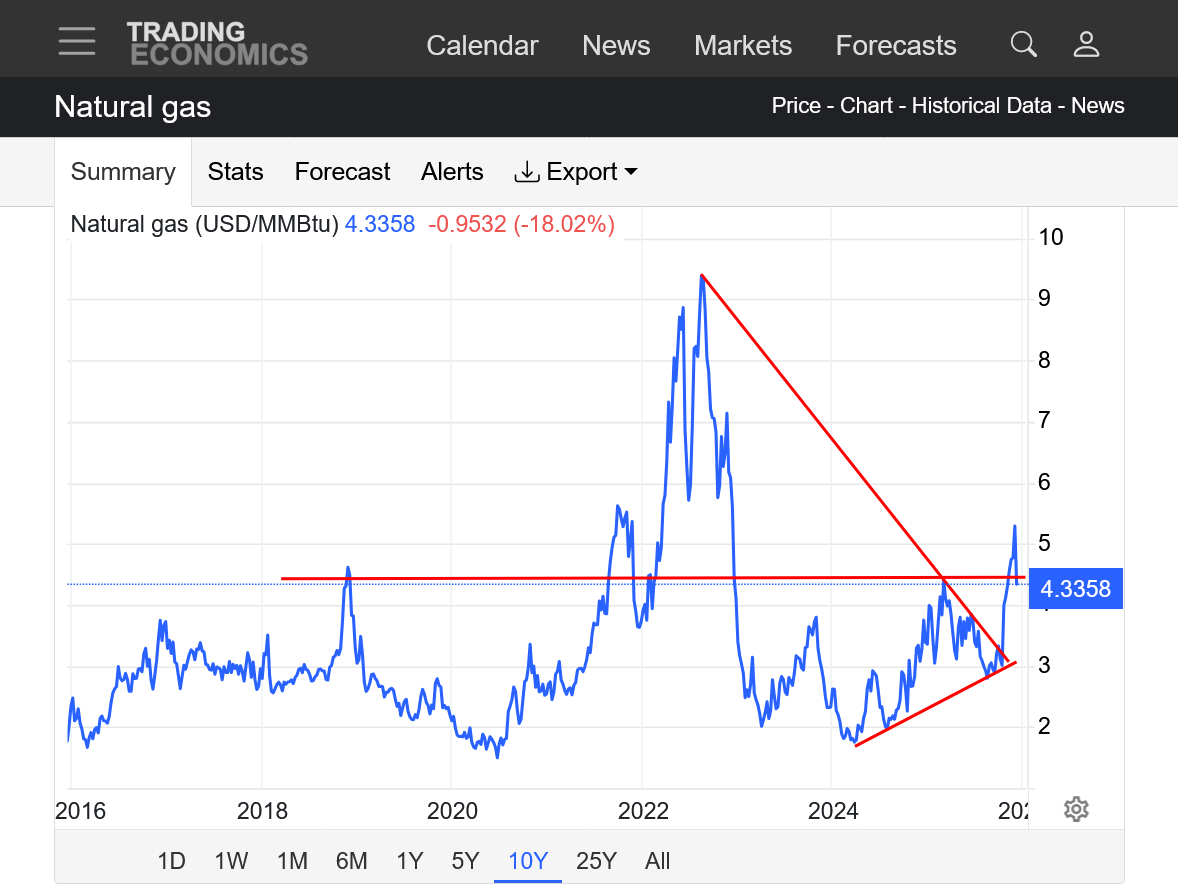
4. 10 years: Still shows the upside break out from the longer term symmetrical triangle(lower highs-higher lows). Still barely above the March 2025 highs.
MetMike
I specifically said--Watching
You are a victim of your own success, pretty much always right, but "nervous"
Old adage--let your winners run!
You nailed it--my goodness.
"Wanted " to buy silver call, thought it "too expensive"---now $10,000 later was pretty cheap.
Very 'easy' to be right---MOST difficult to make money
Must properly compliment you for a great ngas forecast. Wow, if one were only on it from Friday close OR immediately Sunday night, VERY well done.
Any chance for a bounce back? After all, 50% back is a great move itself!
Silver is setting itself up for a blowoff top, but when/where!
Thanks, tjc!
As soon as the next pattern changes back to cold materializes, then NG WILL bounce back.
However, it will have to be a long lived/sustained cold lasting for more than a week to get back most of the losses.
The later it is in the weather trading season, the harder it is to generate interest from large specs who will buy on bullish weather. Same thing in the grains. Basically, you're gradually closing the window/time frame for the weather to have an impact on (residential demand for ng) and (supply for crops).
With corn/beans in May/June for instance, we can still kill the crop. In August, dry/hot will take off some yield during filling but most of the yield was determined.
Same thing in NG. In November/December, frigid weather that lasts most of the Winter can draw down storage to low levels by the end of the heating season. That actually happened last Winter from sustained cold. Market participants remember this too the following year, which has added to the extreme bullishness early this season and that contributed to the move that ended with the blow off top last Friday.
It was waaaay overdone. In just 2 days, we got back down to prices that are more justified but maybe this spike down was a bit excessive? If it stays warm into January, then we will go lower still.
We can go back up by XX% amount but it will get tougher to generate the interest it did before if it's January and half the Winter is over. Time is running out to erode the amount in storage with sustained cold.
In February, unless storage is already drawn way down, it's almost impossible to do what the same cold did in December. The market knows the drawdown season is on borrowed time.
By late March, an interesting dynamic kicks in. A strong positive seasonal kicks in by late in the month that lasts until early June. Everybody knows this seasonal and it reinforces itself from the law of self fulfilling prophesies. Traders know NOT to be short NG in April/May. As a result, a major cold shot in late March with a big drawdown can actually be extra bullish fuel for this positive seasonal in some years.
Wonderful recap!
I recall your prior cautionary memos reflecting the same sentiments on early cold is bullish, mid season not so much (if at all).
So...look to sell a retracement!
thanks, tjc,
we can always keep learning new things, no matter how much we know or think we know.
one of the things I learned from this blow off top related to the volume in natural gas. I normally don’t follow this metric but tracked it on Friday because I realized we were having a blow off top and volume is a big indicator.
It ended up being well over 300,000 contracts for just the front month. I’m not sure what the average is but that was extreme.
Heres what I learned. With the volume stat, we also get the open interest, which is the number of total positions held. I’ve followed the open interest and volume enough in the past to know that open interest is almost always HIGHER than the volume on any 1 day.
Last Friday, I was blown away that the NG volume was HIGHER. than the open interest. I assumed it was from the blow off top with every other market having the OI higher than volume.
So the past 2 days I e been looking at these metrics more than I have in awhile because of the blow off top.
All the other markets have more OI than volume in the front month……but only NG has more volume than OI!
Hmmmmm.
This suggests NG has more day trading of the front month than the others?
Or is this related to something else? I’ll have to check but imagine this is not the case for the back months.
And maybe this very high volume is mainly just from the extreme volatility and wide daily ranges. Think about it. If the price stays in a tight range, the volume is limited to only those that want to buy/sell in the tight range.
When we have a huge move in 1 direction, instead of traders setting a price to sell or buy at, we have a way lopsided, huge group of traders that don’t care about price……they want out or in AT THE MARKET! As a result this forces the market to go up or down ALOT to seek out the number of contracts from traders to match the lopsided sell or buy at the market orders.
Many of those are resting orders and usually the greater the price swing in one direction is, the BIGGER the size of the resting order is.
So the huge moves have to blow thru bigger and bigger resting orders to meet the at the unbalanced market orders in 1 direction.
That defined Friday and Monday as we might expect because of the monster moves.
Not sure what is the normal for front month NG But I will be watching more this season
+++
I just checked and Feb NG only has half the .volume as the OI and still less OI as the Jan. This was expected.
Probably in a week or so the OI in the Feb will top the liquidating OI of the Jan and Febs volume will rapidly be picking up.
All that is expected but I’m still shocked that volume for Jan NG has been exceeding the OI, the only commodity today doing that.
The 0z European Ensemble model was almost another -7 HDDs compared to the previous 12z run from 12 hours earlier. So NG is tanking more. -$2,500/contract!
https://tradingeconomics.com/commodity/natural-gas
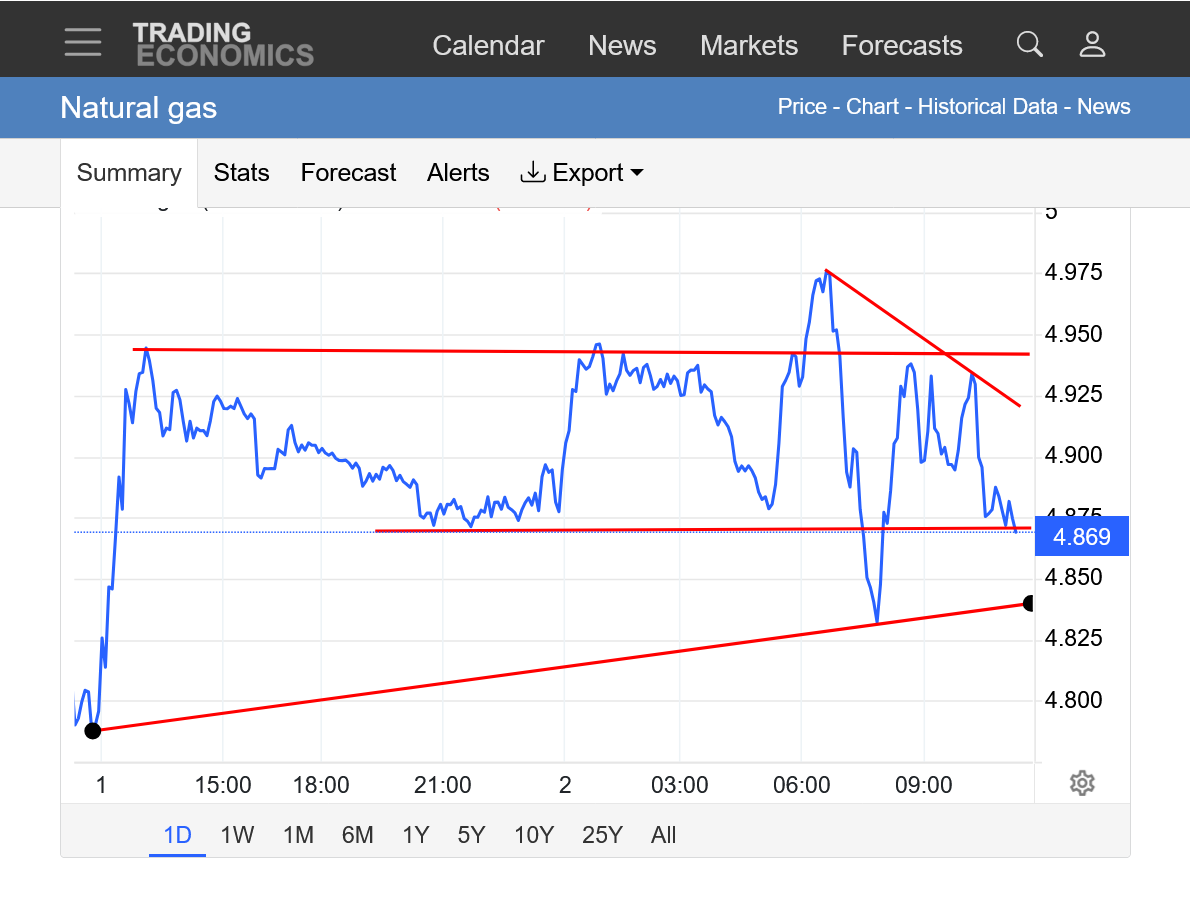
1. 1 week: Blow off top and 6 different wimpy dead cat bounces(tiny bull flags/waves) that interupted the incredible plunge since Friday's capitalization/buying exhaustion.
2. 1 month: Fake break out. Below the November high/breakout. Approaching some support but continued warmer forecasts will smash thru that too.
3. 1 year: Fake break out, below the March high bullish breakout point. Where might this drop stop? Entirely dictated by the weather pattern and forecast updates. Red lines only tell us WHAT HAPPENED ALREADY but can't forecast where we are going. The market will react almost entirely to powerful weather patterns and changes in the TEMPERATURE FORECASTS.
4. 10 years: The breakout from the long term symmetrical triangle is still valid but all th other formations are MEGA bearish.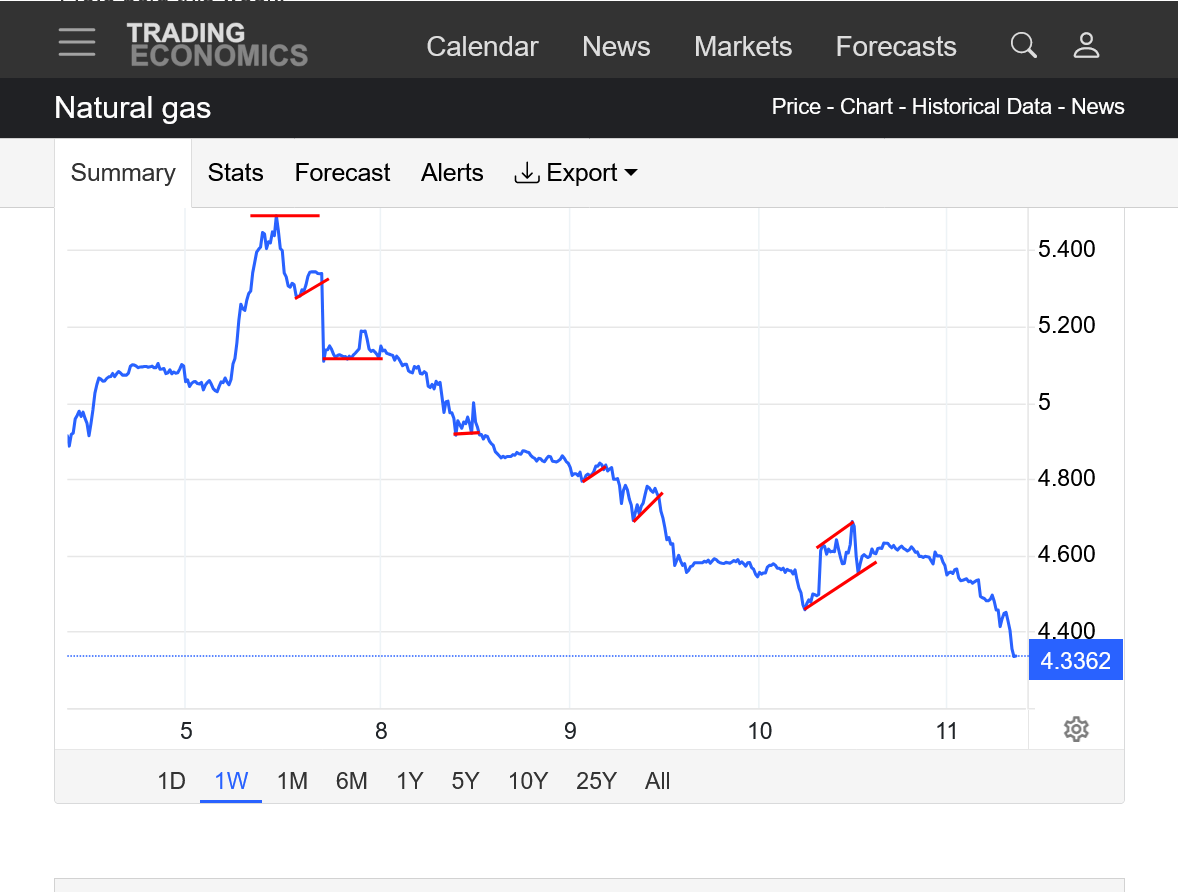
-177 Bcf. Maybe the biggest drawdown so early in the heating season ever? What do you say, Larry?? A tiny spike up in response that won't go anywhere without the forecasts turning colder. The blue line on the graph below took a sharp turn downward but is still above the 5 year average for 1 more week. The next 2 weeks will feature massive drawdowns but the market traded that LAST WEEK with the blow off top!!!!
As Joe K. used to say...........these are FUTURES markets not PASTures
The market is NOW trading the next 3 weeks of weather ahead.
![]()
for week ending December 5, 2025 | Released: December 11, 2025 at 10:30 a.m. | Next Release: December 18, 2025
| Working gas in underground storage, Lower 48 states Summary text CSV JSN | |||||||||||||||||||||||||
|---|---|---|---|---|---|---|---|---|---|---|---|---|---|---|---|---|---|---|---|---|---|---|---|---|---|
| Historical Comparisons | |||||||||||||||||||||||||
| Stocks billion cubic feet (Bcf) | Year ago (12/05/24) | 5-year average (2020-24) | |||||||||||||||||||||||
| Region | 12/05/25 | 11/28/25 | net change | implied flow | Bcf | % change | Bcf | % change | |||||||||||||||||
| East | 843 | 888 | -45 | -45 | 864 | -2.4 | 861 | -2.1 | |||||||||||||||||
| Midwest | 1,030 | 1,088 | -58 | -58 | 1,064 | -3.2 | 1,049 | -1.8 | |||||||||||||||||
| Mountain | 277 | 288 | -11 | -11 | 283 | -2.1 | 230 | 20.4 | |||||||||||||||||
| Pacific | 306 | 315 | -9 | -9 | 303 | 1.0 | 276 | 10.9 | |||||||||||||||||
| South Central | 1,290 | 1,345 | -55 | -55 | 1,259 | 2.5 | 1,227 | 5.1 | |||||||||||||||||
| Salt | 354 | 371 | -17 | -17 | 343 | 3.2 | 339 | 4.4 | |||||||||||||||||
| Nonsalt | 936 | 974 | -38 | -38 | 916 | 2.2 | 887 | 5.5 | |||||||||||||||||
| Total | 3,746 | 3,923 | -177 | -177 | 3,774 | -0.7 | 3,643 | 2.8 | |||||||||||||||||
| Totals may not equal sum of components because of independent rounding. Notice: On Friday, December 12, the U.S. Energy Information Administration will execute a second test of our new information release system for weekly data products. We will again release a mock version of the Weekly Natural Gas Storage Report through our test server. Please visit https://irtest.eia.gov/ to learn how to participate and provide feedback. Remember that for our weekly releases of the Weekly Petroleum Status Report and Weekly Natural Gas Storage Report, the only valid location to retrieve data is from https://ir.eia.gov. The only place to receive mock data for test releases is https://irtest.eia.gov/. Please ensure that your bots are programmed to use these sites to eliminate errors in data retrieval. | |||||||||||||||||||||||||
Working gas in storage was 3,746 Bcf as of Friday, December 5, 2025, according to EIA estimates. This represents a net decrease of 177 Bcf from the previous week. Stocks were 28 Bcf less than last year at this time and 103 Bcf above the five-year average of 3,643 Bcf. At 3,746 Bcf, total working gas is within the five-year historical range.
For information on sampling error in this report, see Estimated Measures of Sampling Variability table below.
Note: The shaded area indicates the range between the historical minimum and maximum values for the weekly series from 2020 through 2024. The dashed vertical lines indicate current and year-ago weekly periods.
++++++++++++=
9:45 am:
1 day: Here's the little blip higher from the bullish EIA number above:
Mike asked me: -177 Bcf. Maybe the biggest drawdown so early in the heating season ever? What do you say, Larry??
——-
Mike, I don’t have 2020-2024. But before that going back to 1994:
12/16/16: -209 on 217 Fri-Thu HDD
11/21/14: -162 on 214 HDD
11/29/13: -162 on 200 HDD
12/13/13: -285 on 253 HDD and included -14 for freeze offs
12/11/09 -207 on 221 HDD
12/8/06 -168 on 198 HDD
12/9/05 -202 on 233 HDD and -18 for Katrina/Rita shut-ins
12/6/02 -162 on 187 HDD
12/8/00 -158 on 208 HDD
So, these give one an idea of the largest draws so early in the season. However, none are as high as today’s report’s -177, which is as of 12/5/25. I’d say though that -162 on 11/21/14 and especially -285 on 12/13/13 are more impressive for the date.
But again, these exclude 2020-4 since I stopped documenting them in 2020, unfortunately.
Thanks very much, Larry!
Now that I think about it, I kept records in the 1990's and will go back to see what they showed.
In checking my records, I found numerous pages from posts that Larry E. made about natural gas stats that I printed out from 15 years ago and before that.
Does anybody know who Larry E. was
I cherished some of your natural gas statistics posts enough back then to actually print them out and save them, Larry!
Also remember your guessing natural gas EIA number contests!
+++++++++++++++++++
The way I saved the data that I'm looking at did not have the actual dates but had which week in the year it was so it was easier to compare all the data for just that week.
In this case, the data was for week 49. Confirming what you stated, week 49 in 2002 was -164 and in 2000, it was -147.
My records only go back to 1996 though and if you remember, the mid/late 1990s featured some very mild Winters.
For week 49, the biggest drawdown during that period was -69. In 1998, we had an incredible INJECTION of +27 Bcf for that week.
I don't think there are records for the 1980's but I'm positive that mid/late December 1989 had the greatest drawdowns of HO and NG for December in history, probably by a wide margin.
I watched heating oil prices more than double and spike extremely high (natural gas was not traded then) and it was a huge reason for why I decided to change my career from broadcast/television meteorology to trading commodities impacted by weather for a living. I opened my first account in January 1992 with $2,000 at Ira Epstein because they were the only firm that would take less than $5,000 and we didn't have $5,000.
I've described my incredible success in turning it to 500K at one point(AFTER taking out money for our expenses). Life was great in the 1990's when I had a satellite dish on the roof getting the data an hour before the market did and before the huge funds made it crazy, them now using in house models that get the data even faster than me.
That is no more for metmike, especially after I had all my money stolen at MF Global in 2011, then the returned money AND borrowed money stolen at PFG Best in July 2012.
Anyways, back to the weather.
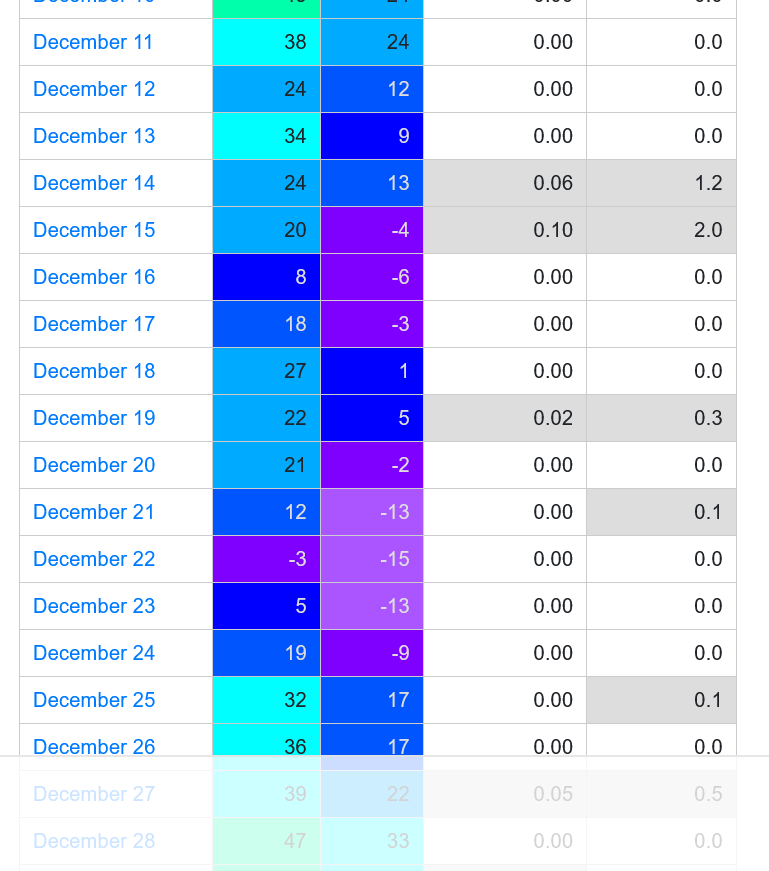
https://www.extremeweatherwatch.com/cities/evansville/year-1989
Lowest Temperatures in Evansville in 1989
| Rank | Temperature | Date |
|---|---|---|
| 1 | -15 °F | December 22 |
| 2 | -13 °F | December 23 |
| 2 | -13 °F | December 21 |
| 4 | -9 °F | December 24 |
| 5 | -6 °F | December 16 |
| 6 | -4 °F | December 15 |
| 7 | -3 °F | December 17 |
| 8 | -2 °F | December 20 |
| 9 | 1 °F | December 18 |
| 10 | 5 °F | December 19 |
Hey Mike,
Well now I can give you the full answer as to whether or not the -177 for the week ending 12/5/25 was the biggest draw on record for that week. I looked at the EIA site’s weekly data in 2020-24. The answer is no. When was it higher? Only one time since 1994 it appears and that just happened to be last year when there was -190 for the week ending 12/6/24! Average guess was ~-165 to -168 making it solidly bullish vs expectations:
https://www.nasdaq.com/articles/eia-natural-gas-storage-change-week-ending-december-6
https://mansfield.energy/wp-content/uploads/2024/12/December-16-2024.pdf
How about that, Larry!
Thanks for checking. I remember that last Winter featured some huge drawdowns that I thought came during 3 distinct periods of sustained cold with mild breaks in between.
However, I forgot about this week and it might be because my Dad passed away in late November 2024 and I was in Detroit for much of November and not following the weather as close.
We started chess late last year too after Dad passed away.
Hey Mike,
That makes sense as one year ago you couldn’t possibly be in your normal routines.
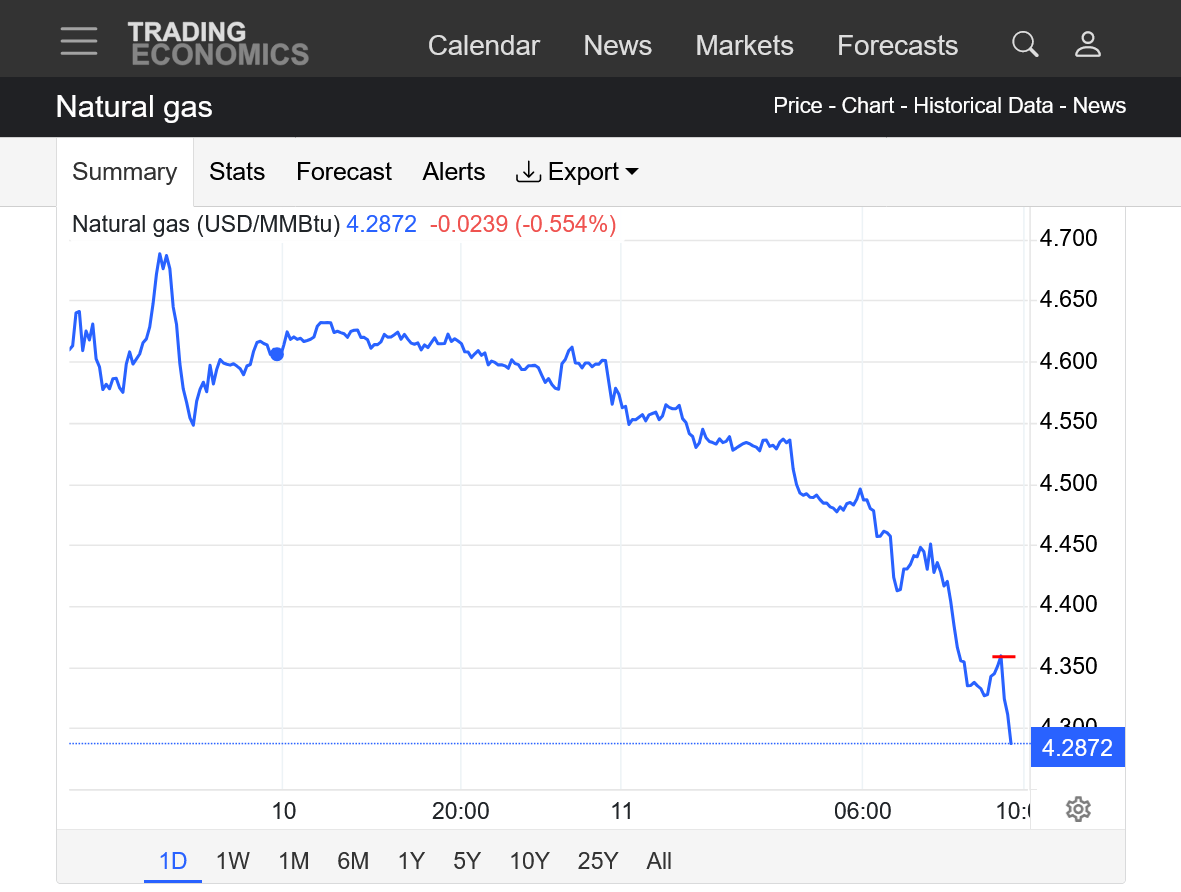
NG is down a whopping 25% since the peak of 8 days ago. Do you know the last time NG dropped that % in 8 days?
Larry, a drop of 25% in 1 week might be THE record for such a short period.
2022 had a spike down from 9+ to 6 but it took from August to October.
There were also bigger drops in the 2000's but they took months. The magnitude of this move in 1 week looks unprecedented.
This appears to be the nature of extreme speculative trading in 2025. Every day this week, the front month of natural gas(Jan) is the only one with volume that exceeds open interest every day. There's likely some unique trading dynamics at play. I'm thinking massive liquidation of longs is a huge one.
Volume for NGF today, however is less than half what it was last Friday for the blow off top, which probably featured massive SHORT covering.
I note 1 exception today. Unprecedented silver prices are having a huge spike down today and the volume is also much greater than the OI.
https://www.eia.gov/dnav/ng/hist/rngwhhdm.htm
.png)
+++++++++++
The last 0z European Ensemble model was another -4 HDDs bearish.
Note where the lines are compared to the average green after this spike up over the weekend. Every new day, just adds another bearish number at the end of the forecast that replaces the current short term bullish number.
New NG thread here: