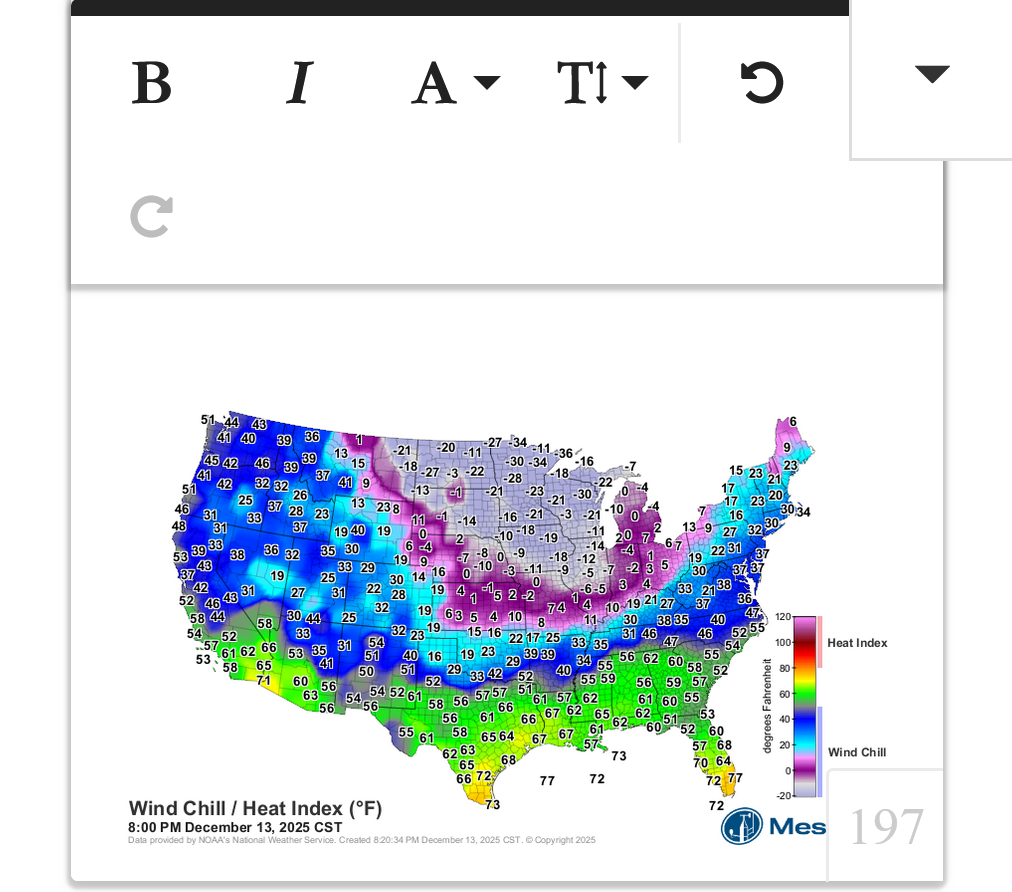
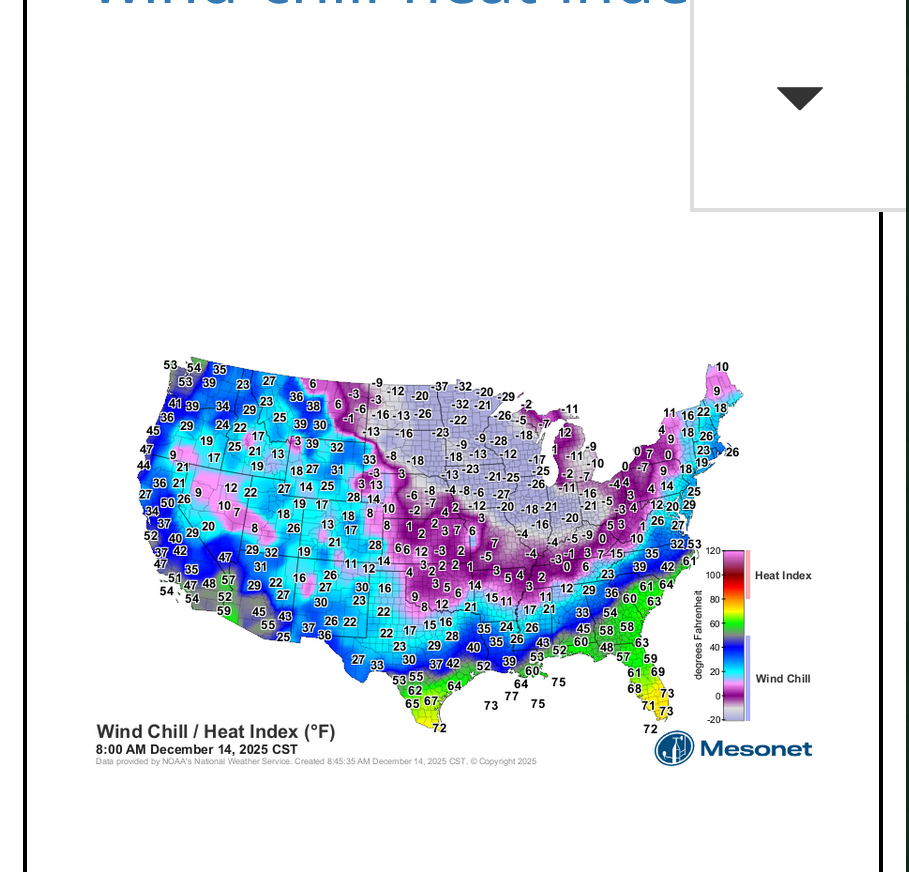
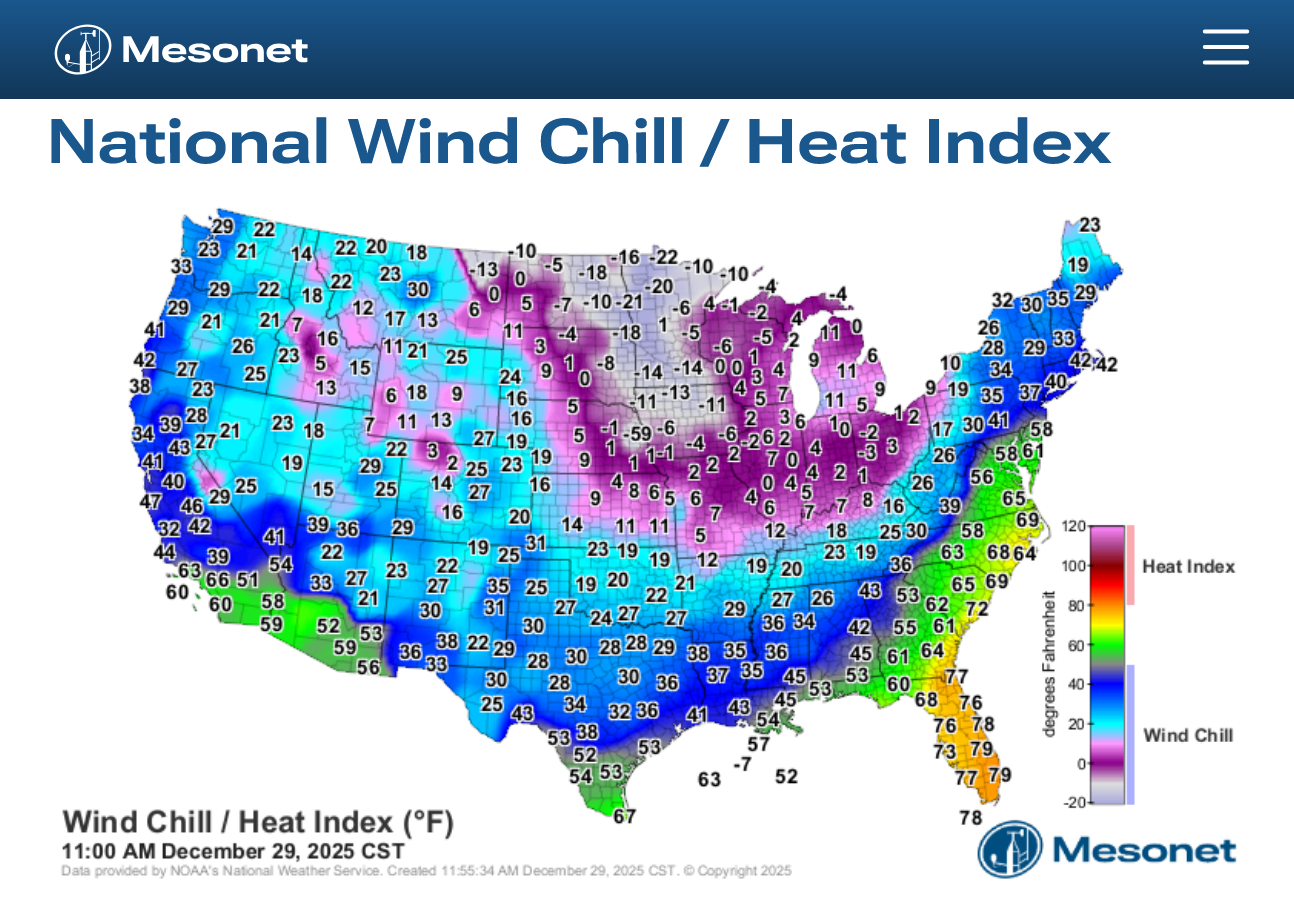
8pm 12-13-25 below. A large area of the Upper Midwest has well below 0 Deg. F Wind Chills right now!
8am, Sunday 12-14-25 below
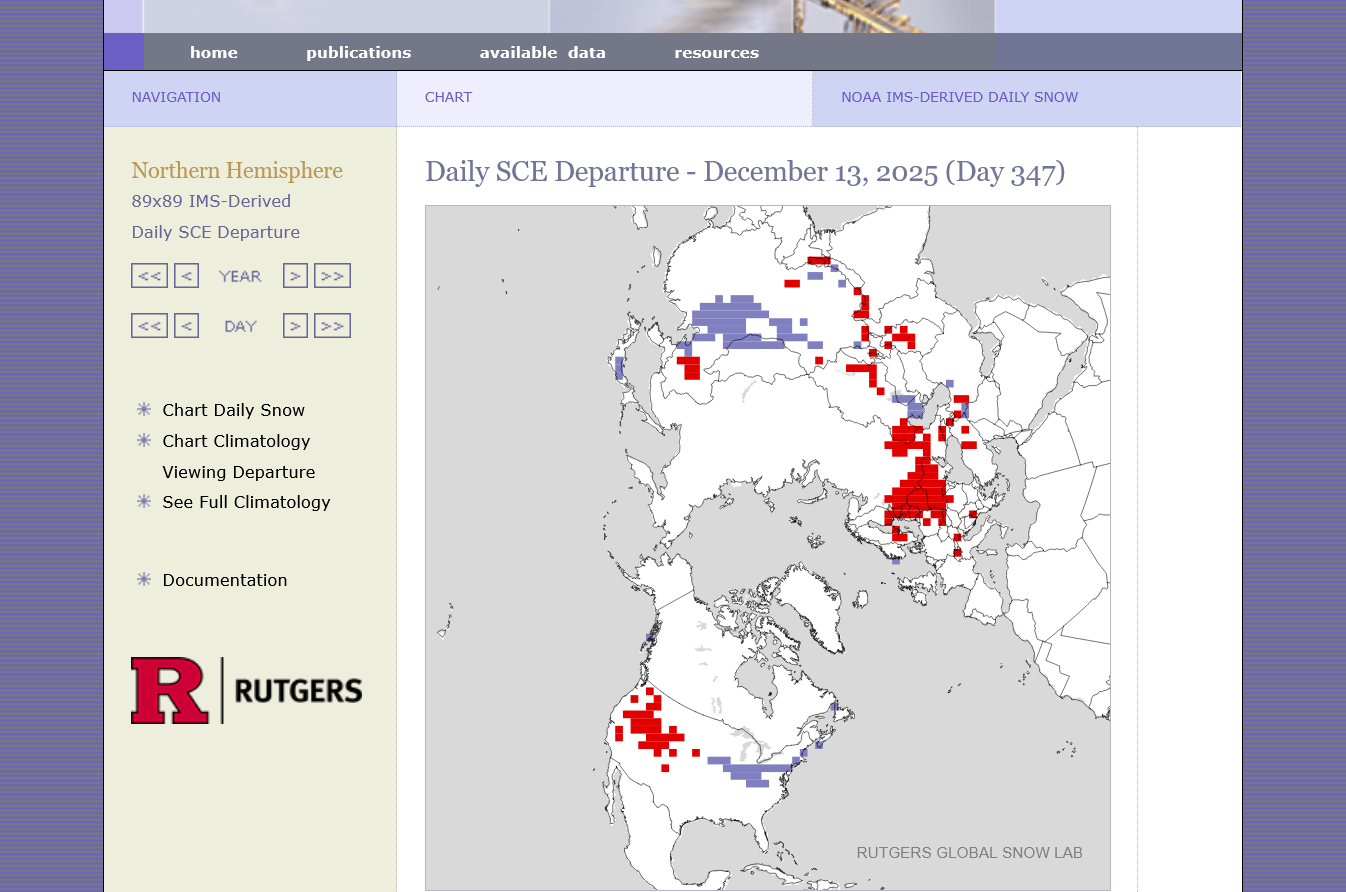
This map below is constantly updated:
+++++++++++++++
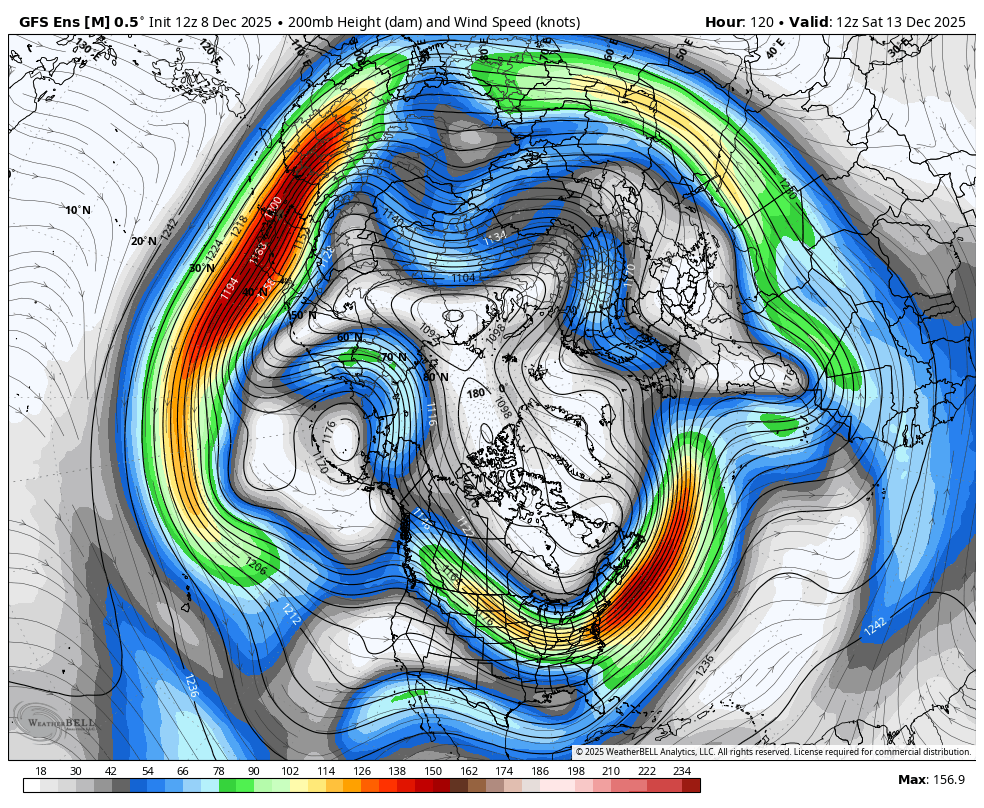
The recent Jet stream has featured a cross polar flow spreading frigid air masses from Siberia(coldest on the planet right now), across Canada, then into the United States. This is the 200 mb map around 35,000 feet)
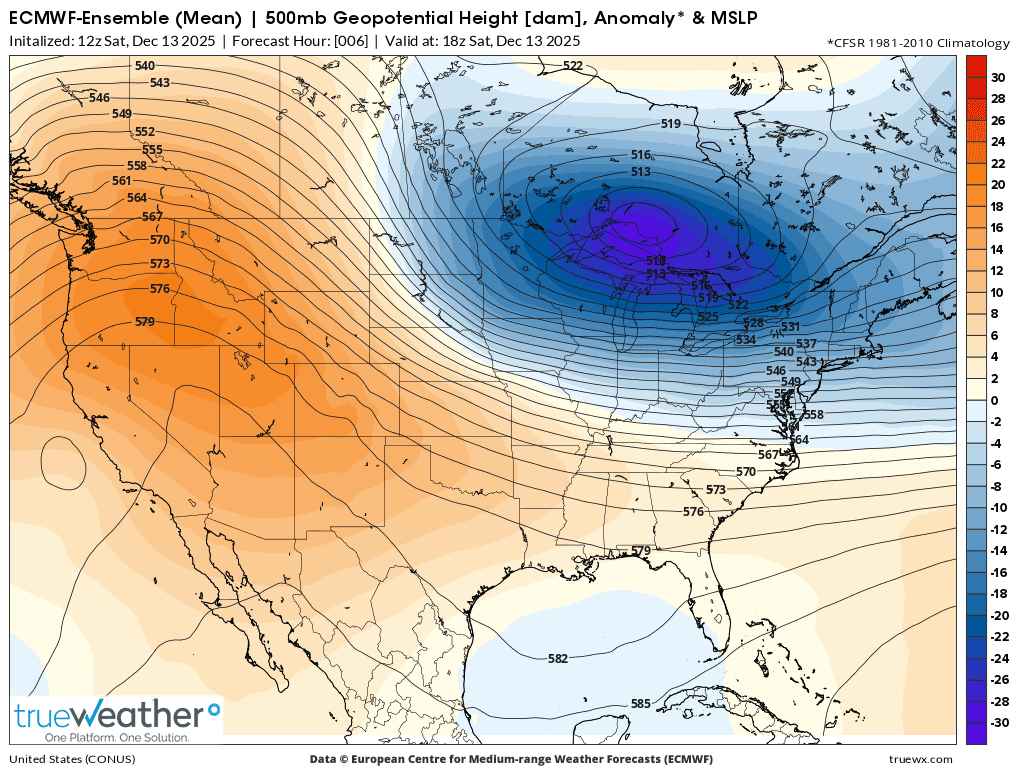
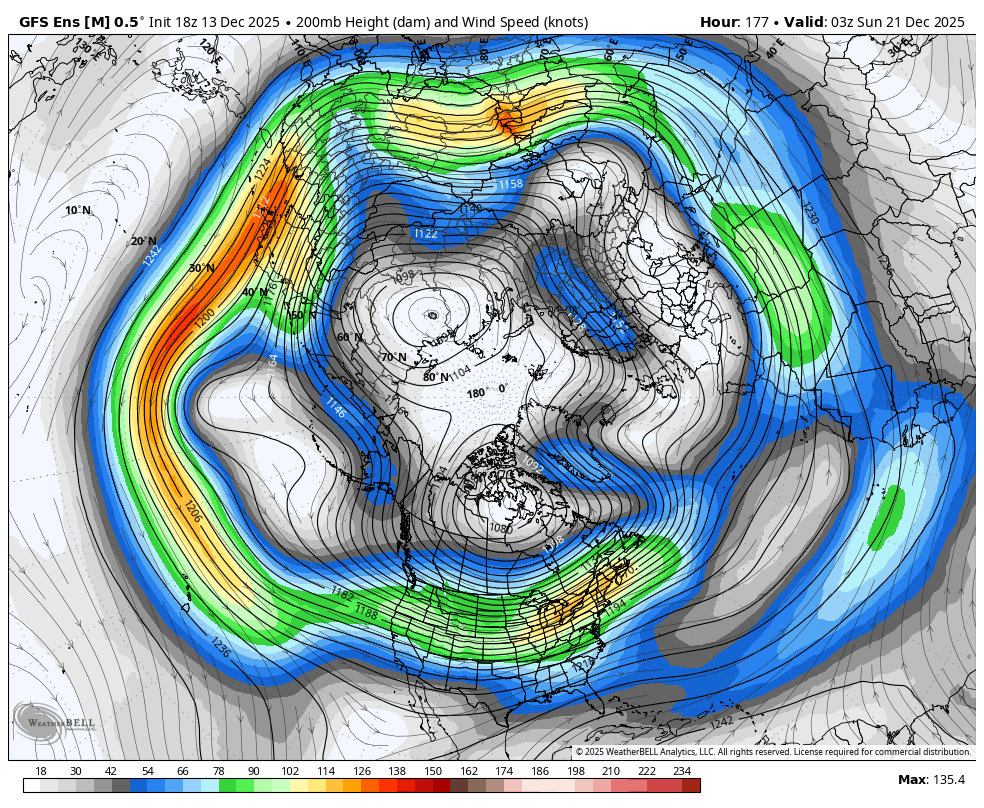
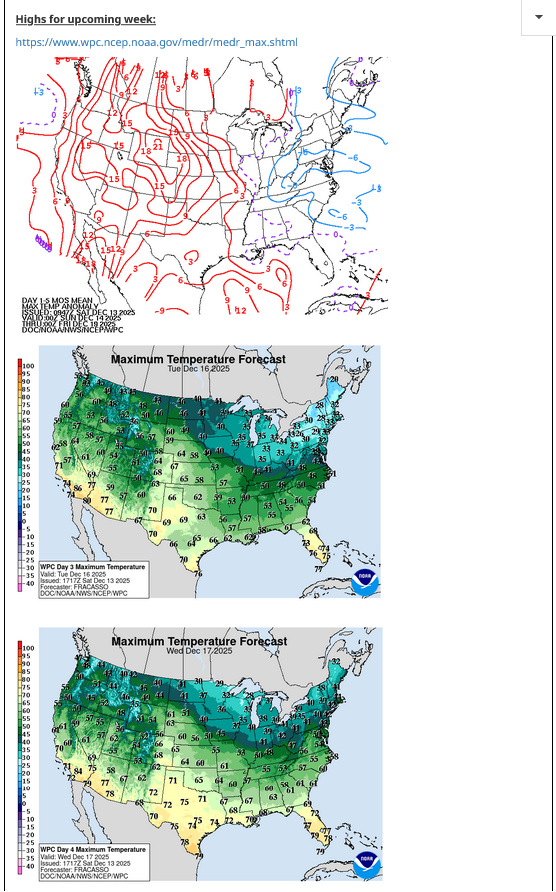
Here's the new pattern below. This is 1 week from today on 12-20-25. Mild, Pacific(oceanic) air masses will spread from west to east across much of the country. Bitter cold will continue to pool in Canada and some of that will leak/ooze just south of the US border, undercutting the main jet stream in the lower levels but that cold will not have much push to penetrate very far south as it moderates over bare ground.
The Polar Vortex will be anchored just northwest of the Hudson Bay in Canada. Canada will be extremely cold for the rest of the month!
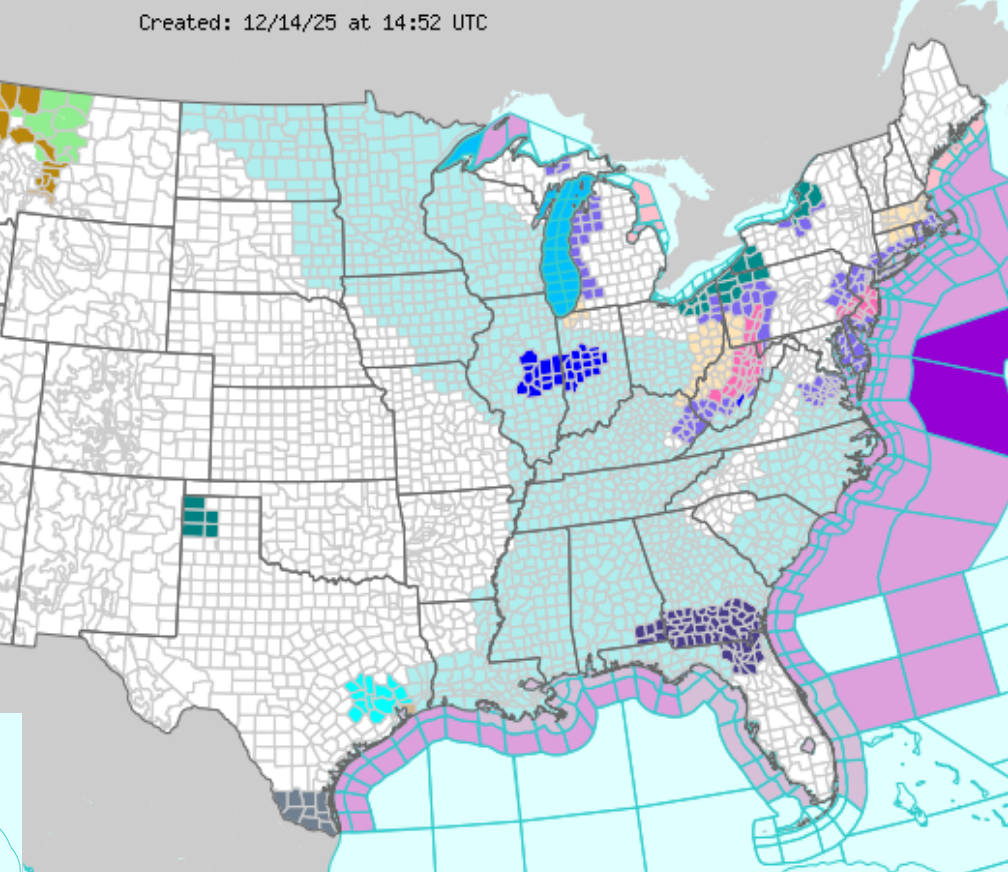
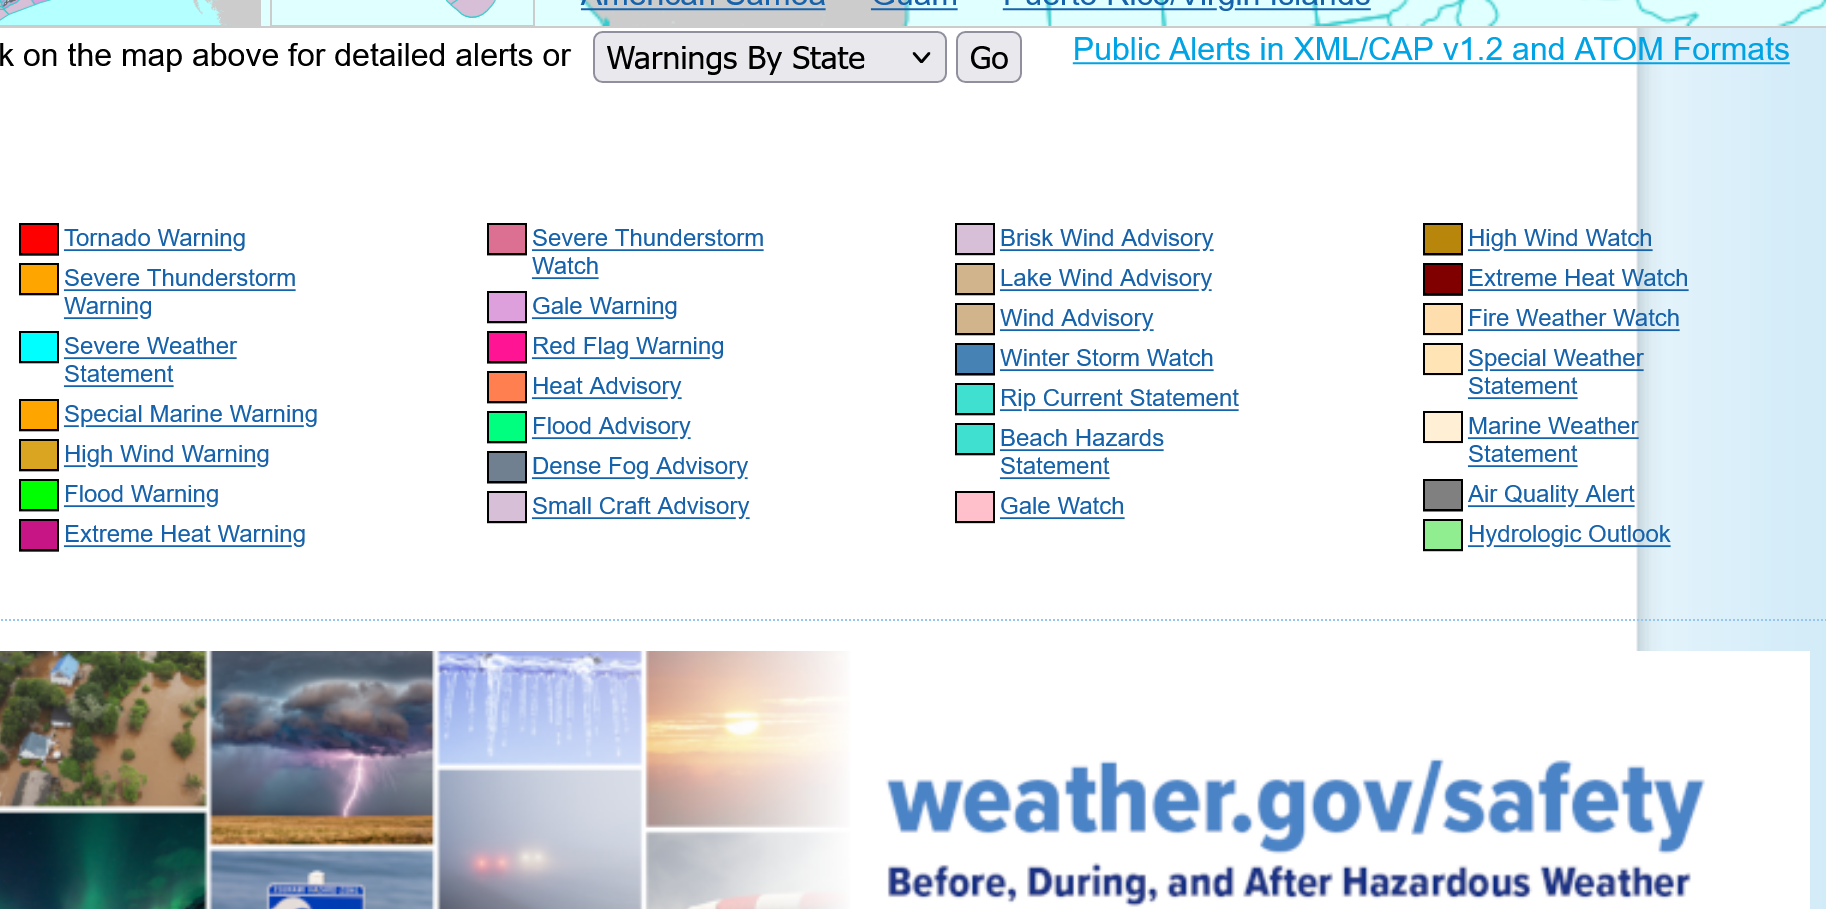
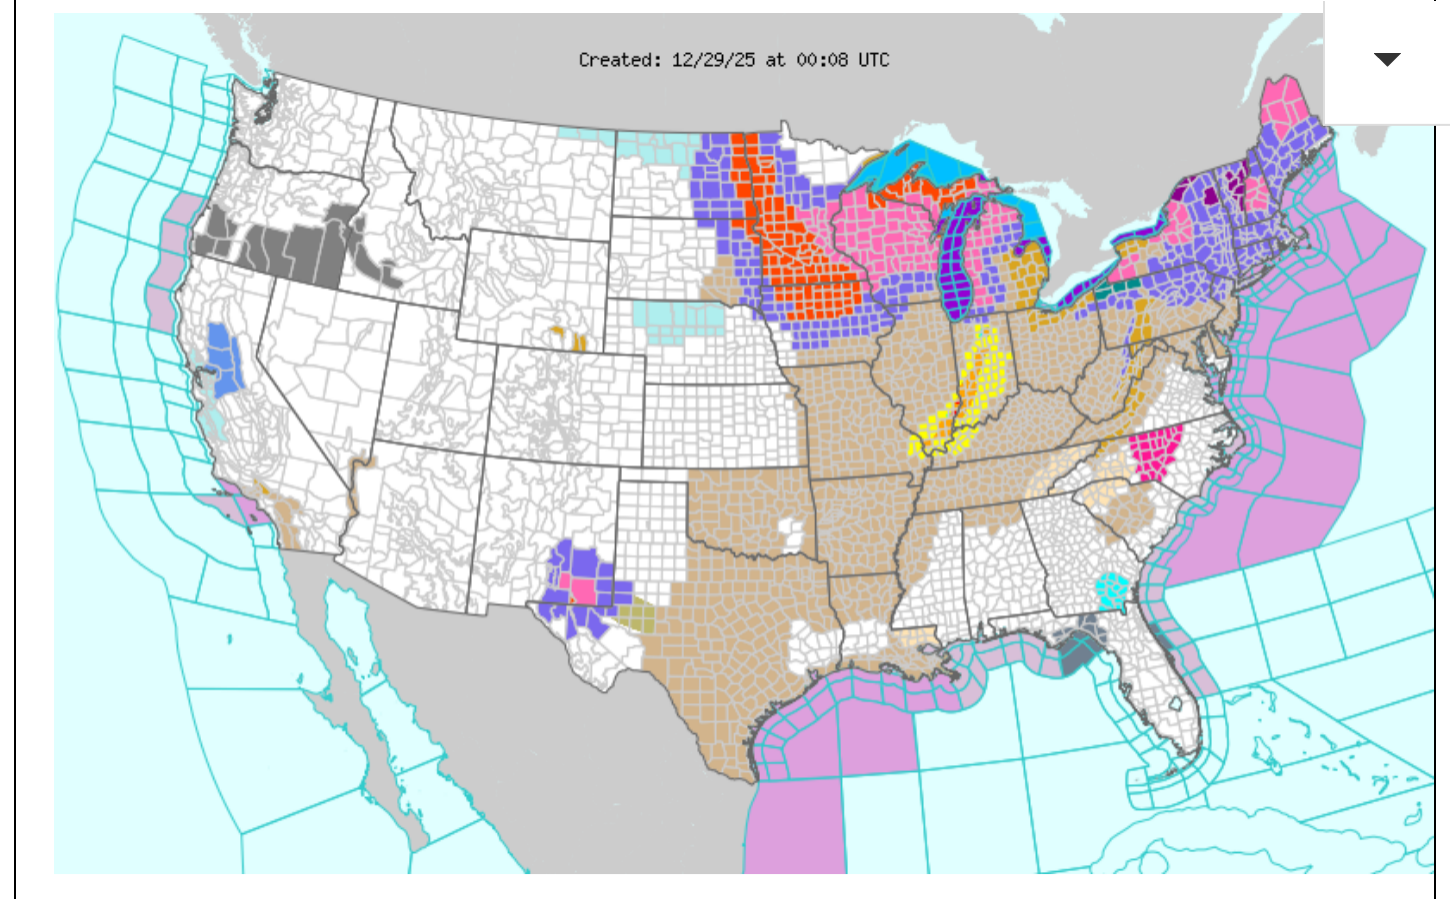
Look at all the cold weather advisories and warnings here on Sunday Morning!
Current Hazards at the link below.
For your NWS and county, go to the link below.
Then you can hit any spot on the map, including where you live and it will go to that NWS with all the comprehensive local weather information for that/your county.
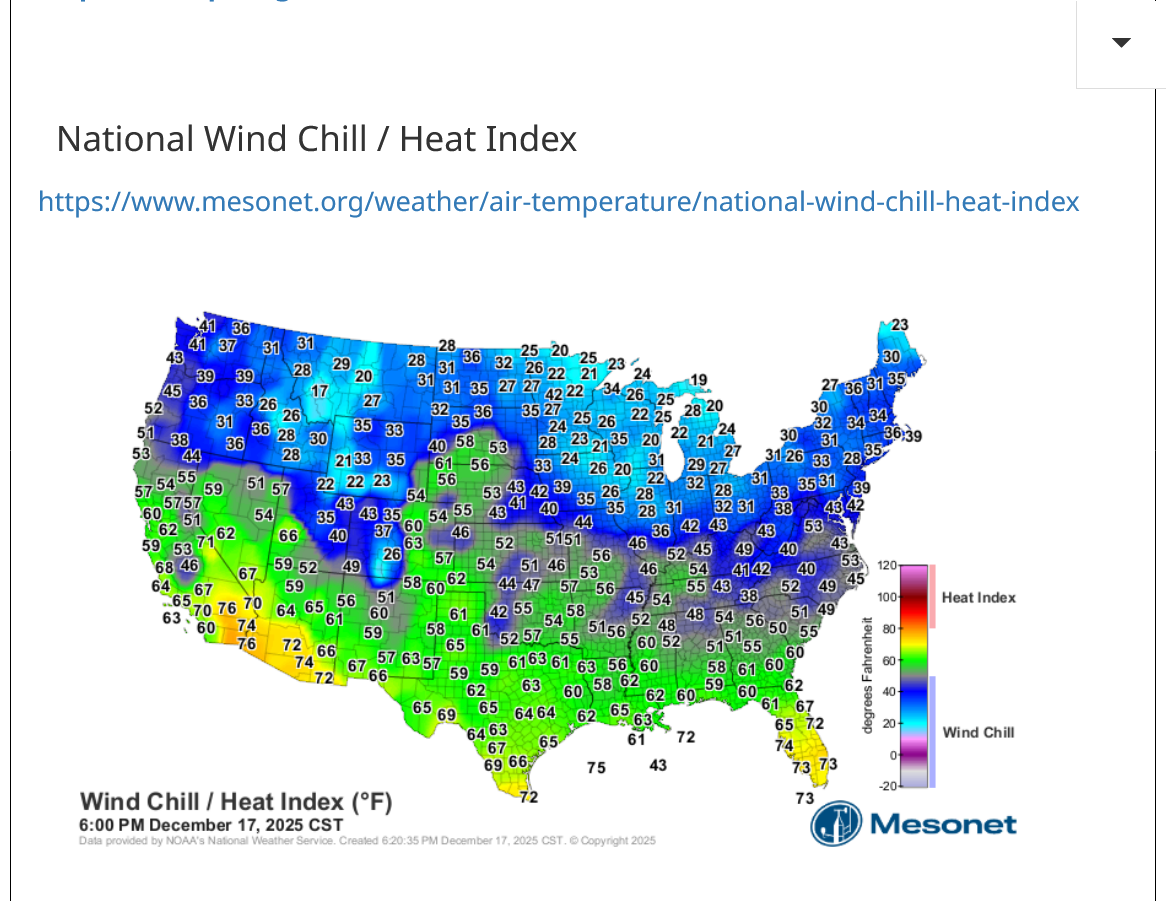
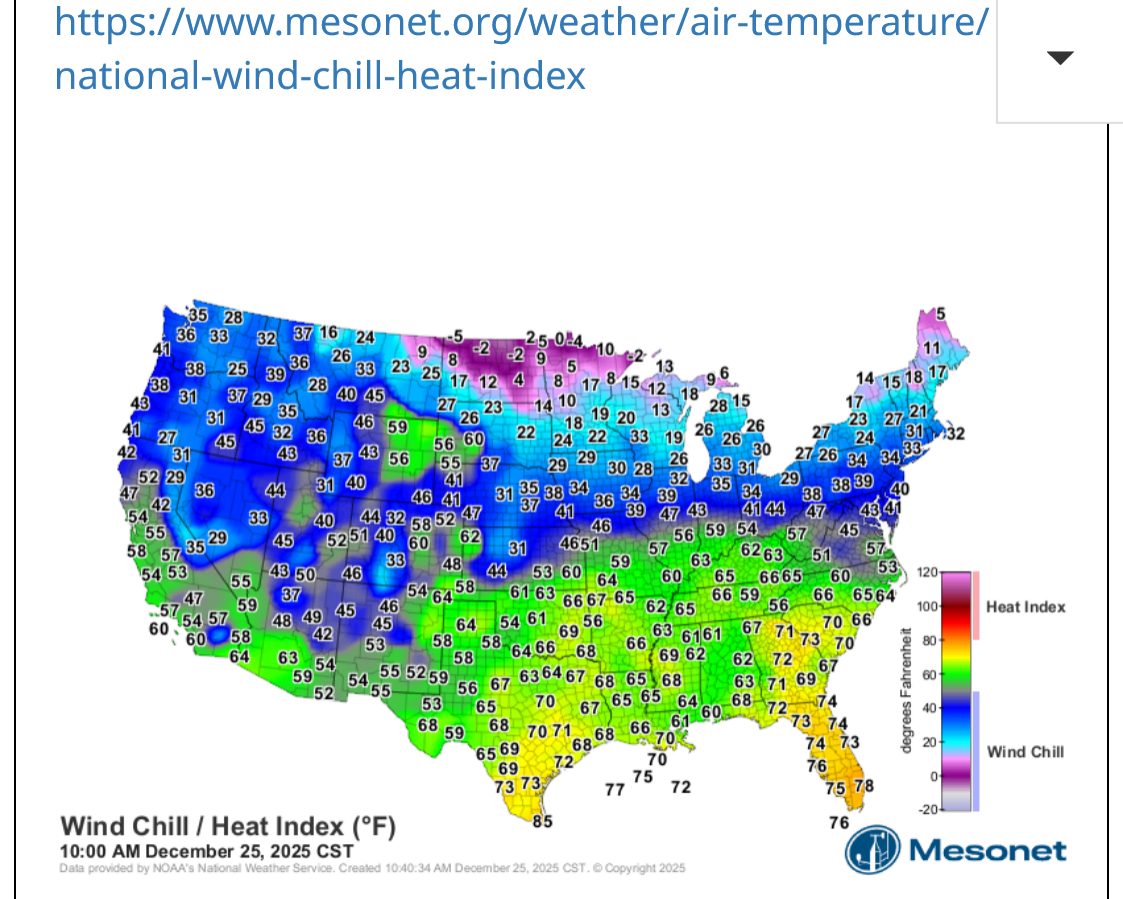
Look how much warmer the early evening temperatures are here on Wednesday, 12-17-25 compared to the map above!!! There are places, like the N.Plains where it feels 60+ degrees warmer right now!!!!
Click below for archives of past outlooks (data & graphics), historical analogs to todays forecast, and other formats of the 6-10 day outlooks ArchivesAnalogsLines-Only FormatGIS Data
Click below for archives of past outlooks (data & graphics), historical analogs to todays forecast, and other formats of the 8-14 day outlooks ArchivesAnalogsLines-Only FormatGIS Data
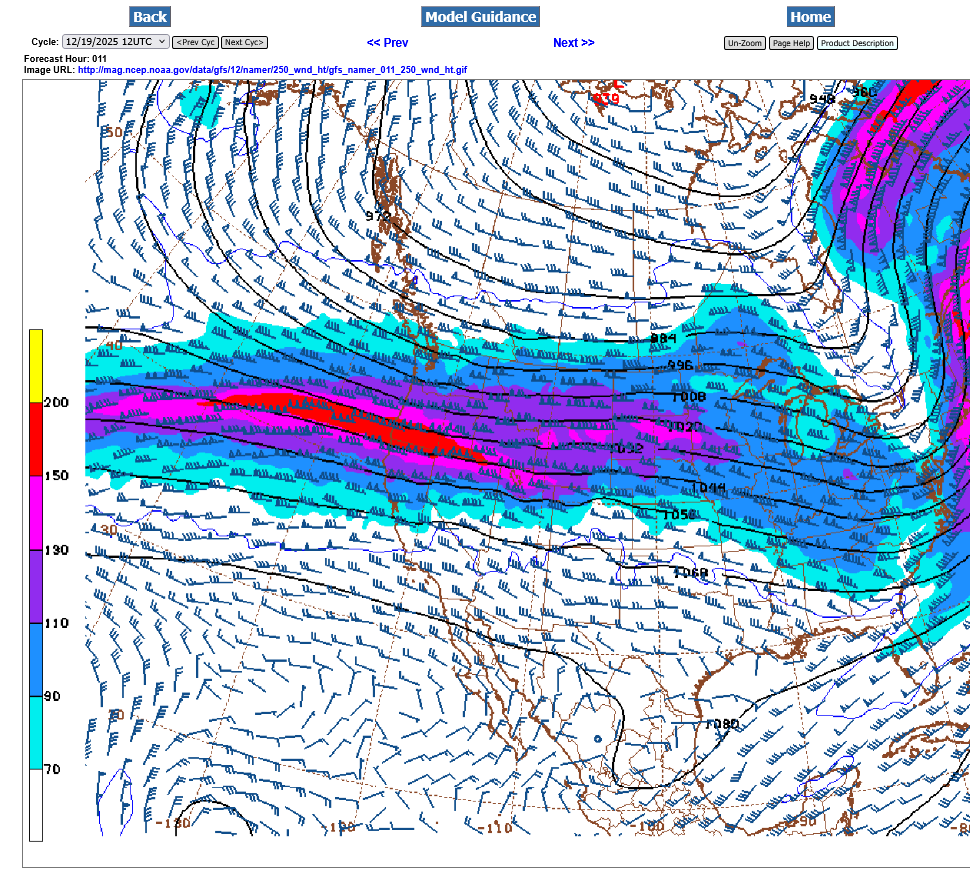
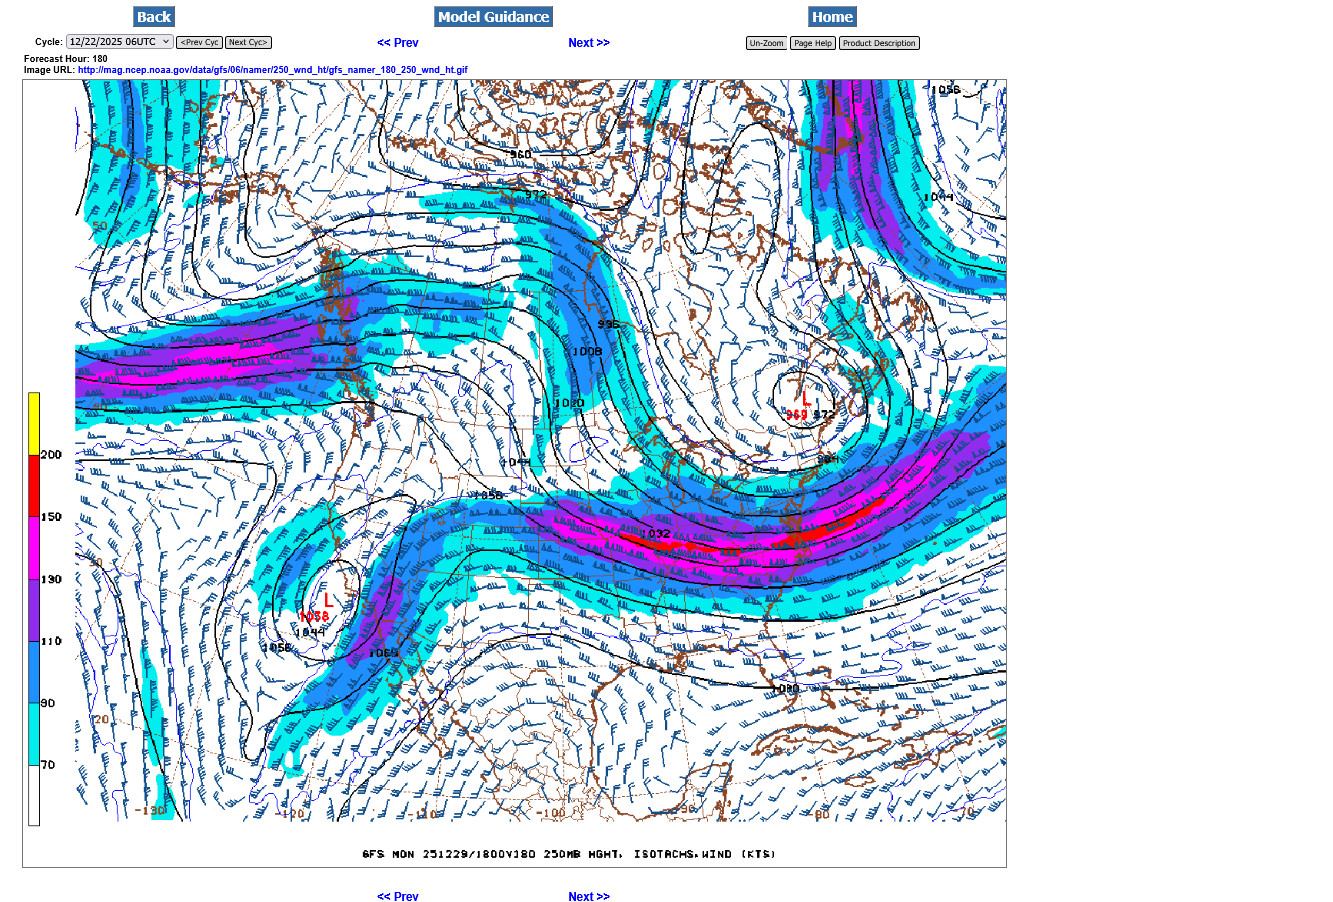
This is the current jet stream at 250 mb or around 34,000 feet above the ground. Mainly west to east, mild zonal flow with a southwest component pumping up an upper level ridge in the center of the country that will lead to near record warmth this week.
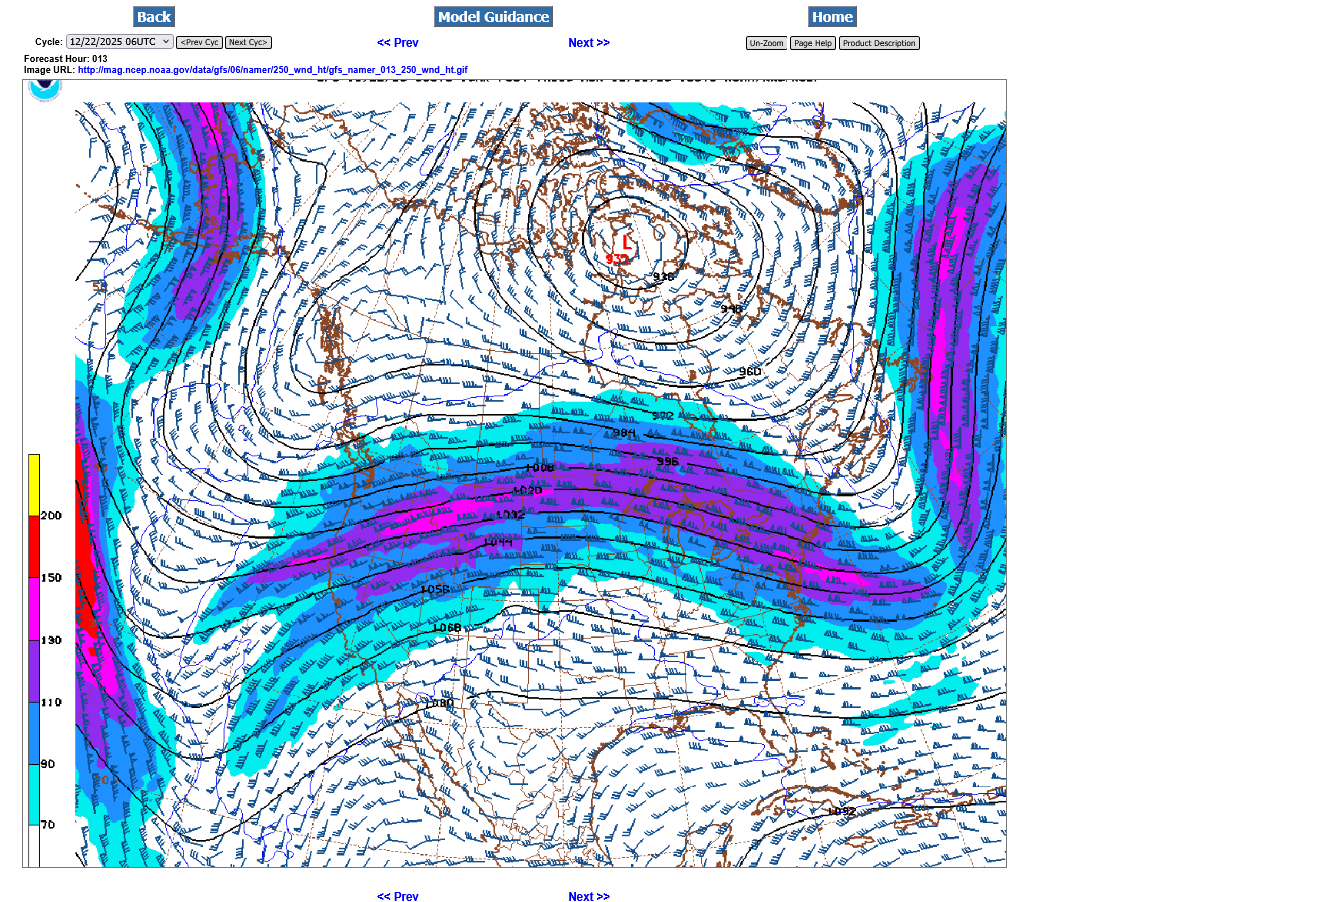
This is the jet stream next weekend. Note the "surprise", temporary development of an upper level low in Southeast Canada and the upper level winds on the backside taking on a north to south component This will drag down a slug of frigid air in Canada into the eastern half of the country for several days.
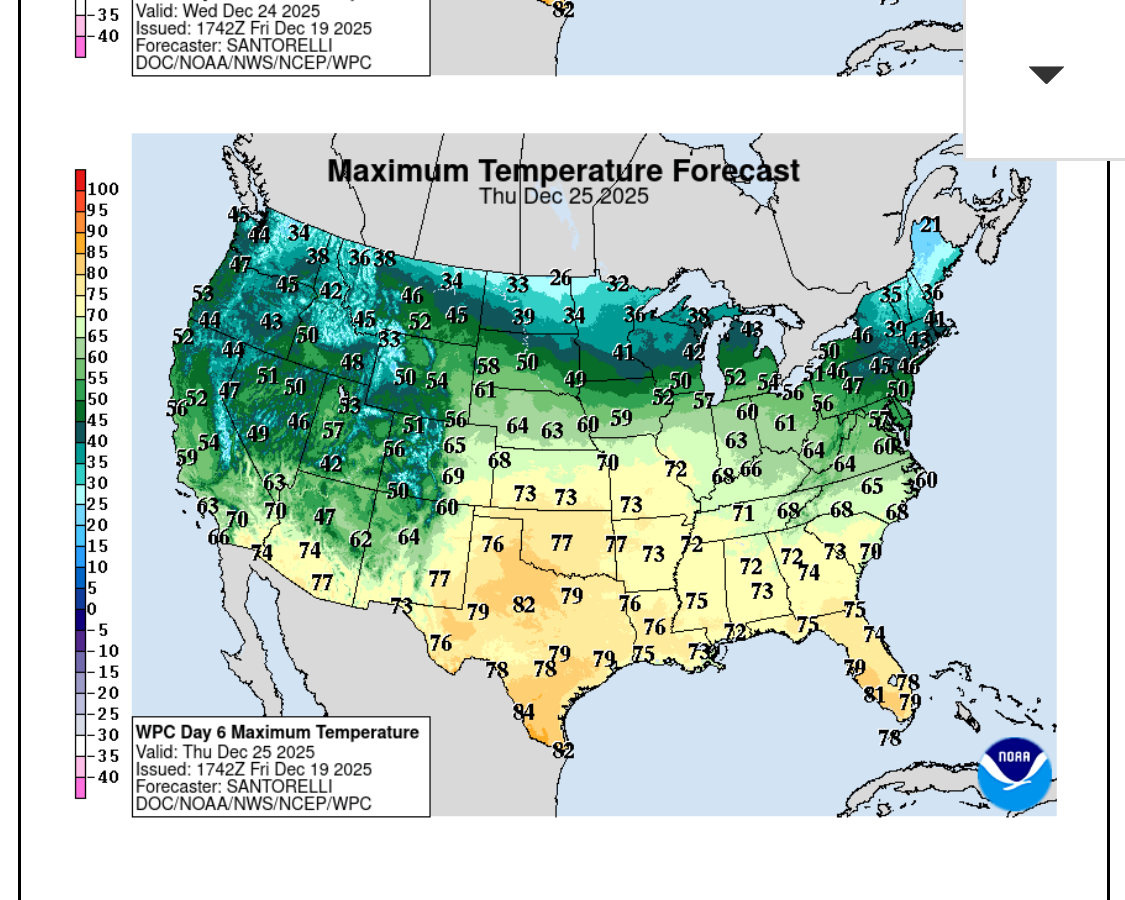
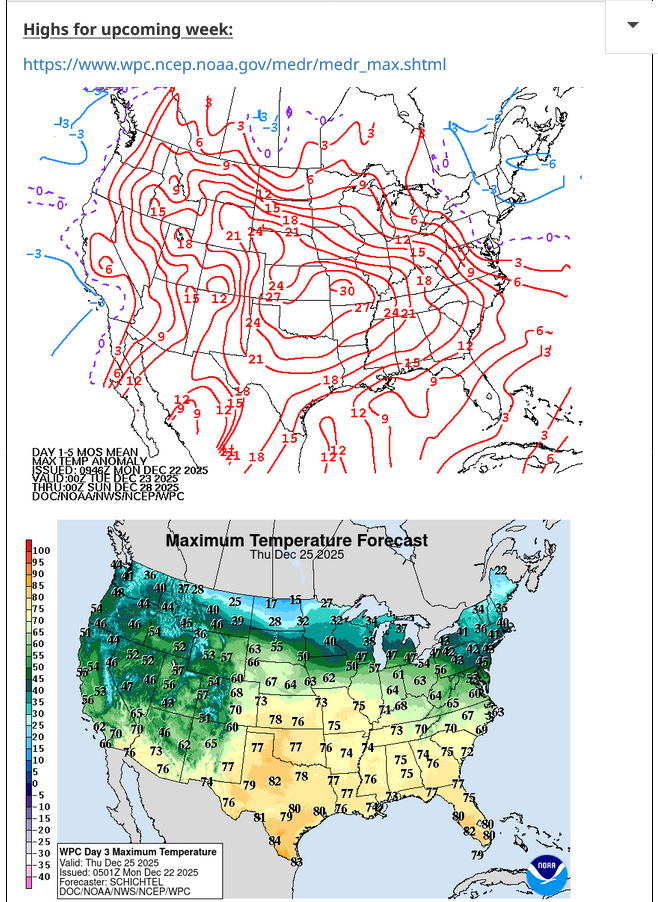
Temperatures this week will average almost 30 degrees above normal in the center of the country. The 2nd map are highs on Christmas Day. Note the very cold air right along the Canadian border. The southern edge of that will surge south this coming weekend!
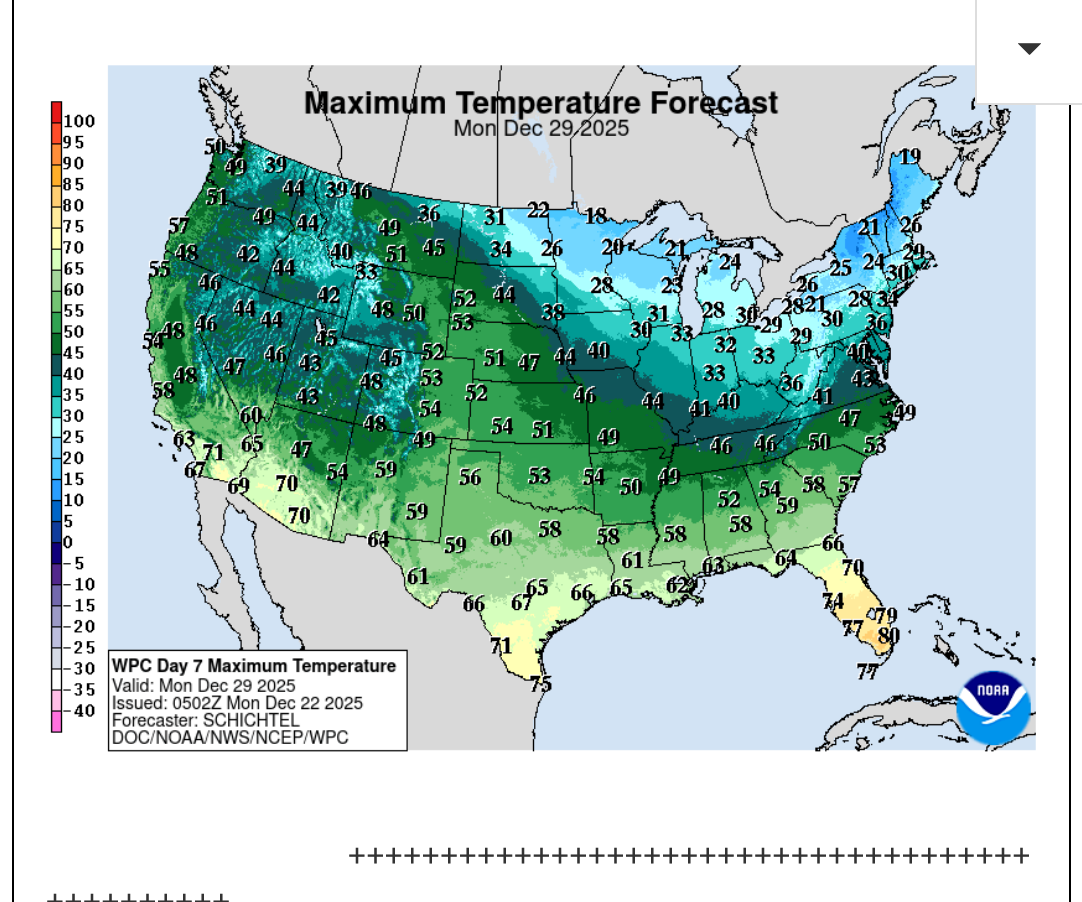
Note the big slug of cold dumping in over the weekend. These are highs next Monday. In some places this will feature a day or even 2 of temporarily, slightly colder than average...........then back to the mild pattern!
Related to your mention of the surprise cooldown for early next week: how much did HDD increase on the EE for 12/28-31 since the 12/19 run?
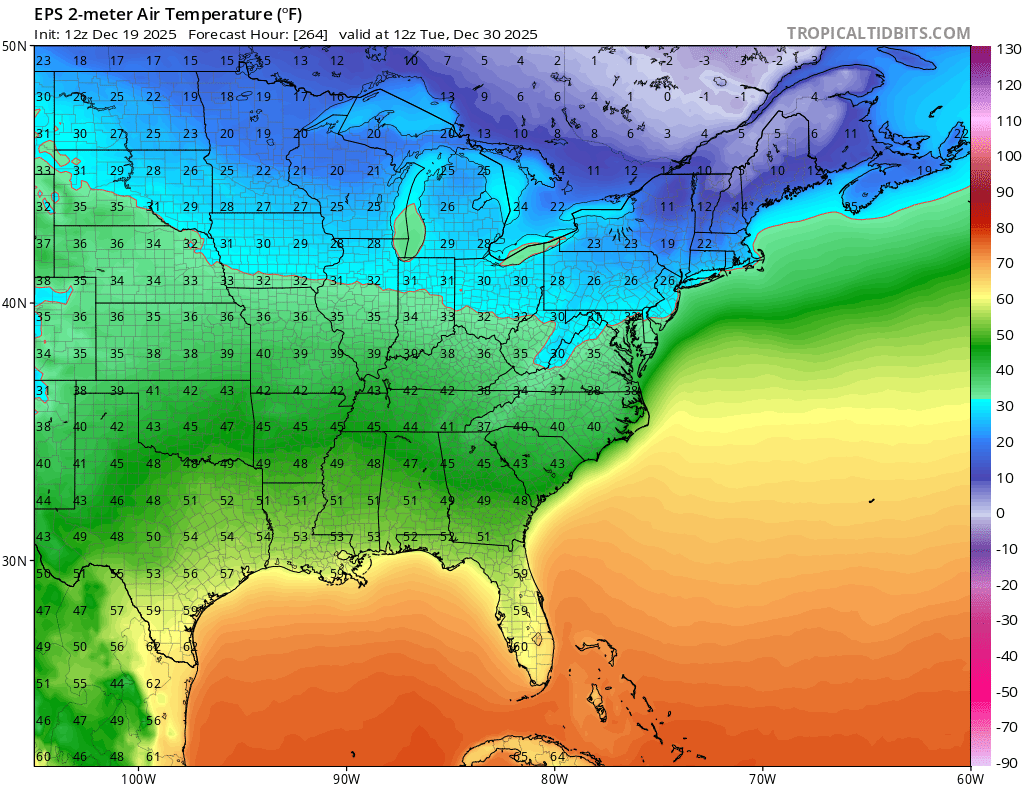
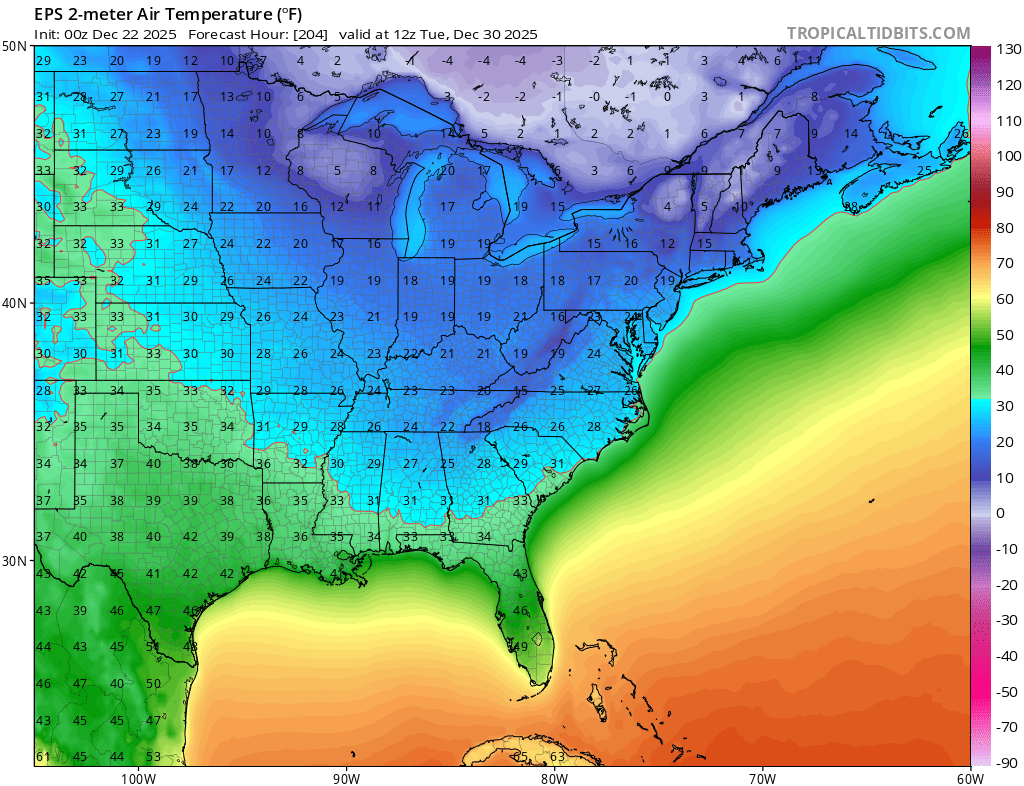
Look how much the EE has cooled for the lows of Dec 30th in just 6 runs thanks to the pushback from the strengthening -NAO despite the Aleutian ridge not budging! It has cooled this much from the Friday 12Z run, an amazing amount for an ensemble mean over such a short period:
- Roxboro 12F from 38 to 26 - Charlotte 14F from 40 to 26 - CAE 14F from 43 to 29 - SAV 15F from 48 to 33 - ATL 18F from 45 to 27 - Chattanooga 19F from 41 to 22 - Nashville 19F from 42 to 23 - Birmingham 20F from 47 to 27 - Tupelo 19F from 48 to 29 - Chicago 13F from 30 to 17 - Tulsa 11F from 43 to 32
Been busier than usual but I'll try to catch up here.
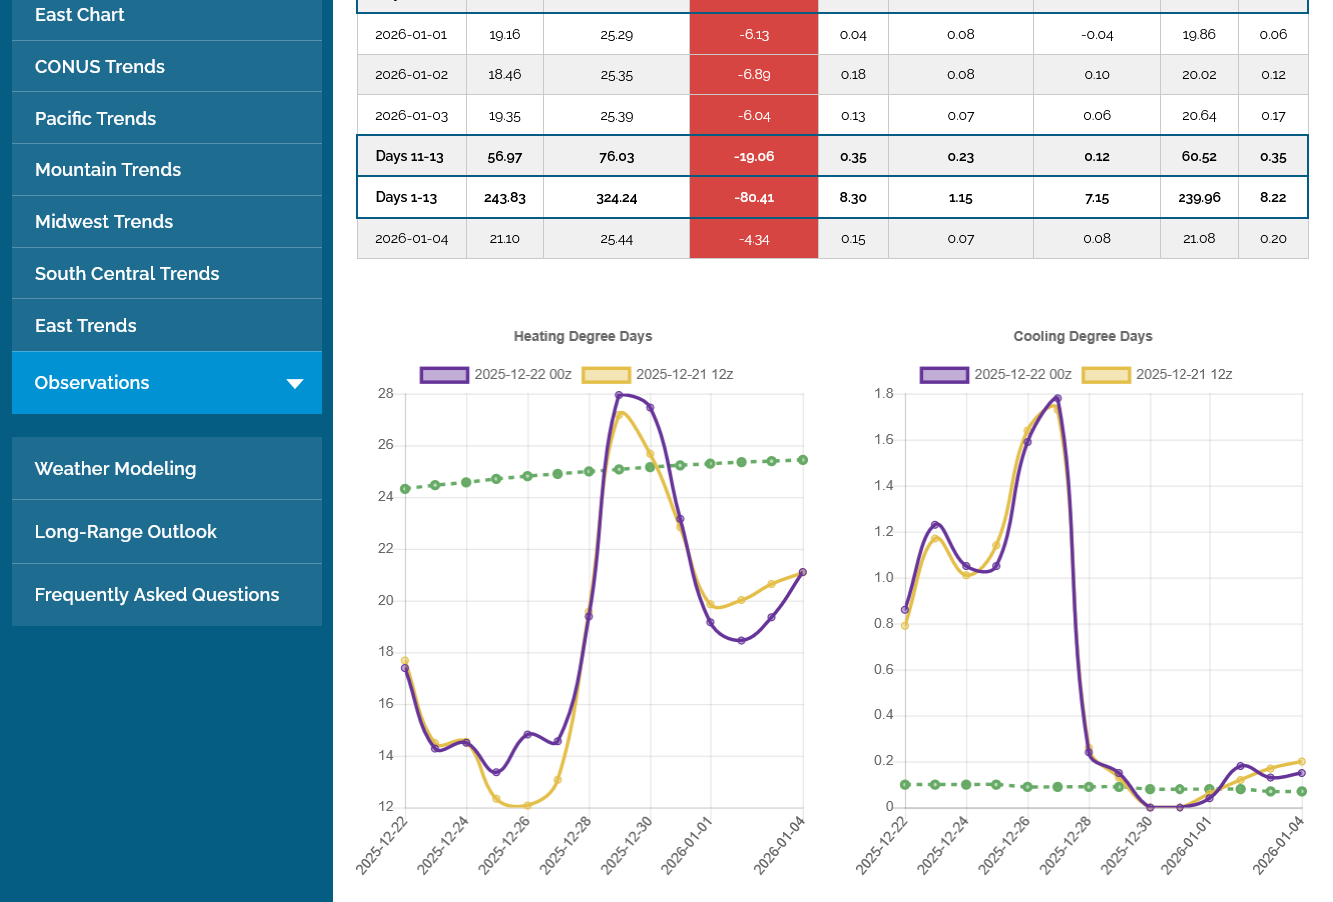
NG opened higher from colder individual days in the forecast over the weekend. The overnight models were even colder for that reason, however the pattern is the same mild pattern late in the period. This colder change is the result of a surprise northern stream system next weekend that will break the milder pattern for several days as seen with the spike up of HDDs on the left.
This last 0z European Ensemble model was another +4 HDDs compared to the previous 12z run. Basically a 4 day spike up that interrupts but doesn't end the very mild, dominant pattern.
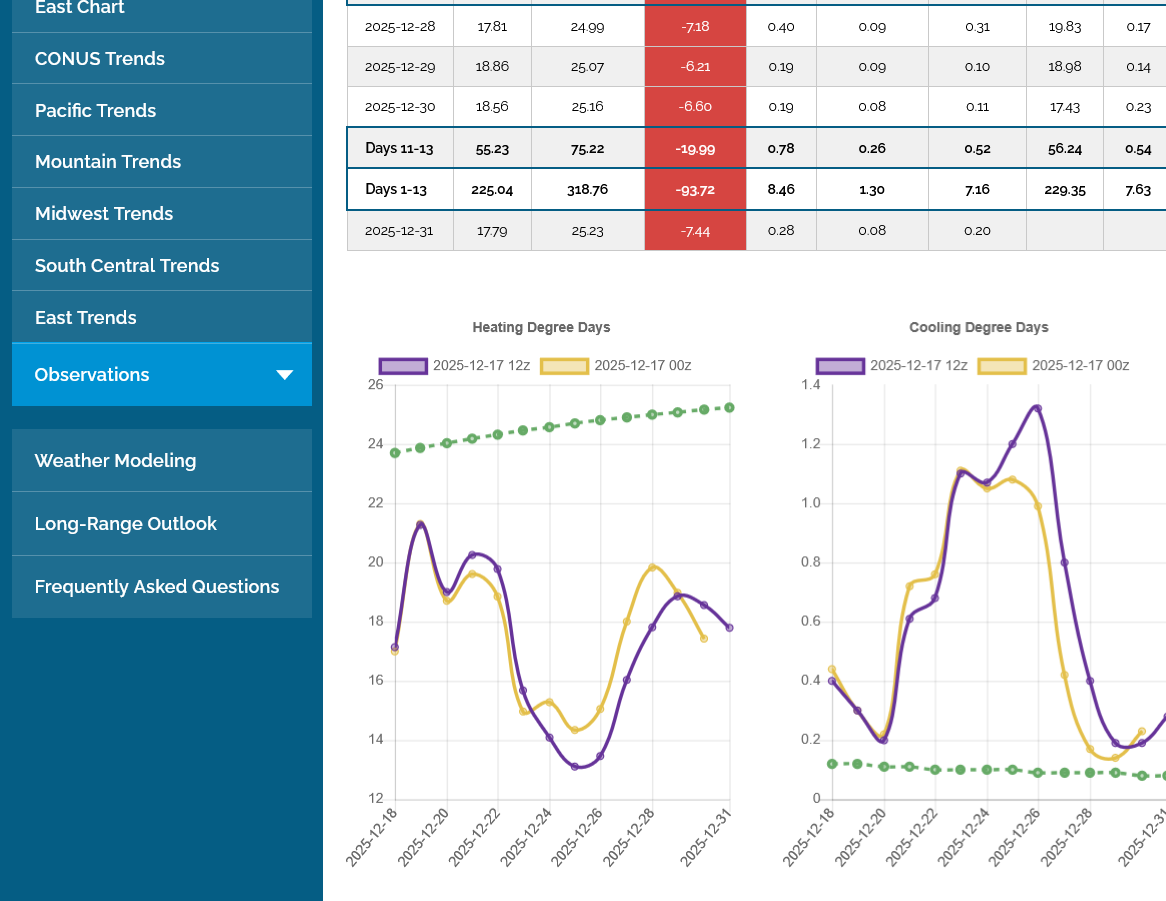
Below was the same HDD map from 5 days earlier. HDDs are on the left. Note how far below the green average line we were FOR EVERY DAY at that time:
We’ll have to see if that longer range mild pattern will verify considering how badly the models missed the much colder change for 12/28-31! The models got this week’s warmth right, but otherwise they’ve been missing too warm most days since Thanksgiving week! So, I’m not necessarily buying that the mild pattern after this surprise cold period will actually verify.
The models were consistently too warm in November/early December for unexpected northern stream impacts that were very similar to this last one over the weekend. However, they then were frequently not warm enough the past 2 weeks after ng made it's blow off top on December 5th.
Was this last brief "much colder" surprise episode (that is similar to the November models a harbinger of the models and pattern that existed in November? Something to watch closely, especially since the amount of cold in November/early December should have featured the models predicting a very negative AO and NAO and they consistently were unable to capture those indexes in their medium range outlooks. You made a great post pointing this out!
Sunday High: 70 °F Chance Showers then Showers Likely
Sunday Night Low: 26 °F Showers then Chance Rain/Snow
Monday High: 29 °F Mostly Sunny
++++++++++++++++++++++++++++++++
Current Hazards at the link below.
For your NWS and county, go to the link below.
Then you can hit any spot on the map, including where you live and it will go to that NWS with all the comprehensive local weather information for that/your county.
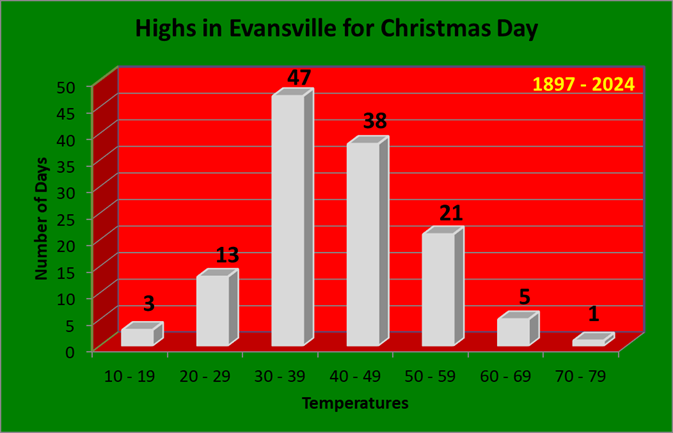
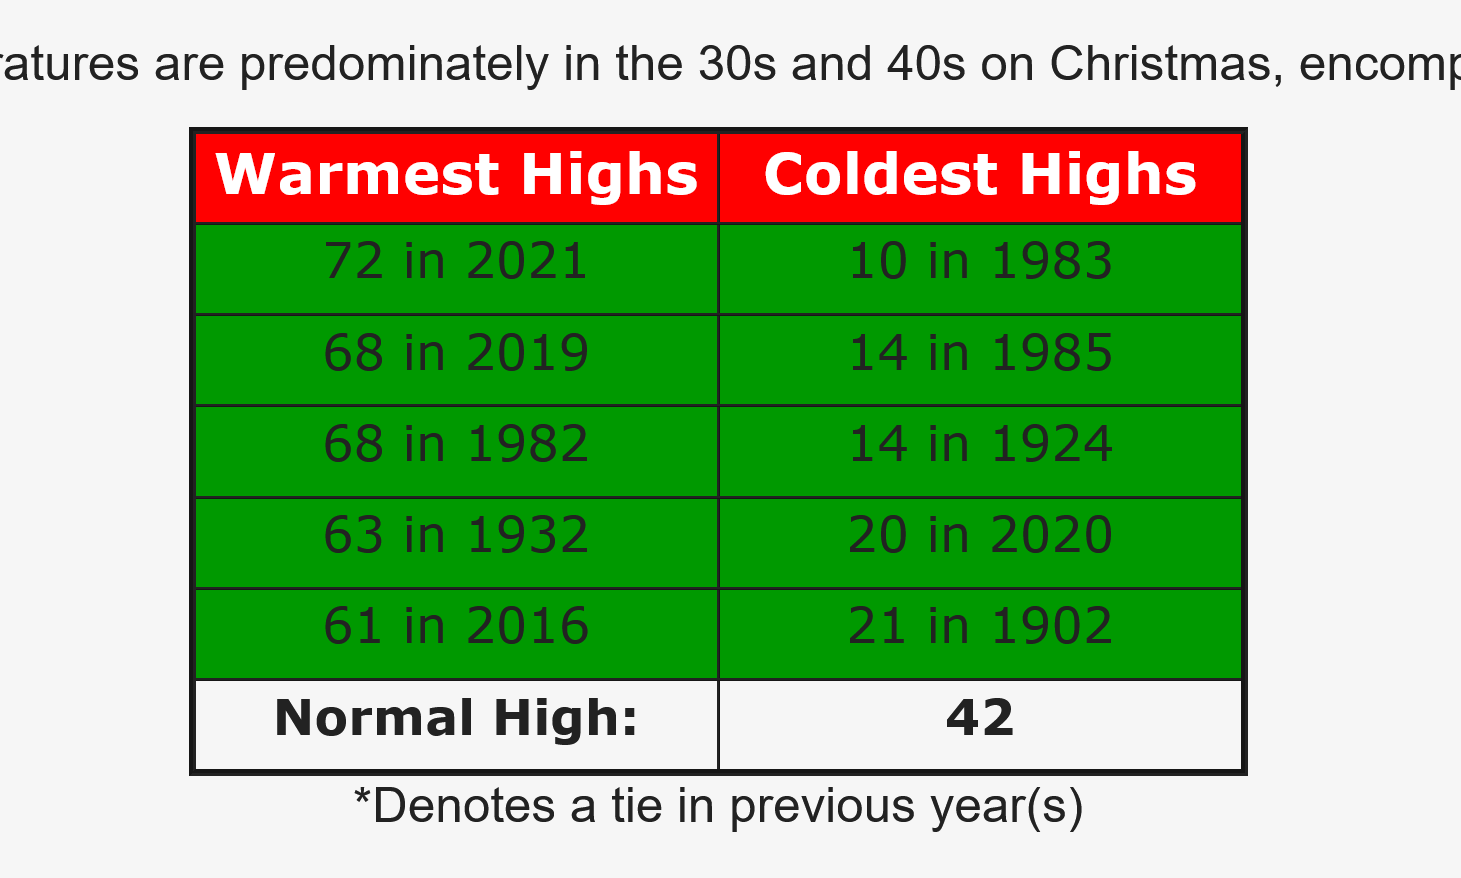
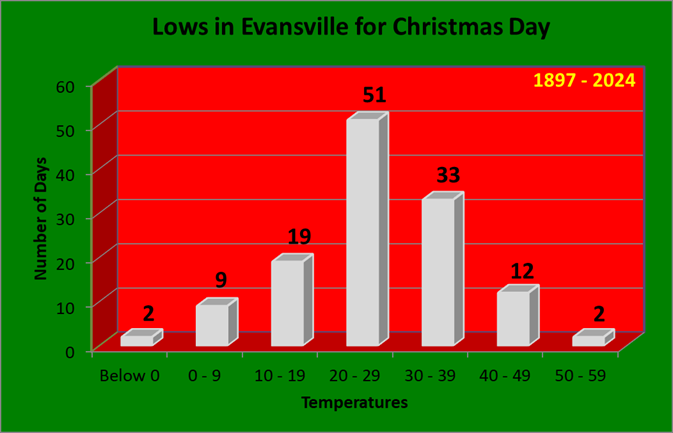
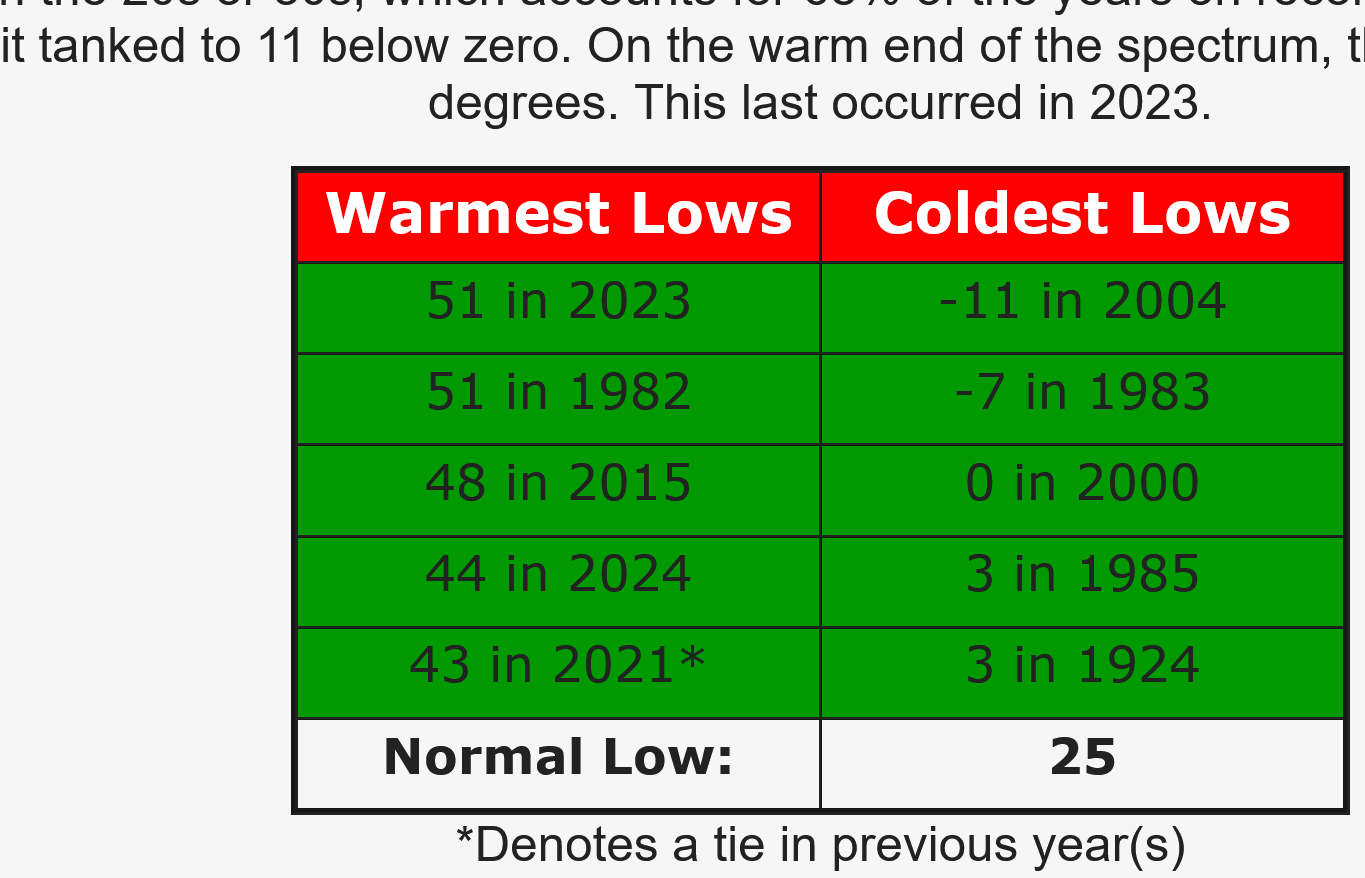
Low temperatures typically fall in the 20s or 30s, which accounts for 68% of the years on record. There have been 2 years with lows below 0, most recently in 2004 when it tanked to 11 below zero. On the warm end of the spectrum, there have been 3 years with lows above 45 degrees. This last occurred in 2023.
This was the warmest low on record for Evansville in history. 54 early this morning:
Temperatures on Monday will feel almost 70 deg. F colder than Sunday at times!!!!
The low on the MORNING of December 28 was an incredible 66 degrees!!!!! This was 7 degrees warmer than the record of 59 degrees and just 2 degrees from the record high.
This also tied for the warmest overnight low for the MONTH of December, with the previous 66 deg. low temp set on December 2, 1982.
Not only that, this tied for the record warmest overnight low for WINTER and for the period Nov-Dec-Jan-Feb.!!! Evansville. We also had a 66 deg. low on January 25, 1950.
However, the cold front will go thru this evening and temperatures will plunge BEFORE midnight, so this will not stand in the record books for December 28th.
Extreme WEATHER like this is not from climate chance. Yes, the planet has beneficially warmed by almost 2 deg. F(more in the coldest places of the Northern Hemisphere- in the the coldest times of year) and climate change is REAL but this is a wonderful time to repeat the Golden Rule!
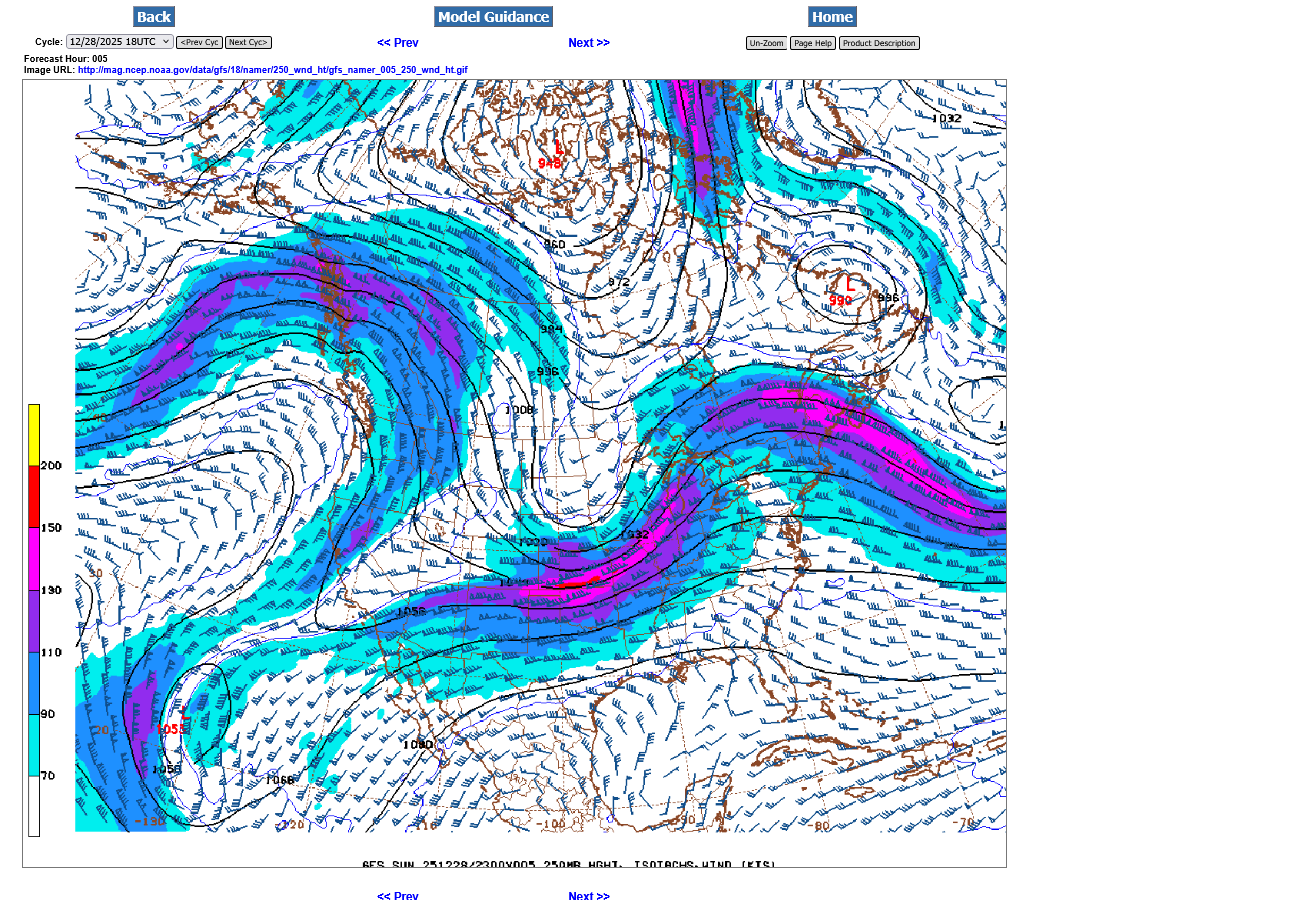
To have a chance of tornadoes, you usually need a powerful jet stream. This jet stream map is 32,000 feet above the ground. The orange embedded in the center of the colors is a jet streak close to 200 mph. That creates powerful lift AND spin even though the air lacks heat/humidity of a Spring outbreak.
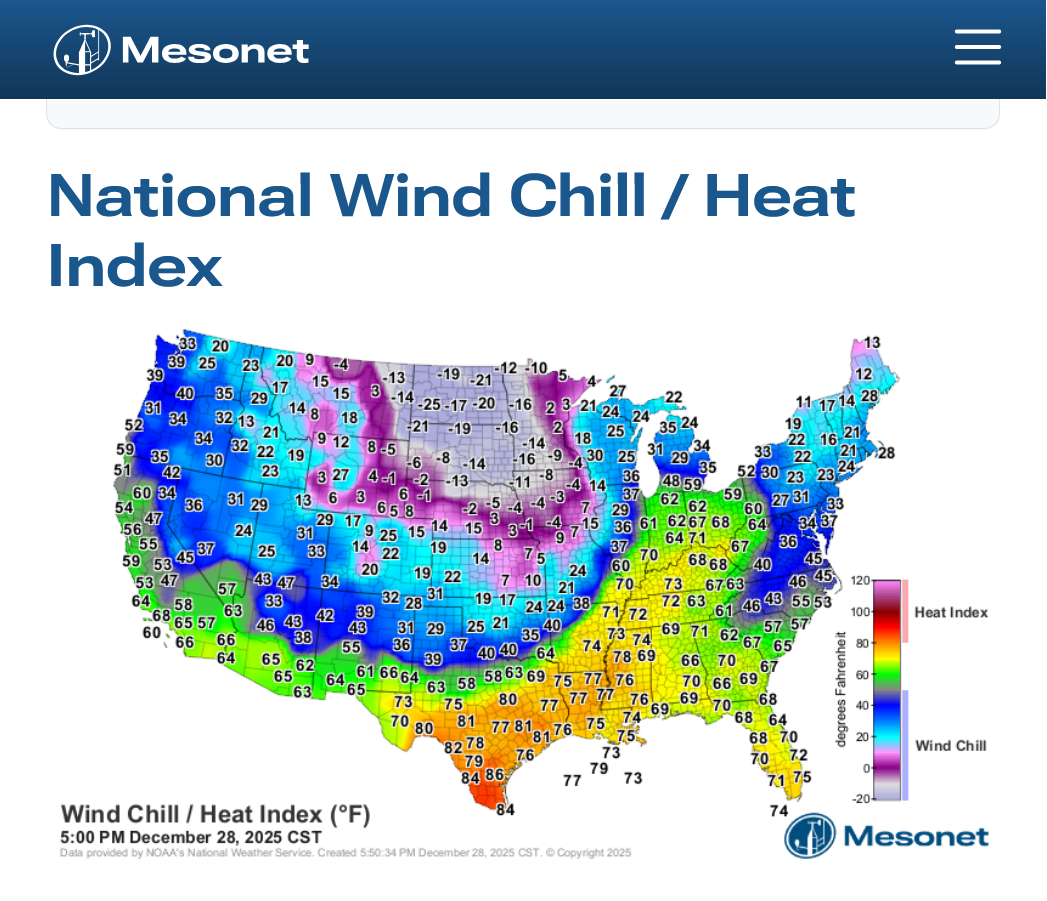
This is a freeze frame of the map at 6pm CST. The map below should update constantly
Current Hazards at the link below. An rare Tornado Watch in yellow for late December.
For your NWS and county, go to the link below.
Then you can hit any spot on the map, including where you live and it will go to that NWS with all the comprehensive local weather information for that/your county.
This is for a radar indicated tornado tracking just north of Evansville, along and north of I64.
The National Weather Service in Paducah has issued a
* Tornado Warning for...  Northwestern Warrick County in southwestern Indiana...  Southeastern Gibson County in southwestern Indiana...  Northern Vanderburgh County in southwestern Indiana...
* Until 700 PM CST.
* At 639 PM CST, a severe thunderstorm capable of producing a tornado  was located over Haubstadt, or near Fort Branch, moving east at 55  mph.
+++++++++++
The new severe thunderstorm warning set the sirens off again in ALL of Vanderburgh County even though its only for a tiny sliver of southeast Vanderburgh County along the Ohio River.
When they draw the warning boxes, they don't line up with county borders. Even if less than a mile of a county is included, the warning sirens go off for the ENTIRE county. This can be extremely confusing to people hearing the sirens going off and the storms are past of hitting/threatening a different part of the county.
The technology isn't perfect but compare it to March 25, 1918 for example.
The biggest tornado in history(1 mile wide) was on the ground for 3.5 hours and 219 miles with up to 300 mph winds, touching down in Southeast MO, crossing the entire state of IL to sw IN before lifting up after decimating Griffin, IN.
How much warning did those folks have?
Answer: All of them found out about the threat when they saw the actual tornado with their eyes or when it was obliterating the building they were in.
As many people died from just that 1 tornado, 695 than the total number that die in 10 years worth of tornadoes in this age.
I like it here in 2025.
I like it ALOT!
BTW, climate change, which is real has REDUCED the most violent tornadoes by 50% from reducing the meridional temperature gradient(by warming the coldest air masses the most).
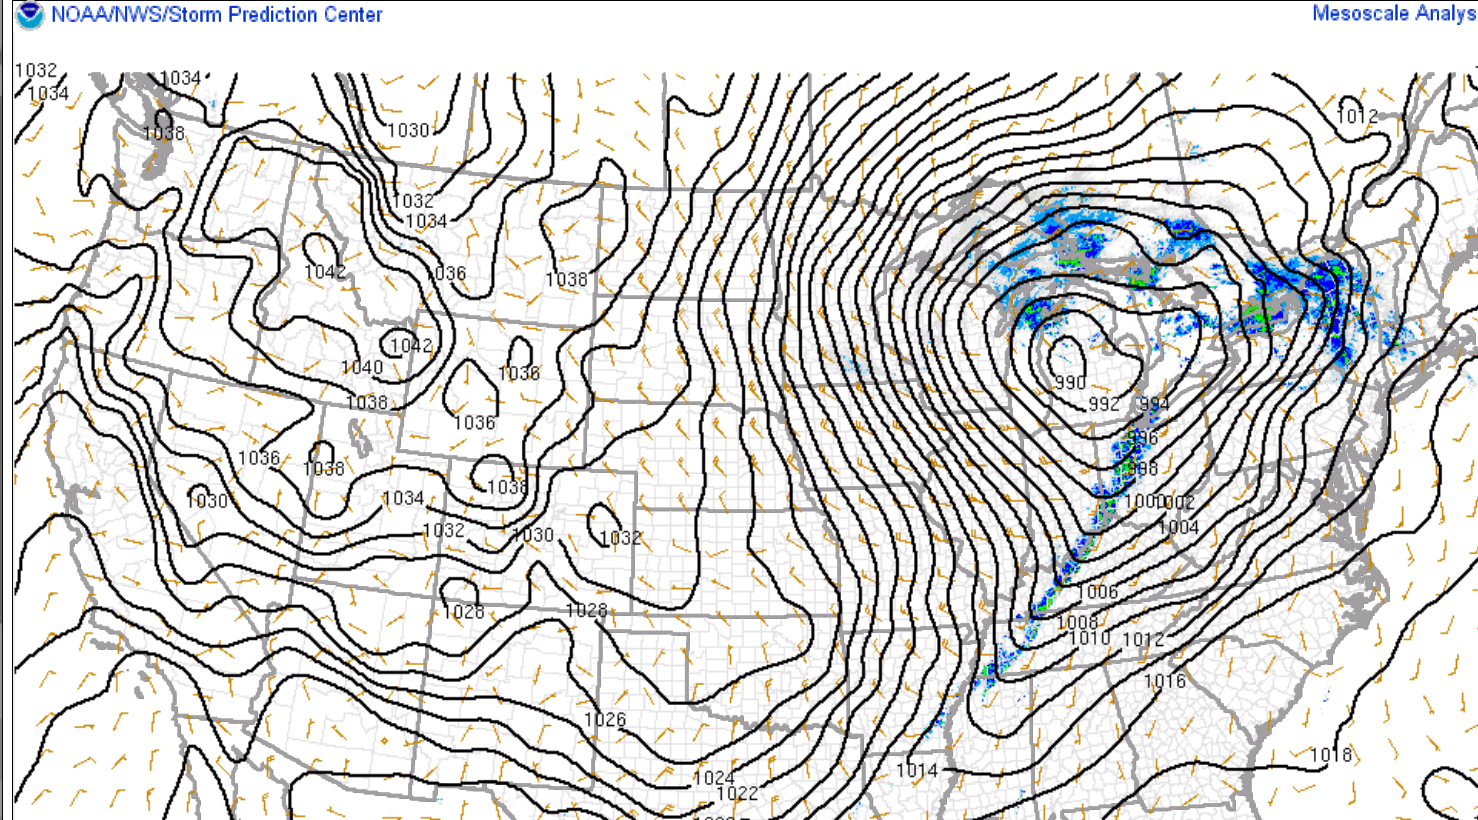
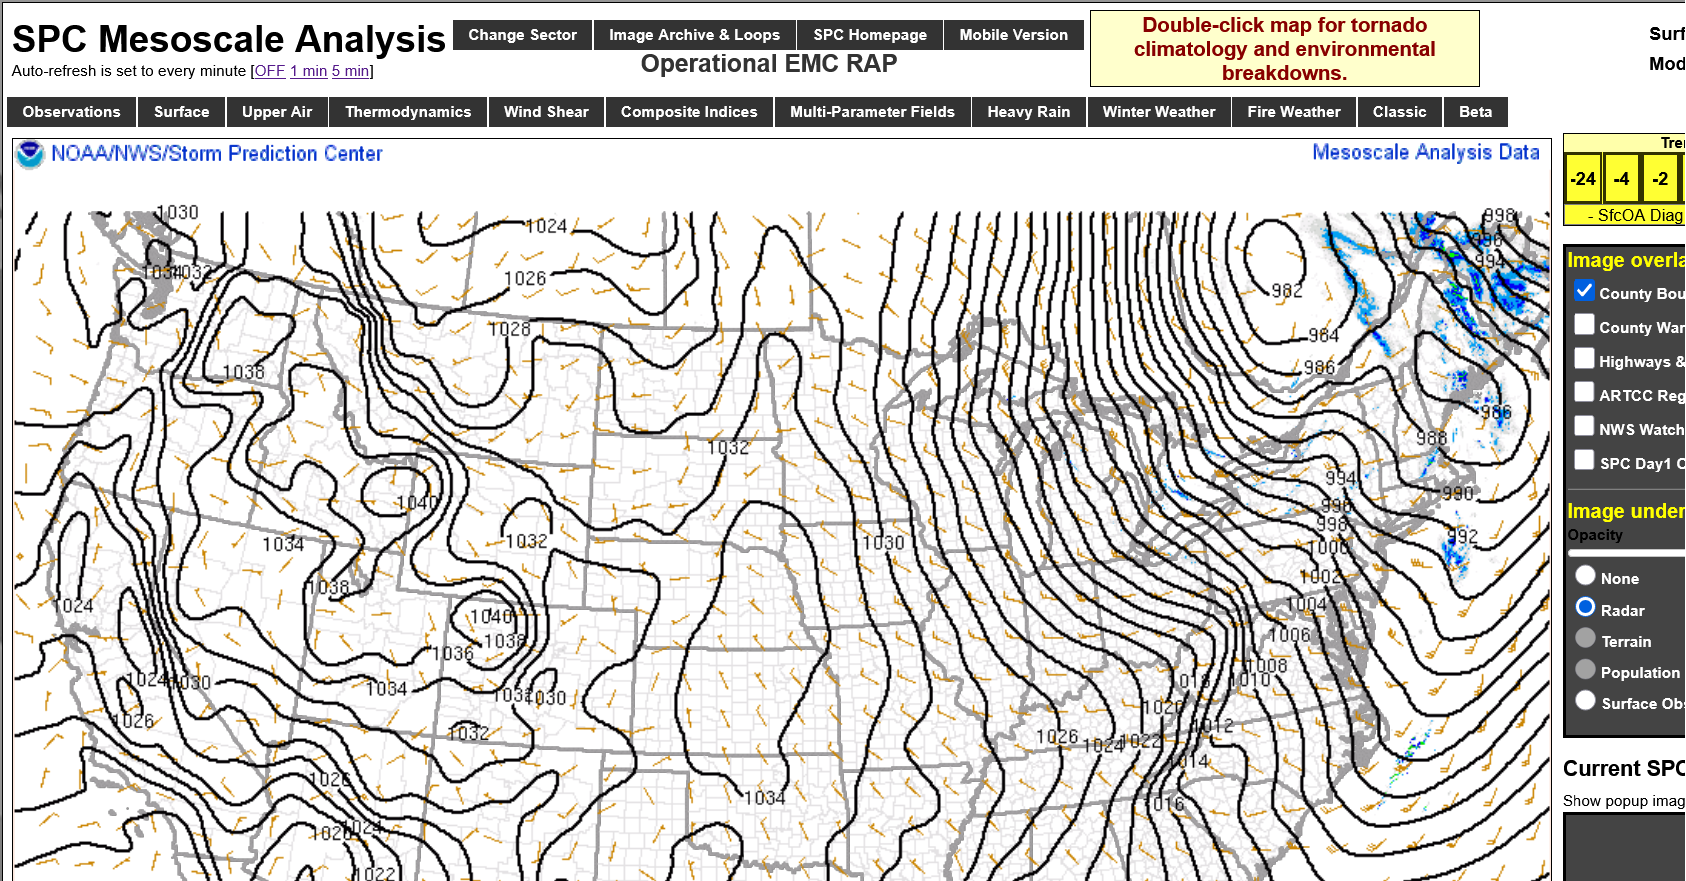
There goes the departing windbag storm with a center in Southeast Canada and another one in Maine! You can get thousands of times more information like this for free at the link below. This is a freeze frame after 5pm CST.
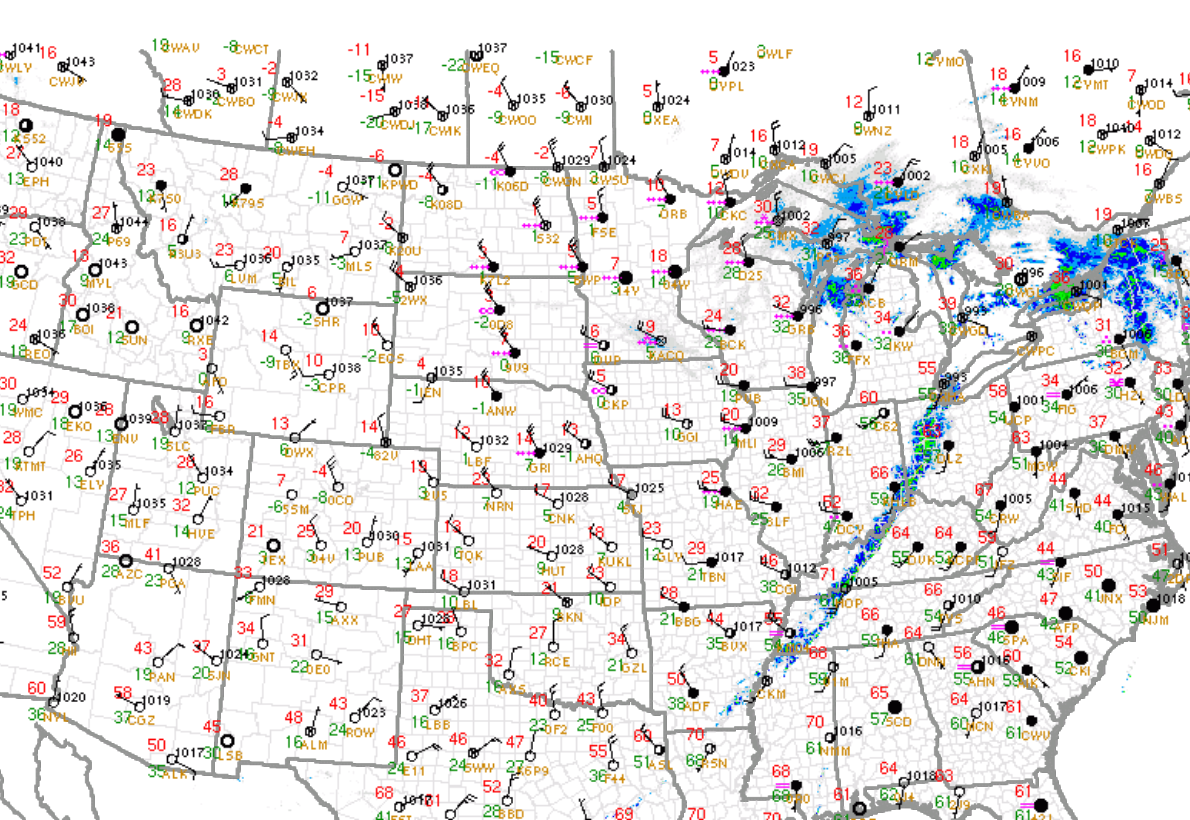
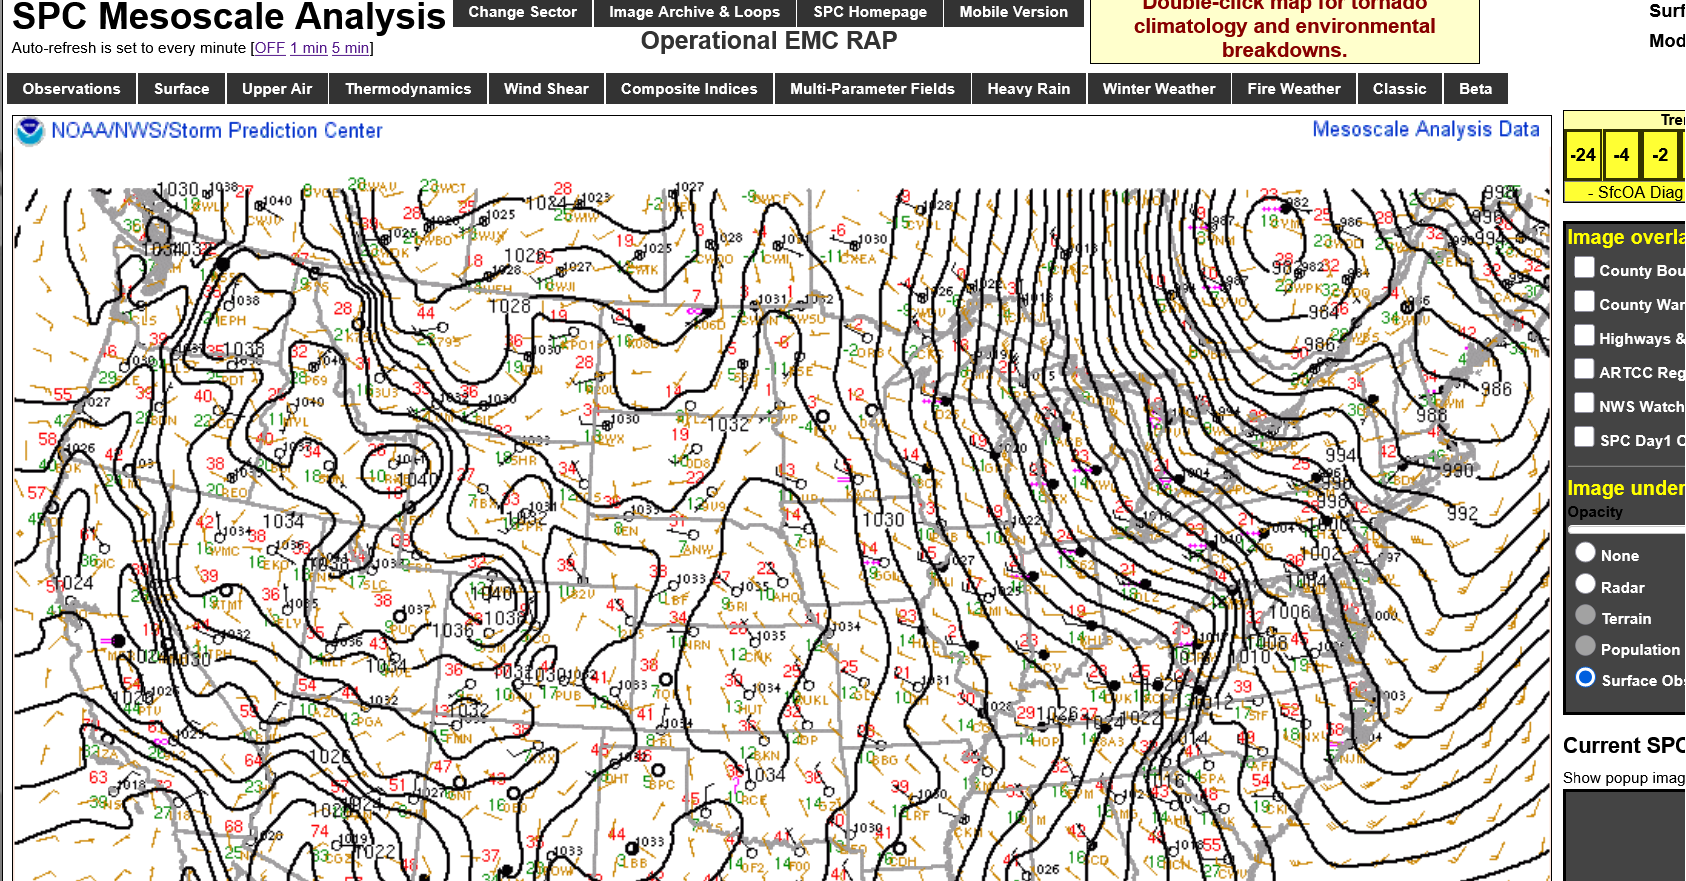
The 2nd map is just before 6pm. I took off the counties and radar from the first map and added the surface observations.


