The new week is the perfect time for a new NG thread! My fingers will appreciate this. :)
Thanks very much, Larry!
The natural gas threads pile up the most posts in a short period of time for sure. If not for you, those threads might go into the hundreds of posts .
Actually, your timing is almost perfect for deciding when to start a new thread. Much appreciated!
This was the last one to get the background for where we are today:
NG 12/1/25-12/12/25
64 responses |
Started by WxFollower - Dec. 1, 2025, 9:09 a.m.
It appears as if we're in for a HIGHER open!
We did open higher and briefly spiked to over $1,000/contract higher with not much bullish hopes as long as the forecast stays mild in December.
Same weather story here on Monday!
Huge warm up this week!
Started by metmike - Dec. 13, 2025, 9:25 p.m.
https://www.marketforum.com/forum/topic/116566/
++++++++++++++++++
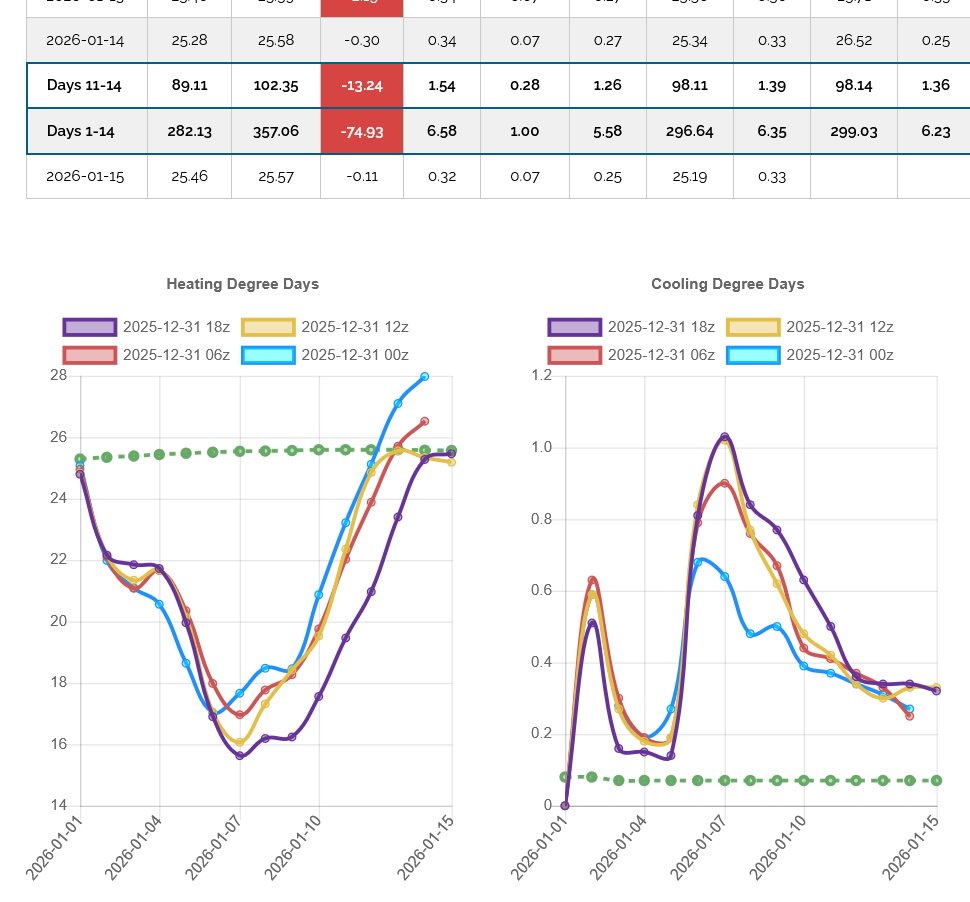
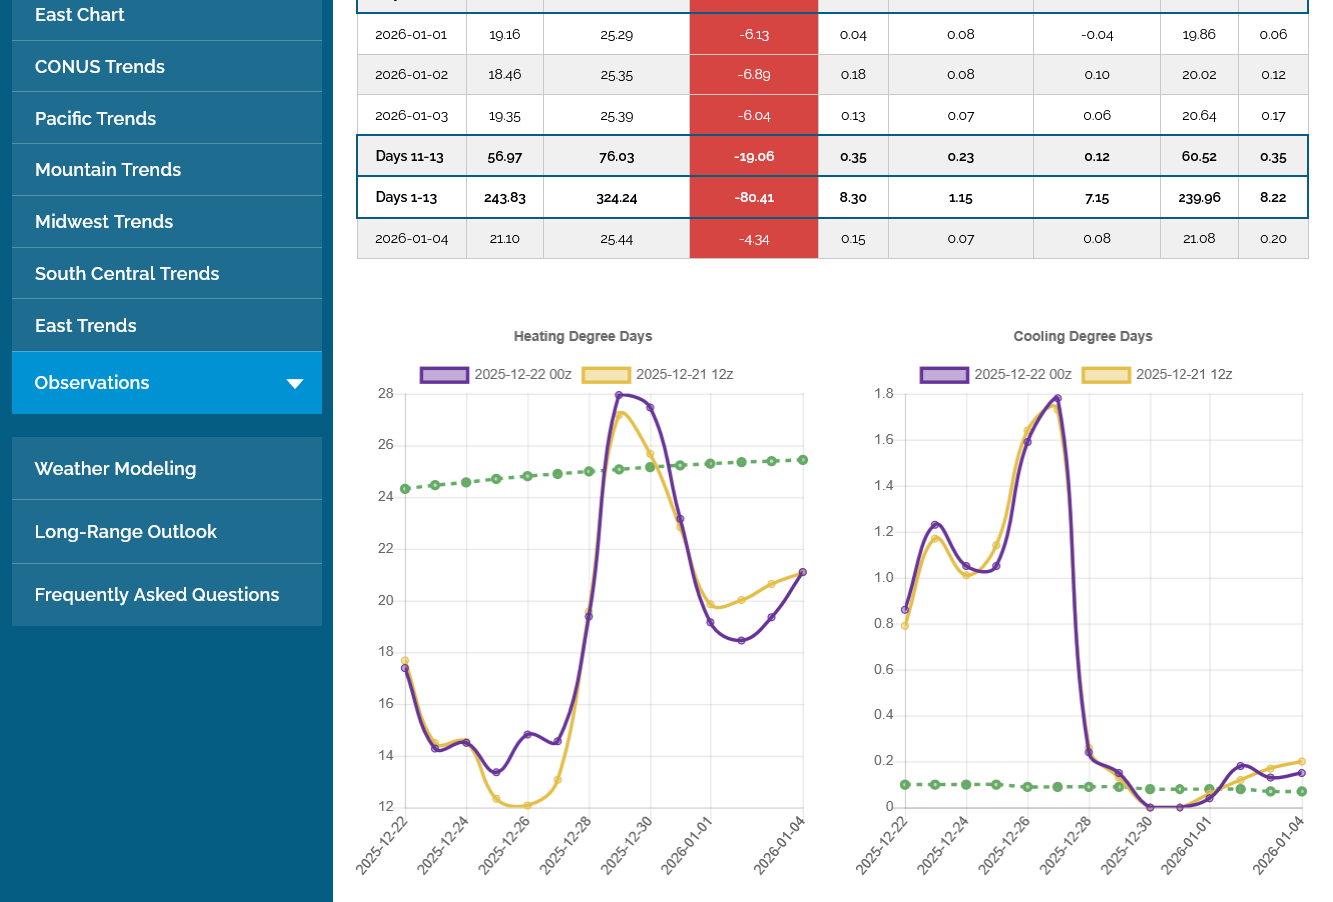
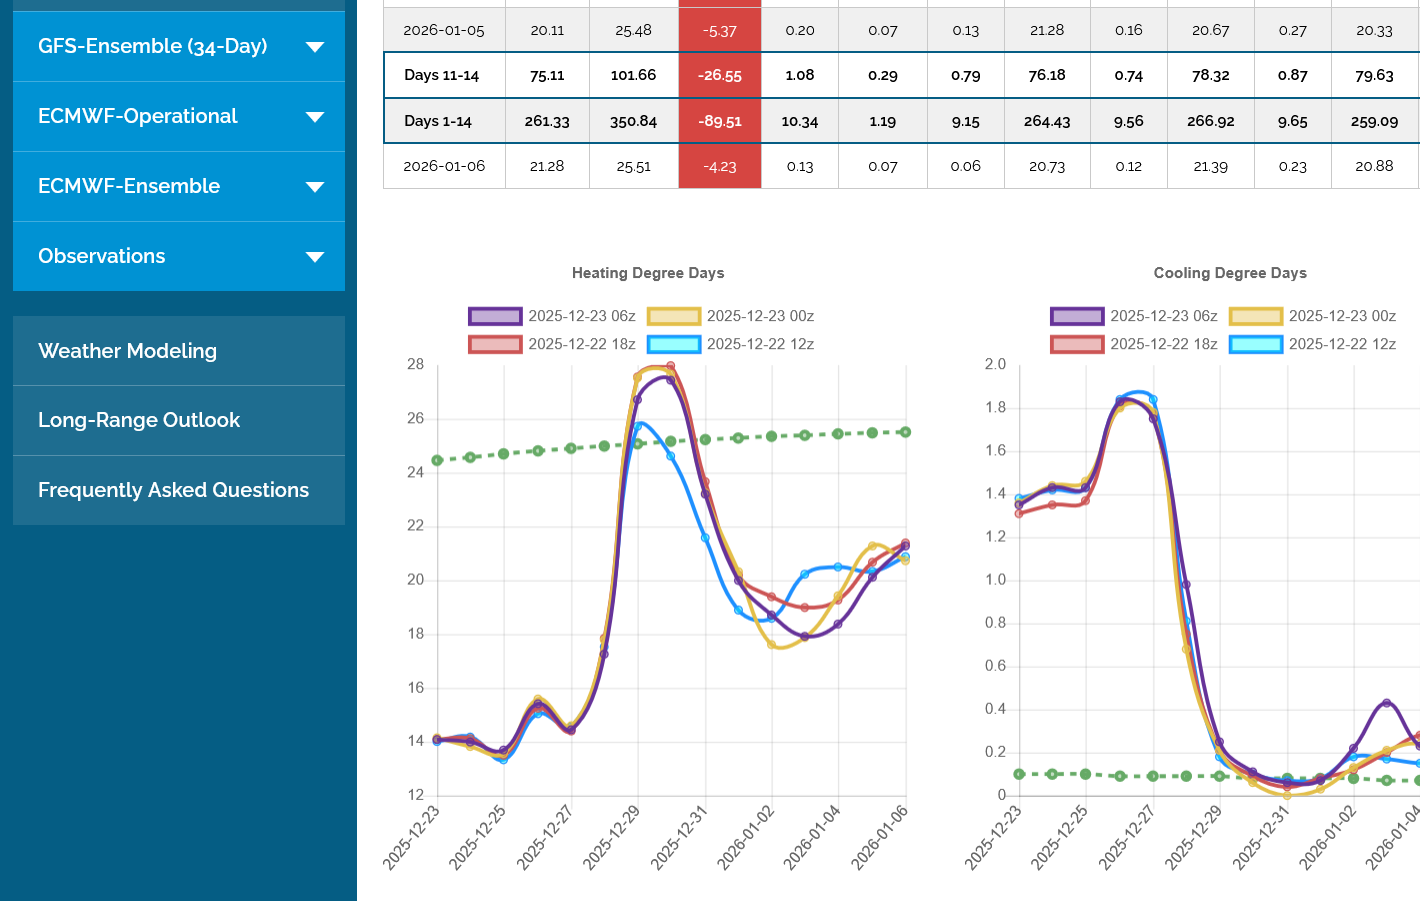
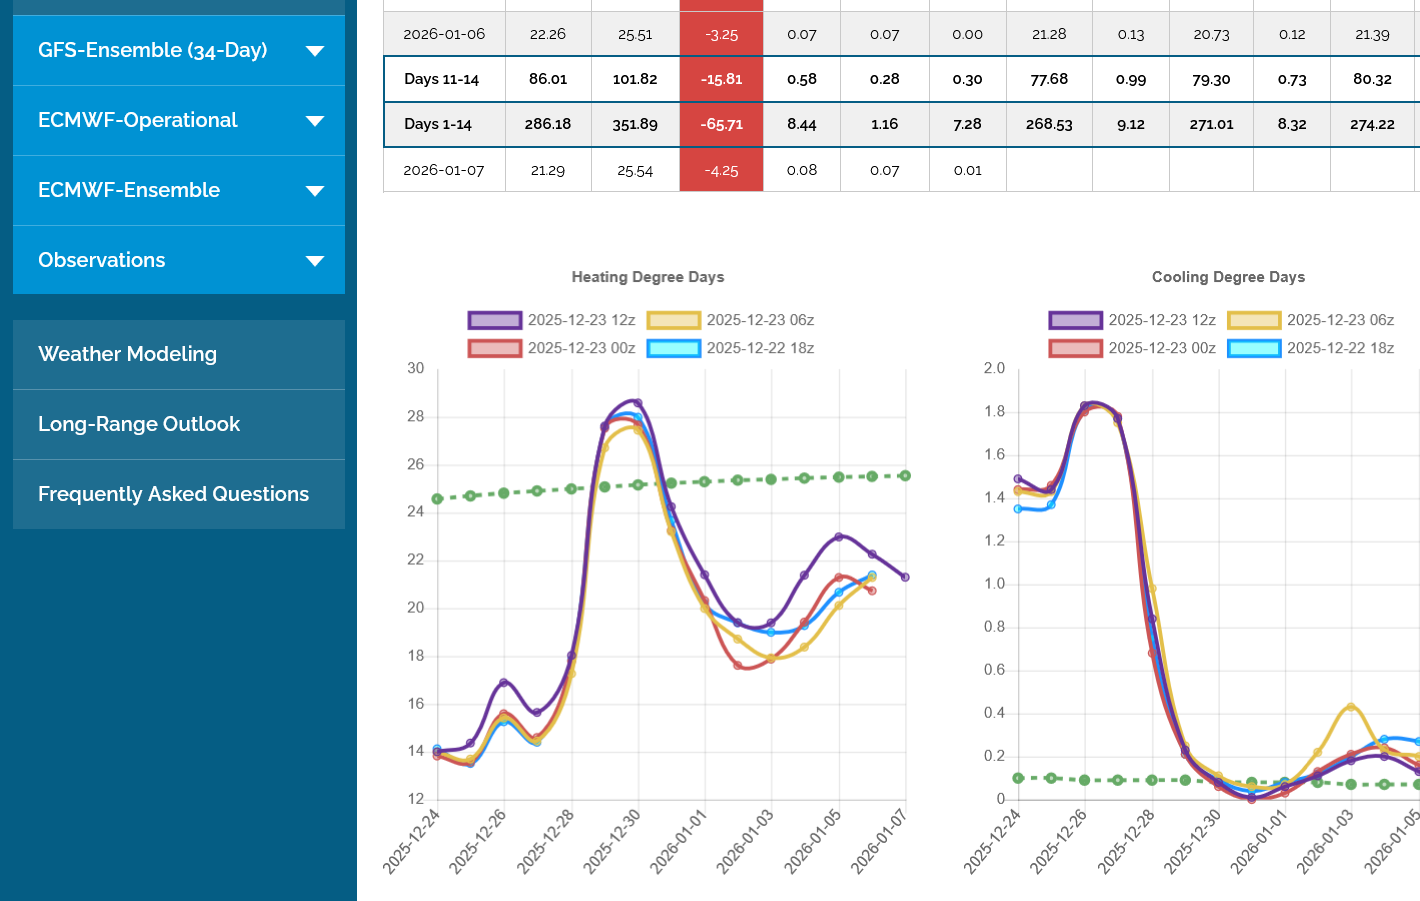
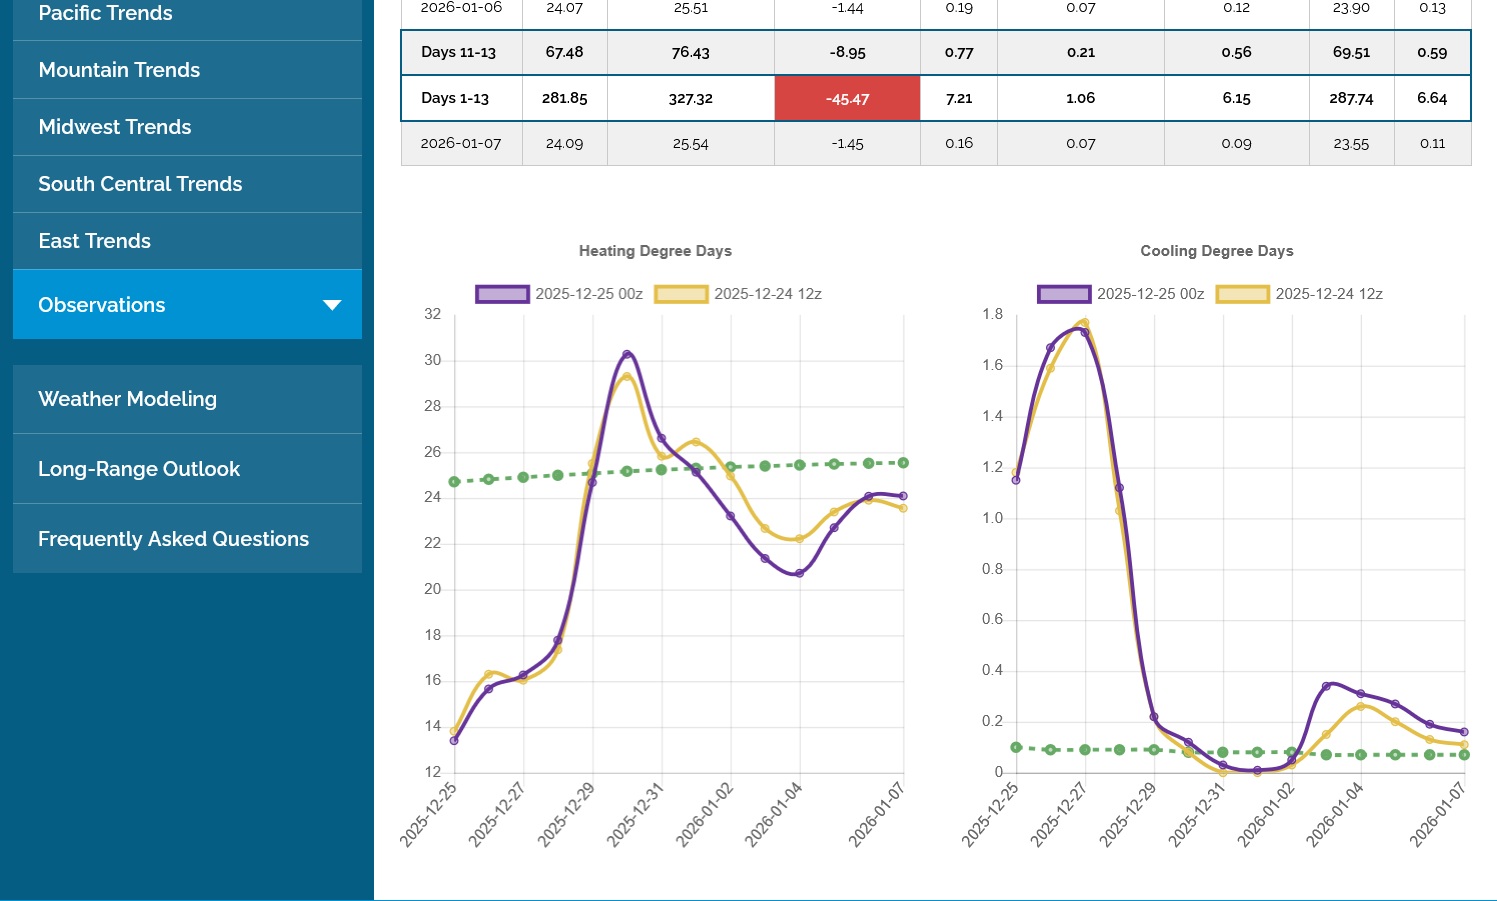
The last 0z European Ensemble average in purple/left showed the same thing. HDDs MUCH below average and continuing that trend at the end of the period.......for now. Some frigid air in Canada does leak south of the border but not enough penetrates deeply to have a significant impact on HDD's.
With such a steep temp gradient(north/south) a big shift south would turn bullish.
Note below, how far below the lines on the left are below the slowly increasing average line in green.
The lines start going up again at the end of the period, with a chance for that to lead towards a much colder week 3.
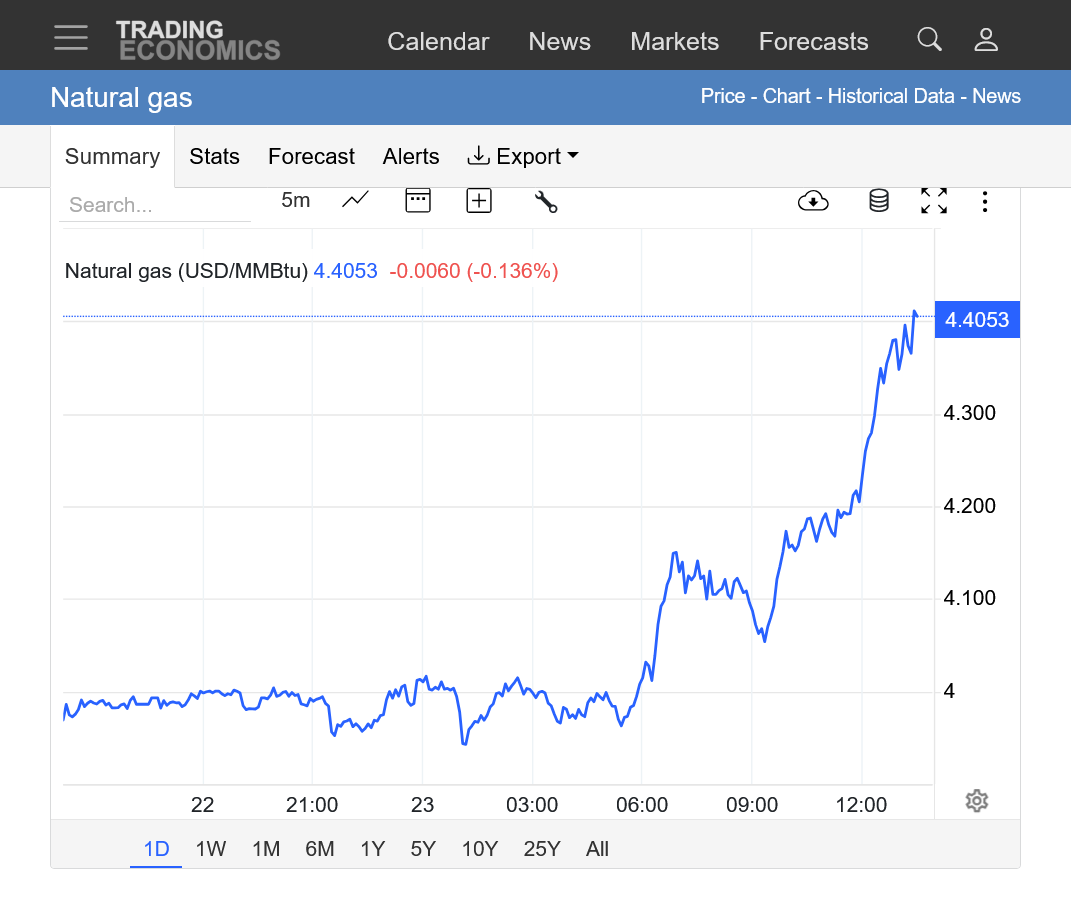
Is NG finally bottoming? It’s currently up 3%. If this were to hold, this would be the best day since Dec 5th, the day it peaked way up at 5.48. There’s been only one other up day since then, Dec 9th, when it closed up 1/2%.
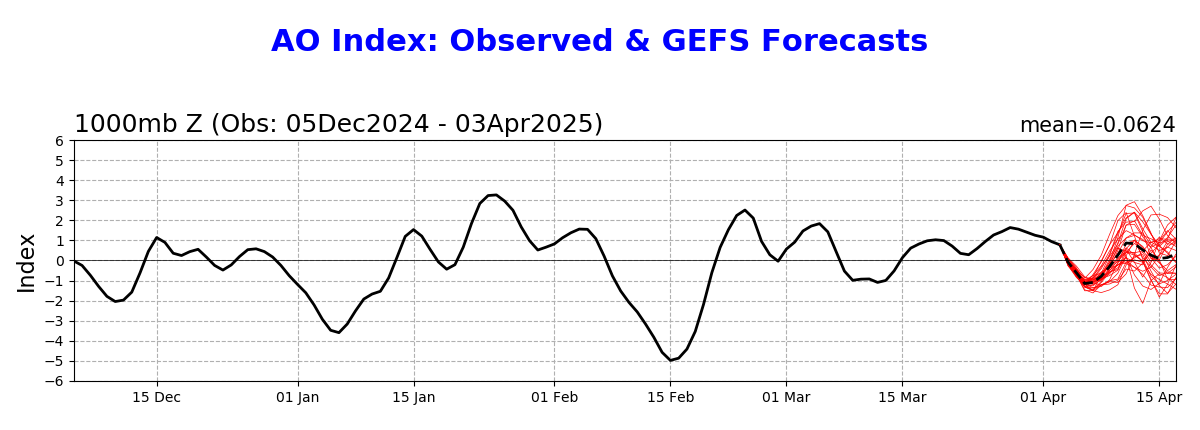
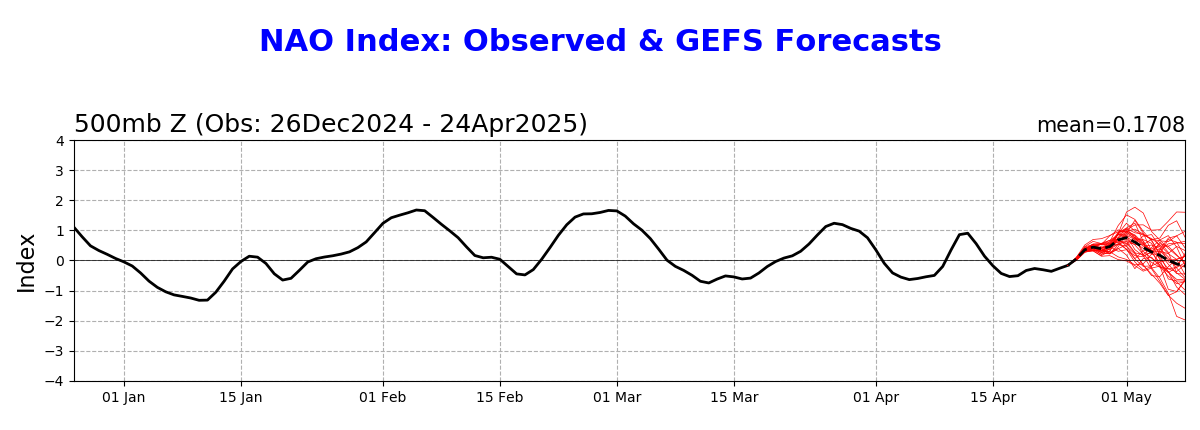
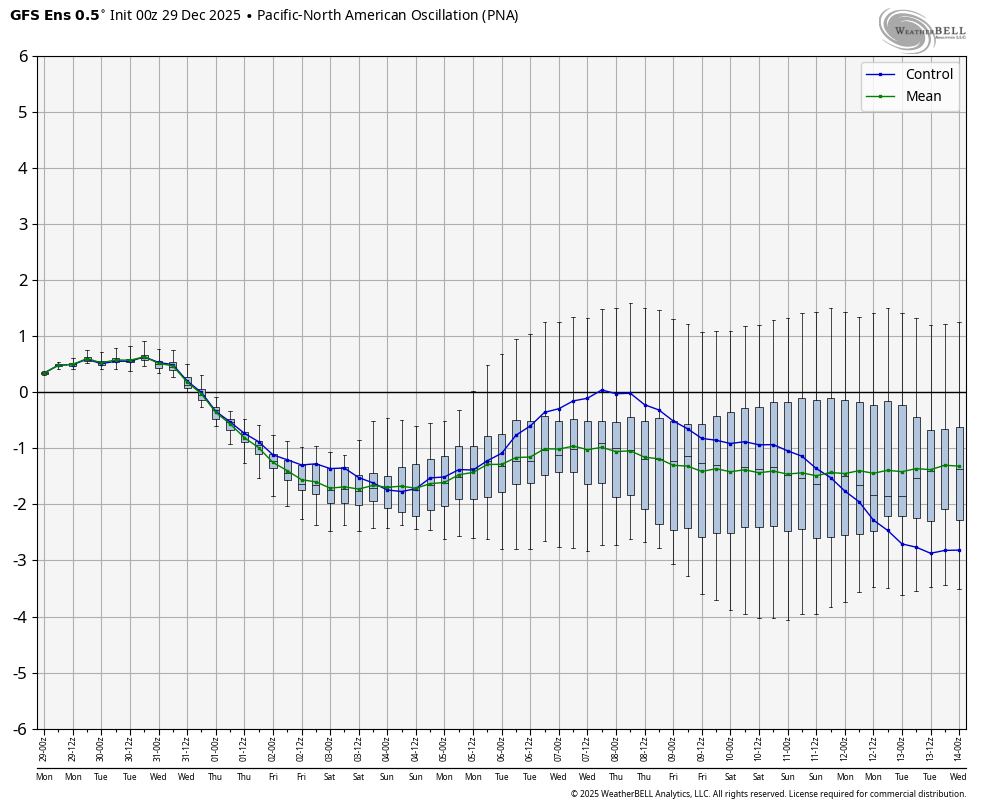
Why do I think it’s up today? The AO and especially the NAO forecasts have gotten significantly more negative than yesterday’s more neutral forecasts. A strong -NAO lead to much colder 0Z and 6Z GFS after Christmas fwiw. This kind of thing happened for early this month.
Yesterday’s GEFS NAO forecast:
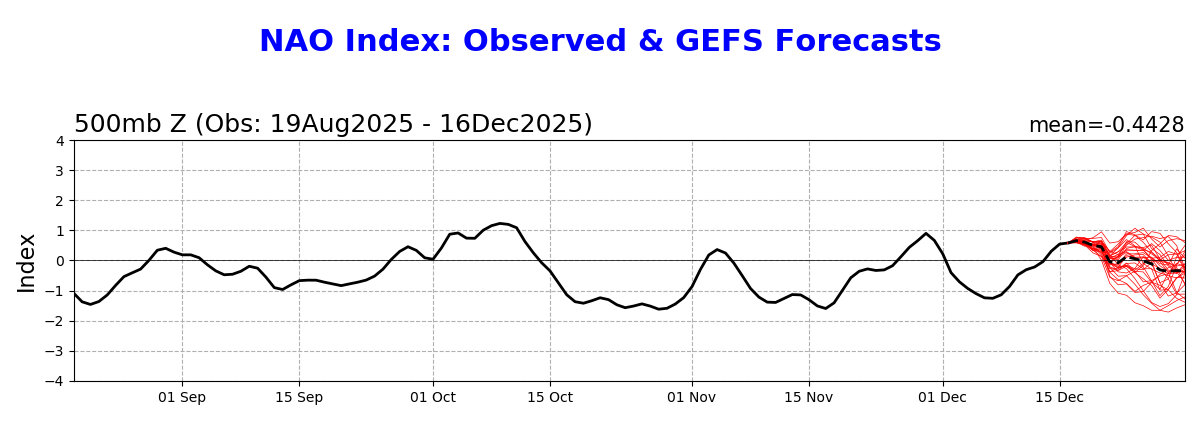
Today’s GEFS NAO forecast:
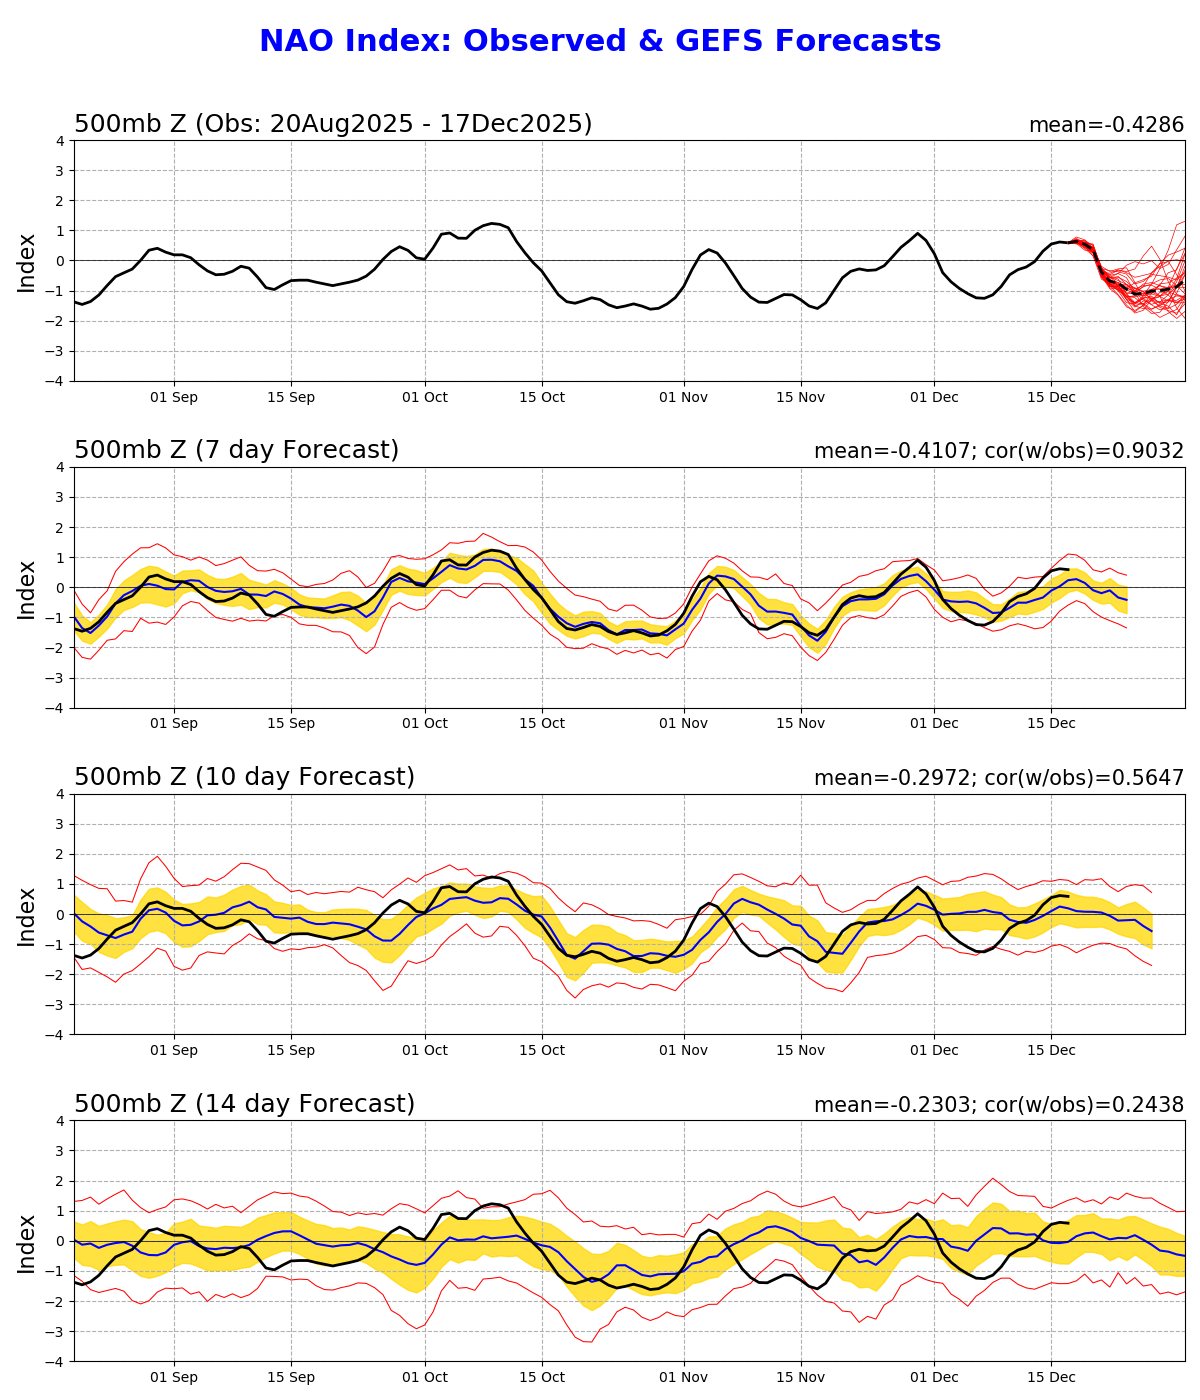
I agree with you, Larry!
I've been watching the AO and NAO drop this week with interest too.
As you remember though, the models busted badly ahead of all the cold air because they continually INCREASED the AO and NAO to values that would typically mean a pattern change to milder..........then day after day, week after week, the models would have to add colder days and a colder pattern to the updated forecasts.
However, just because something happened during 1 time frame doesn't mean we can apply it to other times frames. In this case, I'm just noting how crummy the models have been at forecasting the AO and NAO the past month.
You did a wonderful job pointing this out here just over a week ago!
By WxFollower - Dec. 8, 2025, 11:32 a.m.
++++++++++++++
Maybe this means that the cold will be even colder than the AO and NAO like it was before???
Regardless, like you said the market acts like it's put in a temporary bottom here.
Part of that is that we came much too far down in too short of a period. I think it was a short term selling exhaustion.
NG is a market that, especially today will OVER react at times. In retrospect, the extreme blow off top higher earlier this month was an extreme, over reaction to the upside. Then the drop was an over reaction to the downside.
This last 0z European Ensemble model was +9 HDDs vs the previous one 12 hours earlier.
These were mainly from individual days as you can see below with the trajectory of the purple line at the end of the period being in a bearish posture. Also, the previous run was that much bearish(so all we did was take that away) and after that run came out yesterday, NG had a strong rally instead of dropping from the bearish 12z EE run.
Should be a robust drawdown tomorrow at 9:30 am for the EIA NG storage report. Quite a contrast across the country.
More people live where it was cold compared to where it was warm and estimates for residential heating demand based on temperature forecasts is the most important factor in driving natural gas futures prices in December.
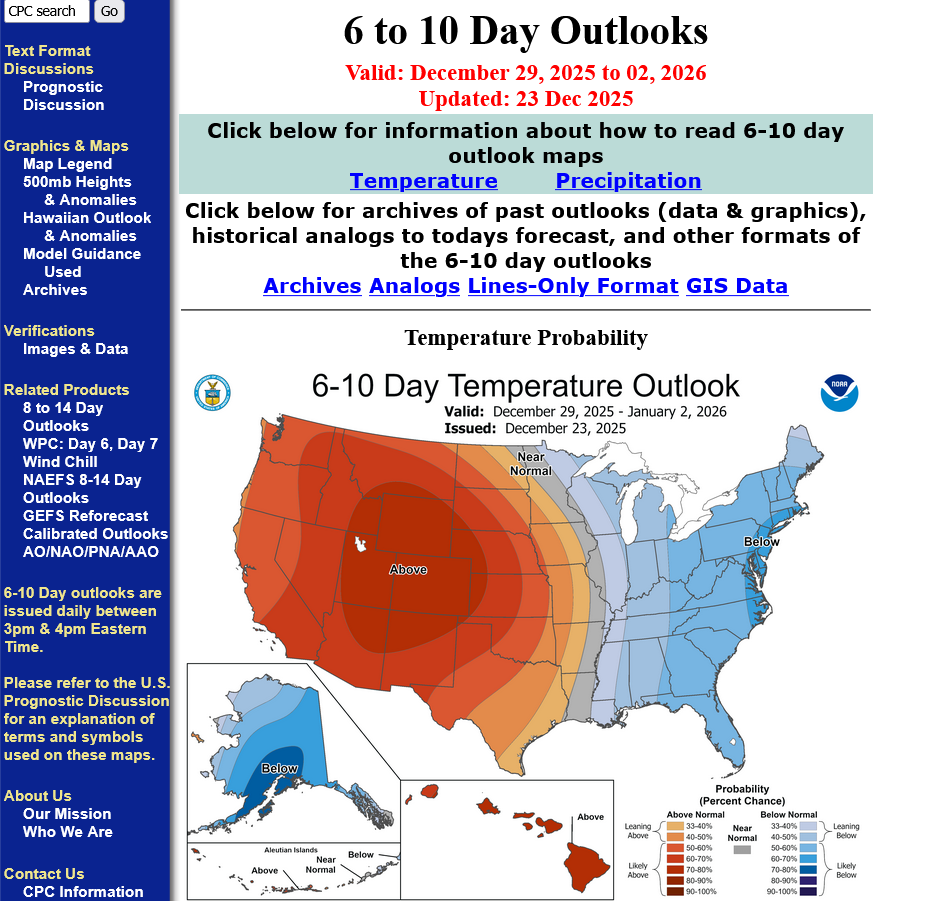
https://www.cpc.ncep.noaa.gov/products/tanal/temp_analyses.php
NG easily had its best day since Dec 5th.
By metmike - May 2, 2022, 11:42 p.m.
https://www.psl.noaa.gov/map/images/ens/ens.html#nh
NCEP Ensemble t = 360 hour forecast 
NCEP Ensemble t = 360 hour forecast 
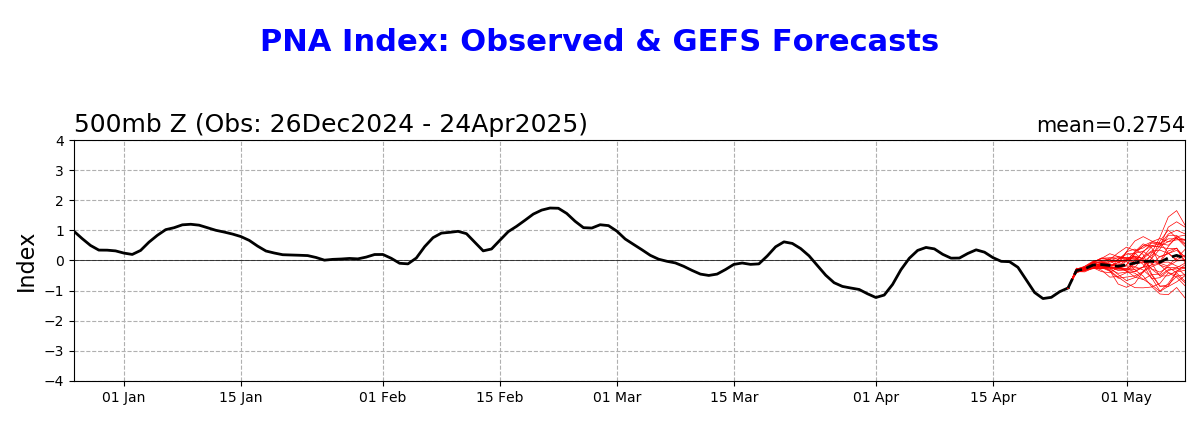
Arctic Oscillation Index, North Atlantic Oscillation Index, Pacific North American Index.
https://www.cpc.ncep.noaa.gov/products/precip/CWlink/daily_ao_index/ao.shtml
https://www.cpc.ncep.noaa.gov/products/precip/CWlink/pna/nao.shtml
https://www.cpc.ncep.noaa.gov/products/precip/CWlink/pna/pna.shtml
-4 HDDs on the last 12z European Ensemble model (blue/left) but NG continued soaring higher all afternoon!
Look how far the lines are BELOW the slowly increasing average in green. Average temperatures bottom out in around a month.

-167 Bcf. Robust for this time of year. Corrected, thanks to WxFollower!
NG was already well off the highs but this caused a spike lower almost back to UNCH for the February contract. Must have been a tad less/bearish than expected.
Still no sign of much colder weather, so the weather continues to be bearish. Hard for NG to generate long lasting upside when the 2 week forecasts are this mild.
![]()
for week ending December 12, 2025 | Released: December 18, 2025 at 10:30 a.m. | Next Release: December 24, 2025
| ks billion cubic feet (Bcf) | Year ago (12/12/24) | 5-year average (2020-24) | |||||||||||||||||||||||
| Region | 12/12/25 | 12/05/25 | net change | implied flow | Bcf | % change | Bcf | % change | |||||||||||||||||
| East | 797 | 843 | -46 | -46 | 827 | -3.6 | 834 | -4.4 | |||||||||||||||||
| Midwest | 966 | 1,030 | -64 | -64 | 1,014 | -4.7 | 1,014 | -4.7 | |||||||||||||||||
| Mountain | 271 | 277 | -6 | -6 | 275 | -1.5 | 223 | 21.5 | |||||||||||||||||
| Pacific | 304 | 306 | -2 | -2 | 297 | 2.4 | 268 | 13.4 | |||||||||||||||||
| South Central | 1,242 | 1,290 | -48 | -48 | 1,226 | 1.3 | 1,208 | 2.8 | |||||||||||||||||
| Salt | 338 | 354 | -16 | -16 | 338 | 0.0 | 337 | 0.3 | |||||||||||||||||
| Nonsalt | 903 | 936 | -33 | -33 | 888 | 1.7 | 871 | 3.7 | |||||||||||||||||
| Total | 3,579 | 3,746 | -167 | -167 | 3,640 | -1.7 | 3,547 | 0.9 | |||||||||||||||||
| Totals may not equal sum of components because of independent rounding. | |||||||||||||||||||||||||
Working gas in storage was 3,579 Bcf as of Friday, December 12, 2025, according to EIA estimates. This represents a net decrease of 167 Bcf from the previous week. Stocks were 61 Bcf less than last year at this time and 32 Bcf above the five-year average of 3,547 Bcf. At 3,579 Bcf, total working gas is within the five-year historical range.
For information on sampling error in this report, see Estimated Measures of Sampling Variability table below.

Note: The shaded area indicates the range between the historical minimum and maximum values for the weekly series from 2020 through 2024. The dashed vertical lines indicate current and year-ago weekly periods.
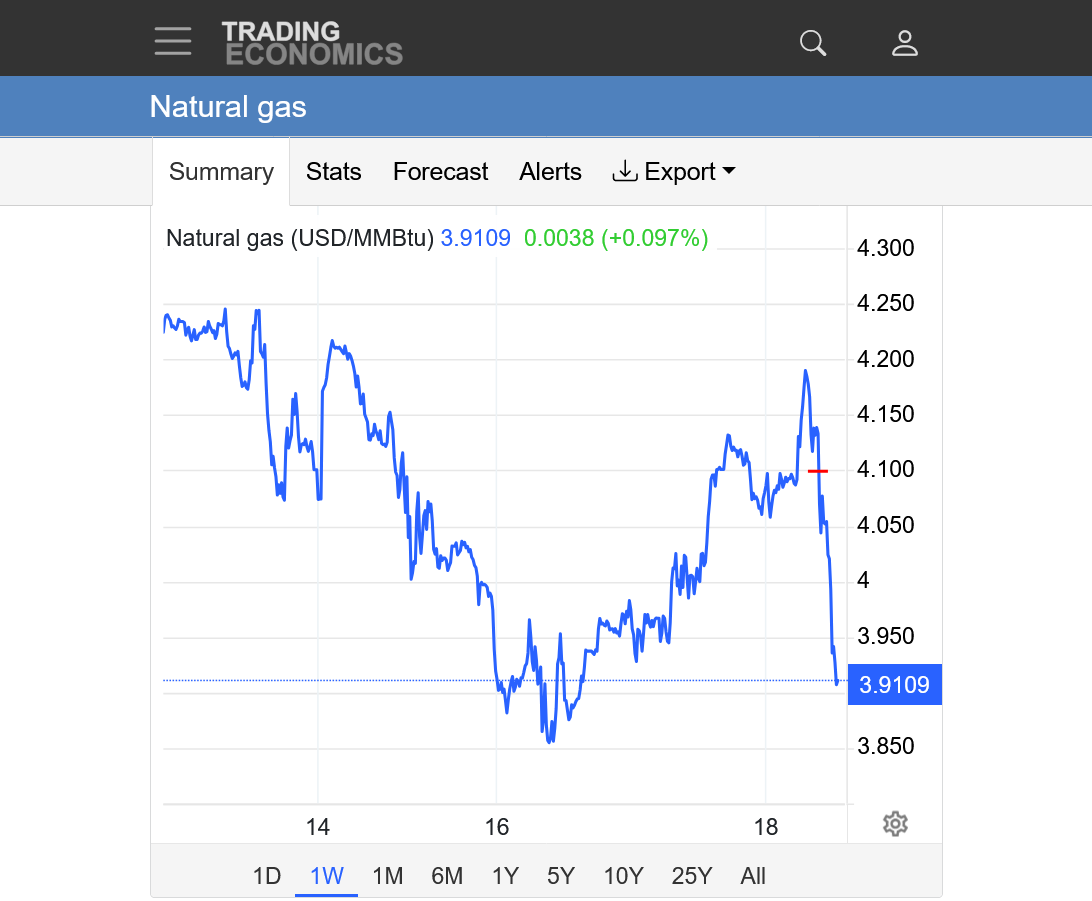
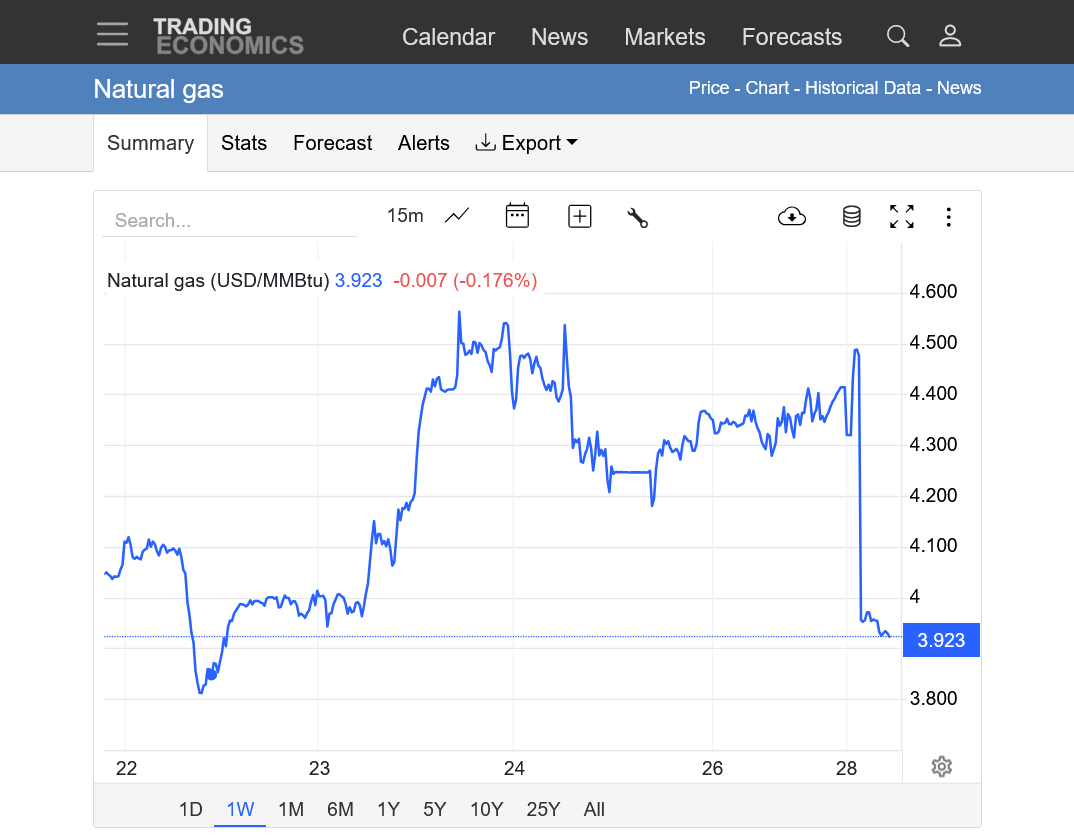
After a couple of up days, short covering and dead cat bounce, ng is back to sharply lower again.
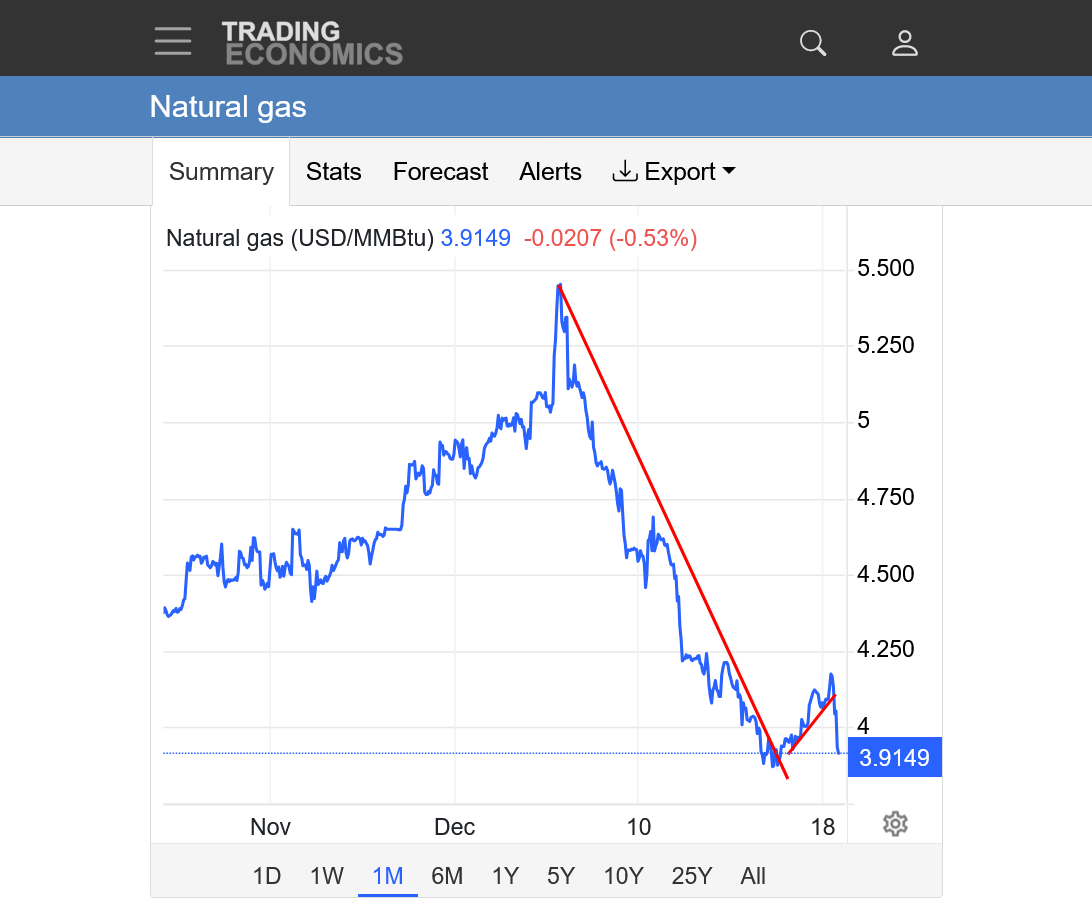
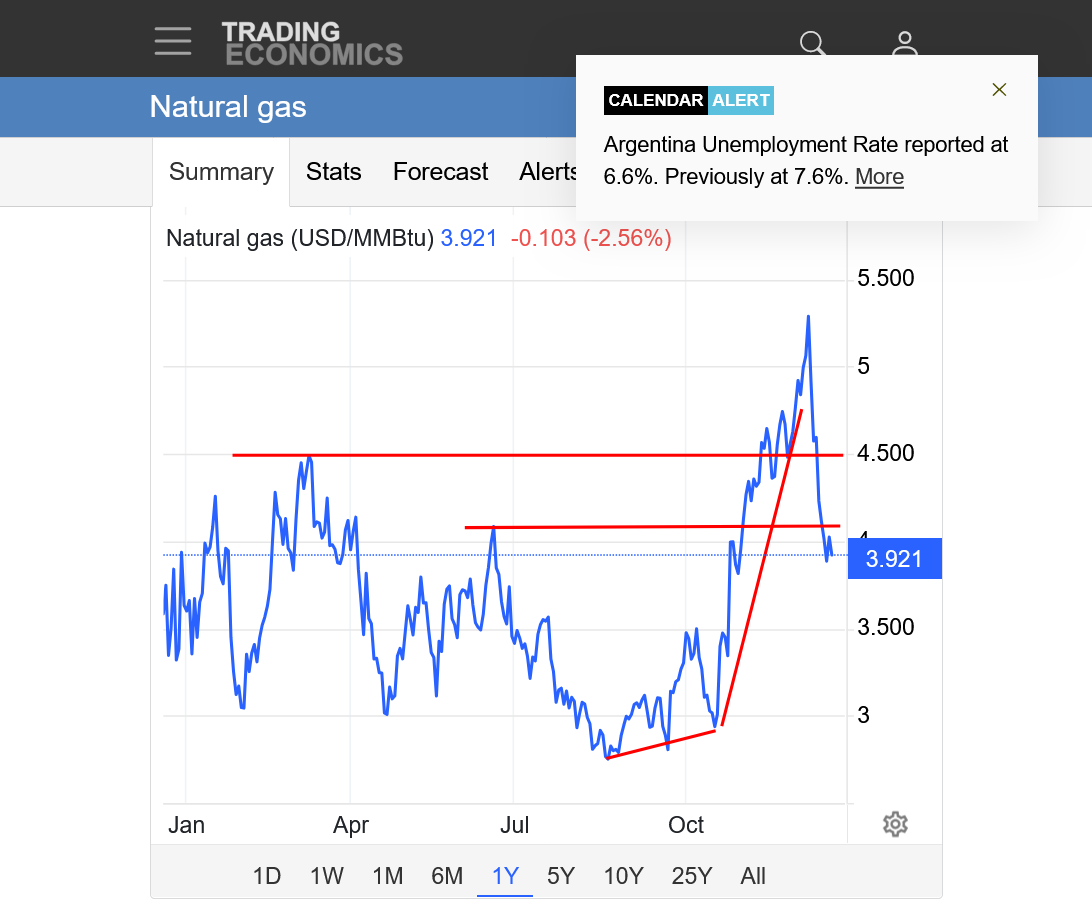
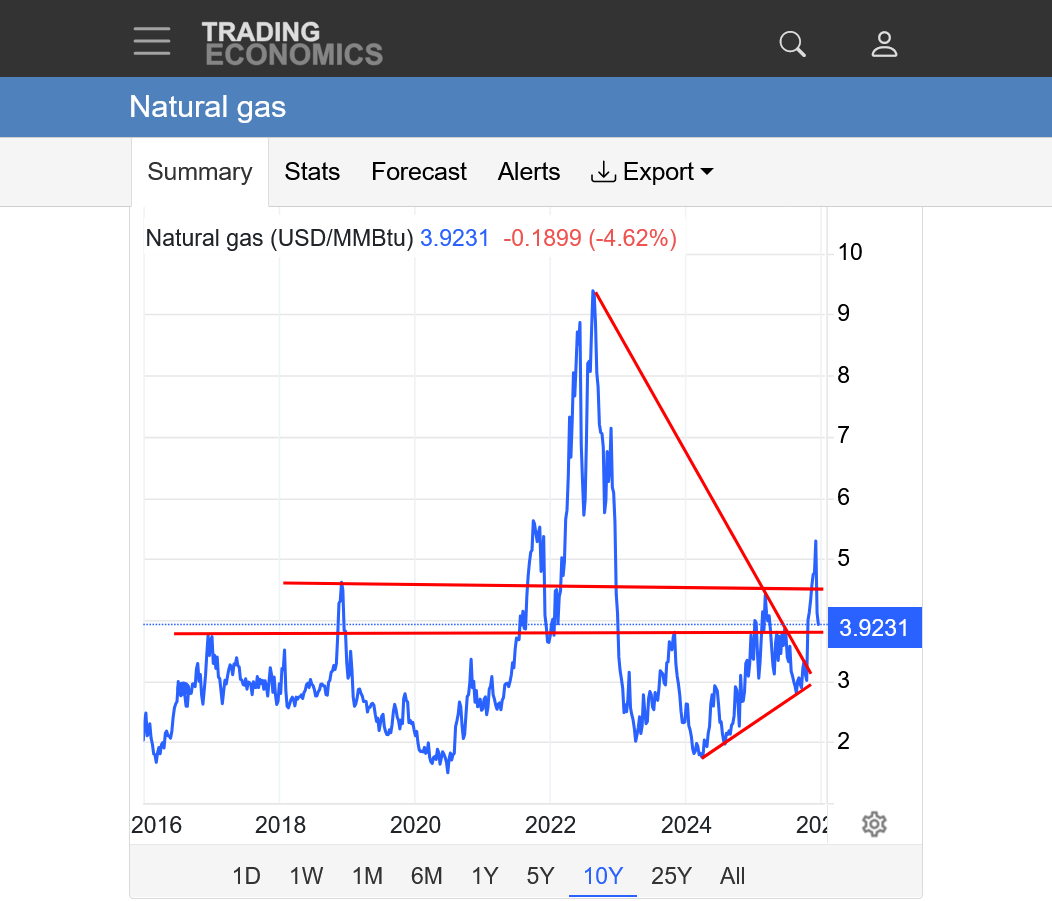
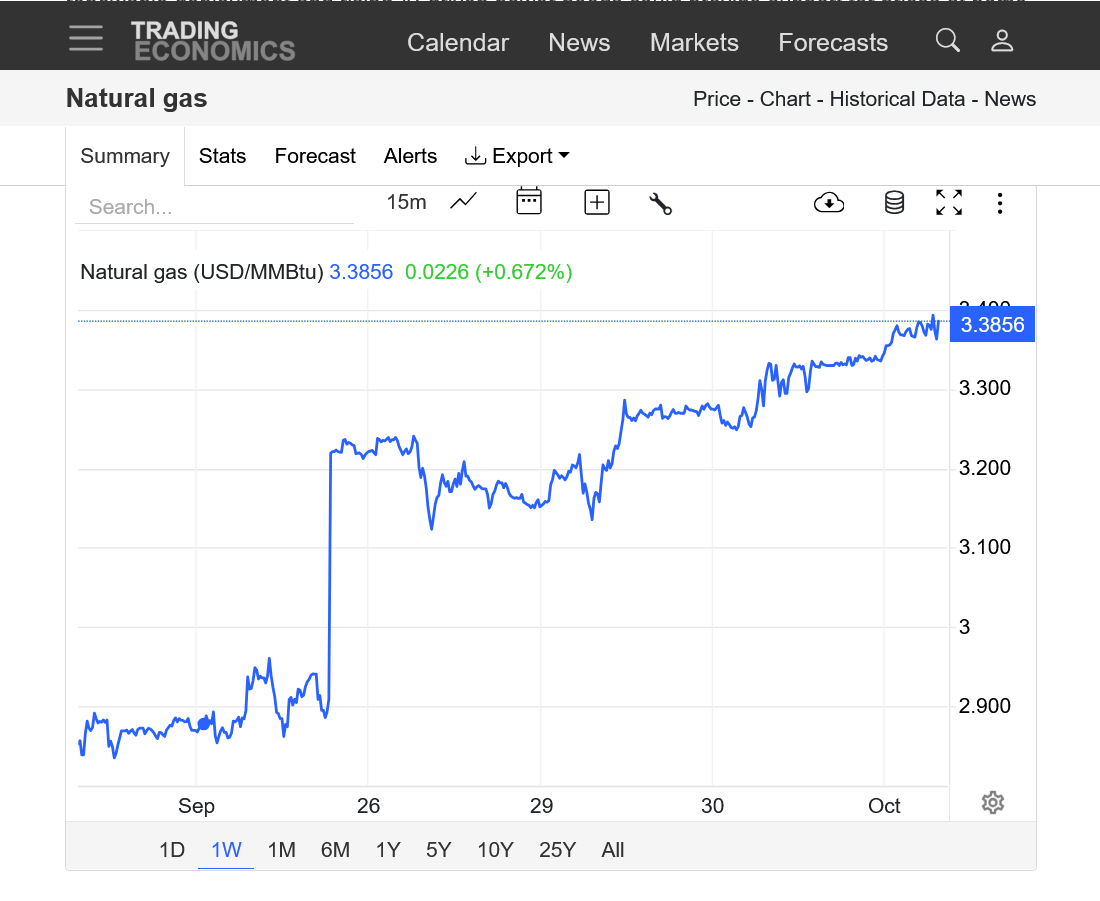
https://tradingeconomics.com/commodity/natural-gas
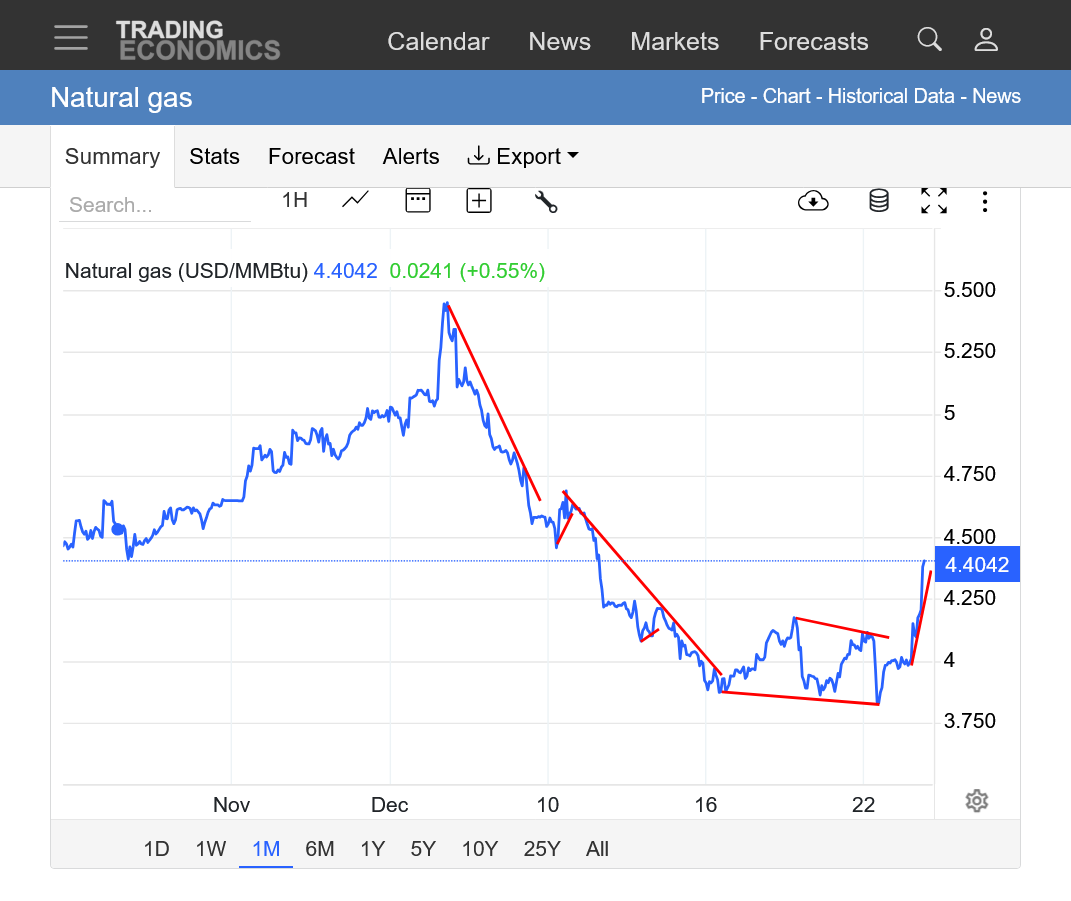
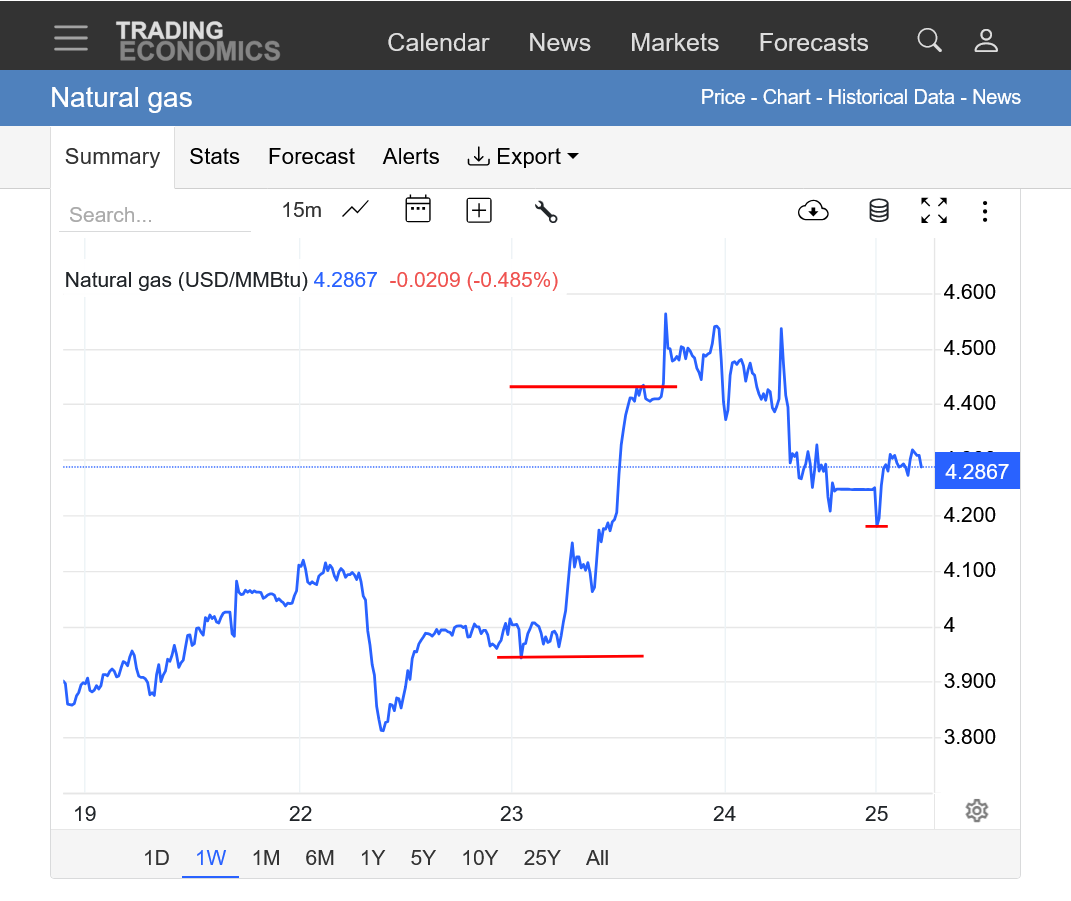
1. 1 day: Red line was when the EIA number was released.
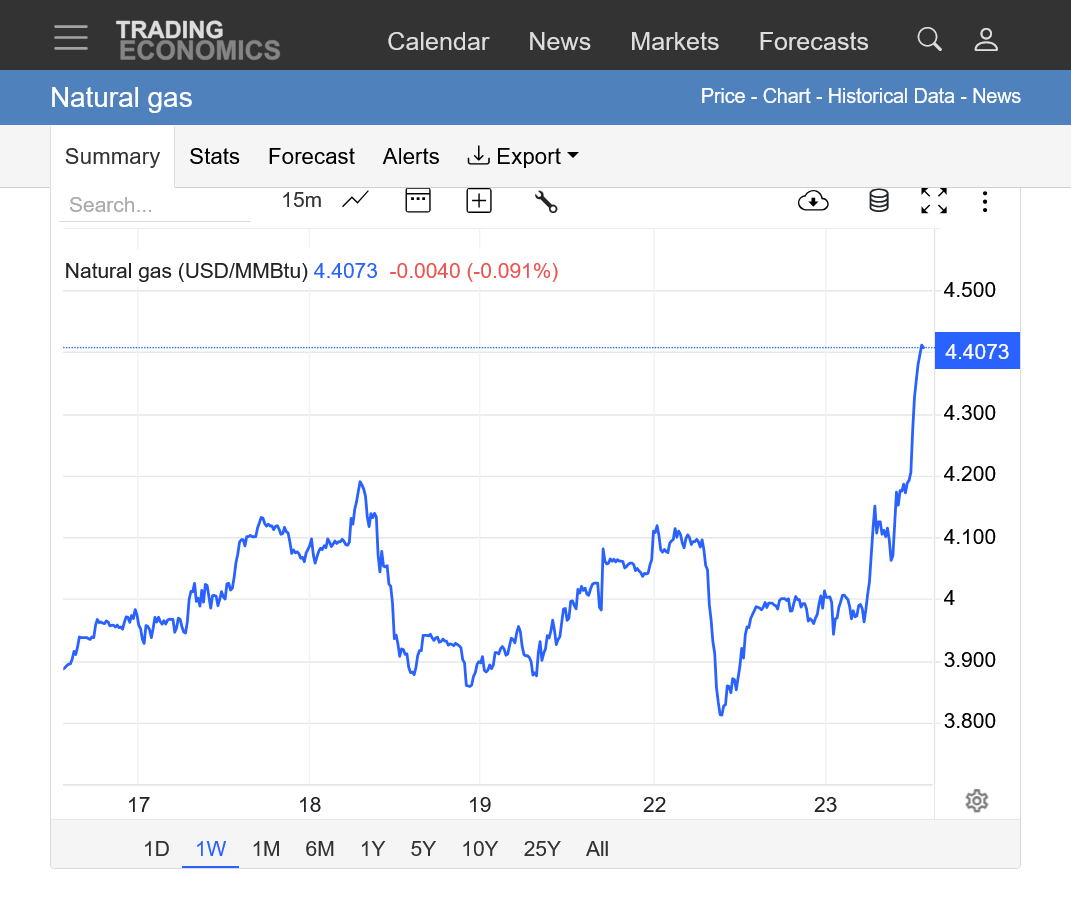
2. 1 week: Red line was when the EIA number was released.
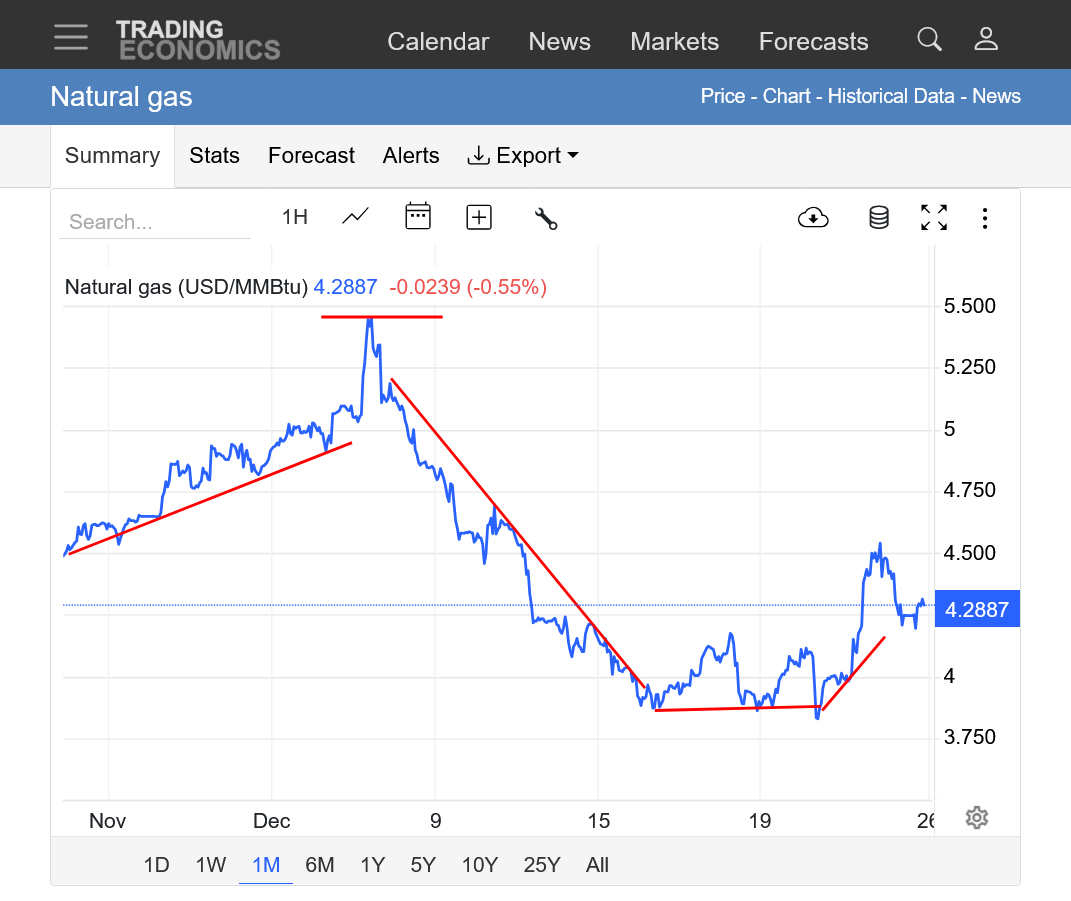
3. 1 month: Huge rally(blow off top in 12-5-25), followed by record collapse(greatest loss so fast in history) after the weather models turned sharply milder, starting 12-6/7).
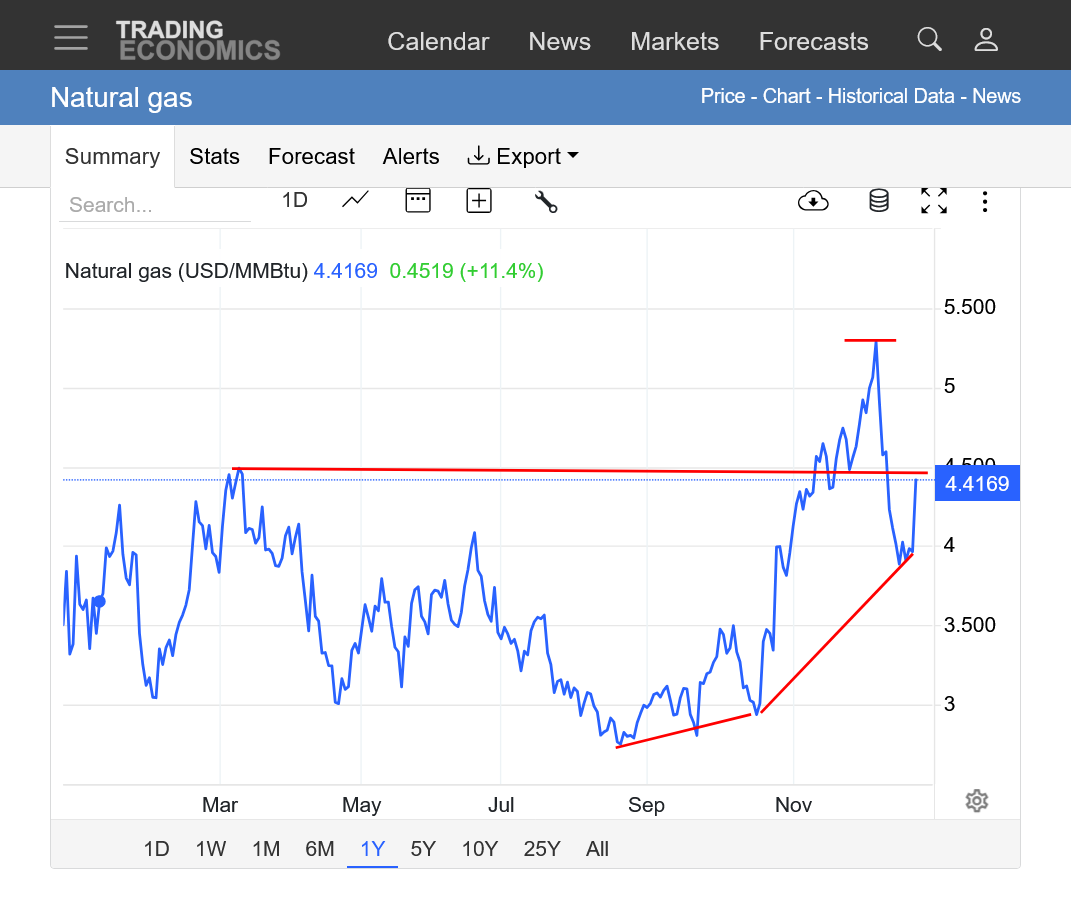
4. 1 year: False upside break out (FAILED) above March highs(from extreme cold, very early in the heating season) after significant low in early Sept. Spike straight down last week was the biggest/fastest drop in NG history.
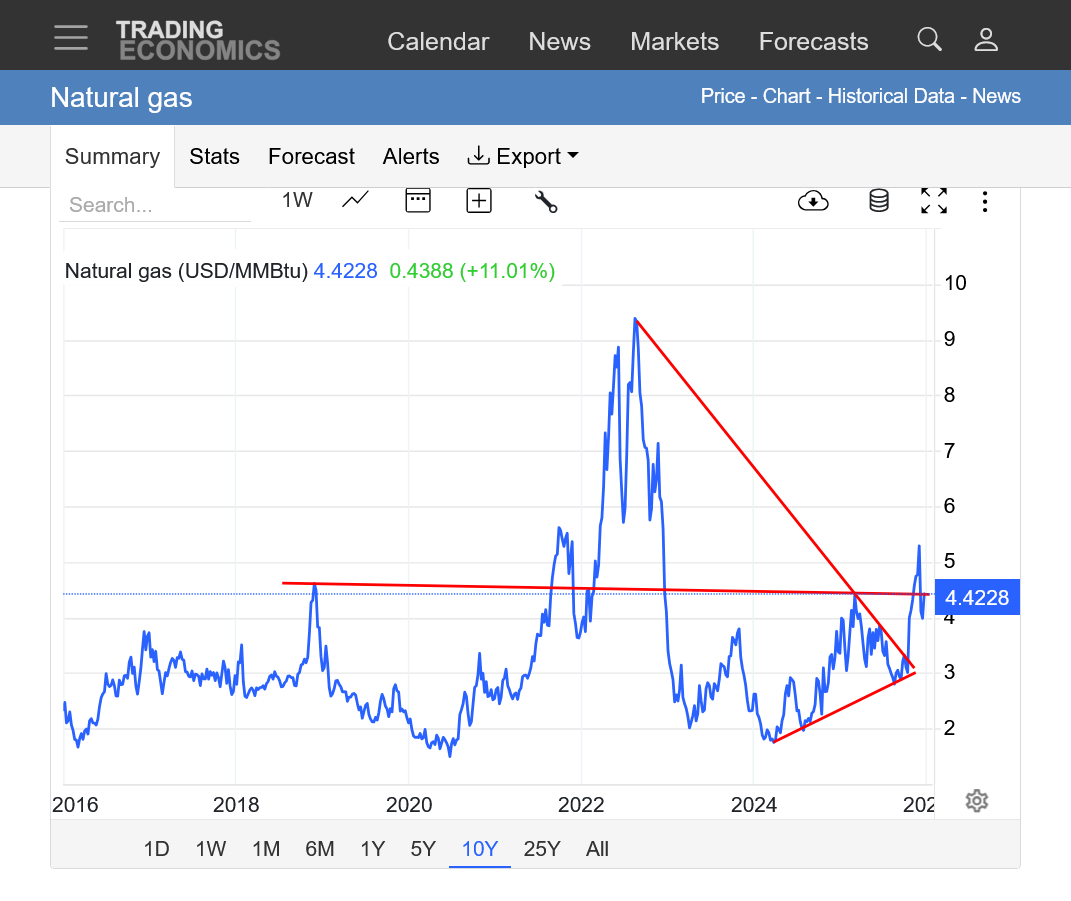
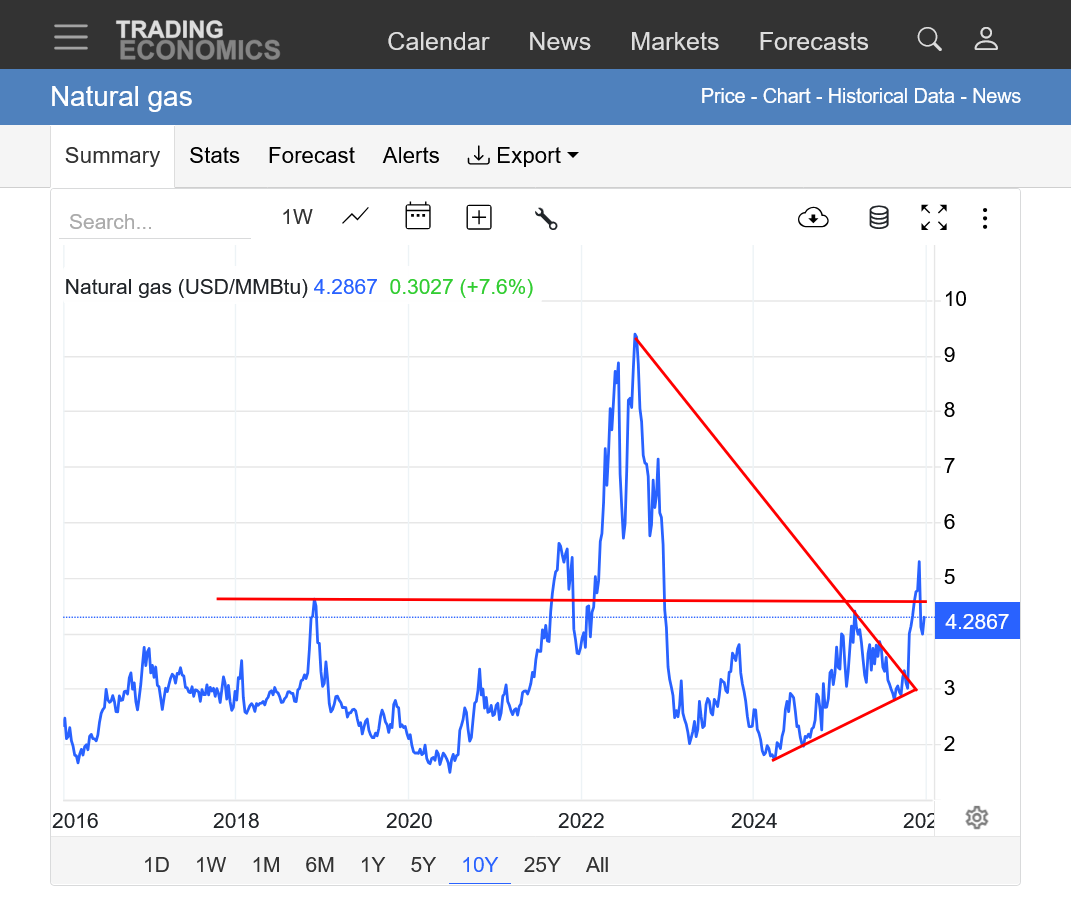
5. 10 years: Long term upside break out from symmetrical triangle (higher lows and lower highs) thats still valid. Lines of support/resistance drawn horizontally. Fake upside break out for shorter time frames as described above. 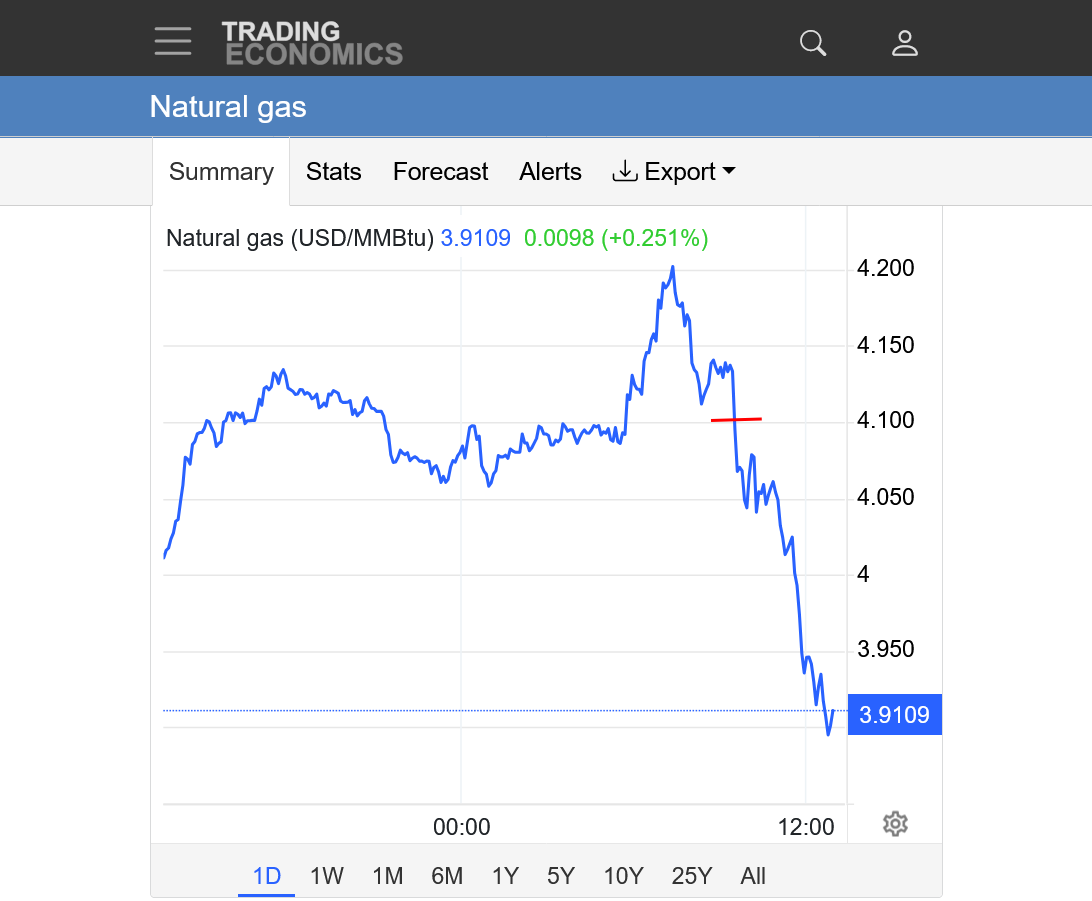
Been busier than usual but I'll try to catch up here.
NG opened higher from colder individual days in the forecast over the weekend. The overnight models were even colder for that reason, however the pattern is the same mild pattern late in the period. This colder change is the result of a surprise northern stream system next weekend that will break the milder pattern for several days as seen with the spike up of HDDs on the left.
This last 0z European Ensemble model was another +4 HDDs compared to the previous 12z run. Basically a 4 day spike up that interrupts but doesn't end the very mild, dominant pattern.
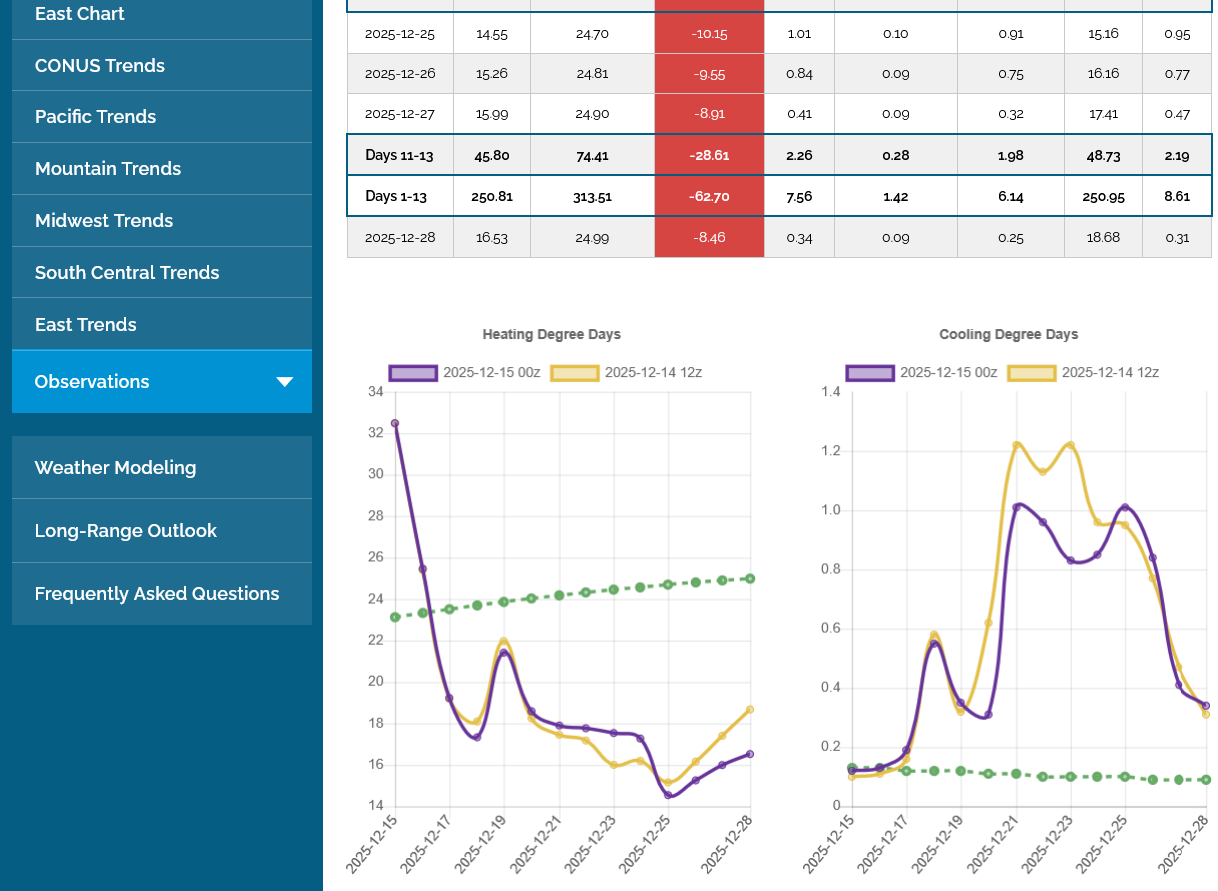
Below was the same HDD map from 5 days earlier. HDDs our on the left. Note how far below the green average line we were FOR EVERY DAY at that time:

++++++++++++++++++++++++++++==
This is the current jet stream at 250 mb or around 34,000 feet above the ground. Mainly west to east, mild zonal flow with a southwest component pumping up an upper level ridge in the center of the country that will lead to near record warmth this week.
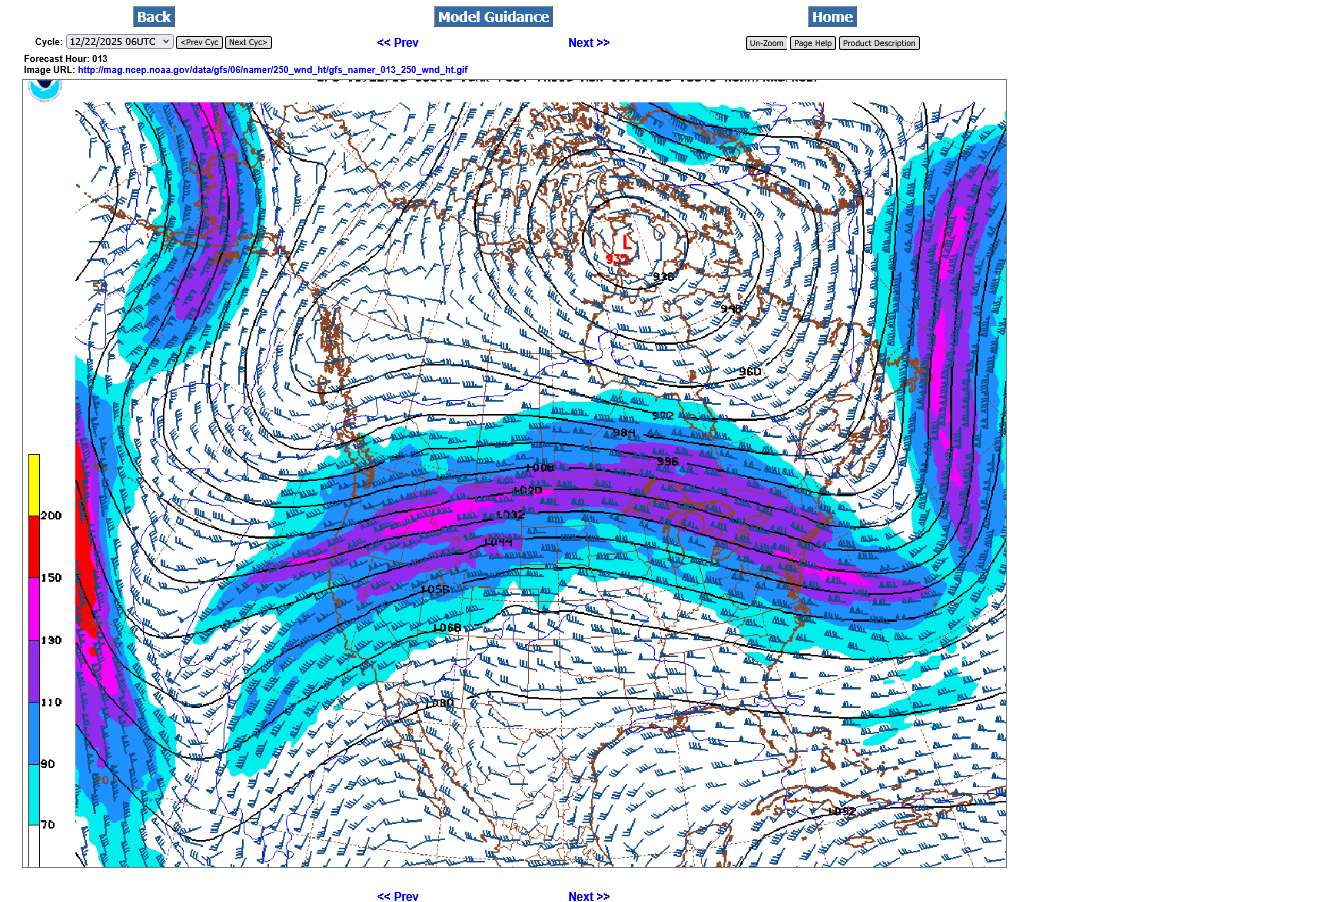
This is the jet stream next weekend. Note the "surprise", temporary development of an upper level low in Southeast Canada and the upper level winds on the backside taking on a north to south component This will drag down a slug of frigid air in Canada into the eastern half of the country for several days.
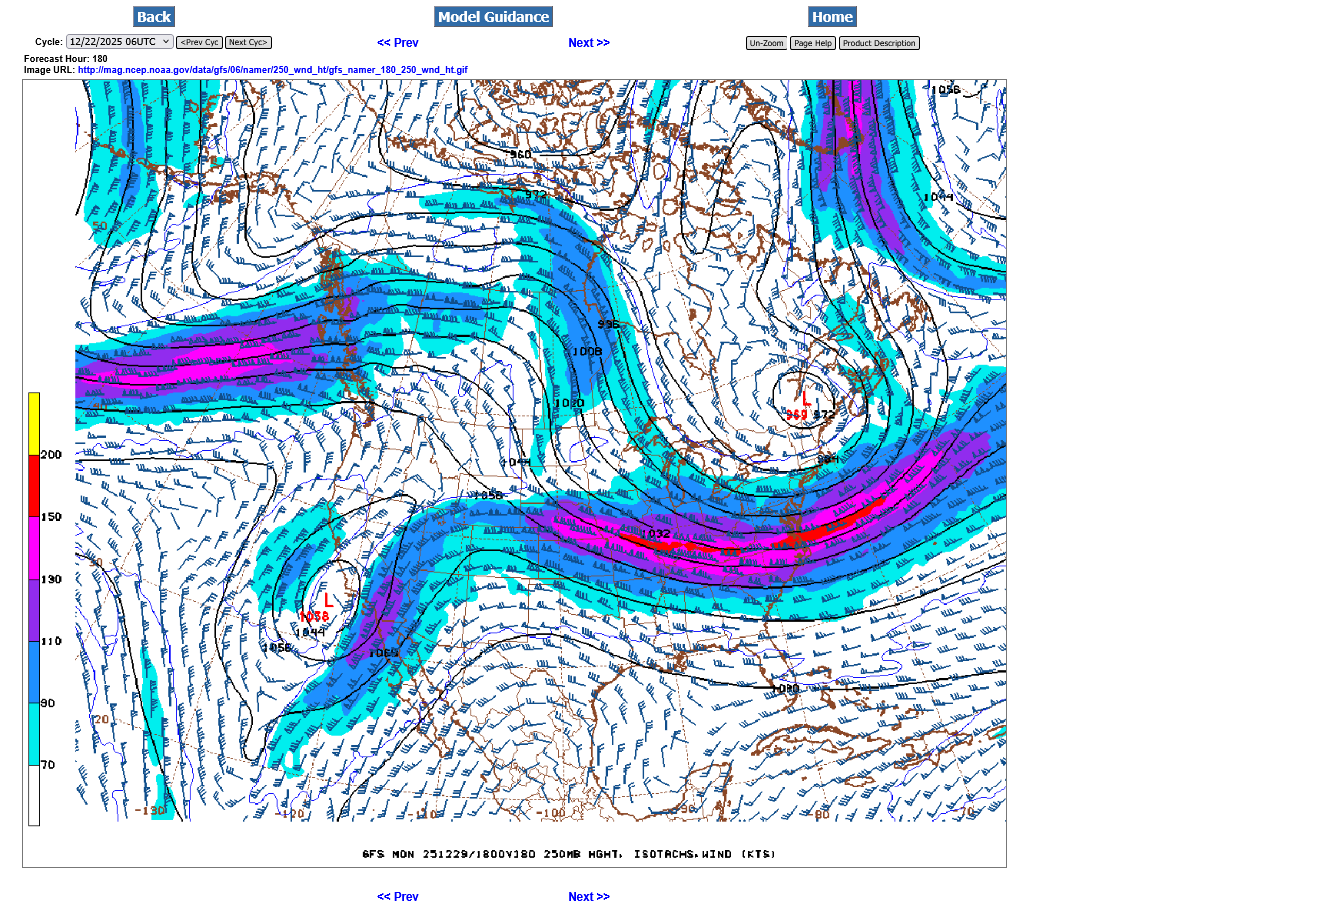
++++++++++++++++++
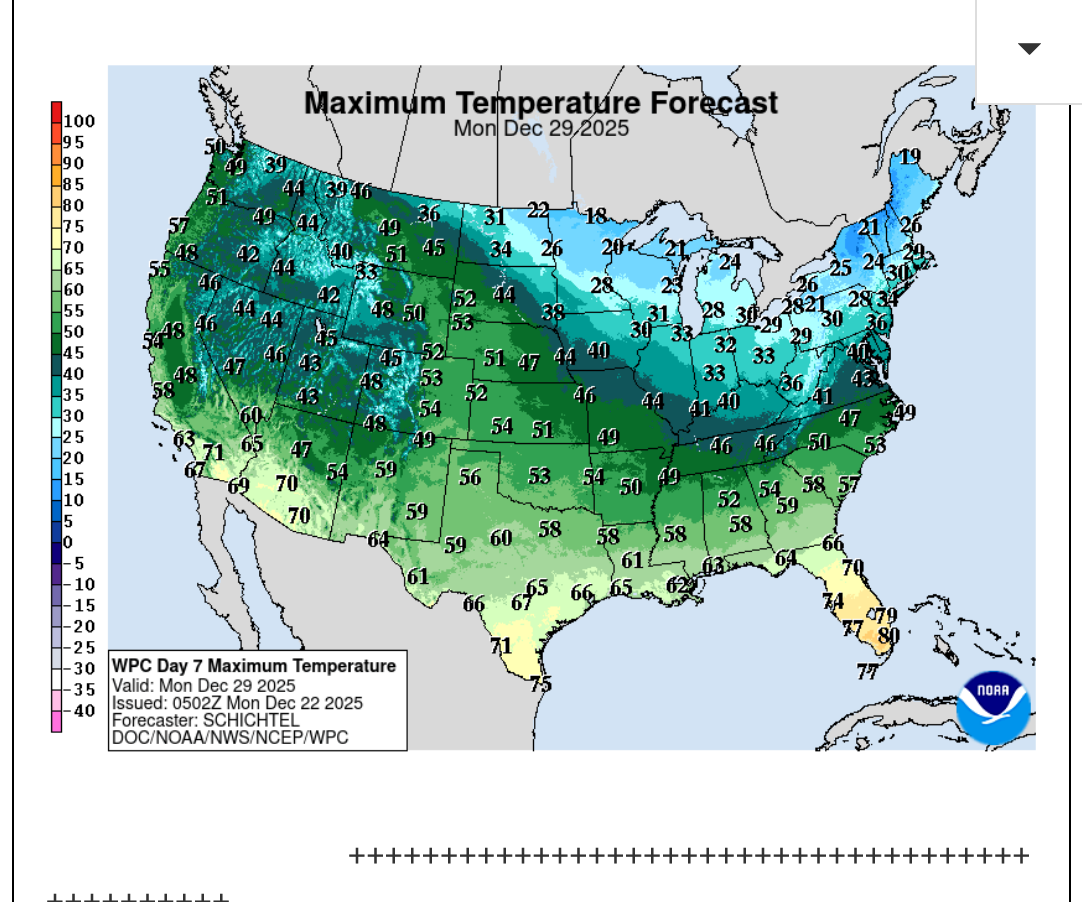
Temperatures this week will average almost 30 degrees above normal in the center of the country. The 2nd map are highs on Christmas Day. Note the very cold air right along the Canadian border. The southern edge of that will surge south this coming weekend!
https://www.marketforum.com/forum/topic/83844/#83851
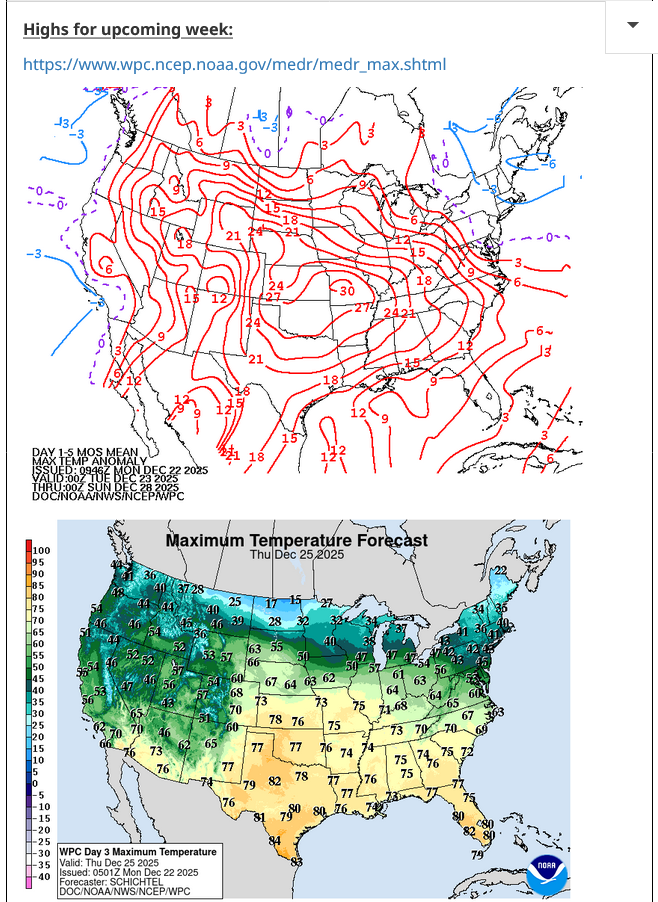
Note the big slug of cold dumping in over the weekend. These are highs next Monday. In some places this will feature a day or even 2 of temporarily, slightly colder than average...........then back to the mild pattern!
+++++++++++++++
The EIA report this week will be released a day early because of Christmas. Should be another robust number because of the extreme cold early in the period for the eastern half of the country, where the most people live and use natural gas for residential heating(the greatest fluctuating demand factor for ng).
Near record warmth out west will be spreading east this week from the mild Pacific flow and zonal, west to east jet stream.
https://www.cpc.ncep.noaa.gov/products/tanal/temp_analyses.php

NG is +4% I assume on the continued increasingly colder late Dec and now possibly early Jan model consensus. The models are continuing to not see cold over one week out.
Thanks, Larry.
I might assume that too but the data doesn't support it.
The EE was just under +2 HDDs and had the same trajectory profiles while the last 2 GEFS runs, below had LESS HDDs.
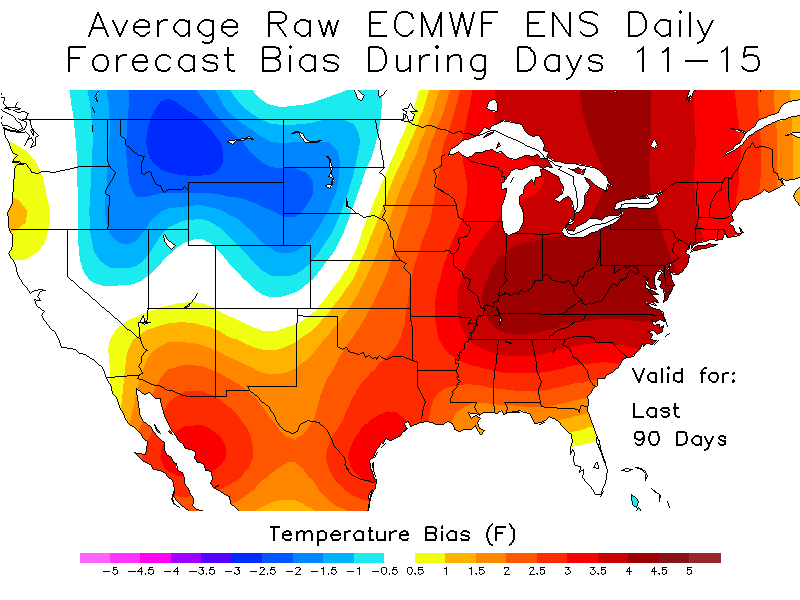
We’ve been discussing that the models have been too warm in the E US in week 2 quite often since Thanksgiving week. Well, here are some maps clearly showing that for all 3 major ensembles that has been the case averaged out over the last 90 days even more than I realized: this is crazy, especially when one realizes this goes back to Oct and even late Sept, when misses are typically smaller due to typically lower variance. So, this implies that if there were a 30 day map that the too warm misses might be even larger.
1. EE last 90 days in last 11-15:
2. GEFS last 90 days in 11-15:
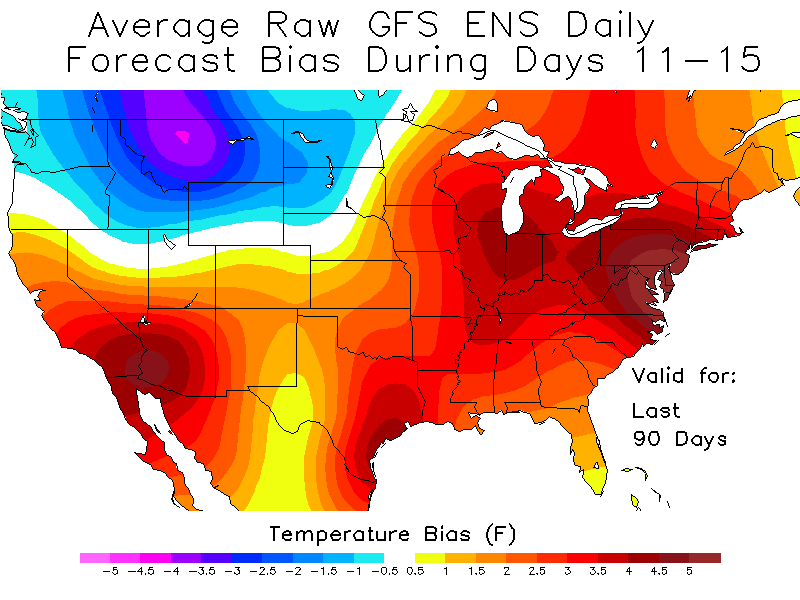
3. GEPS last 90 days in 11-15: The avg too warm miss is smaller. But, this is more significant than it looks like because the CMC is cold biased/the coldest model of the 3 on avg. That’s why it hasn’t been as far off. So, if even the cold biased GEPS has been too warm in the E US, that’s saying a lot!
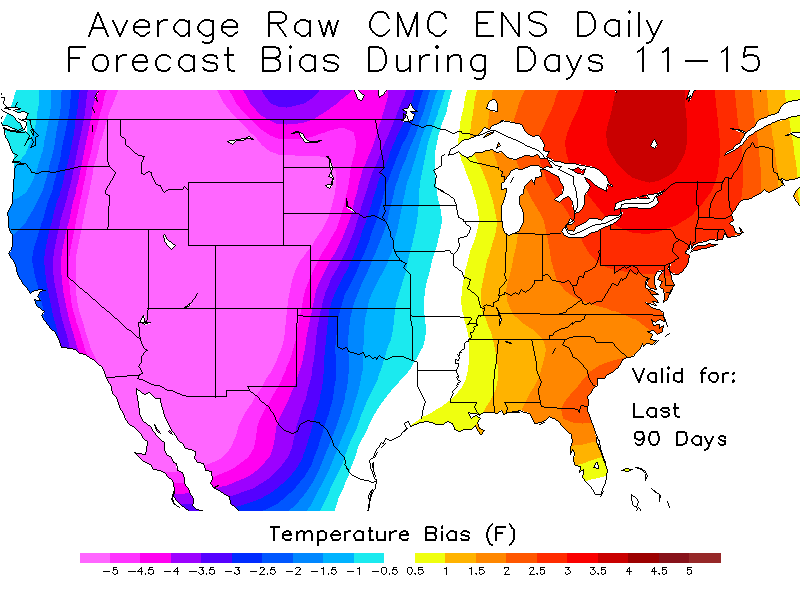
So, with the 11-15 day models having been too warm so consistently, the NG market may start to not react as much to them when they’re warm. Maybe that’s what’s going on today?
Also, the HDD for 12/28-31 are still much higher than they were on many of last week’s runs. Maybe NG is realizing that further today and also realizing these colder corrections to week 2 may continue.
That's pretty profound, Larry!
And good for our post of the week!
+++++++++++
This has been going on for LONGER than 90 days too:
By metmike - Sept. 3, 2025, 3:48 p.m.
Re: Re: Re: Re: Re: NG 8/4/25+
By metmike - Sept. 5, 2025, 12:38 p.m.
++++++++++==
I can't remember such an extreme forecast model disparity compared with reality in the same direction for so long in my life.
Something extraordinary is going on in the atmosphere that the models are blind too.
I know that you might not agree with me on this but I feel that this is why almost all the hurricanes this year tracked AWAY from the US, well out in the Atlantic. It's much more than just the strength or persistence of the NAO(-NAO).
Maybe if I had many hours to research and more data I could put my finger on it with the smoking gun but I'm sure that you can appreciate the extreme cooler than forecast anomalies along the East Coast, which would result from much stronger NORTHERLY flow, being caused by the same forcing mechanism that would repel hurricanes, that would be more likely to hit with SOUTHERLY flow.
Does that make sense, Larry?
Just look at the hurricane tracks below and see this happening.
https://en.wikipedia.org/wiki/2025_Atlantic_hurricane_season
| 2025 Atlantic hurricane season | |
|---|---|
 Season summary map Season summary map |
Hey Mike,
Your idea about the same forcing (E US troughing) that kept the hurricanes recurving well offshore the E US being the same causing colder in the E US in recent months makes perfect sense! You should give yourself a co-post of the week!
By the way, thanks for my POTW honor!
————-
NG now up a whopping 10% on what I think is a combo of:
-earlier up 4% on the much colder late Dec than thought last week
- up still another 6% on significantly colder early Jan!
This confirms your theory, Larry!
This last 12z GEFS, in purple/left was a whopping +18 HDDs vs the previous 6z run.
I won't get the HDDs for the European Ensemble model for over an hour but that was MUCH colder too.
NG is greatly adding to the already big gains.
Front month, January NG expires soon. It's down to 93,000 in volume compared to February at 119,000.
January is +$4,000/contract!!! Part of this impressive magnitude is likely the result of short covering ahead of the January expiration, which I believe is next Monday the 29th.
+++++++++++
A huge factor in this is the fact that the pattern does not need to change much to cause temperatures to plunge. The pattern already features cross polar flow dumping frigid air into Canada. Canada is filled up with bone chilling, Siberian and Arctic cold which is only a stones throw away.
It doesn't need to come many thousands of miles to get here because its at the border already!
NGF6 is up $4,600/contract. Being long 10 contracts today would have made $46,000!
That was me.............20 years ago(in fact, I traded 100 contracts with full margin position trades-day trading margins were not available back then- for numerous years when moves of this magnitude never happened).
No position today, just analysis.
https://tradingeconomics.com/commodity/natural-gas
1. 1 day
2. 1 week
3. 1 month
4. 1 year
5. 10 years
Hey Mike,
Ignoring end of month highest volume contract changes, contract expirations, and other misleading daily changes at investing.com, it appears to me when looking at investing.com daily data that today’s ~11% legit rise of natural gas may be the single highest legit rise in a day in all of 2025!
There are larger daily changes on investing.com that aren’t legit apples to apples changes of the highest volume contract.
Examples of deceptive Investing.com rises from 2025
Jan 23rd: 13% but open of 4.001 is way higher than the Jan 22nd close of 3.506. So, not real.
May 25th: 13% but open of 3.786 is way higher than May 23rd close of 3.334. Now granted, May 25th is a Sun opening. But gapping up 14% in May? No way!
June 27th: 15% but open of 3.530 is way higher than June 26th close of 3.261. Also, near month-end. Not real.
Sept 15th: 12% but open of 3.199 is way higher than the Sept 12th close of 2.941. Now, granted Sept 15th was a Mon, but unless there was a 9% gap up open, which is hard to believe in Sept, this isn’t real. Mike, what do you know? I guess we could look back at the NG thread from then to make sure.
Sept 29th: 15% but open of 3.149 is way higher than Sept 26th close of 2.835. It is another Monday but etc, etc. We can look at old NG thread to make sure, but with this near month end, this looks like typical month-end deception.
Oct 20th: 34% and yes a Monday but open of 3.837 is higher by 28%. No way there was a 28% gap up. Not real.
Oct 30th: 17% but open of 3.798 is way higher than Oct 29th close of 3.376. Also near month-end. Not real.
OTOH:
May 20th: +9% looks legit
Apr 28th: +8% looks legit
Assuming we don’t find anything confirming gigantic gap ups on Sept 15th and 29th, I’ll then feel comfy in saying today’s 11% gain is the largest gain of 2025 and with it replacing the +9% of May 20th.
—————
What do you think?
**EDIT:
I just looked back at the NG thread covering Sept 15th and Sept 29th. Based on looking at this, I say that as expected seals the deal that those two dates didn’t have huge rises.
Sept 15th in here: I see nothing earth-shattering
Sept 29th in here: again I see nothing earth-shattering
Great stuff, Larry!
I'm guessing that those way higher open very late in the month were sometimes the result of the graph rolling over to the next month, just before expiration.
When that happens this time, going from Jan to Feb, there will be a huge spike DOWN by $5,000 because that's how much higher that front month Jan is to Feb right now. This is partly the result of a typical price spread for those months in Winter but the magnitude is especially amplified right now, suggesting some sort of bullish underlying fundamental impacting the front month the most.
I would be that helped fuel the incredible jump up on Tuesday.
My trading account prices won't go back to expired contracts but this is what I show for the biggest 3 ranges for the current front month, January 2026.
1. December 22/23, 2025: Today's move up
High 4449
Low 3990
Range 506
2. December 5, 2025 Blow off top
High 5496
Low 5027
Range 469
3. December 11, 2025 Huge spike down
High 4626
Low 4196
Range 435
+++++++++++++++++
https://www.marketforum.com/forum/topic/83844/#83852
Amazing change in the forecast below with temperatures in the East dropping something like 7 categories(colder colors) in 24 hours.
After the colder 18Z GEFS lead to session highs up 3%, NG fell almost 3% from session highs over the last 35 minutes in what I think is because of the 0Z GEFS not being as cold as the 18Z. This drop back is probably made more likely by the largest daily rise of 2025 (11%) in yesterday’s session.
Mike, your thoughts?
That sure was a crazy drop, Larry!
~$1,500 in 30 minutes like you said in %.
https://tradingeconomics.com/commodity/natural-gas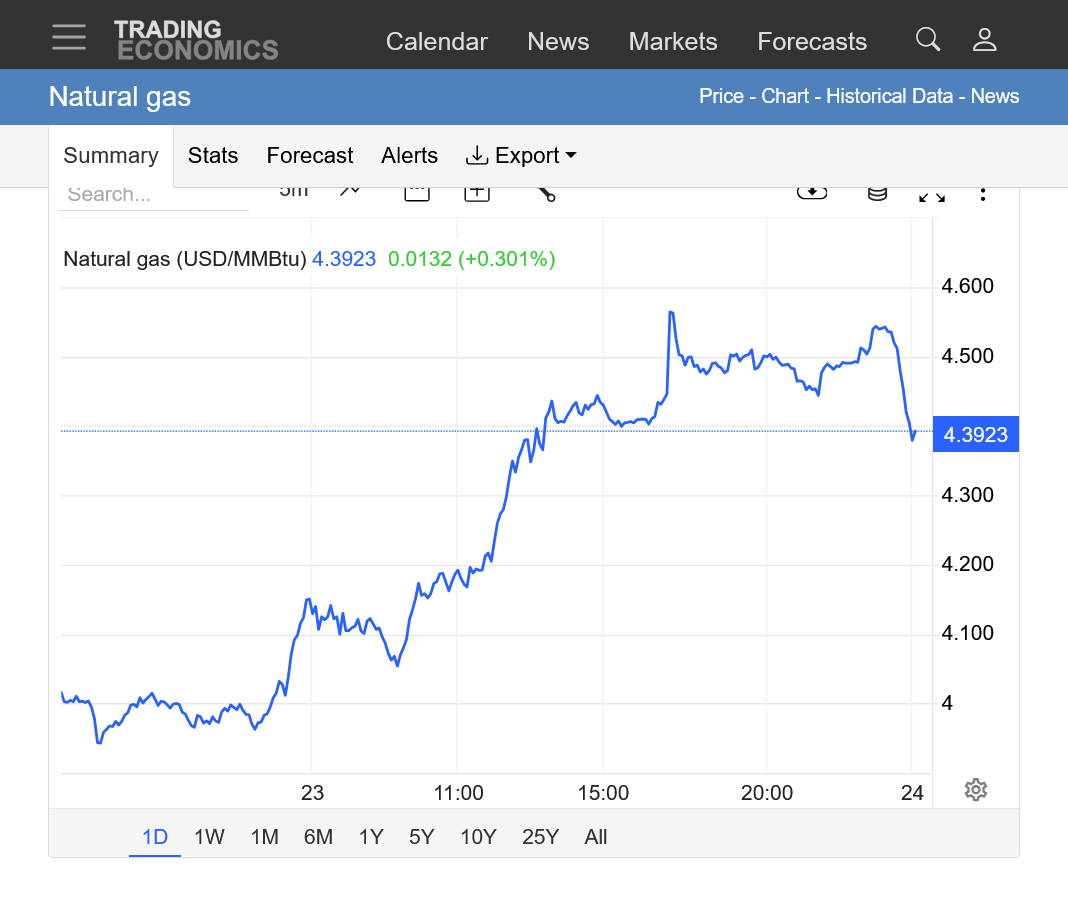
++++++++++++++
This was the previous, extremely bullish 12z EE, by the way close to +19 HDDs! The HDD for this 0z run coming out now won't be out for awhile.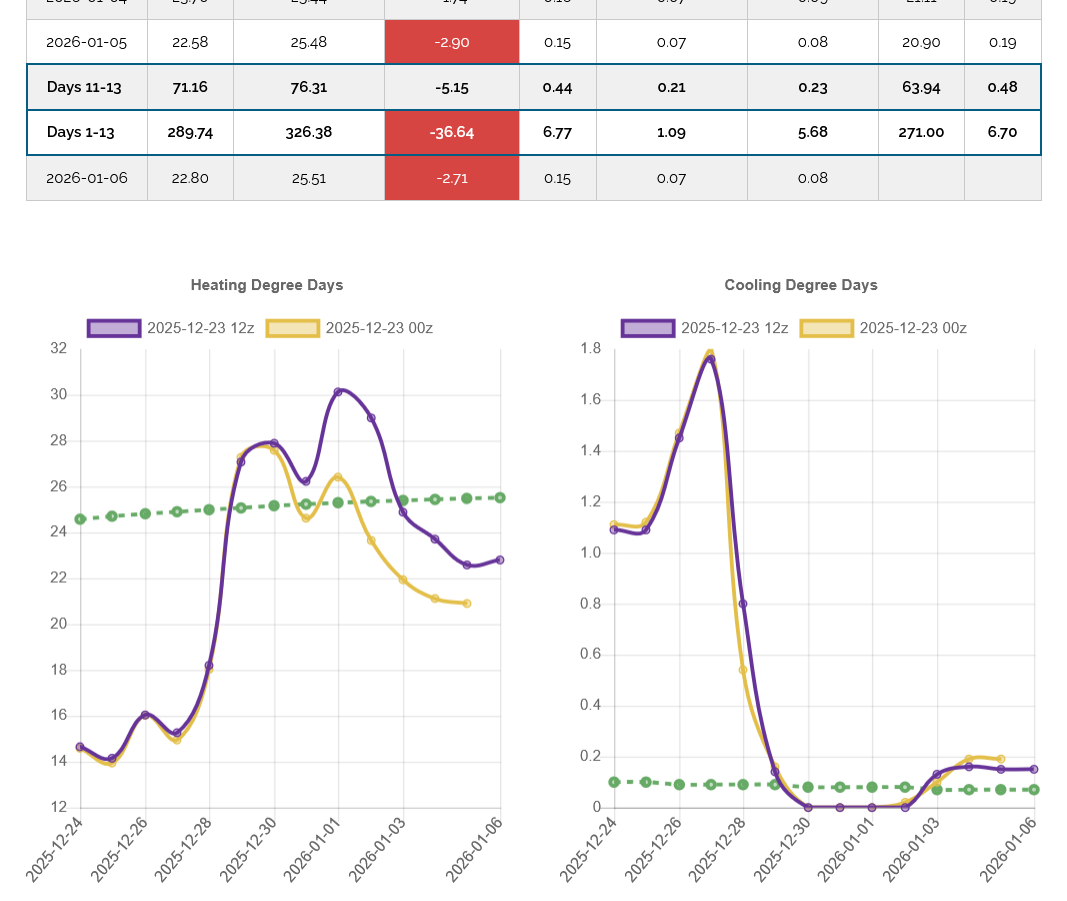
+++++++++++++++++++++++++++
12:20am
This was the last 0z GEFS in purple on the left. After the 12z was mega bullish, the 18z run was a tiny bit more bullish and this last run was almost -8 HDDs vs the 18z run.
The market is having some extreme reactions this month!!!
This last run was still ~+13 HDDs vs the 6z run, 3 runs ago!
Thanks, Mike!
NG ended up down 20 cents/4%+ from the late evening at the low point afterward. I’m the meantime, I see that the EE was also coming in warmer than its prior run, especially after day 10. So, that likely had been contributing to the 4% drop back. But it then quickly bounced back ~half of the 20 cents and is now back up to 10 cents off the highs.
Wild night for NG!
Front month, Jan is back up $660, while Feb. is down a tad. A very bullish front month dynamic is impacting January this week as it approaches expiration next Monday!
Only 21,000 contracts left in open interest for the January. Almost 9 times that OI in Feb.
Volume tonight is around 9,000 for Jan with the Feb contract almost double that
Thanks, Mike!
Based on the overall 0Z/6Z model consensus being not as cold in the E US as the 12Z/18Z model consensus (Mike, please tell me if my assessment is wrong), which had lead to ~15% gain by late evening (best of all of 2025 so far), natural gas has not surprisingly had a good amount of selling, including profit taking, which had NG down over 4% a little while ago. But that level is still 10-11% higher than the close of Monday.
Let’s see whether or not the 12Z will bounce back colder. This market will likely tell us the answer without having to actually look at the models, themselves.
That sounds about right, Larry.
`1. The HDDs from that previous 0z EE were -9 HDDS which took away half of the gain from the 12z run before that which really fired up NG.
2. The HDDs from this last 6z GEFS in purple were actually a bit bullish at +2.4 HDDs and we spiked up $1,500 from the lower price when it started coming up but then came back down. Having that milder 0z EE is a bearish force on traders right now. We can see that the last 4 GEFS runs are close to each other.
Like you said, the 12z model runs will be ng trading Gospel shortly.
Thanks, Mike!
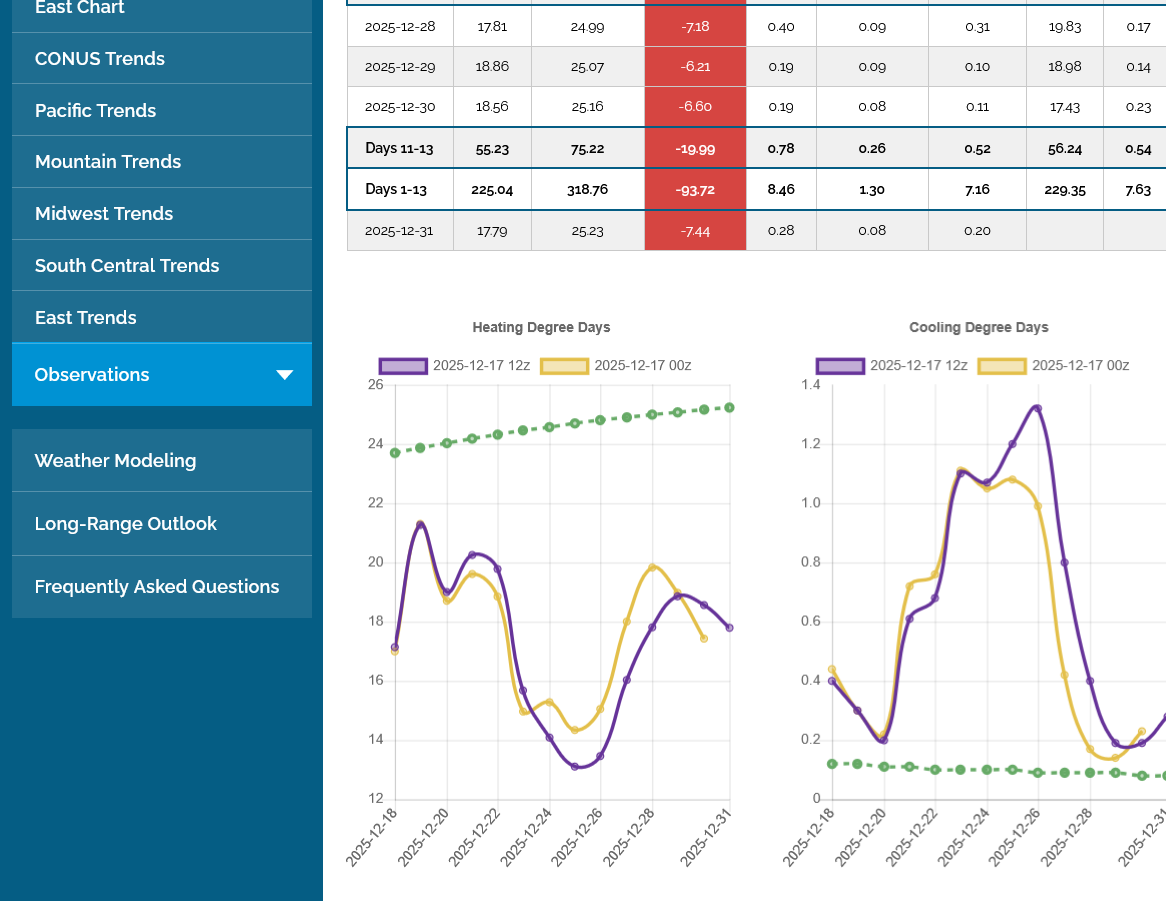
Now for a review of the remarkably colder changes from a week ago on the EE:
As I posted two days ago, US pop weighted HDD rose sharply on the EE from the 12/17 12Z run’s well BN 74 to the 12/22 (Mon) 0Z run’s NN 99 for 12/28-31, meaning a much colder change.
What has happened on the EE since that Mon run?
- 12/28-31 has maintained 24 of that 25 HDD gain from 12/17 with it at 98 HDD
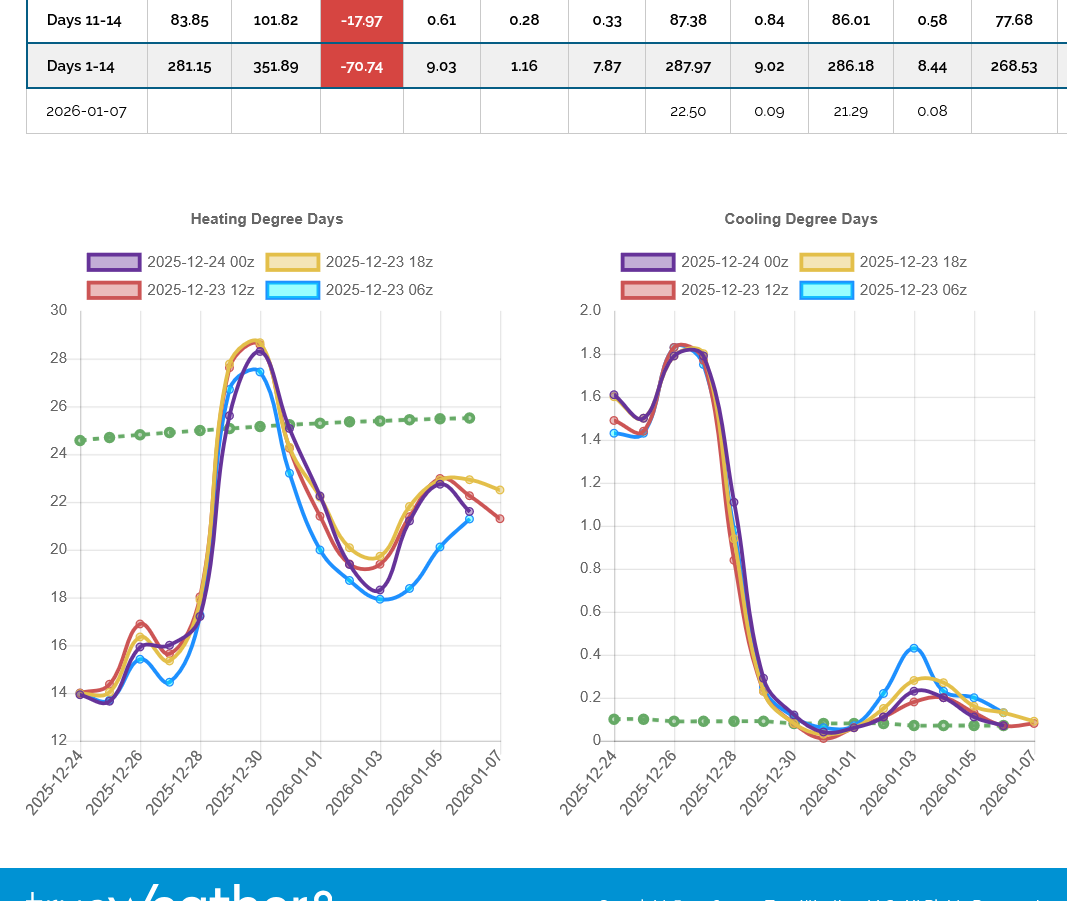
- 1/1-4 has gone from a well BN 78 HDD in the 12/22 0Z run to a NN 101 on the 12/24 0Z run. And that’s even with the 12/24 0Z run not being as cold as the 12/23 12Z run’s 108 HDD!
-So, just since a week ago, the EE’s US pop weighted HDD have increased a whopping ~47 HDD just for the period 12/28-1/4 (from way BN to NN)!
12/24 0Z EE HDD run left side in purple:
12/22 0Z EE HDD run left side in purple:

12/17 12Z EE HDD run left side in purple: look at how warm that run was compared to today’s! All days had BN to well BN HDDs:
Thanks, Larry! We covered this part already But that was a great review to emphasize how big the changes were.
I was expecting the EIA number to be released a day early as it has been the past 3 decades when a holiday in on Thursday, the usual release day.
But the source says the release will be next MONDAY!
What gives? What will be the release date the week after that? Back to Thursday!
https://ir.eia.gov/ngs/ngs.html
Next Release: December 29, 2025
++++++++++++
I also noted this statement:
Notice: We will implement our new information release system for the Weekly Petroleum Status Report on January 7, 2026, and for the Weekly Natural Gas Storage Report on January 8, 2026. You can continue to access weekly data manually or through automated bots via ir.eia.gov.
++++++++++++++
So this means the next 2 releases will have more days in the reporting period and completely skip a week. In other words, 2 reports but with the days of data being 3 week's worth???
No report this week.
Next week's report on Monday 12-29-25, so 7 days +4 days.
Report after that, back to Thursday, 1-8-26, another week +3 days, resulting in 2 reports for a 21 day period instead of 3 reports.
Larry,
Is that what they're doing?
Looking in the rear view mirror at the price action this week, I'd have to guess that at least half the extreme spike higher yesterday was tied to short covering in the January contract ahead of expiration.
This actually happens with such frequency that its not unusual but the MAGNITUDE was especially extreme because of the huge colder changes that you've been on top of, which greatly amplified other bullish impacts.
There are times when the expiration spike is DOWN and not up. I think that this is tied to the large spec positions towards the end of each month. In this case, we can assume that they were heavily short in this case. Large specs often act like mobs when they all do the same thing at the same time which is also why we see extreme moves in general with natural gas.
Larry,
I‘m glad that you reviewed the recent changes for us above.
Hey Mike,
1. Sorry, but I don’t have a clue as to what the EIA is doing regarding the next couple of NG inventory reports. I need to see a link to detailed info.
2. From NGI, this tells me that yesterday’s gain was the largest in 3 years:
After posting their biggest one-day gain in three years on thin trading volume, January natural gas futures pulled back early Wednesday, the final trading day of the shortened Christmas week and ahead of Monday’s expiration.
You were right, Larry!
I just looked at the European weekly for the first time in awhile and saw that the extended forecast in weeks 3 and 4 really cooled off too early this week so that was,likely even more fuel for that spike up.
The last 0z EE was another -6 HDDs vs the previous 12z run. However, looking at the actual pattern it may be morphing into a colder overall pattern in early January.
Lower open with an immediate $1,000 spike up this evening:
https://tradingeconomics.com/commodity/natural-gas
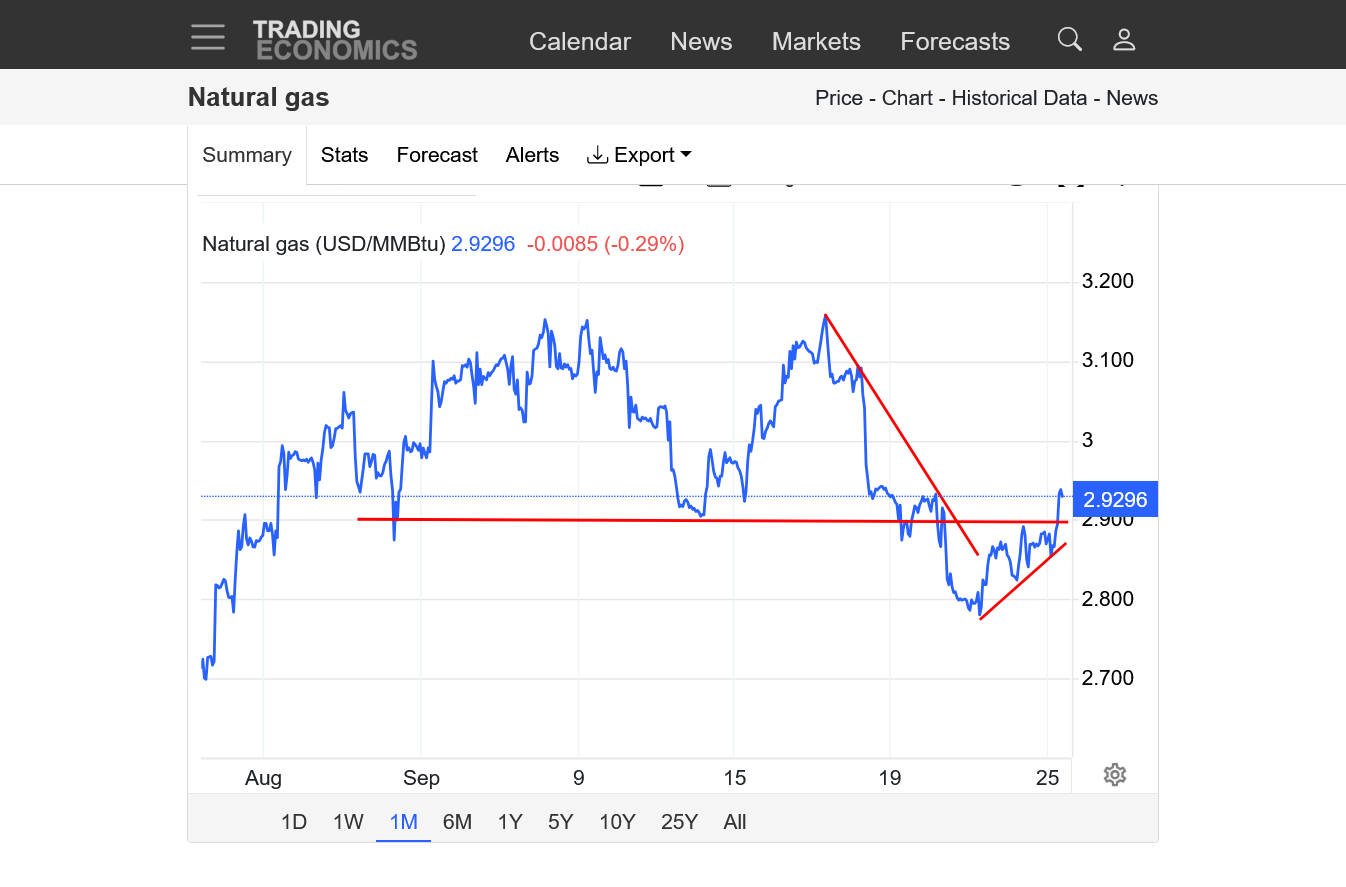
1. 1 week: Tuesday's biggest gain in 3 years, with a $5,000/contract wide range in the center after models turned sharply colder. On the right is the open tonight.
2. 1 month: Uptrend leading to the blow off top on December 5. Steep move down -$15,000/contract in 7 trading sessions from a pattern change to much warmer, followed by sideways bottoming, then models turned sharply colder early this week.
3. 1 year: False break out above March highs/resistance. Sharp downtrend late in Summer with near record cool temps late August/early September. Bottom in September/October. Sharp move up in November from colder and colder temps. Blow off top December 5 with EXTREME coldest yet, Polar Vortex and peak in bullishness. Price recovery this week from weather forecasts turning colder again.
4. 10 years: Break out above the symmetrical triangle (lower highs after 2022 top and higher lows after 2024 bottom). False break out above previous resistance.

NG had a strong day of up 3% until a 1% selloff at the 1:28-30 CST “close”, when it dropped 5 cents in <2 minutes. I’m assuming this is mainly profit-taking of longs who don’t want to take a chance on a gap down Sun night.
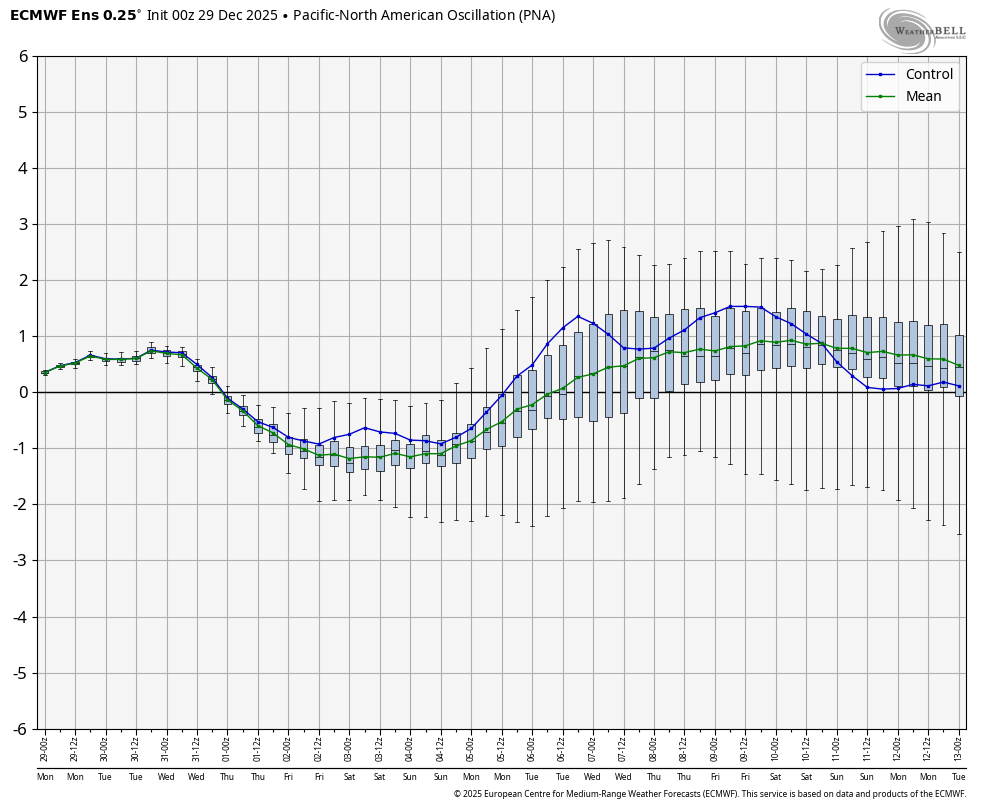
Indications continue to suggest a major change at 500 mb in ~2 weeks with the Aleutian ridge weakening, west coast heights riding, and the strong -PNA ending and likely going toward a +PNA just as occurred in all -ENSO Jans after -PNA Decembers since 1983-4.
There’s a rather strong hint as a result of this of an Arctic plunge coming down into the US Jan 9-11th.
Thanks, Larry!
The last 12z European Ensemble model that came out just before that close gave the natural gas traders a BEARISH kiss to end the trading week with -4 HDDs. It's the purple line on the left with the yellow line being the previous 0z run from 12 hours earlier.
This just out 18z GEFS in purple (past 3 runs-spaced every 6 hours included) was also a tad bearish with -3 HDDs. However, as we know so well, the market give 0% weighting to Friday PM models/weather forecasts when it opens on Sunday Evening. Those opens can diverge more compared to the Friday close than any other market.
From BAMwx showing how far off for 12/28-1/3 was the GEFS just 7 days ago (12/21 run): 43 HDD too low. This is consistent with what we’ve been discussing regarding 12/28-1/4 and the overall warm E US and related -PNA bias the last 90 days in the means of the models:
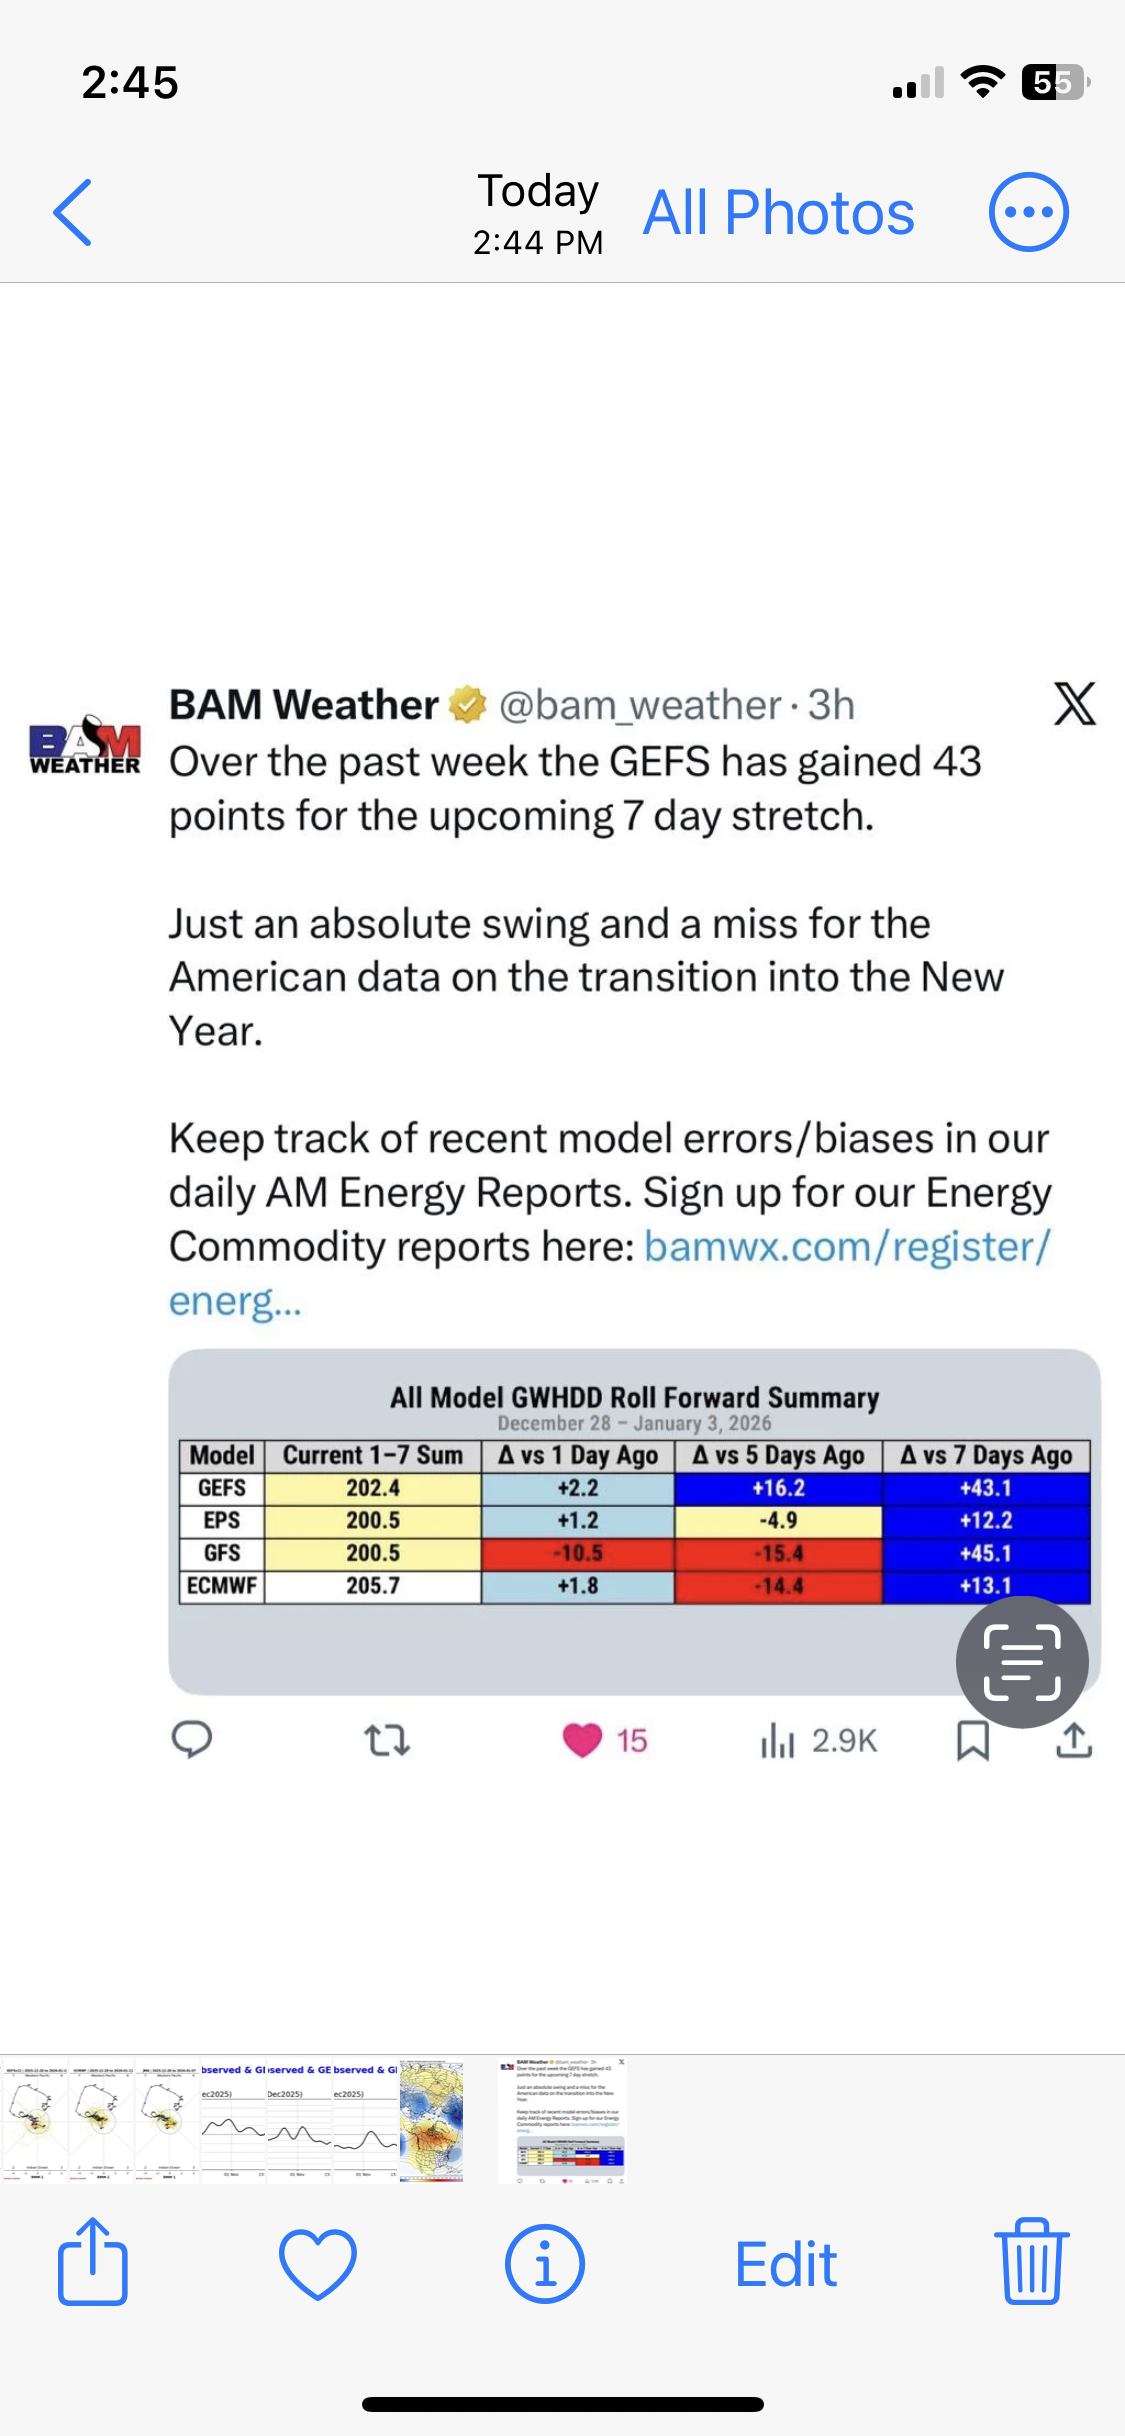
Thanks, Larry!
We're off to a strong start for the last trading day on the front month, January.
The Feb contract is up around $770/contract after 42 minutes of trading.
9pm: This was the last 12z European Ensemble model. -2.43 HDDs:
The spike down is the expiring January contract rolling over to the February contract which is trading around $5,700/contract lower.
It's going to really mess up our ng price charts here for a little while.
https://tradingeconomics.com/commodity/natural-gas
The EIA storage report comes out for the first time in history on Monday. Not sure how many days will be on it.
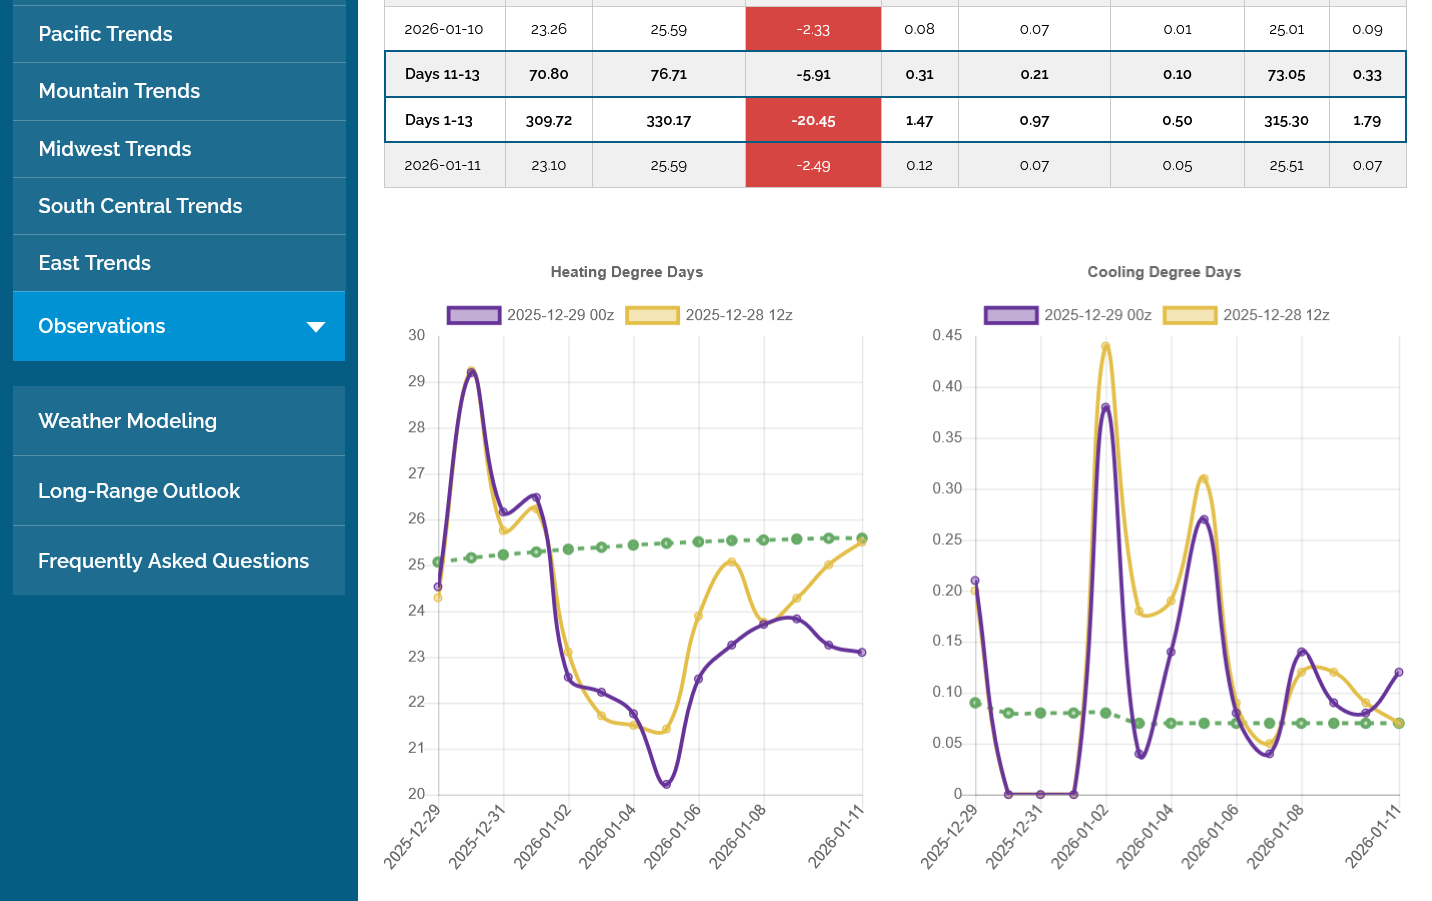
This last 0z GEFS was a whopping -20 HDDs bearish compared to the previous 18z GEFS..
Hey Mike,
As we can see, NG has been heavily selling off the last 3 hours with a drop since then of 3.5% off of the higher evening levels. The much warmer 0Z GEFS that you noted got it started. The much more modestly warmer 0Z EE added more selling pressure.
Despite the modestly warmer EE, its strong W ridge/modest +PNA at 360 remains much colder than the -PNA of the 0Z GEFS, which resulted in a mild E US/SE ridge for hour 360. They’re so far apart then.
The good news about those rooting for the EE is that it has been much steadier (better model) and both have had a significant -PNA bias the last 90 days. Also, every -ENSO -PNA Dec since 1983-4 has transitioned to a +PNA in Jan. So, I’m going with the EE as having a better chance than the GEFS to verify closely.
0Z runs show a big disagreement in week 2 between them GEFS’ mild E US -PNA and the much steadier/colder +PNA of the EE:
GEFS strong -PNA:
EE moderate +PNA:
 Edit for 6Z GEFS update: it also has a -PNA and the resulting warmth in the E US late in week 2. But NG bounced back during this anyway:
Great post, Larry.
If I was still in my office at that time, I would have showed the Canadian model that was the most bullish of all with its 0z solution similar to your description. Some of it's individual ensemble members are EXTREMELY bullish.
Dislodging the Polar Vortex and sending it far enough south to impact the US directly late in the 2 week period.
https://weather.gc.ca/ensemble/charts_e.html?Hour=384&Day=0&RunTime=00&Type=gz
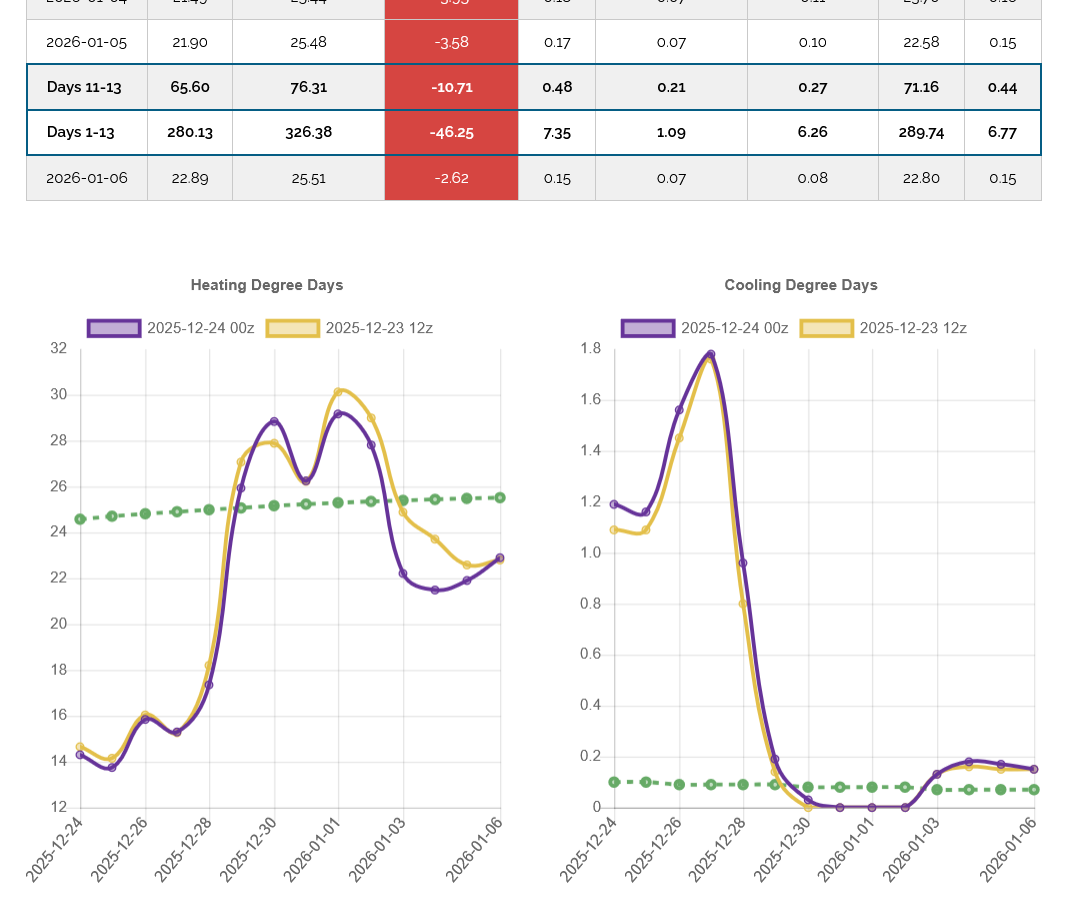
This was the last LESS bearish 0z European Ensemble average model. HDDs on the left.
Purple was the last run which had a great deal of LOWER HDDs vs the previous run because of INDIVIDUAL DAYS!!!
The most important thing to note is THE TRAJECTORY and SLOPE of the lines in week 2, NOT individual days.
1. Individual days are significant in telling us the difference in day to day heating and cooling that accumulates over the 2 week period.
2. The TRAJECTORY/SLOPE of the 2 lines relative to the average green line above tells us where THE MAIN WEATHER PATTERN is headed. It's what will serve as the overall pattern that is superimposed on the individual days(that change from model run to model run).
3. The trajectory below is crystal clear when viewed with this informed way to interpret the graph.
a. After this current cold spike is completely exhausted in the next day, the pattern is to go extremely mild again. Then, in 7 days, A NEW PATTERN will impose sustained cooling that SLOWLY increases HDDs. The rate that this happens is uncertain as shown by the disparity of the purple and yellow lines but make no mistake, the NEW PATTERN is strongly suggesting it will turn colder and beyond 2 weeks, we assume that upward trajectory, if it continues will cross above the green average line.
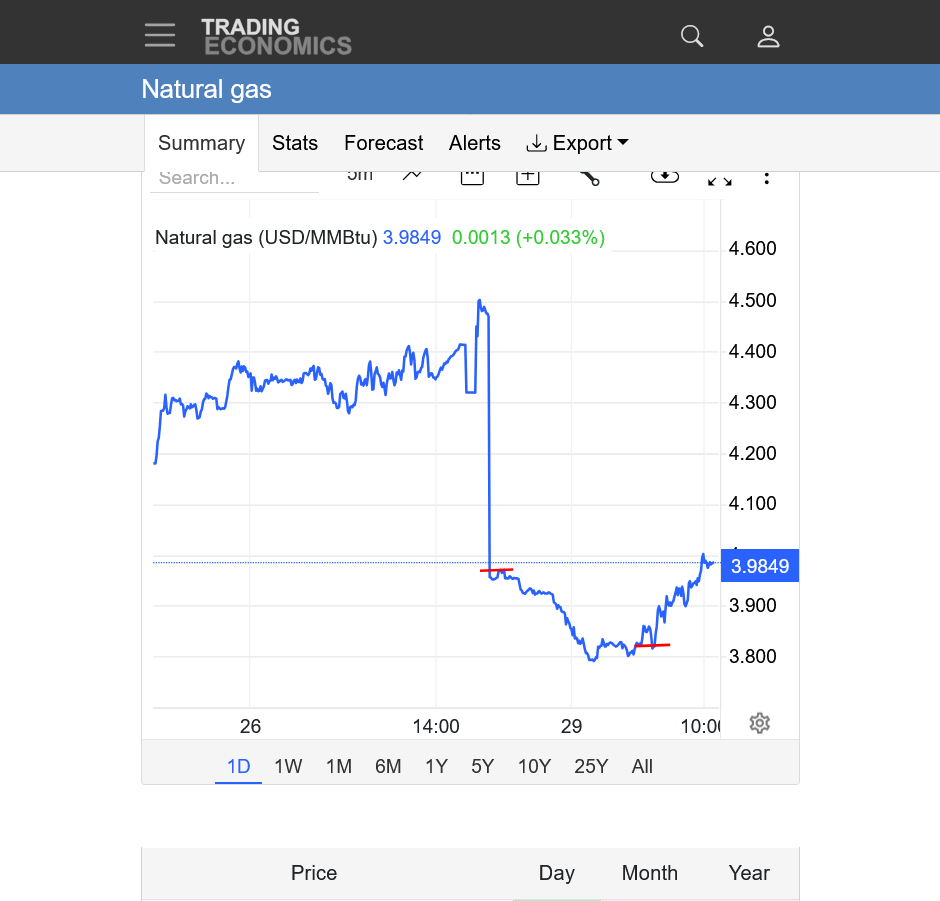
As mentioned last evening. The rolling over from Jan to Feb took away $6,000 from the price charts in 1 swoop.
We can see below on this 1 day price chart the big drop lower after the Sunday night open with the red line.
This was enhanced from the mega bearish HDD data from the 0z models but with a huge recovery up since then to new highs for this trading session.
The 2nd red line is 6am. We often see huge changes in how the market acts close to that time frame because the overnight traders are replaced by a much bigger trader that uses, mostly the day session trading. This trader will often focus less on HDD data changes from the last model run overnight to more significant fundamentals, including weather PATTERN changes like the one Larry has been describing the past week here.
https://tradingeconomics.com/commodity/natural-gas
For those familiar with the Wyckoff trading principles, we might assign the trader that takes over at 6am, as having a different, more important "Composite Man" identity related to being MORE informed than the overnight traders.
Re: Re: Re: Re: Re: Trump's Influence on Markets/Economy
By metmike - Dec. 11, 2025, 10:48 a.m.
++++++++++
That doesn't mean overnight traders are wrong. And they can get a big jump on the bigger, day session trader when the weather PATTERN changes overnight.
This last 12z GEFS was a whopping +16 HDDs BULLISH vs the previous run, taking away the changes from the bearish 0z run. Good call, Larry.
The Jan contract is going off the board, crazy strong!
Now more than $7,000/contract higher than the Feb contract. This is likely pulling the Feb contract higher as it expires.
Thanks, Mike!
12Z EE: I’m guessing it came in 6-7 HDD warmer than the 0Z. But more importantly in this case, it maintained its bullish +PNA at the end.
I’ll post it when it’s in, Larry but your guess is the same as mine on its warmer solution. Maybe even a tad more.
The coldest model, the Canadian model was warmer too. Not a shocker when models are trying to lock in properly on the right solution to a pattern change as 1 powerful set of forcing dynamics, battles another, opposing set.
Small changes in new/fresh data amplify with time and no model has the perfect set of gazzialon equations to represent the physics of the atmosphere everywhere at all times.
We know what all the physical laws are that represent the process's in the atmosphere and how to represent them mathematically in models.
But there are huge data gaps around the planet and umpteen places where these laws apply in a unique, impossible to put in a global model way. This results in random variation perturbations that amplify with time and can grow into a totally new, large scale weather pattern change with enough time.
++++++++
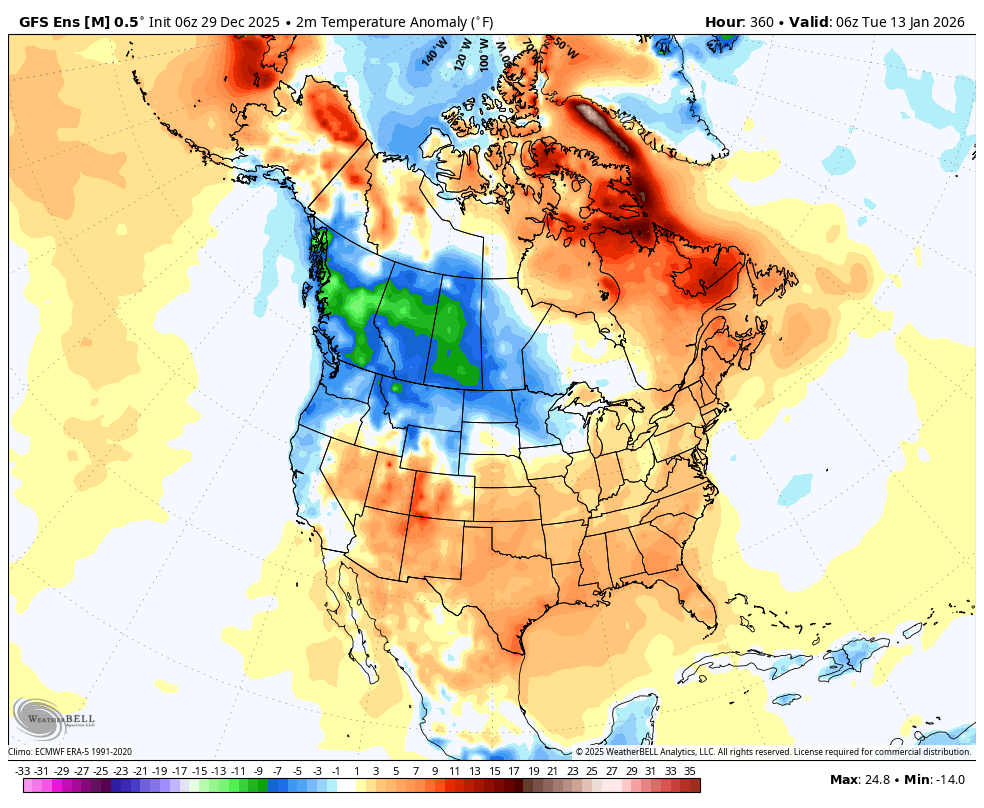
Related to Larry’s projection here, I’m also noting some pretty substantial positive height anomalies building in the higher latitudes late in week 2.
1 centered around Greenland and another over Alaska.
This should result in the AO dropping into deep negative territory which is favorable for the air at high latitudes to get flushed down to the mid latitudes.
++++++++++++++
The 12z EE was -6 HDDs vs the 0z run from colder individual days but note the BULLISH trajectory, going up and closing the gap with the green average:
+++++++++++
I need to correct my statement above about the 500 mb anomalies building in the higher latitudes which was based only at looking at 1 map at the end of the forecast period. There is CURRENTLY a huge positive anomaly in Greenland already! This is what's causing the current MUCH colder pattern than the previous, mild one:
https://www.psl.noaa.gov/map/images/ens/z500anom_nh_alltimes.html
This is the map I was referring to earlier at 360 hours. Positive anomalies across the high latitudes with a weakness in the mid latitudes are the recipe for cold air to move from north to south and a negative AO.
Arctic Oscillation Index, North Atlantic Oscillation Index, Pacific North American Index.
https://www.cpc.ncep.noaa.gov/products/precip/CWlink/daily_ao_index/ao.shtml
https://www.cpc.ncep.noaa.gov/products/precip/CWlink/pna/nao.shtml
https://www.cpc.ncep.noaa.gov/products/precip/CWlink/pna/pna.shtml
Ridging in the west/positive anomalies on some models would help to create a +PNA which is favorable for cold to penetrate deeply south.
The maps on the previous post are updated daily, so the analysis yesterday will be old news quickly as the weather patterns advance forward.
It's clear that the new high latitude positive anomaly is shifting to northwest North America with a downstream weakness in the mid latitudes that determines where the Frigid blasts will target.
This pattern is similar to the one earlier in December that featured cross polar flow. Transporting the coldest air on the planet in Siberia into Canada, then farther south into the United States.
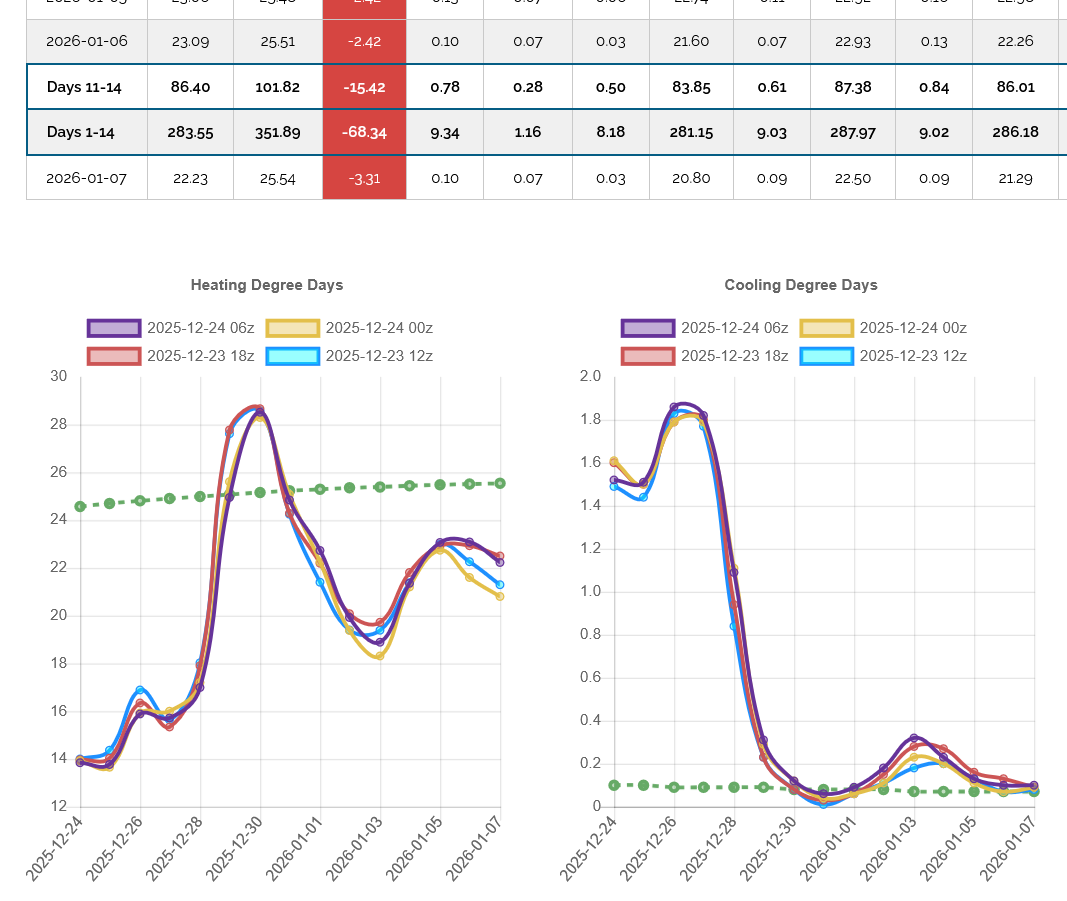
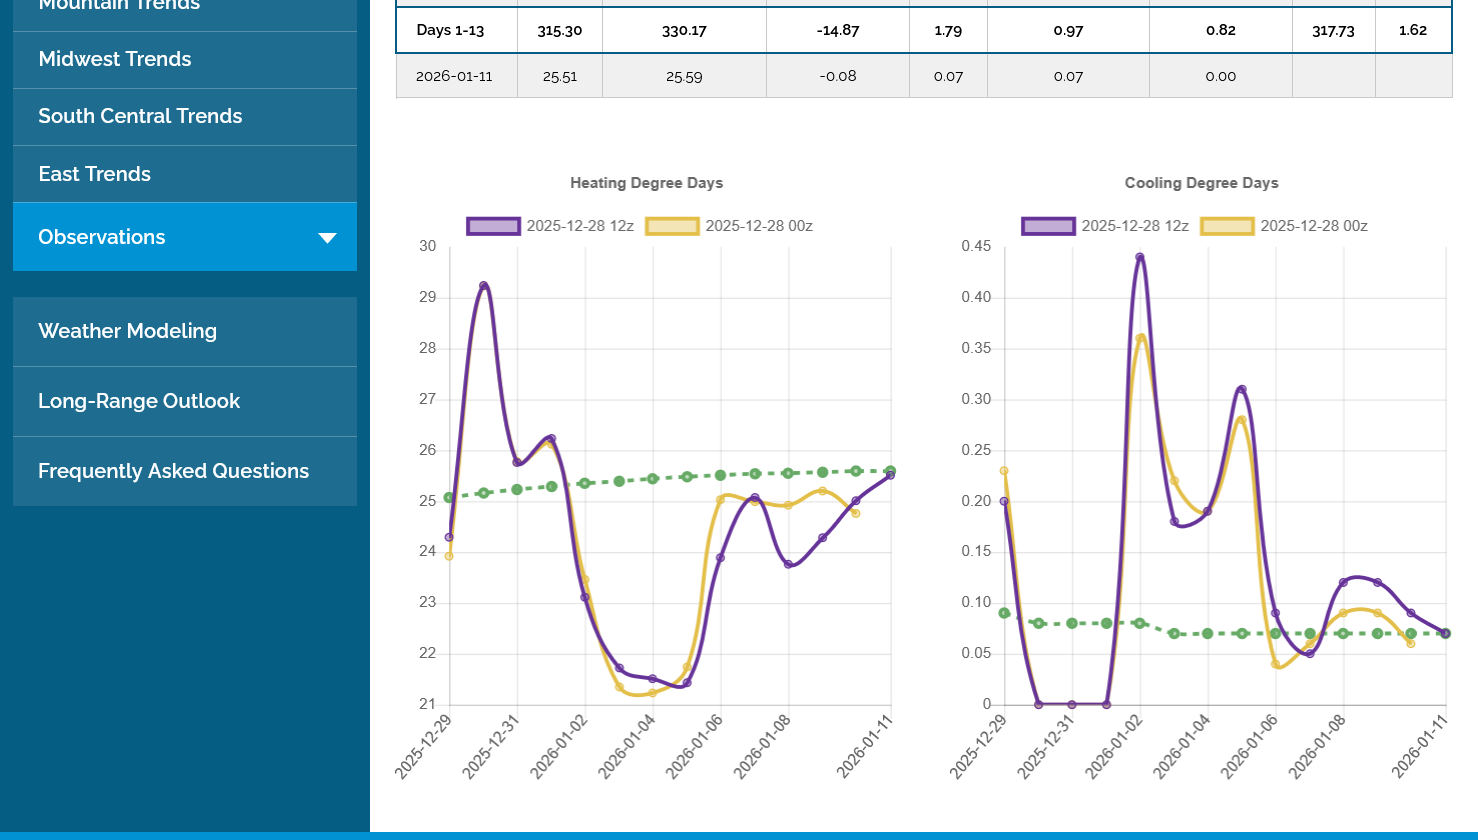
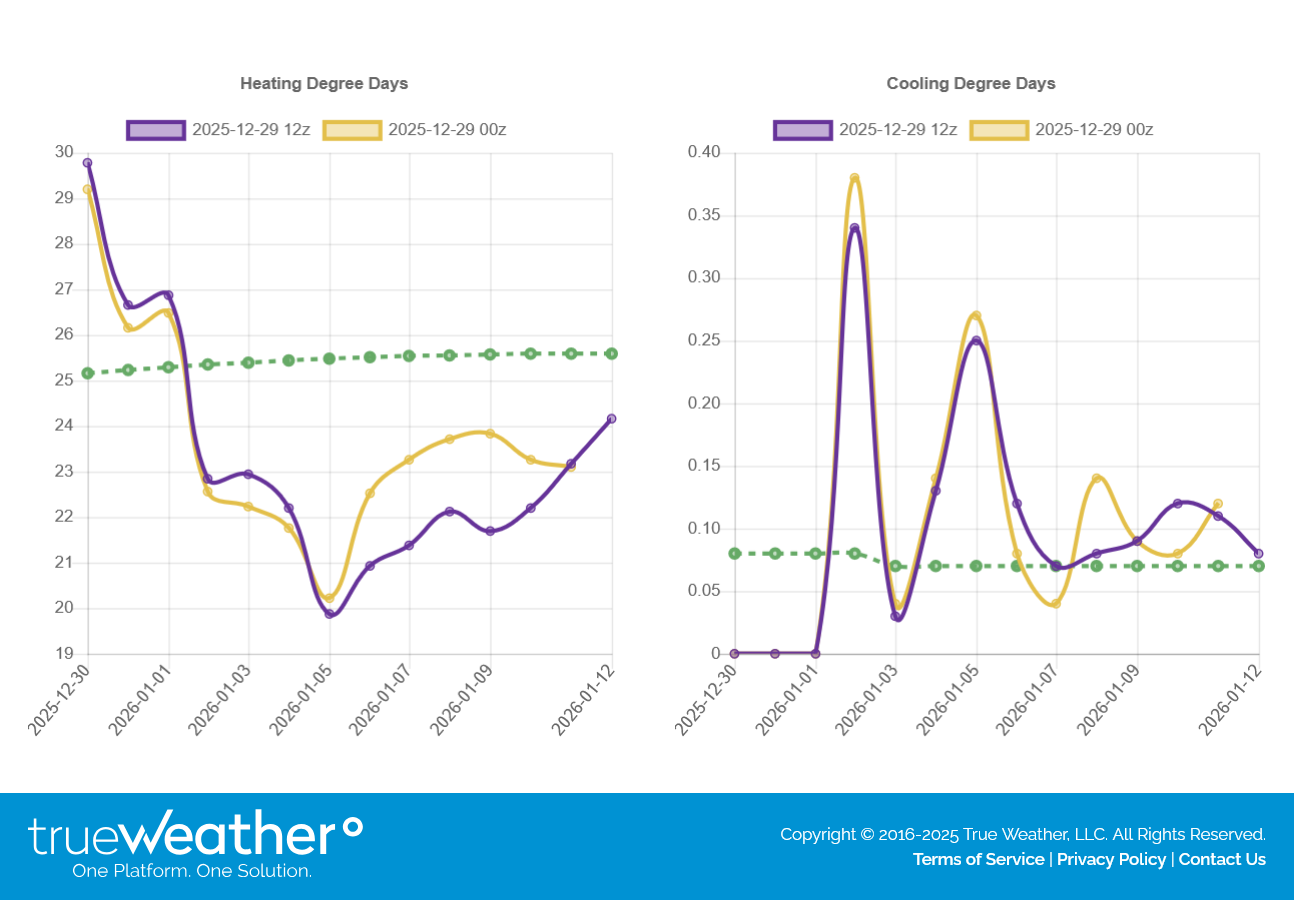
The last 0z European Ensemble mean, purple/left was -7 HDDs and bearish again from INDIVIDUAL DAYS compared to the previous 12 run. But the week 2 trajectory of the lines on the left is still a fairly steep upslope, closing the mild gap with the seasonal average green line.
Note the green line, that has been increasing the past 3 months is finally flattening out and tops in mid January which is when seasonal temperatures hit their yearly nadir and HDDs peak.
This was the data from yesterday's very odd EIA on a Monday release(4 days late). The next one is tomorrow, 2 days later.
https://ir.eia.gov/ngs/ngs.html
for week ending December 19, 2025 | Released: December 29, 2025 at 12:00 p.m. | Next Release: December 31, 2025
| Working gas in underground storage, Lower 48 states Summary text CSV JSN | |||||||||||||||||||||||||
|---|---|---|---|---|---|---|---|---|---|---|---|---|---|---|---|---|---|---|---|---|---|---|---|---|---|
| Historical Comparisons | |||||||||||||||||||||||||
| Stocks billion cubic feet (Bcf) | Year ago (12/19/24) | 5-year average (2020-24) | |||||||||||||||||||||||
| Region | 12/19/25 | 12/12/25 | net change | implied flow | Bcf | % change | Bcf | % change | |||||||||||||||||
| East | 751 | 797 | -46 | -46 | 796 | -5.7 | 805 | -6.7 | |||||||||||||||||
| Midwest | 904 | 966 | -62 | -62 | 967 | -6.5 | 974 | -7.2 | |||||||||||||||||
| Mountain | 266 | 271 | -5 | -5 | 268 | -0.7 | 214 | 24.3 | |||||||||||||||||
| Pacific | 303 | 304 | -1 | -1 | 293 | 3.4 | 258 | 17.4 | |||||||||||||||||
| South Central | 1,190 | 1,242 | -52 | -52 | 1,218 | -2.3 | 1,186 | 0.3 | |||||||||||||||||
| Salt | 323 | 338 | -15 | -15 | 347 | -6.9 | 336 | -3.9 | |||||||||||||||||
| Nonsalt | 867 | 903 | -36 | -36 | 870 | -0.3 | 850 | 2.0 | |||||||||||||||||
| Total | 3,413 | 3,579 | -166 | -166 | 3,542 | -3.6 | 3,437 | -0.7 | |||||||||||||||||
| Totals may not equal sum of components because of independent rounding. Notice: We will implement our new information release system for the Weekly Petroleum Status Report on January 7, 2026, and for the Weekly Natural Gas Storage Report on January 8, 2026. You can continue to access weekly data manually or through automated bots via ir.eia.gov. | |||||||||||||||||||||||||
Working gas in storage was 3,413 Bcf as of Friday, December 19, 2025, according to EIA estimates. This represents a net decrease of 166 Bcf from the previous week. Stocks were 129 Bcf less than last year at this time and 24 Bcf below the five-year average of 3,437 Bcf. At 3,413 Bcf, total working gas is within the five-year historical range.
For information on sampling error in this report, see Estimated Measures of Sampling Variability table below.
Note: The shaded area indicates the range between the historical minimum and maximum values for the weekly series from 2020 through 2024. The dashed vertical lines indicate current and year-ago weekly periods.
+++++++++++++++++
The EIA for tomorrow is for the period below, I believe.
You don't often see warmth of this magnitude over such a large area of the country! Only the far Northeast was cold. The EIA withdrawal for tomorrow will be unusually SMALL for late December.

Hey Mike,
Not only was it extremely warm, but it also was a holiday week reducing demand even more. I wonder if that week could see a record low draw or even a teeny tiny net insertion. But the survey I saw has nobody predicting an insertion with the lowest draw of 17 and a range of -17 to -53. The mean is -38 and the median is -40. It may be though that the slightly colder than normal and highly populous NE US along with the strongest warm anomalies being largely in low population areas keep the draw from being at a record low for that week. We’ll see.
Other survey means had even higher draws (-48 to -53). Those seem too high with the record warmth and holiday.
I just found these at the EIA site:
EIA week ending:
12/26/14: -26
12/30/16: -49
12/28/18: -20
1/3/20: -44
12/31/21: -31 (very warm Christmas also)
1/6/23: +11
12/29/23: -14
1/3/25: -40
Thanks, Larry!
In contrast to recent model forecasts being too warm before and getting colder with time, the models this week have been getting warmer and warmer. Same pattern but amplifying the upper level ridge in the East/Southeast with time so much that it greatly warms the eastern half of the country more with each run. This has been causing individual days to keep getting warmer, even as the trajectory in week 2 is straight up as the much colder part of the pattern kicks in(cold moves east).
A lot of people live in the East/Southeast(Midwest too) that use natural gas for residential heating. So big warming there has the highest impact on demand and HDDs.
Another important factor is that this is January and getting close to Winter being half over by the end of the period. Speculators are more inclined to buy on late period pattern changes to much colder, the earlier in the heating season it is. In December and even November, the promise for a sharply colder change late in week 2 would be much more bullish.
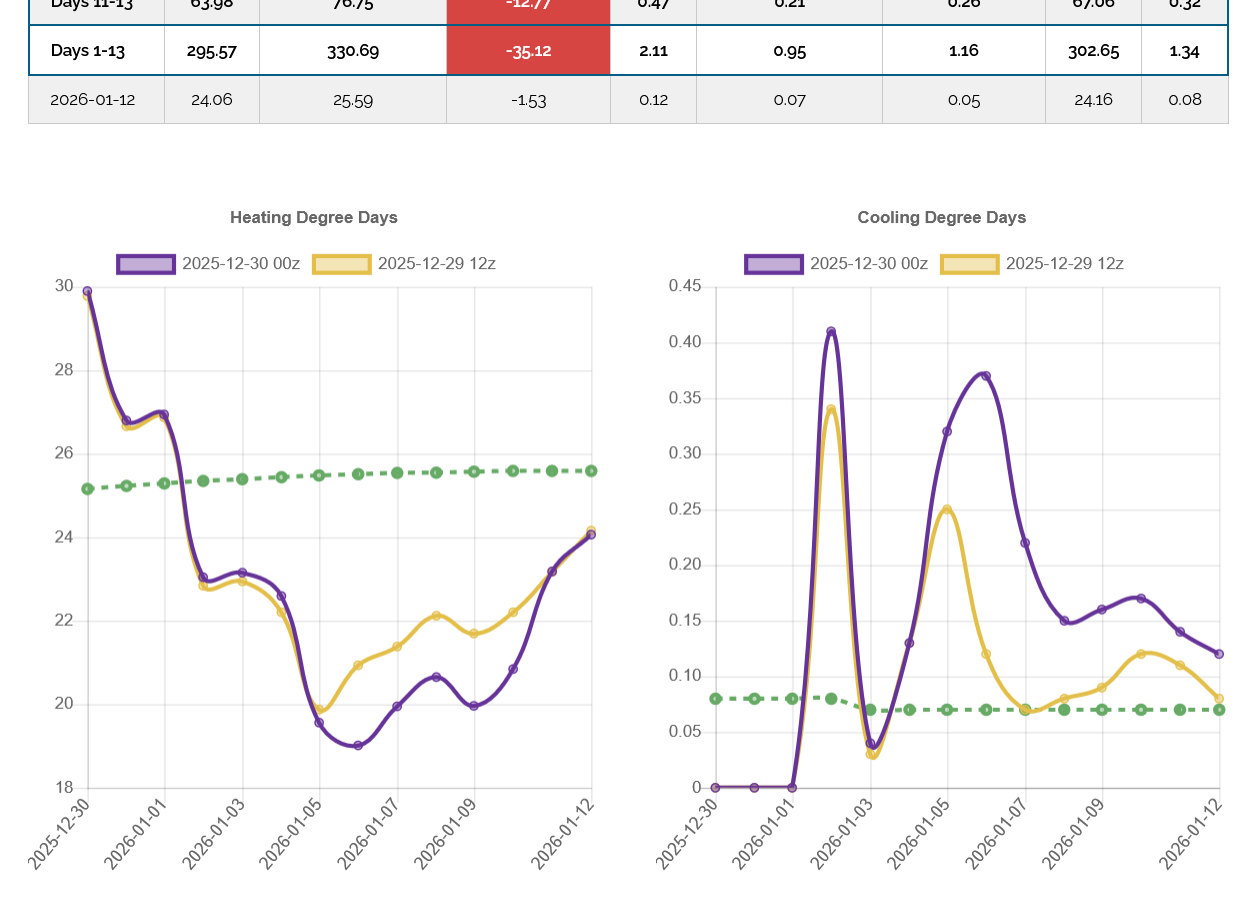
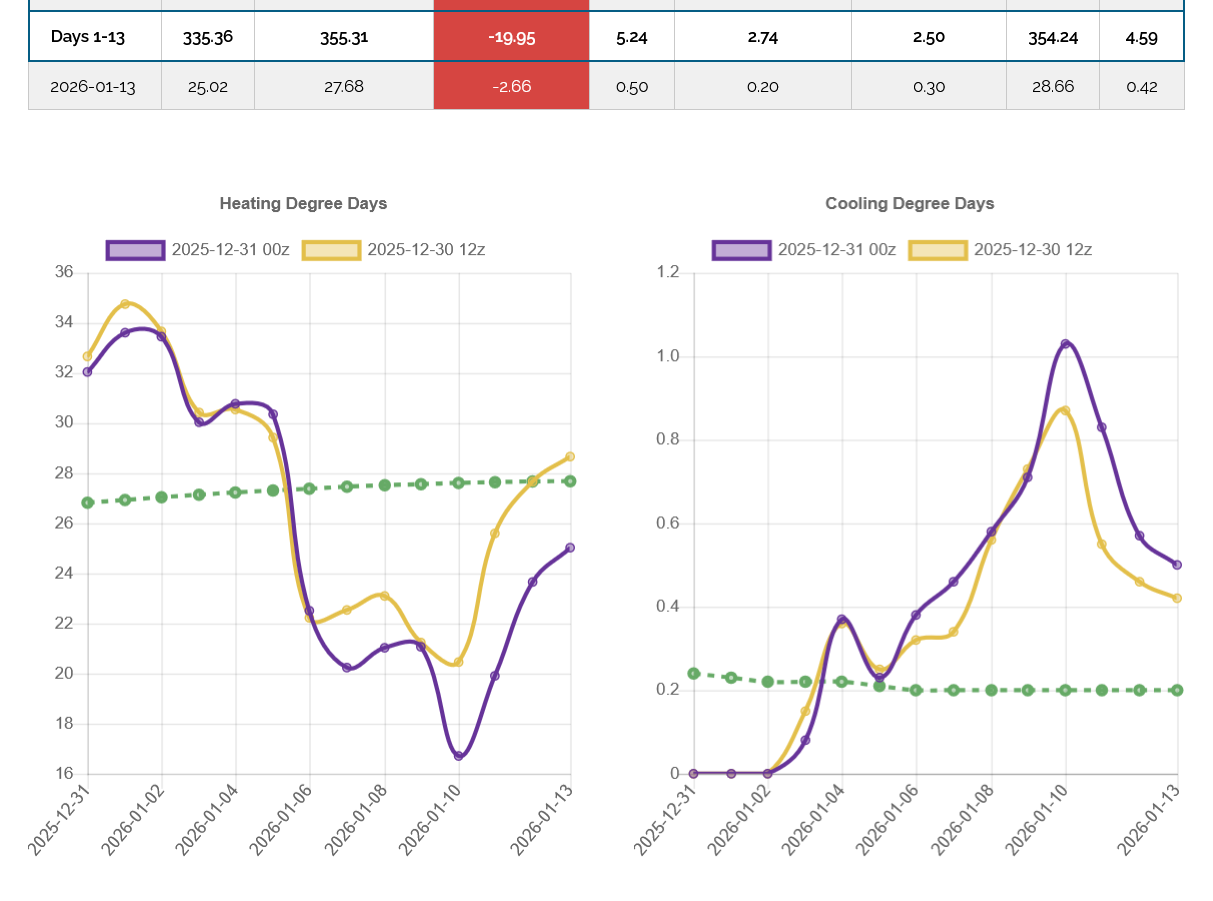
1. This last European Ensemble average model was down, almost another whopping -14 HDDs.
Also, this very bearish EIA could be a sell the rumor, buy the fact event if weather models start getting colder.
Also, the approach and expiration of January was very bullish, with it going off the board at a $7,000/contract premium and spike higher which probably pulled up the February with it. After it expired, February doesn't have the same pull.
The trajectory at the end of the period is still potentially bullish, If it continues into week 3 and crosses to the positive side of the green average line, ng should go up again. Note the green average line hitting its seasonal/climatological peak in week 2.
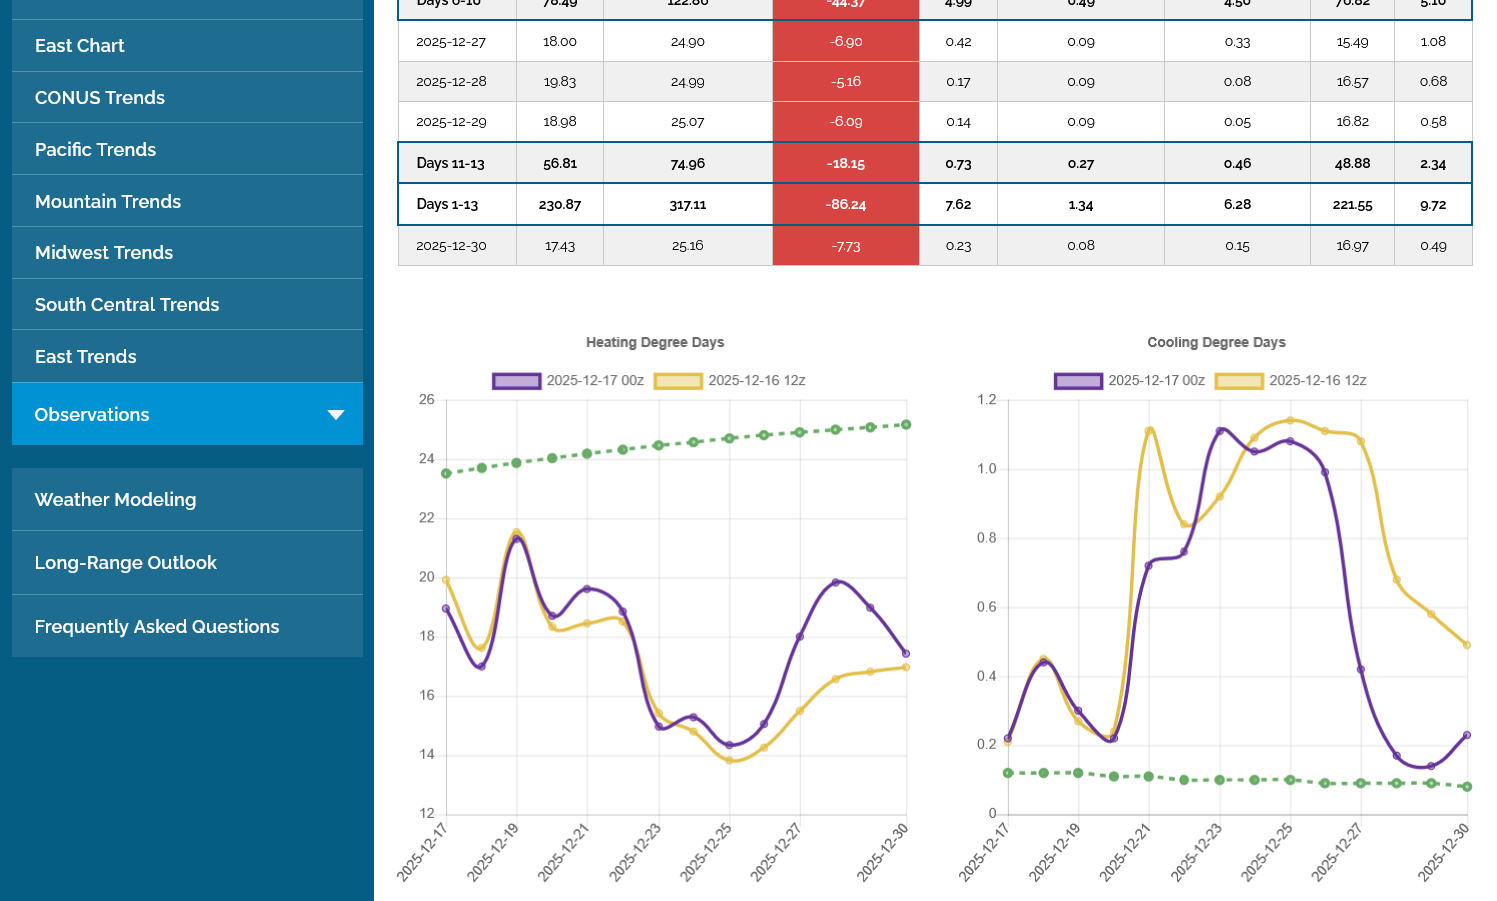
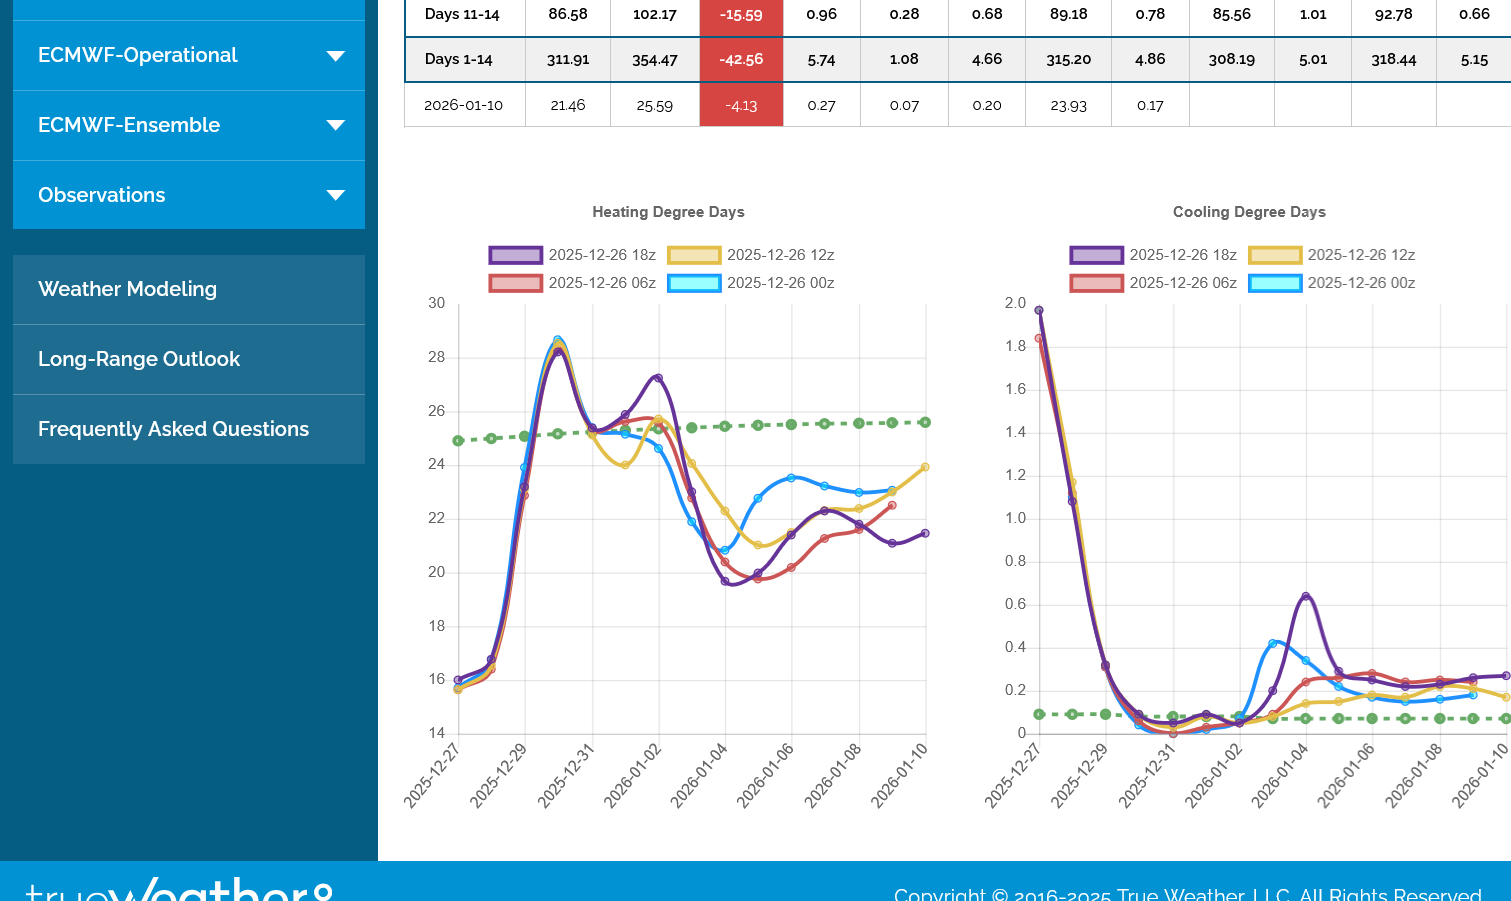
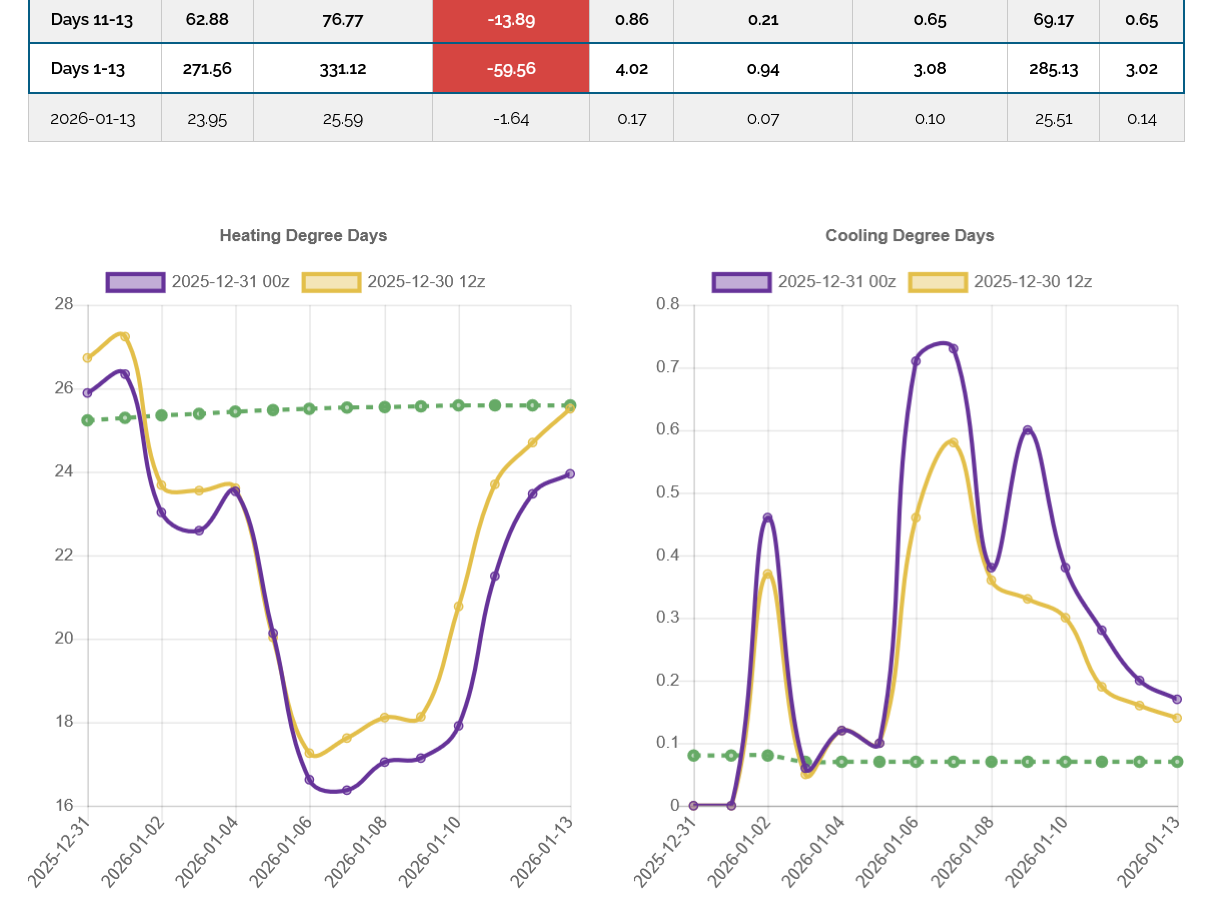
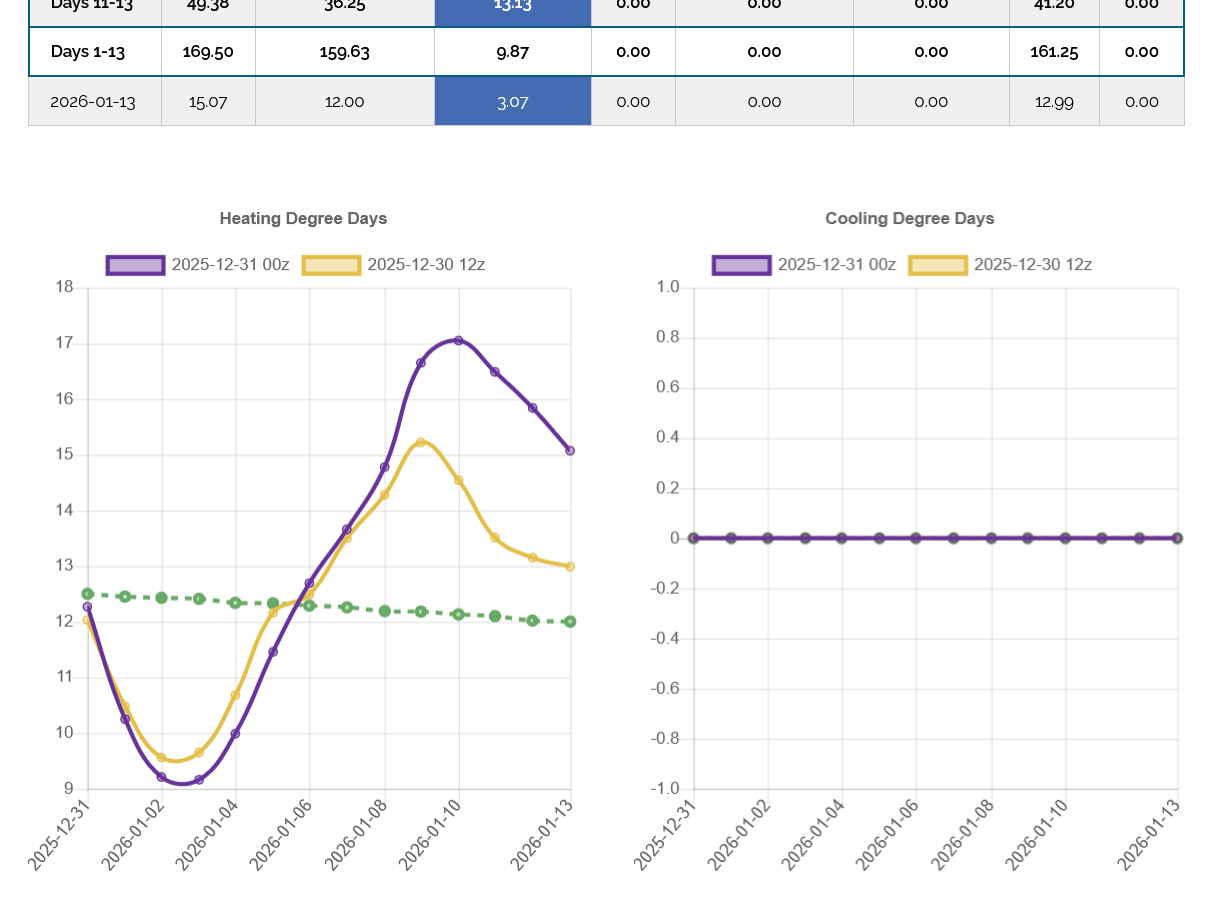
2. The cold WILL be hitting but it will do so in the West as the upper level ridge builds in the East. These were the HDDs for just the Pacific region. MUCH colder/bullish but not enough people live here for it to impact the OVERALL HDDs in the United States enough.
3. Below that is the MUCH more important East HDDs. This last 0z run was a whopping -20 HDDs for this DOMINANT region!
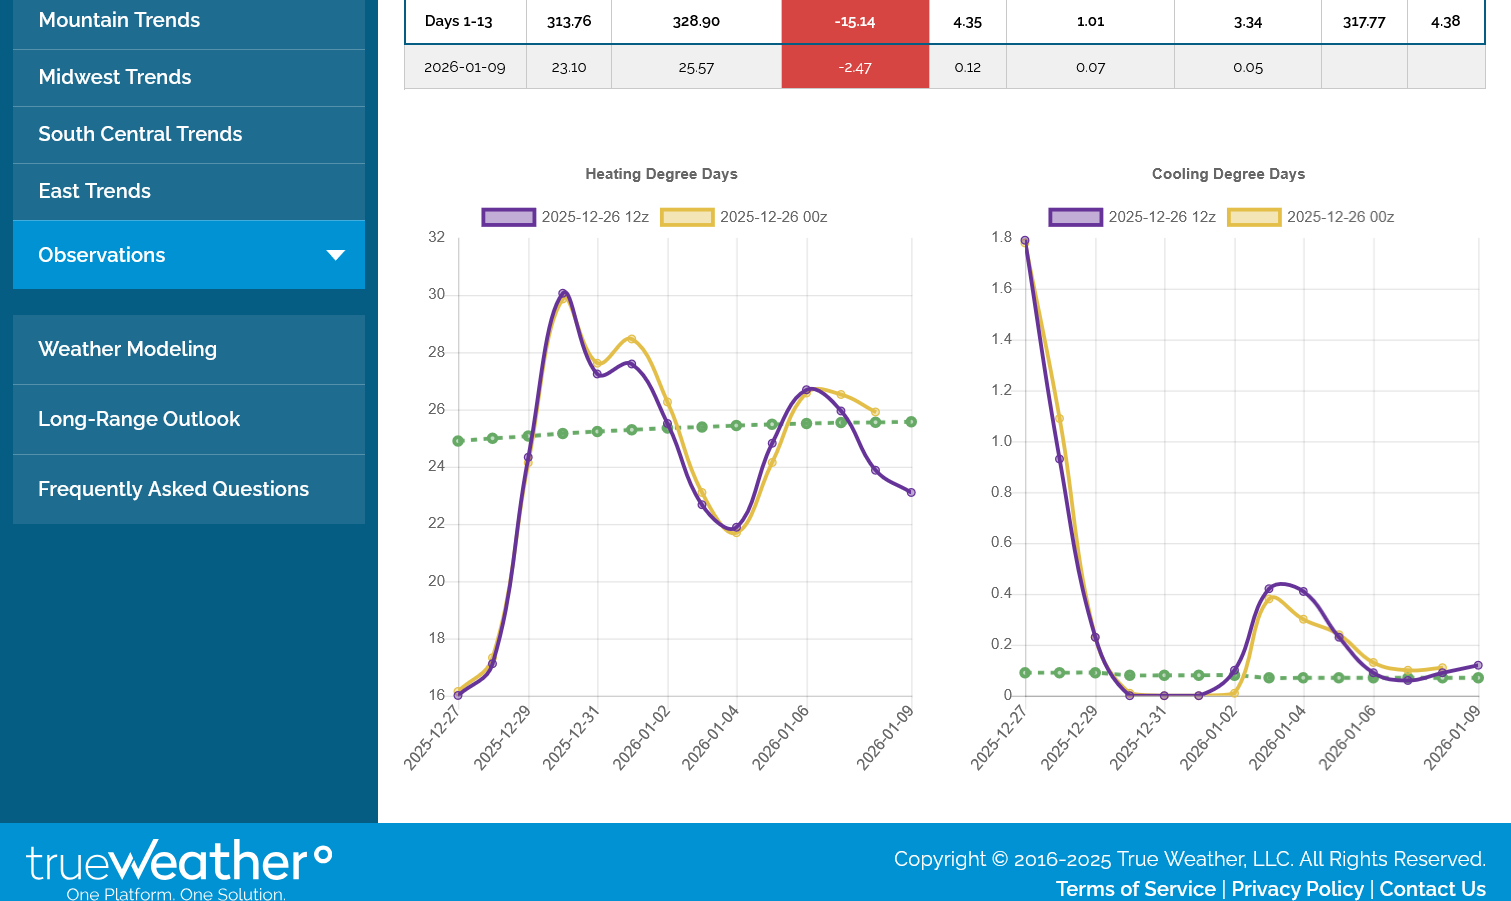
The HDDs are on the LEFT below. CDDs on the right only matter in the warm weather season. The scale for CDDs below is trivial.
EIA was -38, right at the mean of the survey I saw. This is nowhere near the record low draw for that week since 2010, which is -14 based on the following:
EIA week ending:
12/26/14: -26
12/30/16: -49
12/28/18: -20
1/3/20: -44
12/31/21: -31 (very warm Christmas also)
1/6/23: +11
12/29/23: -14
1/3/25: -40
Thanks, Larry!
Not warm enough(too cold) in the Northeast and Upper Midwest/Great Lakes this time.
https://ir.eia.gov/ngs/ngs.html
![]()
for week ending December 26, 2025 | Released: December 31, 2025 at 12:00 p.m. | Next Release: January 8, 2026
| Working gas in underground storage, Lower 48 states Summary text CSV JSN | |||||||||||||||||||||||||
|---|---|---|---|---|---|---|---|---|---|---|---|---|---|---|---|---|---|---|---|---|---|---|---|---|---|
| Historical Comparisons | |||||||||||||||||||||||||
| Stocks billion cubic feet (Bcf) | Year ago (12/26/24) | 5-year average (2020-24) | |||||||||||||||||||||||
| Region | 12/26/25 | 12/19/25 | net change | implied flow | Bcf | % change | Bcf | % change | |||||||||||||||||
| East | 736 | 751 | -15 | -15 | 752 | -2.1 | 771 | -4.5 | |||||||||||||||||
| Midwest | 865 | 904 | -39 | -39 | 921 | -6.1 | 929 | -6.9 | |||||||||||||||||
| Mountain | 264 | 266 | -2 | -2 | 263 | 0.4 | 207 | 27.5 | |||||||||||||||||
| Pacific | 307 | 303 | 4 | 4 | 295 | 4.1 | 252 | 21.8 | |||||||||||||||||
| South Central | 1,203 | 1,190 | 13 | 13 | 1,200 | 0.3 | 1,159 | 3.8 | |||||||||||||||||
| Salt | 343 | 323 | 20 | 20 | 349 | -1.7 | 331 | 3.6 | |||||||||||||||||
| Nonsalt | 859 | 867 | -8 | -8 | 851 | 0.9 | 828 | 3.7 | |||||||||||||||||
| Total | 3,375 | 3,413 | -38 | -38 | 3,430 | -1.6 | 3,317 | 1.7 | |||||||||||||||||
| Totals may not equal sum of components because of independent rounding. Notice: We will implement our new information release system for the Weekly Petroleum Status Report on January 7, 2026, and for the Weekly Natural Gas Storage Report on January 8, 2026. You can continue to access weekly data manually or through automated bots via ir.eia.gov. | |||||||||||||||||||||||||
Working gas in storage was 3,375 Bcf as of Friday, December 26, 2025, according to EIA estimates. This represents a net decrease of 38 Bcf from the previous week. Stocks were 55 Bcf less than last year at this time and 58 Bcf above the five-year average of 3,317 Bcf. At 3,375 Bcf, total working gas is within the five-year historical range.
For information on sampling error in this report, see Estimated Measures of Sampling Variability table below.
Note: The shaded area indicates the range between the historical minimum and maximum values for the weekly series from 2020 through 2024. The dashed vertical lines indicate current and year-ago weekly periods.
+++++++++++++++++
We are starting a period from a year ago that featured extended frigid weather that will cause us to go from a small deficit vs last year to a pretty big surplus by the end of the month with the current forecast.
This last 18z GEFS was yet another -14 HDDs! Purple on the left. Been getting warmer and warmer all week for INDIVIDUAL days that have really added up, even though the trajectory in week 2 is still up. Potentially bullish if it would ever happen, instead of being continually delayed, while warming things up more constantly.
The predicted upper level ridge in the Southeast is turning out to be much more expansive and tenacious.