Samsung has developed a new solid-state battery that is set to revolutionize the electric vehicle industry.
The reason is that this new battery uses a silver-carbon composite layer for the anode. And according to estimates, there could be as much as (5) five grams of silver per cell in Samsung’s solid-state batteries. A typical EV battery pack contains around 200 cells, which means that each vehicle could require about 1 kg of silver.
The solar industry (which accounts for 15-20% of all silver demand) is in a race to reduce its silver consumption due to high prices. But the reality is that there is no viable substitute for silver in solar panels.
Thanks a ton, cutworm!
It's been an incredible market the past 4+ years!
Previous thread:
Gold Update
29 responses |
Started by joj - Oct. 8, 2025, 10:42 a.m.
https://www.marketforum.com/forum/topic/115139/
+++++++++++
Re: Re: Re: SILVER and Gold Update November 28, 2025
By tjc - Dec. 18, 2025, 9:09 p.m.
IMHO---time to buy PUT all 4 metals
Bought PLT put 2pm
+++++++++++++++++++++
Re: Re: Re: Re: SILVER and Gold Update November 28, 2025
By metmike - Dec. 18, 2025, 10:28 p.m.
Thanks, tjc!
You must have paid a pretty penny with the extreme volatility right now but then, you could make a couple of pretty pennies if you're right
We can't keep going up forever!
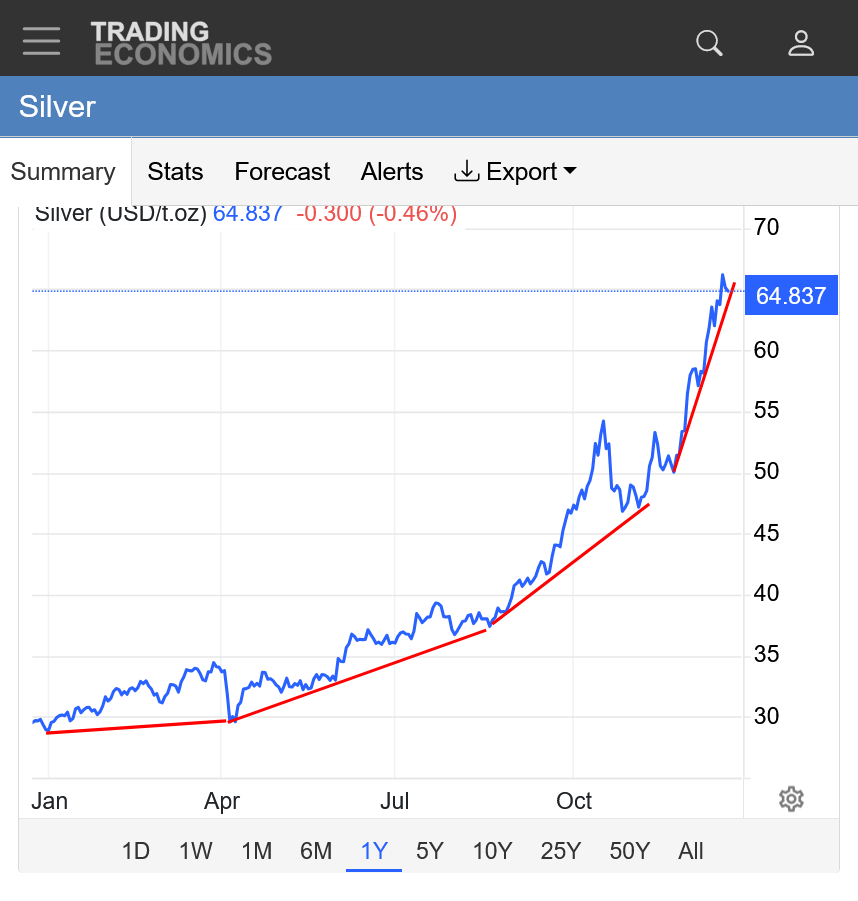
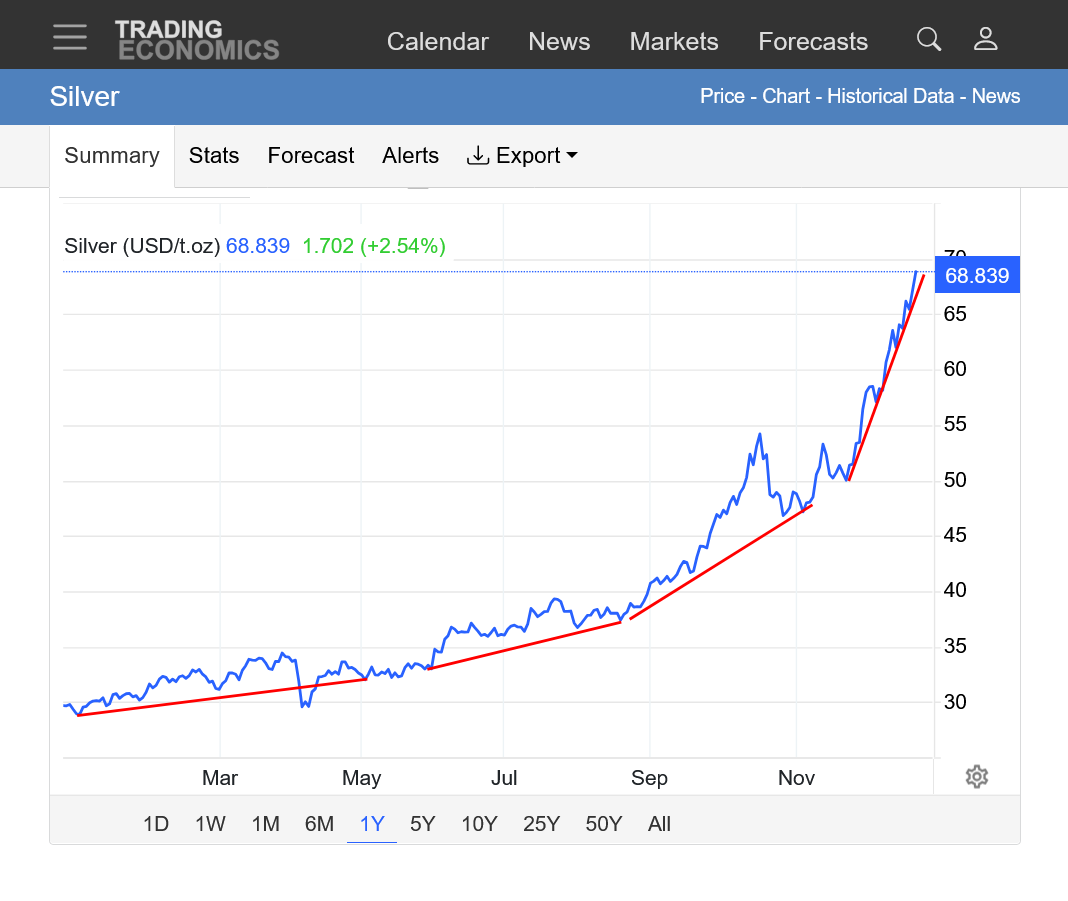
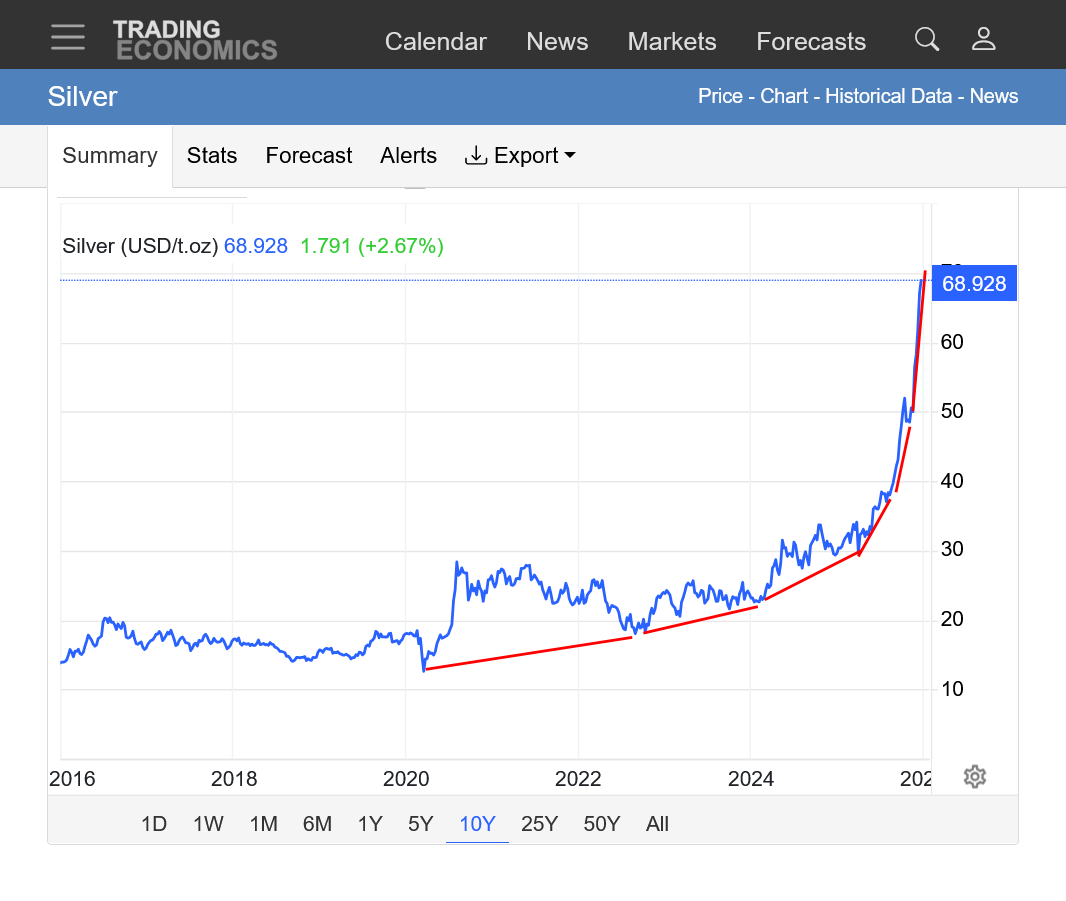
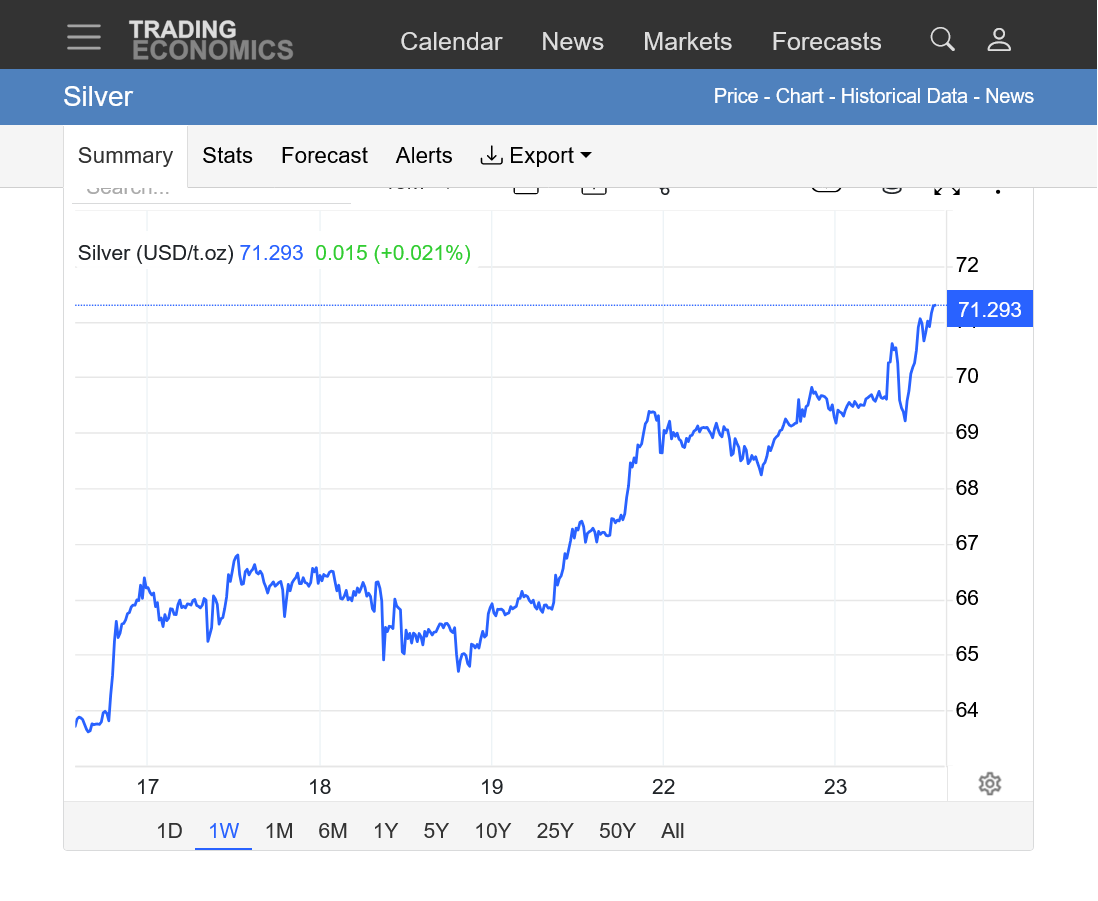
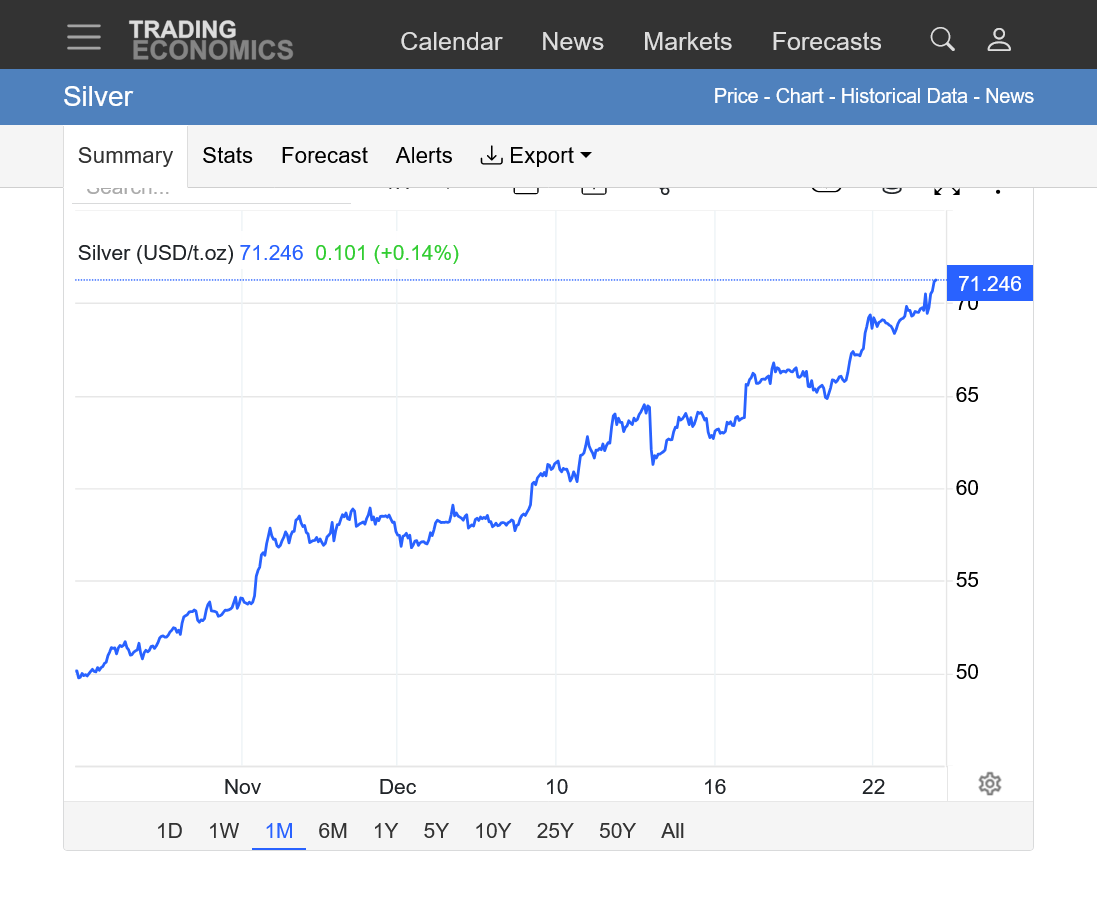
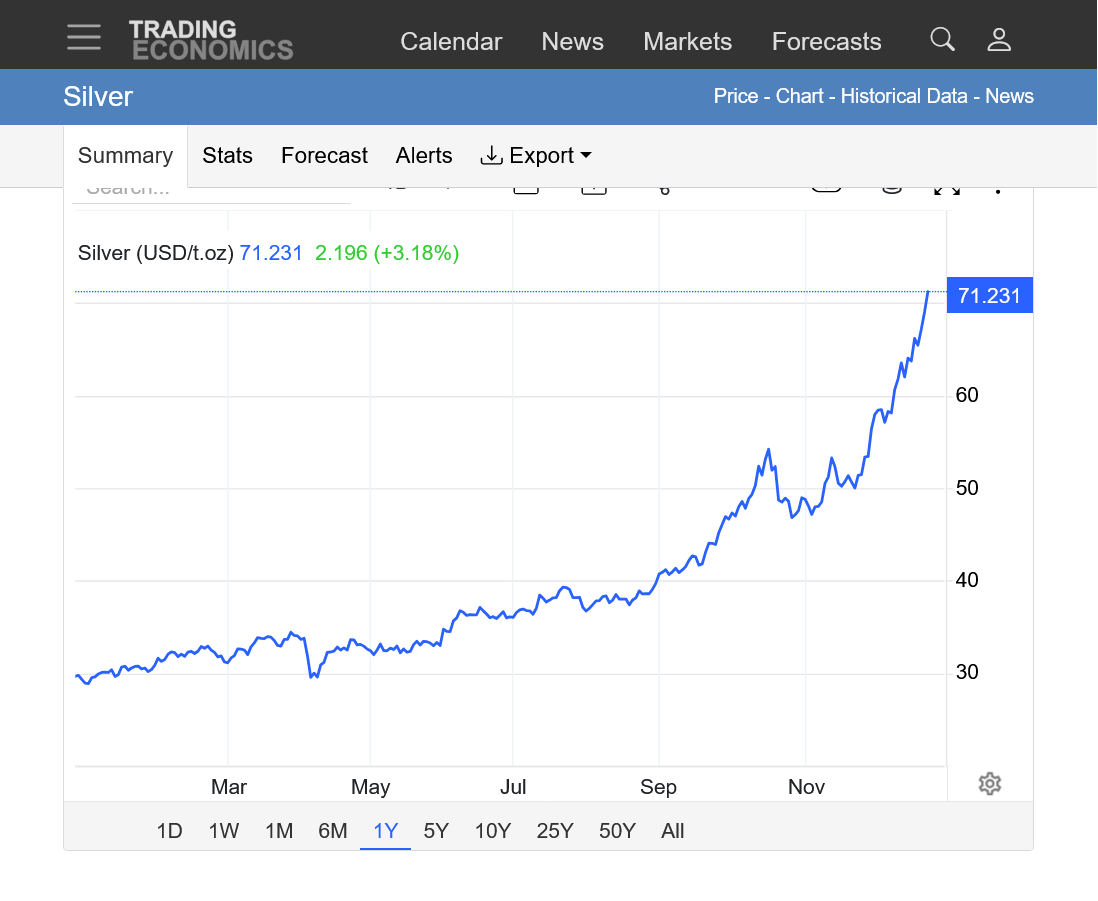
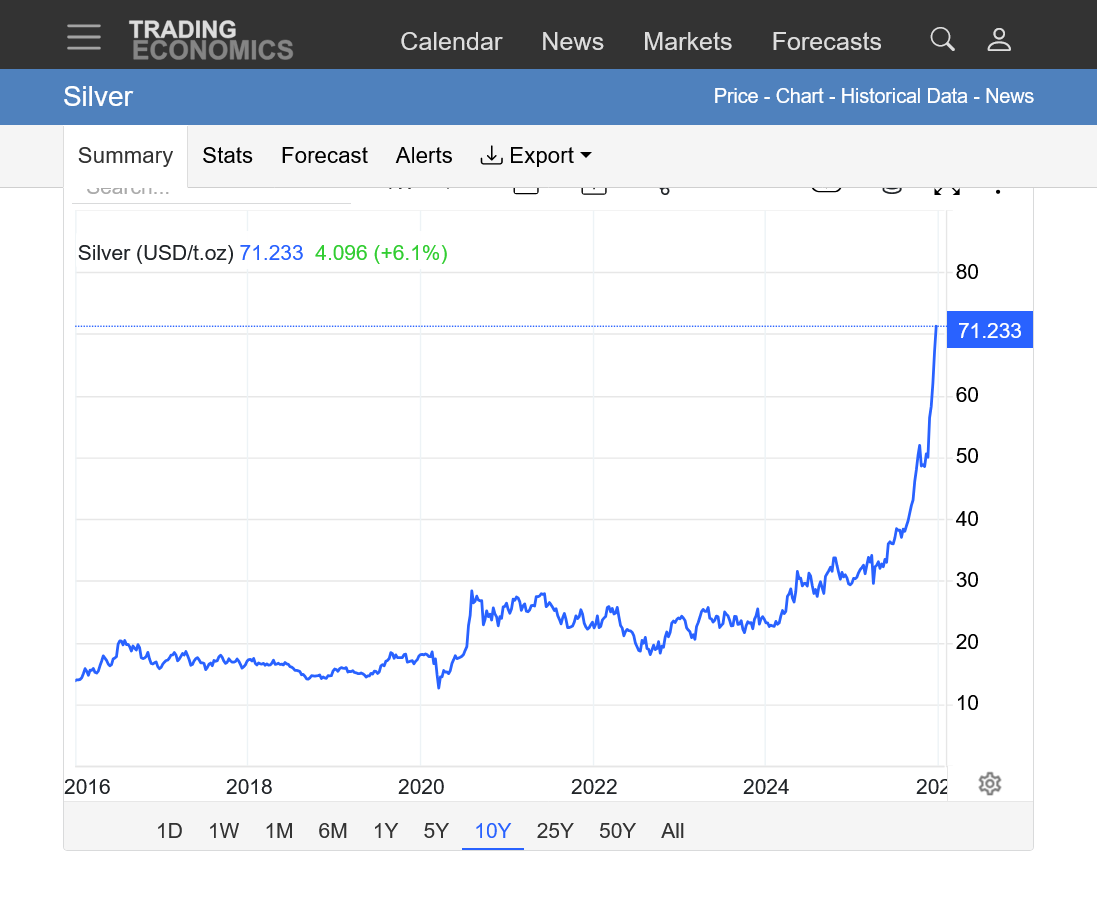
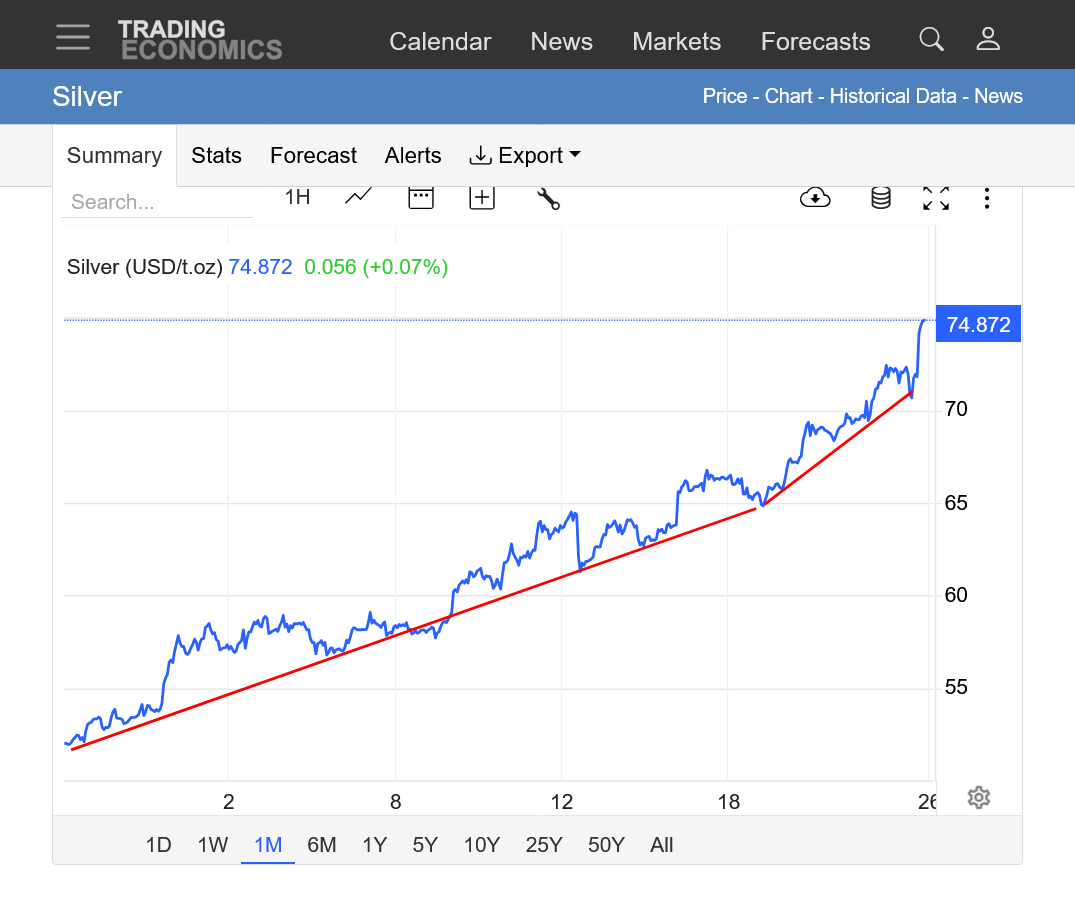
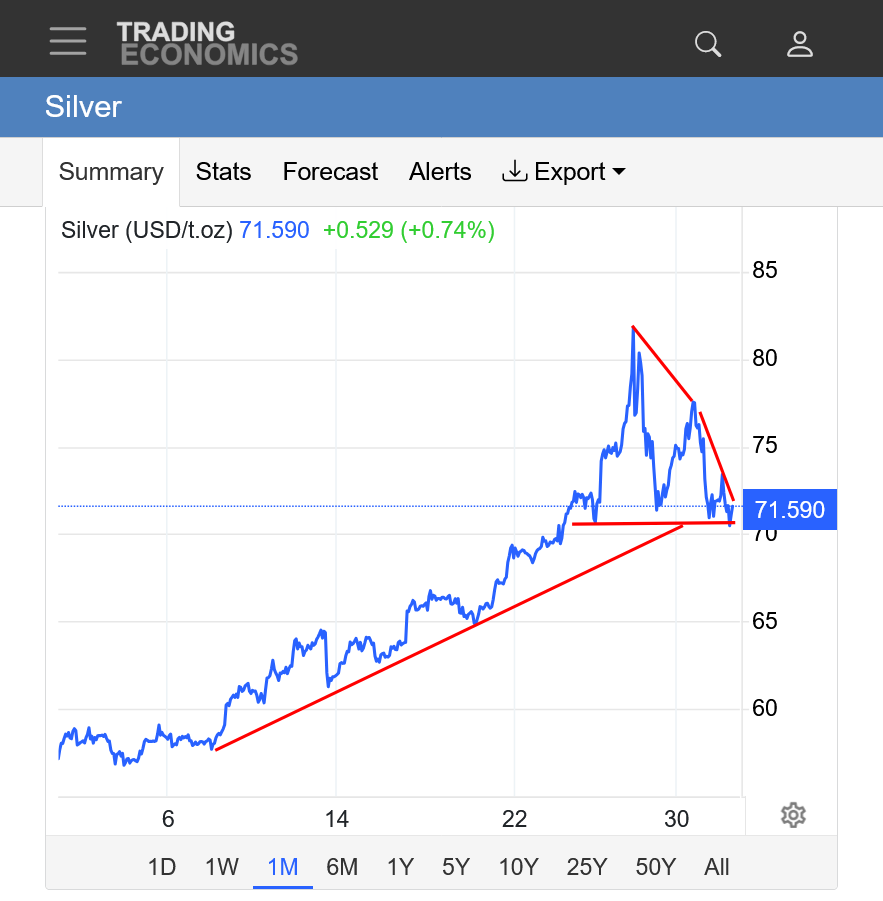
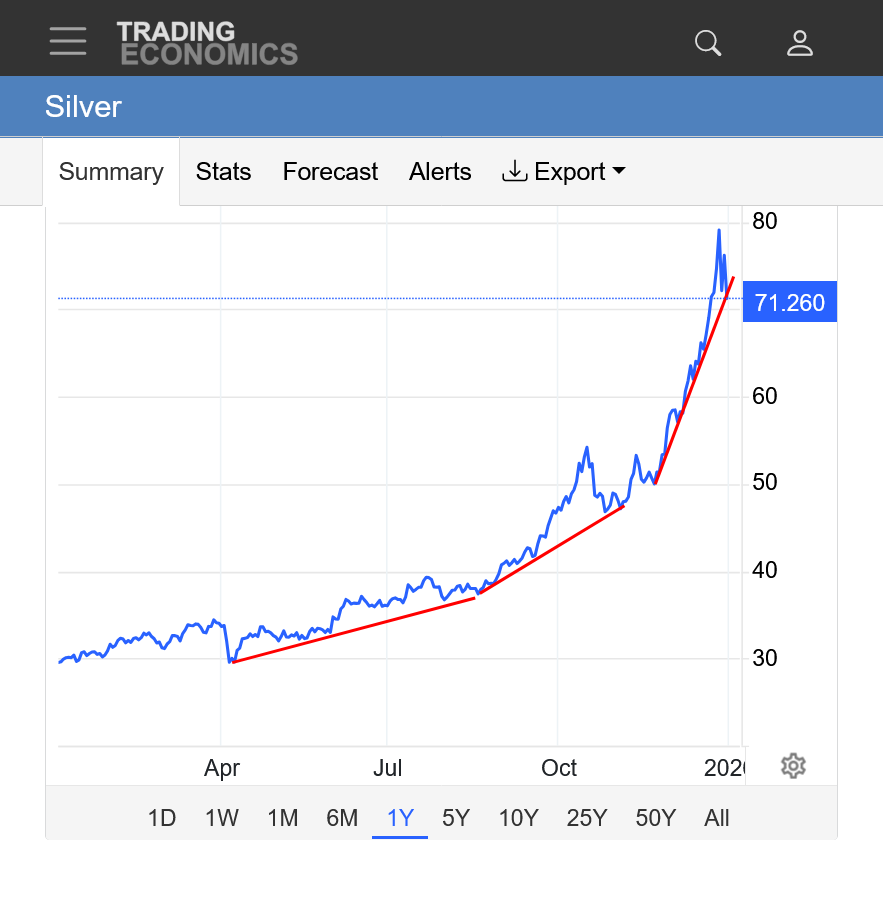
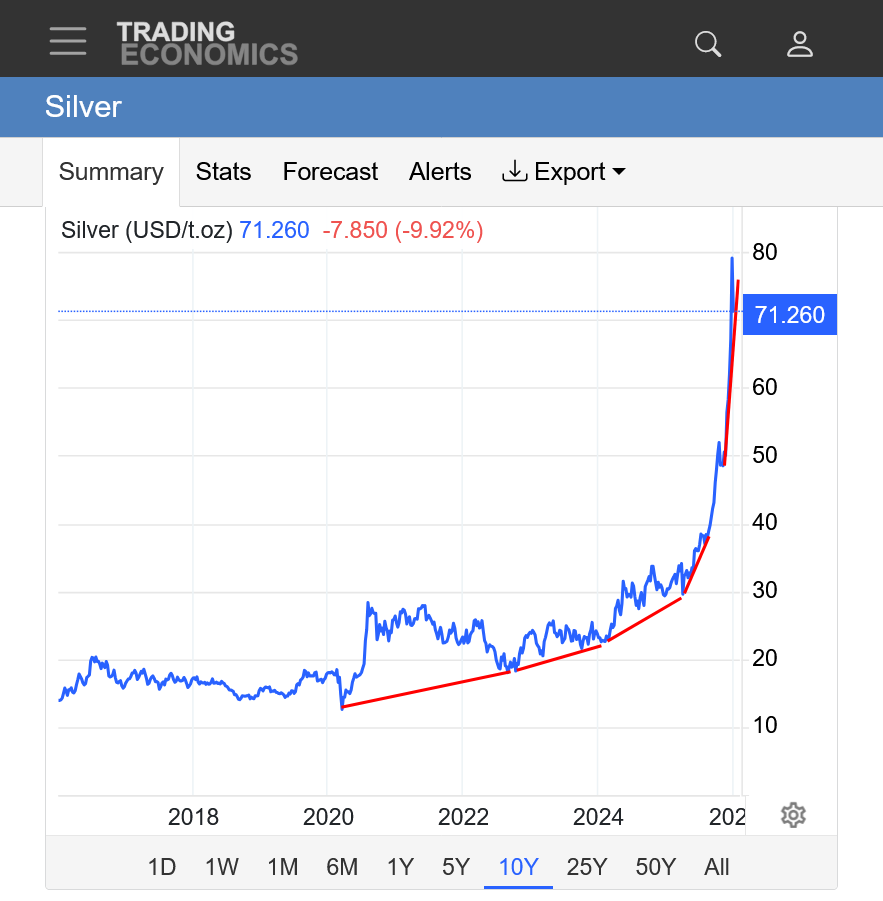
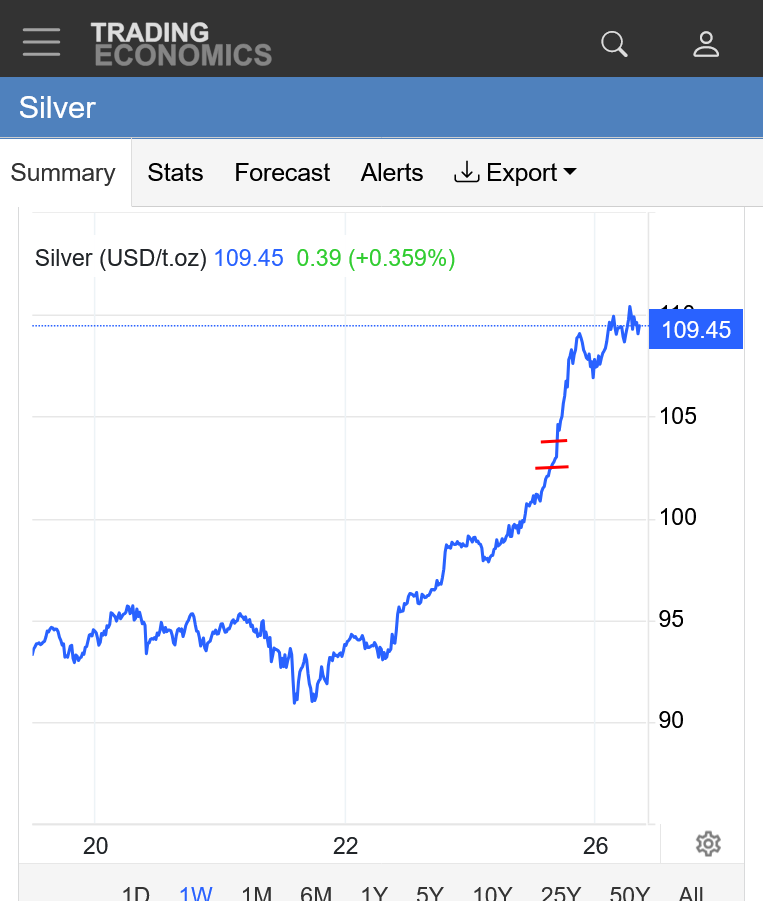
https://tradingeconomics.com/commodity/silver
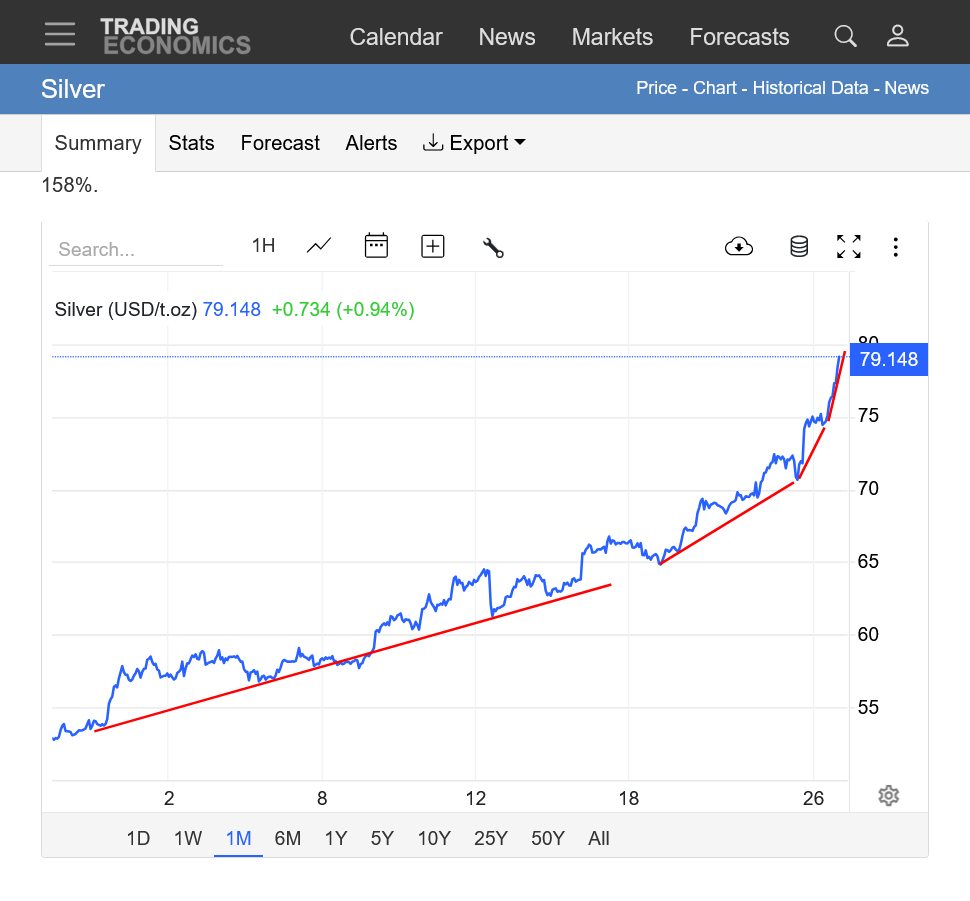
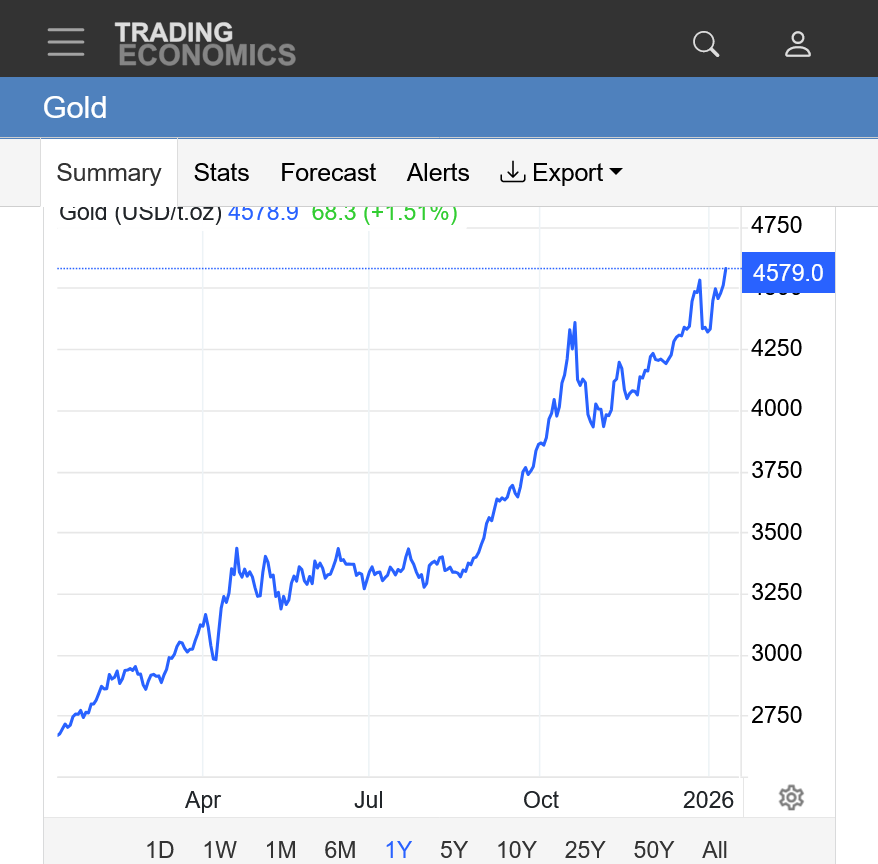
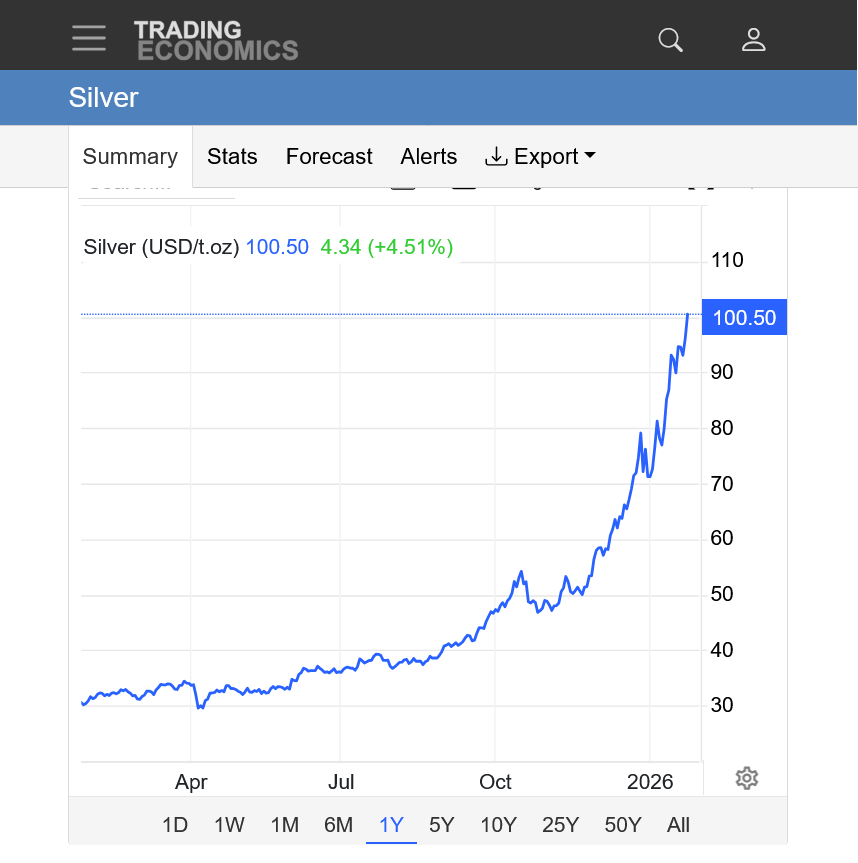
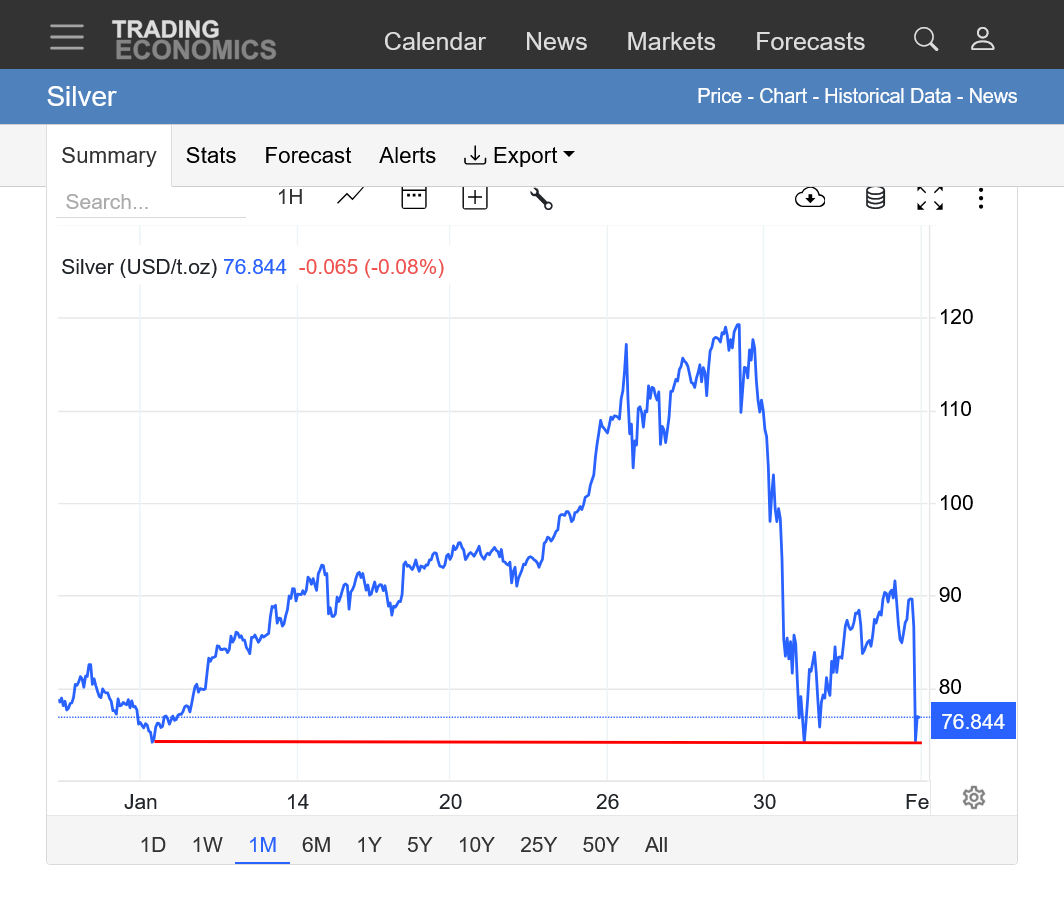
1. 1 month: 50 to 66 in a month. A couple of bull flag formations on the way up. Is this just another bull flag? Or is it a short term top.
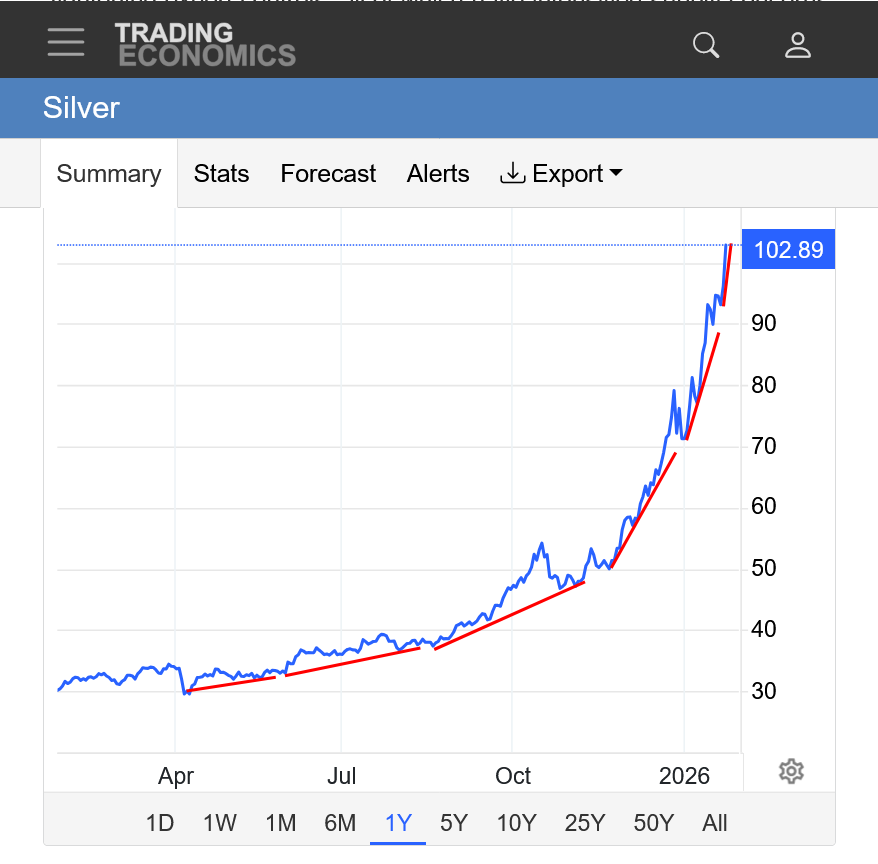
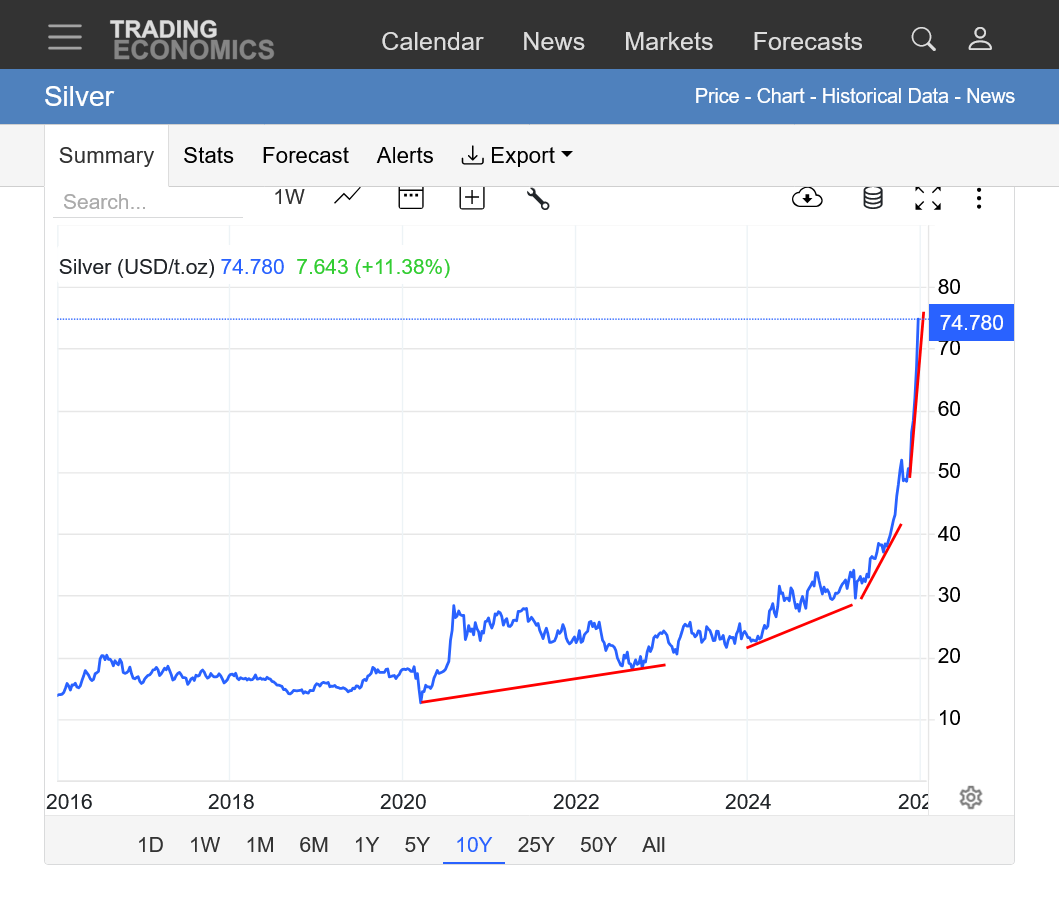
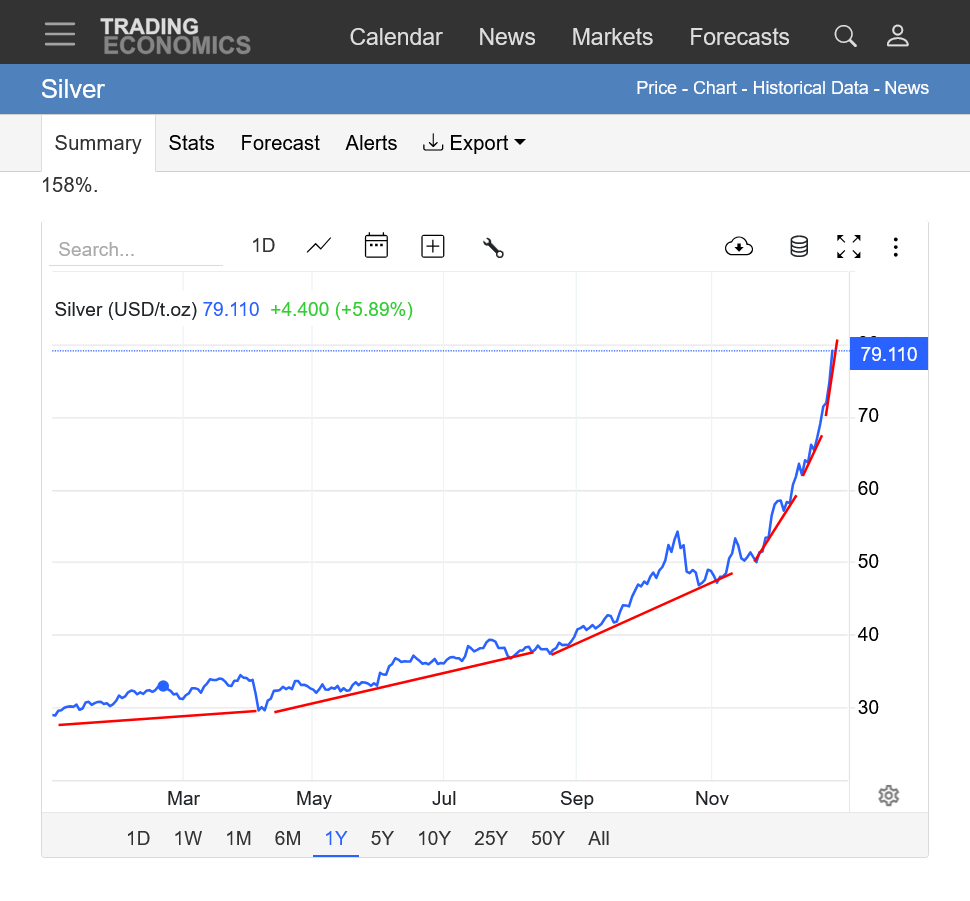
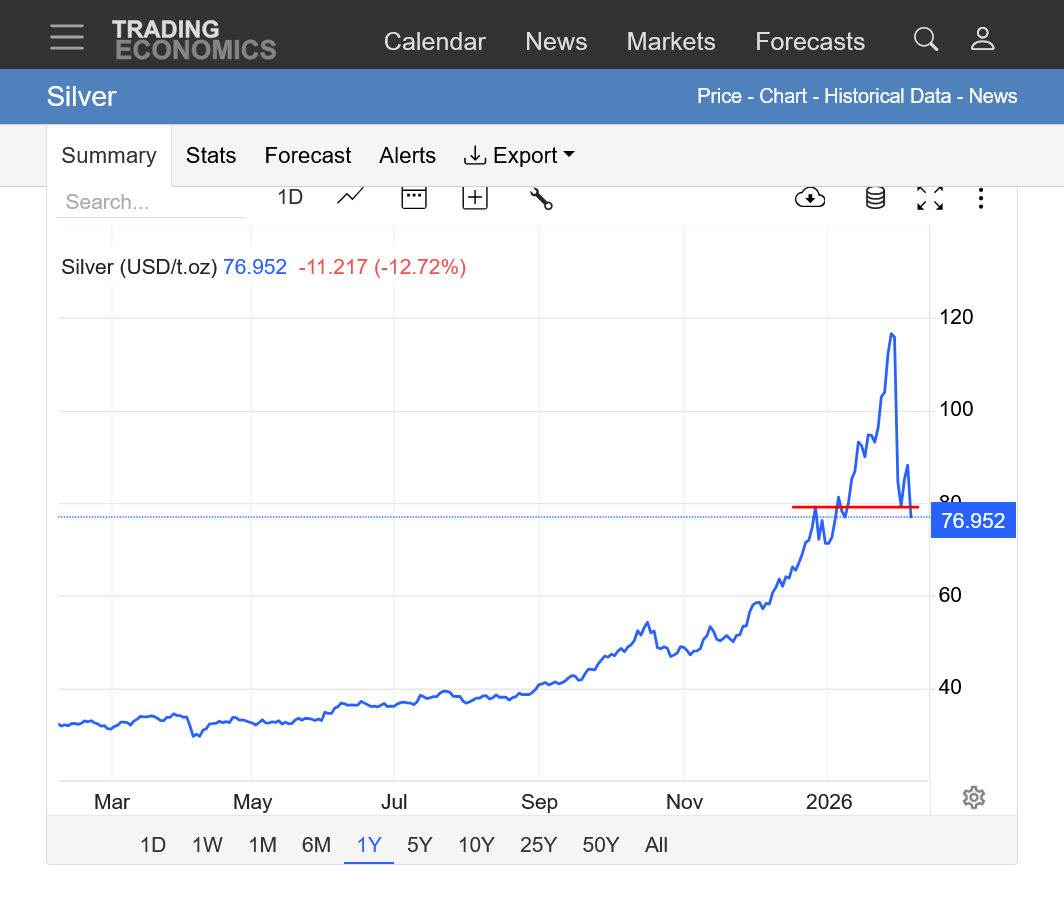
2. 1 year: The price has more than doubled this year.
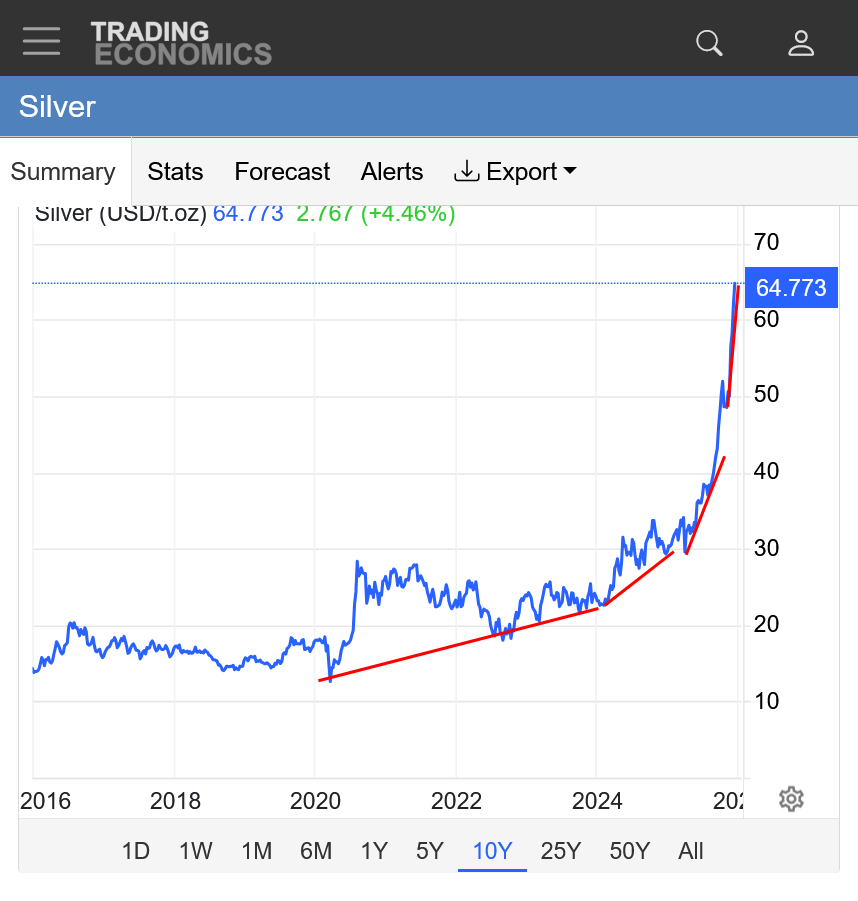
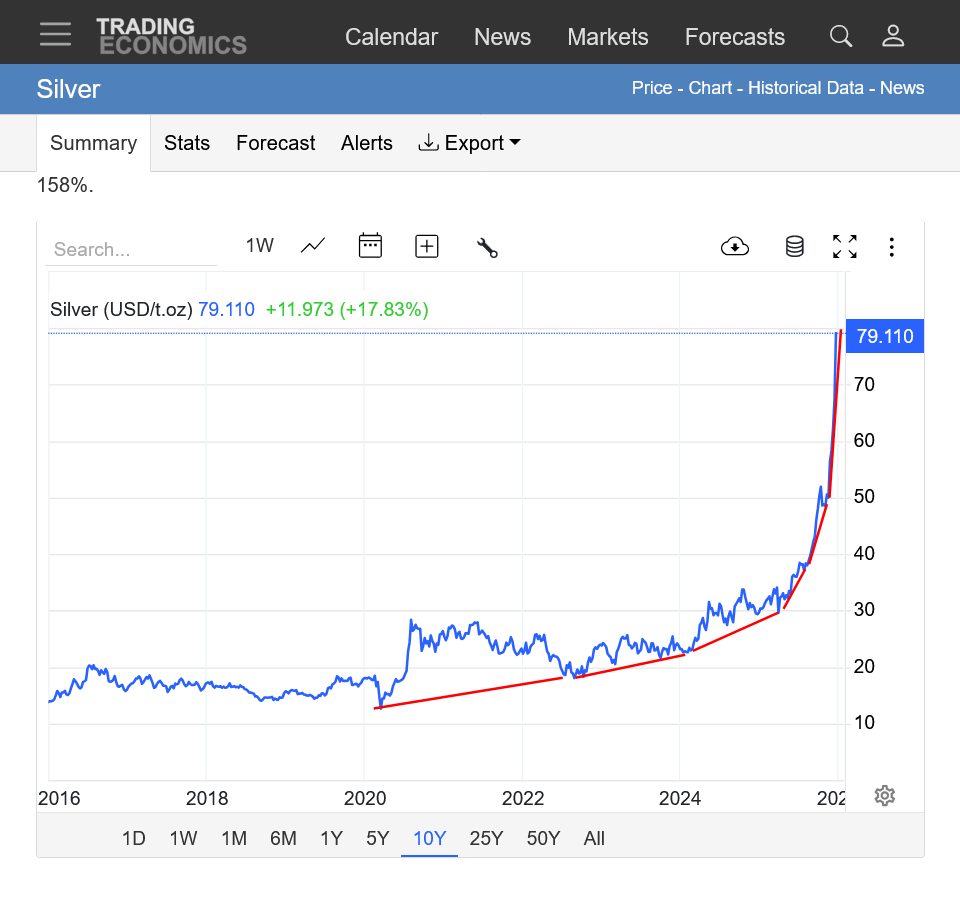
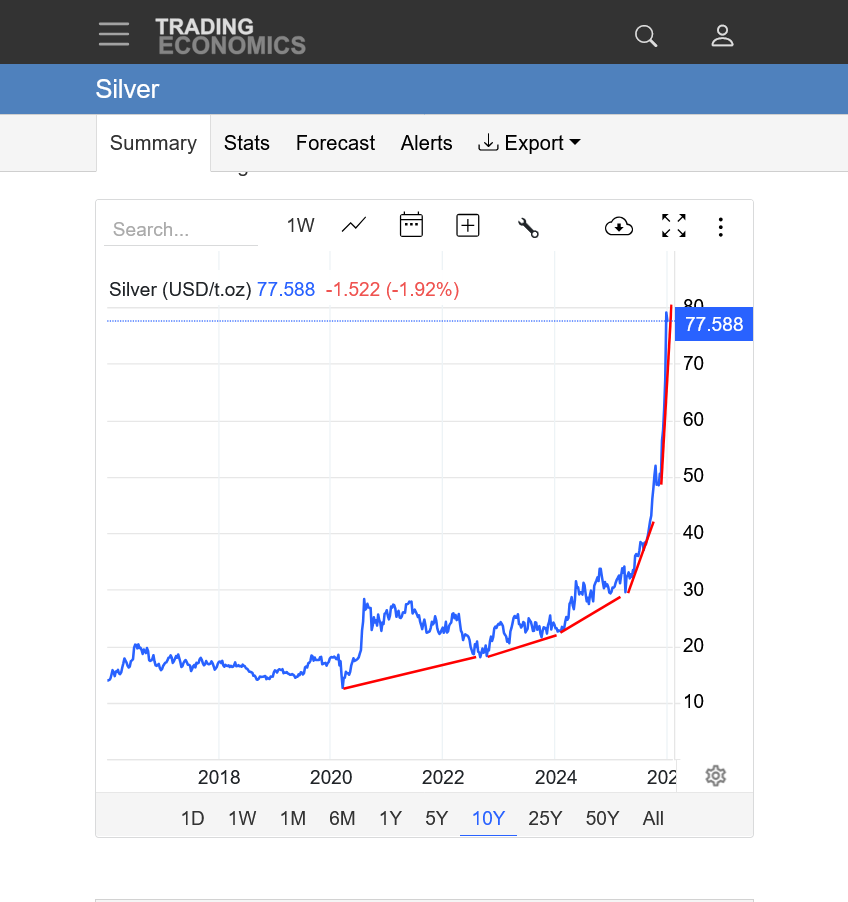
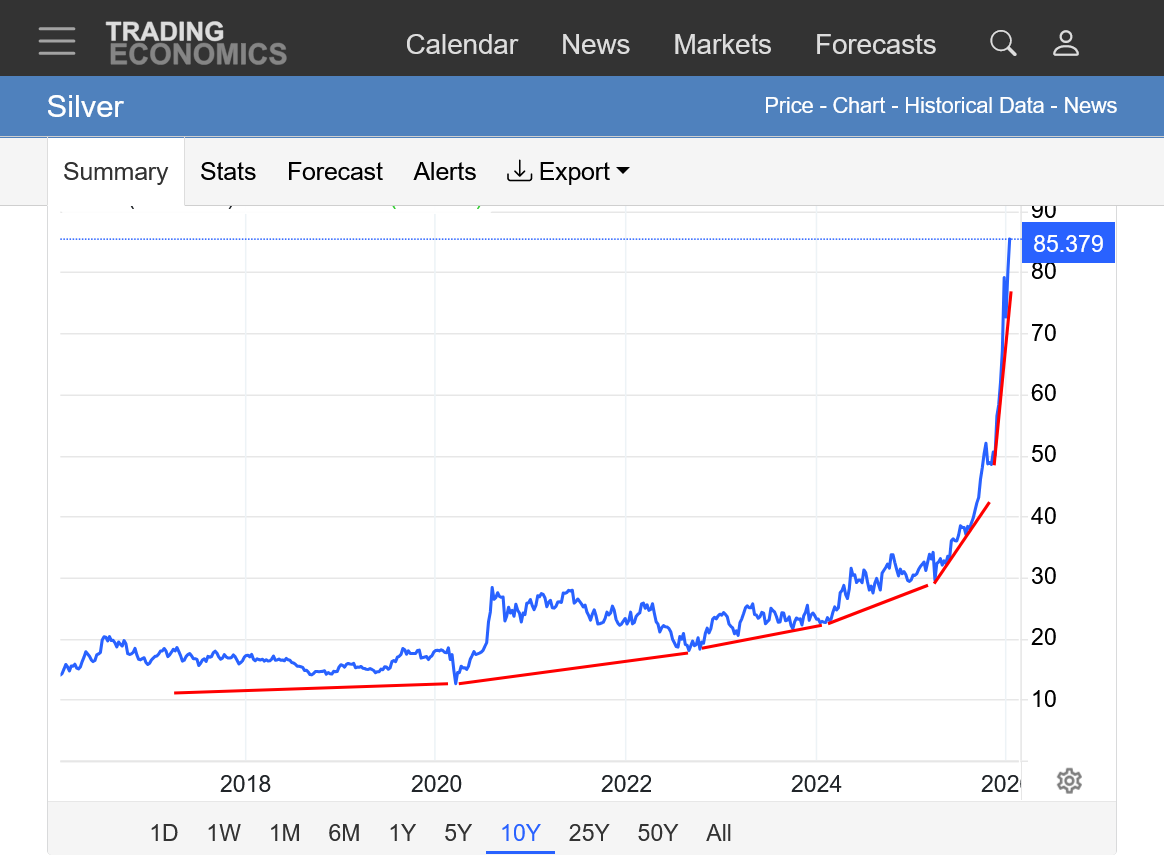
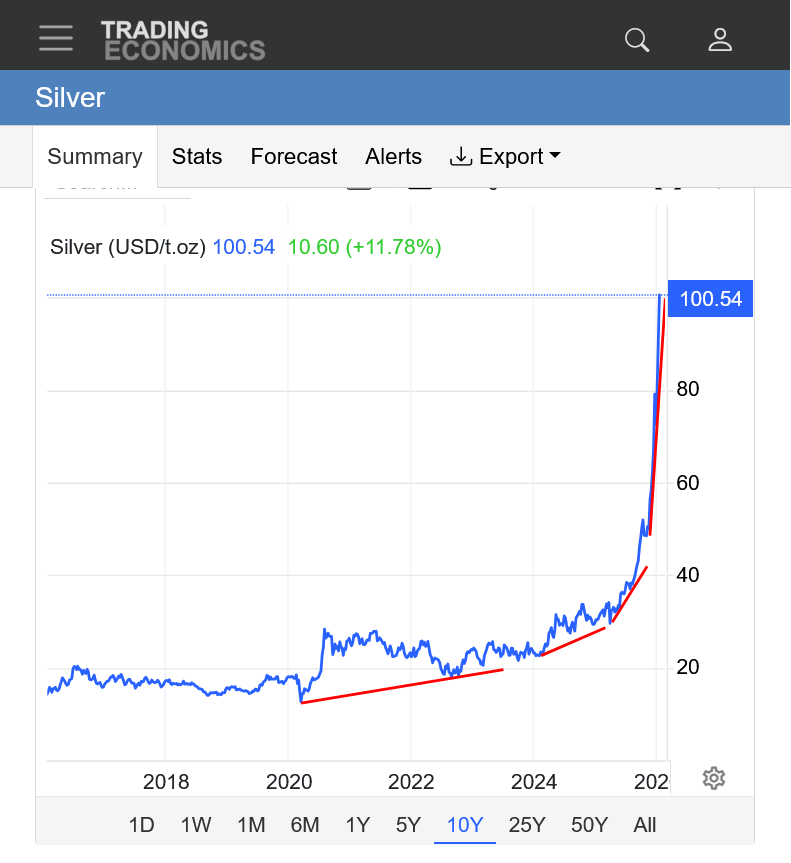
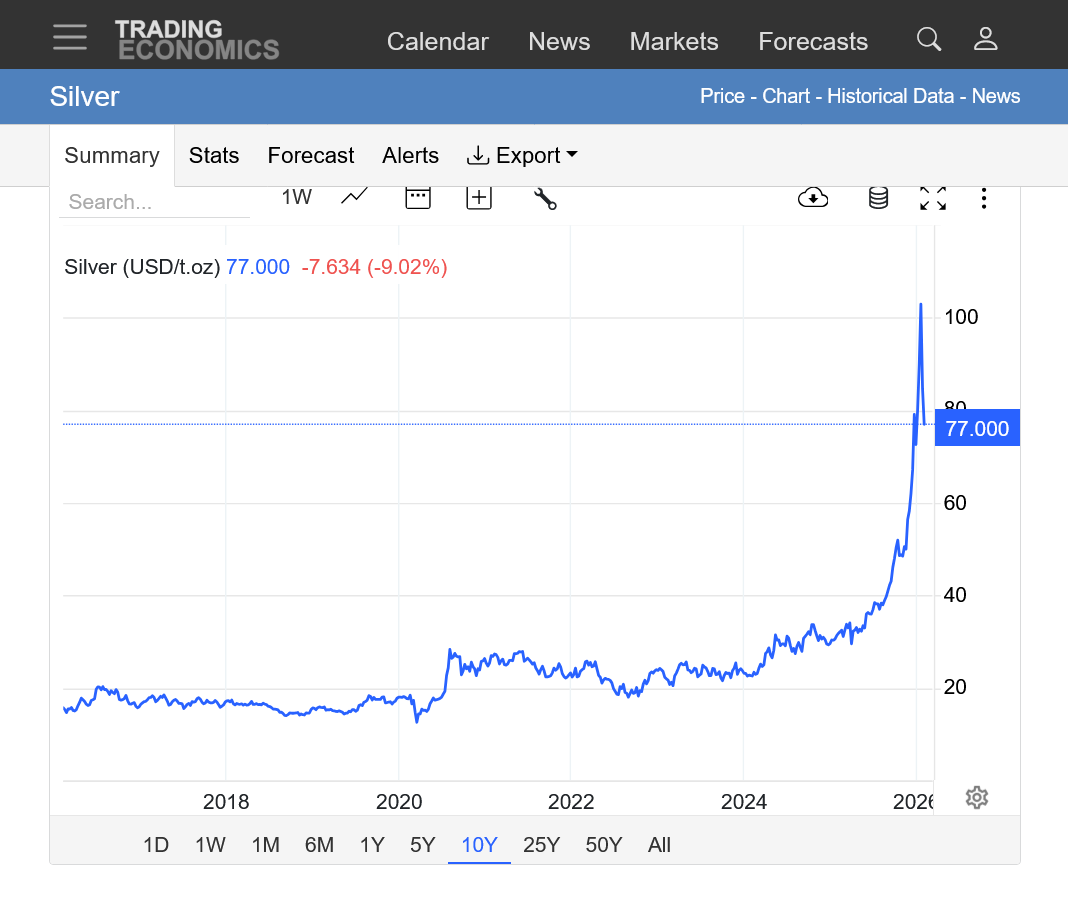
3. 10 years: Extreme parabolic/exponential move. Steeper and steeper upslope. Prices have quadrupled in 4 years. Can't go on forever but it's impossible to know when the top is in with confidence until........we're long past the top.
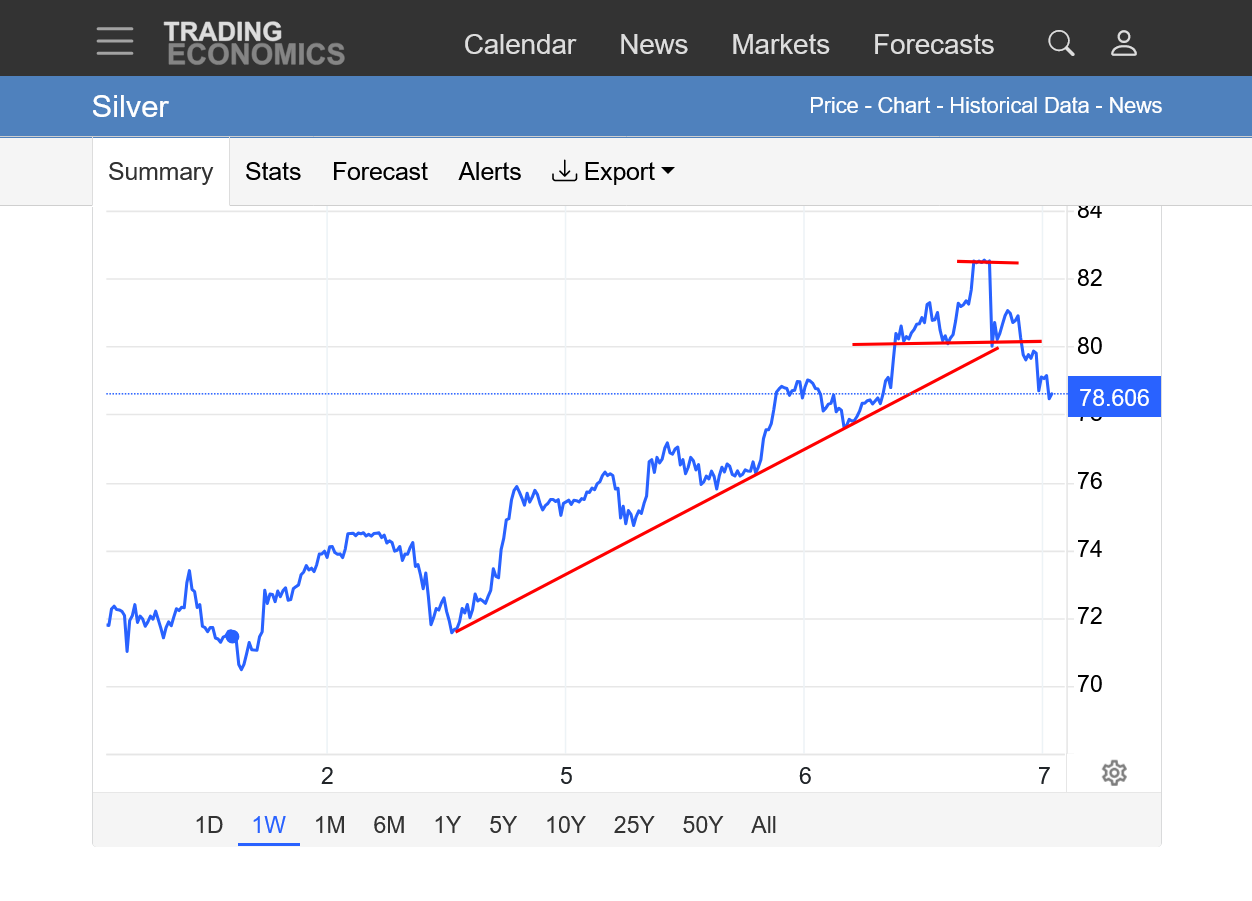
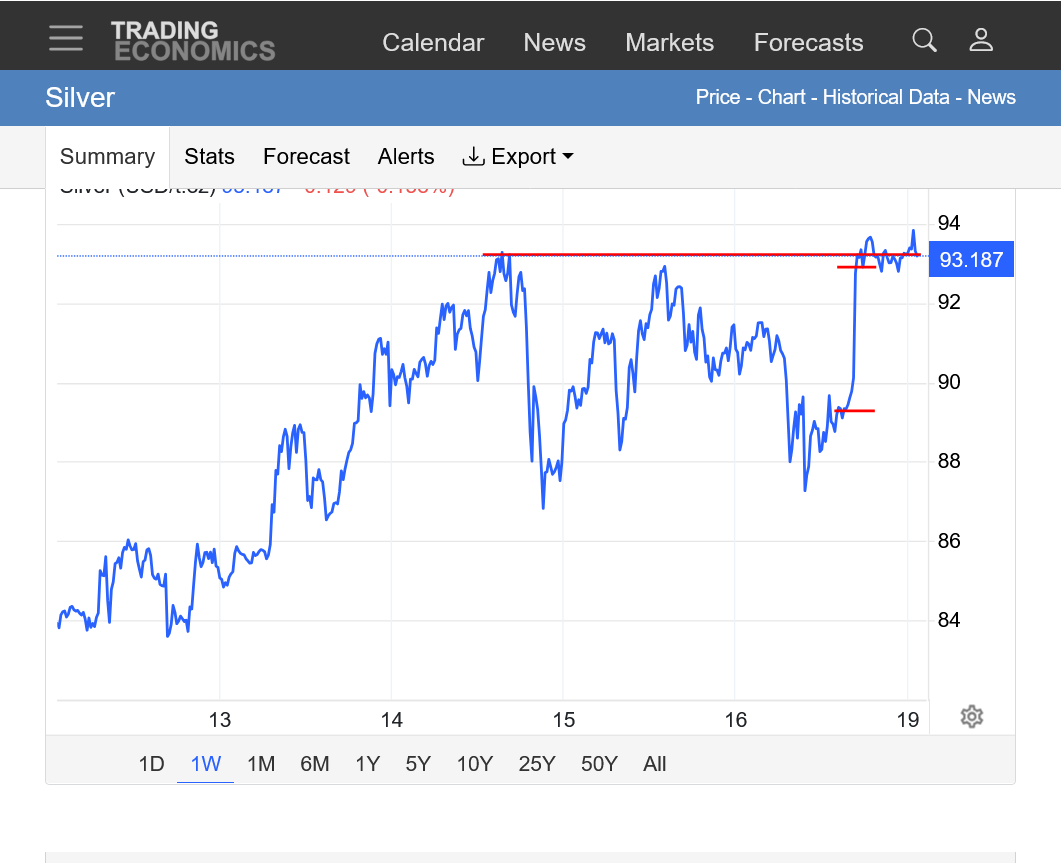
New all time highs for Silver. Unless we reverse lower, this was in fact just another bull flag as mentioned previously which is a continuation pattern.
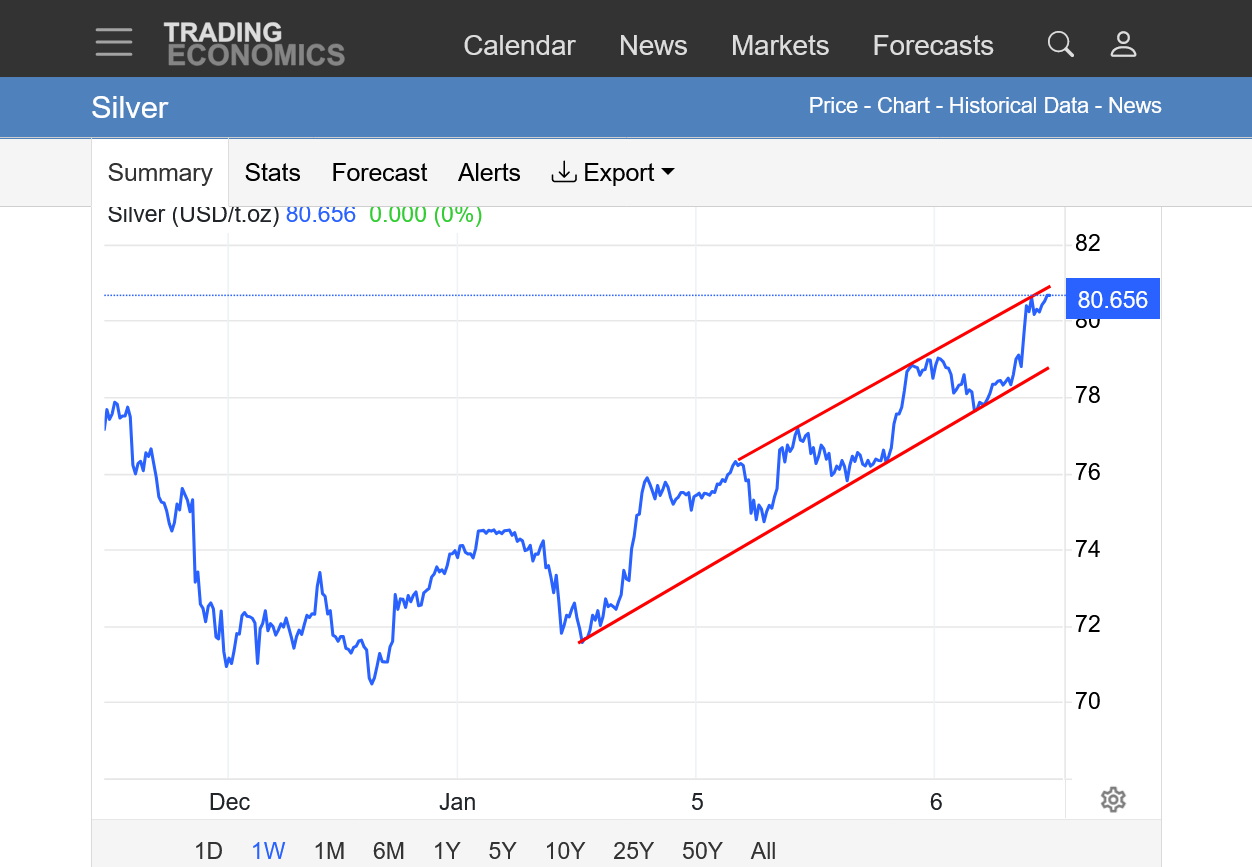
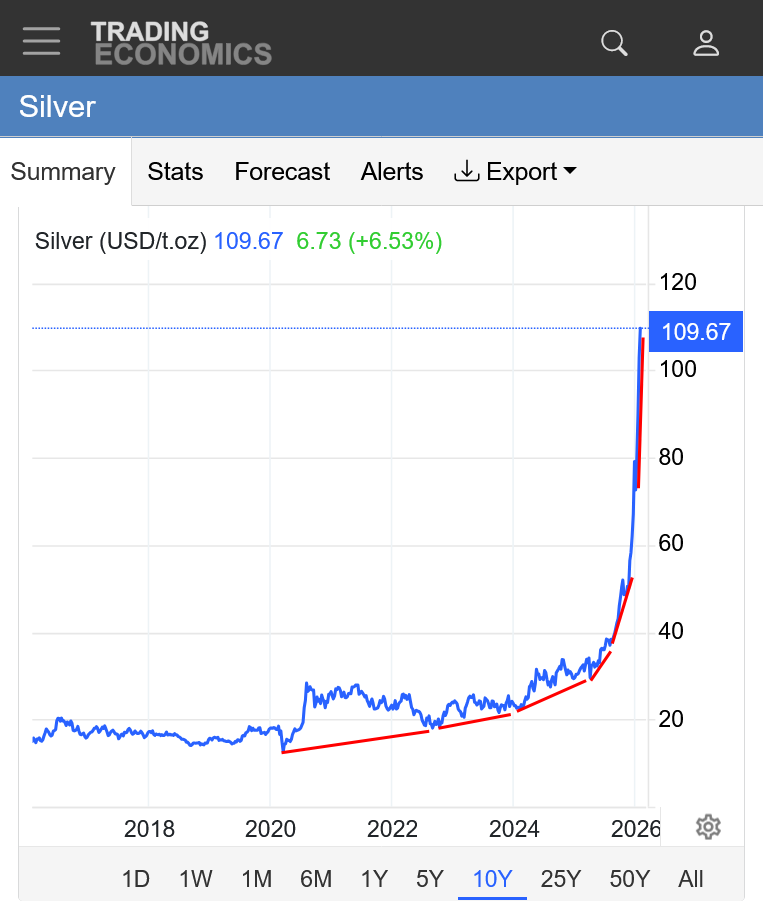
https://tradingeconomics.com/commodity/silver
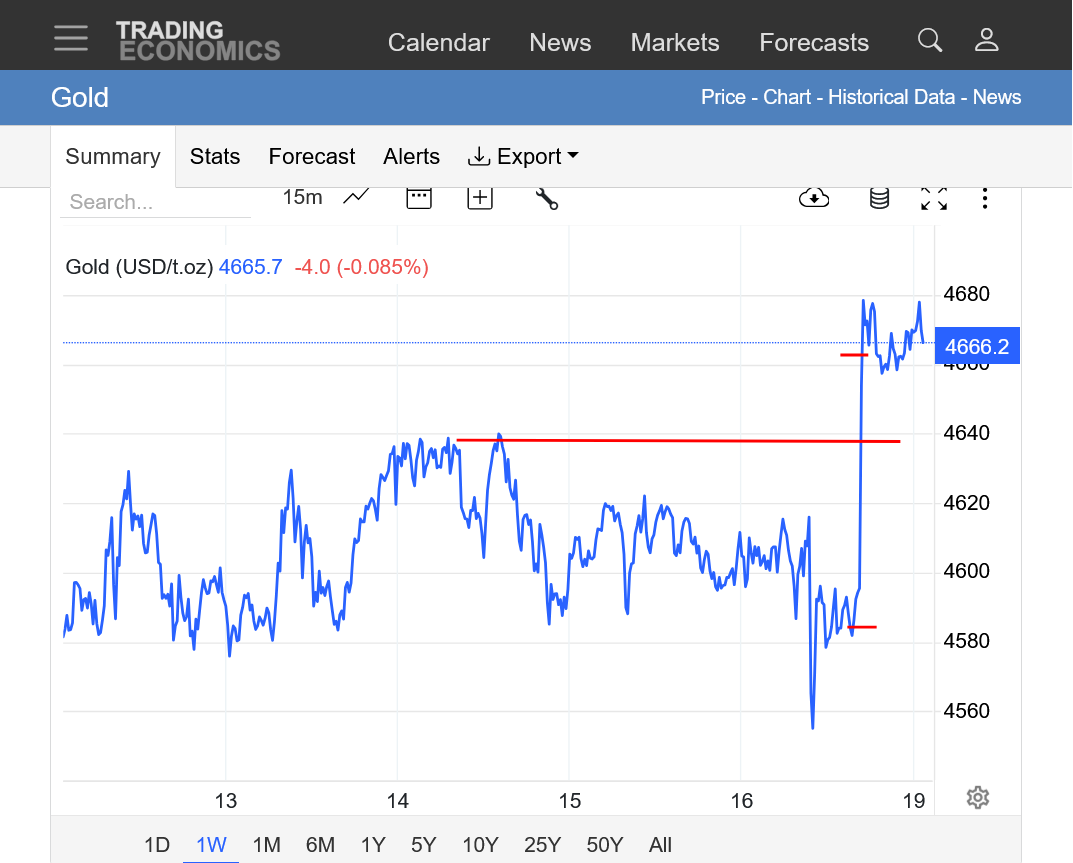
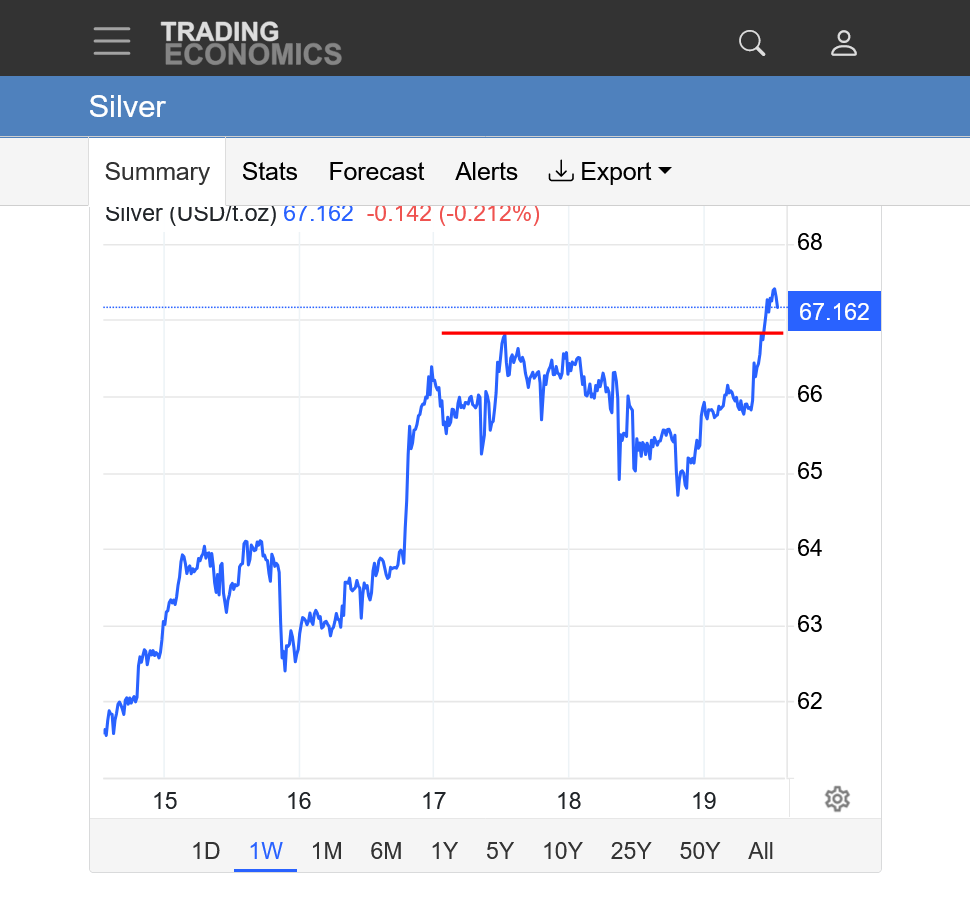
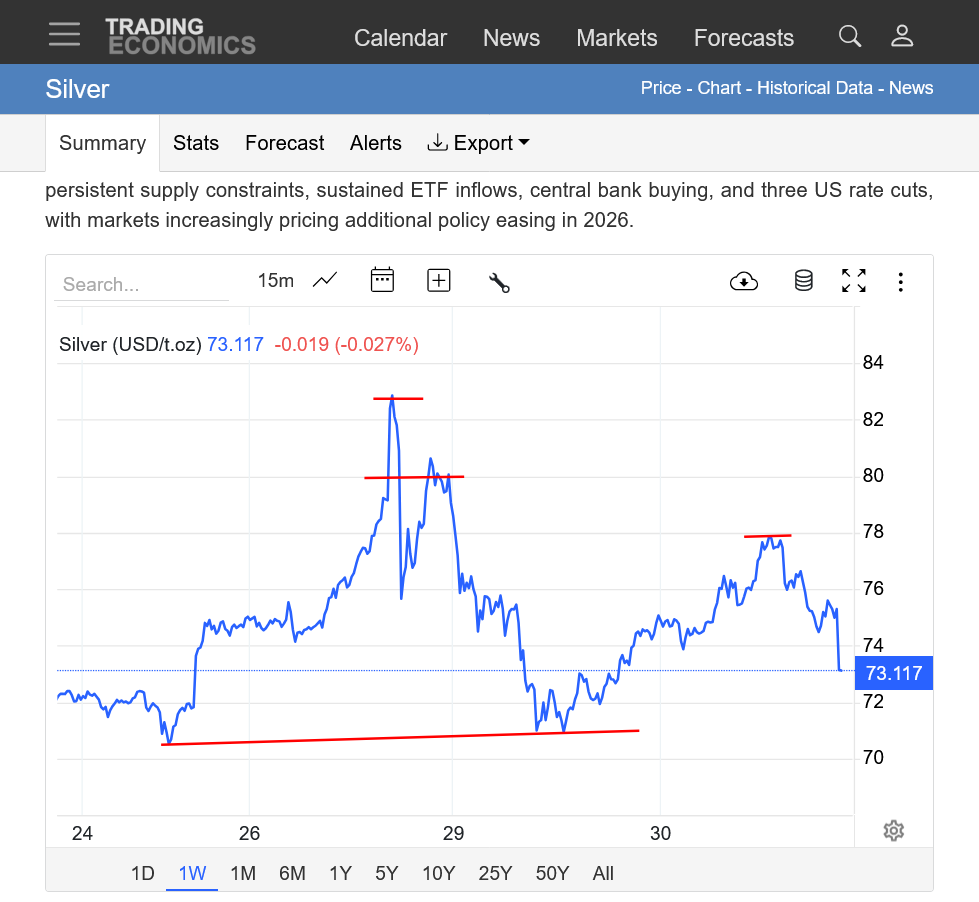
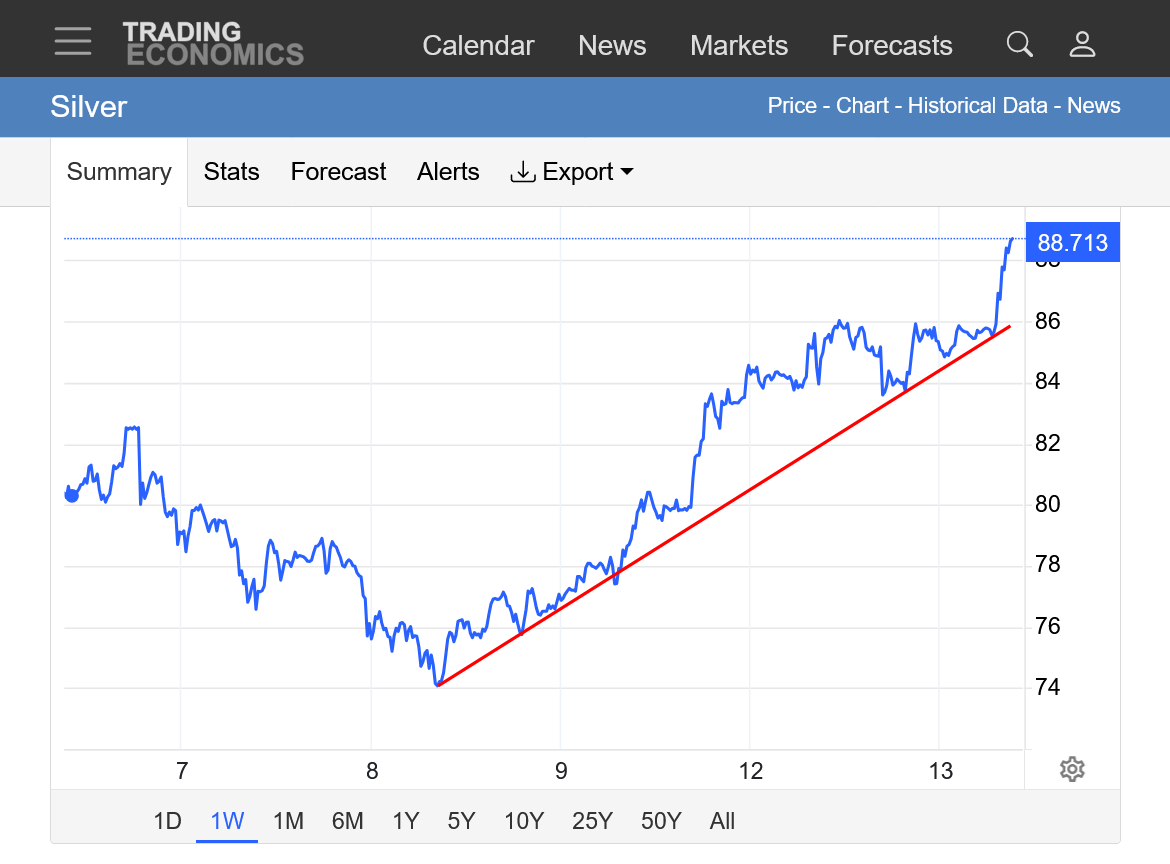
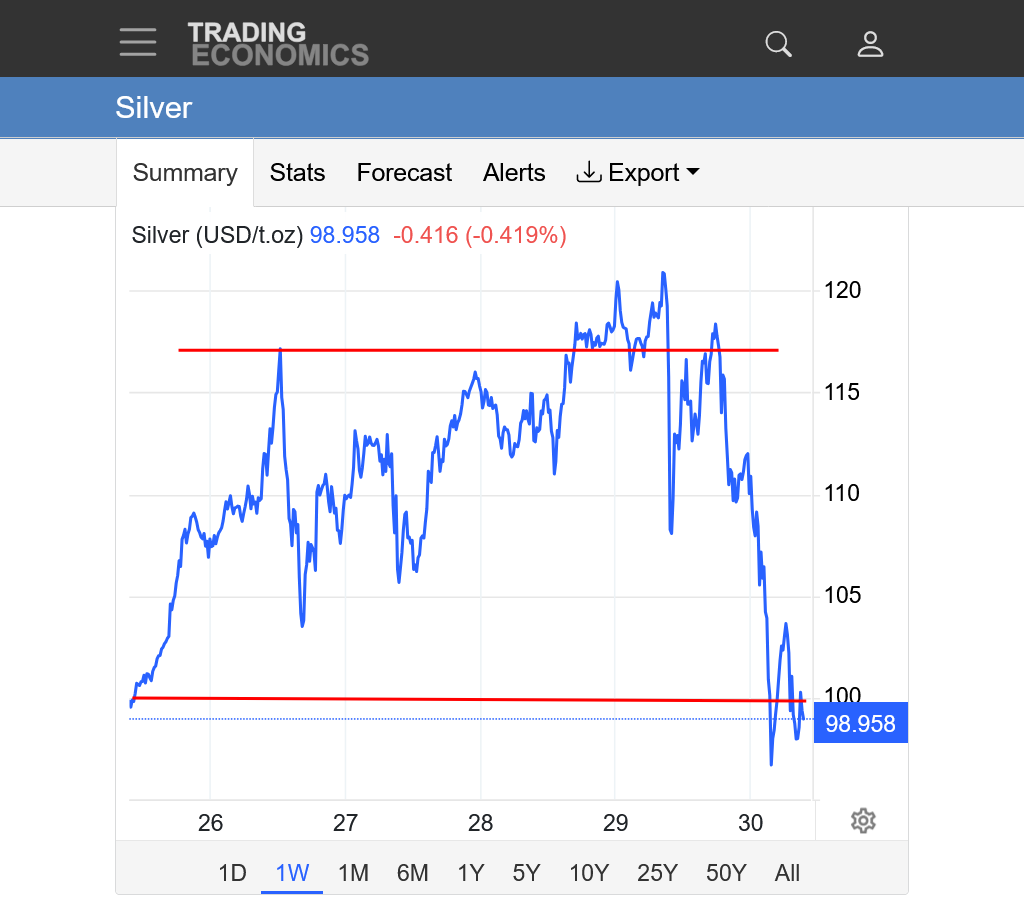
1. 1 week: Breaking above old highs
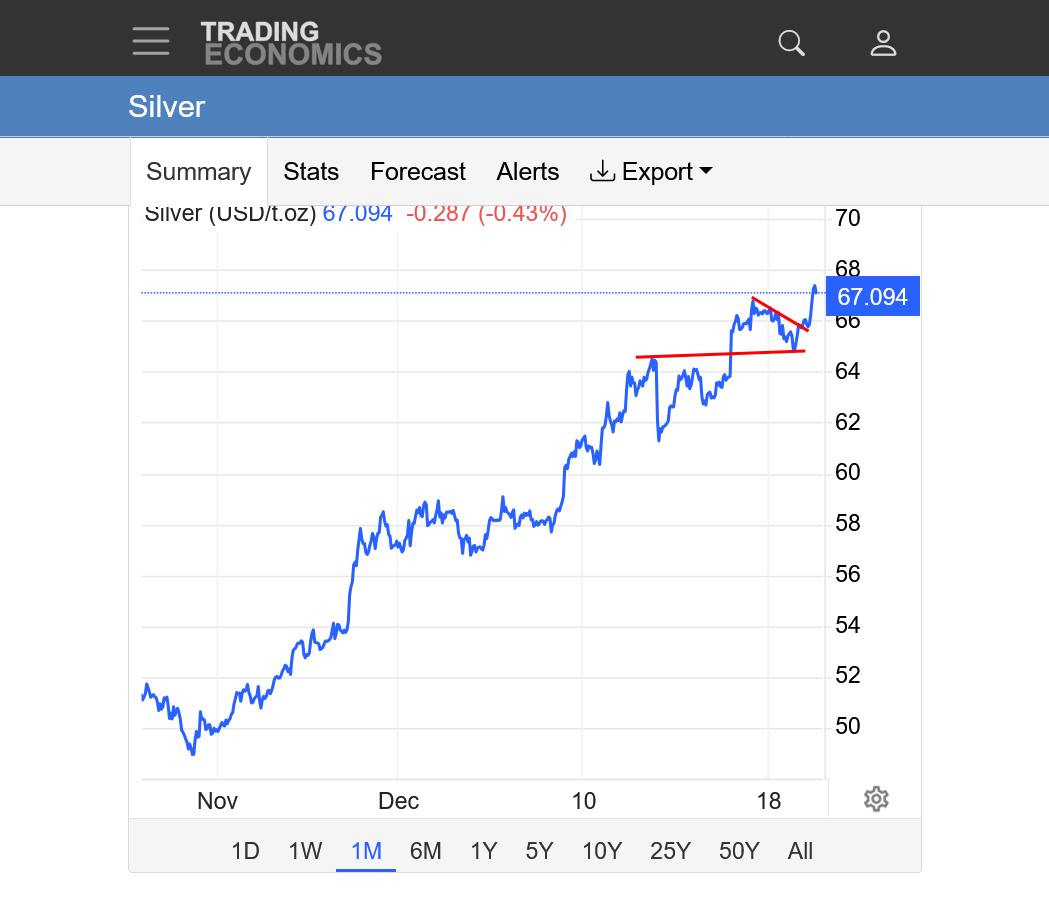
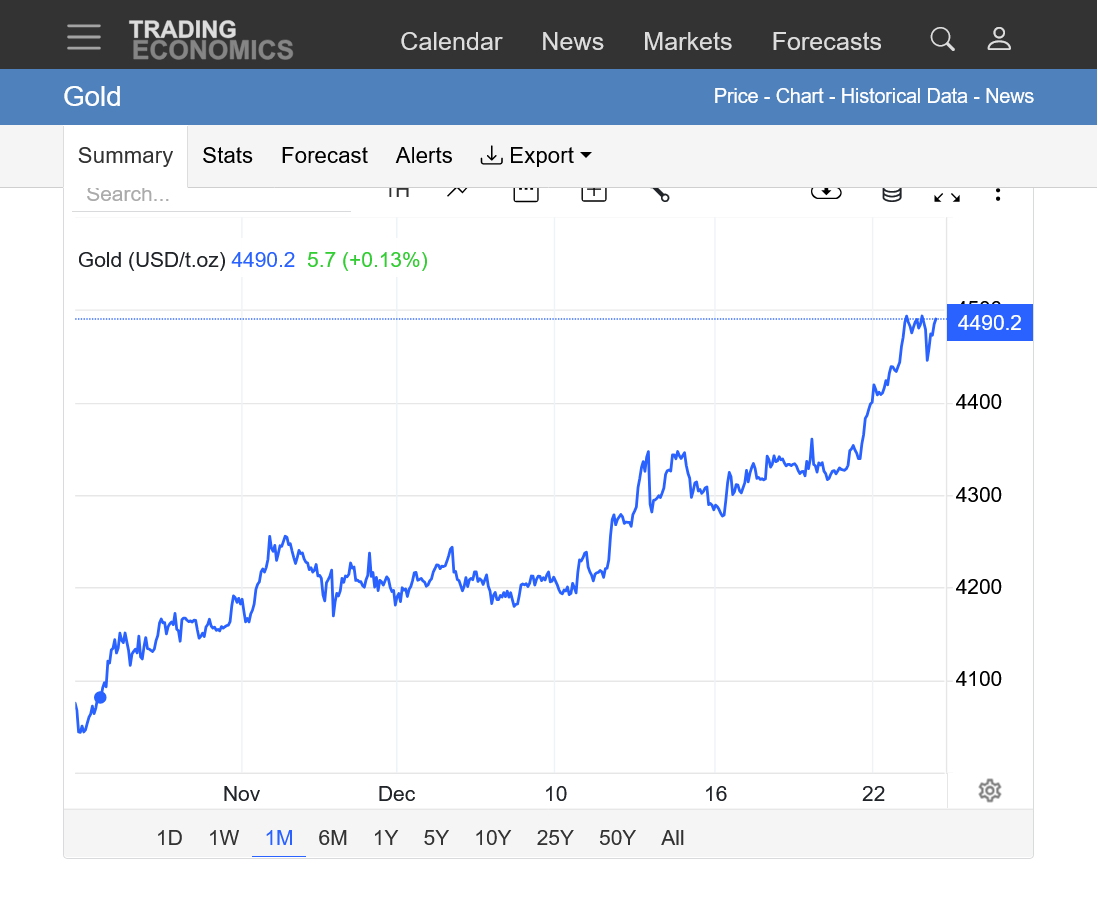
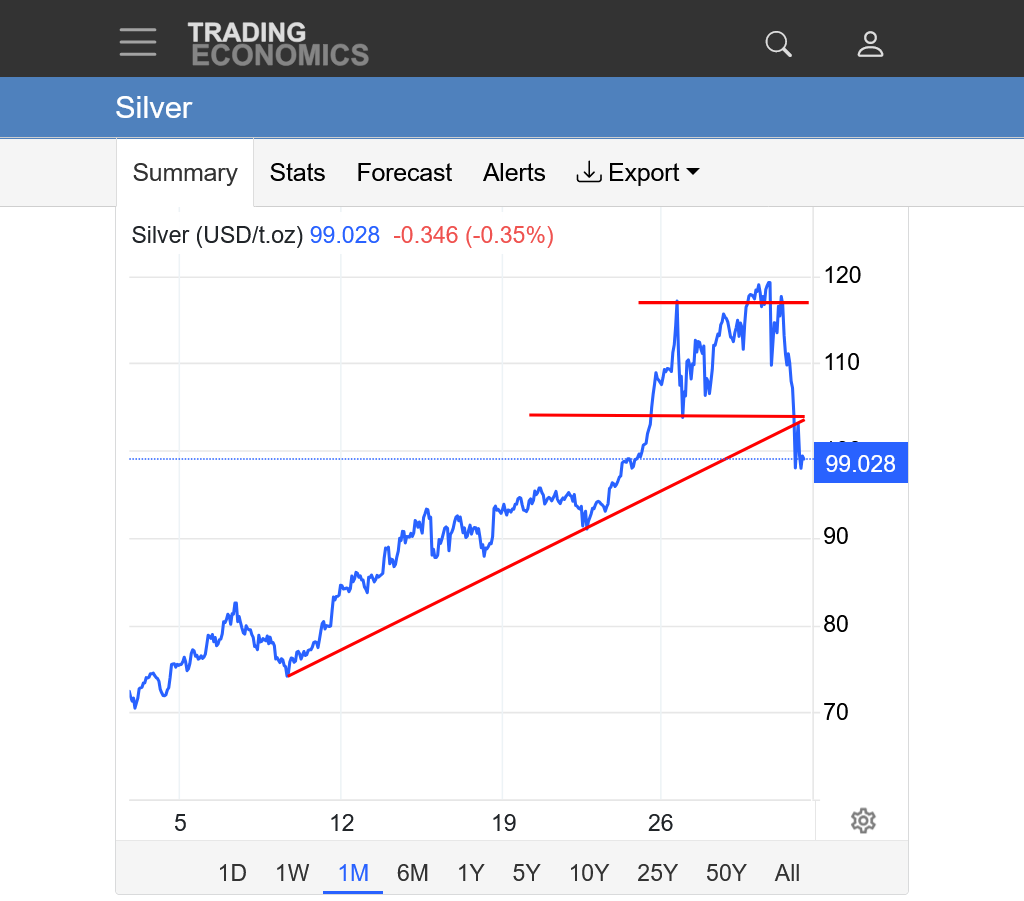
2. 1 month: Bull flag formation, upside break out.
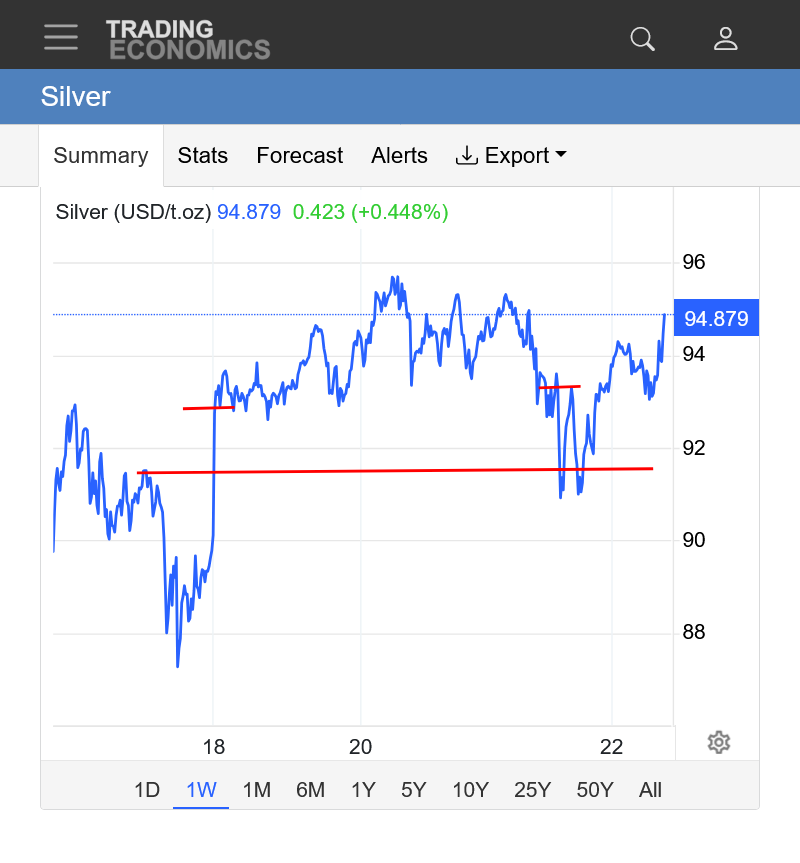
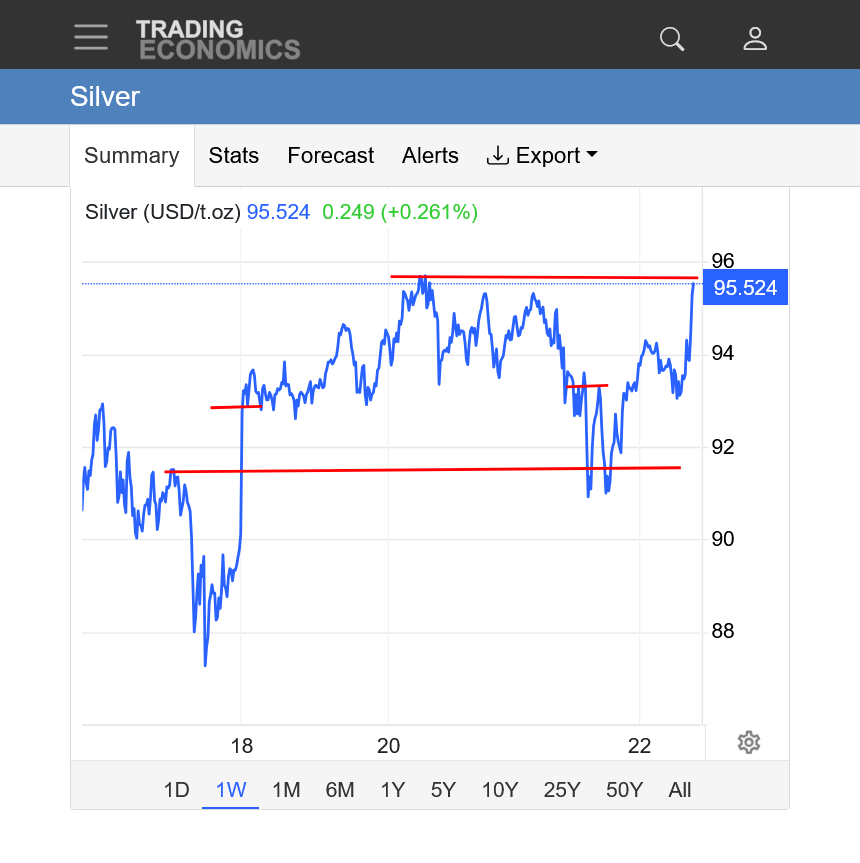
Silver continues to smash old highs. Initially the follower of gold but this year the clear leader!
https://tradingeconomics.com/commodity/silver
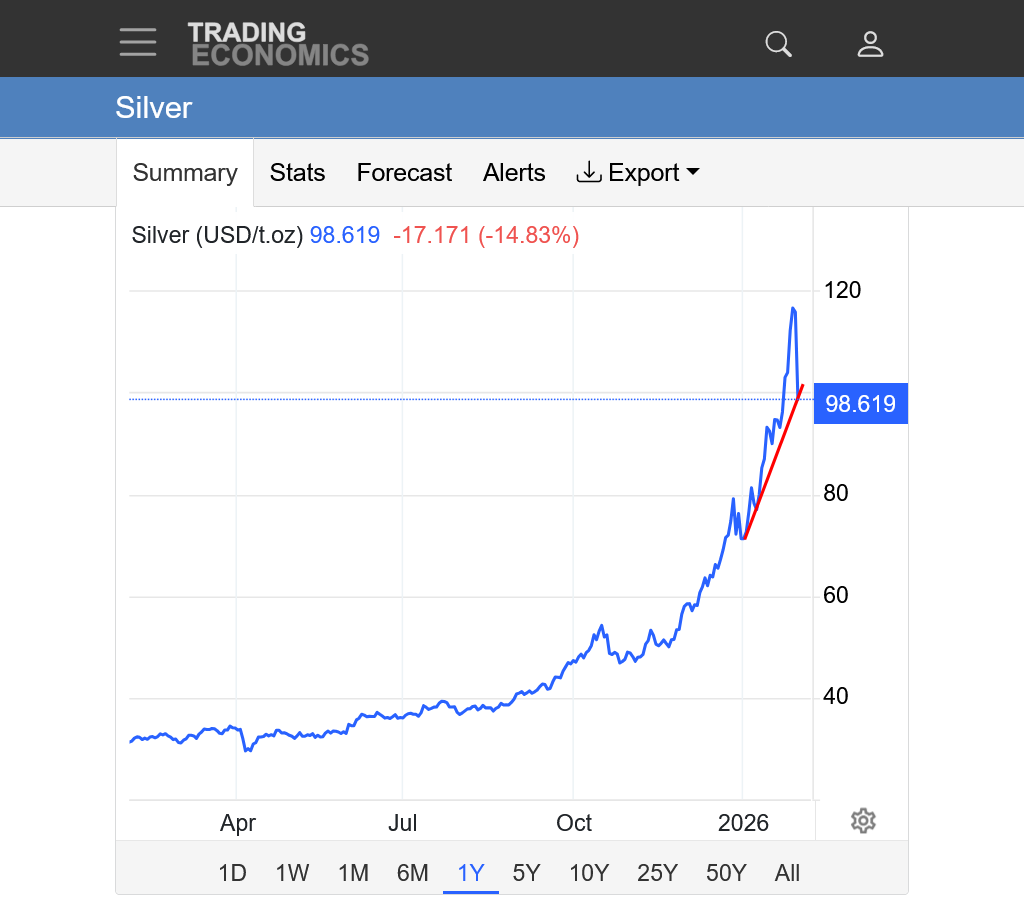
1 year: More than doubling price
1. year: New all time highs; Exponential/parabolic move up. Steeper and steeper slope.
++++++++++++++++++++++++++++++++++++
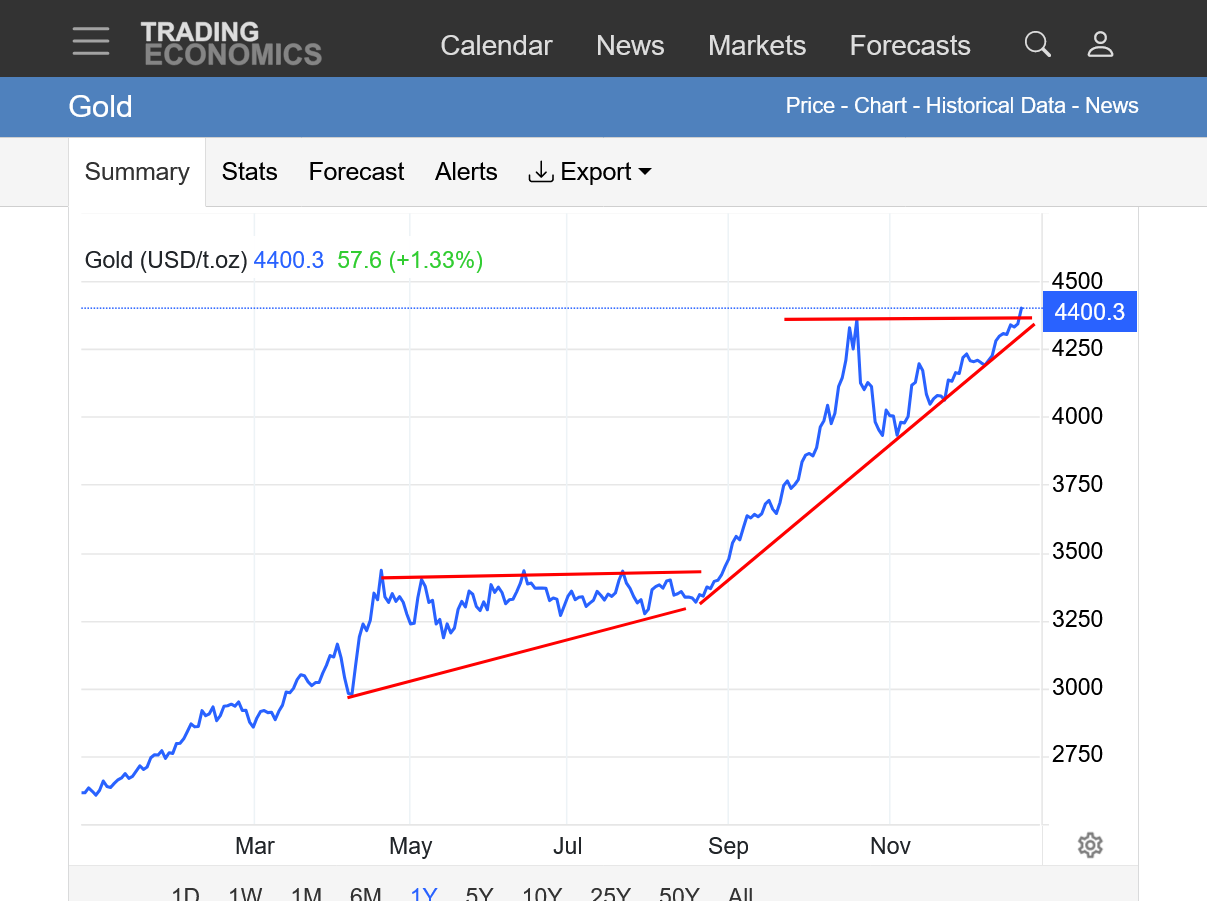
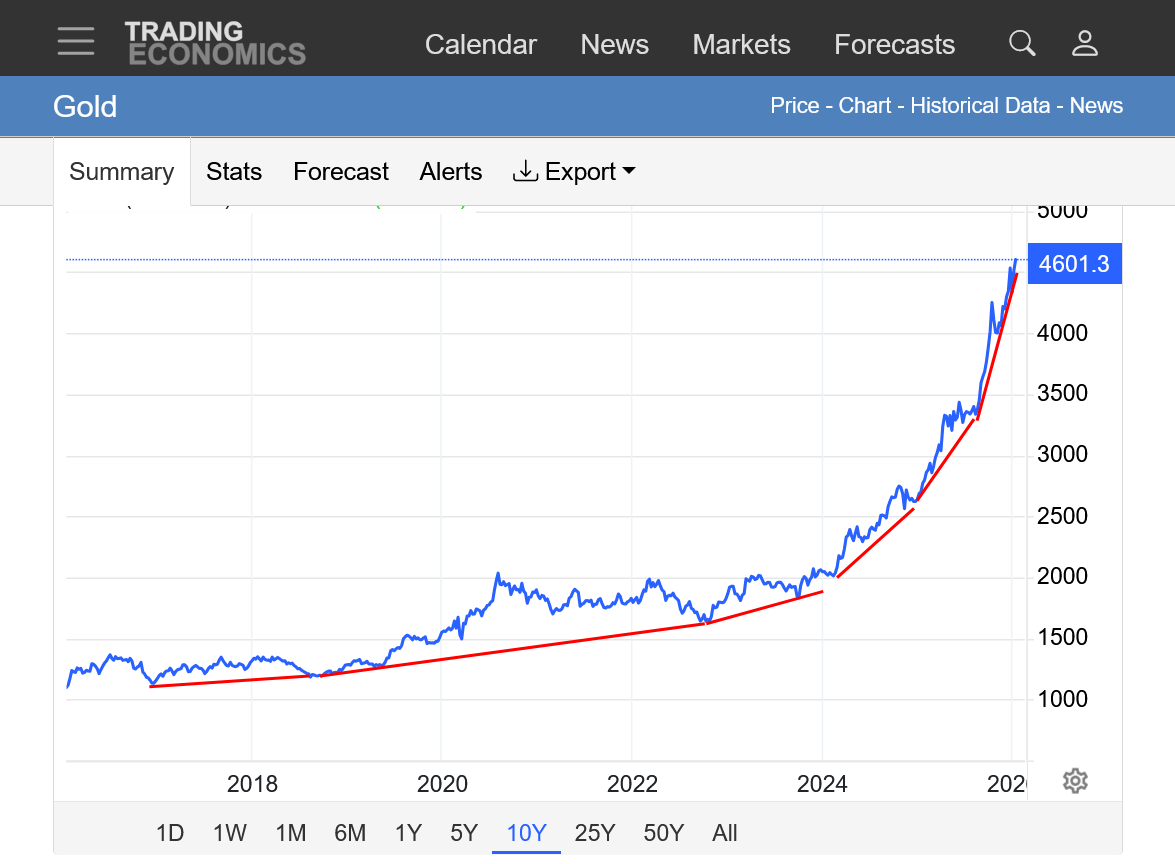
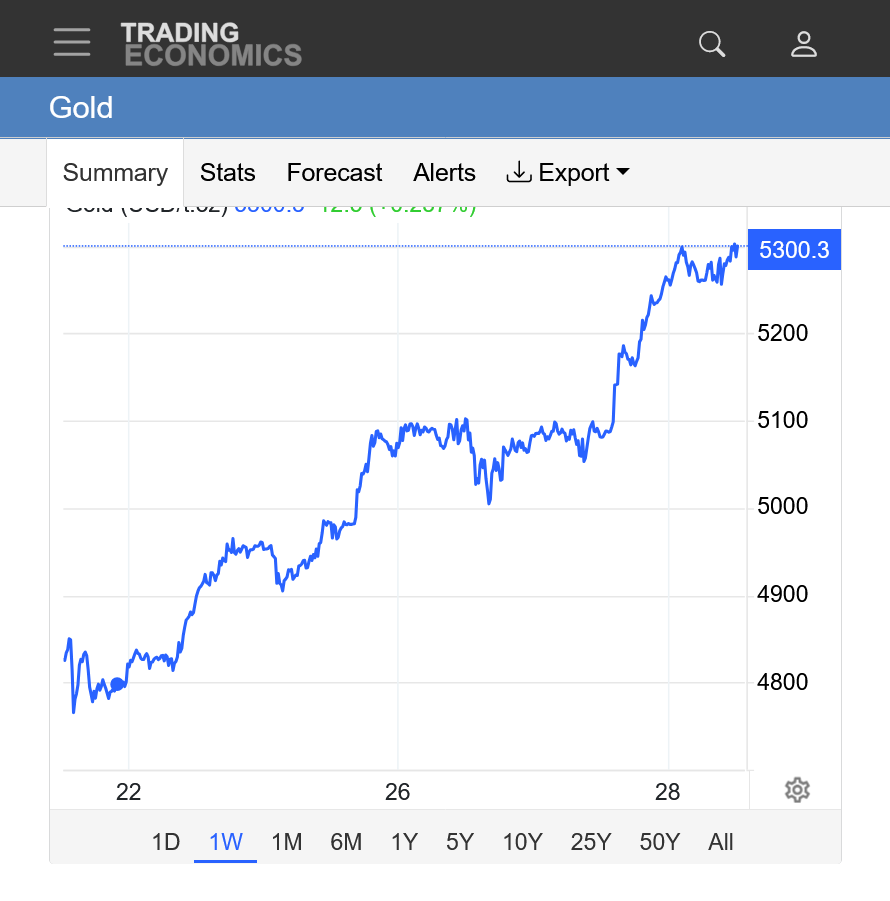
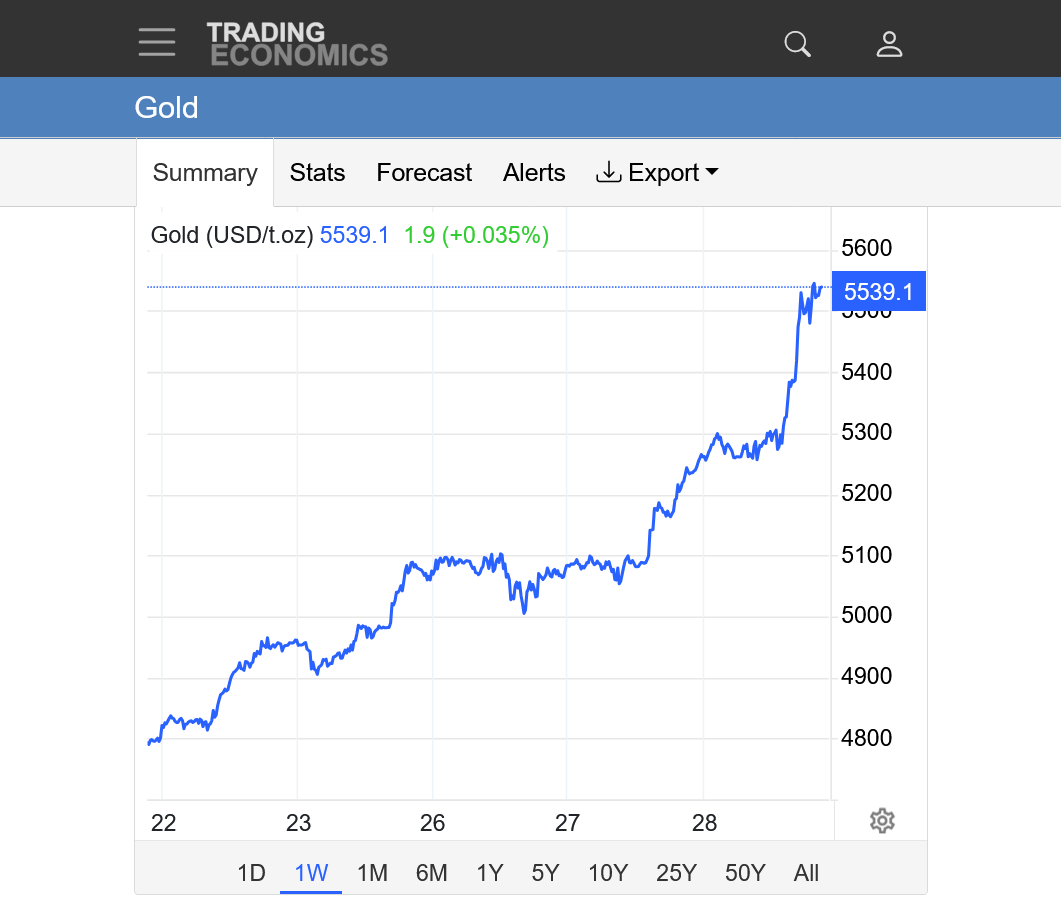
Gold is also breaking out to all time highs. Still the follower and silver the leader.b
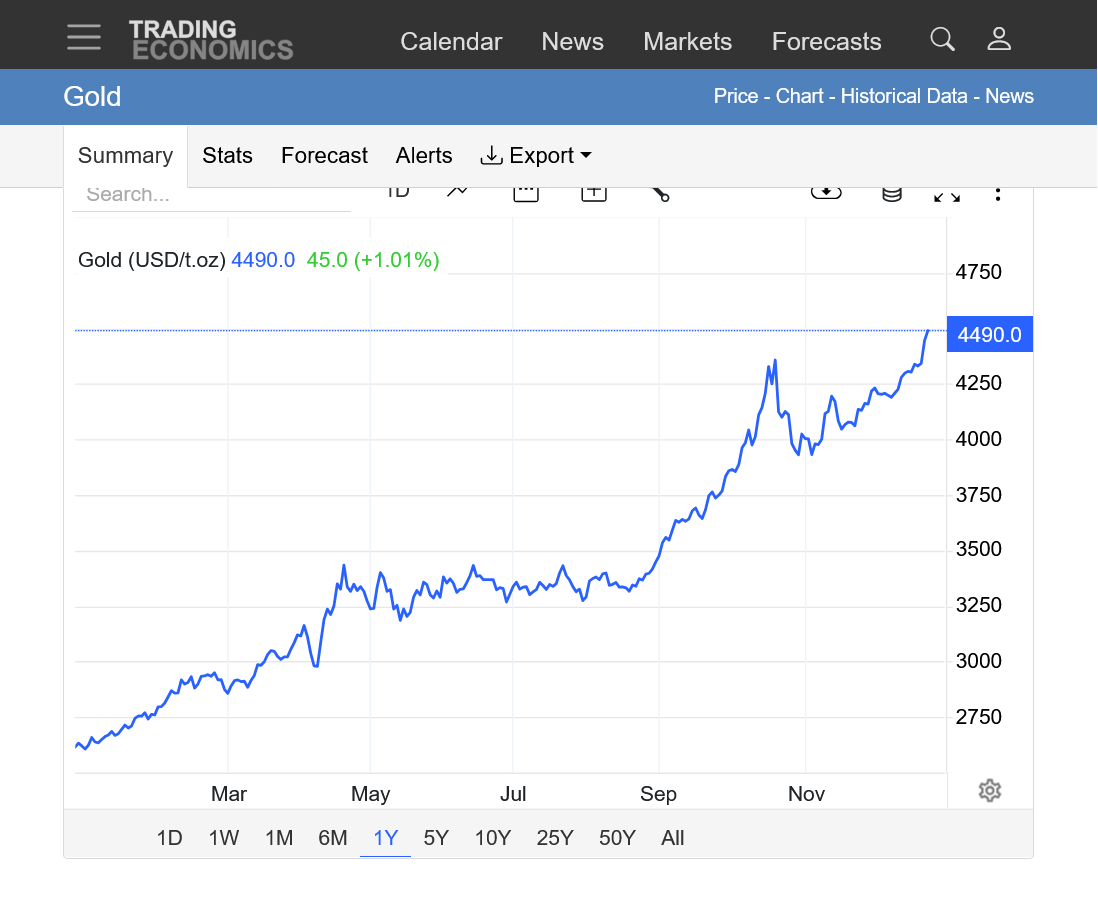
1 year: Breaking out from another ascending triangle!
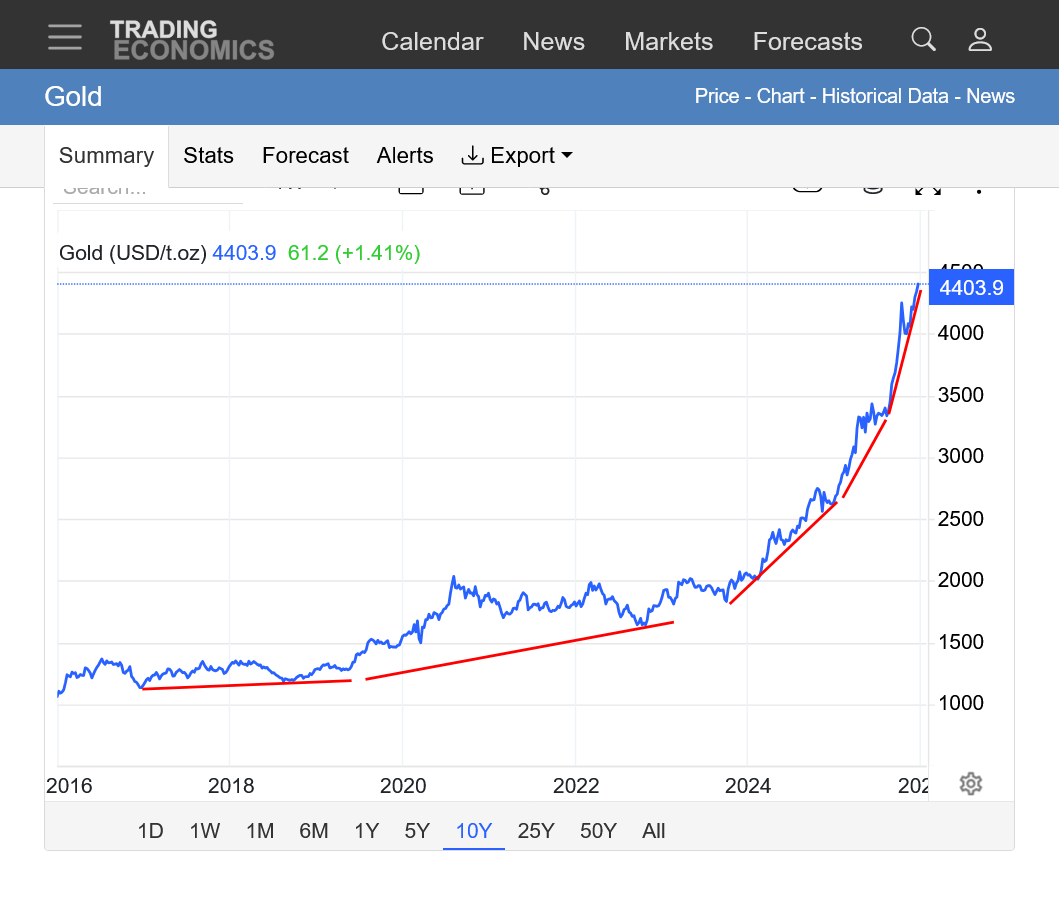
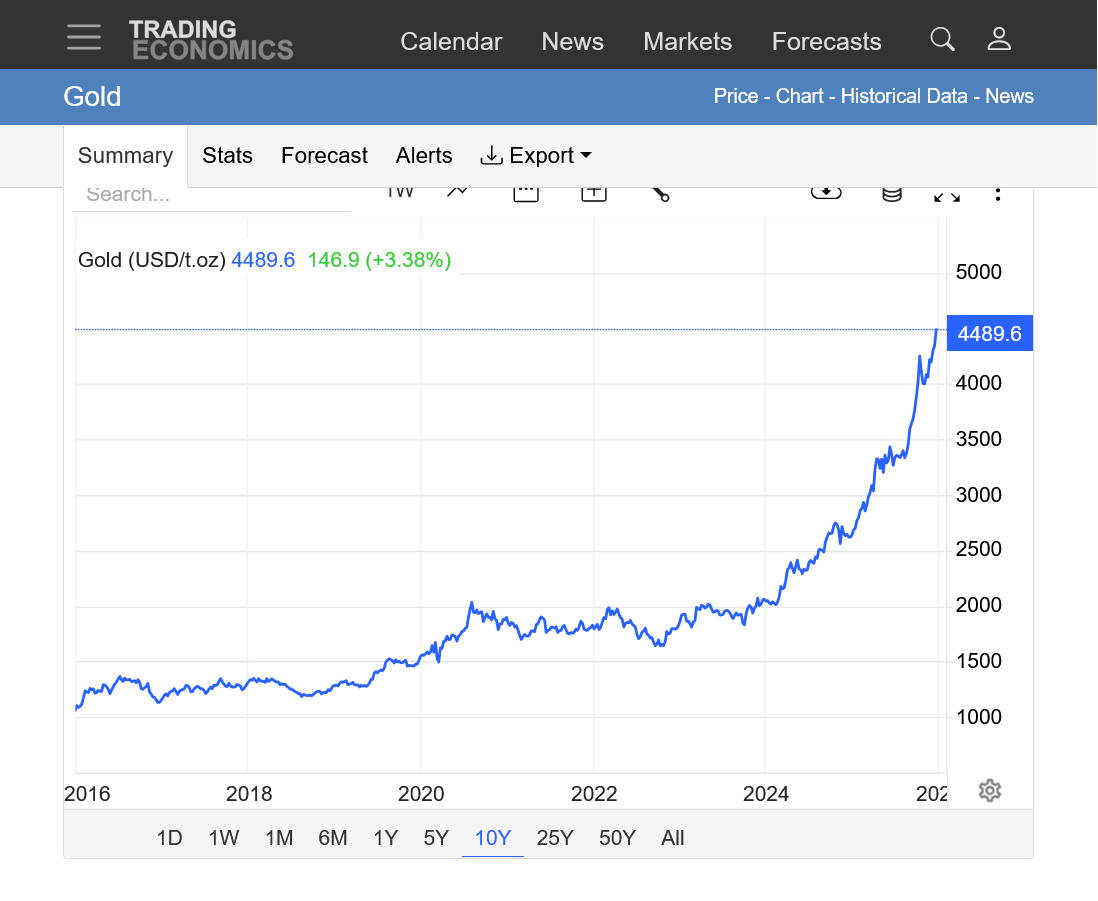
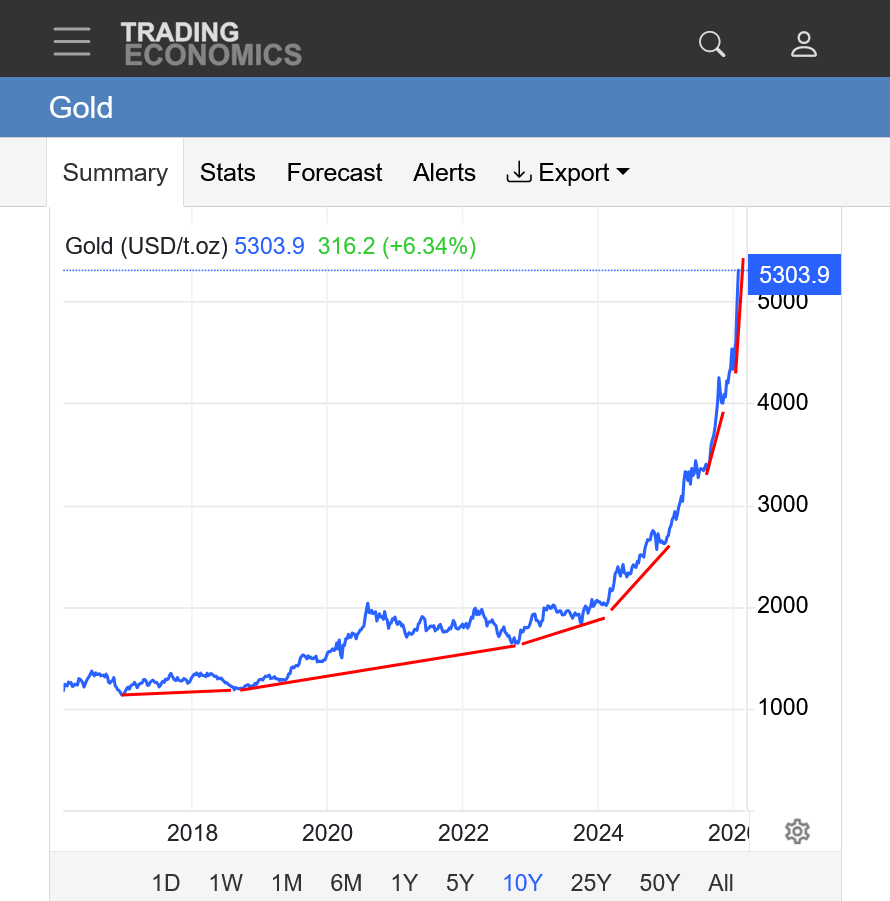
2. 10 year: Parabolic/exponential move up. Steeper and steeper slope. Initially leading silver but now the follower
https://tradingeconomics.com/commodity/gold
More of the same unprecedented moves!
When was the last time this happened?
NEVER! (although 1980 was similar)
See previous analysis above that's still valid with these updated price charts.
https://tradingeconomics.com/commodity/silver
SILVER
1. 1 week
2. 1 month
3. 1 year
4. 10 years
https://tradingeconomics.com/commodity/gold
GOLD
1. 1 week
2. 1 month
3. 1 Year
4. 10 years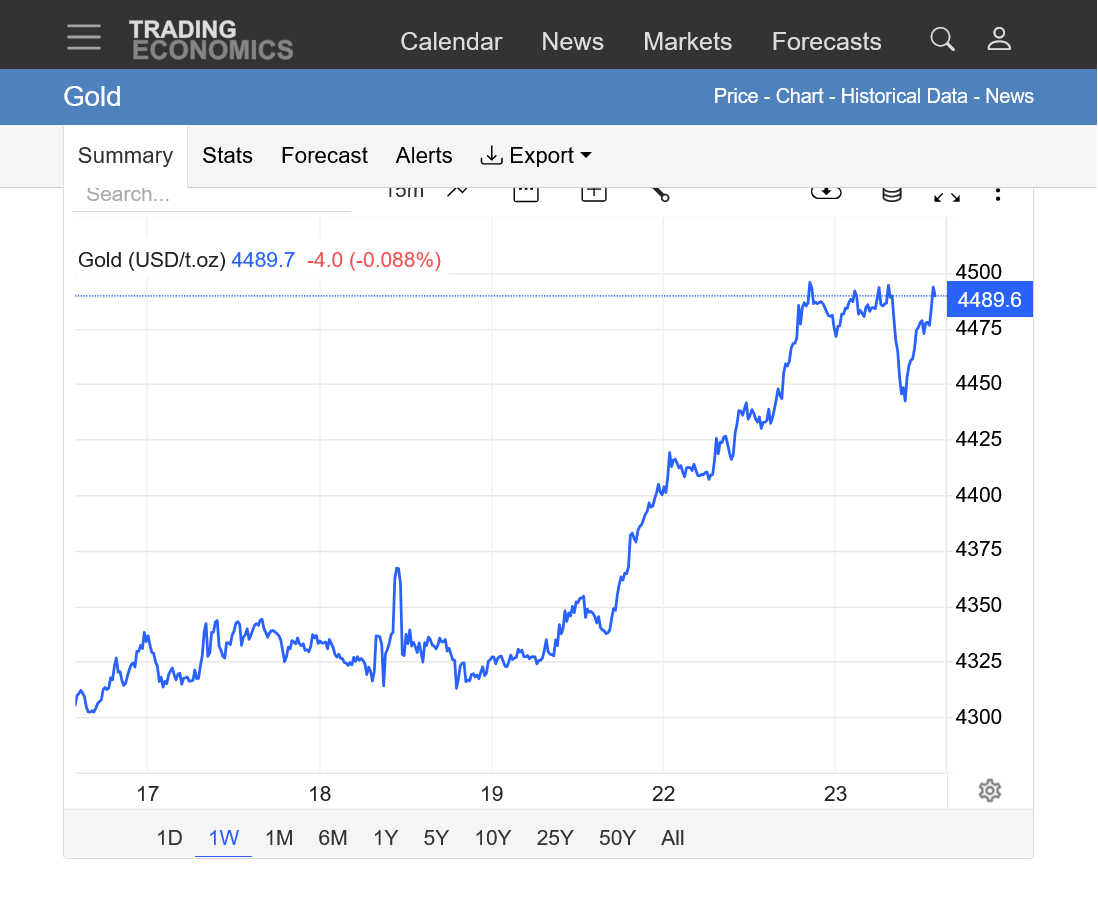
Up up and away!
Why couldn't I buy 2 calls 7 days ago, got drunk, stay drunk, and wake up tomorrow!!!
Thanks very much, tjc!
Just to elaborate on what was meant for readers here:
Re: Re: Re: SILVER and Gold Update November 28, 2025
By tjc - Dec. 18, 2025, 9:09 p.m.
IMHO---time to buy PUT all 4 metals
Bought PLT put 2pm
Wow!!!
https://tradingeconomics.com/commodity/silver
1. 1 month
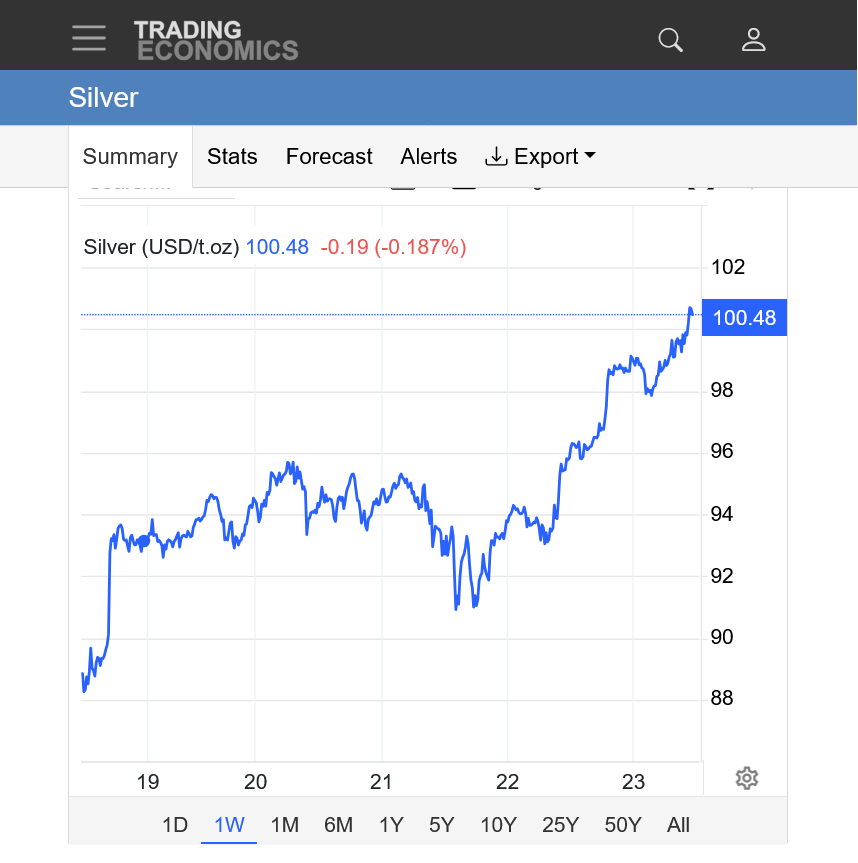
2. 10 years: You rarely see a price chart like this. True exponential/parabolic move with rapidly steepening slope. This is not a look back at a very rare move higher. Its one that is happening right now in real time.
March silver has already traded 38,000+ contracts at 11:30 pm!
Silver today closed at 79.675 +7.990 compared to Wednesday's close.
In the 1990's before the internet made this easily available, I HAND plotted PRICE CHARTS and analyzed 20+ markets every day after the close using a pencil and ruler and building on the paper/hard copies of a weekly chart service that came special delivery on Mondays.
It was tedious but still fun for a person that loves analyzing data. Most importantly, it gave this data plotter a unique understanding of chart patterns for markets that is sometimes missed when a computer does all the work.
Since the internet hit, we can get 1,000 times more data, already analyzed and updated to the latest price tick all day long. MUCH better than 30 years ago but its still good to do our own analysis sometimes.
Anyways, the entire point of that blurb is to make clear, how profound the current silver market was TODAY on December 26, 2025.
In over 3 decades of doing analysis of commodities and drawing trend lines on commodity charts, certainly CLOSE TO 100,000 trend lines in my life. I have NEVER analyzed trend lines this extreme..........EVER!
For that matter, neither has anybody else!
Traders following the markets for decades already know this. So this is for our readers that might NOT appreciate what is happening right now in the silver market. It's unprecedented, except for the spike higher in 1979/1980(when the Hunt brothers tried to corner the Silver market-story below) which in today's money was greater but the fundamentals were much, MUCH different.
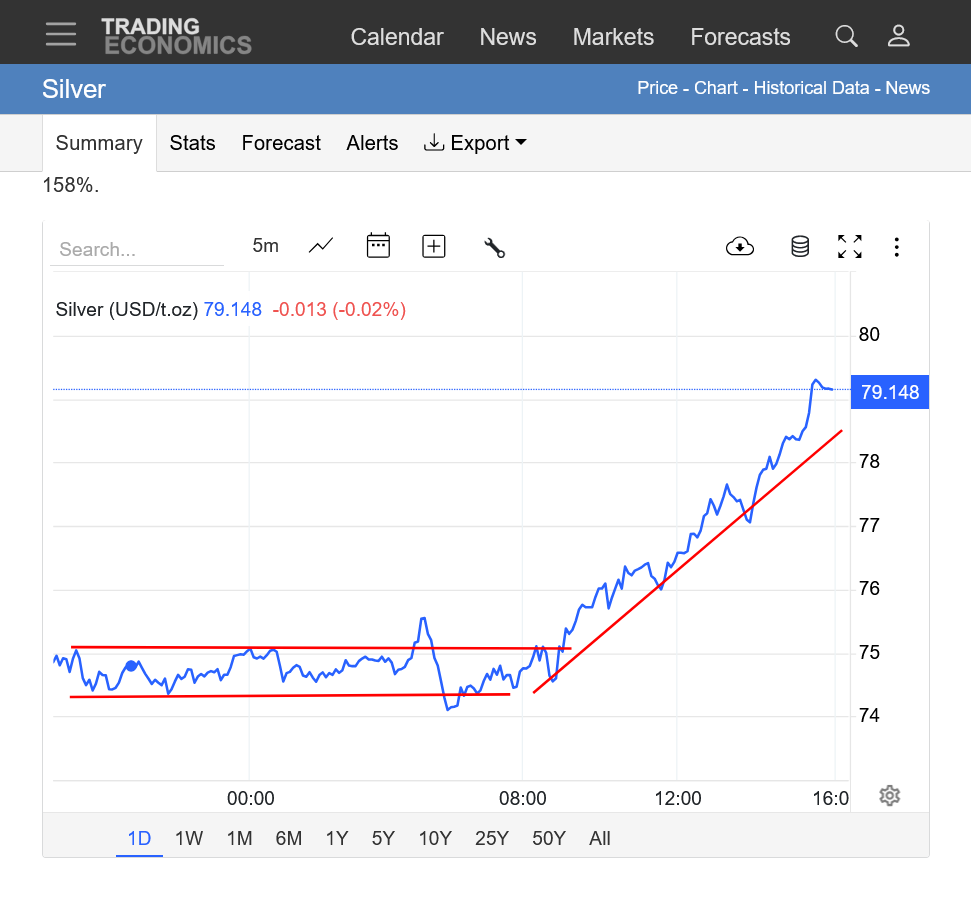
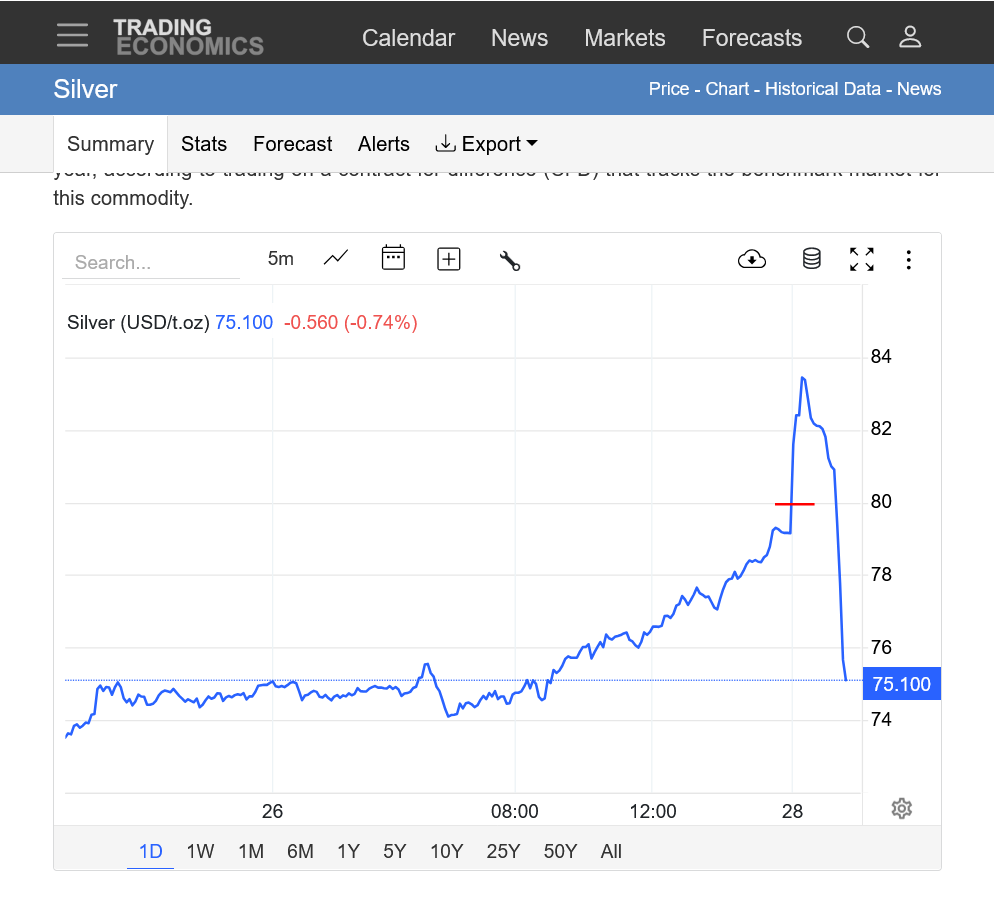
https://tradingeconomics.com/commodity/silver
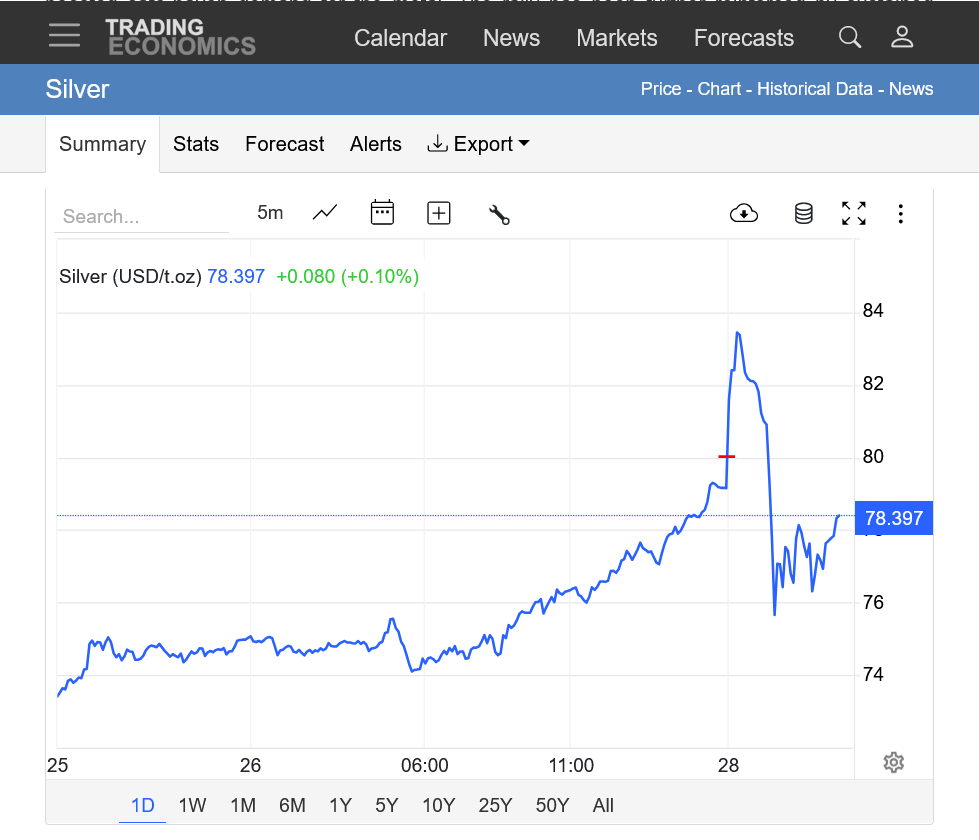
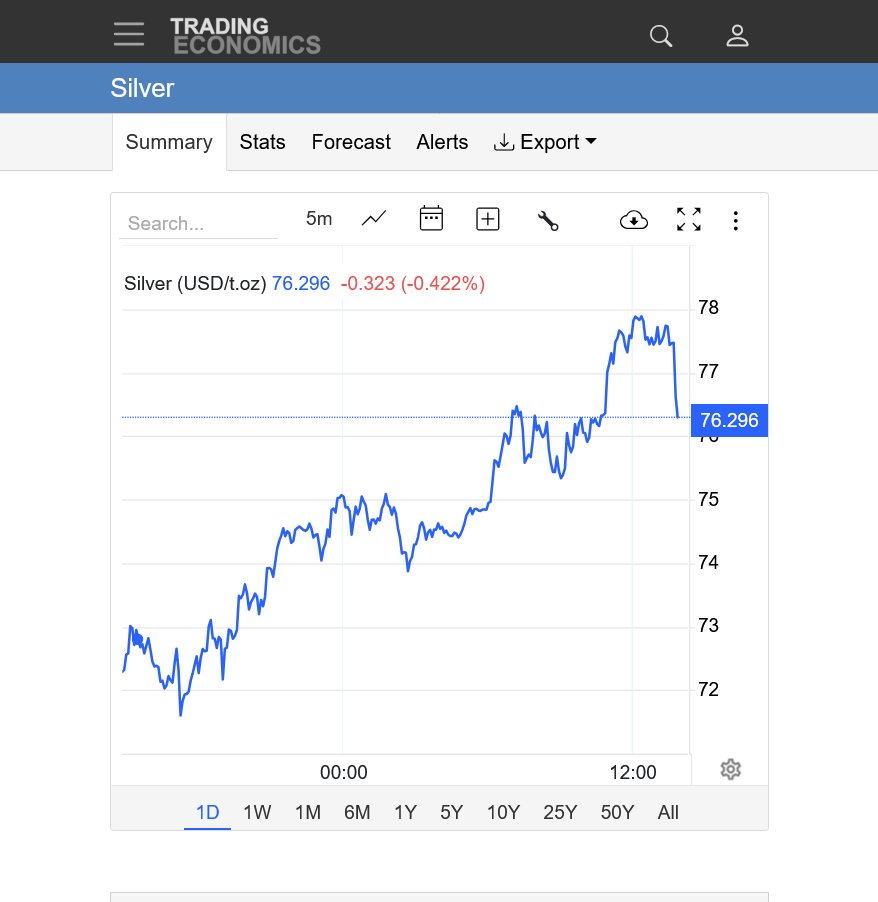
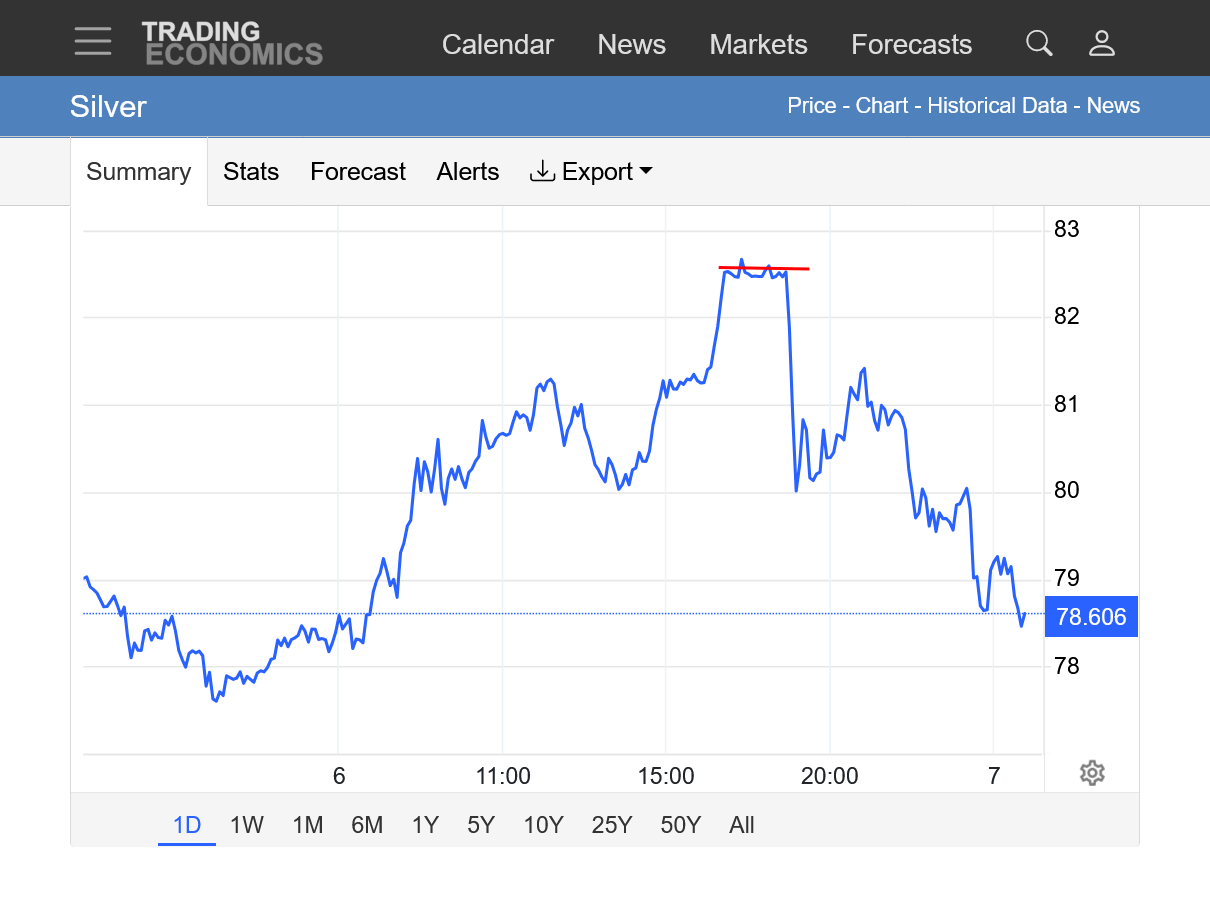
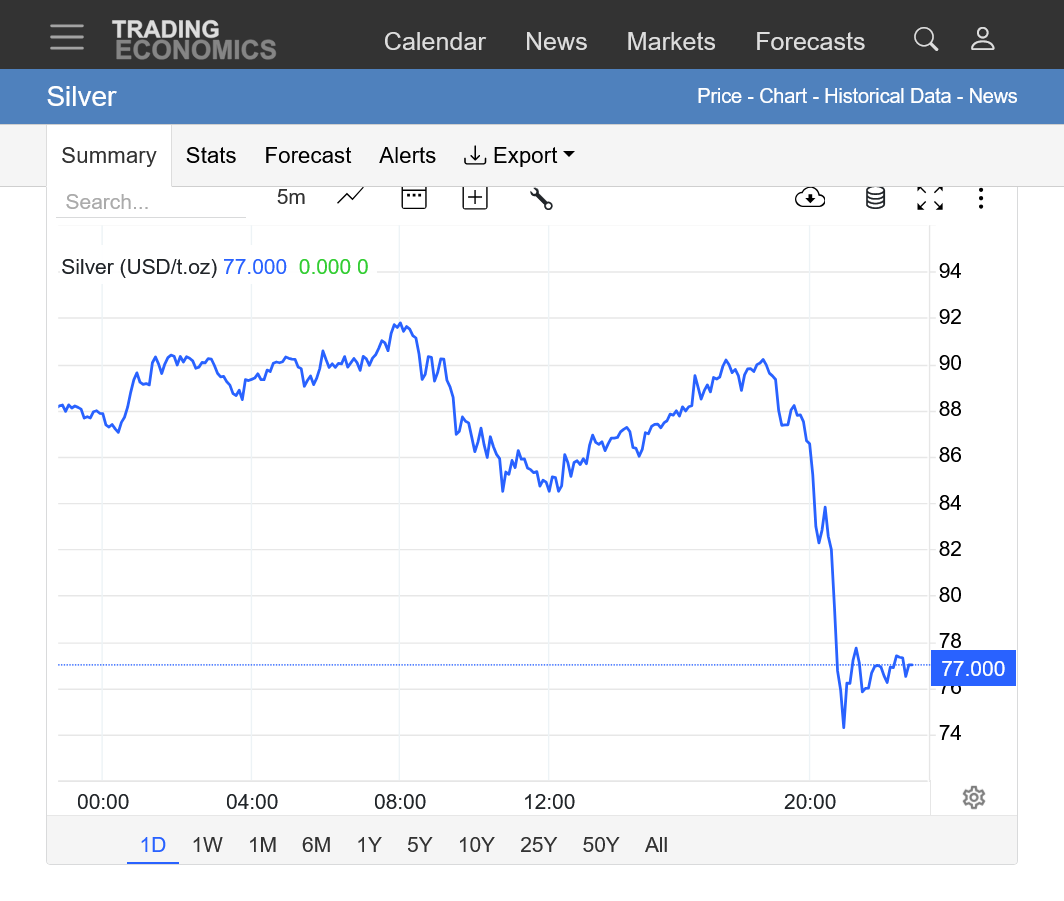
1. 1 day: After sideways trading over night(following a gap higher open Christmas). Silver broke out (again) to the upside just after 8am. The move up was actually very sustained and amazingly steady with the same upslope trend and very few deviations. The gains today, in just a few hours were greater than the entire bullish move higher for entire years in the past!
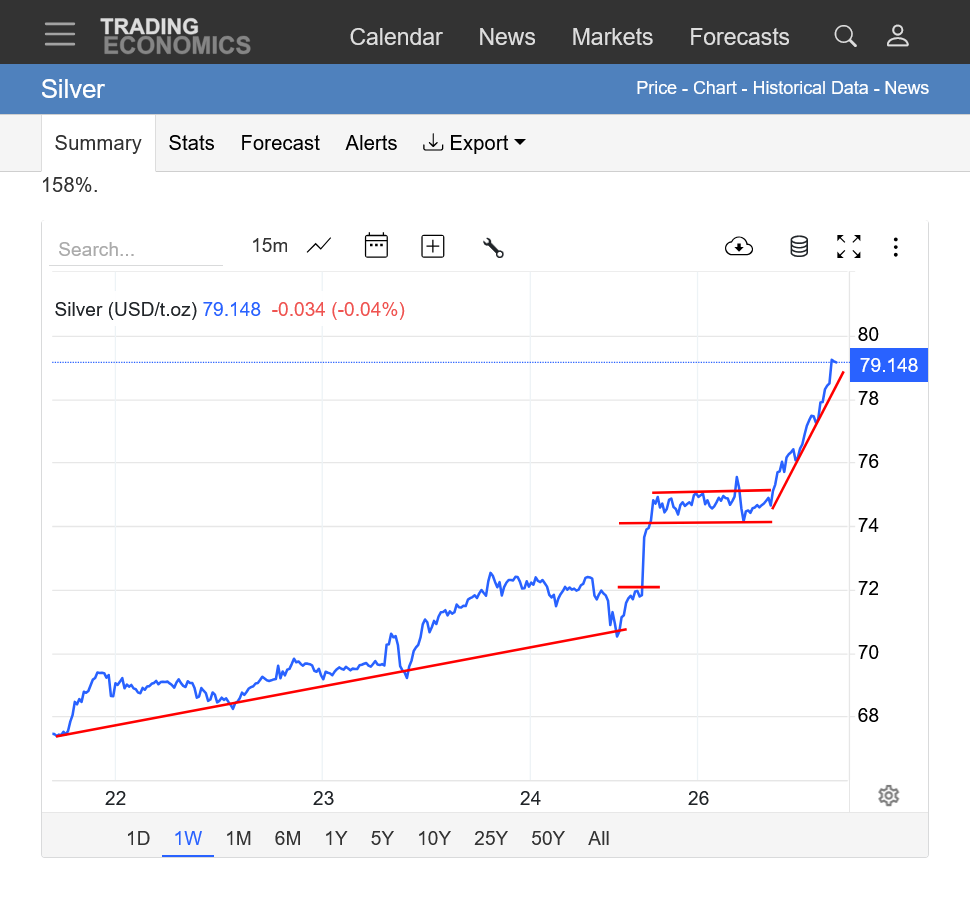
2. 1 week: Steady move up Mon-Wed. Gap higher Christmas Day open. Sideways over night, then the STEEPEST move yet today, Friday.
3. 1 month: Steepening upslope. Silver up 50% in just a month.
4. 1 year: Steepening upslope. Silver price more than doubling in 2025!
5. 10 years: Quintessential example of an exponential, parabolic move up with the trend getting steeper, steeper and steeper. The trend line recently on this time frame appears like a straight up vertical line.
1979/1980 Silver spike:
Re: Re: AUTO-REGRESSIVE APPLICATION TO THIS SILVER CHART
By fayq - Dec. 26, 2025, 11:09 p.m.
https://www.marketforum.com/forum/topic/116684/#116803
+++++++++++++==
Thanks, fayq!
You made the same entire post in 2 threads, so I deleted the one here and replaced it with the link to original one.
This is a profound post/ideas and its much appreciated. However, you've expressed your thoughts as somebody that uses astrology to trade. I'm assuming that those are YOUR ideas and everybody's ideas are always very welcome here, whether I agree with them or not.
On this last post, as well as some other recent profound posts, including one that I elevated to post of the week, the author is NOT the same one that professes using astrology to trade. The disparity and contrast in expressing the views between these sources tells me that they are not the same one.
It's great if you want to show completely different views like that here, fayq. I try to maximize this myself. However, ethical journalism and posting compels the poster to include THE SOURCE or AUTHOR of the content when it isn't them.
There are several reasons that I follow that here.
1. Not doing so is a type of plagiarism because the reader assumes that the poster authored the post.
2. When the source is provided, it gives me an opportunity to fact check.
3. When the source is provided, it maximizes the learning opportunities for everyone because we all stand to gain more insight when we increase our sources.
4. I'm not going to police threads/posts since opinions are often based on reading others opinions. Just mentioning it because the form that you are posting here with is what comes out from a paid newsletter or professional source and NOT an individual giving their personal opinion, which might be the form of other posts(they are certainly not the same sources) . Please continue to post that way, it's great stuff but it's even more appreciated if you post the source(s) and its always best to be authentic!!!!
5. If I'm way off, just let me know and I'll accept that and everybody else can use the rules of authentic posting above as a guideline for posting sources if they want to be authentic.
In private discussions with the founder of this site, Alex who was a professional journalist for decades (when he was twisting my arm to take over) we both agreed strongly on this point and he said a couple of times that authentic was his favorite word that I used.
What everybody wants to know is where is silver headed now?
We had a significant gap higher on the Christmas Day open. The price action on the 26th was that of an upside break away gap higher, projecting even more gains.
The close on the highs on the 26th, suggests the potential for another gap higher open on Sunday, the 28th.
However, there is an alternative view. This price action could be a blow off top, similar to the one that natural gas had on December 5th.
Price action will determine that and one of the blow off top confirmation indicators would be filling an upside gap higher, especially at such significant, historical highs. Filling a gap higher would be a profound buying exhaustion (gap and crap) formation on the price charts.
We make a gap higher from aggressive, PANIC buyers overwhelming the sellers, then when those buyers are exhausted, suddenly there is nobody left to buy at the stratospheric prices and the price collapses lower to seek out fresh buying.........down below the bottom of the gap higher.
This leaves a major top in place at a price that no buyers will buy at.
https://www.tradingsim.com/day-trading/exhaustion-gap
This puts in an extremely bearish, gap and crap technical formation............in a condensed, extremely volatile short term time frame that is different that most gap and craps that occur from a buying exhaustion at the top of a long uptrend.(which marks the end of the bullish mentality).
++++++++++++++++
GapandCrap buying(selling) exhaustion formation
1 response |
Started by metmike - Aug. 30, 2019, 6:12 p.m.
https://www.marketforum.com/forum/topic/38044/
+++++++++++++++++++
This is not a prediction.........for all I know we could be headed to 100 in the next week. Just something to be looking for as an indicator that the panic buying has been exhausted.
The end of extreme parabolic/exponential moves like this are impossible to predict ahead of time!
IMPOSSIBLE!
However, we will know AFTER the top has happened because of the markets reaction to vehemently REJECT higher prices at that point AFTER they are rejected with some sort of reversal lower or gap and crap.
Even then, we might not know if that was a TEMPORARY, short term top or whether it was THE top.
The cure for high prices is............high prices. Eventually, the financial incentive to increase production/supply as well as to the stifling of demand will get the market's demand/supply back into equilibrium/balance.
How high does the price of sliver need to go to accomplish that? How long will it take? What other factors need to be resolved?
It begins in 1934, when the U.S. passed the Silver Purchase Act. Washington wanted to prop up domestic silver mining interests, strengthen the dollar, and pull silver away from Asia — especially China, which at the time was running one of the most important silver-based monetary systems in the world.
But the impact was severe:
American banks and the U.S. Treasury bought immense amounts of silver at inflated prices, pulling metal out of China at a speed never seen before. Silver drained from Chinese vaults and banks, collapsing liquidity. What followed was devastating:
By 1935, China had no choice but to execute a historic currency reform — leaving the silver standard and introducing a fiat-style currency decades before most nations. It changed China’s financial system forever.----ECHOS ---mirror mirror on the Wall ----- it took 90 years --- 1929 means 6 years backwardation and put this Forward --means 2032 ish can be Major cycles !!
Thanks, fayq!
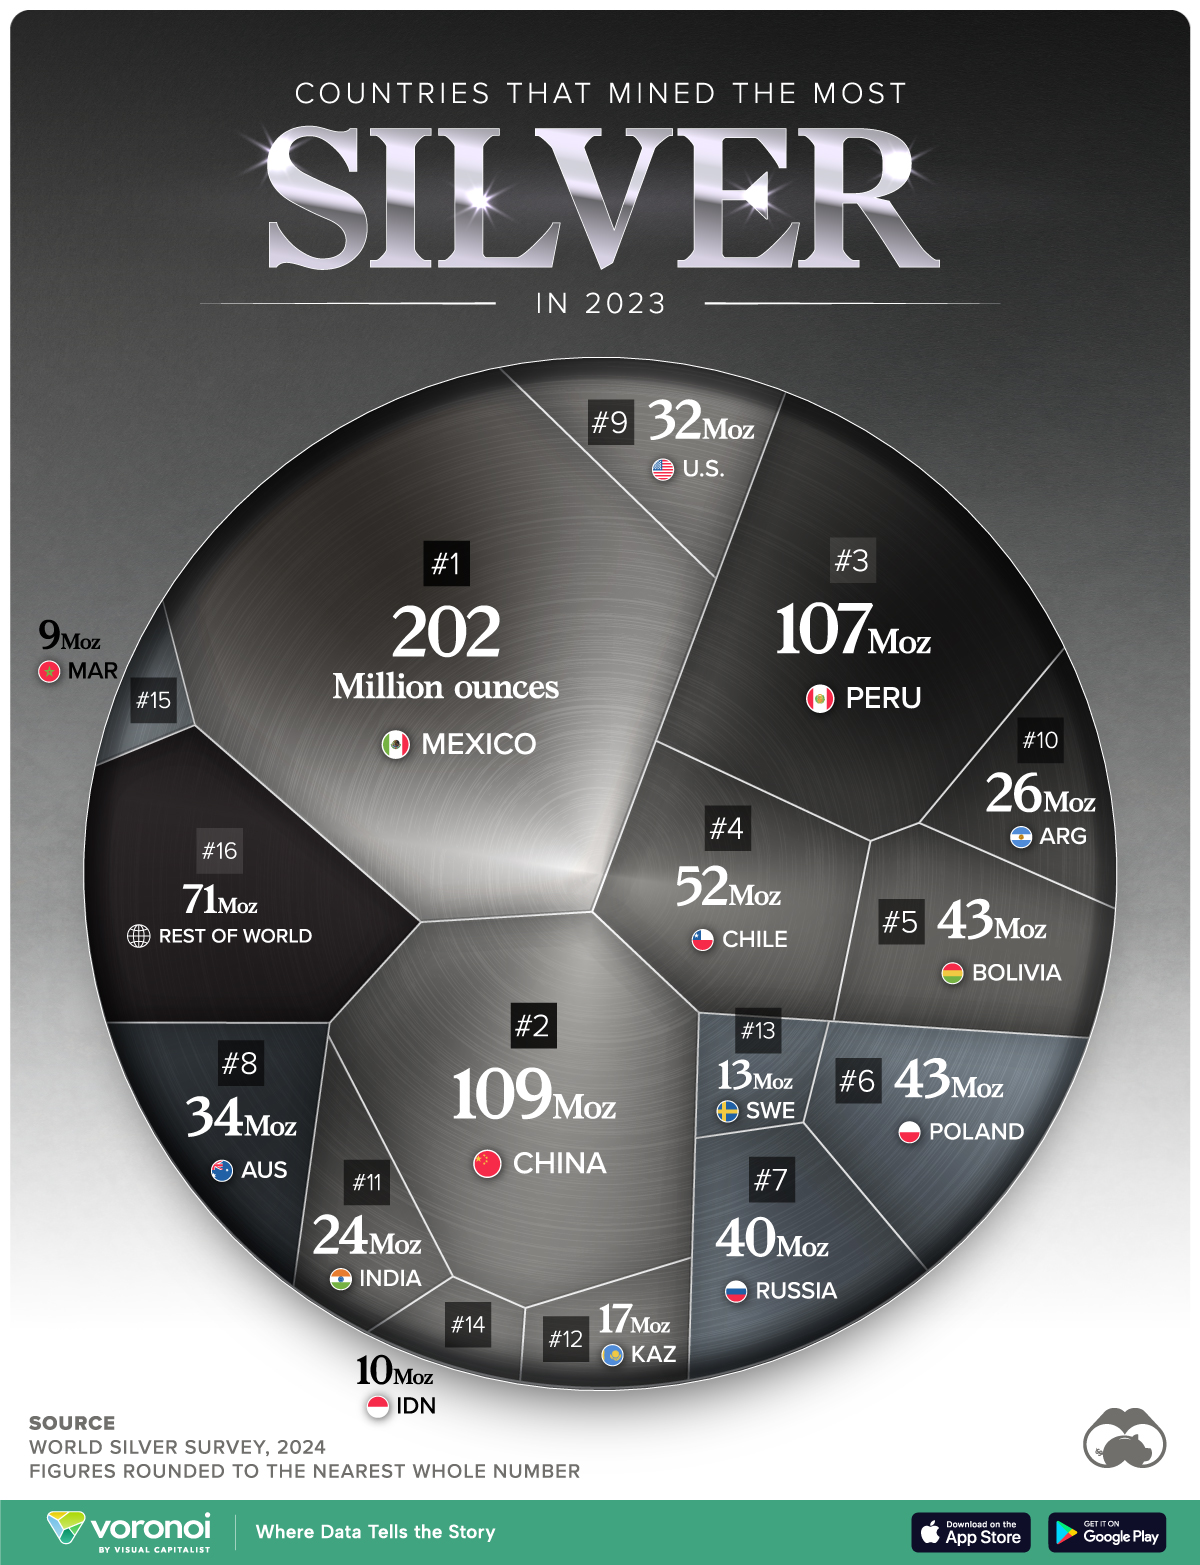
https://www.visualcapitalist.com/dp/si01-ranked-largest-silver-producing-countries/
+++++++++++++++
Excellent, comprehensive report! I won't copy the awesome graphs since this thread is filling up fast with posts.
https://silverinstitute.org/wp-content/uploads/2025/04/World_Silver_Survey-2025.pdf
The unprecedented gold chart is also insane but for the past year+ SILVER has been STRONGLY leading after years of the other way around.
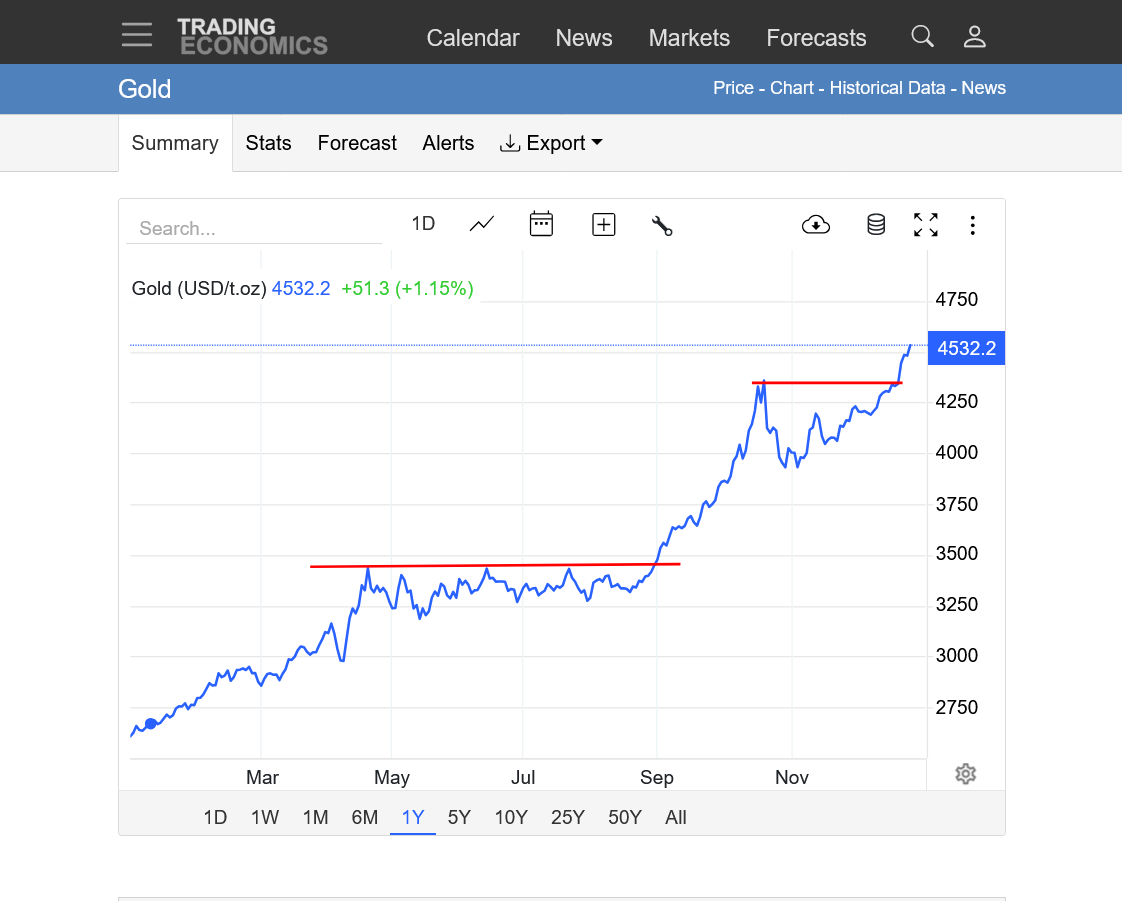
https://tradingeconomics.com/commodity/gold
1. 1 year: Bull flags(continuation patterns) with upside break outs.
2. 10 years. Parabolic/exponential, historical move up with a steeper and steeper and steeper uptrend. It's not sustainable forever but the top is impossible to predict.....and only known AFTERwards. Seems almost impossible that the slope up for silver this year is so much greater than this.
3. Exact same chart FOR SILVER!
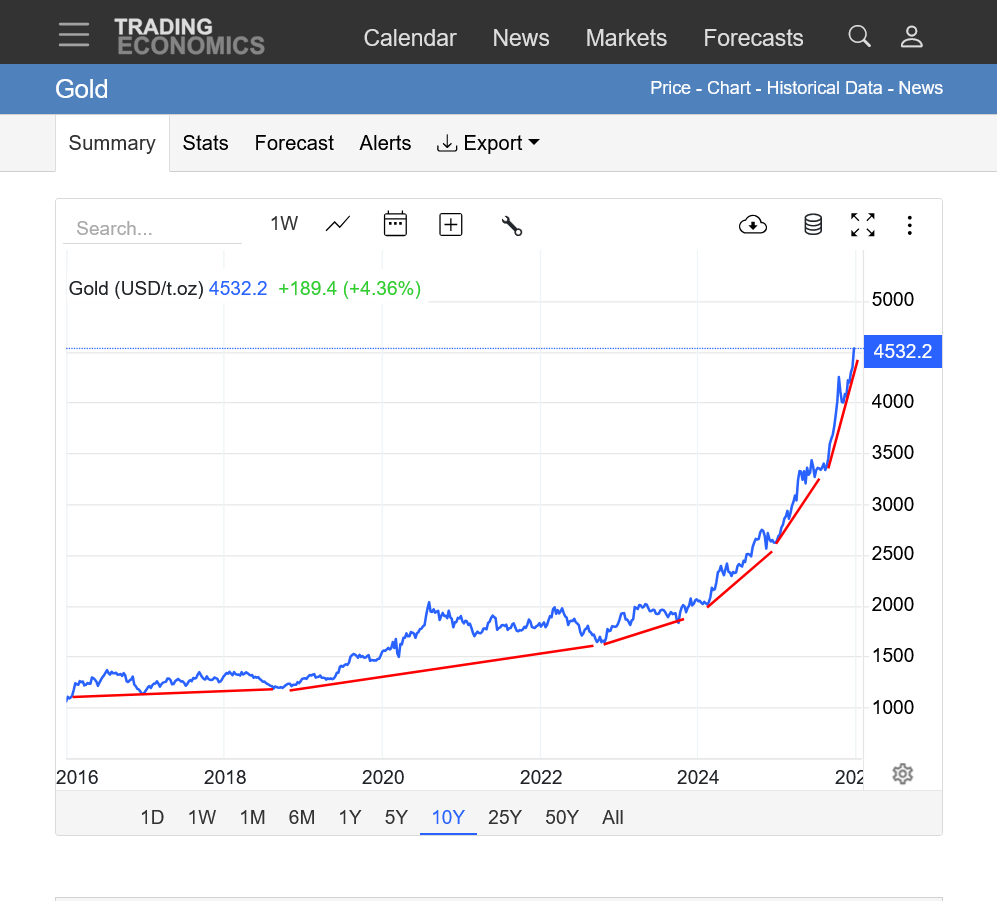

The supply deficit in silver is real, deep, and accelerating, and the market is finally moving high and away as momentum builds from every direction. Whether $82( in china ) marks a temporary top or just a pause point is something only the market can decide, because in this environment price is king, China is setting the tone, and the U.S. paper market is struggling to keep up. Physical silver is already trading above futures, confirming backwardation and acute structural stress: real metal holders refuse to sell at paper prices, inventories are shrinking, and futures traders are being pushed toward premium settlement. With China potentially halting refining and exports—removing as much as 70% of available flow—Western stocks could drain at an alarming rate, exploding premiums, destroying arbitrage, and stripping credibility from the paper market. As inventories fall, short sellers face delivery problems, margin stress, and the risk of forced buybacks, while Monday’s Asia–Australia open becomes the arena where price gaps, locked limit-ups, and sudden margin calls can ignite violent moves. Settlement risk now looms large: COMEX may be forced into cash settlement if physical cannot be sourced, or shorts may have to deliver at premium levels, either of which drives paper sharply upward. With the Gold–Silver Ratio already collapsing from the 30:1 region and capable of compressing into the low 20s—or even 15:1 in a blow-off phase—the path toward $100 or even $120 silver is no longer fantasy, but a realistic outcome of backwardation, shortages, and delivery strain. Miners may be earning record margins, but they cannot increase production quickly because most silver is a by-product of base-metal mining, leaving the structural supply hole untouched. Shorts have limited escape routes: rolling forward is unprofitable in backwardation, OTC swaps do not fix physical scarcity, and flooding the market with paper only works if physical holders sell—which they are not doing. If physical continues to vanish, March delivery becomes the moment of truth, a potential generational squeeze where Asia’s premium, Western inventory drain, industrial restocking, and rising investor panic collide. The cycle is moving through Do–Re–Mi: tension, acceleration, ignition, disorder, blow-off, exhaustion, and reset. Paper is paper, physical is king, demand is rising, algorithms amplify every breakout, and the bull market is smashing resistance after resistance as control slips away. This market is not only bullish—it is showing the early signature of parabolic behavior, and whoever holds real silver in such a phase becomes king.
"signature of parabolic behavior"
This is a wonderful summary, fayq!
joj and metmike had an excellent discussion related to this earlier this year:
Gold and Trump Trade???
Started by joj - Feb. 10, 2025, 8:17 a.m.
https://www.marketforum.com/forum/topic/109907/
https://www.marketforum.com/forum/topic/109907/#109916
++++++++++++++++++
The world will be watching our silver open at 5pm CST. The Asian markets (China) open at 8pm CST(where/when it will be Monday). We often see prices spike in many of our markets at 8pm(soybeans) in response to the open in those markets on the other side of the planet.
Tonight will be watched more than any other time in history because of silver.
Looks like silver may open a bit higher
now 83.20 ish almost 5% up for the day !!
Thanks, fayq.......................and that was the high.
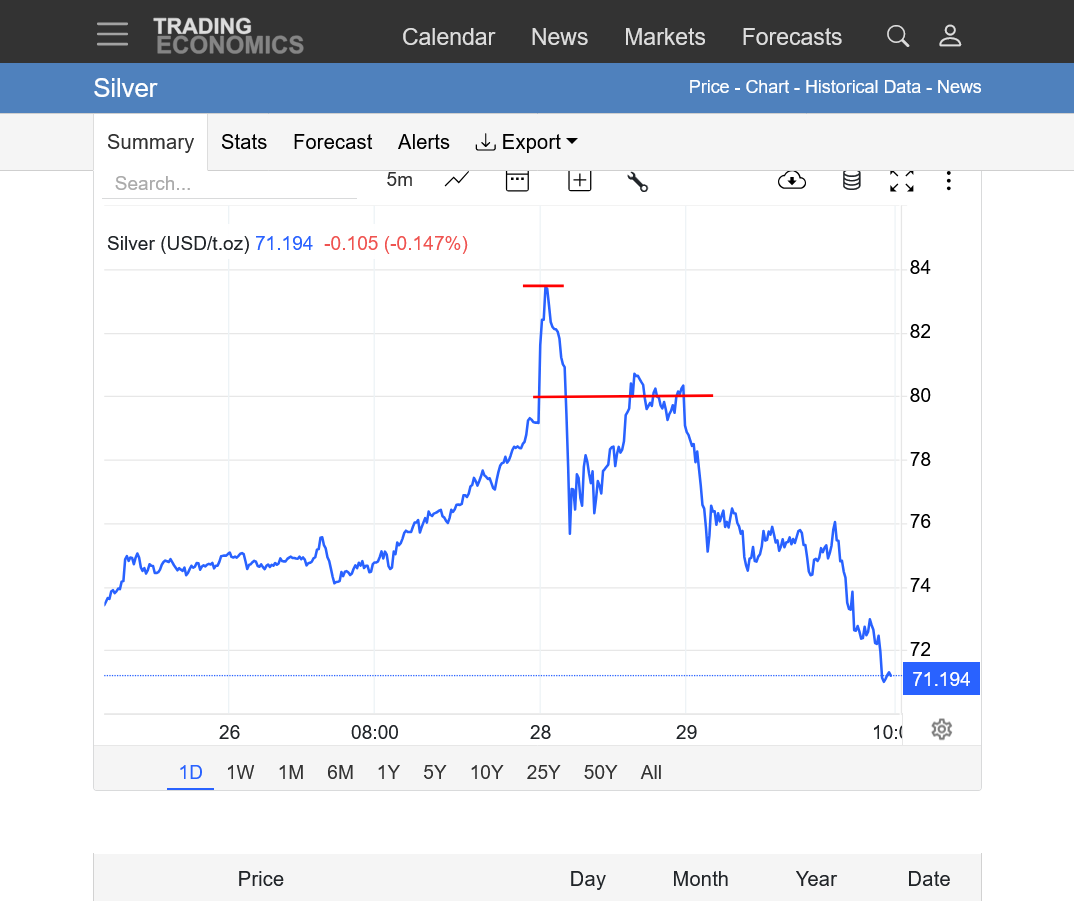
Take a look at this graph below! We had a very small gap higher, opening at $80, spiked up to that new record high, then collapsed lower.
This is a classical gap and crap buying exhaustion gap after a long move up as described above.
By metmike - Dec. 27, 2025, 10:36 a.m.
Is this THE high???
No way to know except what we can say is that THE top, when it happens will look exactly like this.
Could just be a short term top.......or with so much volatility........anything can happen. We could still come back. So much volatility. Already almost 40,000 contracts traded in 90 minutes.
Red line below was the open at 5pm. The night is early!!!
https://tradingeconomics.com/commodity/silver
We're off the lows a bit. With a small bounce up on the 8pm CST open of the Asian markets.
https://tradingeconomics.com/commodity/silver
Open of $80 at red line.
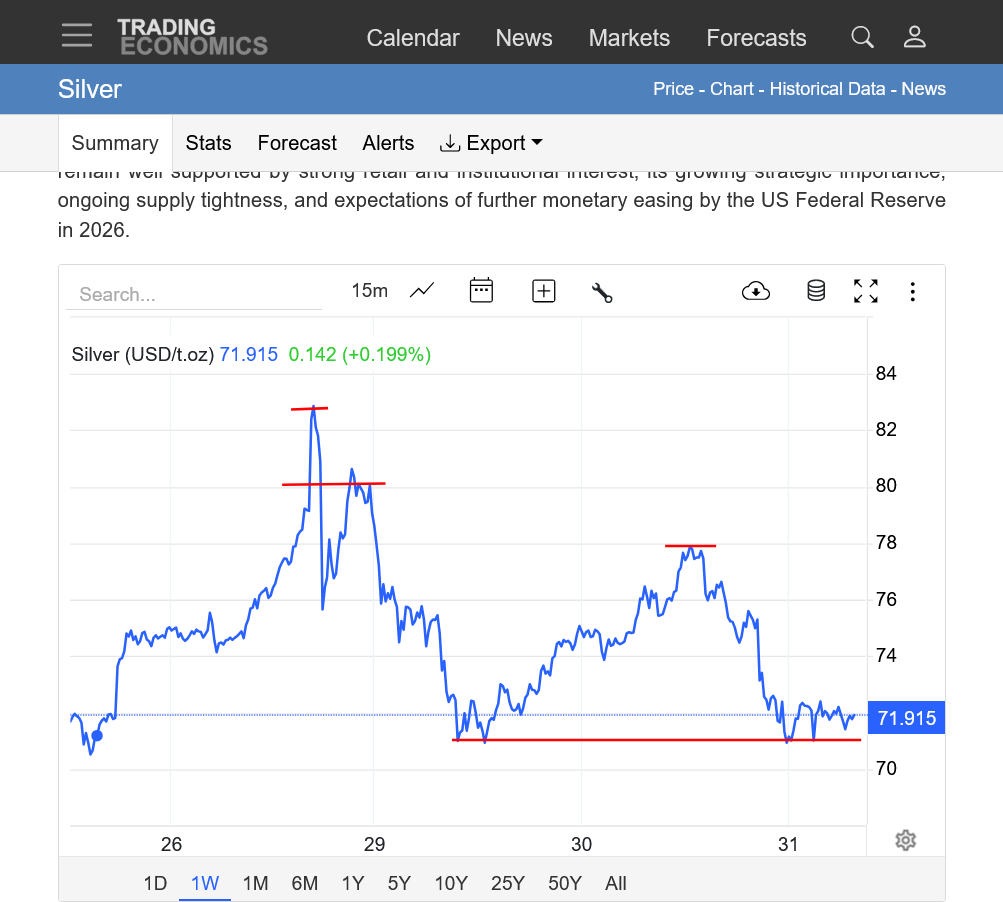
Silver has officially stepped out of gold’s shadow.
What we are witnessing now is not a routine rally or speculative spike — it is a structural shift in how silver is being priced, traded, and perceived globally.
Over the last month, silver printed an extraordinary range, with highs near 84-ish and lows around 75.0, producing a monthly volatility band of nearly 28 points. For a metal that already carries higher beta than gold, this kind of candle is a loud signal:
something has changed.
1. Extreme Volatility Signals Stress, Not Noise
A 28-range monthly candle is not normal price behavior — it reflects:
In March–April 2025, silver’s volatility was significantly lower. The current candle alone almost equals multiple prior months combined, which tells us this is not a technical accident.
This is stress showing up on the chart.
2. Silver Is Breaking Old Rules
Traditionally, silver follows gold — lagging in calm markets and outperforming during inflationary bursts.
But this time, silver is acting independently.
Old assumptions are collapsing:
Those rules are no longer reliable.
We are entering uncharted territory, where silver behaves as:
3. Supply Reality: This Is Not Just a Chart Story
The current move is grounded in real-world supply stress.
Silver is essential for:
At the same time:
This creates a structural imbalance — not a short-term squeeze.
4. ETF Chasing: What Happens If the U.S. Restricts Silver?
Now introduce the wildcard: ETFs.
Silver ETFs depend heavily on:
If the USA imposes restrictions, tariffs, or strategic controls on silver — even partially — ETFs could be forced into panic acquisition mode.
That leads to:
ETF chasing physical silver in a restricted environment would accelerate price discovery violently.
5. China’s Export Restrictions: The New Year Trigger
As the new year begins, China’s export policies become critical.
China dominates large portions of:
Any tightening of exports — whether on:
…would immediately tighten global availability.
This is not hypothetical. We have seen this playbook before in:
Each time, markets didn’t “bubble” — they re-priced reality.
6. Bubble or Repricing Event?
The big question everyone is asking:
Is this a bubble?
History suggests otherwise.
Bubbles are driven by excess supply and leverage.
Repricing events are driven by scarcity, policy risk, and strategic demand.
Silver today shows:
That’s not bubble behavior.
That’s structural repricing.
7. Strategic Candles & Policy Risk
That massive monthly candle is a strategic candle — one that reflects:
Markets print candles like this when confidence in stability breaks.
Conclusion: Silver Has Entered a New Phase
This is not just volatility.
This is not speculation.
This is not social media hype.
Silver is being revalued in real time.
With:
The market is telling us one thing clearly:
Silver is no longer cheap, no longer passive, and no longer predictable.
This may mark the beginning of a new cycle, where silver is treated not as a secondary metal — but as a strategic asset.
And once markets accept that reality, price does not ask for permission.
Thanks, fayq, great stuff!
In the 3td paragraph, i believe you meant 58 instead of 75 for the low In the last month.
Tonight, we got back above 80 and have moved lower again.
84-ish and lows around 75.0, is day range and monthly low around 58 thnx for correction !!
Fayq
As one whose metal puts EXPIRED Friday, Dec 26, what is your assessment of today's massive reversal?
Have metals, particularly silver, merely retraced to Wednesday, Dec 24 levels, and are now ready to "at least" test today's highs?
Is today's volatility now the new norm?
TIA
This price chart for the past 1 day of trading speaks for itself.
The small gap higher at 80, spike up from panic buying that completely ran out at the top, putting in a blow off top/buying exhaustion that was confirmed when we sold off BELOW the open and close the gap(gap and crap signature).
Re: Re: Re: Re: Re: Re: Re: silver
By metmike - Dec. 28, 2025, 7:38 p.m.
This downside reversal formation generated tremendous selling, that spiked us much lower......but the bulls were not completely dead. They made a renewed attempt to recover with enough buying to TEST the ultra significant 80 level and that opening gap area a couple of times.
All the panic buyers/and shorts covering that fueled this late stage of the blow off top early in the evening WERE BLOWN OUT. So the silver market ran out of buyers above 80 and that's all she wrote.
https://www.marketforum.com/forum/topic/116582/
Is this THE top?
Still can't say for sure but will repeat the early Sunday evening statement "THE top will look exactly like this but that doesn't mean this is THE top"
Extreme volatility at extreme tops mean extreme reactions and extreme ranges. It's possible that this is an extreme downside reversal that puts in an extreme SHORT TERM correction.
As fayq has noted, their are ultra bullish fundamentals to back up a MUCH higher price that a blow off extreme top CAN'T FIX by itself.
We did, however eliminate one of the biggest bullish factors fueling this last leg of the extreme, historic move up:
THE PANIC BUYING!
Especially from the shorts covering who were getting blown out.
https://www.axios.com/2025/12/29/china-taiwan-live-fire-military-drills-us-arms-deal
++++++++++++
Donald Trump is the most powerful man in the world and can win almost every battle with other countries because he has the most powerful country in the world to back him up.
But he CAN'T win against China. They are economically too powerful and their leader is a brilliant man that will ALWAYS out think our delusional, pathological thinking leader that is suffering from progressive dementia.
Xi embarrassed Trump and his ruinous tariffs on the global stage by not backing down. Now delusional Trump thinks he can use the implied threat of the most powerful military in the world to intimate the president of China in an area that China will NEVER lose on. NEVER!
Regardless of our opinion on Taiwan and what we think is best for that country and its people, WE DON'T GET TO CHOOSE what's right.
Very often, the choices we make are not between good and bad. The are between bad and REALLY BAD!
In 2021/22, Ukraine had that choice in deciding whether to NOT join NATO and NOT fighting a war over it with Russia or fighting a winner get's Ukraine war with Russian, instead...........the REALLY BAD choice. We're witnessing the consequences of the REALLY BAD choice by Biden/NATO and their puppet, Zelensky.
We have the same choice with Taiwan.
The REALLY BAD choice would be for the United States to get into a war with China over Taiwan. Our current leader is just the man to do that!
Hopefully not.
+++++++++++++
It's likely that Trump is doing this, exploiting his strength as leader of the most powerful military in the world and the most powerful military-industrial weapons producer in the world to try to resurrect his image and refocus in an arena that his delusional mind thinks that he can win.
This is NOT Venezuela.
We can't beat China!
We should not WANT to beat China.
We should be trying to GET ALONG with China. Having FREE TRADE with China. Protesting their human rights violations RESPECTFULLY and expressing our disagreements RESPECTFULLY. Negotiating RESPECTFULLY!
Not imposing huge tariffs and playing high stakes DISRESPECTFUL games of economic trading "chicken".
Our leader doesn't understand the concept of respecting other people or countries that disagree with him. He is a perpetual bully that assumes he will win every battle that way because he's infallible.
This is the exact WRONG tactic to use with China. 30+ years ago, that might have worked. The world has changed and in 2050, China WILL BE the world biggest economic power by a wide margin. India and the United States will be #2.
We need to position ourselves favorably for that certain transition by doing what's best, working WITH China. Not fighting it counter productively and pretend that the US can somehow stay #1 if Donald Trump just waves a magic wand, imposes ruinous tariffs and repeats complete nonsense over and over.
Make China our allies, not our enemies while still defending our positions and ethical concerns.
It's called RESPECT for others!
More discussion on this topic here:
The focus in recent days has been on COMEX margin hikes, but that headline alone misses the deeper story unfolding in the silver market. What’s happening is not just higher margins — it’s limits on contracts, forced funding deadlines, and growing pressure on highly leveraged positions.
Monday marked a critical line in the sand. Funds were required to have capital fully in their accounts, or positions would be liquidated without discretion. No extensions. No negotiations. In a market already experiencing elevated volatility, that kind of enforcement speaks volumes.
This is not routine risk management.
This is stress response.
Margin hikes are familiar tools. Exchanges raise them to cool speculation. Traders adjust, reduce leverage, and move on.
But contract limits change the structure of the market itself.
When limits are imposed:
That combination suggests the exchange is not only managing risk — it is actively preventing instability.
Adding to the tension are reports circulating within the precious metals space that significant margin calls may be hitting large short silver positions, including those held by major bullion banks.
According to industry commentary and reporting, some large short positions appear increasingly vulnerable as:
If even a portion of these positions are forced to reduce or liquidate, the implications are substantial. Forced covering in a tight market doesn’t unwind smoothly — it accelerates price discovery.
Whether every claim proves accurate or not, the risk dynamics themselves are undeniable:
In leveraged markets, margin pressure matters more than opinion.
Silver is uniquely sensitive to:
When margin calls cascade:
This is exactly the kind of environment where sudden pullbacks and violent rallies can coexist — not because fundamentals disappear, but because positioning is being forcibly adjusted.
Against this backdrop, results matter — and so does how they were achieved.
I’m currently up 133% year-to-date, and 230% over the last two years. I’ve been part of the Finding Value community for roughly 20 months, and these outcomes weren’t driven by leverage abuse or chasing headlines.
Yes, silver has pulled back in recent hours, and that may shave the final numbers slightly as the year closes. But even accounting for that, the performance remains exceptional.
That’s not luck.
That’s structure, patience, and risk management.
COMEX does not raise margins and cap contracts for entertainment. These measures exist to protect the clearing system, not individual traders.
When:
It means the system is prioritizing survival over speculation.
Weak hands are forced out. Over-leveraged positions don’t get opinions — they get liquidated.
Whether margin pressure is hitting hedge funds, large speculators, or major bullion banks, the takeaway is the same:
Markets don’t move because of narratives — they move because positions break.
Silver remains a market where leverage cuts both ways. In times like these, survival is the edge, and discipline is the trade.
The numbers speak for themselves.
The rules are changing in real time.
And those who understand structure — not just price — are the ones still standing when the dust settles.
fayq,
Thanks VERY much for the outstanding summary. Especially for providing the link to the source for your posts and respecting my request over the weekend.
If everybody in the world respected each other, we could all get along so much better with peace and harmony replacing much of the hate, intolerance, hostility and wars.
A trading session like we’re having right now, with silver bouncing back to 74 would have looked extremely bullish earlier this month.
Although we put in a profound buying exhaustion and blow off top on Sunday Evening, theres no way to know how long it will last.
The price right now is still higher than it ever was before Christmas 2025.
Back to 76 and recovering some of the losses from yesterdays historic plunge.
We've gained back around 50% of the historical losses in yesterday's trading session.
The prices below are not exactly accurate. For instance, the longer term charts from this site don't show the price ever getting above 80........but they're free and allow me to describe the analysis/history.
https://tradingeconomics.com/commodity/silver
1. 1 week. First gap higher on the Christmas Day open was a break away gap. The 2nd one on Sunday Night was an exhaustion gap, confirmed when we quickly closed it, a short period after it was opened. Then we retested that exhaustion gap at 80 and crashed lower in a hurry with all the high octane short covering and panic buying fuel depleted. We dropped to a price that apparently represents intrinsic value as buyers have stepped in again.
2. 1 month: All we did was test the LINEAR uptrend line!
3. 10 years: This crazy, downside reversal as unprecedented as it was has still not changed the very bullish, long term chart formation which has gone parabolic/exponential. Steeper and steeper slope of the uptrend.
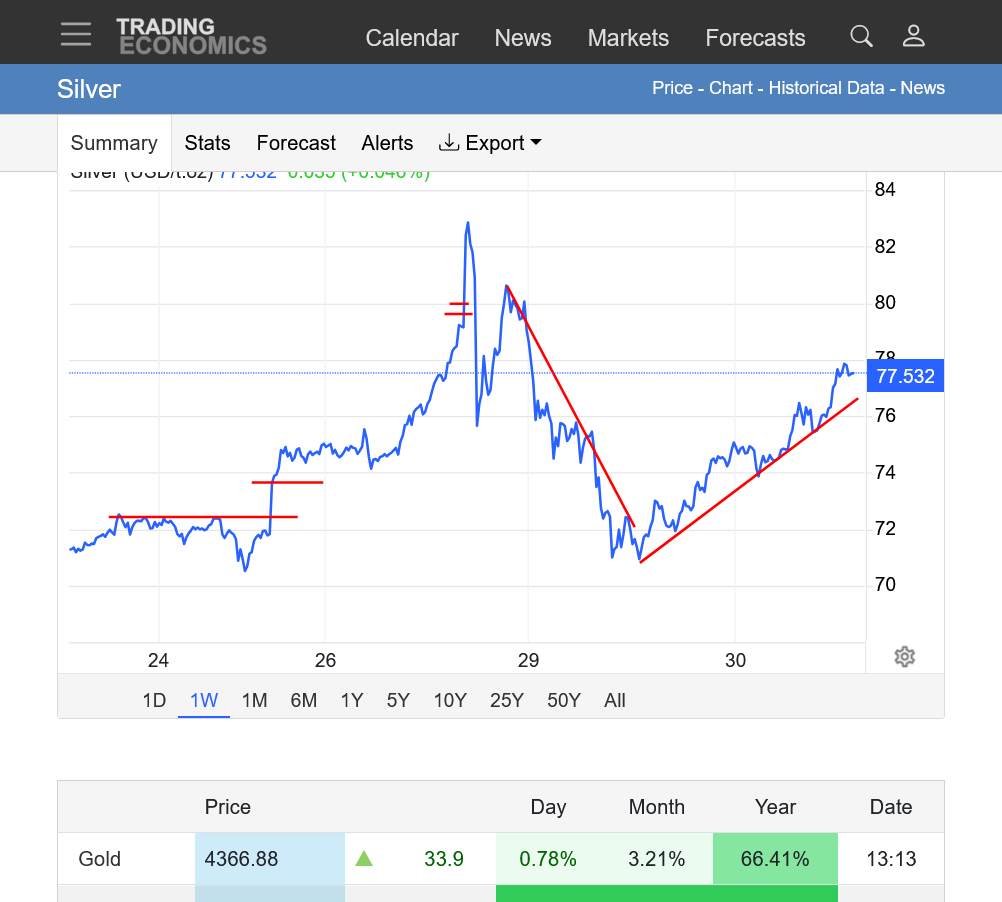
A big difference now, compared to the first time we were at this level is that previously, there were no levels higher for traders to use as historic reference points. 80 was a big round number but didn't mean that much.
This week, we could still blow thru 80 again but traders see it as potentially strong resistance., especially as its the exhaustion gap that HELD on the retest from below, now serving as solid resistance. Also, the all time record high on Sunday Evening. Those levels could potentially cause the bulls to back off and entice selling pressure just from chart formations that didn't exist a week ago.
This is all just speculative based on chart patterns/formation with no inside information about the fundamentals driving this market.
+++++++++++++++
1:50 pm: Right after posting that above, silver commenced the biggest drop since it recovered from yesterday's bottom.
Was this from news? From sellers stepping in based on the downside reversal chart formation/new resistance??
1. 1 day
Amazing run. I've been watching the [long silver - short gold] lately which is a safer way to play silver. After years of gold out performing, silver is having its way this past year.
I would take an interest in silver in the mid 60s (bull flag) if it got there with declining volume.
Thanks, joj!
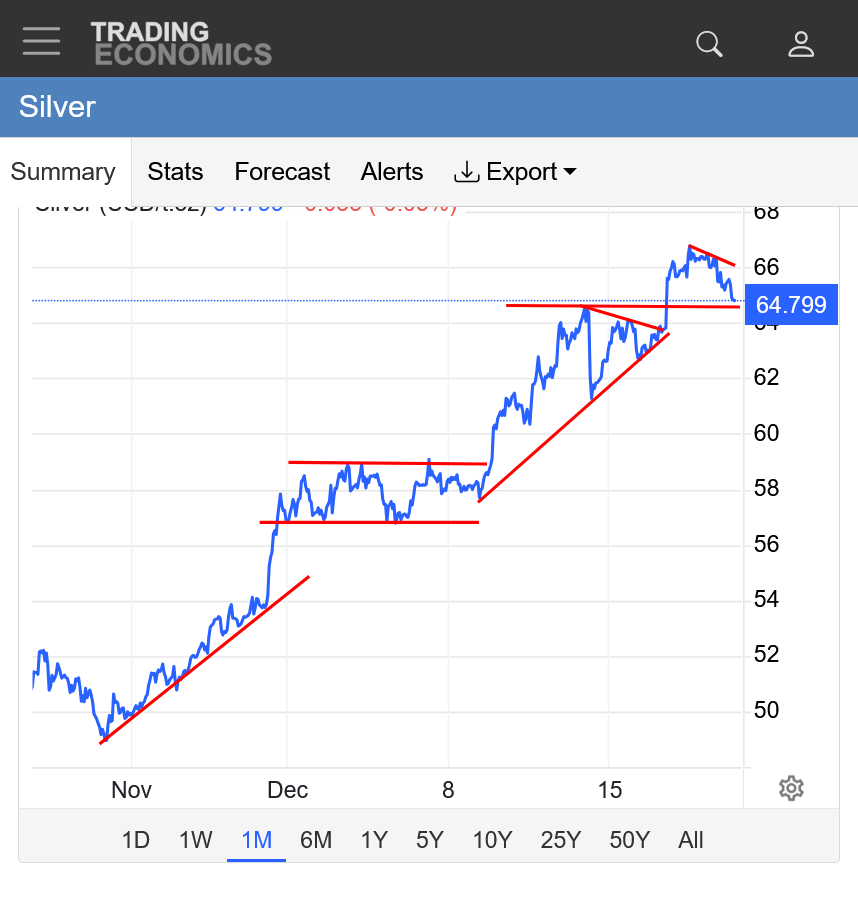
We're etching out a pattern since the downside reversal thats put down some resistance levels that didn't exist when we were in uncharted territory and constantly making record highs.
Current resistance.
1. The highs Sunday
2. 80 from the gap, then the retest
3. Todays high around 78.
The fact that the last 2 highs have been LOWER is not good for the bull case. It means the selling is overwhelming the buying at lower and lower prices.
https://tradingeconomics.com/commodity/silver
Which red lines will be violated?
Sellers have stepped in/buyers backed off at lower highs/prices.
Buyers are taking a strong stand at this current support with sellers matching them and some sideways action at the moment.
Any information about rate in China japan and USA ---plz update on all three TIA
Thanks, fayq,
I'll be tied up at my daughters house watching IN place in the Rose Bowl this afternoon but will post anything new before then.
https://tradingeconomics.com/commodity/silver
1. 1 week: Exhaustion gap at 80. All time high/top followed by LOWER highs and a NEW SHORT TERM DOWNTREND with steepening slope. This could also be a BULL FLAG.
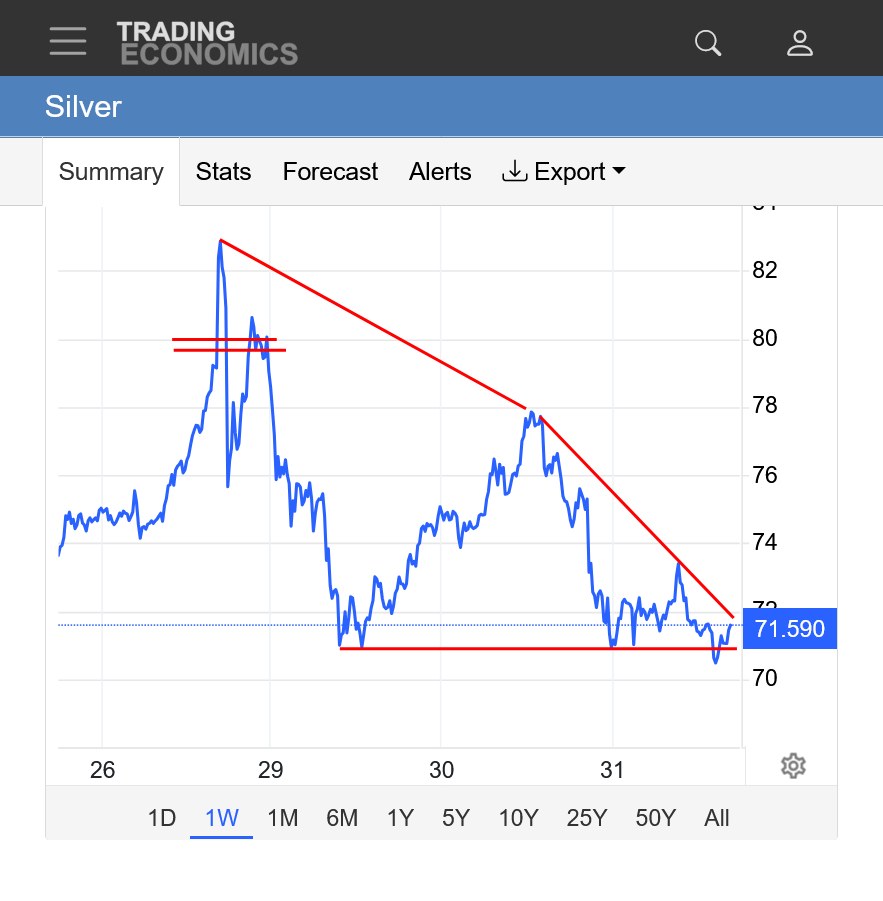
2. 1 month: Steepening DOWNTREND. Testing or violating the previous linear short term uptrend. Testing 70. Potential BULL FLAG.
3. 1 year: Testing the most recent linear part of a parabolic longer term slope. The all time high is WRONG on this chart.
4. 10 years: Still parabolic with steepening slope of uptrend but this is being tested. The all time high is WRONG on this chart.
+++++++++++
Red lines on price charts only tell us what has happened, which (helps to understand Wyckoff's composite man mentality). Understanding market mentality is important and assists with predicting the future but can't tell us the unknown news/changing fundamentals, how traders will react to that or how traders will react when prices hit new price levels at new times frames.
For instance, we can't know if there's a million contracts worth of buy orders below 70 that will be a brick wall of support. If that is the case(I have no idea) this will be a bull flag.
However, if this was a long term blow off top that exhausted all the panic buying, it may be impossible to generate enough buying to go up again to those prices WITHOUT THE PANIC BUYING. At least for awhile
There are long term fundamentals to consider and intrinsic value. We greatly exceeded that with the short term blow off top but that could inspire FRESH buying by traders looking for value as we drop into the value one.
After Donald Trump kidnapped the president of Venezuela and ramped up the chaos in the world, a higher silver and gold market seemed inevitable. The open earlier this evening was at the red line.
Thanks much, cutworm!
Silver breaking above $80 and negating much of the previous, negative price formations from the gap and crap SHORT TERM buying exhaustion in late December.
Unfortunately, the free source that I use has this current price ABOVE any previous price so using anything other than this 1 week chart will be using bad data.
Regardless, we are trading ABOVE the exhaustion gap and crap and ABOVE $80 which makes the historic correction, just another bull flag in a market that got way overdone/ahead of itself. The next MAJOR resistance is the all time highs.
There is still the chance of putting in a double top formation if the old record highs hold. The very bullish fundamentals as well as the chaos in the world from Donald Trump's agenda of obtaining more and more power seem to be plenty of fuel to go higher.
https://tradingeconomics.com/commodity/silver
Silver went up and tested the old highs earlier on Tuesday.
Now down below $80 again and the bears having the advantage again.
https://tradingeconomics.com/commodity/silver
1. 1 week.
2. 1 day
If your not long your wrong. Breaking and closing above 82 give you a clear path to 103. Every dip keeps getting bought by the manufacturers. For the life of me I can’t understand why the big banks keep trying to suppress silver. They are risking wholesale banking collapse. If they would just blow out they would save billions but instead it keeps feeding the demand lead rally.
Thanks, vinny!
Silver is back, just above 80 on a VERY strong day so far.
Gold and silver at all time highs tonight!
Silver: 1 week below. The longer term charts are not giving the right December high.
https://tradingeconomics.com/commodity/silver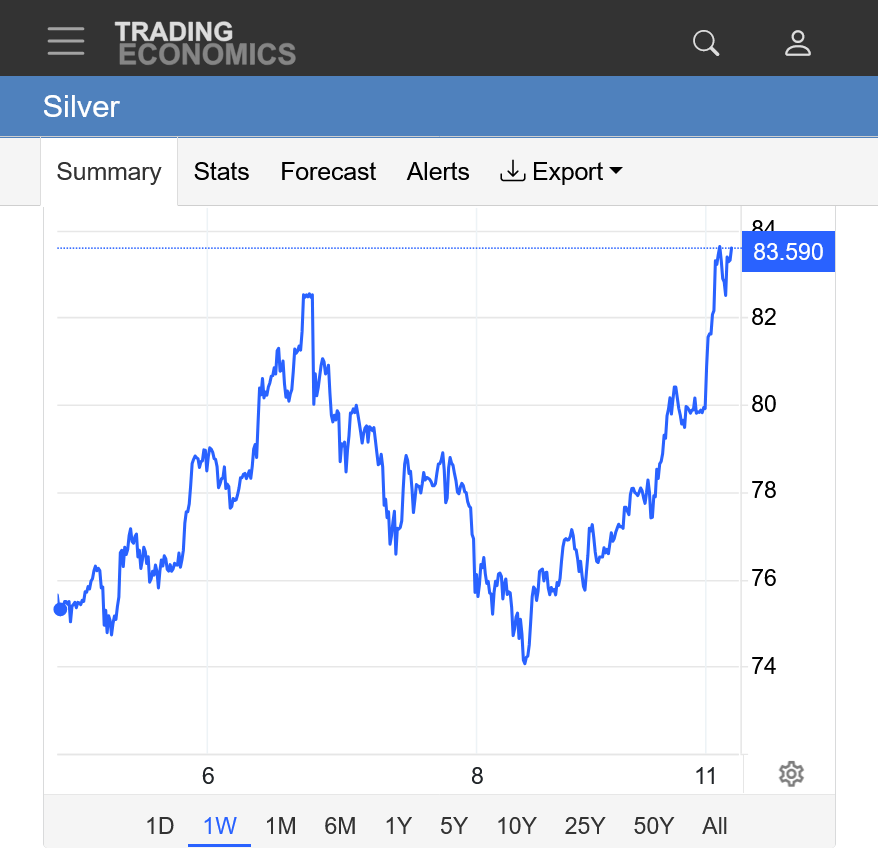
https://tradingeconomics.com/commodity/gold
The record, almost $13+ correction in a short period a couple of weeks ago barely shows up as a blip on the long term silver chart.
Which is still in a continuation of the exponential(parabolic) move higher. With steeper and steeper slope for the uptrend. The top at the end of last year was from a temporary buying exhaustion after a gap higher that ran out of steam(buyers at prices above $80).
Part of it was from panic buying from shorts getting blown out. When that dried up, there was a temporary vacuum in FRESH buying. The reversal down set off sell signals on trading programs too.
However, in the $70 area, strong fresh buying kicked in based on the extreme unbalanced fundamentals. Too much demand and not enough supply to satisfy it.
The cure for high prices is still high prices but it take a very long time to increase supplies, despite the record incentive to do it right now.
https://tradingeconomics.com/commodity/silver
++++++++++++++++++++++
Gold is pretty much the same thing but without the same extreme magnitude of demand from industry that can't be satiated.
https://tradingeconomics.com/commodity/gold
The chaos, uncertainty, loss of confidence in the United States and potential inflation being caused by Donald Trump is gold's best friend right now.
Debasement of the currency is also adding to demand. IMHO
Less inflation news now = lower interest rates by FED = MORE inflation down the road
Silver
https://tradingeconomics.com/commodity/silver
Gold
Parabolic/exponential, steepening uptrend channel for Silver is ACCELERATING!
https://tradingeconomics.com/commodity/silver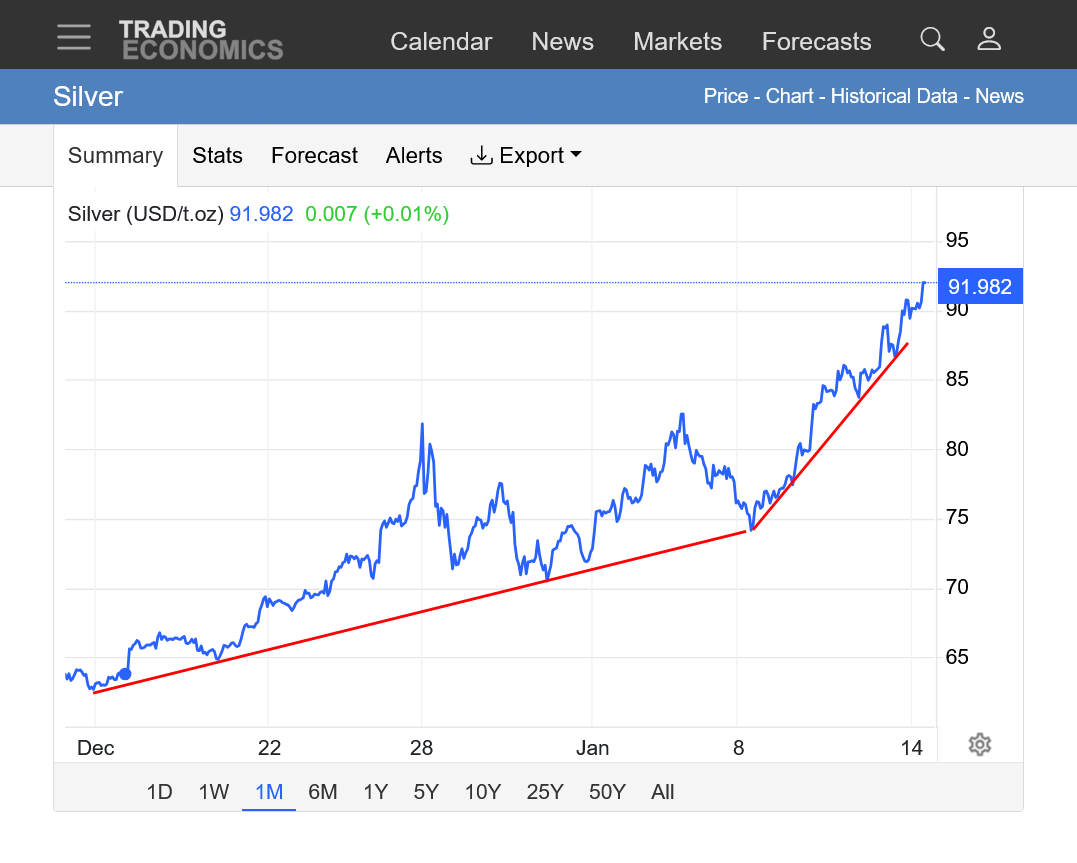
+++++++++++
Gold has also obliterated previous highs
https://tradingeconomics.com/commodity/gold
Becoming VERY expensive to trade (and be wrong) silver.
Friday could be a blowoff high, especially gold, IF metals close near their highs.
Looking to BUY GLL calls.
REMEMBER--highs/lows are formed on 3 day weekends!
"Scares me" that Monday could be a really crazy, (night Sunday) then Monday with "few" traders to 'absorb' a momentum surge. THE ULTIMATE TOP????
For sure, tjc!
My wife, Deb was in the electroplating business for almost 5 decades(started as a teenager). For the first time in my 3+ decades of trading, I can get her attention by just telling her the price of a commodity.......... silver or gold.
I will often tell her when I have a trade and what profit/loss is but the price of ng or the price of corn/beans have no meaning to her.
My son in law has been in the electroplating business for 2+ decades. For the first time in my trading career our careers have crossed paths, like with my wife.
At the start in 2025, he said he had a customer that was predicting $75 silver in 2026 and everybody thought that guy was crazy. Late in the year, I was emailing him price charts of silver already blowing thru 2025.
Very interesting to hear the perspective of somebody that plates parts with gold, silver and nickel.
Yesterday evening, I was actually watching silver when it made that historically huge correction and bounce in such a short period of time and reporting it to Deb who was amazed along with me.
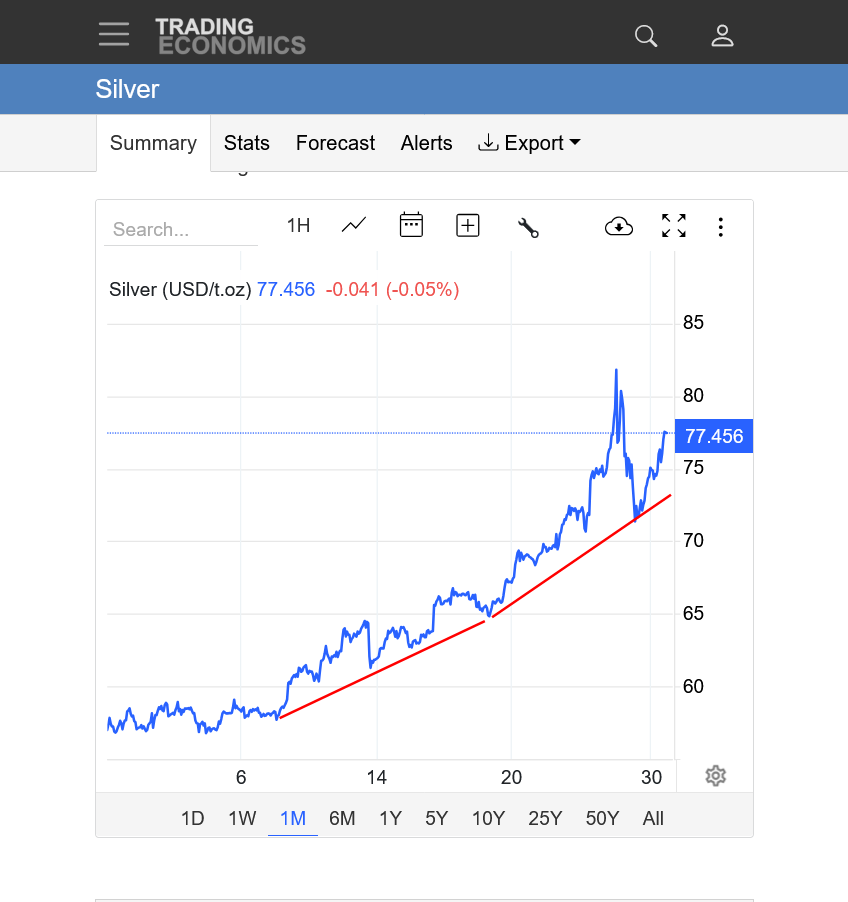
https://tradingeconomics.com/commodity/silver
1. 1 week chart below.
The price change in a couple of hours, first down then bouncing back was multiple times greater than the range of silver for 2 entire decades from the mid 80s to mid 2000s.
https://silverprice.org/silver-price-history.html
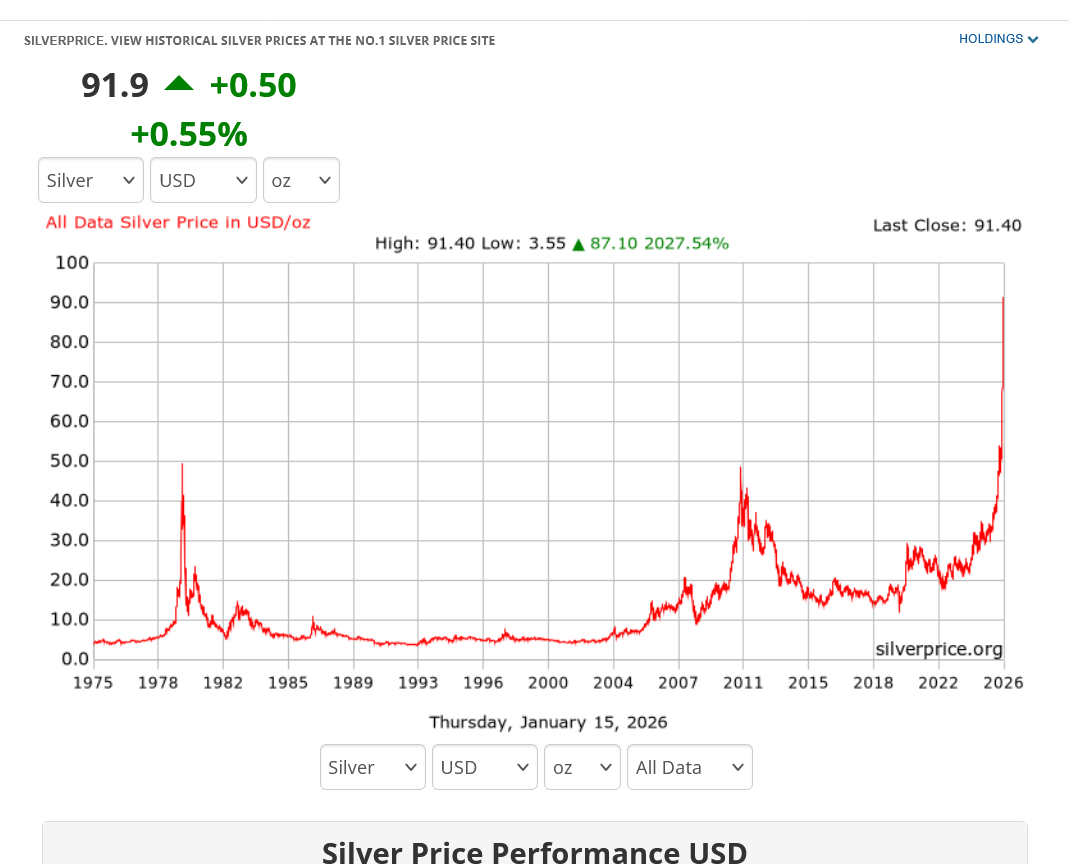
https://tradingeconomics.com/commodity/silver
Short red lines were the close Friday and open Sunday. Long red line was last weeks historic highs. We're up there again thanks to the chaos being caused by the most powerful man in the world.
+++++++++++++++++++++++++
Huge upside breakaway gap in gold because of the major chaos from Donald Trump. Well above all time highs.
Wild rides ahead — Mars under stress brings sharp volatility. 22 Jan 2026 aligns within 1° of the 21 Jan 1980 Mercury Cazimi ( 0 ). That’s a 46-year echo of a major information and market climax. (Aquarius axis = crowded trades, strong narratives, weak foundations.) Silver topped historically around 21 Jan 1980.
In my view, we’re near the top end now — expect shake-outs. Caution advised; straight-line moves are unlikely Imvvho 2cents ===Re@ct 2 mkt conditions
Thanks, fayq!
https://tradingeconomics.com/commodity/silver
1. Donald Trump Greenland chaos gap higher on the left. This caused the stock market to gap lower and close sharply lower.
2. Right: After the stock market tanked on Mon/Tue from Donald Trump(who's top priority is keeping the rich people happy and making the stock market go higher), he backed off of his insane Greenland position on Wednesday to stop the slide, which caused silver to FILL THE GAP higher from Sunday night in silver. But there was no follow thru. In fact, the bottom of the gap served as support and resulted in fresh buying, which NEGATED the gap and crap buying exhaustion signal. This is bullish.
BELOW 9:57am. Added the top line, this week's all time highs because we are either testing them or about to make the upmteeth upside break out, DESPITE Donald Trump's backing off of his madman Greenland position on Wednesday:
Silver over $100!!!!!!!!
https://tradingeconomics.com/commodity/silver
1. 1 week
2. 1 year
3. 10 years. Classical example of a parabolic/exponentially increasing(steeper and steeper slope) that goes almost straight up as it accelerates to an historical top which is impossible to predict with panic buying being the last phase. No telling how much higher we will go or when it will end.
This could be THE top or we could go much higher. However, at some point the price will crush demand. "The cure for high prices is..........HIGH PRICES"
Supplies will go up because of financial incentive but it takes years for the silver mining industry to respond. ....which is the biggest reason that we can't stop this freight train by adjusting the SUPPLY SIDE fundamentals from price incentives.
+++++++++++++++++++++
https://tradingeconomics.com/commodity/gold
Gold is also parabolic but MUCH LESS extreme. It was the leader for years but the past year+ has been a follower of silver.

What is possible for next swing --A Gap opening ?and what would be tgt area
Great question, fayq!
I would say this market is not predictable right now.
Record volatility at extreme record highs in a market that is trading with a legit supply shortage, during extreme news chaos bombarding the market from the most powerful man in the world who is bombarding all the markets with a steady stream of unpredictable chaotic news.
Profound market reactions at certain points can help to give us powerful clues at those points in time. However, record smashing highs above psychological $100 resistance seems to suggest more upside potential.
If we reverse down and close under $100 on high volume, maybe that's a short term top??
Gentlemen, Fayq and Mike
Totally agree the volatility in metals, ESPECIALLY silver, almost completely prevents 'trading'. Currently, one must be able to withstand 4-8 dollar swings, $20-40,000 with ever increasing margin requirements. One dollar, $5000, swings in an hour!
Options and their expanding bid/ask is also not for the faint of heart as a 'reasonable' in the money WEEKLY, not monthly, expiration may require a $10,000 "investment".
I have totally missed the rally. NEVER would have been wrong chasing a call!! Instead, I have wrongly anticipated a high and bought puts, usually buying on Friday for the next week Friday strike prior to the 5pm est close! "Nice", "normal", "routine" trading cycles NEVER seem to work in parabolic markets!!
Daily cycles 'tell' me to look for a/the high this week, but I do not have the pocketbook to speculate IN THIS MARKET. Makes one want to trade oats or OJ! HAHA! The 'lucky' selective put will make one easily $20,000!
Please tell me THE day!
Tim
PS--Mike, currently, silver makes YOU and LARRY'S ngas look like oats!
Wonderful contribution, tjc!!!
It's been fun to follow for entertainment purposes, even though I never did and never will trade silver.
However, it's not a healthy thing for our economy when a critical metal like this more than triples from an already high price in 9 months.
My son in law is in the electroplating business as was my wife for almost 50 years. Every single end user of silver is and will pay a hefty price for this and that will be passed on when they sell their products to consumers.
++++++++++++++++++++++
+++++++++++++++++++++
https://en.wikipedia.org/wiki/Electroplating
++++++++++++++++
++++++++++++++++++++
https://www.visualcapitalist.com/dp/si01-ranked-largest-silver-producing-countries/
+++++++++++++++
https://silverinstitute.org/silver-supply-demand/
Excellent, comprehensive report! I won't copy the awesome graphs since this thread is filling up fast with posts.

https://silverinstitute.org/wp-content/uploads/2025/04/World_Silver_Survey-2025.pdf
+
Gold and Silver both had big gaps higher. On every time frame a very bullish upside break out gap higher. Filling it would represent a gap and crap buying exhaustion.
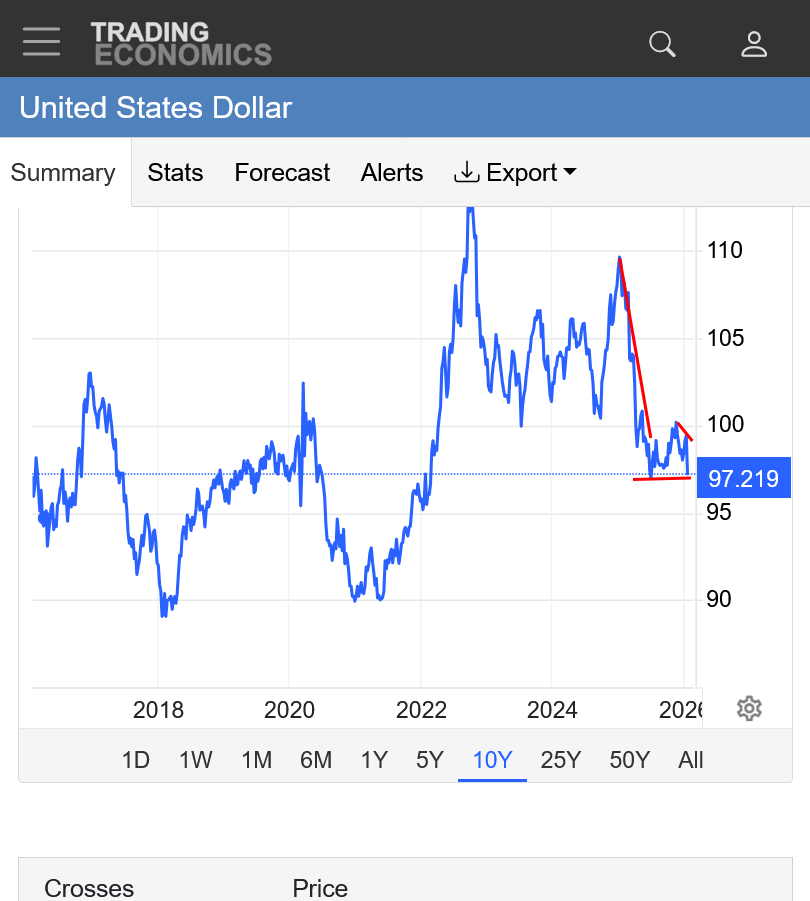
Dollar Index HUGE gap lower.
My personal feeling is that the market is also dialing in the inevitability of Donald Trump being removed from office that adds to the speculative aspect of the bullishness.
Disagree with your President Trump statement.
Silver and most metals are in very short supply and unlike ONE crop year, can not quickly increase supply.
In contrast, Ngas will have a massive correction as supply will "fairly" quickly absorb 2-3 weeks of needed supply for temporary demand.
Yes on natural gas! They can turn up production fairly fast. Once the cold subsides, they can start building storage again.
Agree also about the supply side of silver. However, there is MUCH more going on.
The supply side of silver didn't cause the US Dollar to gap lower and isn't causing the US dollar to crash lower.
I''ll start a new thread and do a dollar index analysis this evening after I get rid of a foot of snow on the driveway and sidewalk.
We are about to see a major downside break out!
https://tradingeconomics.com/united-states/currency
1. 1 year
2. 10 years: top of the red downtrend line is exactly when Donald Trump started his 2nd term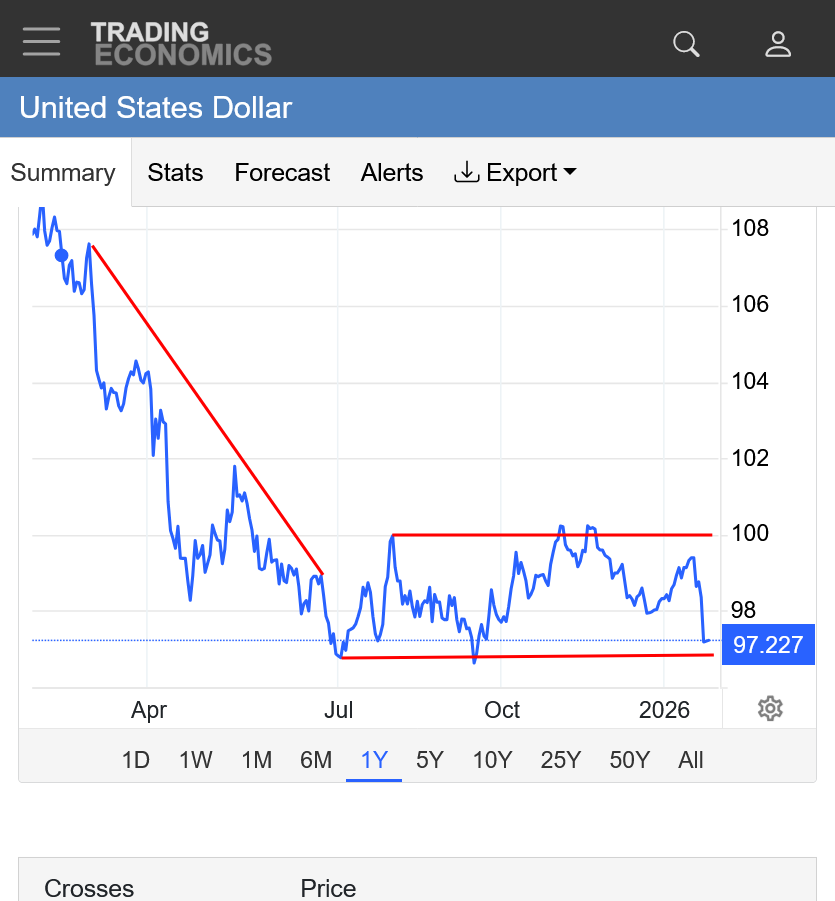
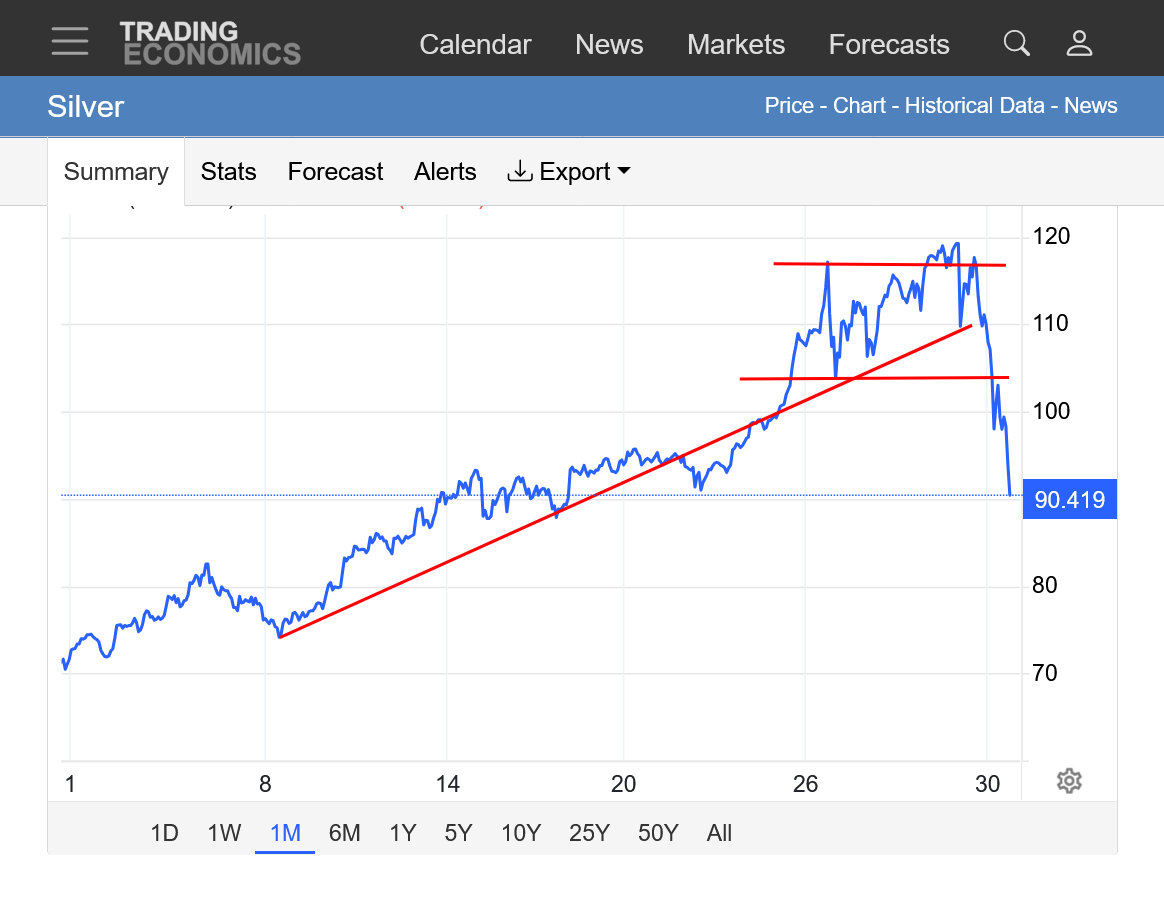
https://tradingeconomics.com/commodity/silver
1. 1 week with small gap higher to start this week(last weeks highs-lower red line/this weeks lows upper line)
2. 10 years. Extreme example of a parabolic, exponential move higher. It can't go on forever but trying to pick a top is impossible......until well after the top.
11am: Silver almost $114.
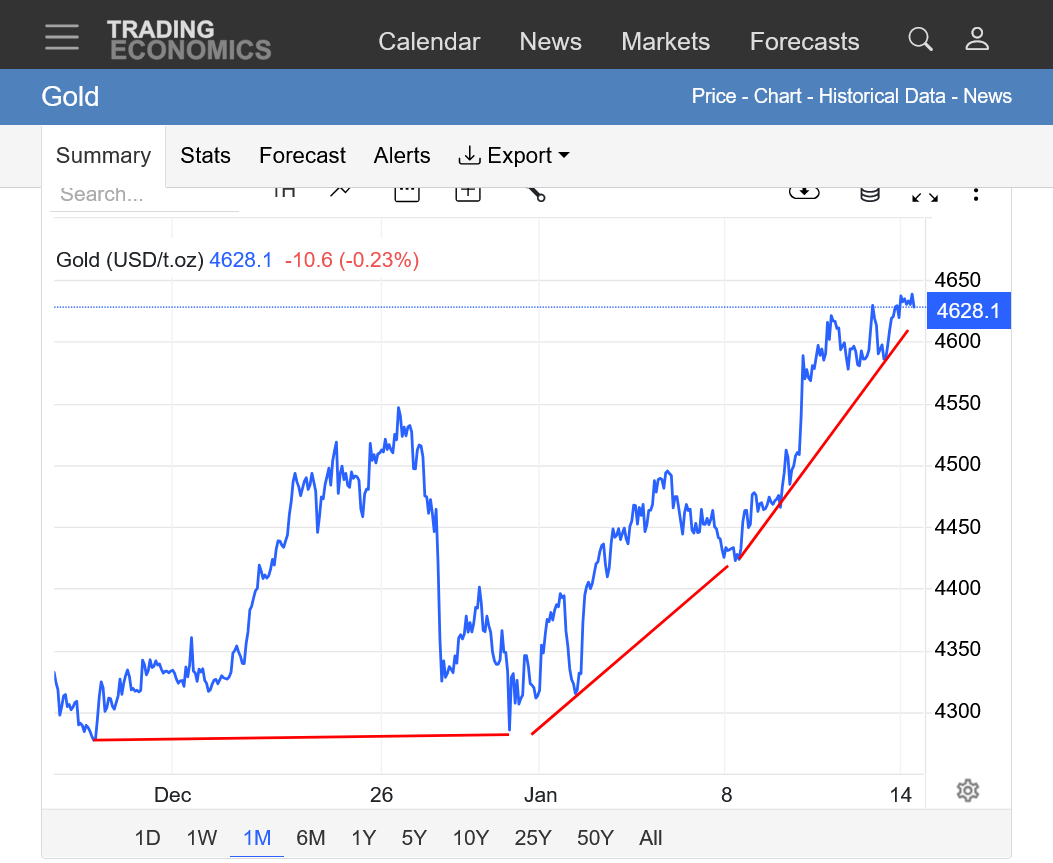
Gold is really taking off this week:
https://tradingeconomics.com/commodity/gold
1. 1 week
2,. 10 years: Parabolic/exponential with increasingly steep slow for up trend.
Gold projection after FOMC -Some choppy sction --- later 5760/5830 Gold strong resistance zone we needs to watch it very carefully---!!
Thanks, fayq!
These must easily be the biggest 1 week gains in history for gold!
https://tradingeconomics.com/commodity/gold
104,000+ contracts traded in the April Gold contract in just 4 hours. WOW!
Gold and Silver reversed lower this morning from all time highs.
3pm: We can't go higher all the time every day and when we have intra day corrections, they will be huge. Still no sign of THE top.
Take a victory lap cutworm on calling this silver move. Well deserved.
Now mkt lower =---silver and gold--------->> so--!!
Thanks, fayq!
Now THAT is a powerful sign of a top. Certainty a short term top but will it be THE top? Time will tell but it looks bad for the bulls!
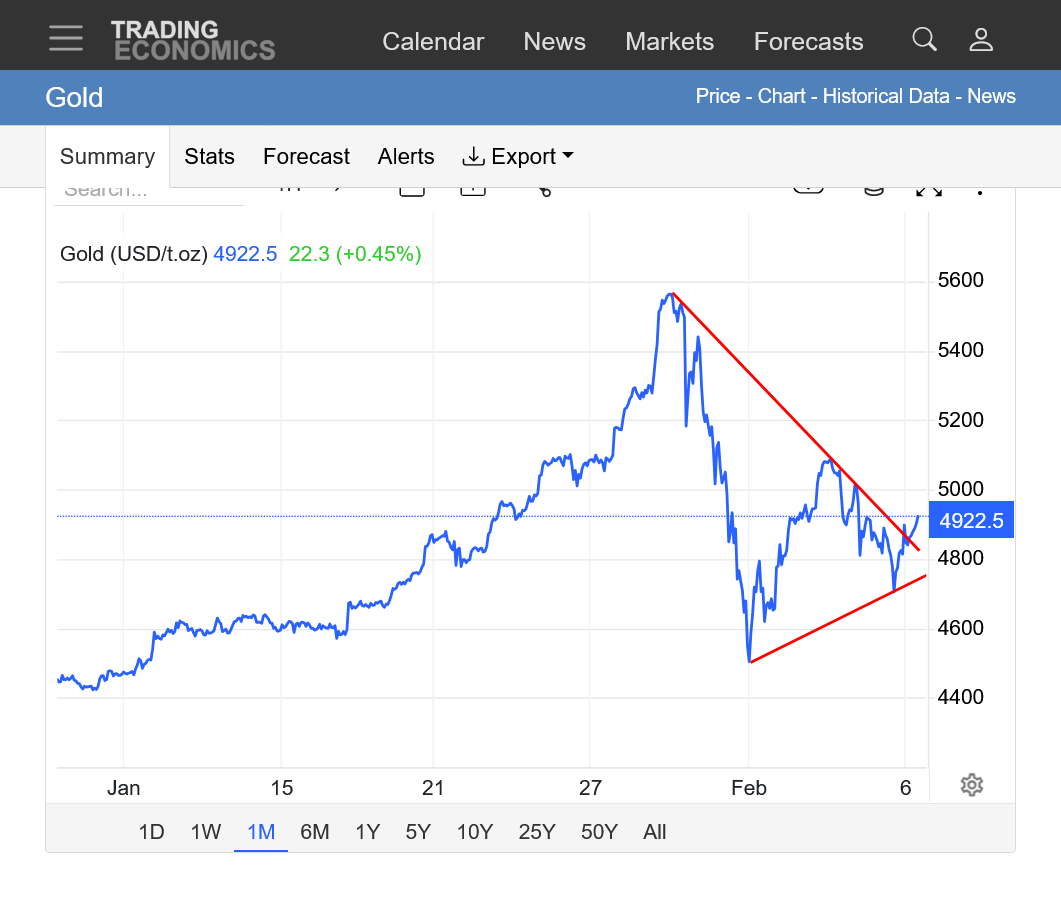
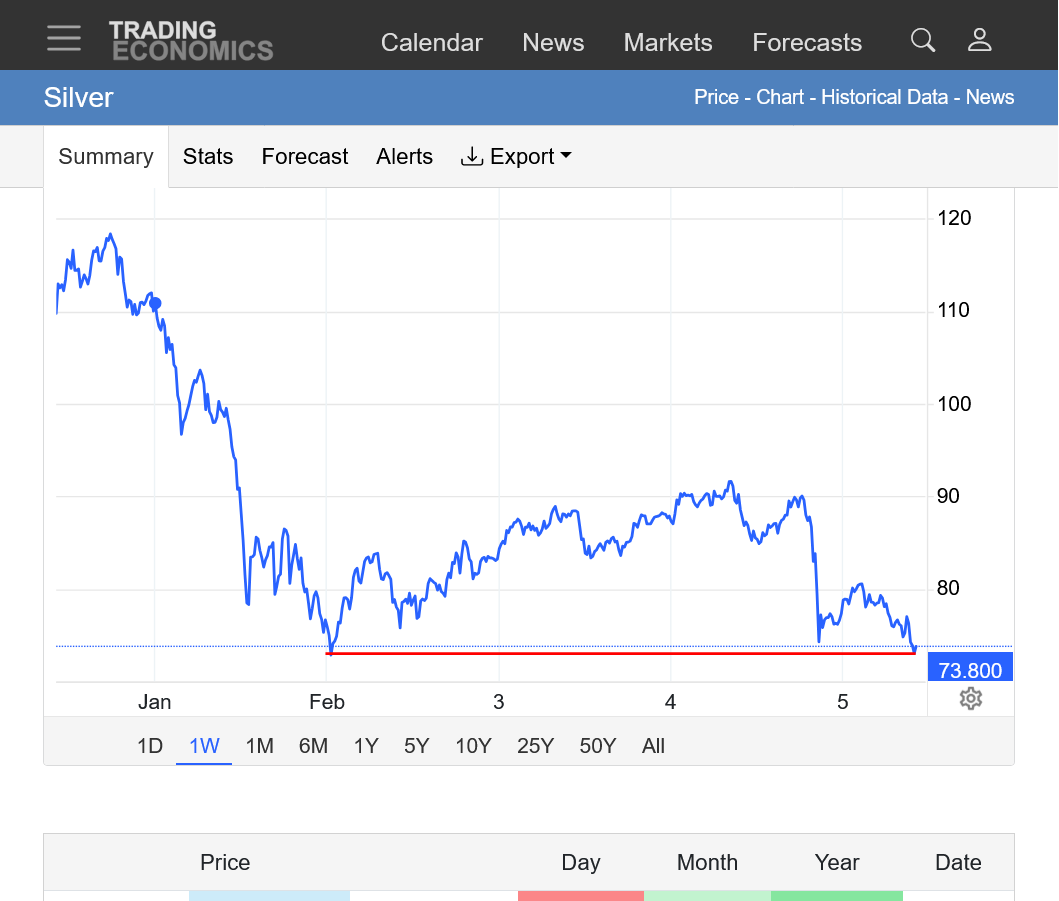
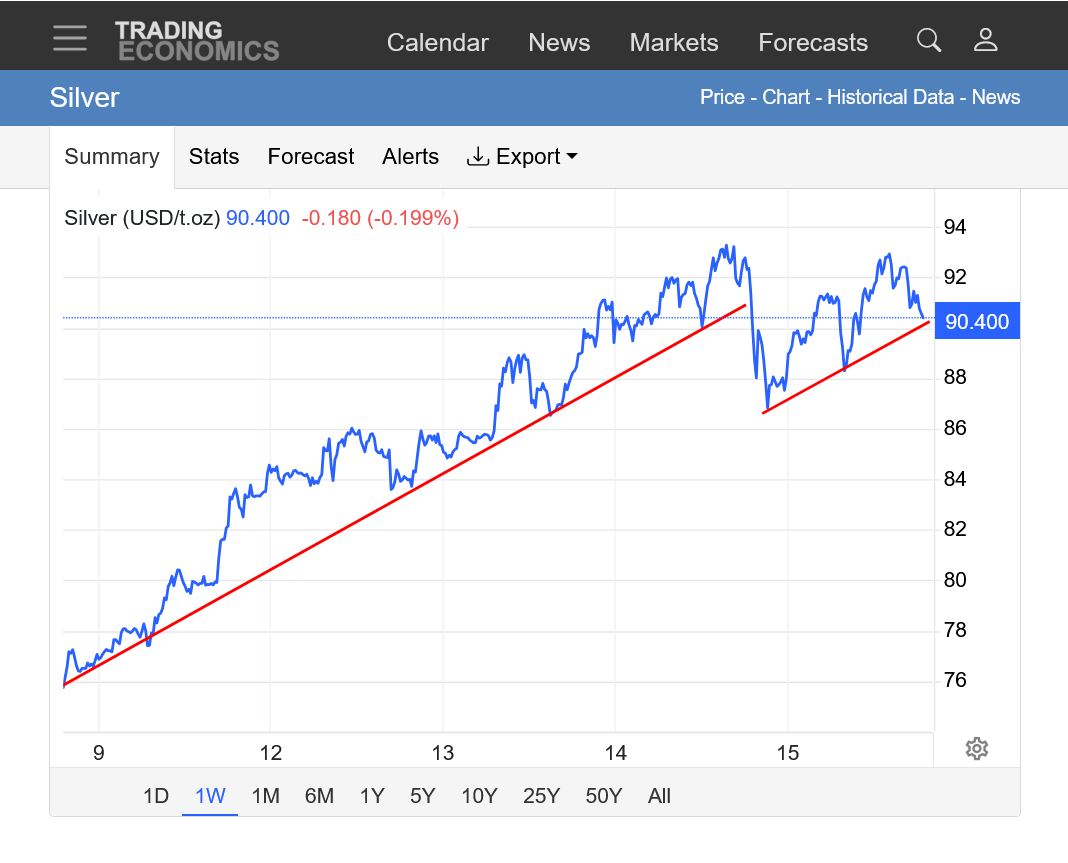
https://tradingeconomics.com/commodity/silver
1. 1 week
2. 1 month
3. 1 year
EXTREMELY unprecedented move down in a market that has had an unprecedented move up.
Incredibly, prices are still higher than they were to start January/2026! The graph below is only for January.
https://tradingeconomics.com/commodity/silver
I have the low at 74.00! One would have to assume that was THE top based on almost every MAJOR top, chart analysis in history.
https://tradingeconomics.com/commodity/silver
Thanks, JOJ and met, but victory laps mess with my mind and my trading. These kinds of moves don't happen very often. Need to focus now. Focusing on gold. There are some short trade possibilities. But watch for the secondary top. Not a trade recommendation. JMHO
These moves usably end with an outside day down.(Thursday, confirmed by Friday's bar) But I have seen false breaks.
Just my observations over the years.
What a day, cutworm! Great comments!
The source I use was unable to properly capture the low of 74.00.
1. 1 week below: I drew lines of resistance, including a small double top/retest, and a secondary, previous high that held on the retest after the outside day you mentioned but honestly, when it was happening, like the previous X times, it just seems like another bull flag/wedge which is a continuation formation.
A parabolic/exponential move can't go on forever but its almost impossible to know exactly when its over until we have a day like this.
Lot's of bears trying to pick the silver top got beat up the last several months. Some of them watched today from the sidelines.
This takes some of the excitement of tracking the metals away but as you said, the important thing, exactly as you stated is to have a clear mind and no ego/emotions in any markets that you/we trade.
By fayq - Jan. 30, 2026, 4:49 a.m.
Now mkt lower =---silver and gold--------->> so--!!
+++++++++++++++++
No doubt this is our post of the week!
fayq was the first person to alert us very early about the drop in silver and gold BEFORE the rest of the world knew what was about to happen!
Cutworm
Covered my zsl calls today at a profit, unfortunately bought them Wednesday, not Thursday, and sold a little earlier than optimal this morning----a profit is a profit!
Bought slv calls
What are your current thoughts?
I'm looking for a secondary high to get short. the secondary high almost always comes. When it does it is a good time to be short. I have gld trend line support tomorrow at 416. I won't risk much on these day trades. But once I think the secondary high is in it will be time.
I'm trading gld,and gll depending on if long or short. Got out Friday of gld. Was short via gll for day trades Friday and Monday.
A true setup like this seldom comes around. I've traded this set up in beans and cattle years ago.
JMHO
Congrats, tjc,
Covered my zsl calls today at a profit, unfortunately bought them Wednesday, not Thursday, and sold a little earlier than optimal this morning----a profit is a profit!
Please explain what this is/how it works. It's obviously a trading product that positions for a move lower since silver was trading above 110 when you bought it on the 28th and was trading closer to 80 when you covered today.
What caused you to choose it?
ZSL is a short Silver ETF
The fund seeks to meet its investment objective by investing under normal market conditions in any one of, or combinations of, Financial Instruments (including swap agreements, futures contracts and forward contracts) based on the fund’s benchmark.
In The Money
| Contract Name | Last Trade Date (EST) | Strike | Last Price | Bid | Ask | Change | % Change | Volume | Open Interest | Implied Volatility |
|---|---|---|---|---|---|---|---|---|---|---|
| ZSL260220C00001000 | 2/3/2026 9:43 AM | 1 | 1.05 | 1.00 | 1.05 | -0.55 | -34.38% | 889 | 3,917 | 240.63% |
| ZSL260220C00002000 | 2/3/2026 9:47 AM | 2 | 0.30 | 0.25 | 0.30 | -0.38 | -56.72% | 1,048 | 19,879 | 159.38% |
| ZSL260220C00003000 | 2/3/2026 9:48 AM | 3 | 0.08 | 0.05 | 0.10 | -0.16 | -66.67% | 3,205 | 31,596 | 179.69% |
| ZSL260220C00004000 | 2/3/2026 9:46 AM | 4 | 0.05 | 0.00 | 0.05 | -0.04 | -44.44% | 94 | 28,698 |
Both gold and silver have made 50% ish retracements.
What's next??
Thanks, cutworm!
I note that Gold is just over 10% off the highs but Silver is just under 30% off the spike high. Maybe just a function of silver getting way overloaded with spec longs that were vulnerable for a steeper drop which was inevitable at some impossible to predict point in time with a parabolic move higher.
As an observer and analyst, for sure this is much less entertaining than the first time we hit these levels, going up as amazing, ground breaking unprecedented events.
I'm betting alot of the speculative trading programs see it different too.
At least those that buy new highs/add to positions.
Your question of "what comes next" is a great one. Did this drop take silver down close to its intrinsic value? Will end users step in to buy or have these extremely high prices started to take a toll on demand?
I posted earlier on the impact for people in the plating world and their customers. Silver is inelastic to a point but these prices have gone beyond that point.
Projections for even more silver demand from AI and renewable energy(solar panels) are important.
If silver ramps up the cost of solar panels too high, we have a substitute............fossil fuels and plenty of them still in the ground.
Sorry for the delayed response.
Cutworm is exactly correct in his post.
At approximately 9;35est am today, I covered my slv calls and began buying Feb 20 ZSL calls (a 'bet' silver is headed lower.) Darn good 'thing' I did not wait much longer, as metals are dropping again.
As mentioned, the retracement was about 50%. So I got a nice POP long into perceived resistance, and reversed to being bearish by BUYING a neg ETF ZSL. The 'beauty' of zsl is that it is CHEAP, unlike AGQ puts. In other words, I can trade at a comfortable level (same with SLV calls).
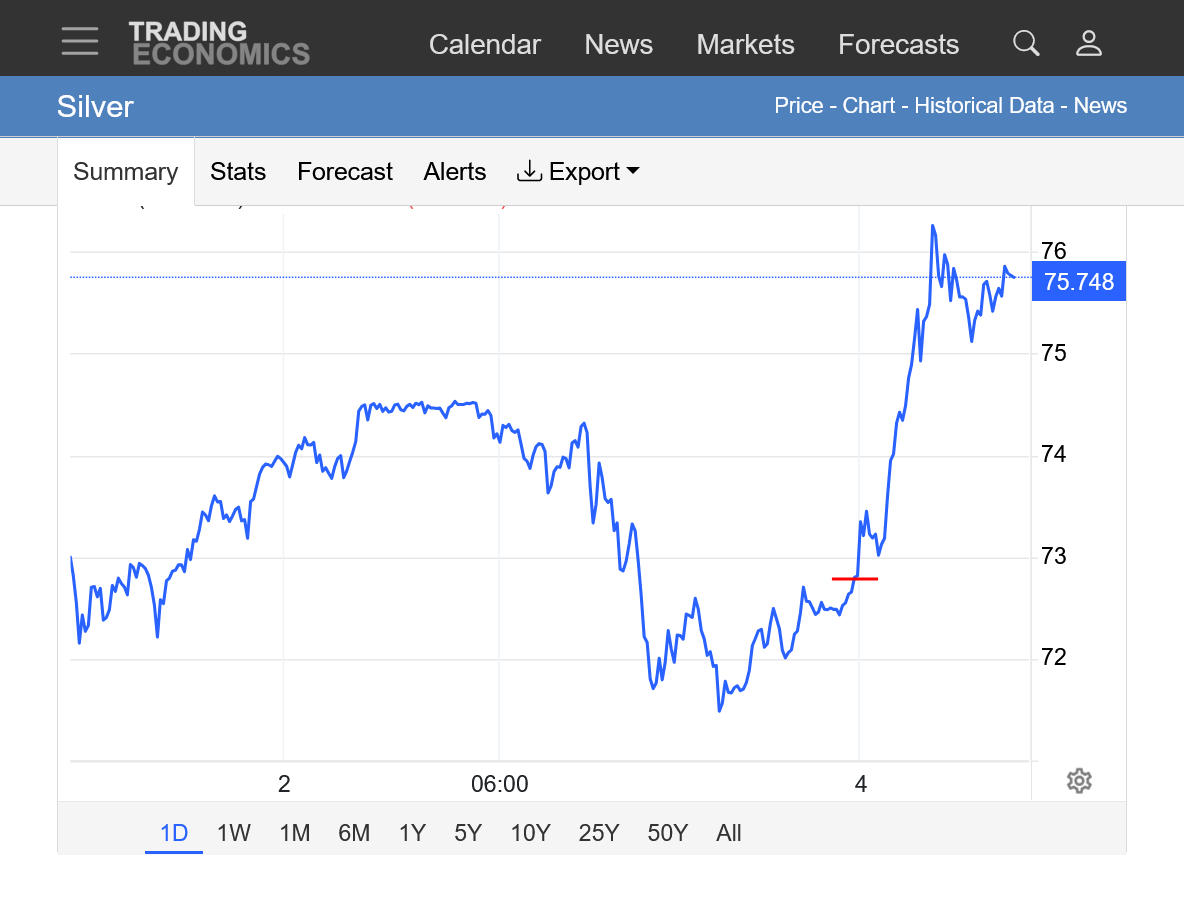
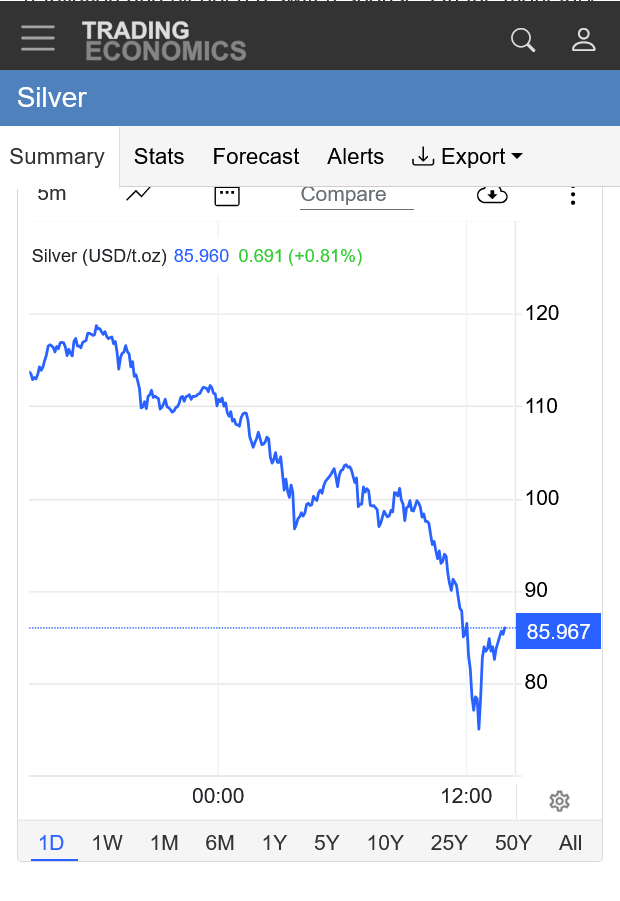
At 7pm, something caused silver to collapse lower, giving up every tick of the 3 day recovery in 3 hours!
https://tradingeconomics.com/commodity/silver
1. 1 day
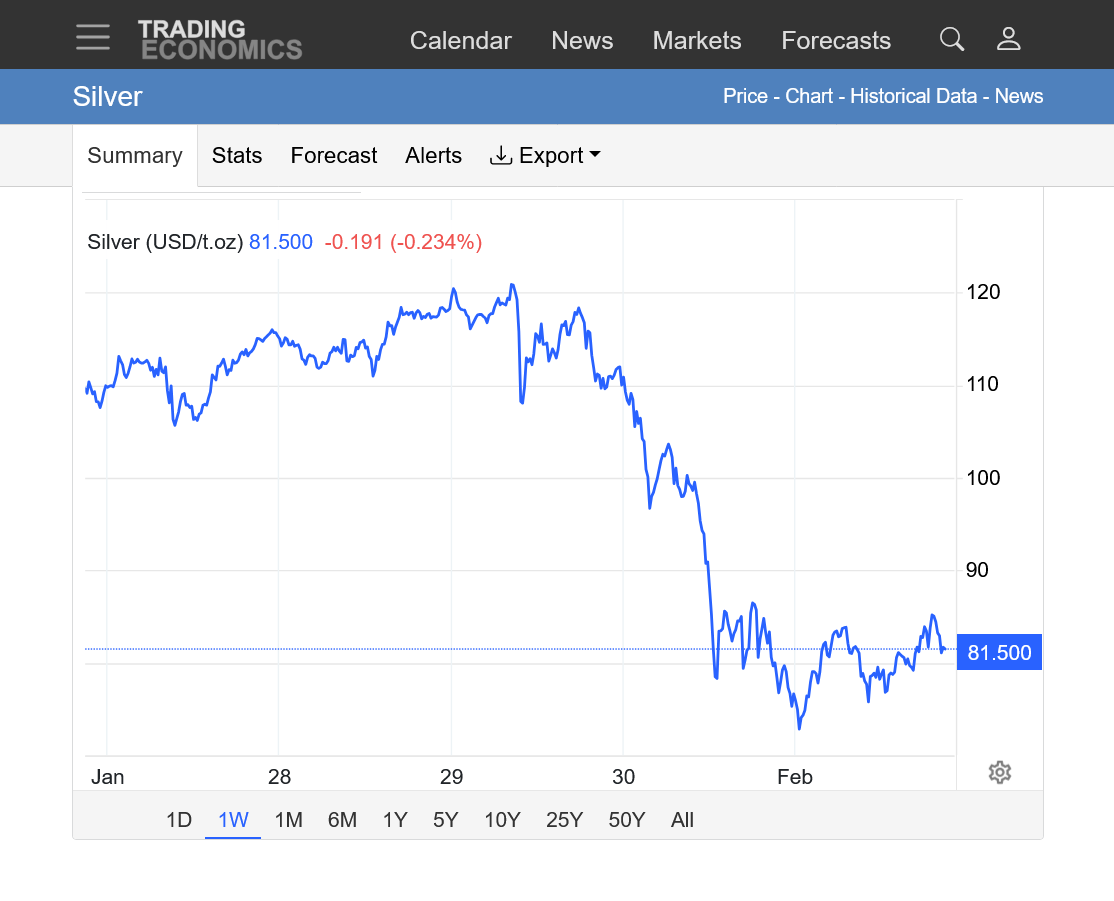
2. 1 month: At major support, 2026 lows. Will we hold?
3. 1 year: Breaking to the downside from a bear flag???(I wouldn't consider any chart formations here to be reliable, although this is an area of strong support. Breaking below it would be pretty bearish.
4. 10 years
Barely holding on to the lows after the historic crash lower!
Good morning, MarketForum
MetMike is correct, no "new" lows, but dangerously close to breakdown, which I believe will happen overnight this Thursday night/Friday morning. Frankly, looking for a low in mid 60s Monday
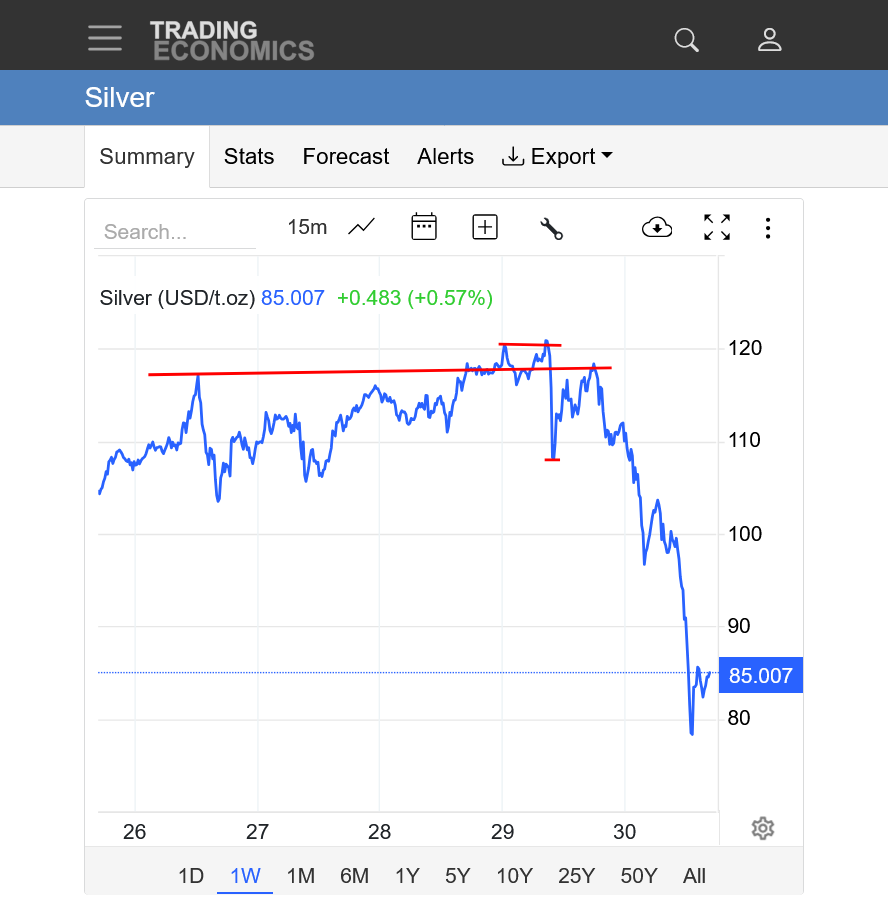
Silver broke thru overnight and spiked down but has reversed back up today. Now just barely above it. Powerful sign of a potential low if we have a solid close higher/above this level today. Incredible volatility.
https://tradingeconomics.com/commodity/silver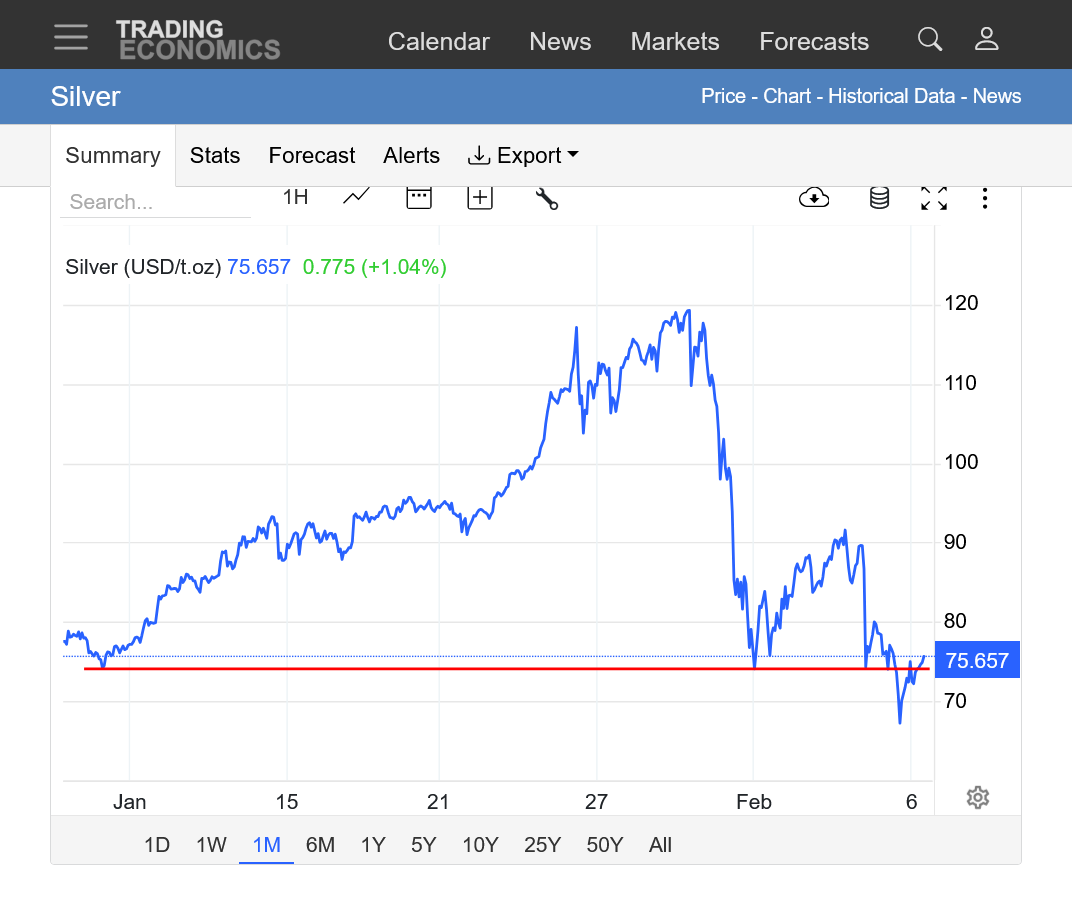
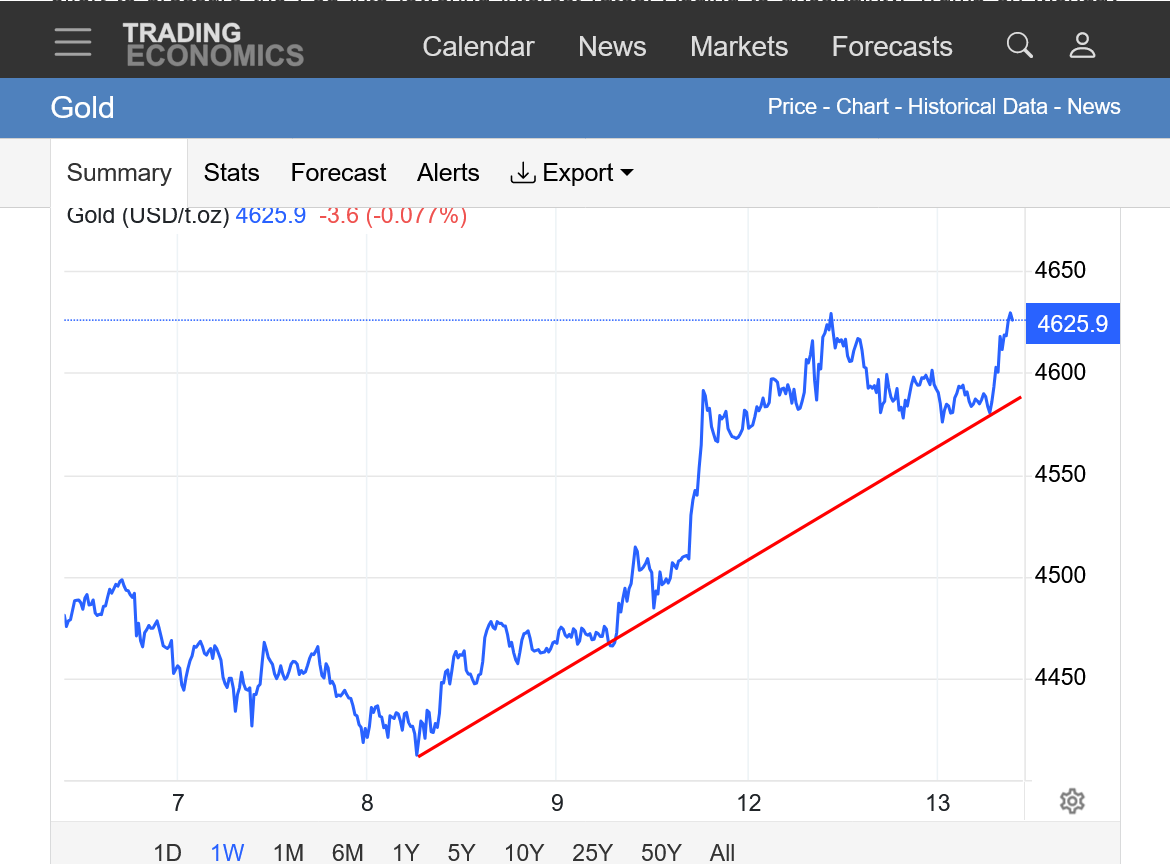
Gold on the other hand has not suffered nearly as much with the recent historic correct as silver. While silver spiked to new lows overnight, gold easily held the recent low and is looking BULLISH again on the price charts. Even breaking above a downtrend line from the highs, then 2nd lower highs and potentially establishing a new uptrend based on last nights HIGHER lows.
This could be an upside break out of a symmetrical triangle/wedge chart formation(higher lows + lower highs).
Regardless, after silver outperformed gold in 2025 by a wide margin, its been the opposite extreme after this historical top in both metals.
Silver down from 120 to 75(which is almost a 38% drop) but gold only down from 5500+ to just below 5000(11% drop).
https://tradingeconomics.com/commodity/gold
5000 could be some resistance? Then just below 5100/recent high. Above that, then it's clear sailing up close to the old highs. Looking sooo much more bullish/less bearish than silver. The magnitude of this divergence is NOT going to continue, maybe just a temporary thing from silver being so overdone and having less open interest when specs covered.
For instance, March silver has 80,500 contracts of open interest but April gold has almost 281,000, more than 3 times that amount.