Global debt has exceeded global assets by an estimated 12–14%, with total debt reaching nearly 330% of world GDP. Liquidity is now largely controlled by an unseen shadow-banking layer, creating synthetic leverage far beyond real economic output.
Roger Babson’s 5-stage collapse model places the world squarely in Stage 3 (“credit strain”) with Stage 4 (“liquidation”) likely emerging in the second half of 2026. August 2026 is a critical convergence month due to historical cycles, Japan–US yield divergence, astro-quant timing, and Gann price-time geometry.
Silver’s behavior confirms rising recession, stagflation, and hyperinflation tail-risks. Market microstructure (O’Hara) and volatility clustering (Engle) show a fragile system where small shocks can cause outsized systemic reactions.
In short: 2026 is mathematically and structurally positioned for the most significant financial stress event since 2008 — possibly echoing 1929, 1979, or 2000 depending on the path of yields.> /? just my 2 c3nts
Fayq,
This is extremely profound and relevant.
Its definitely another post of the week.
silver
8 responses |
Started by cutworm - Dec. 19, 2025, 8:51 a.m.
https://www.marketforum.com/forum/topic/116644/
+++++++++++++++++++++++
https://www.marketforum.com/forum/topic/116644/#116772
By metmike - Dec. 25, 2025, 10:24 p.m.
Wow!!!
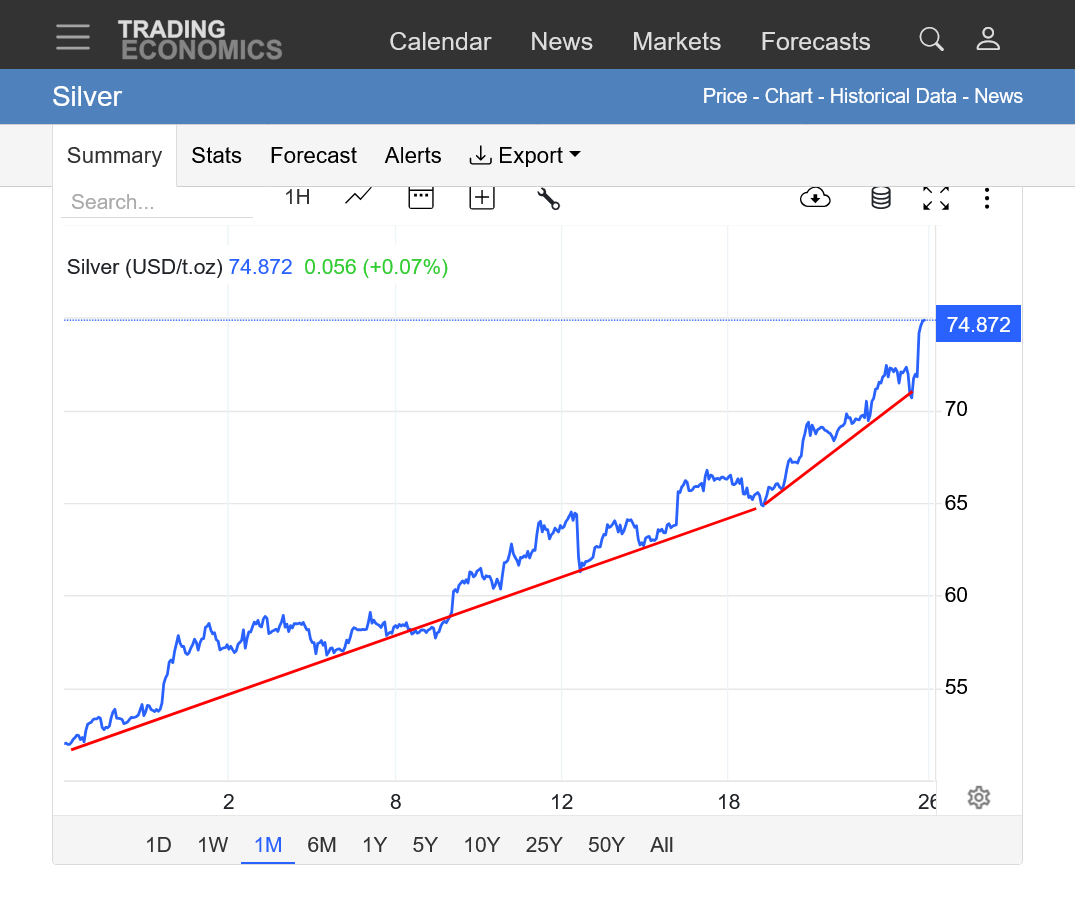
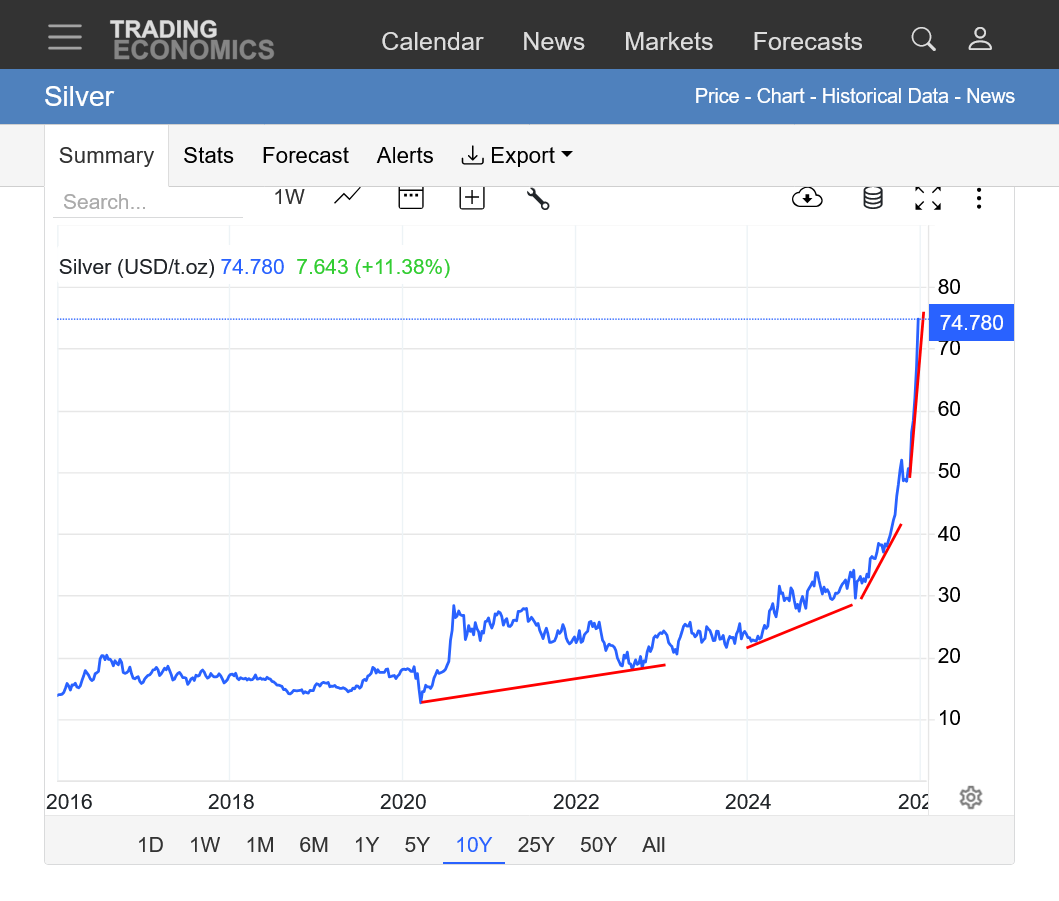
https://tradingeconomics.com/commodity/silver
1. 1 month
2. 10 years: You rarely see a price chart like this. True exponential/parabolic move with rapidly steepening slope. This is not a look back at a very rare move higher. Its one that is happening right now in real time.
+++++++++++++
Silver update:
$125 billion in 5 days: Fed quietly floods banks with cash again — what’s going on?
Yes — there are some important caveats. Extra liquidity doesn’t mean banks will suddenly take bigger risks. Much of the cash is precautionary, helping banks navigate short-term stress rather than fueling new investments.
The Fed’s balance sheet and quantitative tightening measures also put limits on how much cash can stay in the system long-term. If reserves continue to decline or funding markets face shocks, the system could still experience pressure.
Another risk is that liquidity injections can eventually contribute to inflation if sustained over time. While the immediate goal is stability, too much cash in the system over a longer period could push prices higher, creating a tricky trade-off for the Fed.
Finally, the “hidden plumbing” of financial markets — including repo markets and interbank lending — is complex. Even with injections, any disruption in these channels could spill over broadly, affecting more than just banks.
The first thing to monitor is bank reserves. If they continue to fall, pressure on banks may increase, leading to more Fed interventions.
Second, keep an eye on short-term funding rates like repos and reverse repos. Sudden spikes can signal stress returning to the system.
Third, pay attention to Fed statements. Any change in language around liquidity, “ample reserves,” or policy tightening could indicate upcoming shifts in strategy.
Finally, watch government debt issuance. Large Treasury sales can pull cash out of the banking system, putting additional strain on liquidity. How markets respond — particularly risk assets like stocks or crypto — can also give clues about investor sentiment.
Here is the picture of that primary strategic tightening, generally called QT. QT stands for quantitative tightening, the opposite of QE. QT means tightening – or reducing – the quantity of money in the financial system.
Here is that chart:

Here is the chart of the reverse repo. That mountain of cash represents the excess liquidity created when the Fed printed vast sums during Covid lockdowns to prevent an economic collapse:

That process appears to be in play again – and this chart, while not the SRF itself, is an indicator of emergency funds being injected into the financial system right now. It’s pretty surprising, not to mention scary:

In my view, this is what is rattling the market right now and stopping it in its tracks. Money flow drives prices, and when the river of money dries up, bullish moves dry up with it.
Basically, we are in a financial crisis – one that’s being handled in such a way that the only thing we see is a wobble in asset prices. In the old days, before this level of regulation existed, the market would have crashed. Instead, the system is being propped up with liquidity, and we get jitters instead of a collapse. It’s a nervy place to be.