For the new year, we all get for ourselves a present, a new NG thread to give our finger(s) a break. :) Yay!
The 0Z models look mild so far. This isn’t what I want to see as I always prefer the SE brand of refreshing, clean, crisp cold with low dewpoints. It’s my favorite walking wx! In the meantime we’ve had a refreshing cool to cold 12/29-31 and tomorrow should also be pleasantly Canadian though with the inevitable warming trend.
Thanks very much, Larry and Happy New Year again up here on the trading forum!
You‘re right about the new GEFS, yet another -8 HDDs warmer than the last much warmer 18z run.s
Previous threads:
NG 12/14/25-12/31/25
55 responses |
Started by WxFollower - Dec. 14, 2025, 2:51 p.m.
Hey Mike, the warm changes on the Euro weeklies (based on extension of 0Z EE) for Jan 5-18 vs how they looked early in the week are large.
Thanks much, Larry!
Ill take a look at those on my IPad while watching the Rose Bowl.
The Canadian model continues to be MUCH colder than the other ones.
The last 12z GEFS was another -3HDDS. The EE was +3 HDDS.
5pm: I see exactly what you pointed out. Thanks!
Indiana up 17-0 at halftime!
Mike,
Congrats on the Hoosiers obliterating Bama! Otherwise, the Rose Bowl has been boring/zzz.
Are you surprised that NG opened down only 1.5%? Why wouldn’t it have opened further down? Is it a low volume session? Is it oversold?
Thanks, Larry,
That was a wonderful win for the team that leaped to greatness from nobodys faster than any college football team in history.
Within seconds after natural gas opened, it dropped $400 so maybe the usual traders on the open, waited a few seconds before selling.
The last 0z GEFS that just came out, took away 4 more HDDs and is looking less cold in week 2. The models have continued to get less cold all week.
And the upward trajectory in week 2, which was the only bullish part of the forecast is backing down again at the very end of the period.
The Canadian model by far is still the COLDEST at the end of the period, especially this last 12z run!!!
The solution below is for 384 hours out(16 days)
https://weather.gc.ca/ensemble/charts_e.html?Hour=384&Day=0&RunTime=12&Type=gz

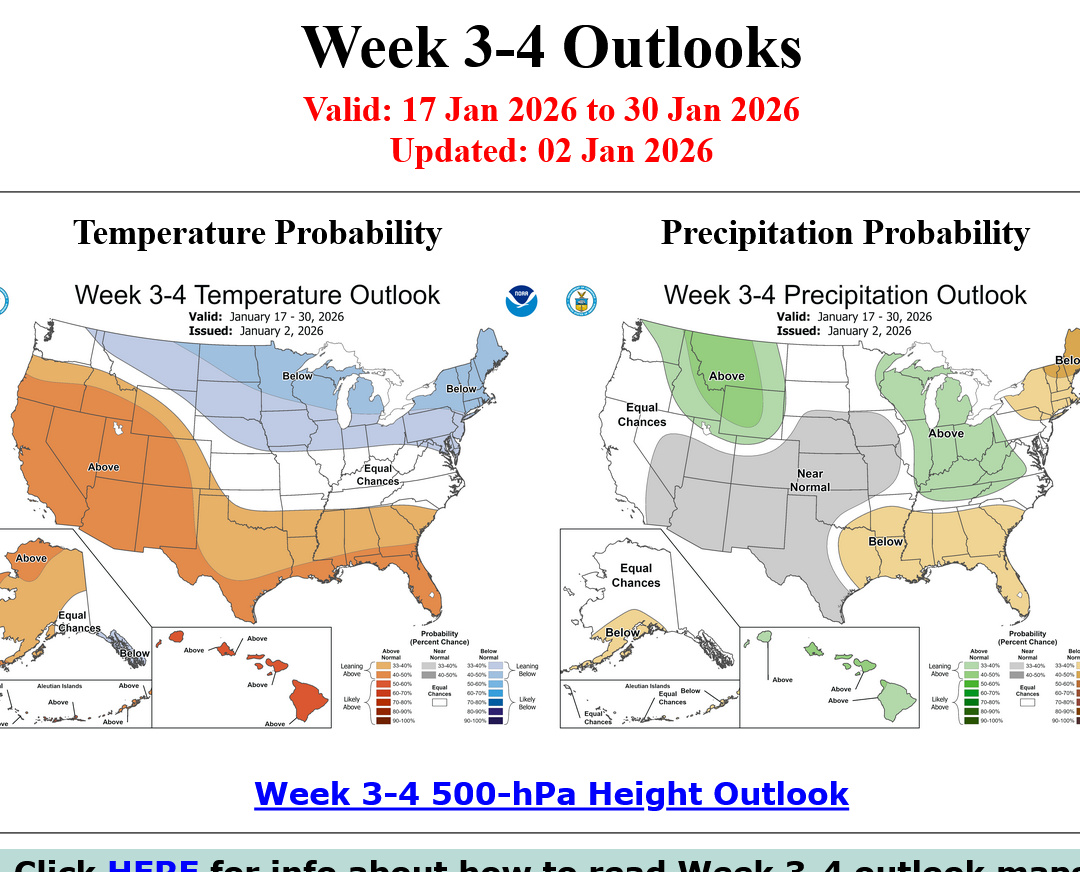
The NWS week 3-4 forecast is pretty cold in the northern 1/3rd of the country. Skill at this time frame is low but I buy this.
I would almost be tempted to be long a few contracts over the Weekend, except the models have consistently been too cold all week. If this continued over the weekend, NG would likely open sharply lower on Sunday and anticipation of that would WRECK my enjoyment of the last 2 days of the long holiday.
https://www.cpc.ncep.noaa.gov/products/predictions/WK34/
+++++++++++
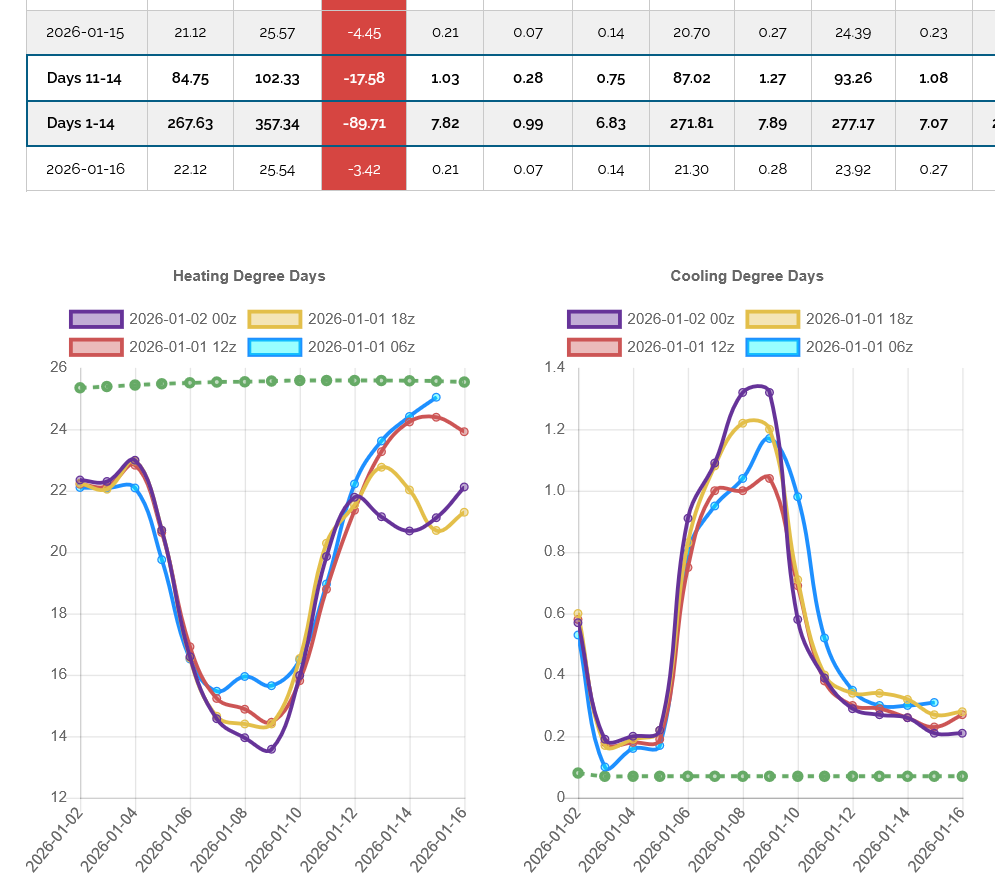
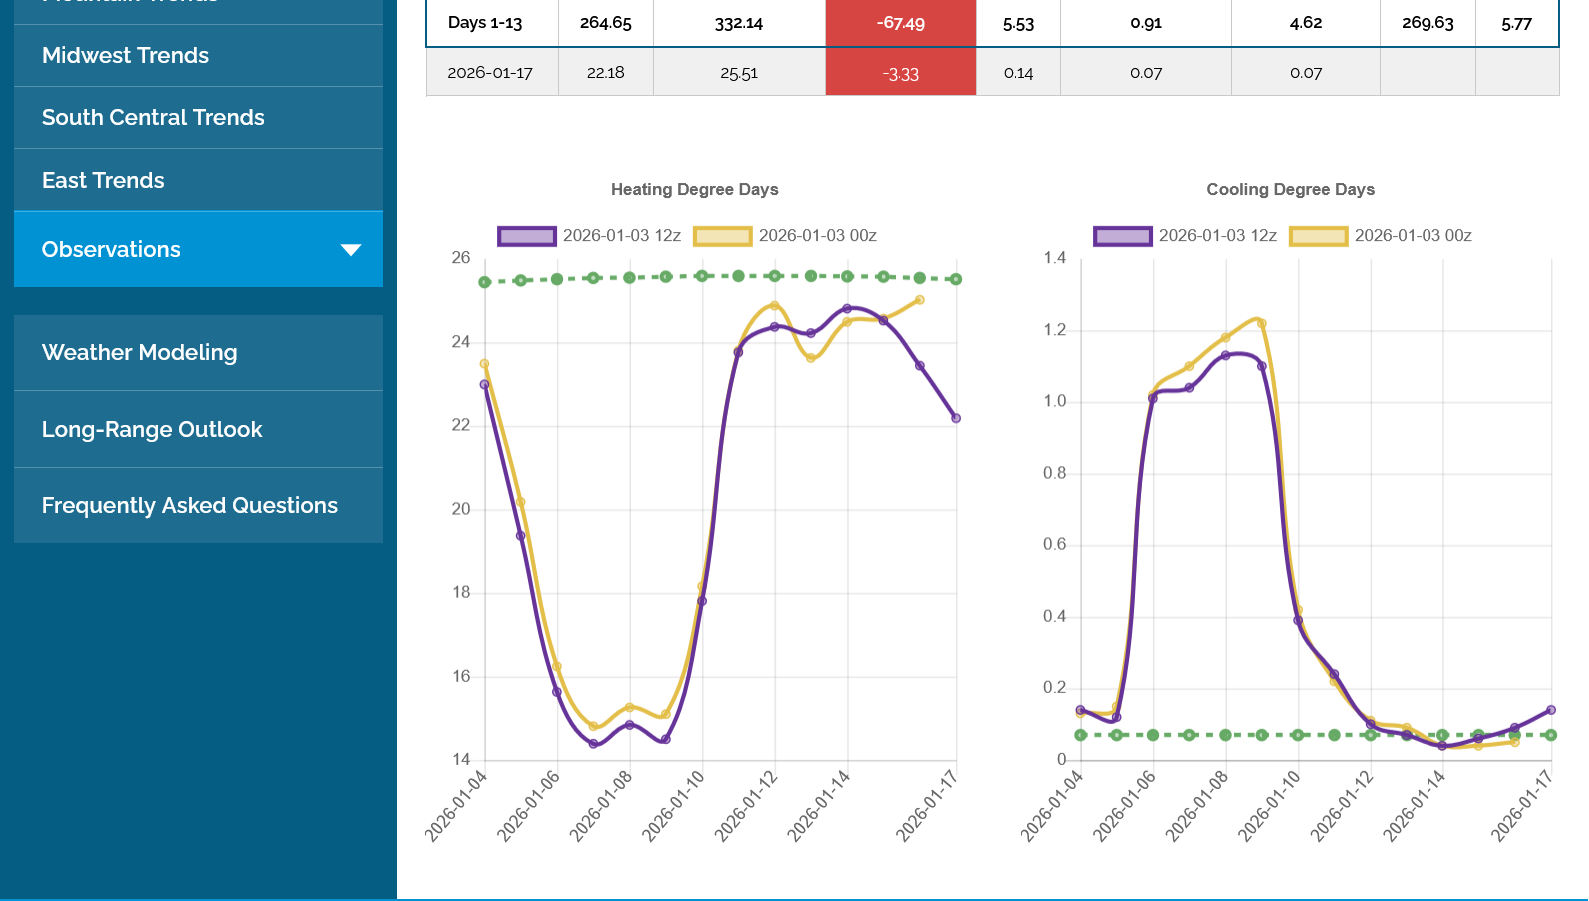
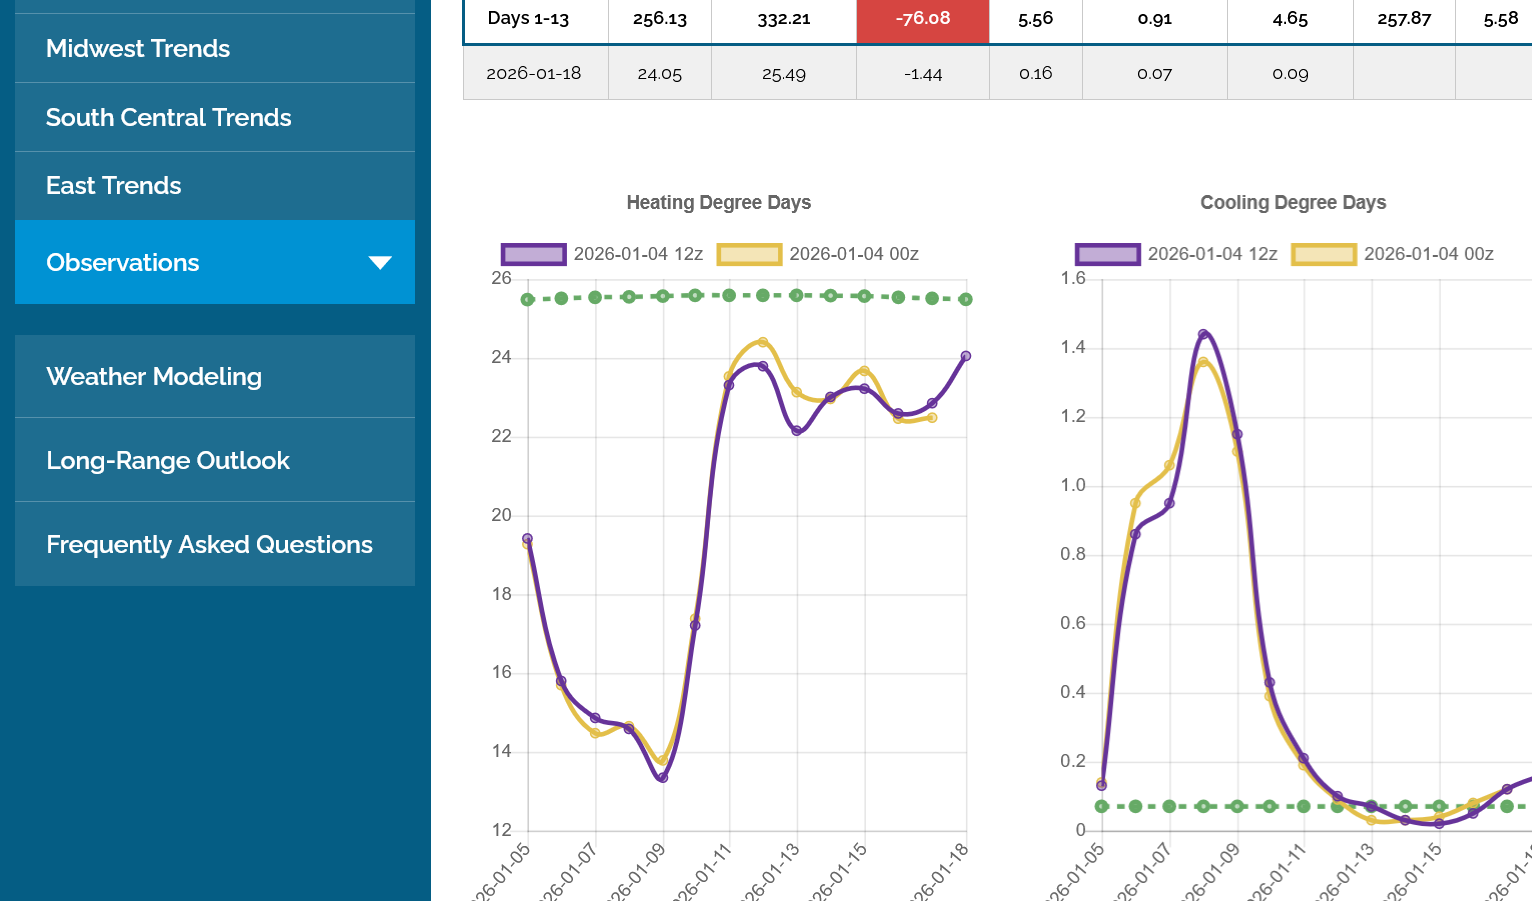
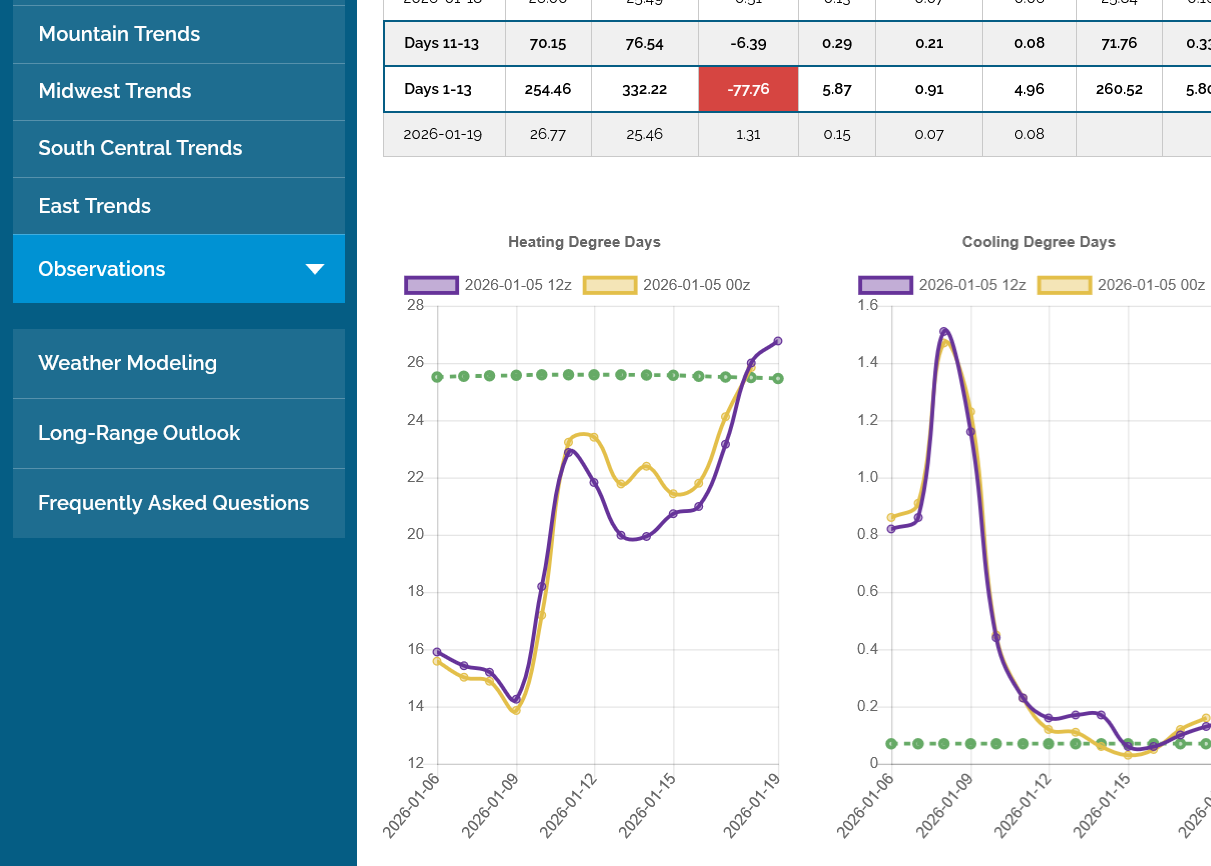
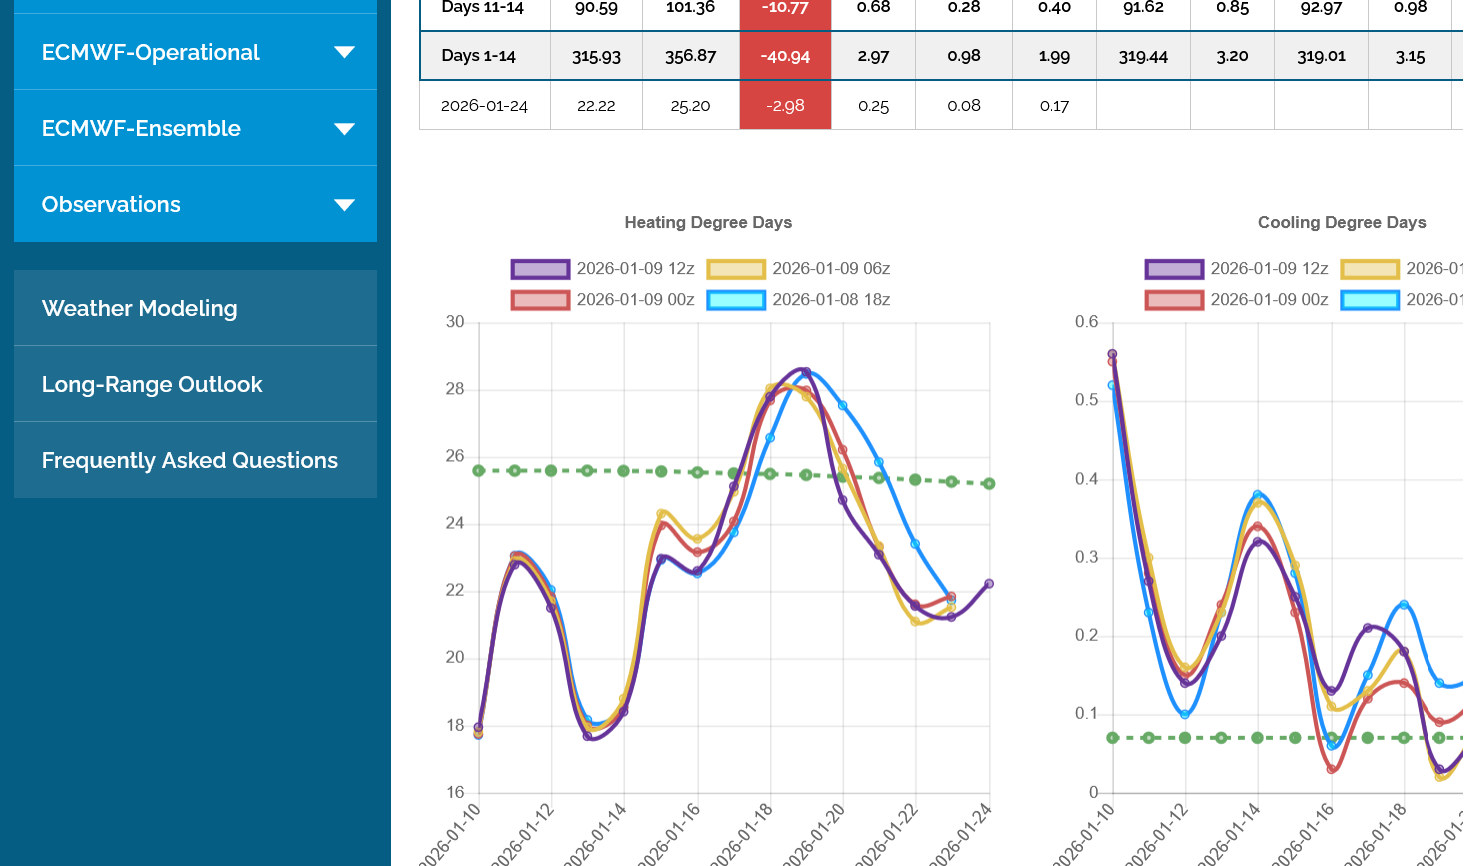
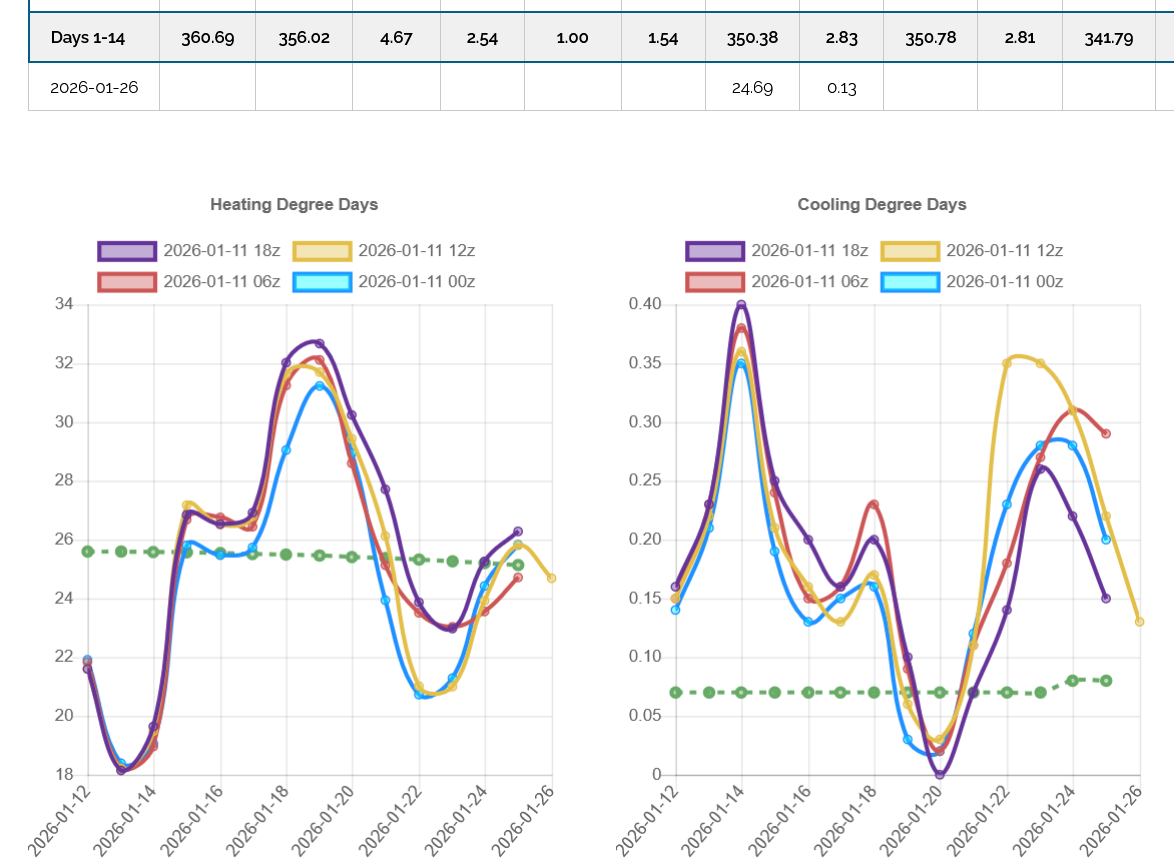
This was the last 12z European Ensemble Mean model. Purple/left. Yet another -5+ HDDs(bearish/milder) compared to the previous run. Also, the trajectory for the last 4 data points is DOWN/MILDER which is the wrong direction for the bulls.
The green dashed, average temperature (climatology) has made its yearly peak and starts to drift lower(less colder) during week 2 of this forecast period.
This happens when Winter is over half over!
Hey Mike,
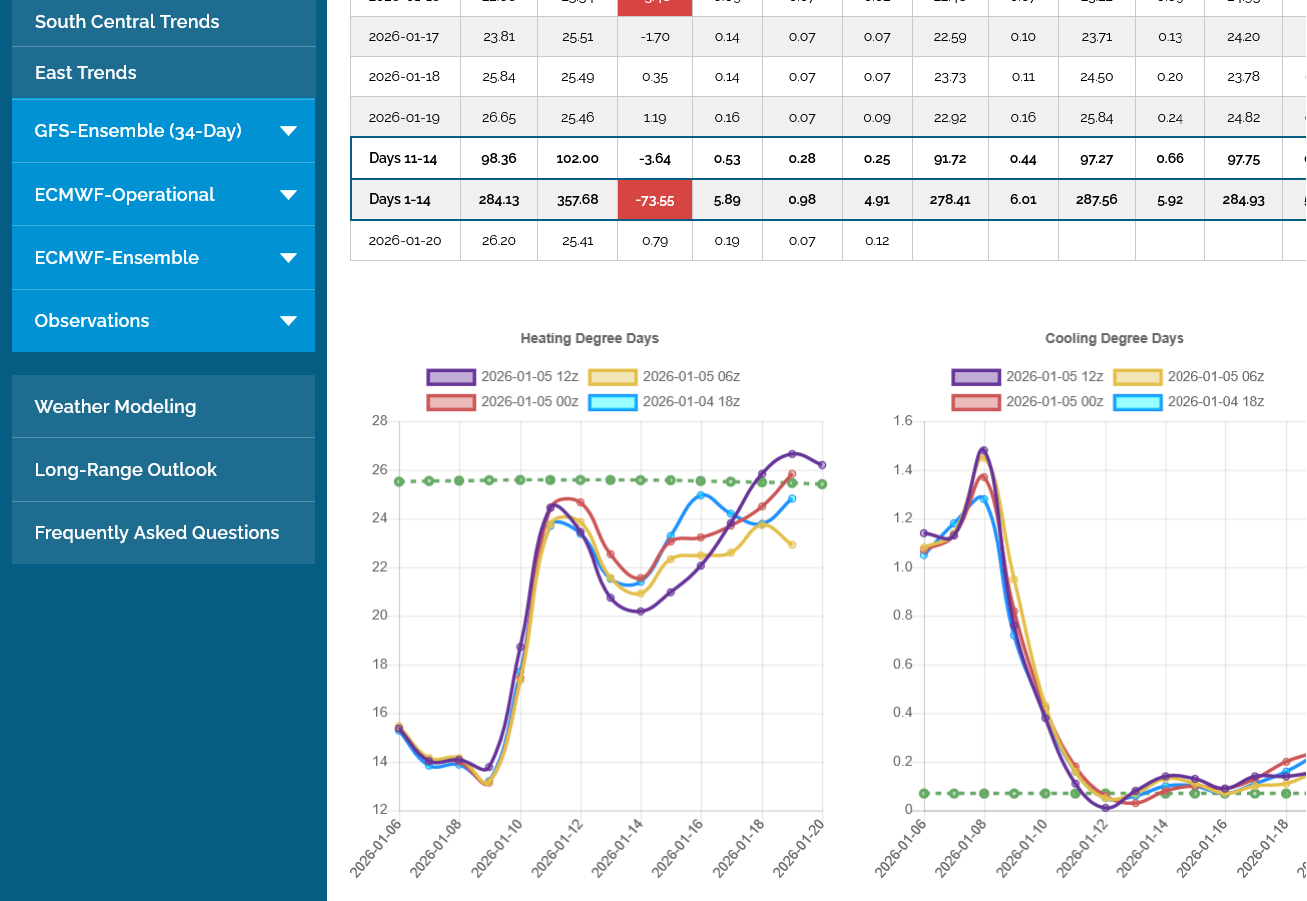
Per my eyeballs, the GEFS total HDDs increased by a very large amount between the 0Z and 18Z runs today due to a significantly colder week 2 in the E 1/2 of the US. Check out this change for week 2: could easily be a rise from 0Z run to 18Z run of 35-40 HDD for the E 1/2 of the US for week 2! (Week 1 changed little):
Not surprisingly, the SW warmed during the same period and thus lost sig. HDDs. That area could have lost ~21 HDD. However, the warming wasn’t nearly as sharp overall as the East’s cooling (~1/2 as sharp) and that area has much less weight (much less pop. density and only ~1/2 the area). Thus, it appears to me that there could easily have been a net US HDD rise from the 0Z to the 18Z run of as much as 25-30 HDDs.
Mike, if you get a chance, please post the 0Z-18Z GEFS HDD charts. If you can’t, please don’t worry about it.
The models have been getting colder which I suspected might happen when considering being long over the weekend.
1.The last 12z European model in purple bucked the trend with a drop at the end but was still a bit colder than the Friday solutions.
2. The last 18z GEFS in purple/left below that was the most bullish yet. Spiking above the average HDDs line in green for the first time in the last week.
NG would be trading HIGHER if it were open right now!
Mike, Holy Twilight Zone!!!!!
What are the odds that I posted about the much colder GEFS literally ONE MINUTE before you posted about it and the colder EE. We were typing at the same time.
Is that insane?!?!
My last sentence was this as you can see:
“Mike, if you get a chance, please post the 0Z-18Z GEFS HDD charts. If you can’t, please don’t worry about it.”
And you did it one minute later not having any idea that I had posted just before you!!
———-
*Edit: So, now I have my answer! HDD rose on GEFS by 24 from 0Z to 18Z vs my guess of 25-30.
Spock - Fascinating!
https://www.youtube.com/watch?v=cFods1KSWsQ

https://www.youtube.com/watch?v=ul-Ed4CcDxs
++++++++++++
Larry,
You're extremely good at estimating the HDDs from looking at surface temperatures on updated weather model forecasts. For others here, this is a population weighted metric so that cold in high population regions of the East, South and Midwest for instance add many more HDDs than cold in the Plains/Rockies where the population density is much lower.
Larry might be typing up his next post right now
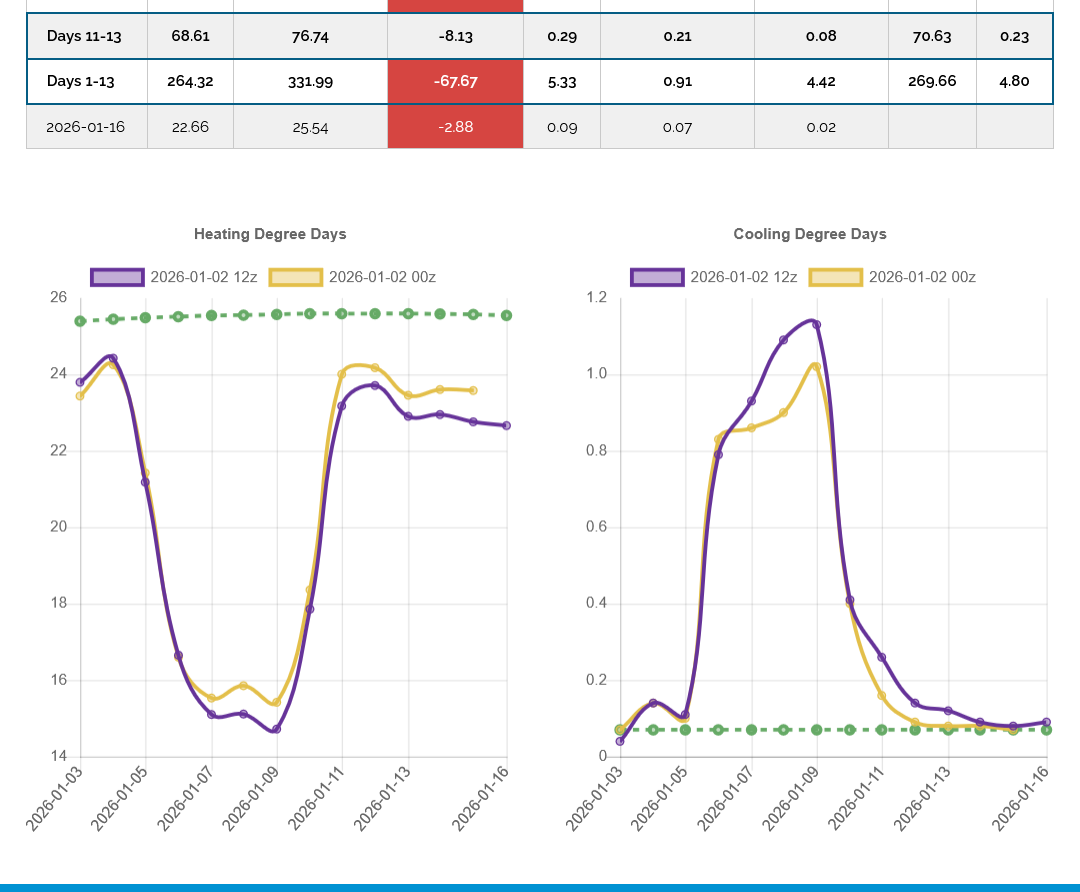
Regarding HDD's the GEFS runs, after turning colder and peaking with Saturday's 18z run, flipped back to milder and back closer to Friday's solutions.
This last 12z run was a whopping -18 HDDs/bearish compared to that 18z run which was an outlier, in blue on the left.
The last 3 runs have been pretty consistent, being milder.
However, the 12z Canadian model continues to be the coldest, mainly because a significant minority have the Polar Vortex dropping unusually far south in Canada with a very deep/large, synoptic scale trough extending into much of the United States. The Canadian model solutions continue to be extremely bullish for natural gas!
This is the 384 hour solution, which is the start of week 3! The last 12z European Ensemble model
https://weather.gc.ca/ensemble/charts_e.html?Hour=384&Day=0&RunTime=12&Type=gz


+++++++++++++++++
https://weather.gc.ca/ensemble/charts_e.html?Hour=384&Day=0&RunTime=12&Type=pnm
This last 360 hour map from the 12z EE map has turned COLDER and has shifted a great deal towards the Canadian model. As Larry knows, the EE is usually the superior model and the LEADER, not the follower like this.
We should also note that there is a cross polar flow to many of these solutions. The coldest air on the planet in January is usually in Siberia. The biggest land mass in the high latitudes is Siberia. Along with darkness for 24 hours a day causing a net loss of heat with no solar gains that gradually brew the coldest air on the planet in the Northern Hemisphere's Winter. So SIBERIAN air masses, all things being equal(no air transport fro milder places) are the COLDEST.

+++++++++++++++++++++++++++++
3pm: This was the HDD map from that last 12z EE model. The line in purple is the last run that was a tad milder than the previous 0z run from 3 slightly milder days in week 2. It's at the very end and beyond that the colder 12z EE solution above would kick in.
We can see this week's incredibly LOW HDDs compared to the seasonal average in green. Next week, pattern change that dumps cold into the West then Upper Midwest, similar to the La Nina Winter signature will take HDDs closer to average. The green line starts dropping at the very end of the period with Winter's cold(HDDs) being half over.
Higher open?
I "almost" bought a call--my thinking, CONTRARIAN move coming!
BUY unch or lower??
What say you, Larry and MetMike!
Happy New Year, tjc!
Yesterday at this time, I would have confidently said a higher to much higher open(much) mainly because natural gas often over reacts on Sundays open.
The GEFS has backed off on the amount of cold and is closer to the way that it looked Friday at the end of the period.
However, after you asked this question, I took a another closer look at the end of the models (confirming the mild GEFS) but am especially struck by how much colder the EE looks than any of its recent solutions for the end of week 2.
There's a ton of uncertainty and wide range between model solutions that are not exactly consistent, except for the coldest Canadian model but I will go with moderately higher on the open and I would NEVER consider being short here, no matter what.
The main risk with being long is if we have another much milder run from the GEFS or especially the 0z EE, you'll get your clock cleaned.
And it will happen faster than I can post the model change here and often, even faster than I can react to while watching the models update in real time and trying to manage a position.
IS there time to buy open AND place a stop thereafter would seem to be the REAL question.
Stop would have to be 3.029 or lower?
tjc,
It looks like Natural Gas will open LOWER!
Again, my bullish enthusiasm is for something coming up in 2 weeks. If this was earlier in the Winter that might get more weighting by the market.
The market could focus on the next week of incredibly mild temps.
HUGE DOWN!
WAIT an hour and buy stop the high!
We not only opened lower but also GAPPED lower.
This will either be a downside breakaway gap if this weeks near record warmth bleeds into week 2(or the extended cold never gets here) or it will be a gap and crap selling exhaustion when the models get colder.
Since I am clearly very biased to the bullish side from the same set up that you recognize, I'm towards the gap filling when it turns colder and putting in a bullish chart formation.
The big gap lower is a huge negative right now and is a break away gap lower signature until that gap is filled!
This is why I dislike predicting Sunday Night opens and price action and clearly missed this one earlier.
What is the timing for next weather "run"?
WAIT an hour and buy stop the high!
Thanks, tjc!
That would work if the models all get colder overnight, then follow up with more cold after that. Also at some point the much colder weather will get closer and closer, replacing milder days this week(if the pattern change to cold is for real).
However, be aware that a much colder part of the GEFS or EE overnight has been known to cause a big spike up that breaks just above the highs, then goes back down if the remaining maps are not as cold.
Also, odds are decent that if we get above the highs, especially filling the downside gap, that the selling exhaustion formation on the charts means just that and it was because traders see colder weather ahead and have lost incentive to sell lower prices and gained MORE incentive to buy at higher and higher prices.
The 18z GEFS came out MUCH colder in week 2. I was long for awhile but got stopped out at around the price I bought at.
The 0z guidance was VERY cold at the end of the period. The lows are likely in!
Unless the models turn much milder=less cold in week 2, especially at the end.
The 6z GEFS is in fact coming out milder. Just over half way thru.
The milder solution lasted thru the end which saved the bears in the nick of time as we were about to fill the gap amd put in a gap amd gap selling achaistion signature.
instead all we did was test the bottom of the gap And opening last night and highs of the session.
The 12z models will matter the most. Now we’re below midpoint iof the trading range of the session And it looks like we spiked thru the lows from the milder 6z GEFS and bounced back above them.
By metmike - Jan. 4, 2026, 6:20 p.m.
+++++++++++++++++++=
The 0z models were in fact MUCH colder which caused NGG to spike up and trade 1 tick above the highs, where any buy stops would have been hit, leaving those traders long from the highs of the session.
When the 6z GEFS came in much milder, we crashed to new lows or the session but have recovered to mid range in a crazy, up and down session because of late period uncertainty in the weather forecast.
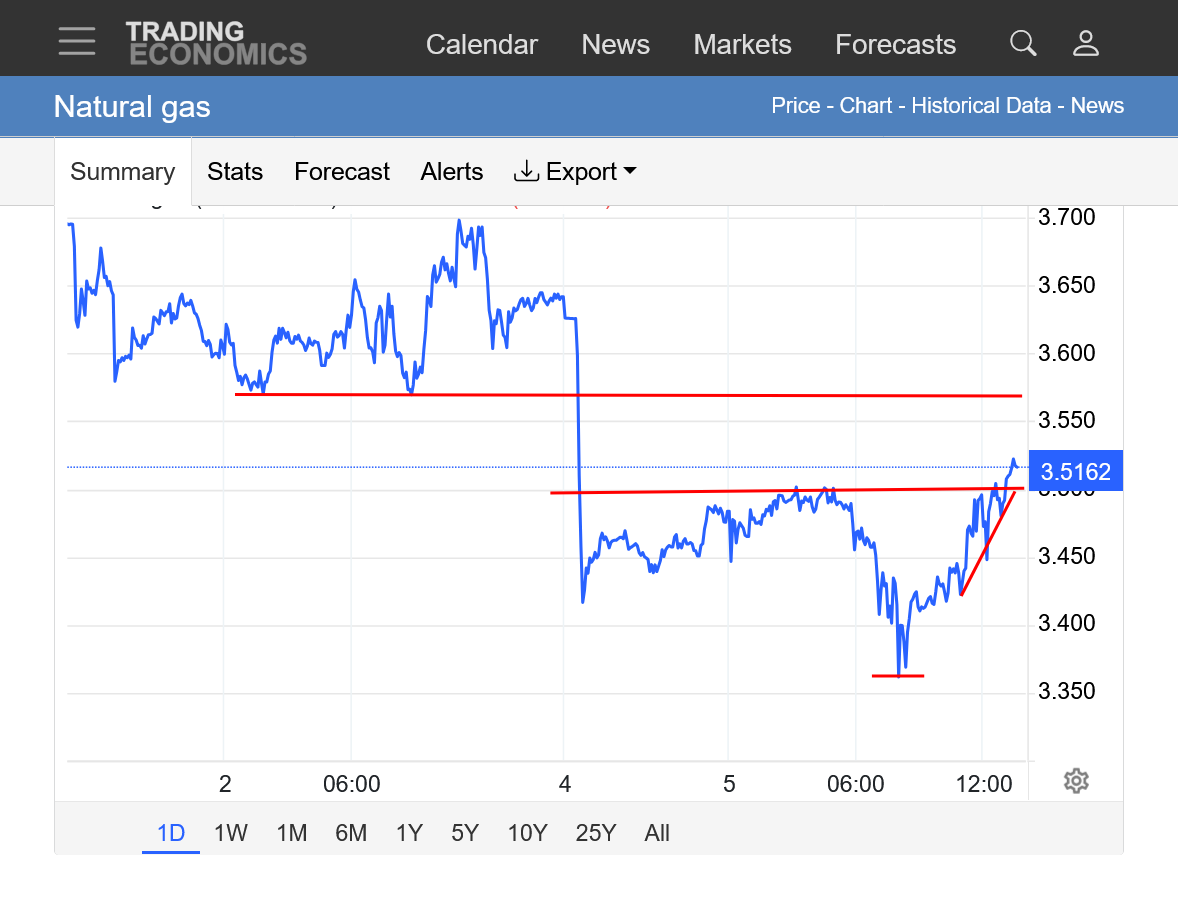
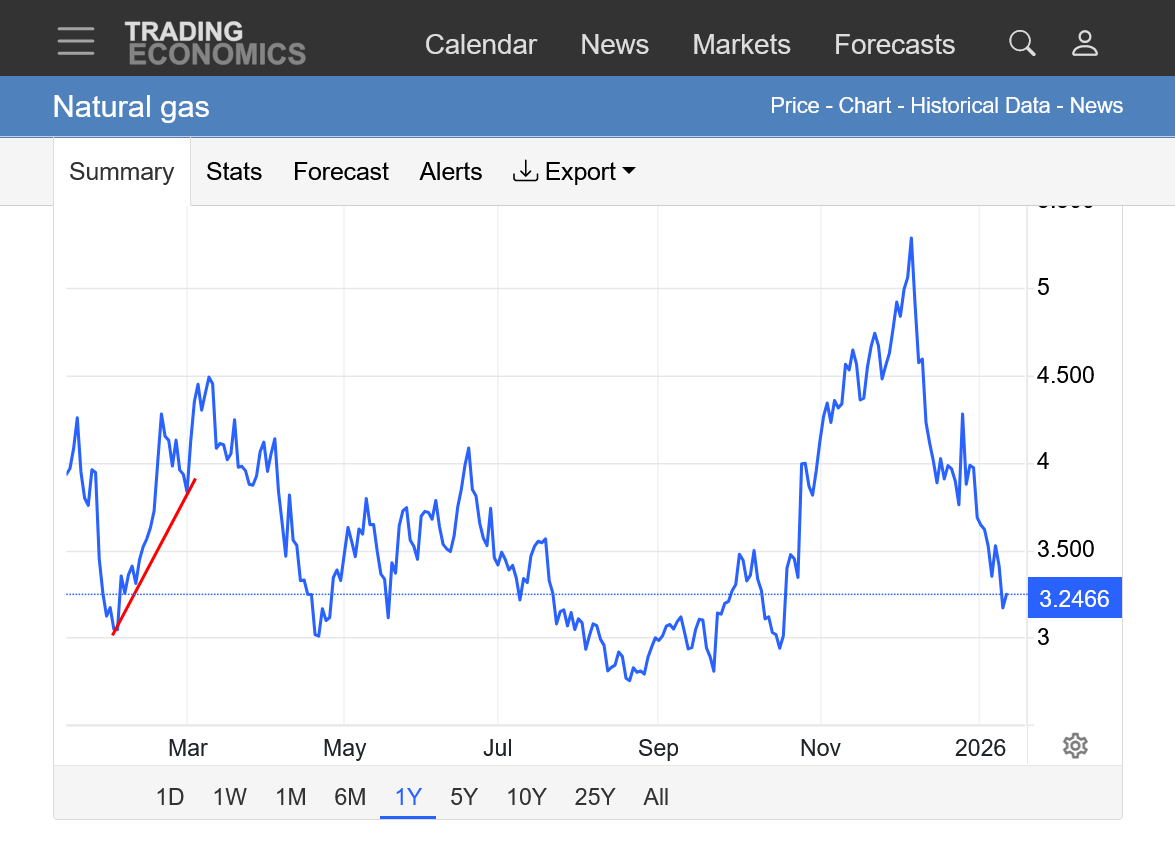
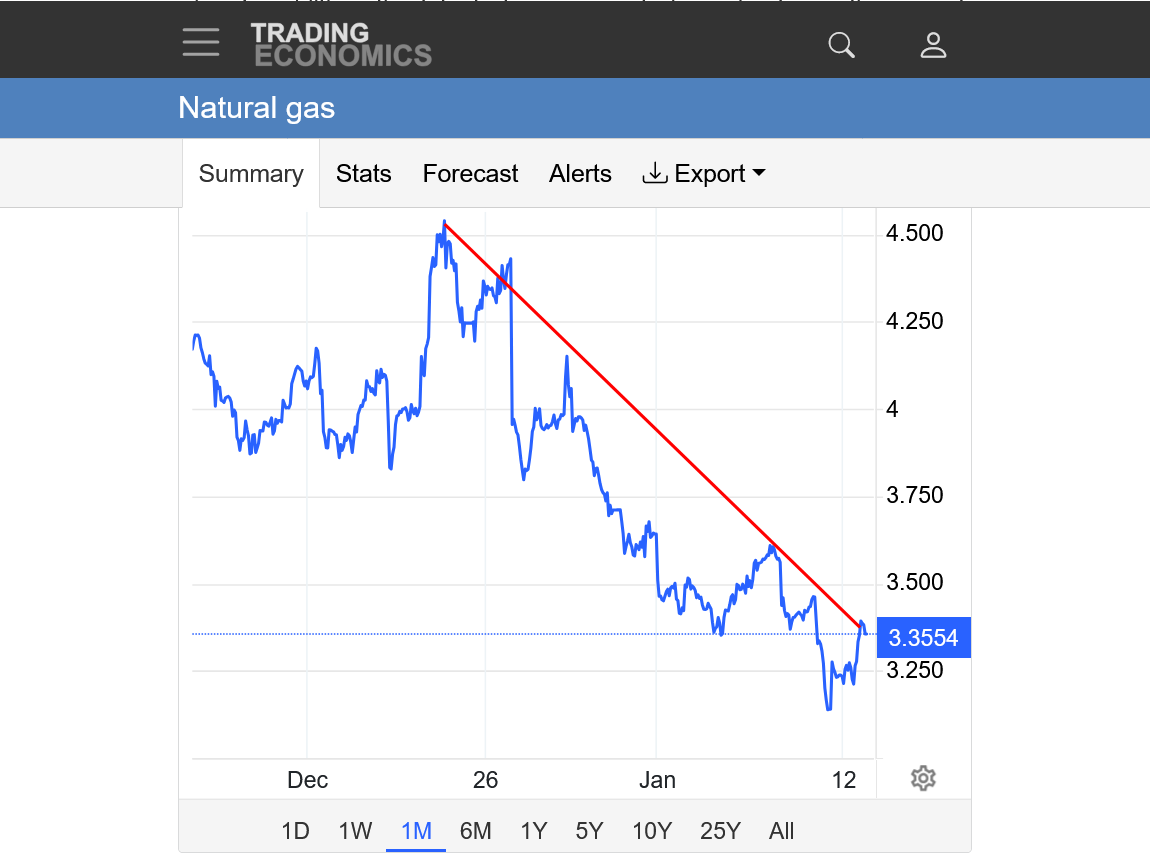
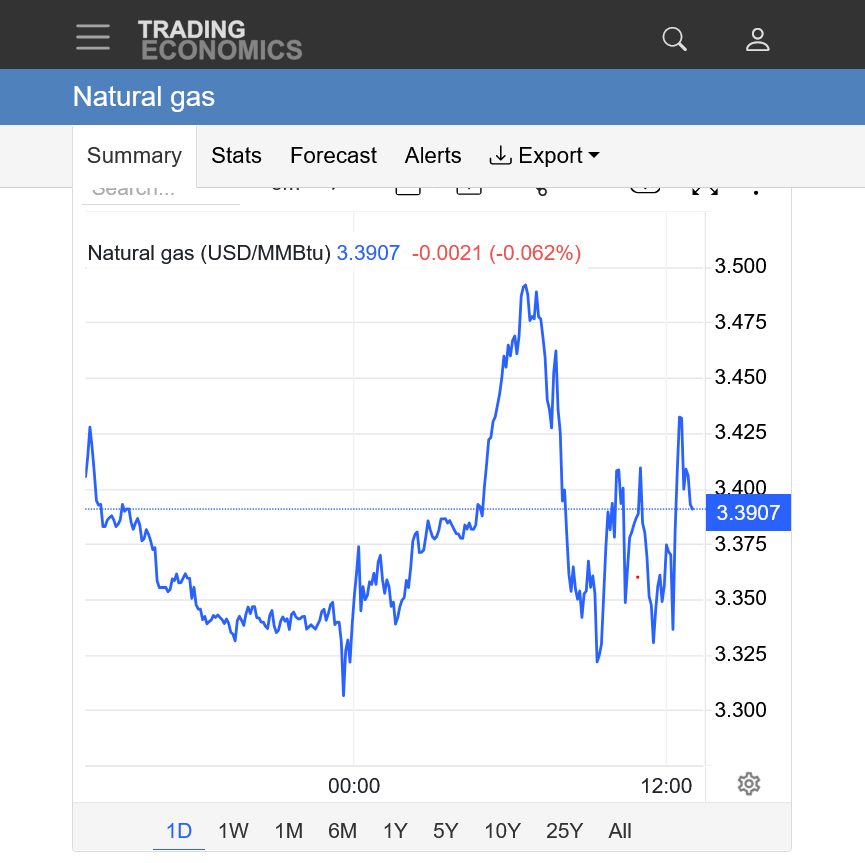
https://tradingeconomics.com/commodity/natural-gas
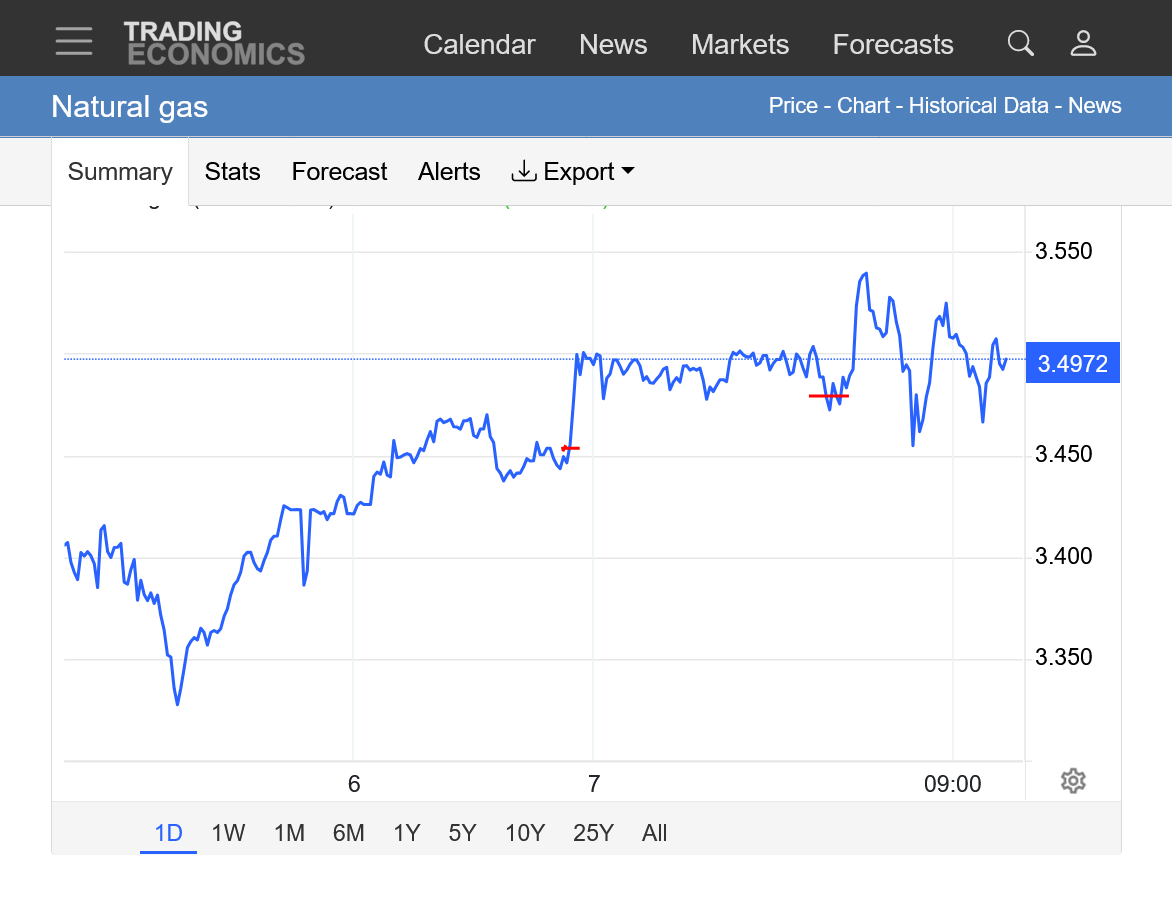
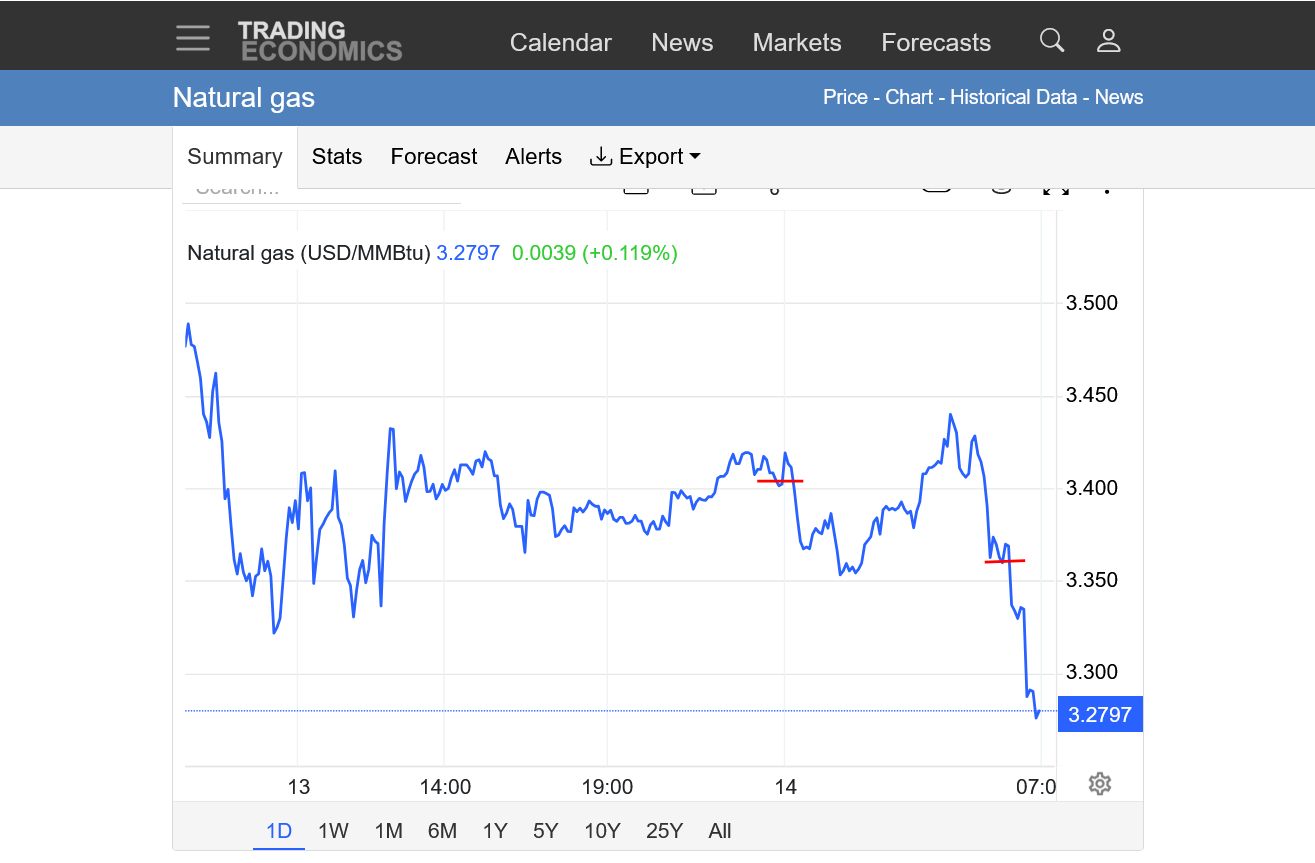
1 day: Big price gap lower on the open with Friday's lows and Sunday Night's open defined. Note that the price barely ticked above those highs after the 18z and 0z models were MUCH colder. Then the 6z GEFS came out MUCH milder and pressured the market to fresh lows that also could not hold.
2. 1 week: Every day last week the forecasts got milder and milder, pressuring the price lower and lower. Note the modest gap lower on the open on Sunday evening. The price action after that is best seen and described on the top graph.
The 12z GEFS was MUCH colder at the end o the period which spiked us to a new daily high again but we came back down, while holding most of the gains from earlier this morning.
The reason we aren't taking off like a rocket is that the12z EE had some very mild days in the middle of the forecast but it too, succumbs to the same cold solution at the end.
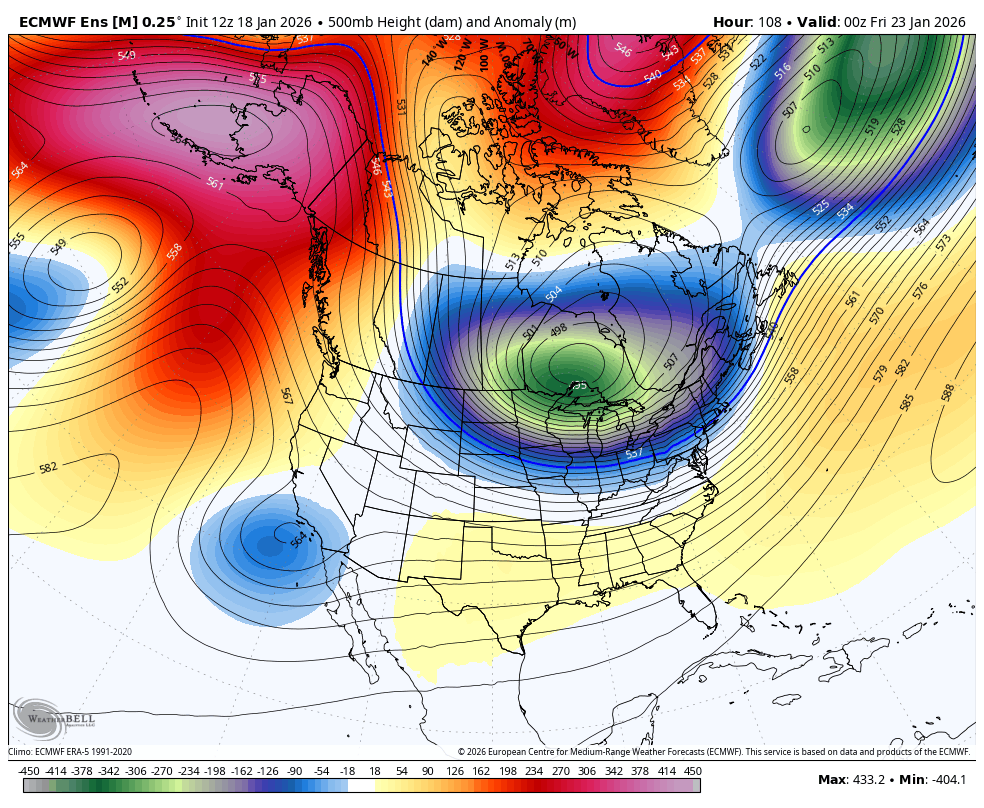
Below was the end of period 500 mb upper level height map with the height anomalies from this last 12z GES.

The last 12z EE model below is coming around to this same anomalous/cold solution too at the very end of the period. Amazing agreement, considering this is 15 days from now. The blocking ridge in the Southeast looks like it will be shoved out completely.

The Canadian model continues the most bullish. That's the POLAR VORTEX over Hudson Bay in Canada, displaced south of its usual spot in the Arctic, with a deep trough extending all the way to northern Mexico. Also note the cross polar flow which is bringing down air from SIBERIA, flushing it into Canada, then pushing it deeply in the US.
https://weather.gc.ca/ensemble/charts_e.html?Hour=384&Day=0&RunTime=12&Type=gz

If we had these same weather maps/forecast a month ago and even 2 months ago, natural gas would be up sharply instead of down modestly. With half the Winter being over, the big weather speculators are less incentivized to go long on cold because storage is in great shape and the comparisons to last year(when it was really cold in January) will be more and more bearish). The next several EIA reports will be bearish vs last year and the 5 year average before this mid/late January cold has a significant impact.
Regardless, the market can't ignore this much longer as it gets closer and closer with every model now in strong agreement. I think we will close the gap lower from Sunday's open and that will be a selling exhaustion signature on the price charts! Pretty high confidence.
We closed near the highs and eroded the far bottom of the gap today.
It's likely we will close the gap soon..........unless the models turn milder again.
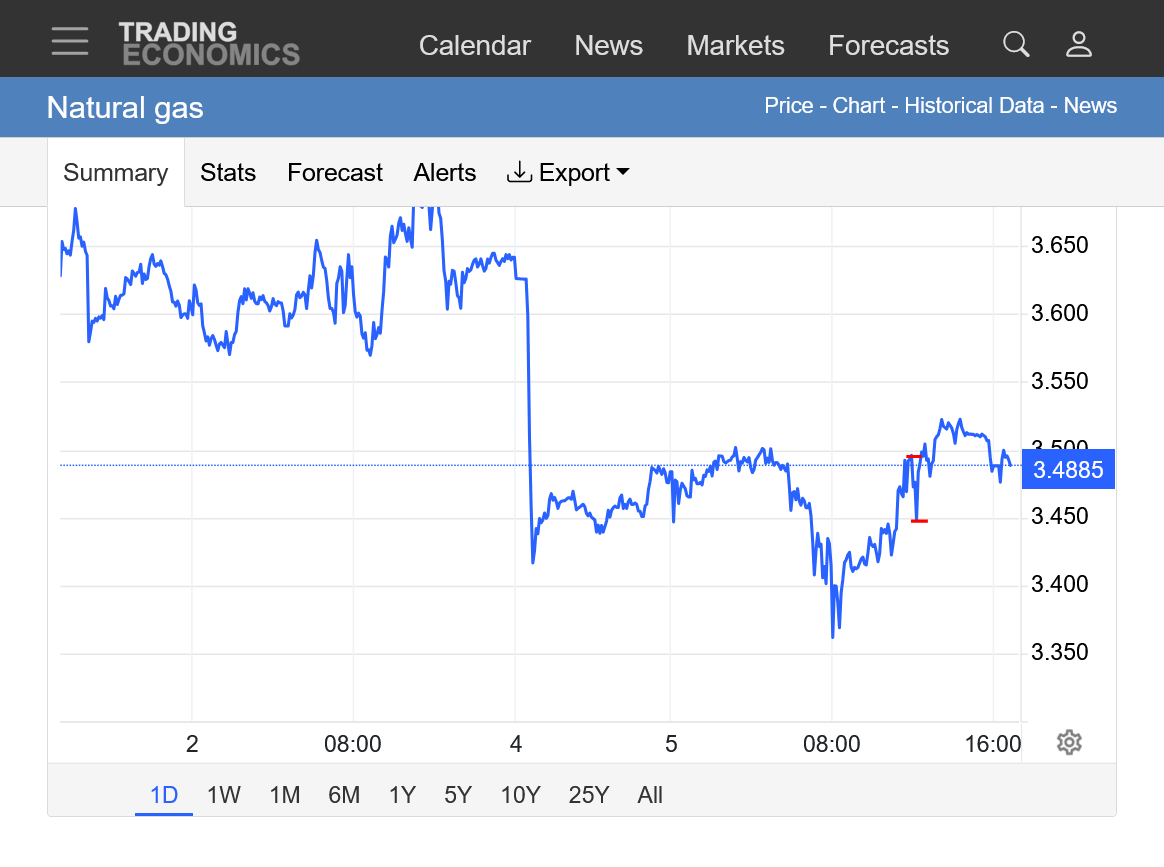
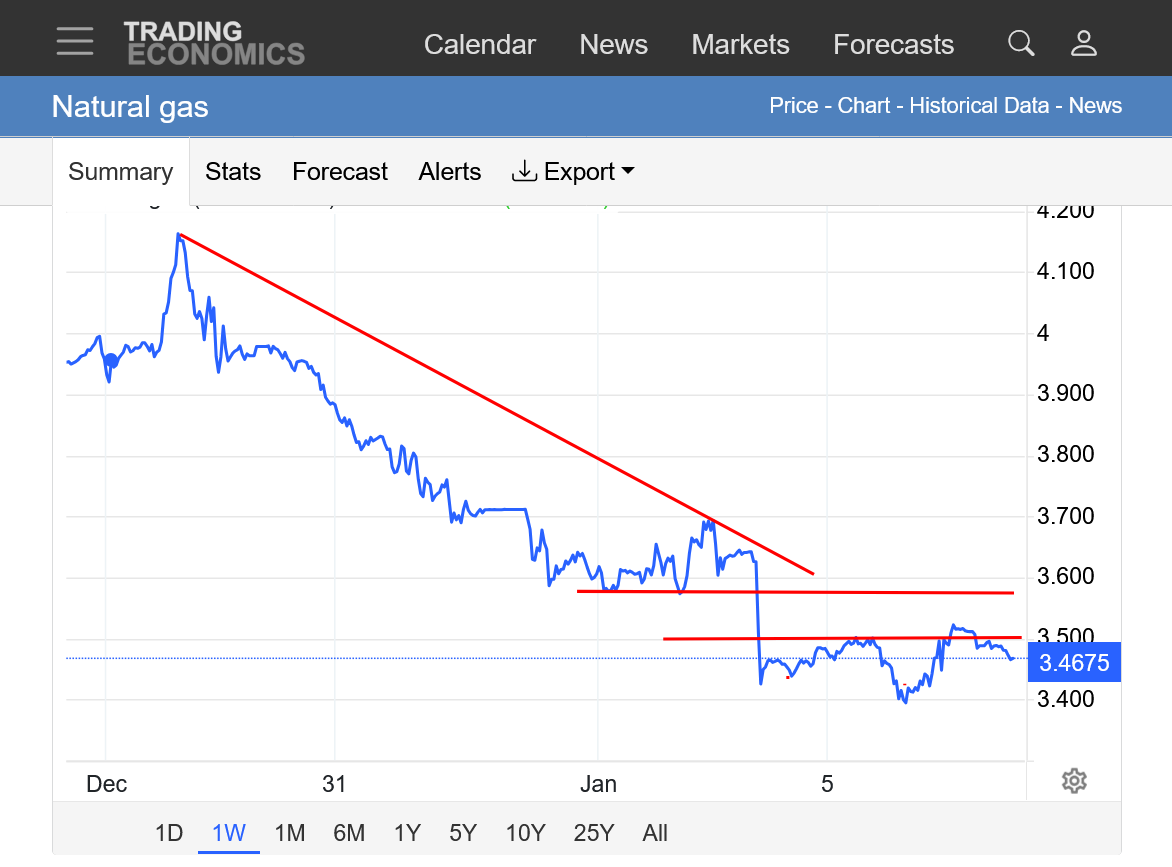
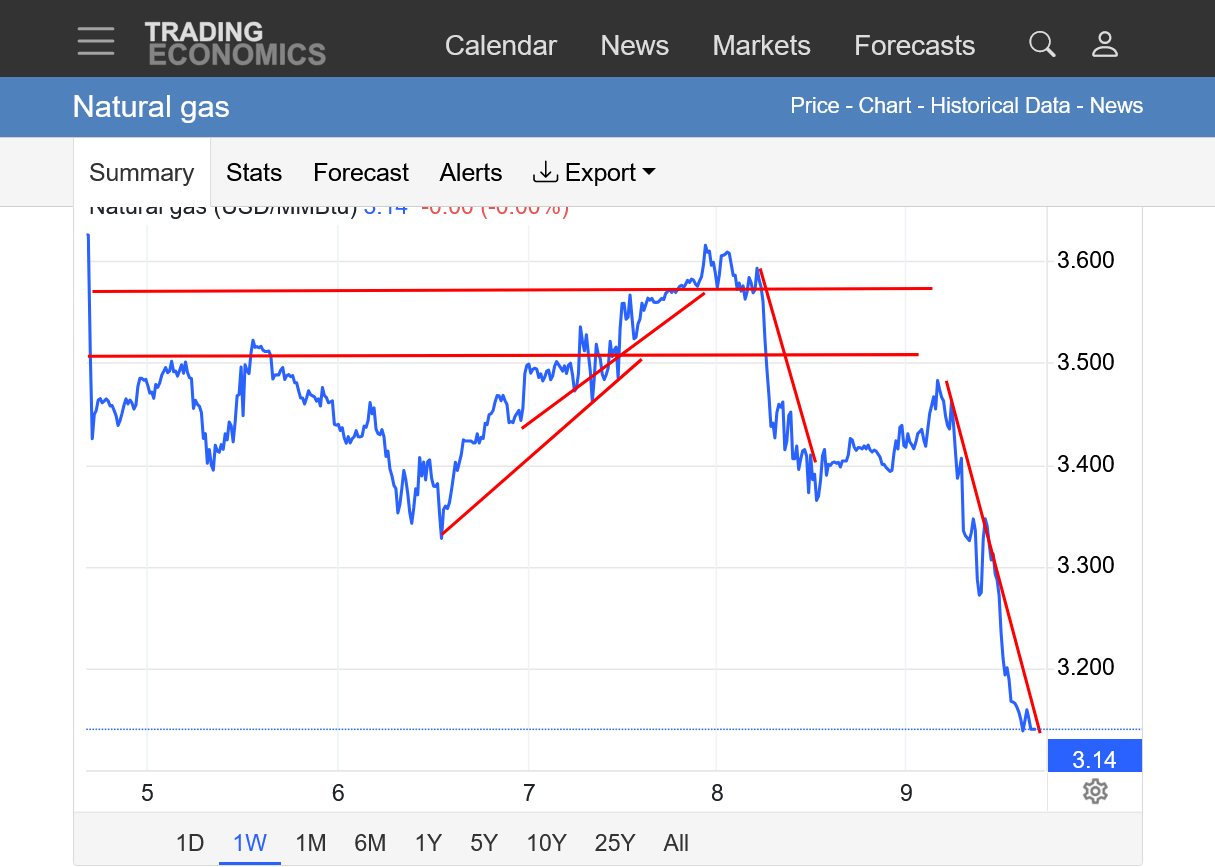
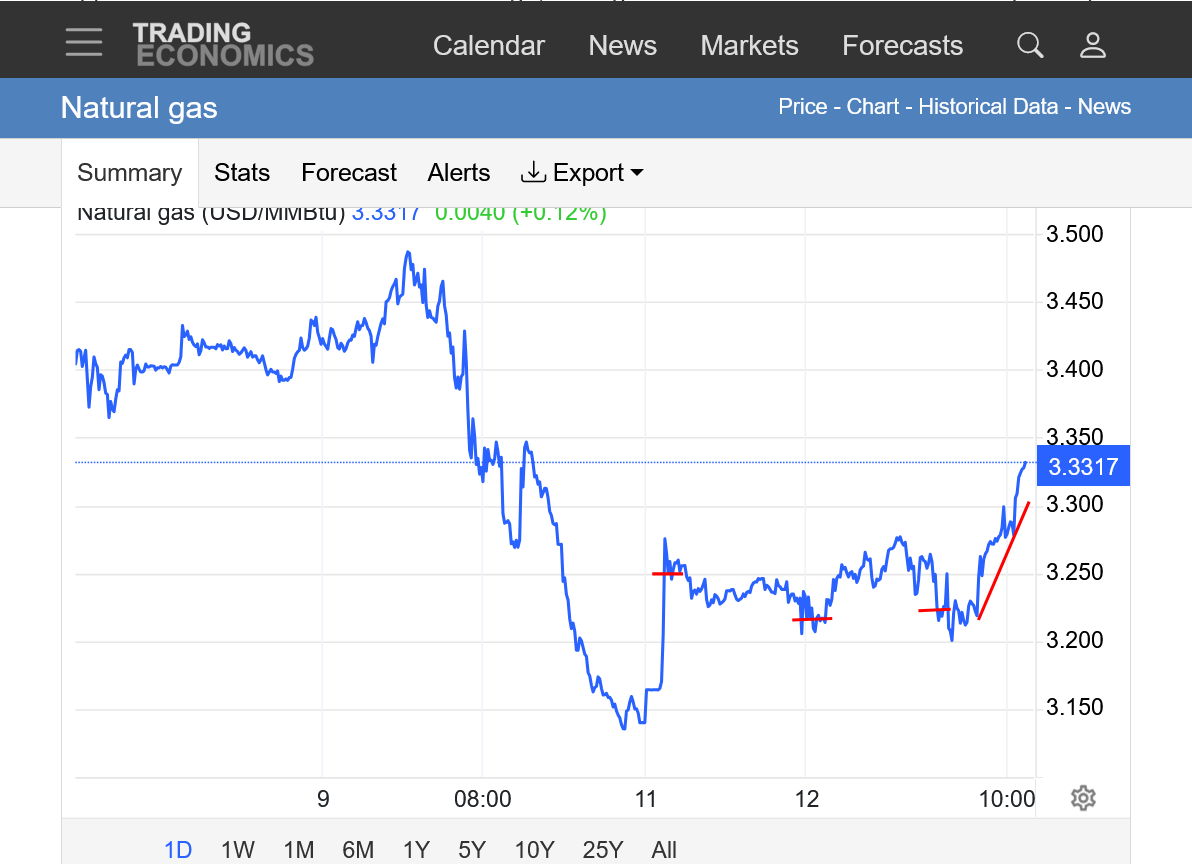
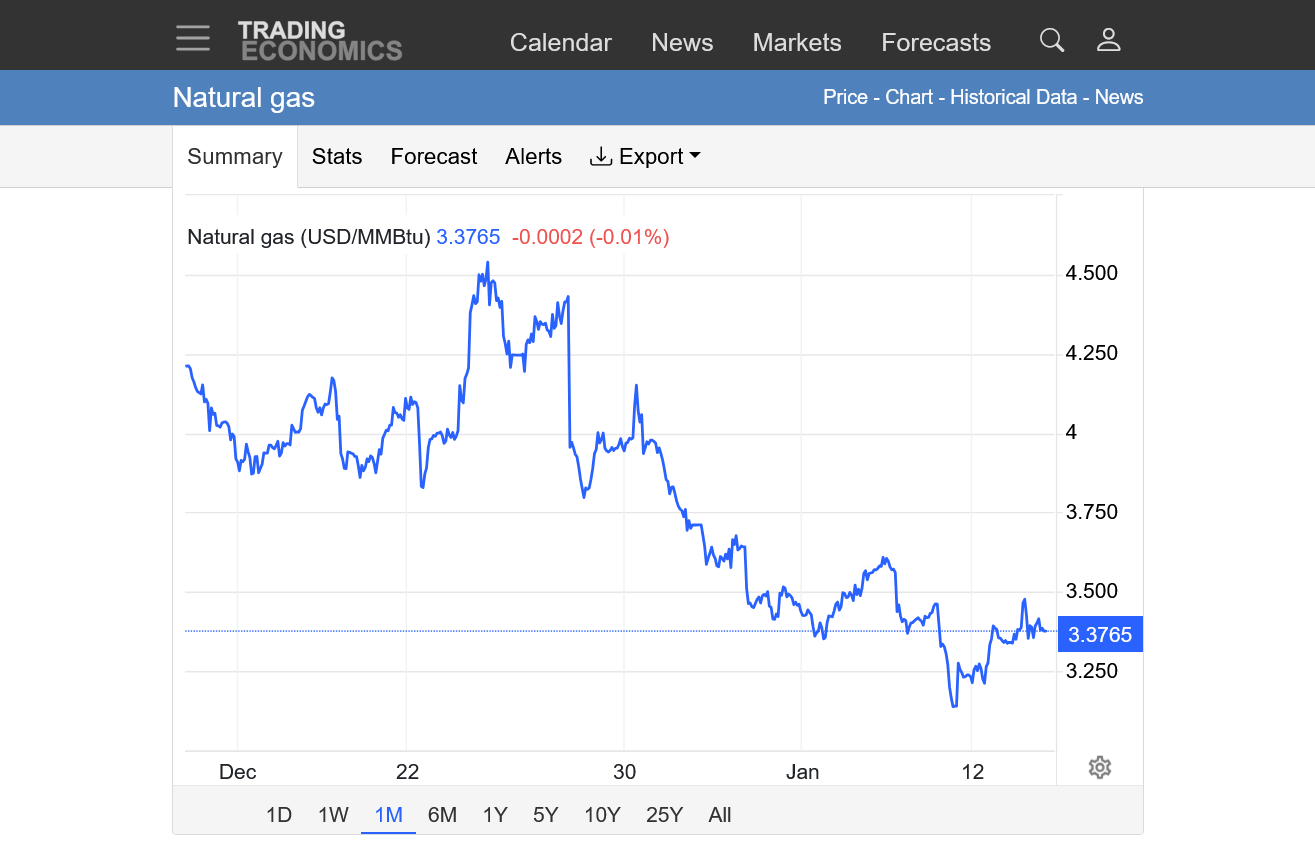
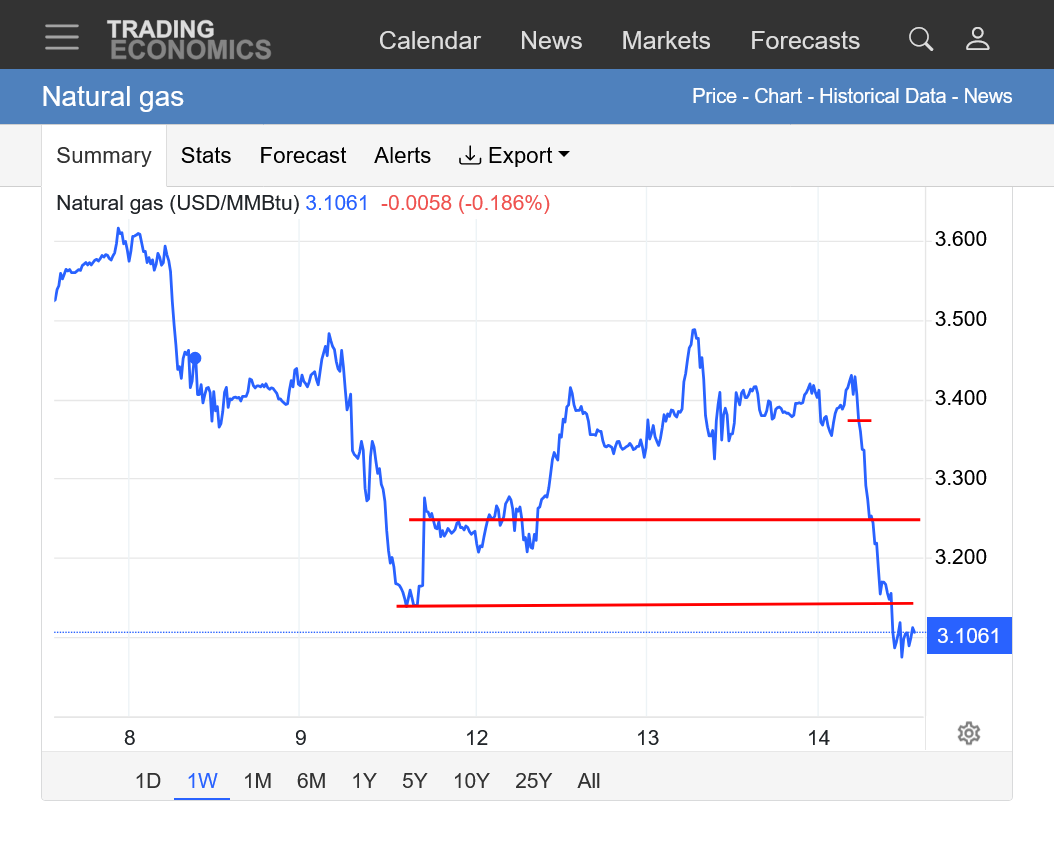
https://tradingeconomics.com/commodity/natural-gas
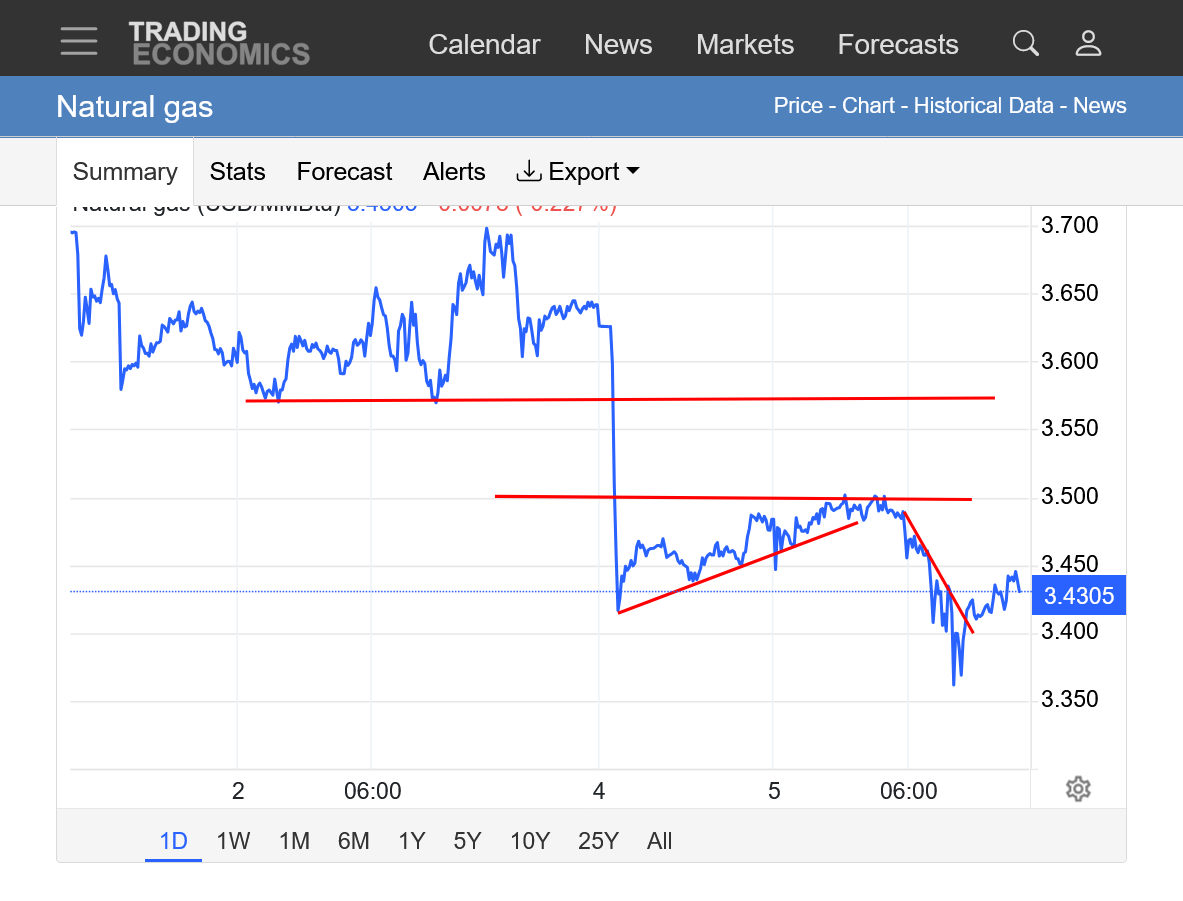
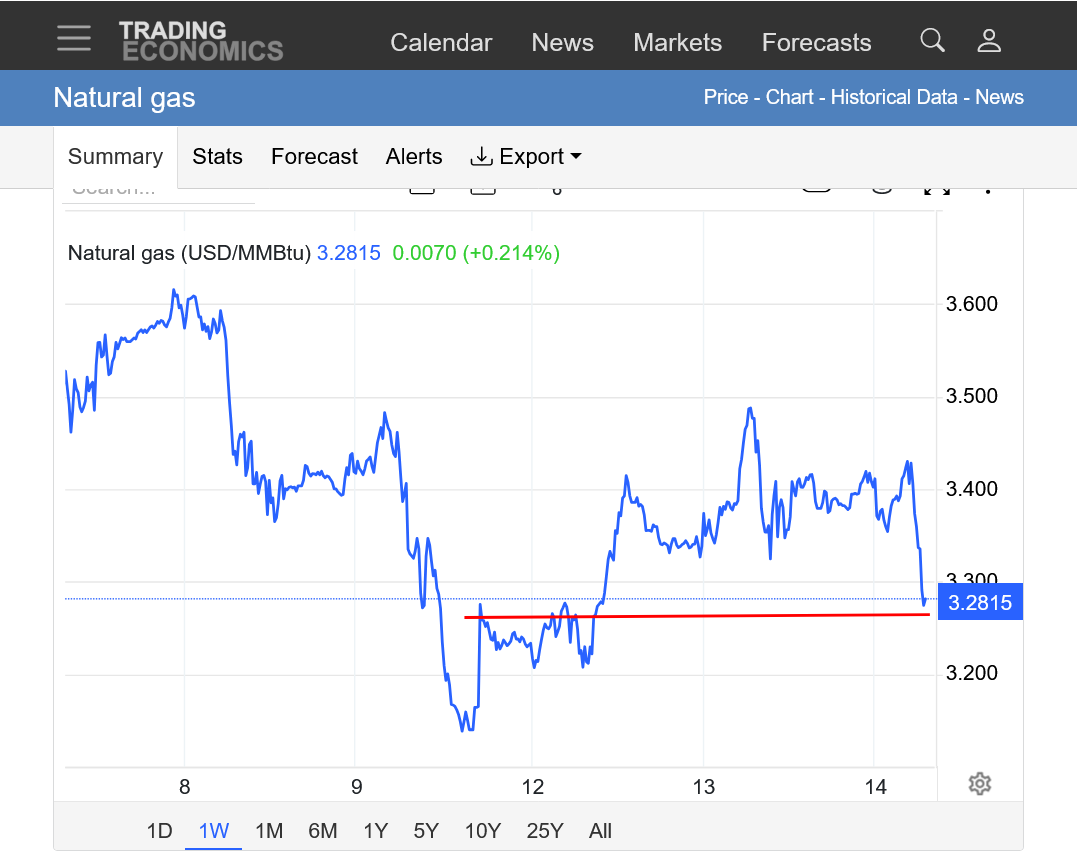
1. 1 day: Closed into the bottom of the gap. Sharp move up after COLDER 12z models came out(mainly the GEFS). The spike lower early this morning after the milder 6z GEFS model came out was likely significant low. Only a big change that eliminates the much colder pattern coming in week 2 will take us back down there.
When the warmer part of this 12z European Ensemble model came out, the NG market quickly plunged $500/contract. Note the 2 red lines on the 2nd chart that show this, then came all the way back and made new highs for the session as the very cold end of the forecast came out.
https://naturalgasintel.com/news/weathers-mild-turn-sends-spot-gas-prices-into-freefall/
https://tradingeconomics.com/commodity/natural-gas
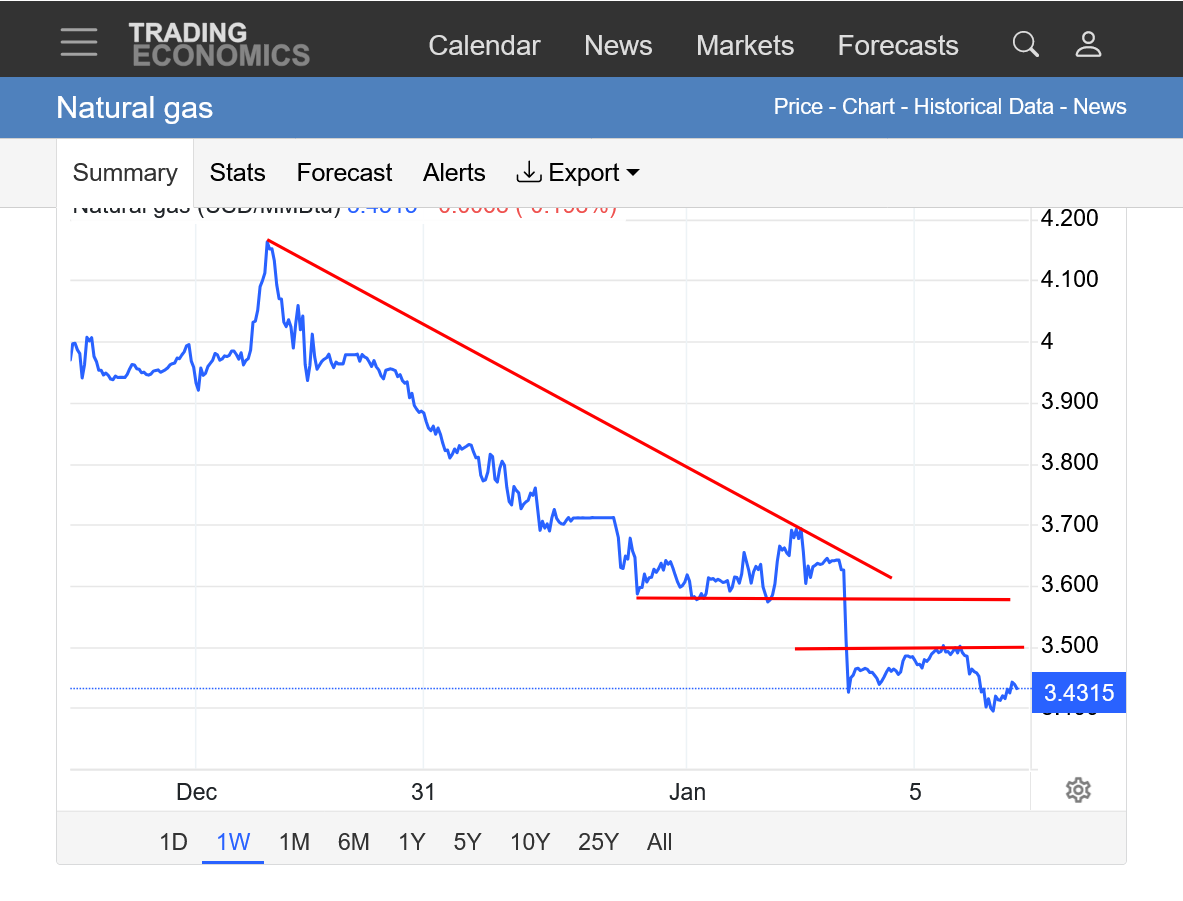
1. 1 week. Previous downtrend from warmer updates to most model forecasts last week. Gap lower on Sunday night. We spiked 1 tick above the gap from colder 0z models on Sunday night, then closed the far bottom portion of the gap with the much colder 12z Mondays models, backing down with the last milder 18z GEFS. We need to fill that gap to put in a selling exhaustion signature on the price charts, otherwise this is still a downside break away gap.
2. 1 day: The horizontal line is the gap lower line. We got 1 tick above after the colder 0z models last night. Then crashed to new lows after the next 6z GEFS model run was milder. Then, recovered especially with the help of much colder 12z model runs(note the 5 minute $500/contract spike low during the upsurge because of 5 milder days in the middle of the EE run). This got us $200+/contract above the gaps bottom(the high was actually 3.530) but not close to filling the gap. After the last 18z model was not as cold, we've backed off again. Now -$600/contract from the day session close but still $1,000/contract above the early morning lows that should hold, unless the forecasts take out even more late period cold.
Considering how cold the 12z models were in week 2, I'm surprised that we couldn't fill the gap or at least more of it. This UNDER performance by the bulls when they get bullish news and OVER performance by the bears when they get bearish news is not to be ignored.
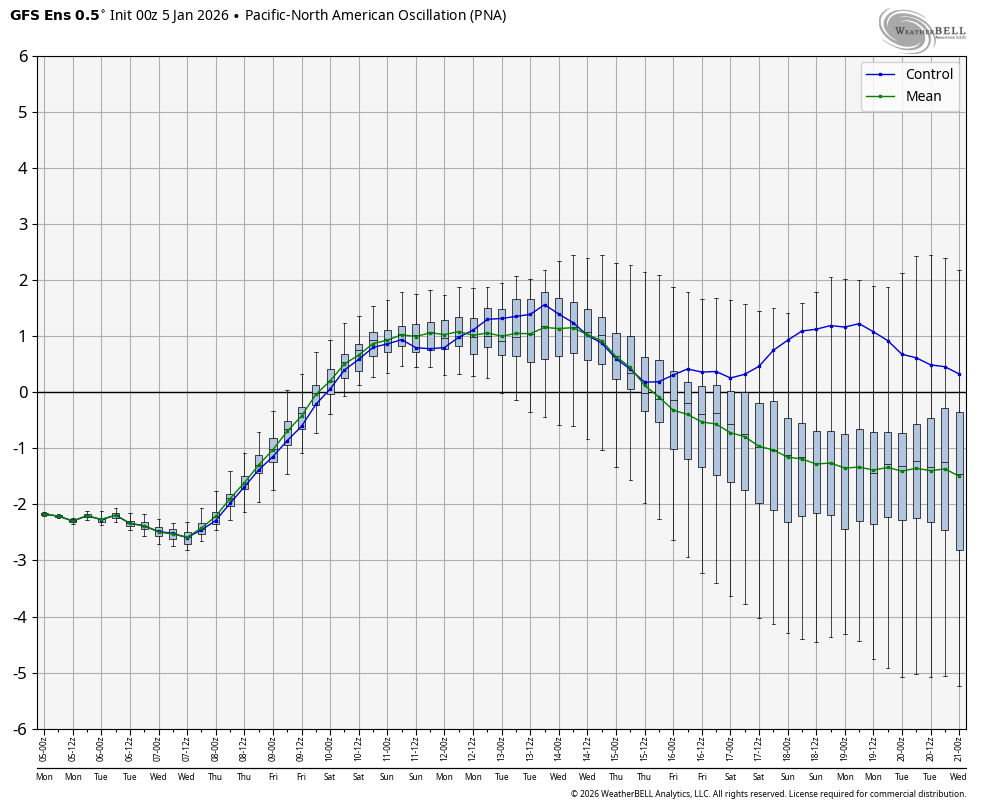
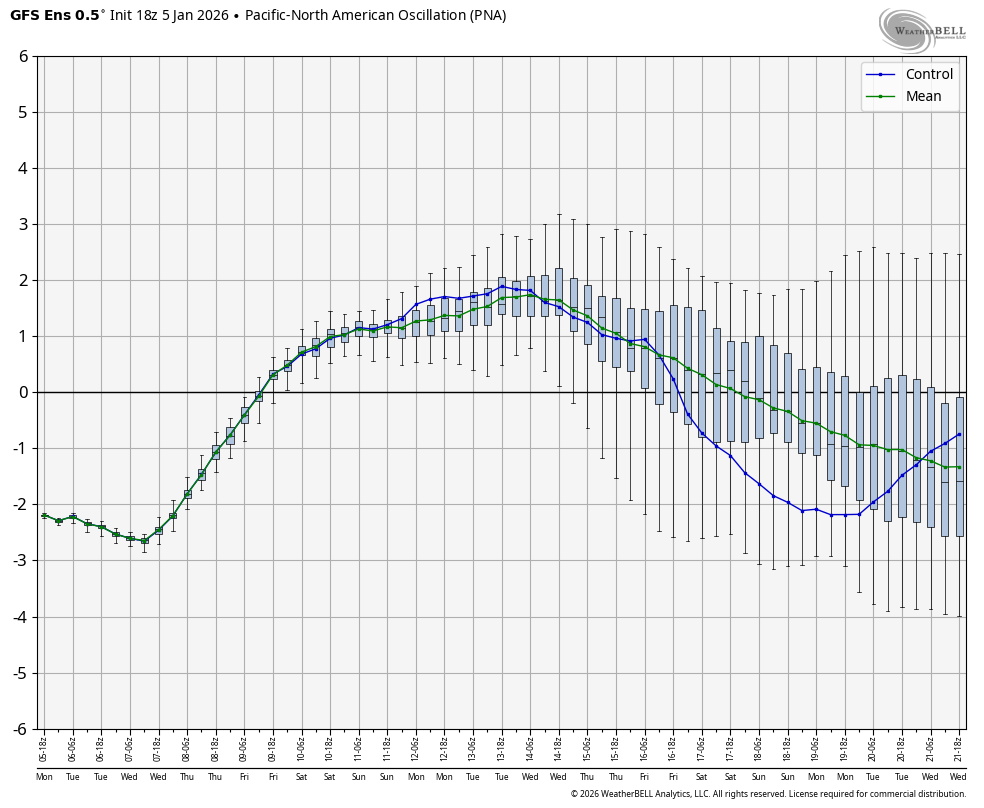
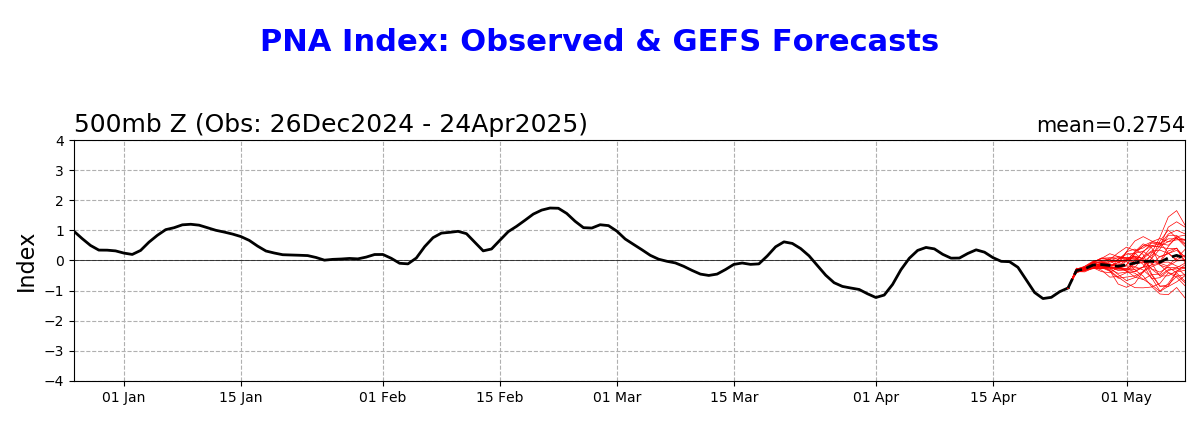
Per WxBell’s version of the GEFS’ mean PNA, the trend of the last few days for both the length and strength of the midmonth +PNA has been a sharp increase: watch as the midmonth green line above 0 on each of these images gets longer and peaks higher:
- 0Z 1/2 run: <1 day >0 (Jan 12th); max amp +0.1 (Jan 12th)
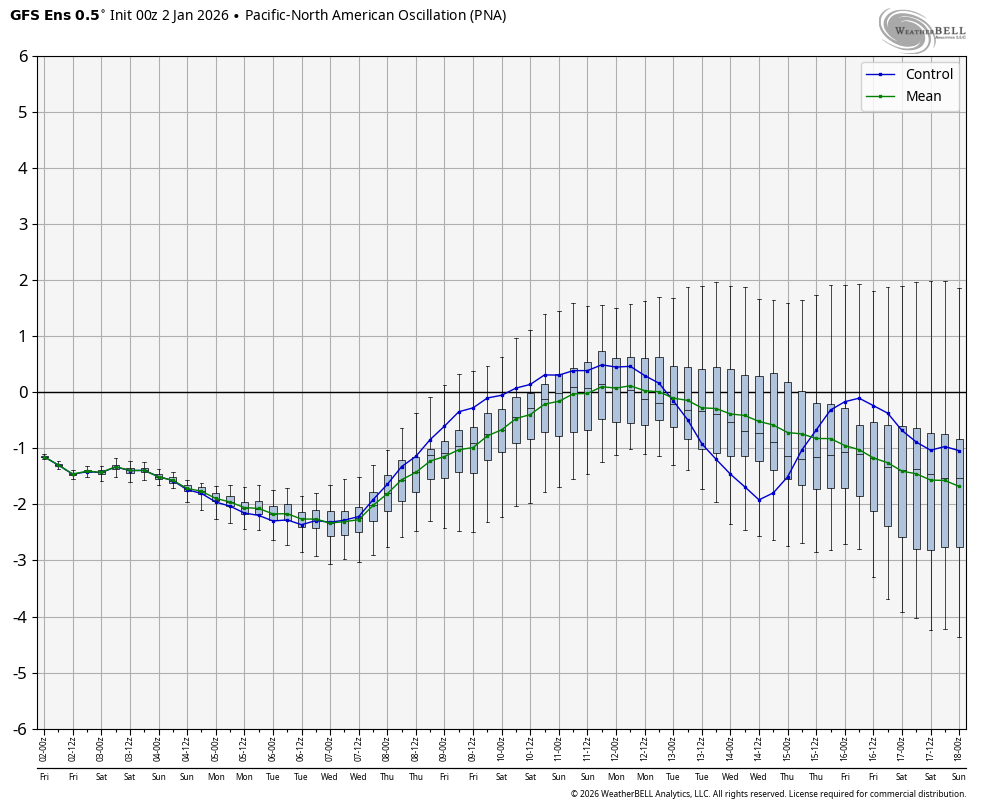
- 0Z 1/3 run: 3 days>0 (Jan 11th-13th); max amp +0.5 (Jan 12th)
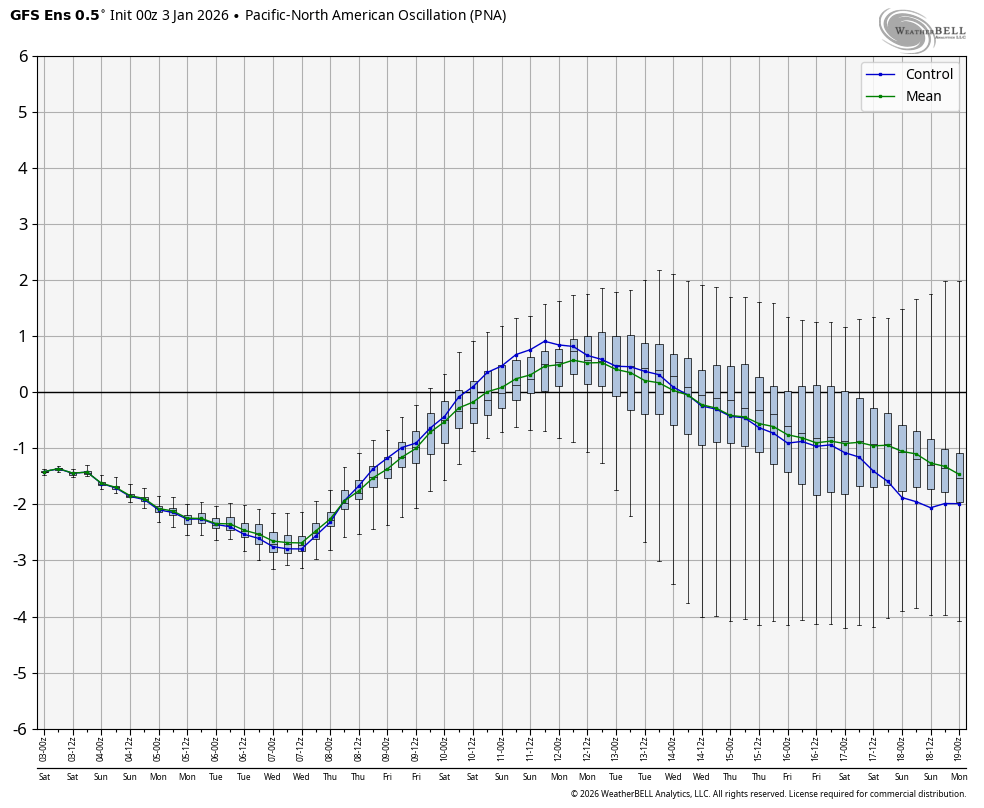
- 0Z 1/4 run: 4.5 days>0 (Jan 10th-14th); max amp +0.7 (Jan 11th)
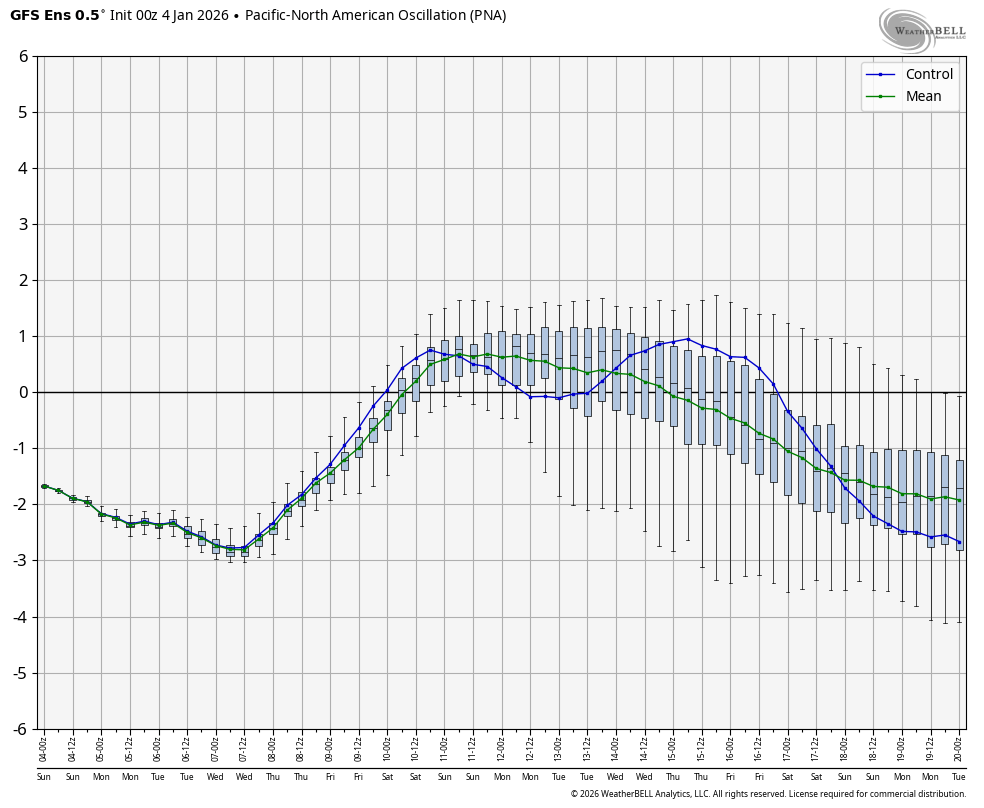
-0Z 1/5 run: 6 days>0 (Jan 9th-15th); max amp +1.2 (Jan 13th)
-18Z 1/5 run: 8 days>0 (Jan 9th-17th); max amp +1.7 (Jan 14th)
Here are those 5 images in a GIF:

Thanks, Larry!
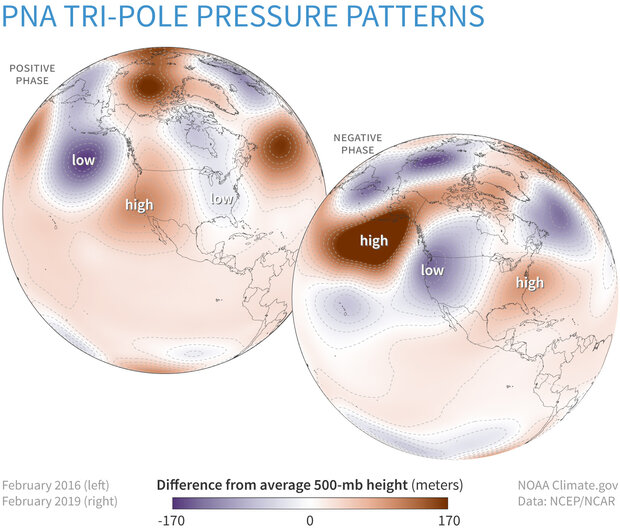
For our non weather experts here, this is the PNA pattern. A +PNA frequently occurs with a ridge/west, trough/east couplet/teleconnection which is favorable for steering Pacific flow AWAY from the West Coast where its warm and dry. At the same time, downstream there is a trough which is favorable for southward transport of colder air because of northerly winds between the high and low.
By metmike - May 2, 2022, 11:42 p.m.
https://www.psl.noaa.gov/map/images/ens/ens.html#nh
NCEP Ensemble t = 360 hour forecast 
NCEP Ensemble t = 360 hour forecast 
Arctic Oscillation Index, North Atlantic Oscillation Index, Pacific North American Index.
https://www.cpc.ncep.noaa.gov/products/precip/CWlink/daily_ao_index/ao.shtml
https://www.cpc.ncep.noaa.gov/products/precip/CWlink/pna/nao.shtml
https://www.cpc.ncep.noaa.gov/products/precip/CWlink/pna/pna.shtml
The last 0z GEFS was -2 HDDs, mainly milder at the end, when it's supposed to get much colder.
The 0Z EE GDDs will end up even milder because of several MUCH milder days towards the end of the forecast.
Mike,
Yeah, the EE is stubbornly holding onto a transition to a stronger -PNA than the GEFS. Regardless, I’ll continue to route for the actual midmonth +PNA to last much longer than the latest ens means are showing. 0Z GEFS largely held onto the more bullish 18Z +PNA, which is a bit encouraging.
The last 12z GEFS was weaker with the +PNA and its ridge/west/trough east couplet/teleconnection.
It looks like that ng market is smarter than us guys posting this week about how bullish the weather is going to be for natural gas. That definitely includes me!
I was briefly long last night but limited it to a very small loss($200/contract) exiting immediately when the 0z European model showed several much milder days.
Staying in, my current loss would be $1,000/contract right now.
In trading we have an entry price.
And we have an exit price.
The exit price is what you did last and more often than not counts the most in rating how smart you were.
I can't count the number of really smart entries I made that were followed by real dumb exits, small profits instead of a windfall and feeling really bad.
Yesterday was not necessarily a dumb entry because the weather pattern justified it using my trading set up. However, the European Ensemble model CHANGED to invalidate that set up, unfortunately with me being long. But VERY fortunately, I immediately recognized this violating my system. I WANTED to put in a sell stop below the lows and risk another $200+/contract and HOPING the market would go up. Instead, I just covered the trade and took the loss and am looking forward to the next opportunity.
Funny thing is that in cases like this, after bailing a trader will then watch the market and hope their last decision was right and their initial one was wrong so they can feel good and justified based on what I just described above.
Bailing too soon can be the worst feeling in the world. You were right but sabotaged your own trade! OUCH!
The middle part of the 0z GEFS was colder, so I was long for +400/contract with a slightly bigger position than my -$200/contract loss last night.
I had to get out when the maps turned milder for several days after that.
I absolutely need to be glued to the updating weather models, HDDs and price movements while the weather forecast models are coming out.
I think the lows might be in again but we still need to fill the downside gap on Sunday Night to confirm the low is in i or its still a downside break away gap.
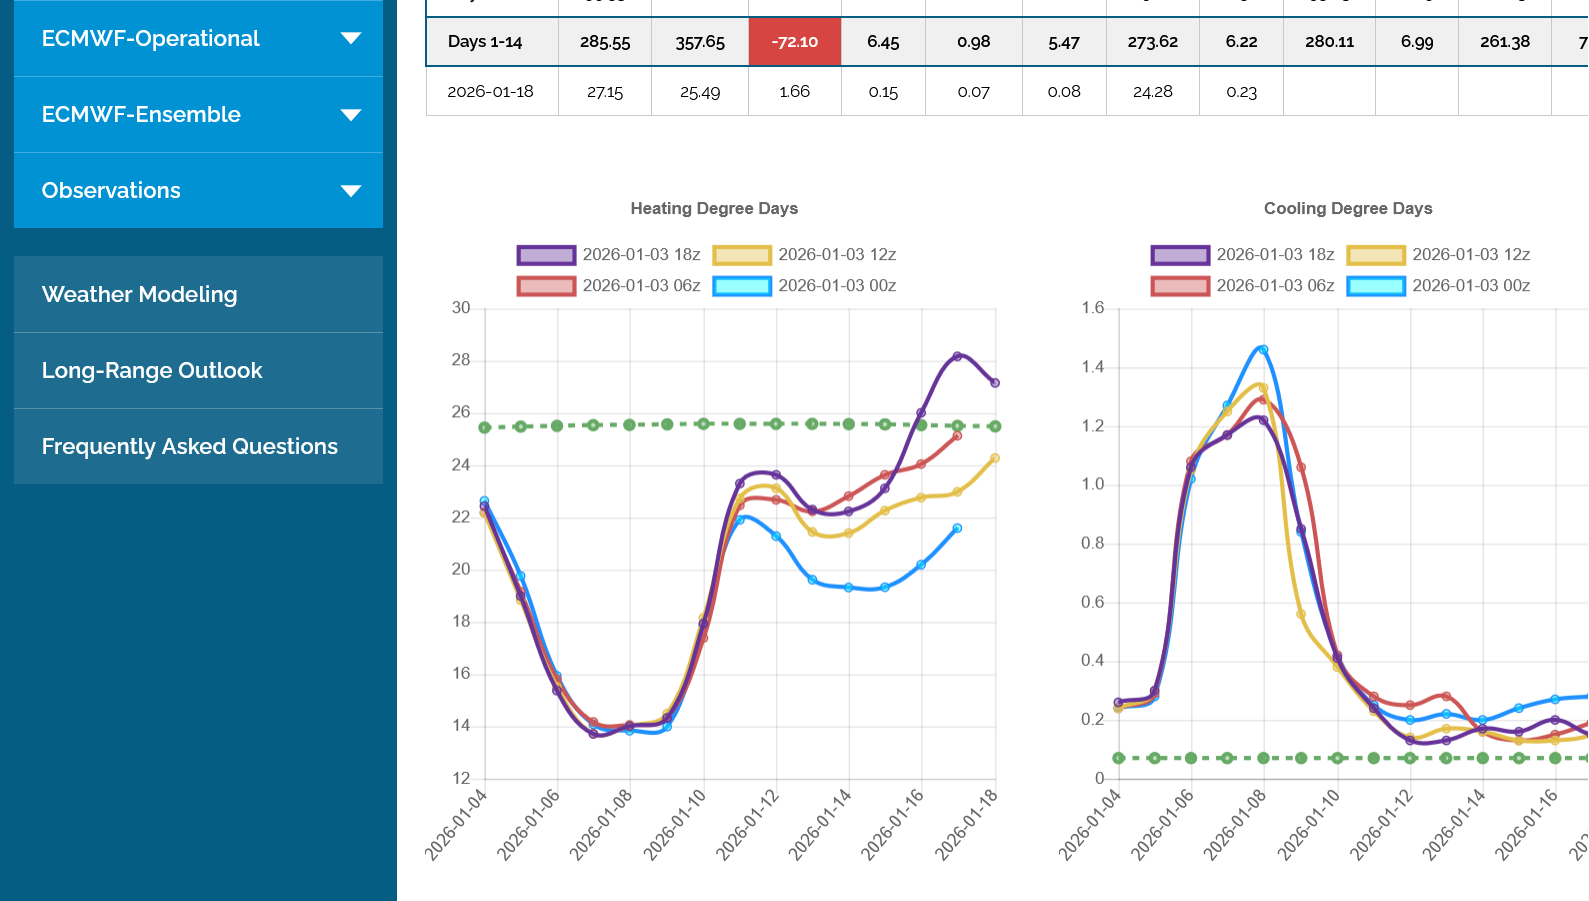
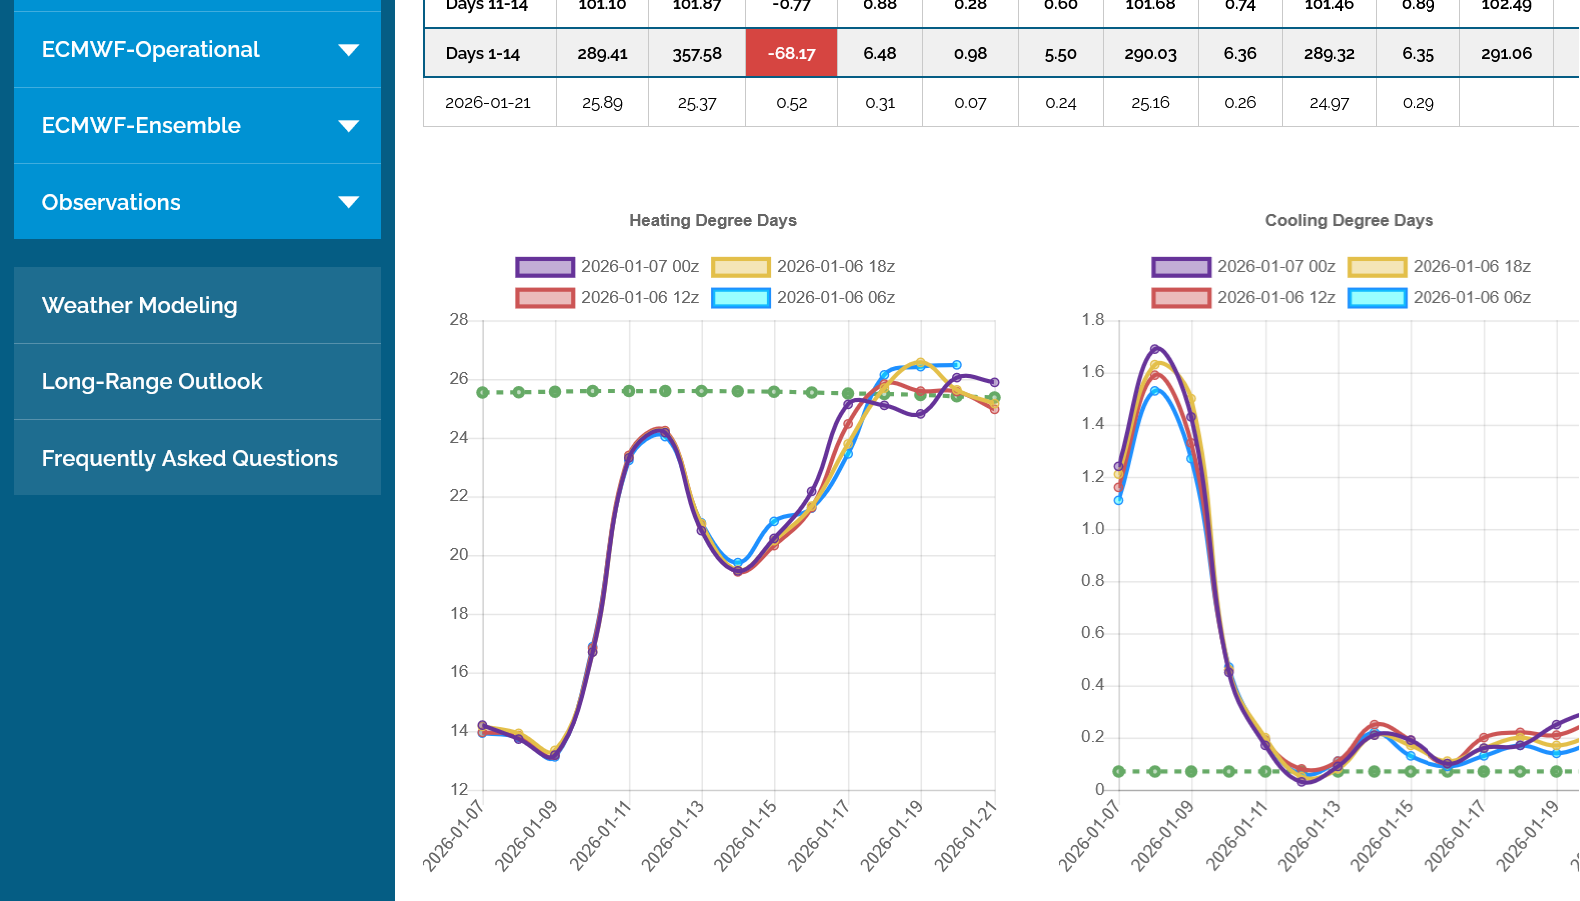
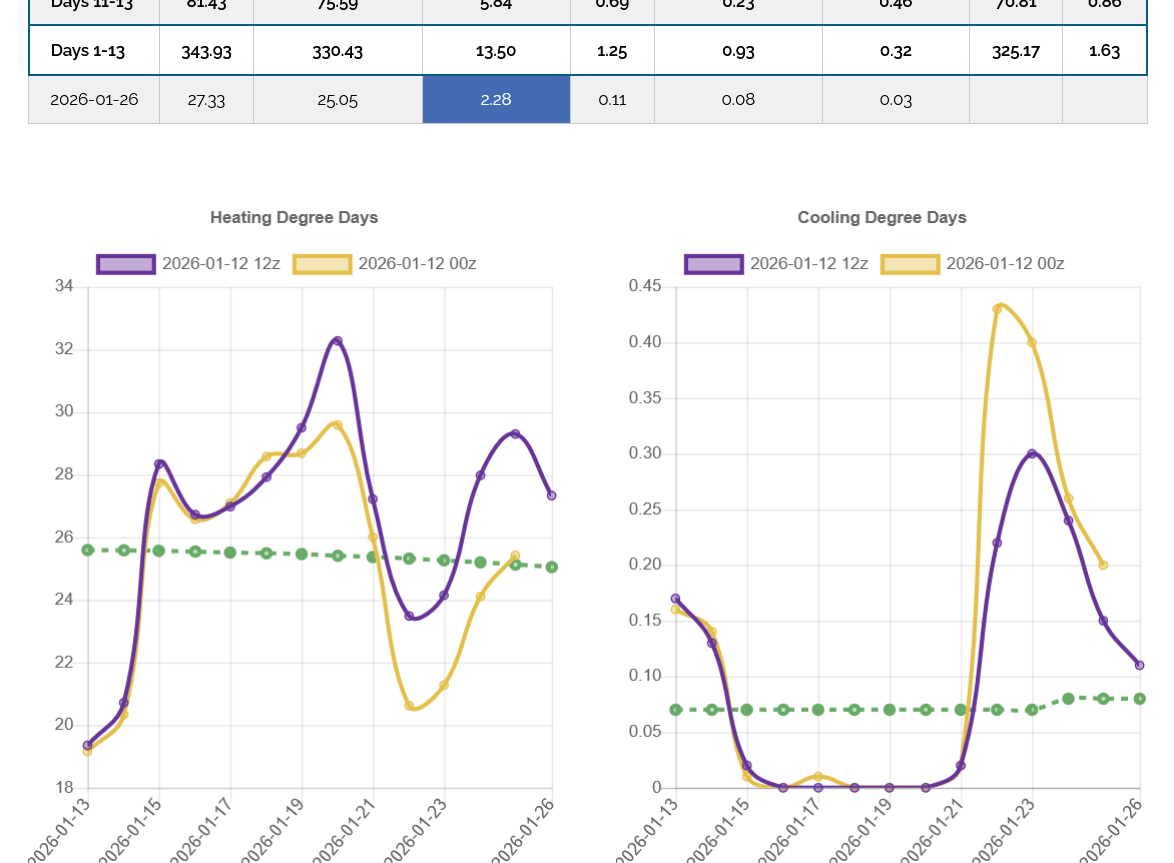
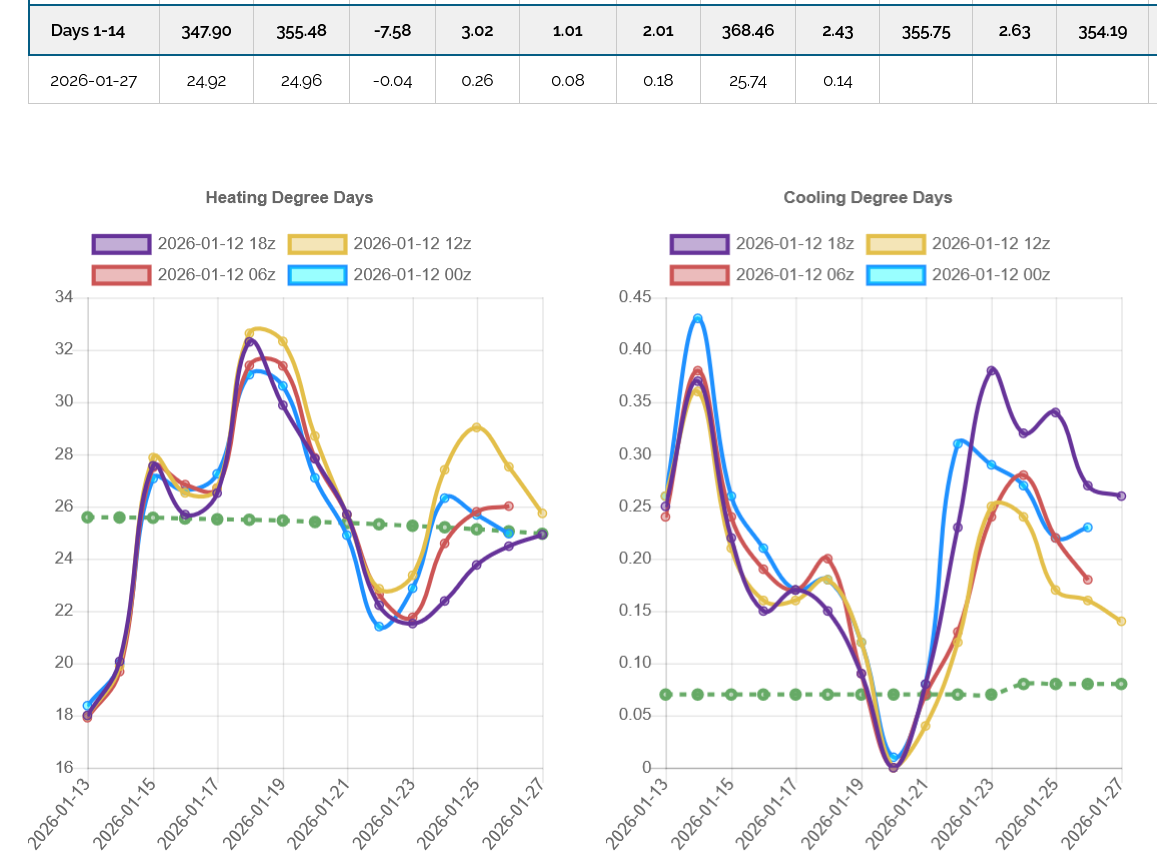
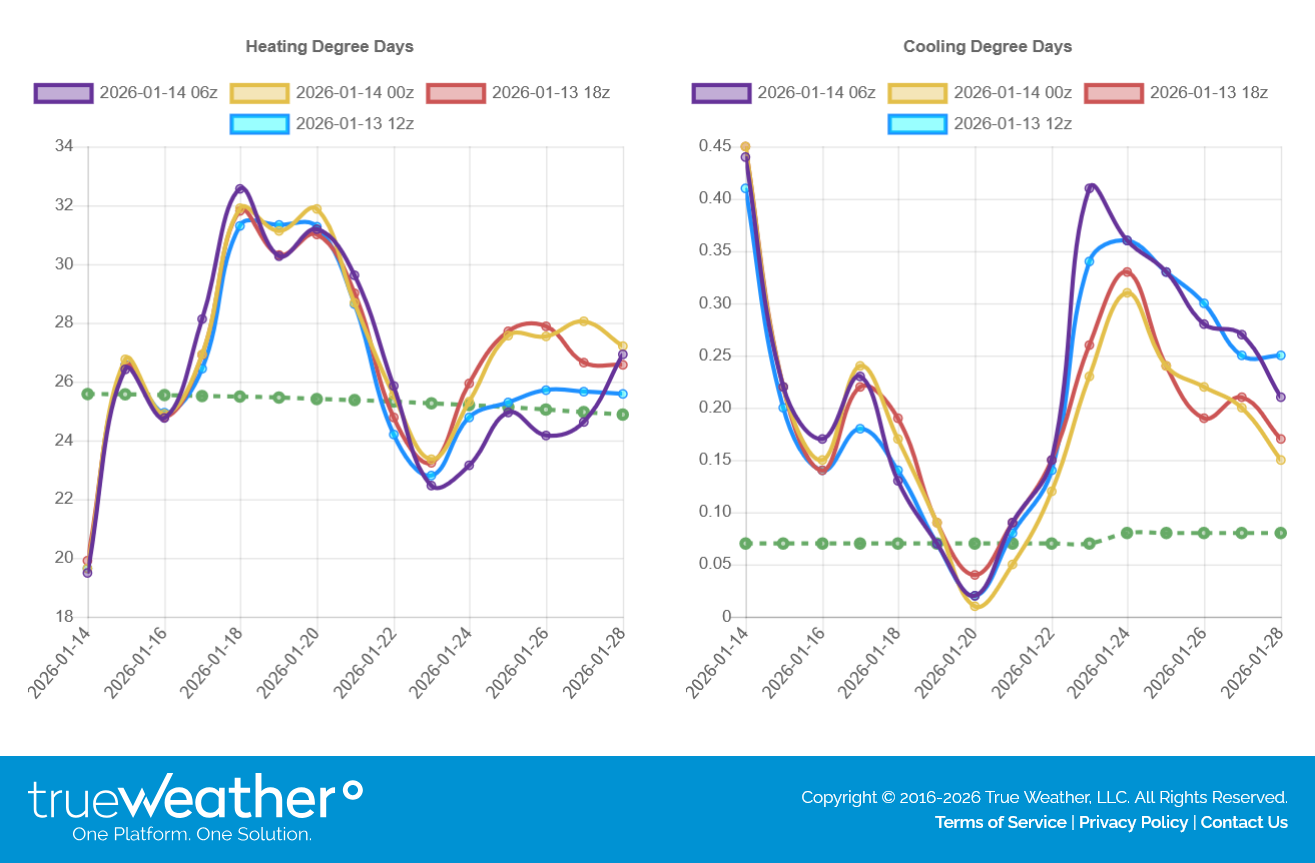
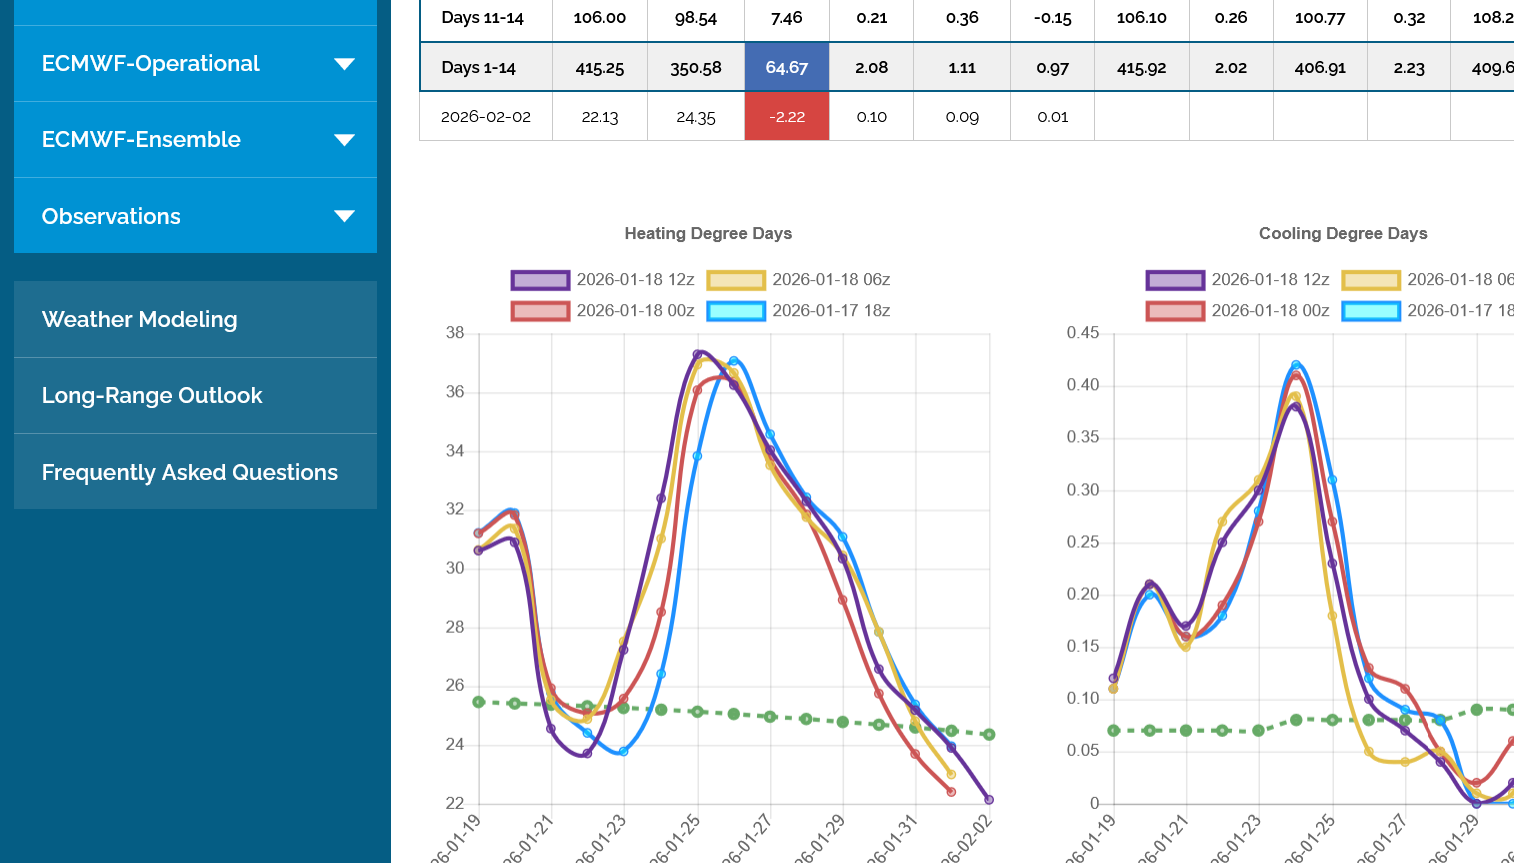
Here's the HDD data just out for that model in purple on the left with the previous 3 runs the other colors.
1am: The last 0z European Ensemble model finished MUCH colder and will be + alot of HDDs compared to the previous 12z run. This should be supportive for NG until the 6z model comes out.
Congrats, MM, on the +400/contract!
The 6Z GEFS week 2 is a decent amount colder than the 0Z. I’m thinking the entire run is 5-7 HDD colder.
NG is +5%.
How much colder was the 0Z EE than the 12Z?
Edit: My guess: 11-13 HDD colder 0Z EE vs 12Z
Thank you, Larry!
I decided to start trading more again but really hate losing so much sleep at my age and am busy with our chess tournament coming up on Saturday but figured that I spend so much time tracking the ng market so close, it's crazy to not use it to make more money again.
Posting here with you is huge enjoyment and of course making money is euphoric but when a position is on, since I don't have a 6 figure account any more but still trade with decent size, its impossible to not be greatly stressed and on nights like Monday, when it goes against me, even when being disciplined and following a solid strategy CAN be emotionally draining at the time.
Fortunately, I was rewarded for it enough this week to assist but as nobody else but you totally understands, the extreme up and down price gyrations in natural gas from weather model changes and big trader algorithms makes trading this market a road filled with huge potholes and false road signs. Even this morning, it would have been impossible to stay long since the spike down would have wiped
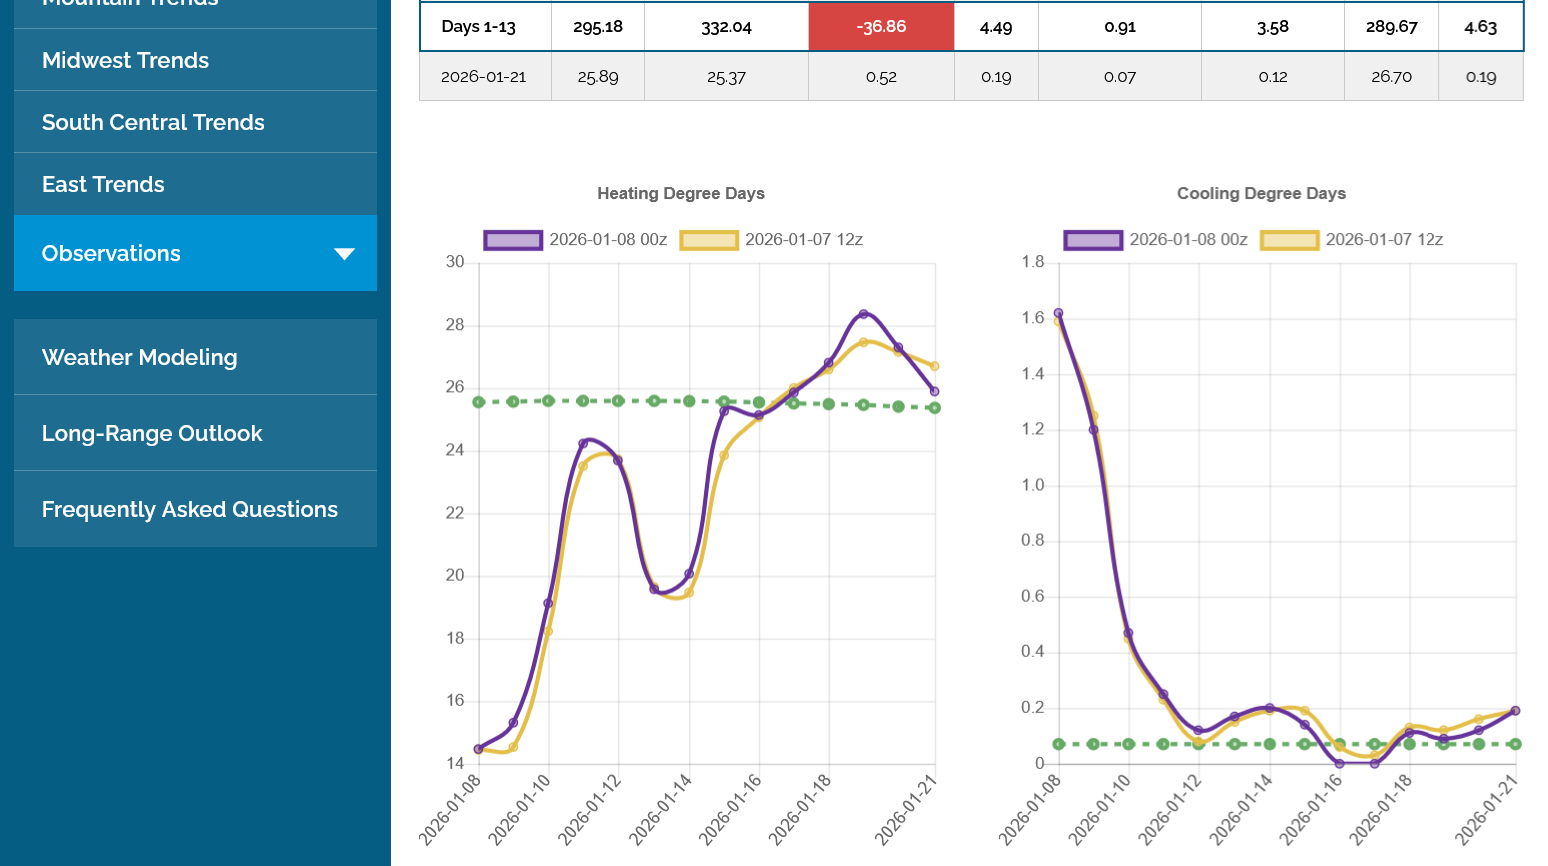
Now the long awaited HDD data.
1. 0z European Ensemble model. Only +7. Not as much as we thought from looking at the actually weather maps but all of it in week 2, especially late.
2. 6Z and prior GEFS. Last 6z run was +5 HDDs in purple. Most of it early in week 2, just before the colder period from the 0z EE but in agreement with it.
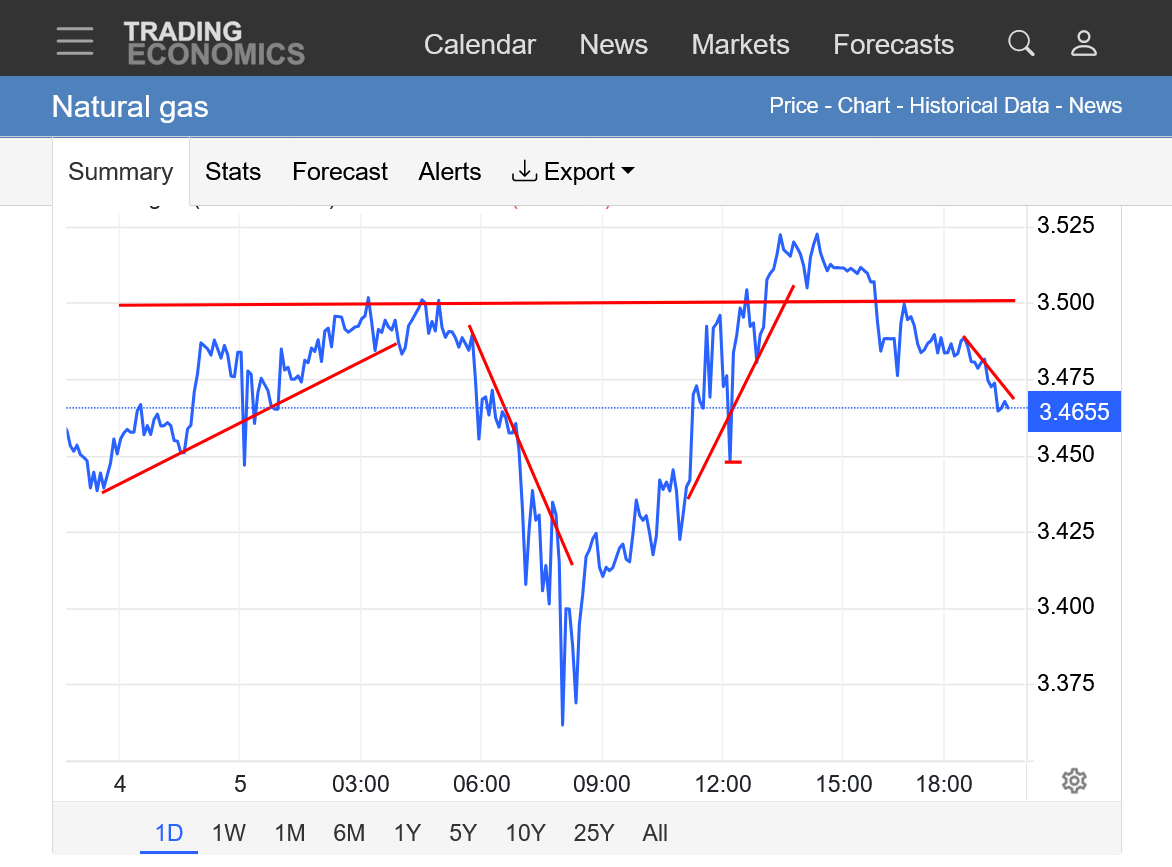
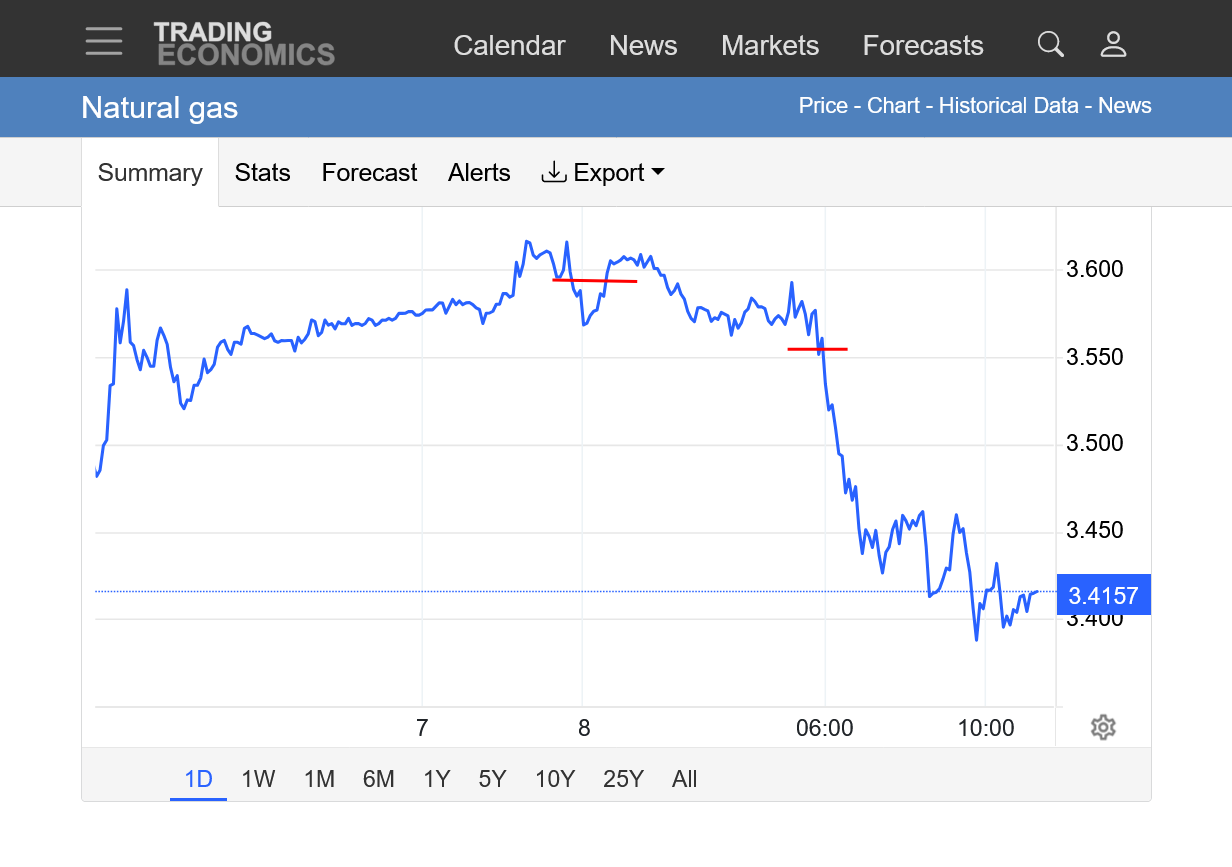
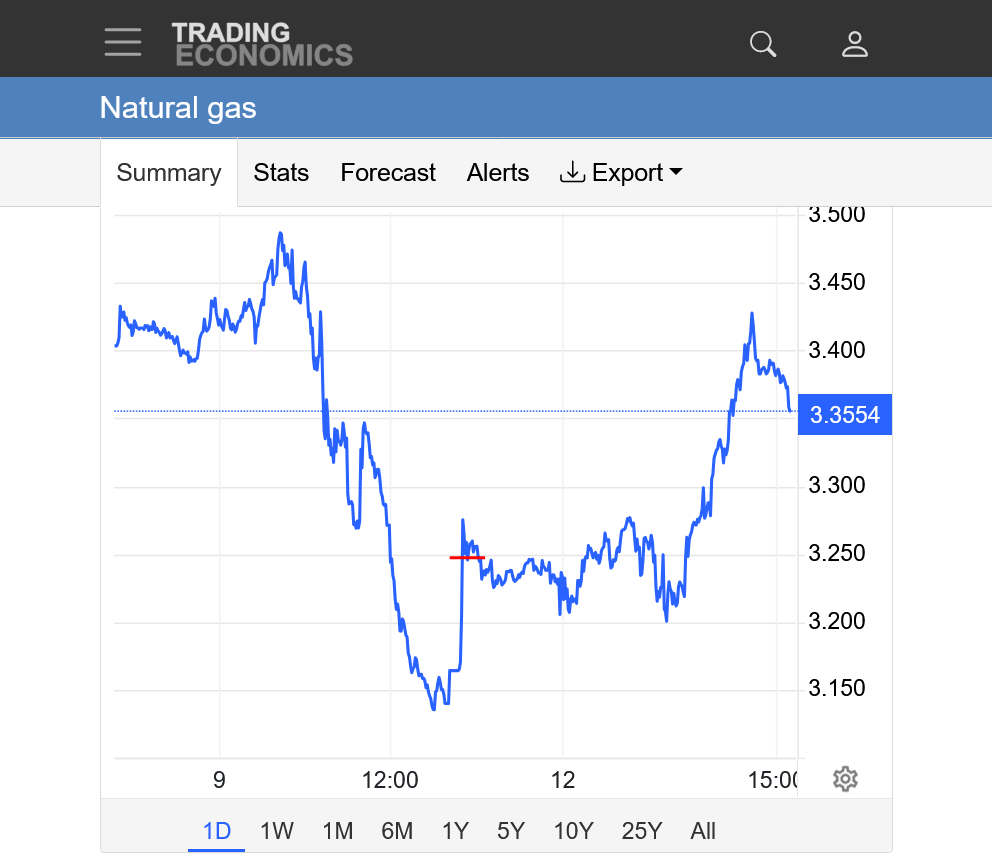
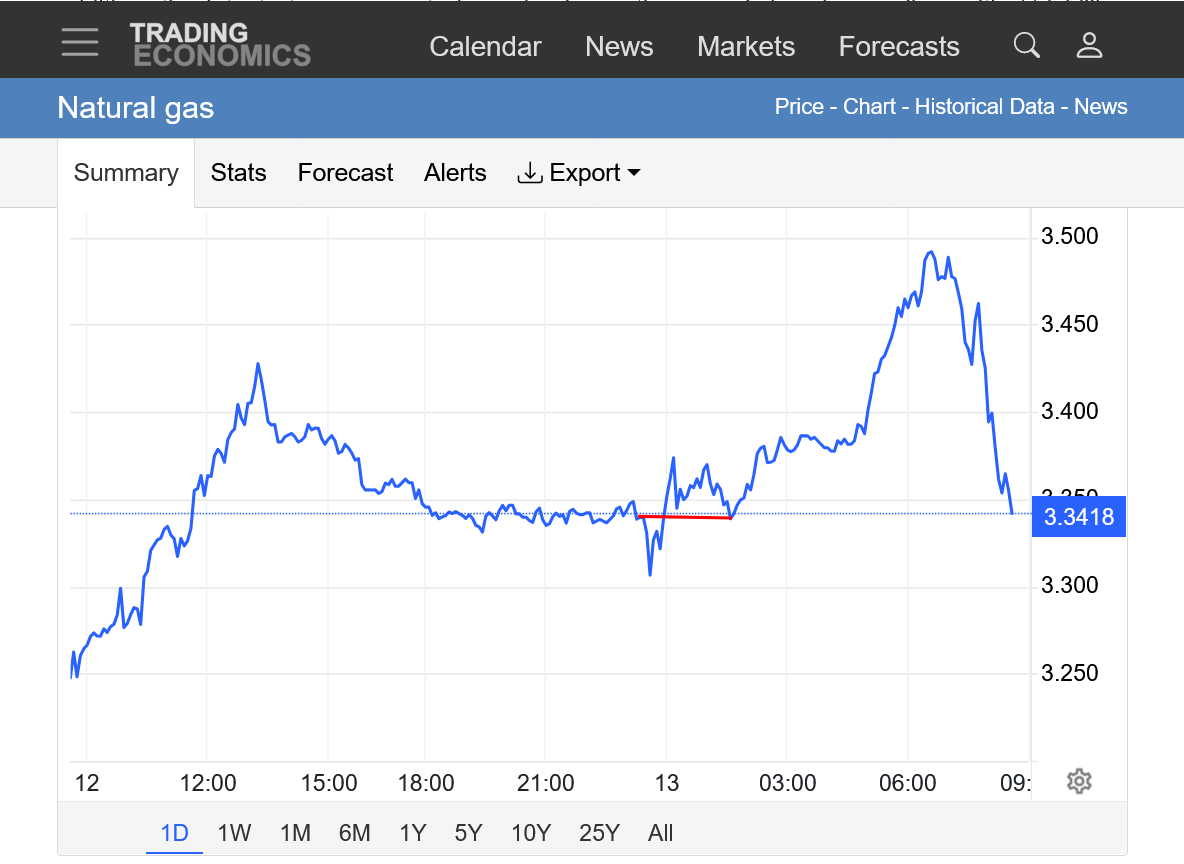
Here's the 1 day price chart that illustrates what makes it so tough.
https://tradingeconomics.com/commodity/natural-gas
The first red line is where the 0z guidance started coming out much colder and where I bought(and covered when the end of the run was not as cold).
We back off a bit and drifted lower even though the end of the EE was very cold and I was convinced we would keep going higher(but held most of the gains).
The 2nd red line is where the 6z GEFS came out COLDER and launched us to new highs/sharply higher. The actual high was 3.549.
At that point, I'm thinking DANG, I should have stayed long but then, without any new weather data the market spiked down ~$1,000/contract at which point ALL my profits would have been gone. No way was I going to risk all that if I had been long.
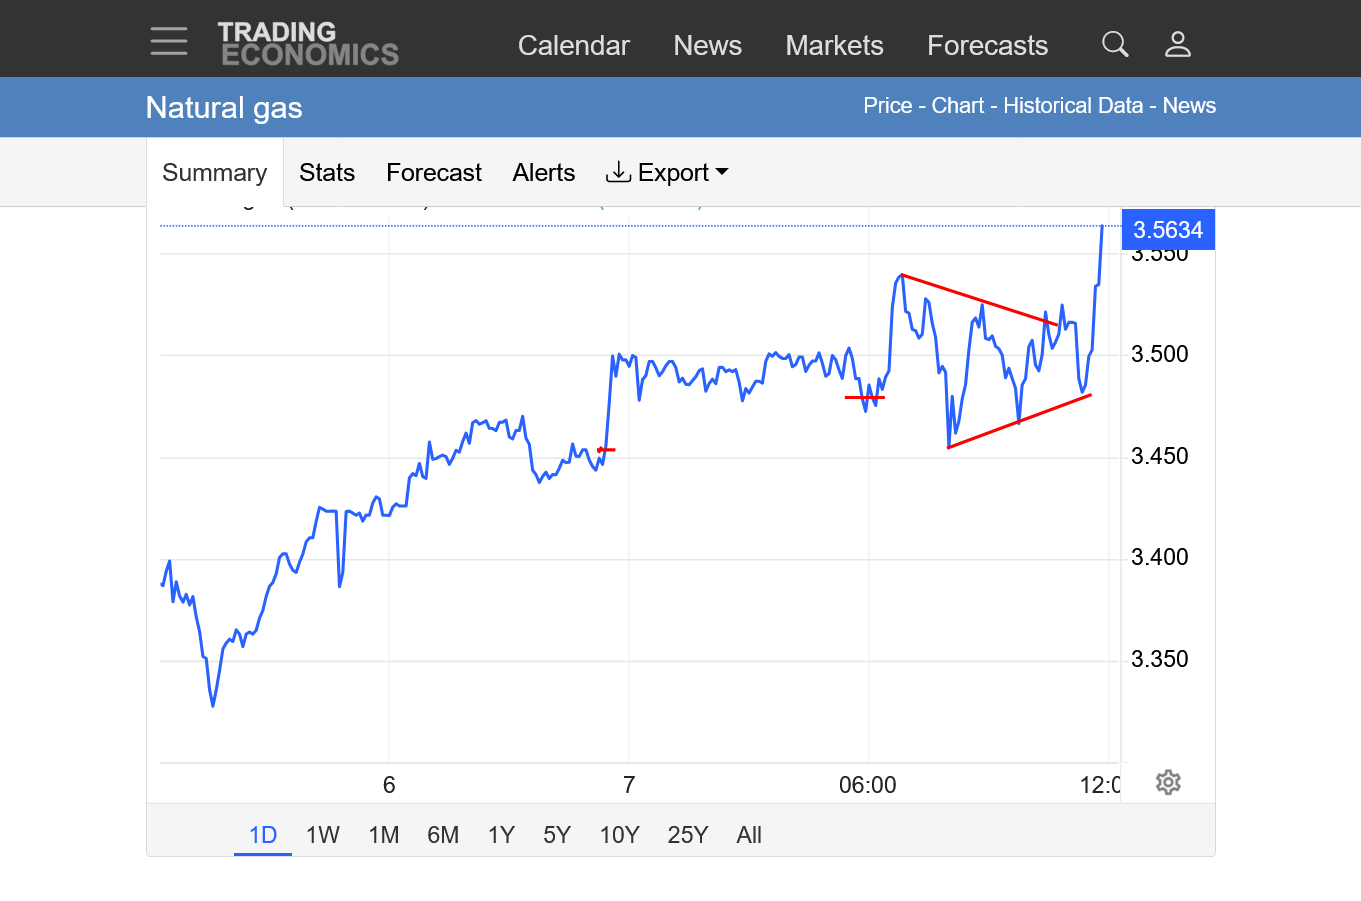
Then we spiked up and down with lower highs and higher lows in a COILING pattern that I think will resolve with an upside breakout above the daily highs.
Below is the latest with the coiling pattern, otherwise known as a symmetrical triangle.
On a daily chart, I would not give as much credence to it. But bottom line, the 12z weather models will determine the break out direction.
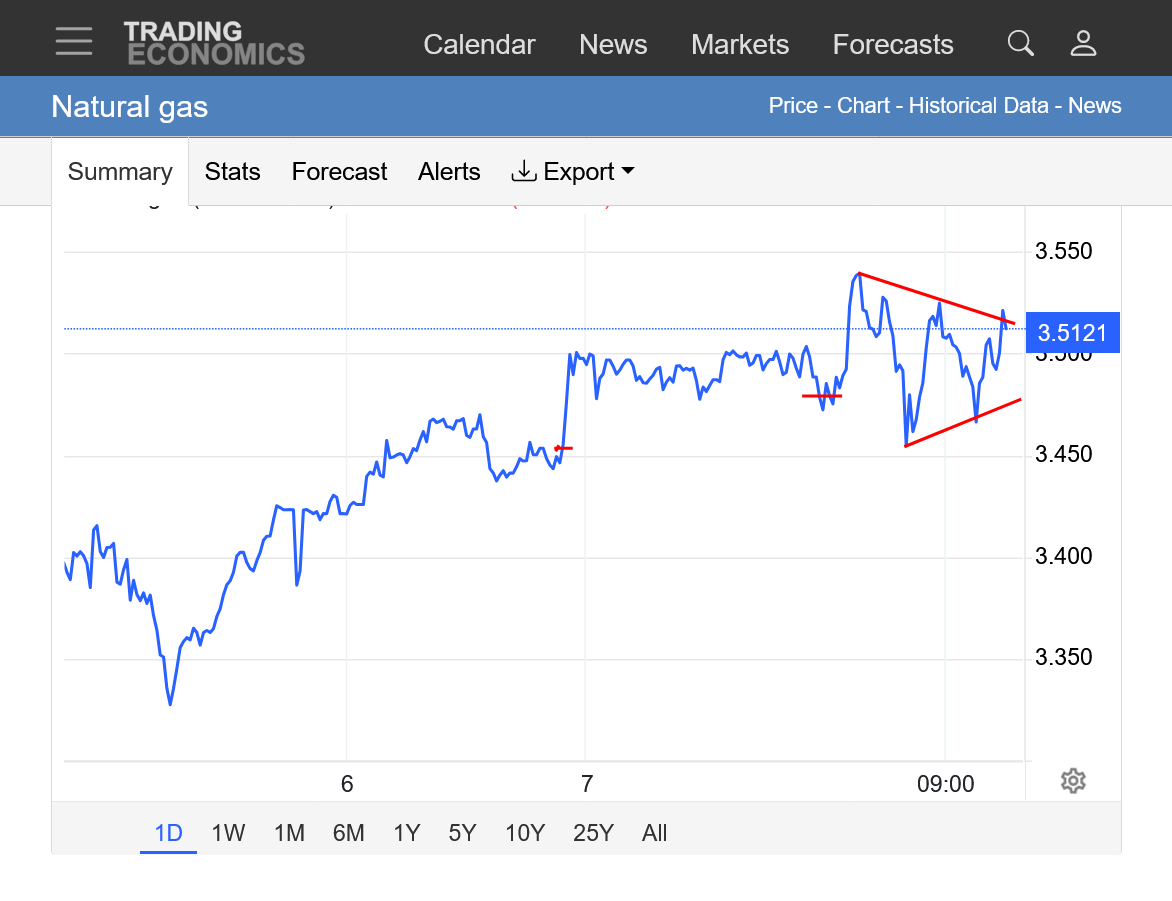
Keep in mind that we have only partially filled the downside gap on Sunday Night, so it remains a downside break away gap. Considering how cold the pattern looks in week 2, this is very bearish and the market UNDER performing what one would think with such bullish weather.
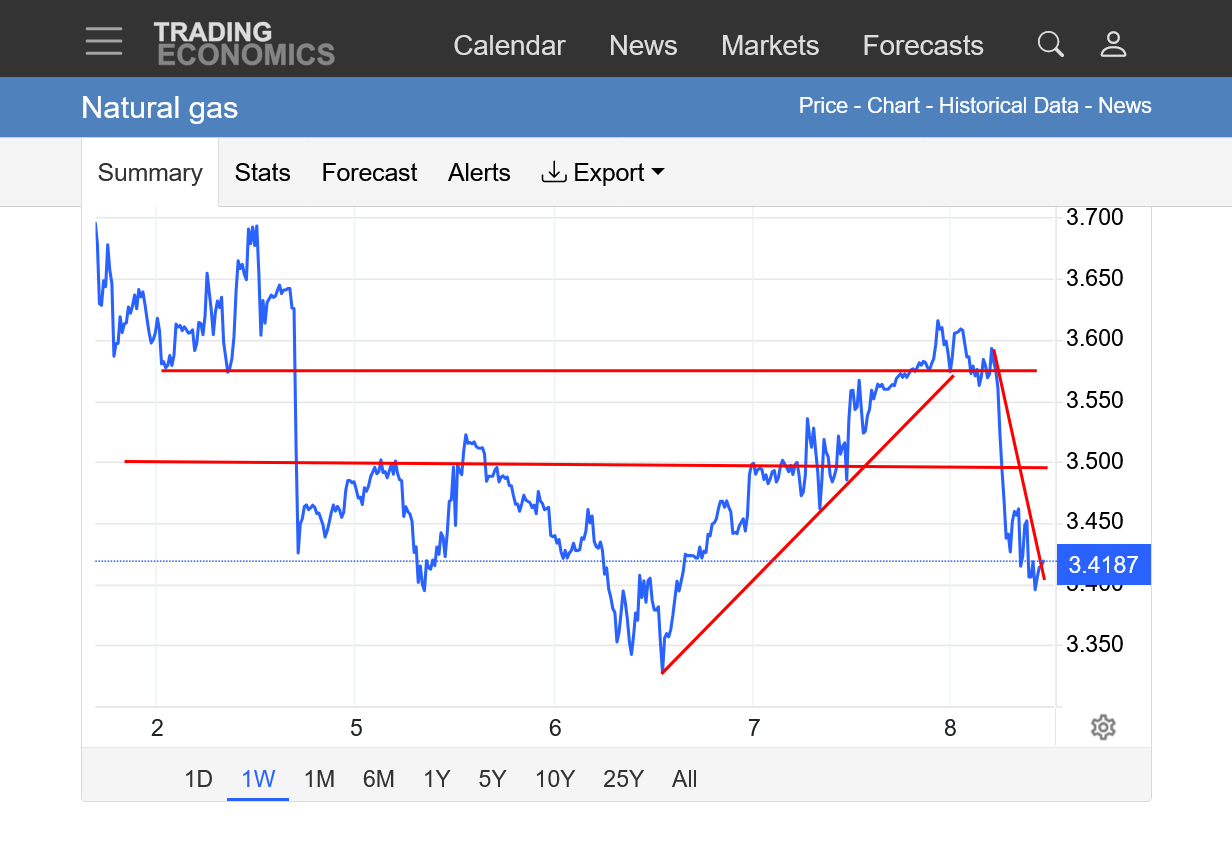
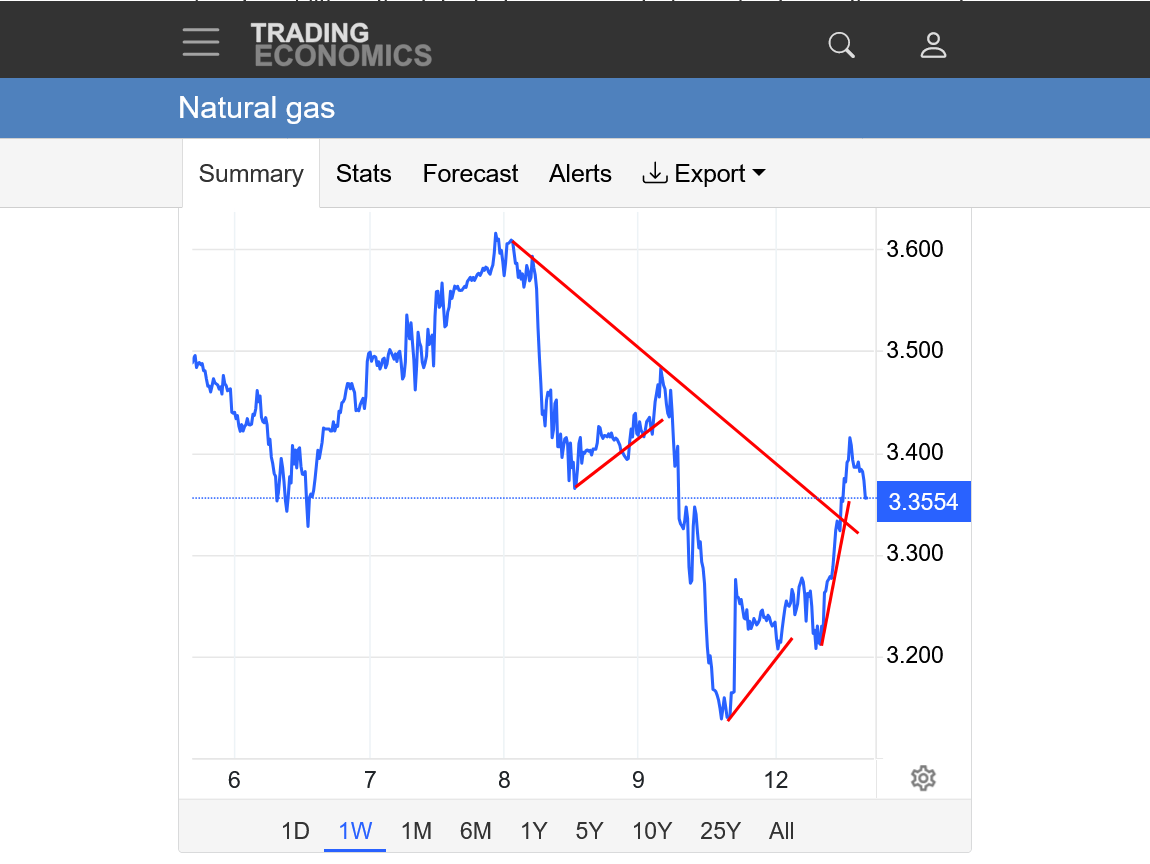
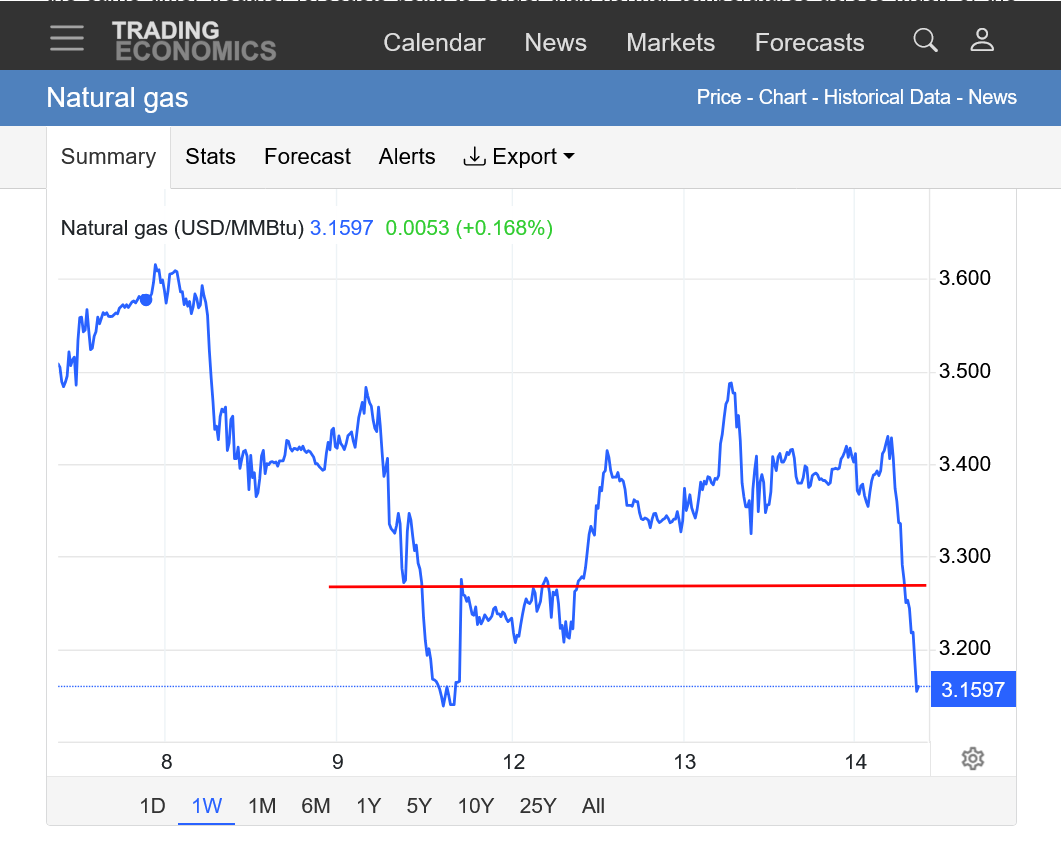
1 week chart: Here's that gap again(top line was Fridays low-bottom line was the Sunday night sharply lower open with a huge gap in prices that were never traded in between(until that is filled, its tells us that the markets mentality has suddenly taken a "step change" lower and is trading a NEW trading range lower. The bottom of last weeks trading range is the top line. The top of this weeks trading range is the top line.
The highs today, 3.549 are not properly shown as they ate thru a bit more of the lower portion of the gap as shown. Maybe filled 60%+ of the gap.
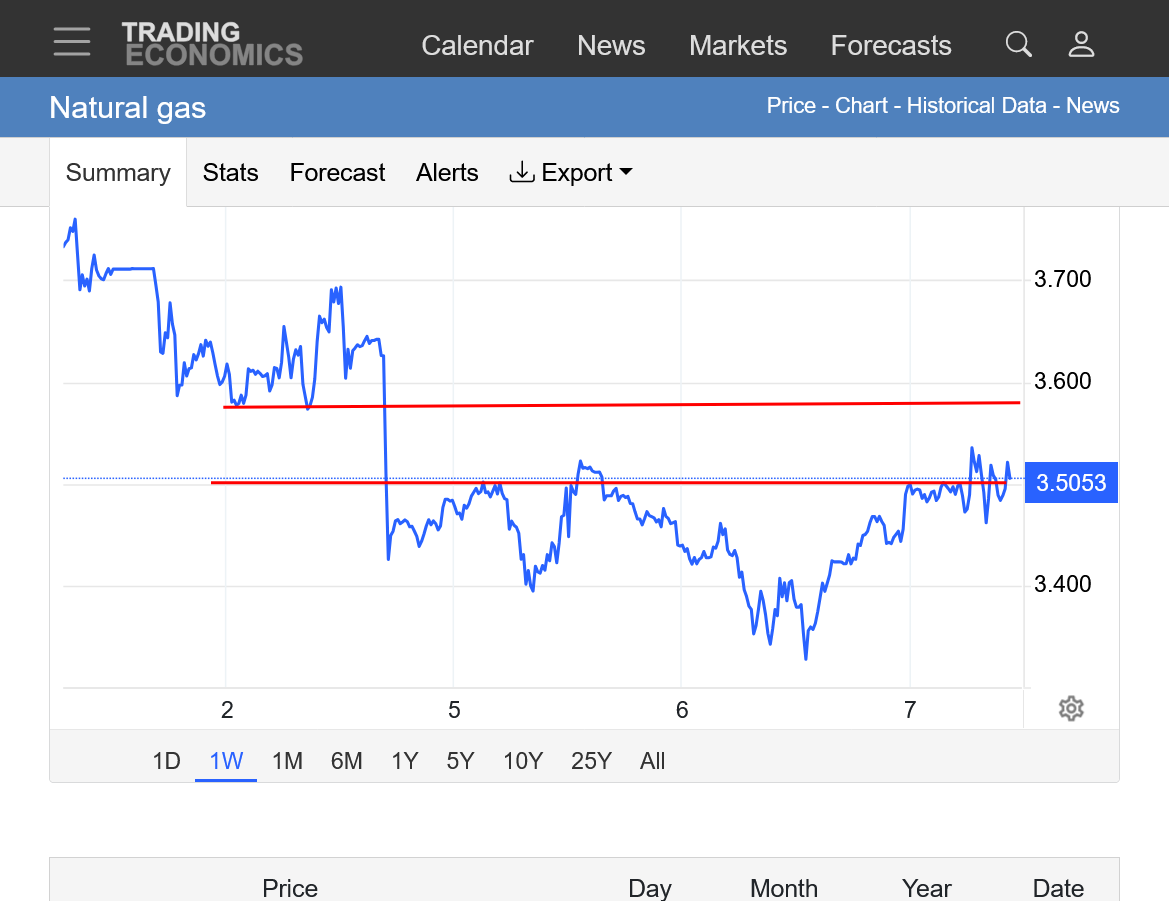
10:45am: I just checked on the actual prices. The top line is actually 3.563 and the HIGH TODAY was 3.549 so we ALMOST completely filled the gap. However, instead the market hit powerful resistance and selling near the top of the gap, being unable to fill it. This could be temporary but is a surprizingly BEARISH reaction to very BULLISH weather forecast models.
Anther thing is that this gap lower is not just on the daily price bars. It was a WEEKLY gap lower. Last week price lows (which happened on Friday) are still higher than this week's price highs, which were earlier this morning.
I still think the weather is too bullish for us to not completely fill the gap which would put in a gap and crap selling exhaustion because the bullish weather getting closer overcame the other very bearish fundamentals.
Less cold 12z models and we'll break out to the DOWN SIDE of the symmetrical triangle/coiling pattern.
And it could definitely be a FAKE out from several warmer days, followed by colder days.
Or a warmer model, followed by a colder model and vice versa.
The 12z Canadian model was extremely cold so I say we break out to the upside, despite this bump down from the early 12z GEFS being warmer.
https://weather.gc.ca/ensemble/charts_e.html?Hour=384&Day=0&RunTime=00&Type=gz
+++++++++++++
https://tradingeconomics.com/commodity/natural-gas
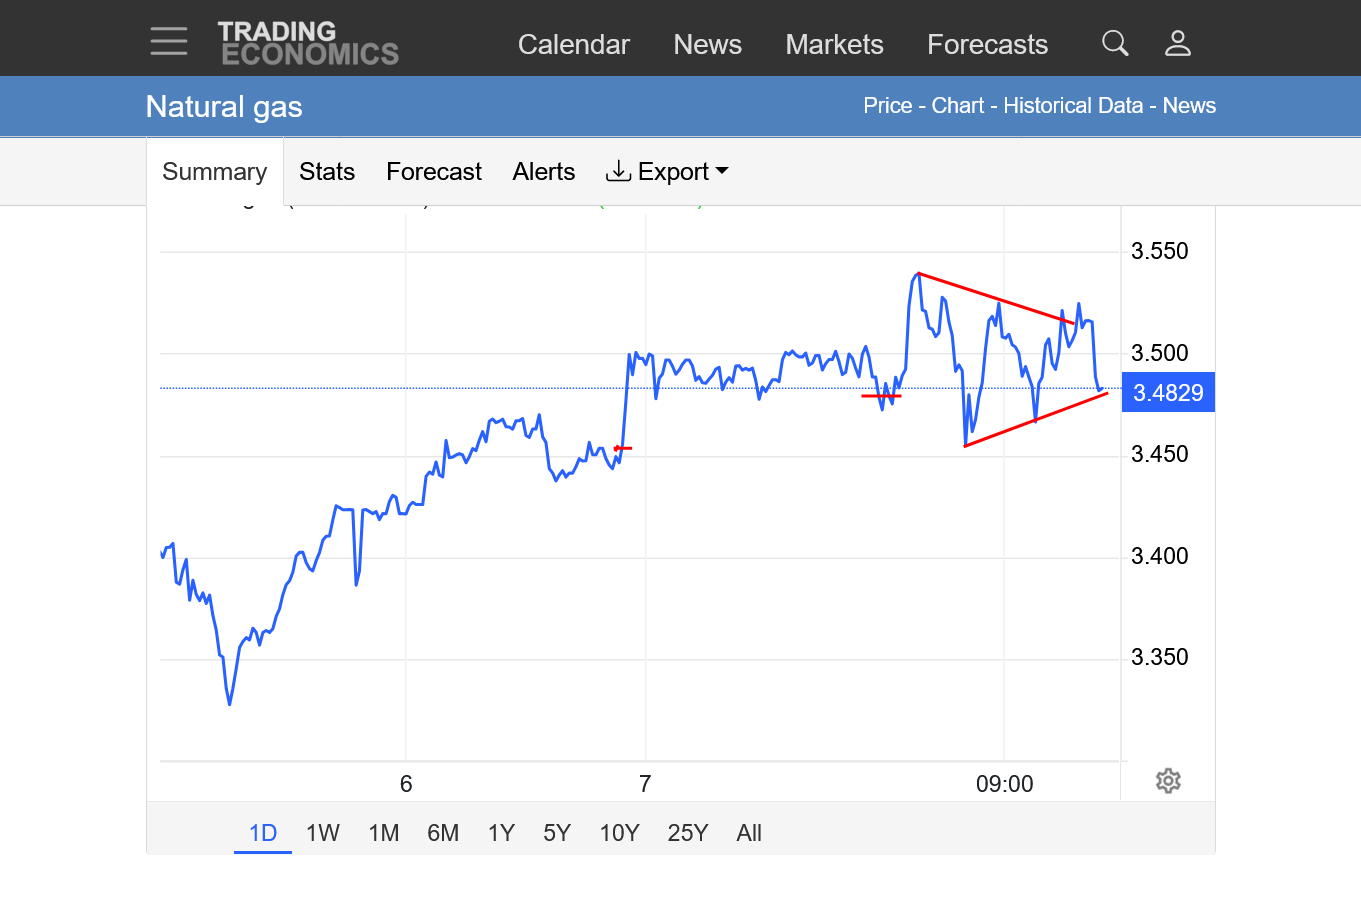
11:55 am:
We just broke out to the upside and filled that gap, which makes it a gap and crap selling exhaustion on the price charts............2 days AFTER I thought it would happen!
If the EE comes out less cold, we could back down but the technical damage has already been done to the bulls!
The EIA natural gas storage number on Thursday will be a bearish/low drawdown but the market knew that last year, when these temperatures were the forecast.
https://www.cpc.ncep.noaa.gov/products/tanal/temp_analyses.php

Natural gas is sharply lower again today(like it was Monday and early Tuesday), negating the gap and crap selling exhaustion formation on the price charts from Wednesday. We were already down sharply before the release but it added to the drop slightly since then. More on that shortly.
Here's the EIA number from an hour ago. Not sure what the market was expecting. As mentioned, January 2025 featured HUGE drawdowns from sustained cold which is making any January 2026 comparisons to January 2025 VERY bearish for the rest of this month. That may be part of the already noted UNDER performance of the market to bullish weather this year and OVER performance when models are LESS cold.
Here are 2 reasons for a weather trader to take note of when the market acts this way.
1. The trader is EARLY on the trade and sees something ahead of the market, BEFORE that being the new focus of the market.
2. The trader is WRONG. Either about the strength of the weather/ change in the weather pattern or most importantly about other fundamentals that the market is focused on that are MORE important than the perceived weather pattern change.
3. The saying "The market is always right" is only correct about the last tick in price which only counts for trades placed at that exact second in time. I look at it as "the market is almost always WRONG" about the future price........otherwise the price would not need to change so much to CORRECT ITSELF. A trader/speculator's job is to determine when the market is wrong and position for the correction closer to being RIGHT.
![]()
for week ending January 2, 2026 | Released: January 8, 2026 at 10:30 a.m. | Next Release: January 15, 2026
| Working gas in underground storage, Lower 48 states Summary text CSV JSN | |||||||||||||||||||||||||
|---|---|---|---|---|---|---|---|---|---|---|---|---|---|---|---|---|---|---|---|---|---|---|---|---|---|
| Historical Comparisons | |||||||||||||||||||||||||
| Stocks billion cubic feet (Bcf) | Year ago (01/02/25) | 5-year average (2021-25) | |||||||||||||||||||||||
| Region | 01/02/26 | 12/26/25 | net change | implied flow | Bcf | % change | Bcf | % change | |||||||||||||||||
| East | 697 | 736 | -39 | -39 | 738 | -5.6 | 745 | -6.4 | |||||||||||||||||
| Midwest | 821 | 865 | -44 | -44 | 886 | -7.3 | 891 | -7.9 | |||||||||||||||||
| Mountain | 256 | 264 | -8 | -8 | 256 | 0.0 | 200 | 28.0 | |||||||||||||||||
| Pacific | 304 | 307 | -3 | -3 | 293 | 3.8 | 246 | 23.6 | |||||||||||||||||
| South Central | 1,178 | 1,203 | -25 | -25 | 1,206 | -2.3 | 1,144 | 3.0 | |||||||||||||||||
| Salt | 343 | 343 | 0 | 0 | 362 | -5.2 | 331 | 3.6 | |||||||||||||||||
| Nonsalt | 835 | 859 | -24 | -24 | 845 | -1.2 | 813 | 2.7 | |||||||||||||||||
| Total | 3,256 | 3,375 | -119 | -119 | 3,379 | -3.6 | 3,225 | 1.0 | |||||||||||||||||
| Totals may not equal sum of components because of independent rounding. | |||||||||||||||||||||||||
Working gas in storage was 3,256 Bcf as of Friday, January 2, 2026, according to EIA estimates. This represents a net decrease of 119 Bcf from the previous week. Stocks were 123 Bcf less than last year at this time and 31 Bcf above the five-year average of 3,225 Bcf. At 3,256 Bcf, total working gas is within the five-year historical range.
For information on sampling error in this report, see Estimated Measures of Sampling Variability table below.

Update:
Story of the Day
Natural gas futures moved lower Thursday after the U.S. Energy Information Administration (EIA) reported a withdrawal of 119 Bcf from working gas storage for the week ended Jan. 2, near consensus but well below last year’s pace.
NG being down sharply today means that my earlier week expectations were wrong about where the price was headed. But I made money from being right about the market being wrong at that point in time (when I placed the trades being long) which is how to make money.
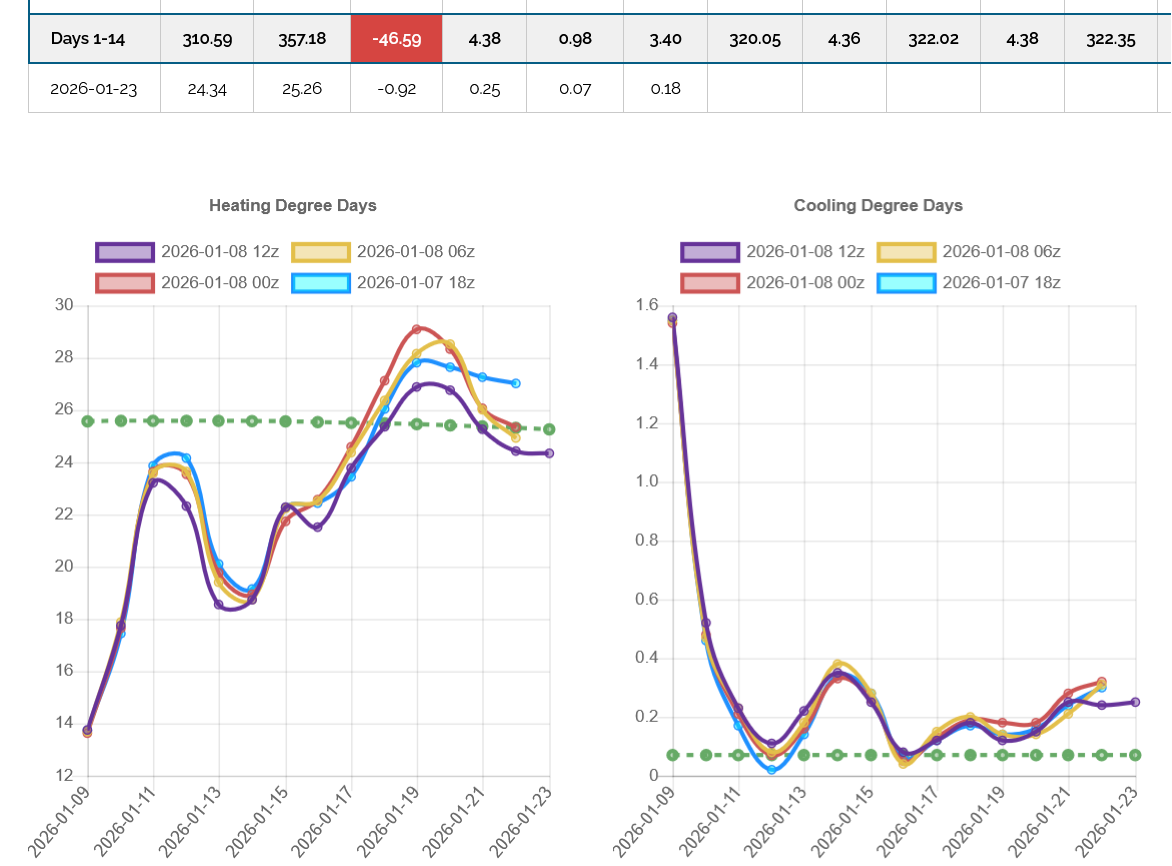
This was the last 0z European Ensemble model, (purple on the left) +5 HDDs compared to the previous 12z run from 12 hours earlier. This SHOULD be bullish for natural gas prices but we're DOWN sharply instead.
+++++++++++++++++++++
https://tradingeconomics.com/commodity/natural-gas
1. 1 day: The first horizontal line on the left was the time frame for the 0z weather models to come out. The EE was the most bullish but the market had already dialed in all the cold from the huge rally on Wednesday. The 2nd line was when the slightly BEARISH/less cold 6z GEFS came out. This also coincided with when the day session with the much bigger traders started. These traders often have a different idea about the market than the overnight, smaller traders did.
2. 1 week: The horizontal lines define the gap lower open on Sunday Night. The top line was last Friday's and last weeks LOWS. The bottom line was the open this week on Sunday Night. The weather models turning EVEN COLDER late Tuesday PM and Wednesday caused the uptrend from the Tuesday low that CLOSED THE GAP completely, making it a gap and crap selling exhaustion formation on the price charts. But there was no follow thru after we barely closed the gap on Wednesday, even with colder models on Wednesday Night.
So after negating the gap lower, downside break away gap to start the week by filling the gap and turning it into a selling exhaustion gap, WE NEGATED THE SELLING EXHAUSTION formation by having no follow through and crashing back below the bottom of the gap and back toward the lows.
As mentioned this week. The market has been UNDER performing with BULLISH weather models and OVER performing on Bearish weather models.
I'll repeat this earlier post about being WRONG and RIGHT.
https://www.marketforum.com/forum/topic/116915/#117077
The 12z runs of the weather models are confirming my previous threads about me being wrong on my Mon-Wed weather forecast about how cold the new pattern is going to be and adjusting it to being LESS cold, which is now in sync with the market.........which is going LOWER today because of the LESS cold forecast.
The frigid weather coming up is still likely, HOWEVER it looks like most of the real cold air will be locked up in Canada and will meet increasing resistance trying to move east and south from the Western US.
The pattern looks too zonal south of the Canadian border to assist that Siberian air pushing southward.
This could change again on Friday but here on Thursday, it's what the Composite Man from Richard Wyckoff's market perspective analysis/views cares about.
https://medium.com/@Blocksavant/composite-man-ca18c9d2d5a5
++++++++++++++
12:30 pm CST:
The 12z GEFS in purple was -10 HDDs compared to the previous run.
We're down over $2,000, just since 5:45 am!!!
The last 0z European Ensemble was +2.5 HDDs over the previous run which gave NG some price support after midnight but we crashed to new lows after that.
The 6z GEFS had about the same projection with 1 exception.
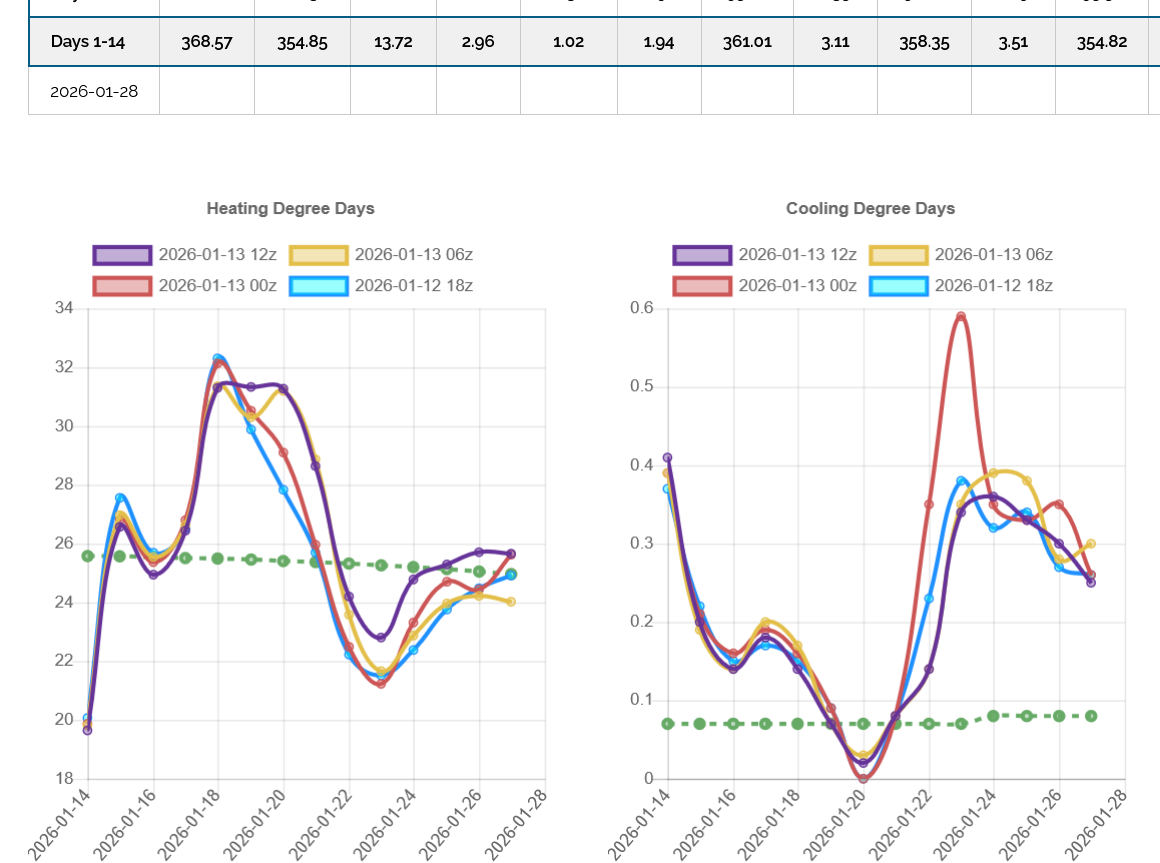
A big part of the problem is the TRAJECTORY of the lines late in the period =DOWN! with the cold moderating instead of increasing.
The last 12z models are giving the natural gas bears a week's end gift as the maps turned sharply milder at the end of the period.
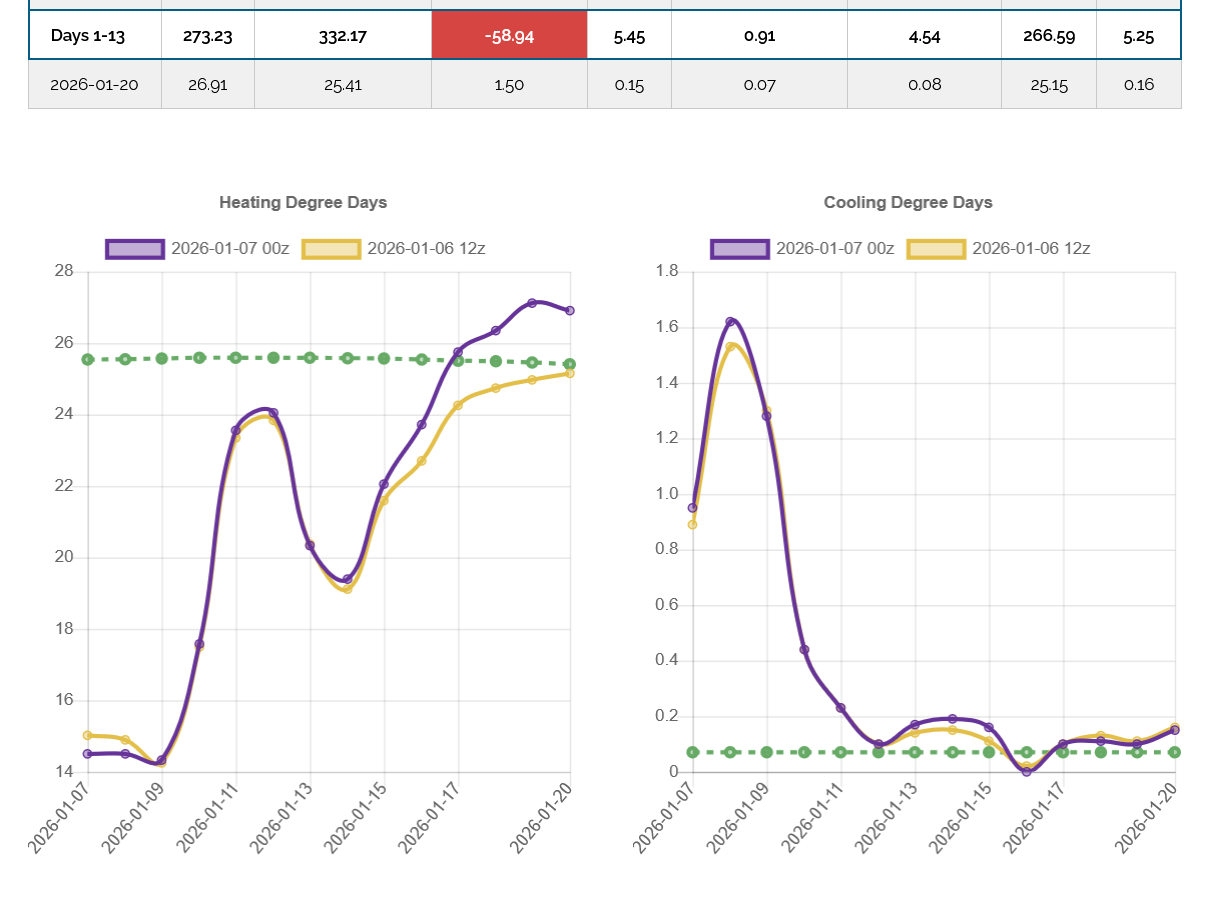
The last GEFS run for HDDs is in purple on the left. The previous runs are in the other colors.
This could still change to much colder again over the weekend!
This was the last 12z Canadian Ensemble model at 16 days out(last map). That huge upper level low centered over the Hudson Bay, with a trough deeply into the United States is the Polar Vortex, displaced unusually far south from its usual position in the high Arctic.
Some of the individual members had this PV even farther south, which would be extremely bullish/cold in the northern half of the US.
https://weather.gc.ca/ensemble/charts_e.html?Hour=384&Day=0&RunTime=12&Type=gz


Thanks, Mike. I see NG is now -6.3% for the day (weakest since Dec 30th if it ends up near here) helped a lot by a warmer 12Z EE. My guess is that it is 10 HDDs warmer than the 0Z.
*Edit: lol, we did it again (typed at same time) except this time it was reversed with my post being one minute later.
Just -4.5 HDDs warmer, Larry because of the early period colder solution as seen on the previous post with the HDD graph.
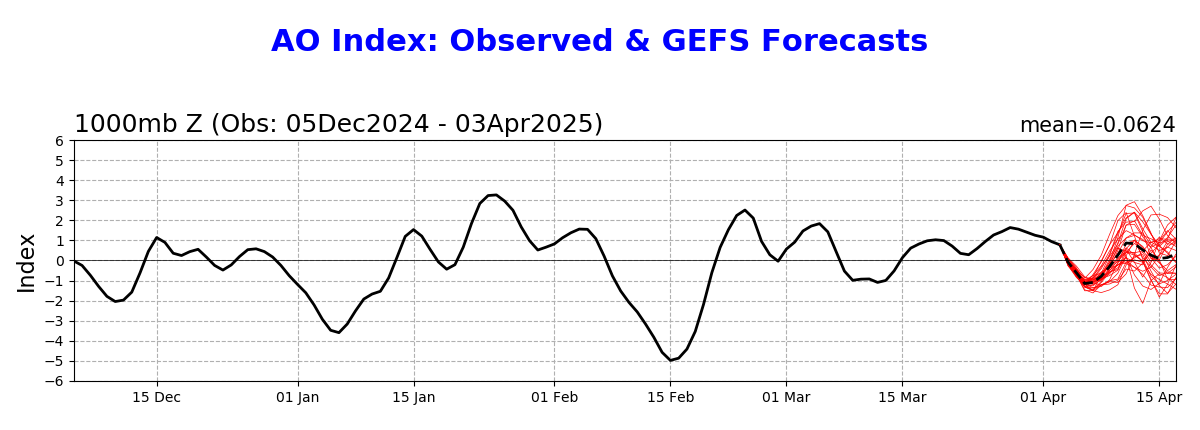
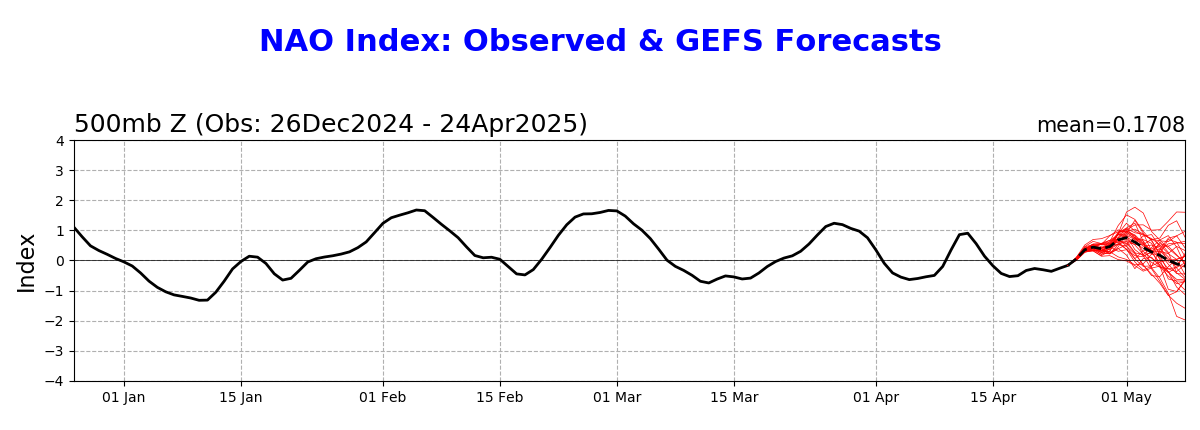
As you can see on the maps below, we will have pretty extreme --AO with numerous solutions even more negative than that average(wide range).
So the cold air will be moving from high latitudes, in fact from Siberia and being flushed thru Canada. However, the upper level ridge in the Southeast and East is blocking its movement into the East with a +NAO.
The favorable for cold, currently +PNA will drop to slightly negative and also make it less favorable for the cold to penetrate deeply south in the US.
As you showed earlier in the week, the models have been too negative for the PNA recently. If that's still the case now, then MORE cold will be coming than these last solutions showed.
https://www.psl.noaa.gov/map/images/ens/ens.html#nh
NCEP Ensemble t = 360 hour forecast
NCEP Ensemble t = 360 hour forecast
Arctic Oscillation Index, North Atlantic Oscillation Index, Pacific North American Index.
https://www.cpc.ncep.noaa.gov/products/precip/CWlink/daily_ao_index/ao.shtml
https://www.cpc.ncep.noaa.gov/products/precip/CWlink/pna/nao.shtml
https://www.cpc.ncep.noaa.gov/products/precip/CWlink/pna/pna.shtml
WX and MetMike
Trading questions based upon my cycle 'suggestion' today marked a low:
1 bull feb/mar or bear spread mar/feb IF bullish
2 buy feb or mar call IF bullish
3 buy feb or mar futures if bullish
Thanks
Note: I am NOT looking for approval or acceptance of a proposed trade, merely seeking YOUR trained opinion on which avenue may best achieve my 'bullish' projection. Diff in feb/mar price, time, etc
Hi tjc,
I was interested in being long for several days last week but only when the weather forecast was getting COLDER. Even on those days, the market was UNDER performing at several points of time on colder updates and OVER performing to the bearish side when weather models were not colder.
That was a warning sign.
https://www.marketforum.com/forum/topic/116915/
1. 1 week. The bottom horizontal line was the bottom of the gap lower on Sunday night. That was a daily AND weekly, downside break away gap. The top horizontal line was the low for the previous daily bar on Friday and ALSO the low for the previous week. So this was a powerful WEEKLY downside break away gap.
When that got filled on Wednesday, the chart formation became a SELLING EXHAUSTION, gap and crap. That happened only after the weather models went from being colder to MUCH colder on Wednesday. The weather changed FIRST, then the market reacted immediately.
The market quickly dialed all of that in and could not follow thru on Thursday with still cold forecast models that didn't continue to get colder, so we dropped below the gap again with slightly less cold maps which NEGATED the gap and crap selling exhaustion.
On Friday, the solutions became less cold again and we collapsed lower and well below previous lows for the move. So we basically had just Tuesday PM and Wednesday being bullish, ending the week down well over $4,000/contract compared to the week before and closing on the lows.
Seasonally, this is NOT a good time to be long.
Early in the heating season, speculators love to buy bullish weather forecasts because there is plenty of time to draw down storage with sustained, huge drawdowns.
January/February/March 2025 were a huge exception because temperatures were so cold for so long. However, that makes the downside seasonal EVEN STRONGER in 2026 because the storage reports for the next 2 months in 2026, compared to 2025 will be BEARISH. The modest deficit in storage in December will turn into a huge surplus by March.
https://charts.equityclock.com/natural-gas-futures-ng-seasonal-chart
 Seasonal Chart")
We are passing the halfway point in Winter. The market knows that even slightly below average temps will not be a problem with current storage and we WILL gain compared to year ago levels.
I only want to be long if we have extreme cold and especially if it penetrates deeply into the Southeast, which looks unlikely.
Only if the weather forecasts are getting MUCH colder. Not even if they are getting slightly colder. The last few days, the forecasts have been getting LESS cold.
As a result, I am NOT interested in being long or in suggesting which bad trade being long is better than the other one.
The weather forecast can change, however.
On a recommendation.
If the forecast turns sharply colder, the best bet is to buy futures on a COUNTER trend, COUNTER seasonal knee jerk upside spike similar to what we saw in the middle of last week with big downs early and late in the week.
That's because:
1. It's against the strong negative seasonal.
2. It's against the current trend and there's NO SIGN of a bottom with us closing on the lows last week.
3. It's against the storage situation which will become increasingly bearish vs last year in Jan-Feb-Mar.
4. It's against the current weather forecasts.
Options, as usual will be OVER priced. To make money in futures, you only need to the price to be a couple ticks better for the buy compared to the selling price. In options trading, if the price is a couple of ticks in your favor you usually LOSE MONEY.
They can give you more staying power but then you will see TIME DECAY in their value which can be greater than the amount of the futures price moving in your direction.
To make money trading futures, you only need to be a tiny bit right about where the price is going. To make money trading options, you often need to be right by an amount that also pays for the time decay AND the high premiums that sellers demand for taking on the risk of being short that option.
It's often said that options lower your risk and that's partly true. They limit the total amount of your risk to the amount you paid or them. In futures, theoretically, you have unlimited risk.
However, in futures you can DEFINE your risk with smart stop placement. This could jerk you out of a good position on a spike up or down that reverses. Happens all the time.
Options keep you in when that happens but YOU MUST BE REALLY RIGHT to make enough money to pay for the COSTLY right to own the option.
And that's your risk.
In futures, there's a small risk to lose big money if you're not careful/smart.
In options, there's a HIGH risk of losing some money, even when you are right but not right by enough.
There are strategies for buying options that make sense and I don't deal with. Producers sometimes buy cheap options after they sell their crop or for other reasons based on them reducing risk OF THEIR BUSINESS and because they are actually doing the OPPOSITE of speculators that make money by TAKING ON RISK.
Farmers want to make smart market decisions that use trading tools to REDUCE ENORMOUS RISKS of their business. Locking in prices and using unique strategies and NOT speculating with their crop/business.
A speculator has the exact opposite objective. They take on risks with 0 intention of taking delivery of anything they buy and not delivering anything they sell. Everything is on paper and covered before expiration.
Farmers and end users use the markets to actually buy stuff they need and sell stuff they grow or produce.
Commodity trading started for them. Speculators often make the markets more liquid because of the massive number of speculative longs/shorts and daily trading volume from them.
When large specs load up in 1 direction, they can greatly distort the price and provide a gift to one side of those that deal with the products, while messing over the other side.
That's much more than you asked for but I very often elaborate with information to educate readers, which is why I'm here. Not to give traders advice to make them money tomorrow but to educate them with knowledge that results in them better understanding markets to make smarter decisions forever.
I'm not anauthority on all the spreads in different markets but know several things about the NG spreads at this time a year.
Along with the seasonal price crash in January for the FRONT MONTHS that can last into Feb but even March in most years is a growing positive in the April-May-June that mainly kicks in with the highest % during April but even in late March in some years. That lasts until early June.
So while the FEB and MAR contracts are still falling, the APR, MAY and JUNE contracts have bottomed.
It's actually the BEAR spreading that make money 90% of the time. SELL the Feb and buy the April, May or June for instance.
There are several reasons for this negative price movement and bear spreading profits.
Supplies in storage for Winter are usually enough to get thru the 2nd half of Winter, so buying by end users often dries up, while end users start buying up the back months to start the injection season.
This seasonal had repeated reliably for so many years, like with other strong seasonals, with time, it turns into a self fulfilling prophesy.
When strong seasonals repeat, traders that follow seasonal patterns like this take note and will increase trades which are intended to exploit this seasonal with positions in the same direction.
This reinforces the same seasonal, even when the fundamentals are not as favorable in some years.
Bear spreading the next 2 months has something like a 80%+ chance of paying off.
The current MILDER forecast amplifies that. I'm guessing that last week, the bear spreads made a killing.
Looks like the Feb ng fell from 5 to almost 3.1 the last month, while the Apr feel from 4 to 2.6 from eyeballing the prices charts.
so Feb is down 19,000/contract and April is only down 14,000/contract.
So the bear spread between these 2 months made $5,000/contract. Besides this being a seasonal, the fact that NG peaked a month ago and has been in a bear pattern, where the front month always leads, (front month is up the most in bull markets) means that bear spread this is expected.
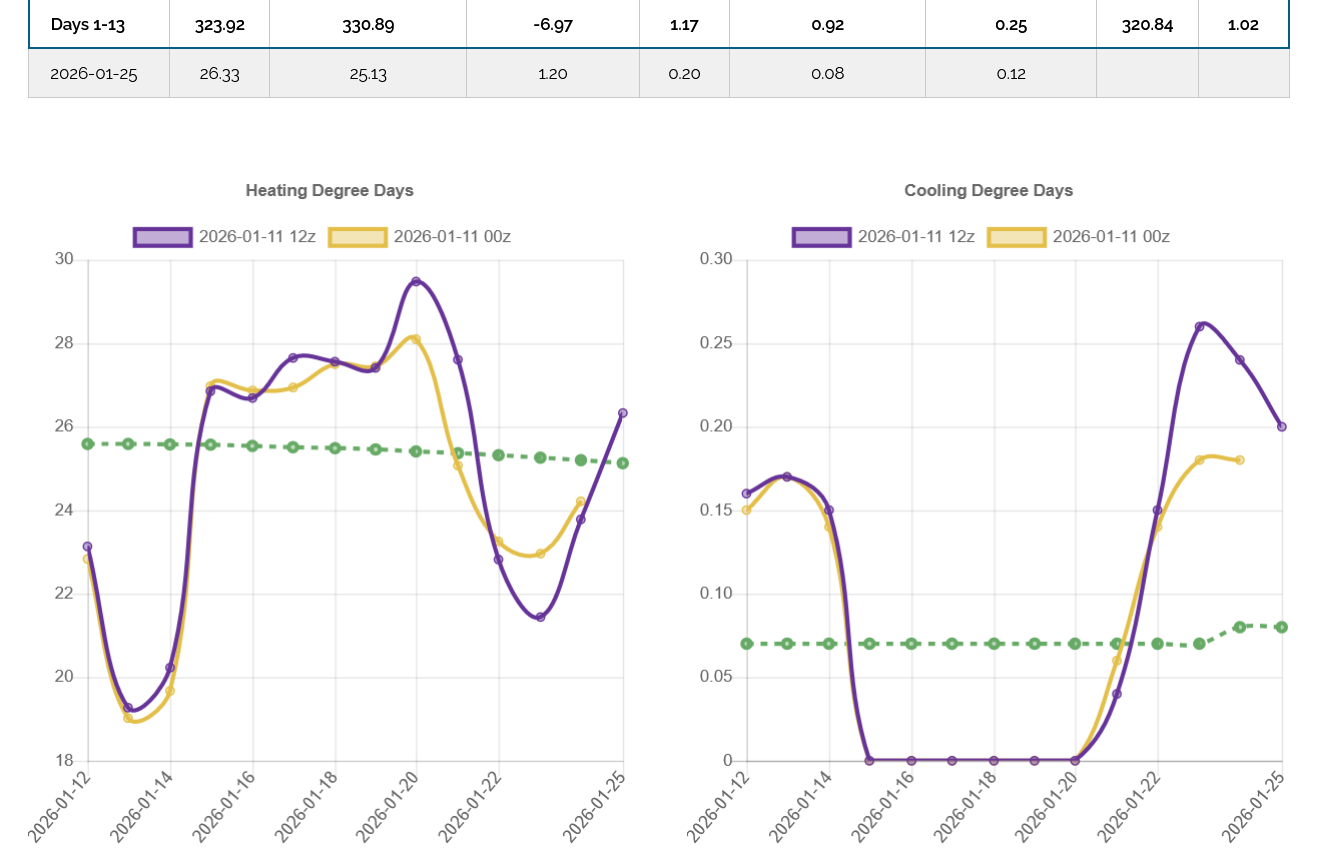
The weather models have turned colder again. This was the last 12z European Ensemble model at +3 HDDs vs the previous 0z run on the left in yellow.
1. The HDDs in the middle of the period are greater.
2. The trajectory of the last 2 data points is UP again now!
I will guess that we open higher tonight. Last week, the weather models were colder too and my early Sunday afternoon guess was a higher open but instead, we gapped lower.
The market last week mostly ignored bullish weather except for the REALLY bullish weather in the middle of the week, that lasted 1.5 days, then it crashed lower with some less bullish(but not bearish weather).
I would be interested again in being long the front month futures(despite every non weather related metric being bearish for the rest of the month) but only on the cold pattern amplifying.
I'll stick with the higher open call (1,000/contract?)but nothing crazy like we often see in natural gas.
I am still interested in being long on MUCH colder models to offset the bearish fundamentals and seasonals and other factors.
++++++++++
5:05 pm: We did open around $1,200/contract higher. Now up just $800/contract.
The red bar on the left is where we open last Sunday night. The one on the right was tonights open.
https://tradingeconomics.com/commodity/natural-gas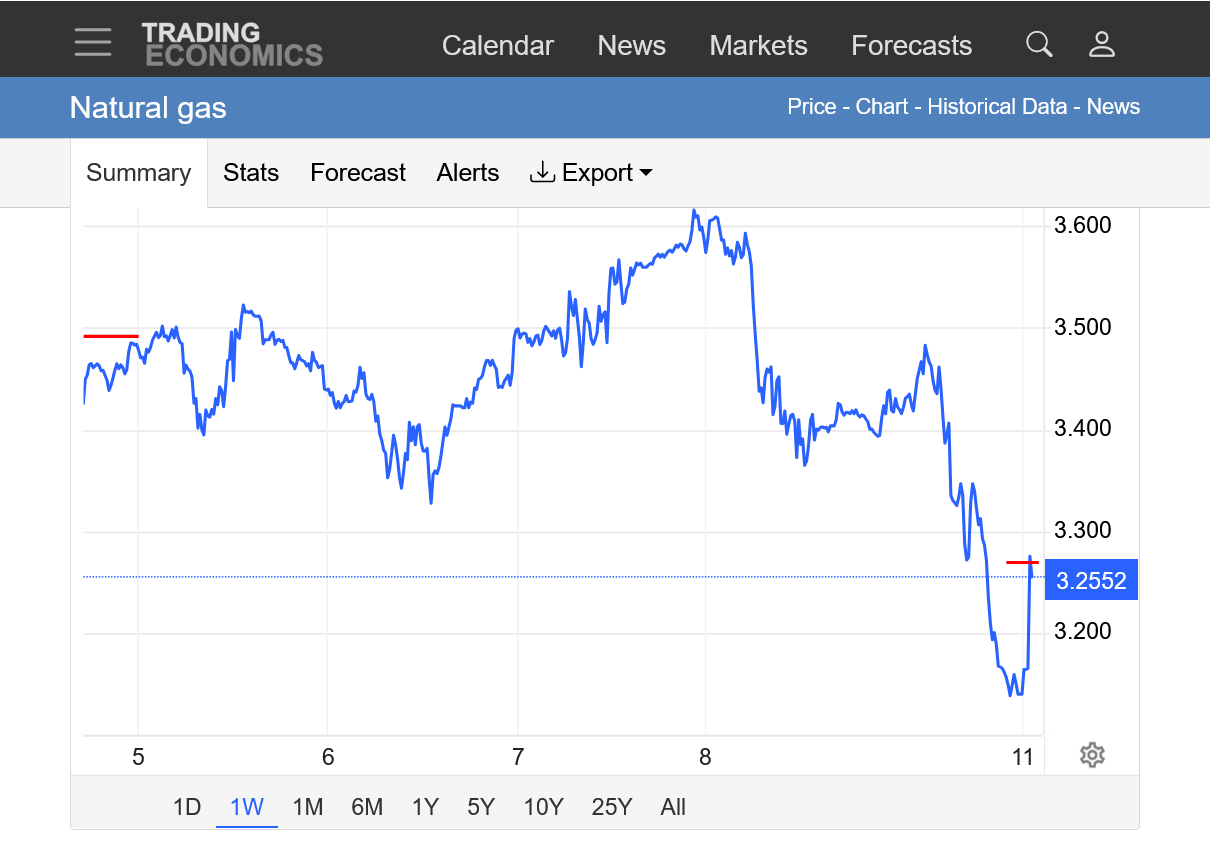
Now we're $600 off the highs. Not exactly a bullish mentality the first 10 minutes.
Good evening, MarketForum
MetMike, thank you for your detailed posts.
As a speculator, I chose to buy the 3.25 call around ten minutes before Friday close. bot .162 and then sold this evening at .212 for $500 profit.
Sell decision was based upon failure to hold initial large gap higher.
Perhaps I was "too careful", but a profit is a profit.
BTW--I will be buying NQH calls when futures dip slightly below the 25800 level
Congrats, tjc,
I guess you just forgot to mention that one in your post 2 days ago discussing this topic after the market closed on Friday!
This last 18z GEFS was another +10 HDDs bullish and now +19 HDDs vs the 0z run from last night.
NG has reacted by drifting LOWER. Now close to the lows and -$750 from the highs.
BTW--I will be buying NQH calls when futures dip slightly below the 25800 level.
NG traders should never be short in April or May without a good reason.
NG traders should not be long the Feb/Mar futures without a good reason. Extreme cold early last year was the BEST reason to be long then.
If the models turn mild and prices drop to your buying price and remain mild, it will take some other, unknown more powerful force to offset all the bearish drivers of price against that trade.
++++++++++++++++
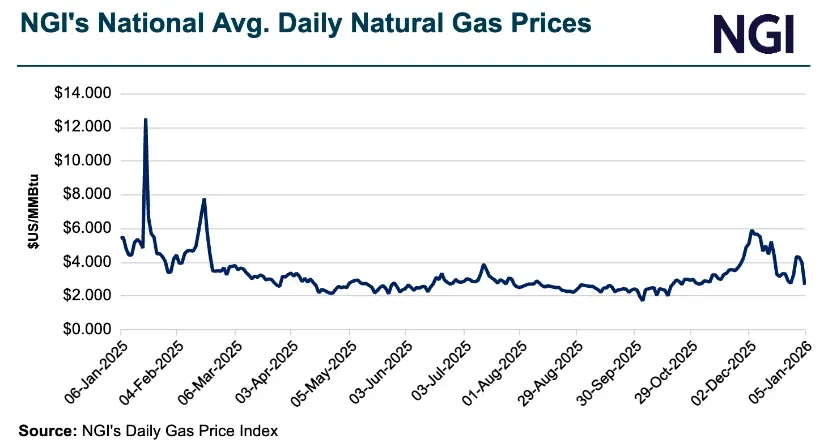
Here's the exact example of what it took last year. In 2025, there was a huge spike up between January 31 and the top on March 10 on the far left of this 1 year price graph.
Note the temperatures in Mid February last year!
https://www.cpc.ncep.noaa.gov/products/tanal/temp_analyses.php

Similar cold in 2026 would do the same thing.
After being extremely weak overnight, trading down to the lows at the end of the overnight session, the bigger daytime session traders decided to aggressively buy at around 8am.
The end of the 6z GEFS that came out prior to this upward surge was pretty bullish.
https://tradingeconomics.com/commodity/natural-gas
1 day map below:
The first horizontal line was the open on Sunday Night.
The 2nd line was when ALL the 0z global weather models were updated around midnight.
The 3rd line was when the 6z GEFS came out around 6am. The European and Canadian Ensemble models are only updated every 12 hours but the American model comes out every 6 hours.
The 4th DIAGONAL line was the sudden buying that kicked in at 8am.
This was the last map which is January 28th

Below were the temperatures from the 6z run at that time frame compared to the previous 0z run:

This last 12z GEFS was a whopping +13 HDDs vs the previous 6z run! Its the purple line on the left. Note it being higher/above the previous runs late in the period.
So natural gas has continued to surge to new highs for the daily session.
https://tradingeconomics.com/commodity/natural-gas
Lows for this day session below were at midnight, then retested at 8am.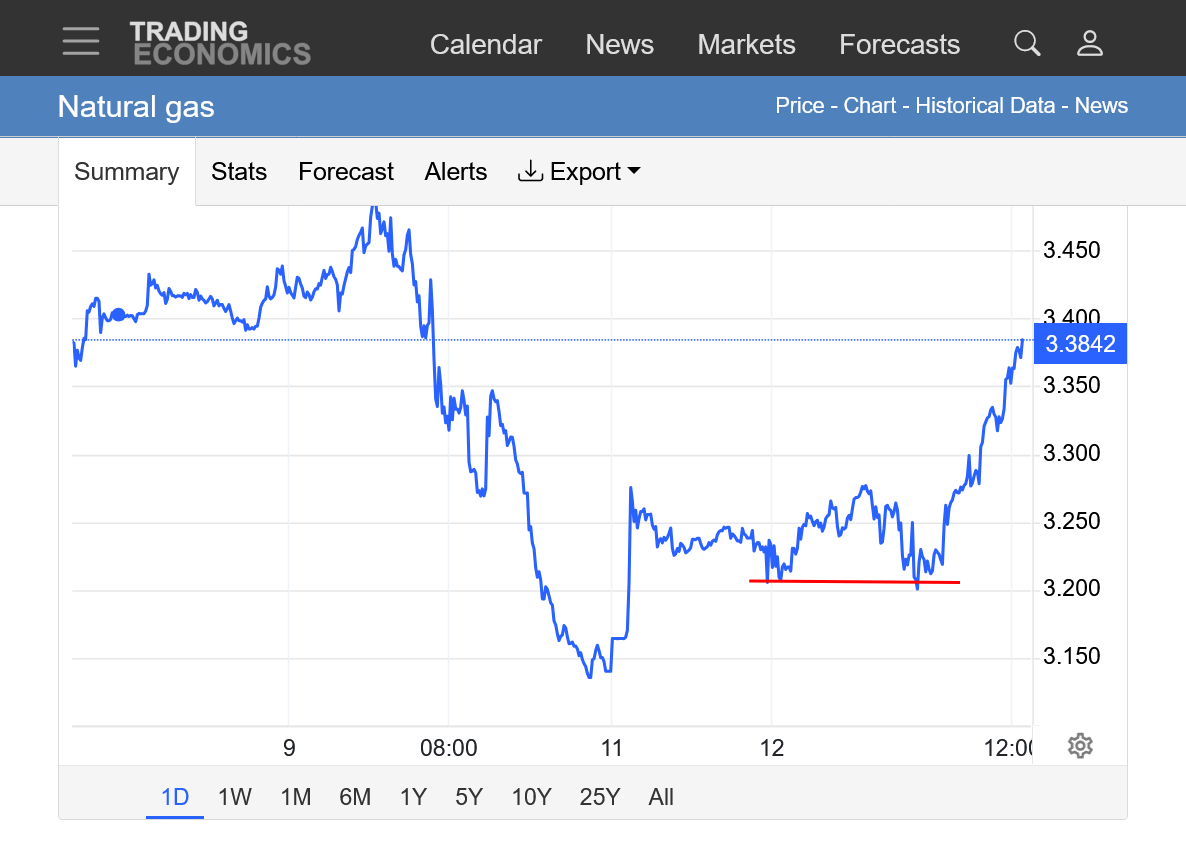
The 12z European Ensemble model has come out even COLDER than the 12z GEFS!
Hey Mike,
My 12Z EE guess is +24 HDD. NG now +7%!
Wow, Larry that would be one of the biggest run to run changes in HDDs that I ever remember.
However, judging from the actual maps, one can make a solid case for something EXTREME.
I'll say +20 HDDs for fun but have the advantage of you guessing first.
If this was The Price Is Right, I would guess 23.9
I'll let you know the actual number within the hour, Larry!
Actually, with the Price is Right rules, I would need to say something lower to win because you can't go over.
Hot off the weather data presses, the HDDs from the 12z run of the European Ensemble model, purple/left was just under +19 HDDs compared to the previous 0z run in yellow.
A change that big doesn't happen to often. The reason is that very frigid air is being flushed into Canada from Siberia but losing its push into the US, causing an incredibly large/tight temperature gradient between the countries.
Model runs that give more push to the colder air, take the southern edge of bitter cold air and shove it into the US. Not just the typical brand of cold in Canada but brutally cold!
Even while milder air from the southern stream dominates the southern US. This is similar to the La Nina analog, which is cold/north and warm south.
This was the temperature change between those 2 models on January 25th.
Note the incredible magnitude of widespread cold changes in the United States which has resulted in the equal and opposite high magnitude WARM UP in Canada as that cold drains south and is replaced by milder air up there.
This was the upper level pattern leading up to that.
The colors show the CHANGE from the previous run. Not the troughing increases in blue and the ridging increases in brown/yellow.
The streamlines have taken on a stronger north to south component because of that, which is steering the bitter cold from Canada into the United States.

1. 1 day: We had a pretty bullish day but closed $800/contract off the highs. The open Sunday evening is the red line.
If this were December, the gains would have been doubled and we would have closed on the highs.
We can still go higher but mainly if the models keep getting colder. The magnitude of the cold increase today was incredible and the gains were not impressive for that amount of cold. As a reminder, the forecast also got colder on Sunday, which is why we opened higher to start the week(and struggled to hold those gains overnight).
If that cold goes away, we will likely drop to new lows for the move. If it increases, we can still go higher but will need the Polar Vortex to move close and sustained brutal cold to go alot higher.
2. 1 week. There is a main downtrend but 3 spikes up, each spike up was from a big cold update on the weather models.
3. 1 month Natural gas plunged $13,000/contract, part of that was the rolling over to the new, lower priced February contract. In a weather market, this often is a great buying set up if the weather pattern changes from bearish to bullish. the problem is that we have turned MUCH COLDER than the pattern was and look how much the price has fallen.
Anytime the forecast is less cold, we've given back all the gains from the colder updates and dropped even lower, even though the forecast is colder than where it was at a higher price. This tells us the market WANTS TO GO LOWER and we are fighting that.
We can win that fight but only with more extreme cold!!!
This last 18z GEFS, purple/left was a whopping -20.5 HDDs vs the previous extremely bullish run.
Small changes in the southern edge of the extreme cold in Canada are making huge changes!
I put a red line to show when the 0z guidance came out early last night, confirming some of the cold changes from a couple of days ago that added HDDs.
NG added to their gains so far this week after that during the rest of the overnight period, then............BOOM. The large traders jumped on it to crush the rally.
This is not how a bullish market behaves.
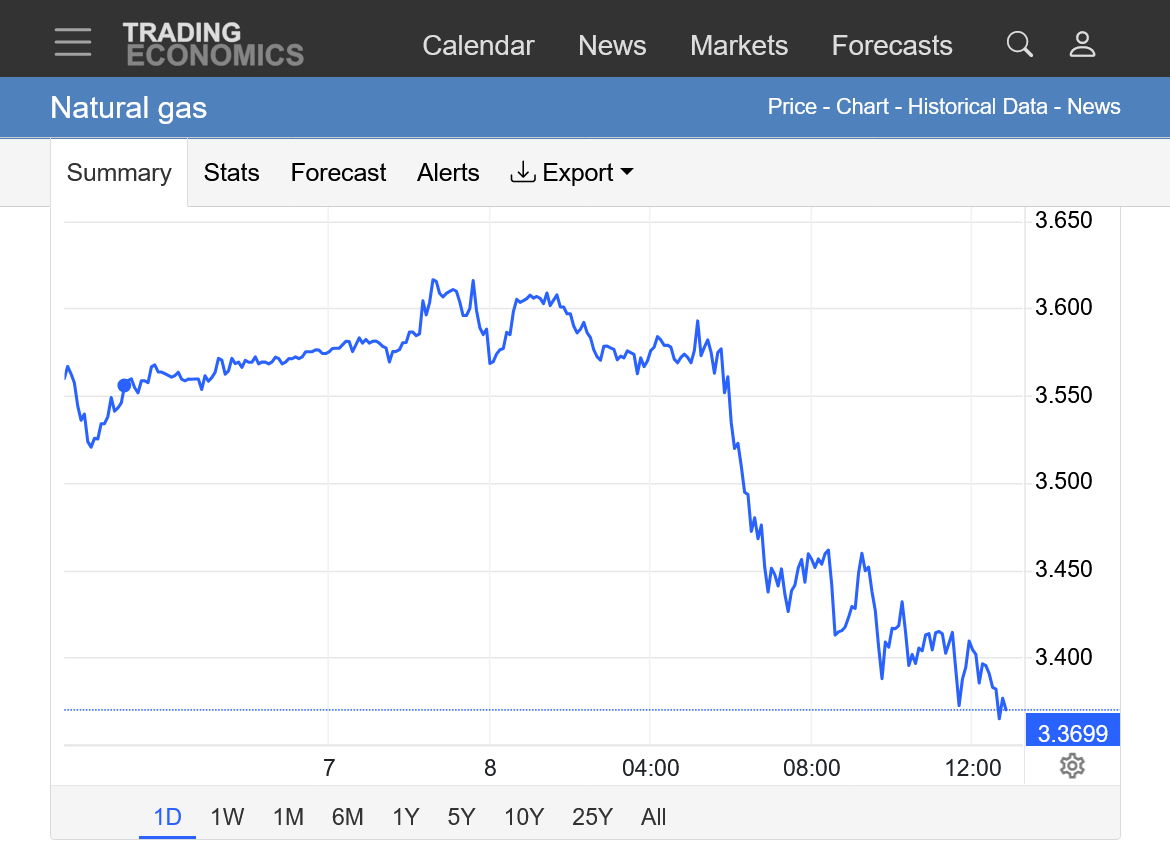
https://tradingeconomics.com/commodity/natural-gas
I was long for +$190/contract on the MUCH colder 12z GEFS but the market is still acting horrible(underperforming on added cold weather) and have to put a trailing stop in any time we have a bounce because the market struggles to hold it.
The last 12z GEFS is in purple/left for HDDs. We should be up +$1,000/contract at least, not down -$400 contract with a forecast like this. Maybe we will be shortly.
We can see how choppy the price has been this morning on the chart below:
1. The EIA number will be unusually small for this week from the widespread, extremely mild temps, except in the far Northeast.
2. This compares to some extreme cold year ago, except in the West.
https://www.cpc.ncep.noaa.gov/products/tanal/temp_analyses.php


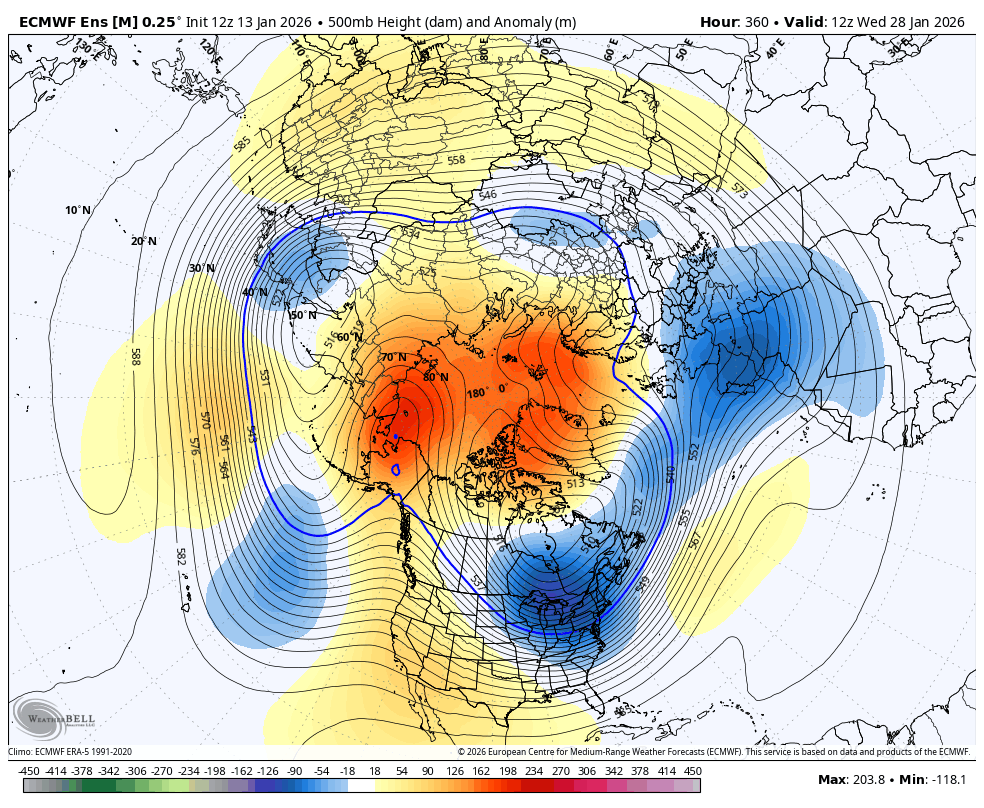
This was the 500 mb map at the end of the 12z European model. WOW!
Textbook extreme high latitude ridge/mid latitude trough couplet for effectively delivering bitter cold air from the highest latitudes, south to the middle latitudes and DEEPLY into the densely populated cities of the Eastern half of the United States that use the most natural gas in Winter.
If this were December 13th and not January 13th, natural gas would have been +2,000/contract. Instead, the front month was LOWER today.
+++++++++++++
Imagine where we would be if the forecast hadn't turned extremely cold the last 2 days!
Regardless, I do think there's a good chance that the lows are in, especially if this cold stays or gets colder.
As I mentioned on Sunday, it's the ONLY thing that can overcome all the bearish forces pushing natural gas down in January in most years.
If this cold diminishes in the forecasts, don't be long!
The 18z GEFS was another +9 HDDs but NG is still lower compared to the close on Tuesday!
I don’t remember natural gas ignoring this much added cold in Winter before.
The last 6z GEFS was -11 HDDs(purple line on the left). This forecast is still VERY cold but as expected, any time of the cold is taken out, NG gives up much of the gains.
https://tradingeconomics.com/commodity/natural-gas
1. 1 day: First red line was the slightly less cold 0z guidance putting some pressure on prices around midnight. 2nd line was the just out, LESS cold 6z GEFS shown above in purple which comes out just before 6am.
2. 1 week: Red line was the higher open on Sunday Evening. After the jump higher on even colder forecast maps, brutally cold for some days, we've dropped back down to the opening price on Sunday Night.
++++++++++
8:45am
Natural gas is really getting crushed now!!!
1. Red line below was the higher open on Sunday. The price is NOW down to the lows from last week.
2. 1 year: The surges up the last week from colder weather forecasts are just dead cat bounces that hardly show up. Tremendous bearish forces have dominated since we had the buying exhaustion on Friday, December 5th.
By metmike - Dec. 5, 2025, 2:15 p.m.
NG continues to crash lower. I would have posted more overnight but I was having a sleep study done at a sleep clinic with 2 dozens electrodes hooked up to my body and brain and they would not allow me to use my electronics. I have severe central sleep apnea. I just got up from a nap since people usually don't sleep that well during sleep studies.
The weekly chart below features 3 times frames/levels.
1. The release of the milder 6z GEFS this morning. Small horizontal line.
2. Below that was the HIGHER open Sunday Night on increased cold on Sunday. You can see choppy bounce up that ended decisively with the release of the milder 6z GEFS.
3. The bottom line is the low from last week and the previous low for this move. We are now BELOW it and down over $3,000/contract just today from the models turning milder.
+++++++++
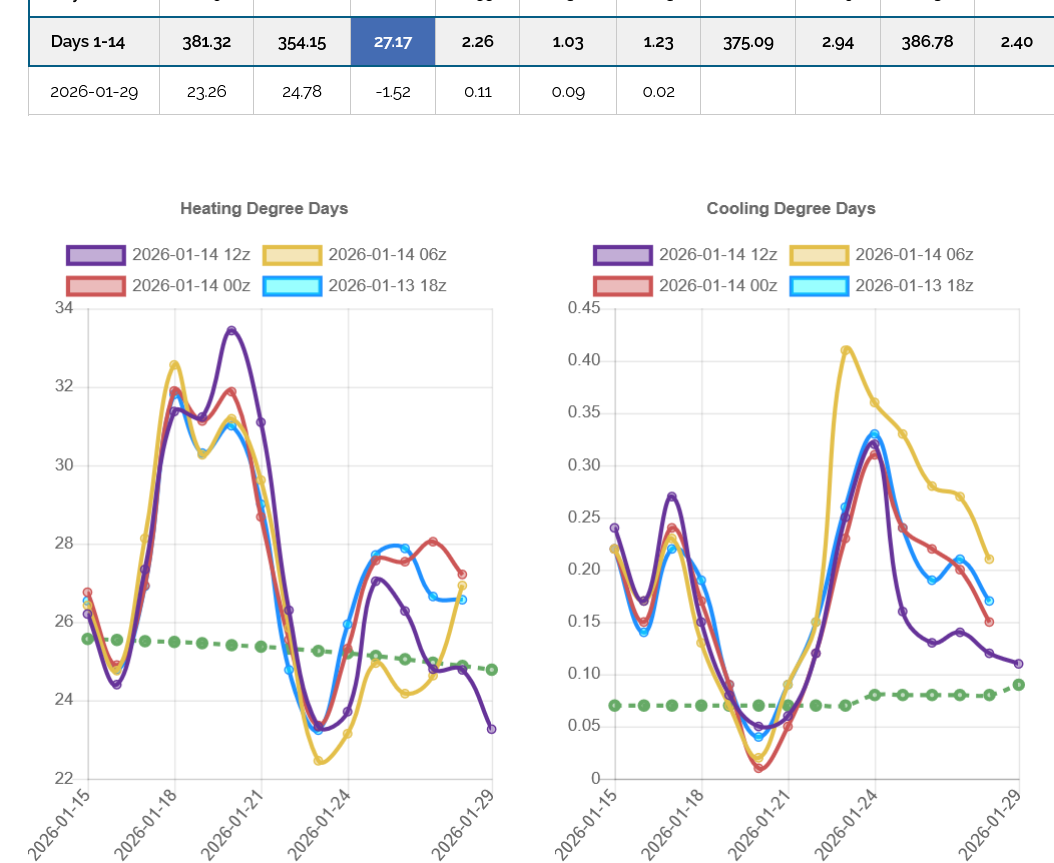
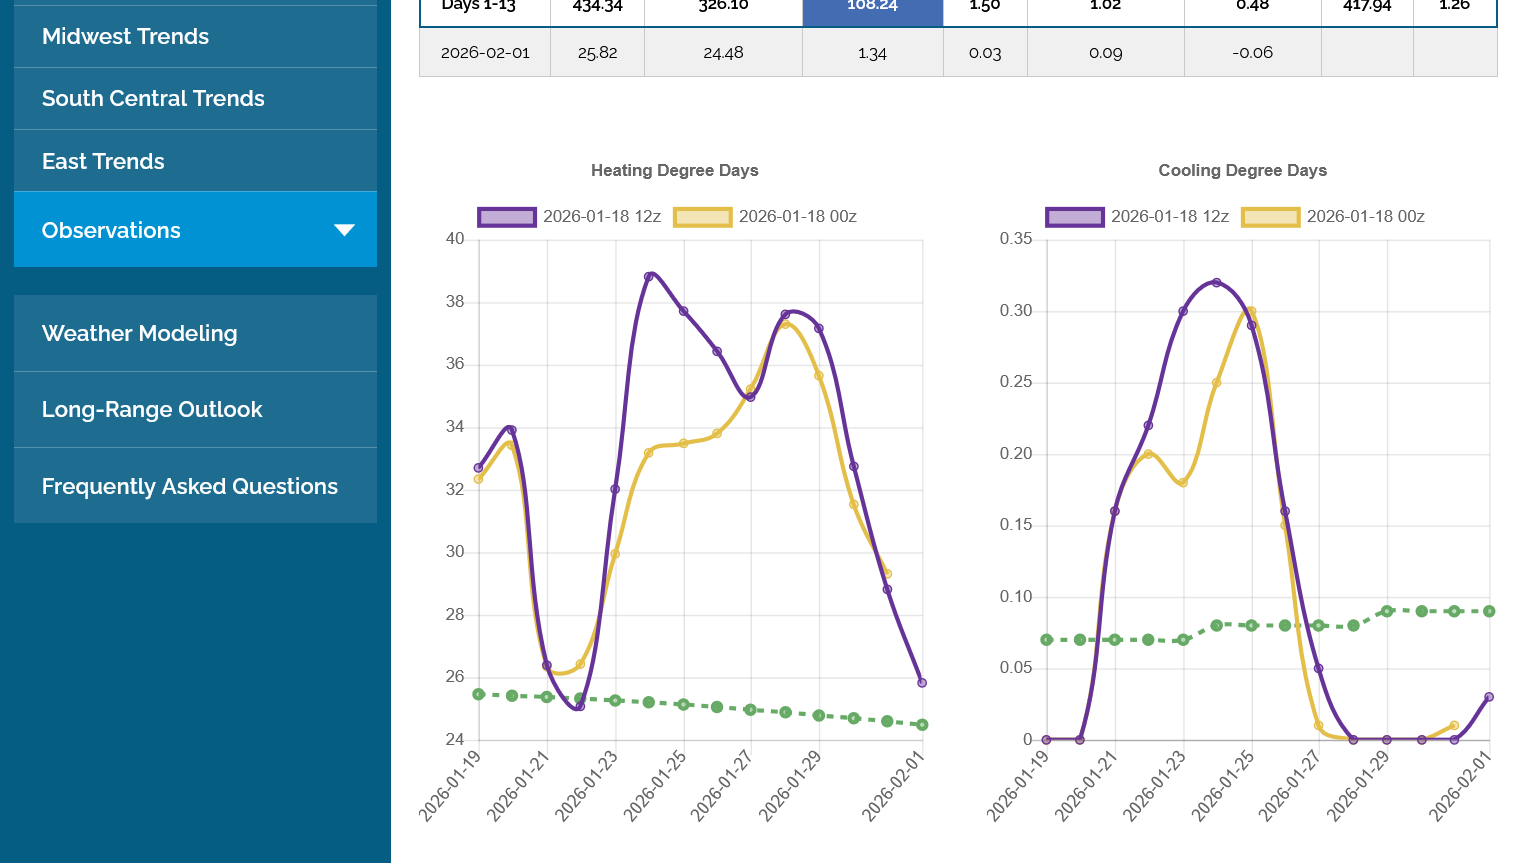
This was the HDD data from the GEFS, purple being the last 12z run. 2 things to note.
1. There were actually MORE HDDs than the bearish 6z run that broke the bulls back(but still LESS than the 0z run)
2. Note the TRAJECTORY at the end of the period.....down sharply for the last 4 data points and BELOW the green climatological line for the first time this week. As Joe K. use to say. The call it FUTURES and not PASTures. The market dials in NEW information about the future and for weather, the week 2+ period almost always has the biggest trade-able changes.
3. Because of my sleep study overnight and the fact that the forecast is still pretty cold, I did not get short, regardless of the previous analysis. Regardless, there will be thousands of wonderful similar activities.
++++++++++++++++
1. This was the last 12 European Ensemble model. This is actually very cold/bullish in the absolute sense!
2. Look at the same run from 24 hours ago when it was EXTREMELY bullish. The market dials in what it knows, then trades almost exclusively at times on NEW information. The NEW information today was LESS bullish than the extreme bullishness of yesterday(in a market that had been UNDER performing on bullish weather all month)
Re: Re: Re: Re: Re: NG 1/1/26+
By metmike - Jan. 13, 2026, 7:02 p.m.

Last map from the same source 24 hours earlier below:
The other thing too about weather trading set ups for me. After a massive move down over the course of a month+ it's NOT a selling set up. It's a buying set up on adding extreme cold providing a bounce higher. After dropping $20,000/contract already since the highs, it's almost impossible to justify being short on anything other than extreme warmth and bearish weather.
However, the key here for making a bit of money was tactfully picking the colder model update time frames and LIMITING the buying to ONLY those times frames and LIMITING risk and LIMITING objectives because of recognizing the markets blatant UNDER reaction to huge cold changes.
NOT basing it on what the market SHOULD BE doing based on MY weather analysis or even MY indicators.
I tell my students that the most important move in chess competitions is WHAT YOUR OPPONENT DID LAST. We all know what our strategy is and developing that is profoundly critical but its at least as important to respond defensively to our opponents strategy and the only way to know that is to pay very close attention, being tuned into their last moves.
Same thing paying attention to the markets last move.
It's still possible if we get cold enough for the market to have some upside potential. It's still a buying set up ON WEATHER getting colder but picking bottoms is usually a really bad idea without powerful justification.
Markets making new lows are doing it because the COMPOSITE MAN is telling us that market fundamentals driving price and trader mentality are at the most bearish yet in the big move down.
There is ZERO indication right now of the market thinking otherwise, amazingly with BULLISH weather.
The market did this today on LESS bullish weather. NOT bearish, just LESS bullish. The big traders controlling money flow, the commercials, end users and large spec that trade fundamentals, seasonals and other items think this price is STILL TOO HIGH!
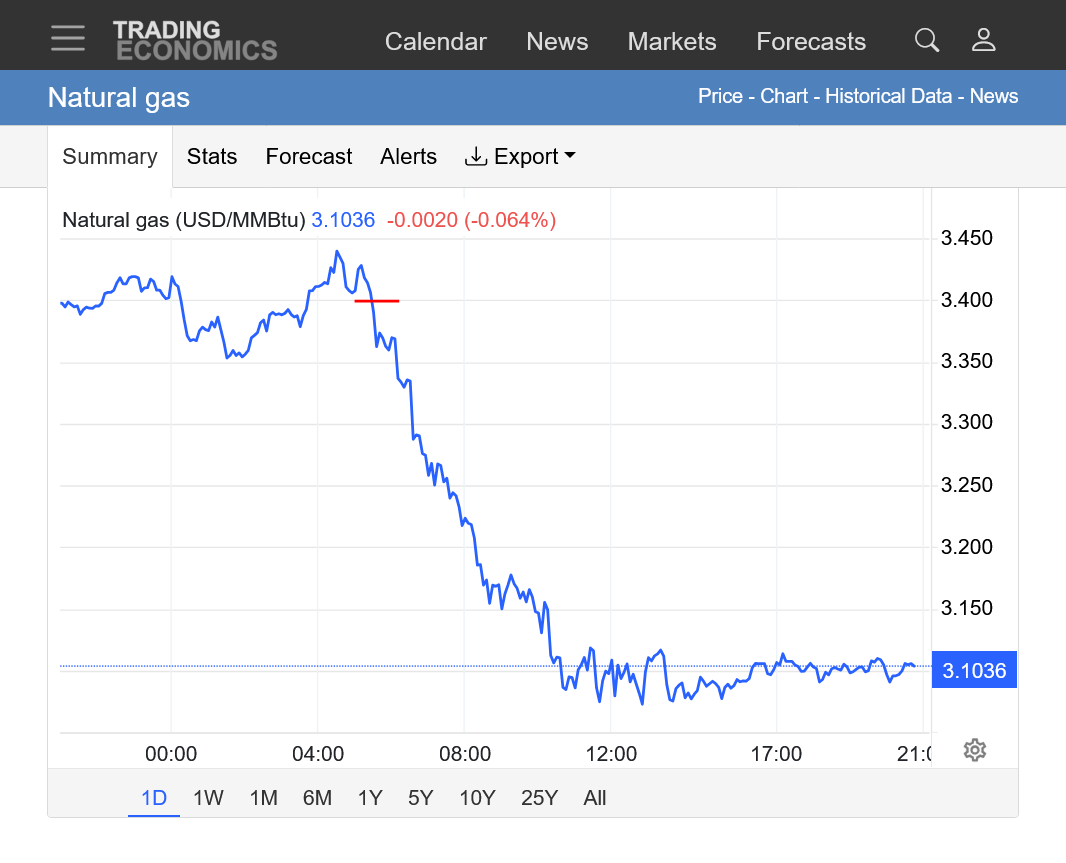
https://tradingeconomics.com/commodity/natural-gas
1. 1 day: The $3,000/contract drop in price during the day session, was apparently triggered by the LESS bullish 6z GEFS early this morning with most of the drop before the next models runs came out(which confirmed the LESS cold changes). There could have been additional news that I don't know about.
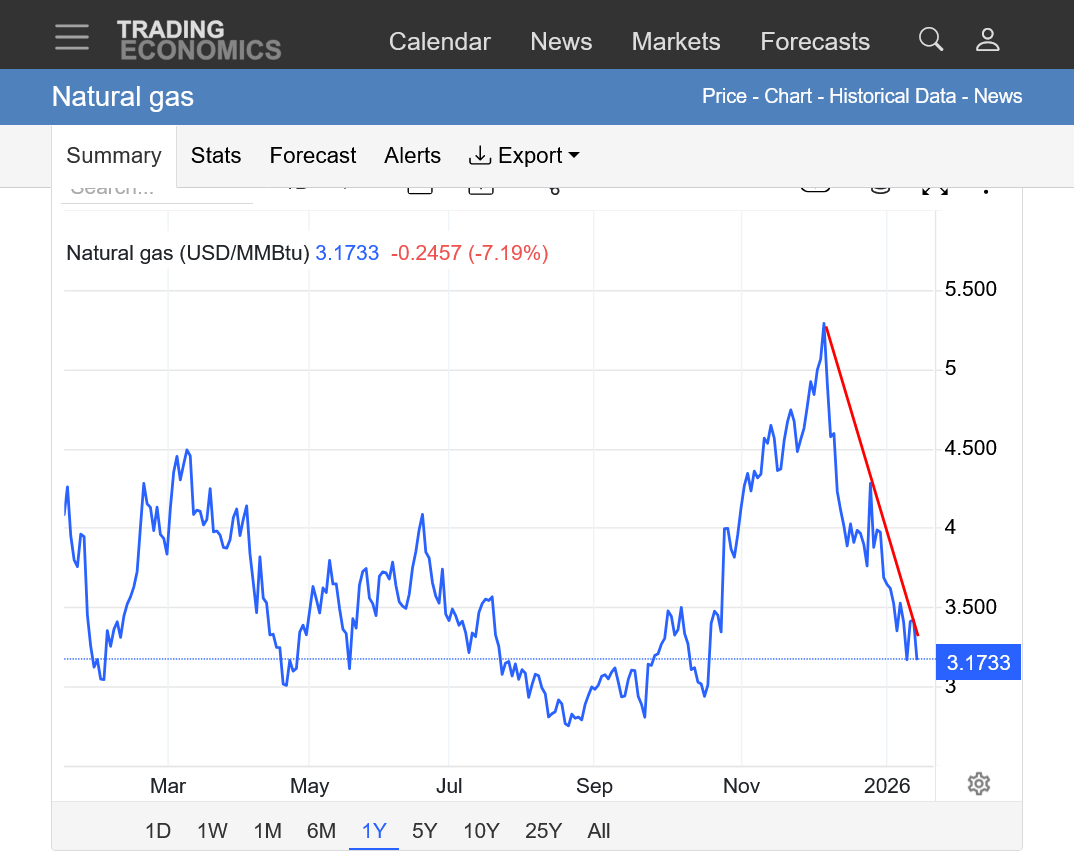
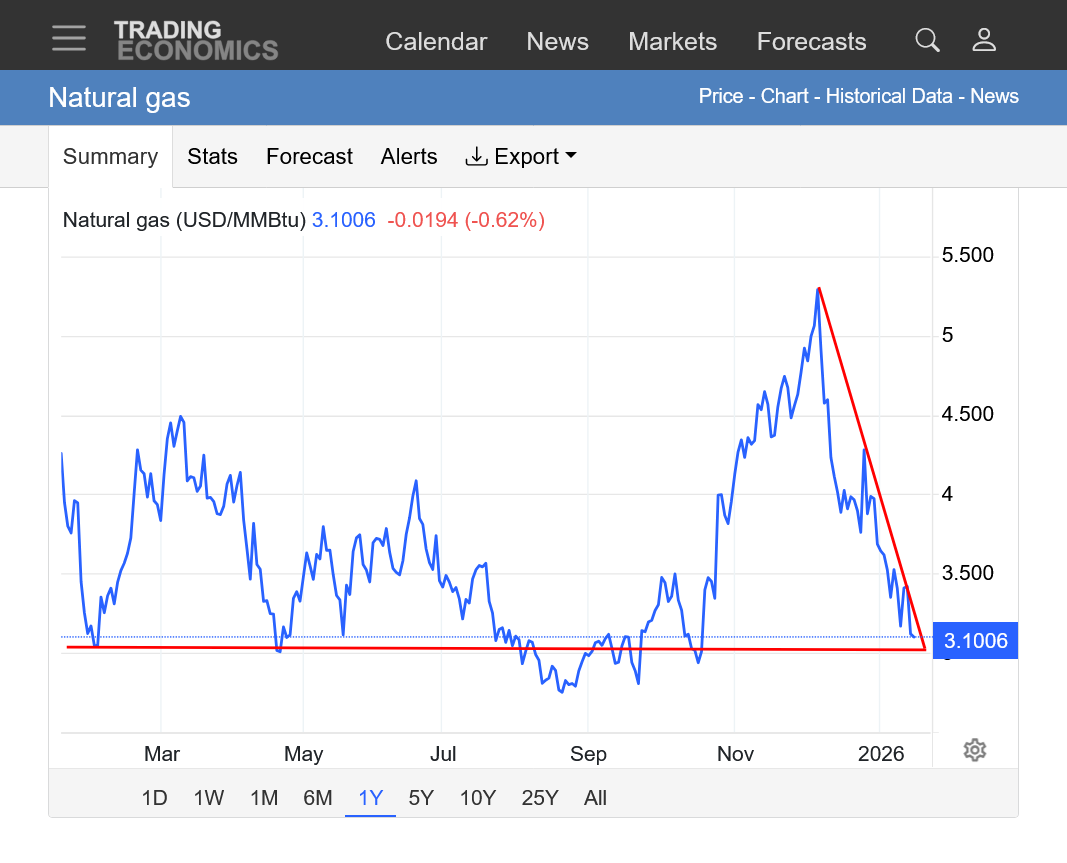
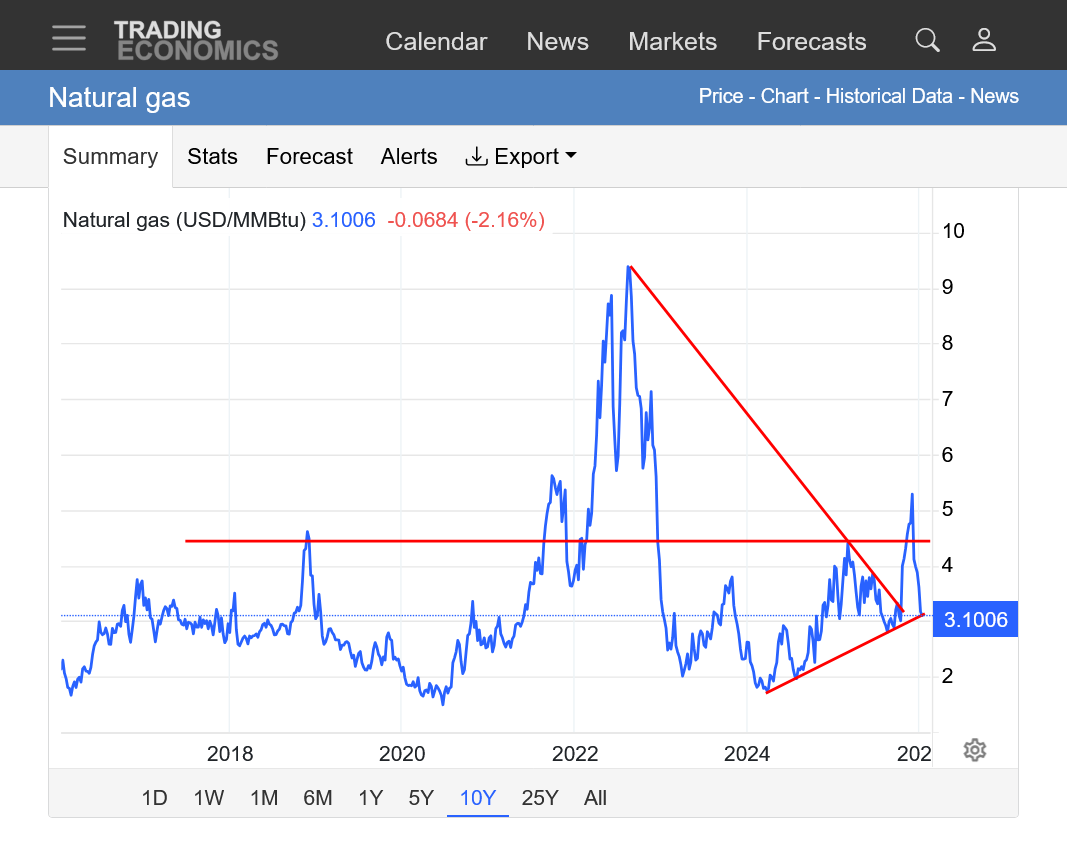
2. 1 year: MAJOR support just below at $3. However, a market falling this far, this fast, despite BULLISH weather coming up is telling us the price of $3.1 is still too high. Only EXTREME cold that is COLDER than this cold will reverse the price up and even then, it better stick around awhile to keep us this high.
3. 10 years: We had a HUGE upside breakout from the longer term symmetrical triangle. We also broke out above some previous long term support but then collapsed below that FAKE OUT! Now we're back down to testing the uptrend from the early 2024 low. This was last tested from the record cool late Summer temperatures 4.5 months ago and will be violated if temperatures keep getting less cold.
Is Feb Gas beginning to 'adopt' a colder, must cover shorts attitude? Turned plus 10am ish !
The market clearly thought the EIA number was bearish with a brief, immediate spike lower which tested the key $3 support level.
NG continues to massively UNDER perform based on the amount of cold in the forecast. I'm not interested in a mentality that thinks I'm smarter than the market about how its not acting more bullish with this much cold. The market, at least recently is not going to care unless the forecast is MUCH colder than whatever the previous forecast was and then, as soon as it stops getting MUCH colder, and goes even lower.
Note on the graph below that the BLUE LINE, which is current storage, because of recent mild weather is now at the TOP of the 5 year average and trying to break above it, which may happen with next week's report. The market cares about that and compared to the frigid weather at this time a year ago, we will add massively to the surplus compared to 2025 in the future.
![]()
for week ending January 9, 2026 | Released: January 15, 2026 at 10:30 a.m. | Next Release: January 22, 2026
| Working gas in underground storage, Lower 48 states Summary text CSV JSN | |||||||||||||||||||||||||
|---|---|---|---|---|---|---|---|---|---|---|---|---|---|---|---|---|---|---|---|---|---|---|---|---|---|
| Historical Comparisons | |||||||||||||||||||||||||
| Stocks billion cubic feet (Bcf) | Year ago (01/09/25) | 5-year average (2021-25) | |||||||||||||||||||||||
| Region | 01/09/26 | 01/02/26 | net change | implied flow | Bcf | % change | Bcf | % change | |||||||||||||||||
| East | 664 | 697 | -33 | -33 | 679 | -2.2 | 705 | -5.8 | |||||||||||||||||
| Midwest | 790 | 821 | -31 | -31 | 818 | -3.4 | 842 | -6.2 | |||||||||||||||||
| Mountain | 251 | 256 | -5 | -5 | 242 | 3.7 | 190 | 32.1 | |||||||||||||||||
| Pacific | 302 | 304 | -2 | -2 | 284 | 6.3 | 238 | 26.9 | |||||||||||||||||
| South Central | 1,178 | 1,178 | 0 | 0 | 1,127 | 4.5 | 1,104 | 6.7 | |||||||||||||||||
| Salt | 355 | 343 | 12 | 12 | 331 | 7.3 | 322 | 10.2 | |||||||||||||||||
| Nonsalt | 823 | 835 | -12 | -12 | 796 | 3.4 | 782 | 5.2 | |||||||||||||||||
| Total | 3,185 | 3,256 | -71 | -71 | 3,152 | 1.0 | 3,079 | 3.4 | |||||||||||||||||
| Totals may not equal sum of components because of independent rounding. | |||||||||||||||||||||||||
Working gas in storage was 3,185 Bcf as of Friday, January 9, 2026, according to EIA estimates. This represents a net decrease of 71 Bcf from the previous week. Stocks were 33 Bcf higher than last year at this time and 106 Bcf above the five-year average of 3,079 Bcf. At 3,185 Bcf, total working gas is within the five-year historical range.
For information on sampling error in this report, see Estimated Measures of Sampling Variability table below.
+++++++++++++
Note the temperatures in Mid February last year!
https://www.cpc.ncep.noaa.gov/products/tanal/temp_analyses.php
Thank you MetMike for update.
NO bottom in sight for N Gas. Perhaps at Feb contract expiration when March comes on much lower?
Thanks, tjc!
Despite NG being a bear market right now ( I missed almost the entire move down and the BIG money, instead making a bit of money on the dead cat bounces) I will continue to look for more dead cat, knee jerk reaction bounces on MUCH cold weather forecasts with the objective of holding for as short as minutes to possibly hours and unlikely days, which would be a position trading time scale.
I note today, that the Feb is down LESS than the March and acting much more bullish than the March.
This could be the near term is being pulled higher from the higher cash price from the major cold in the short run. Or it could be other reasons but it's actually a bullish sign when the front month is stronger like this.
We should note that the March is weaker than April which is weaker than May, so the back months are holding up best but the back months are also way cheaper and the seasonal that works in most years is those back months almost always bottom first in the 2nd half of Winter.
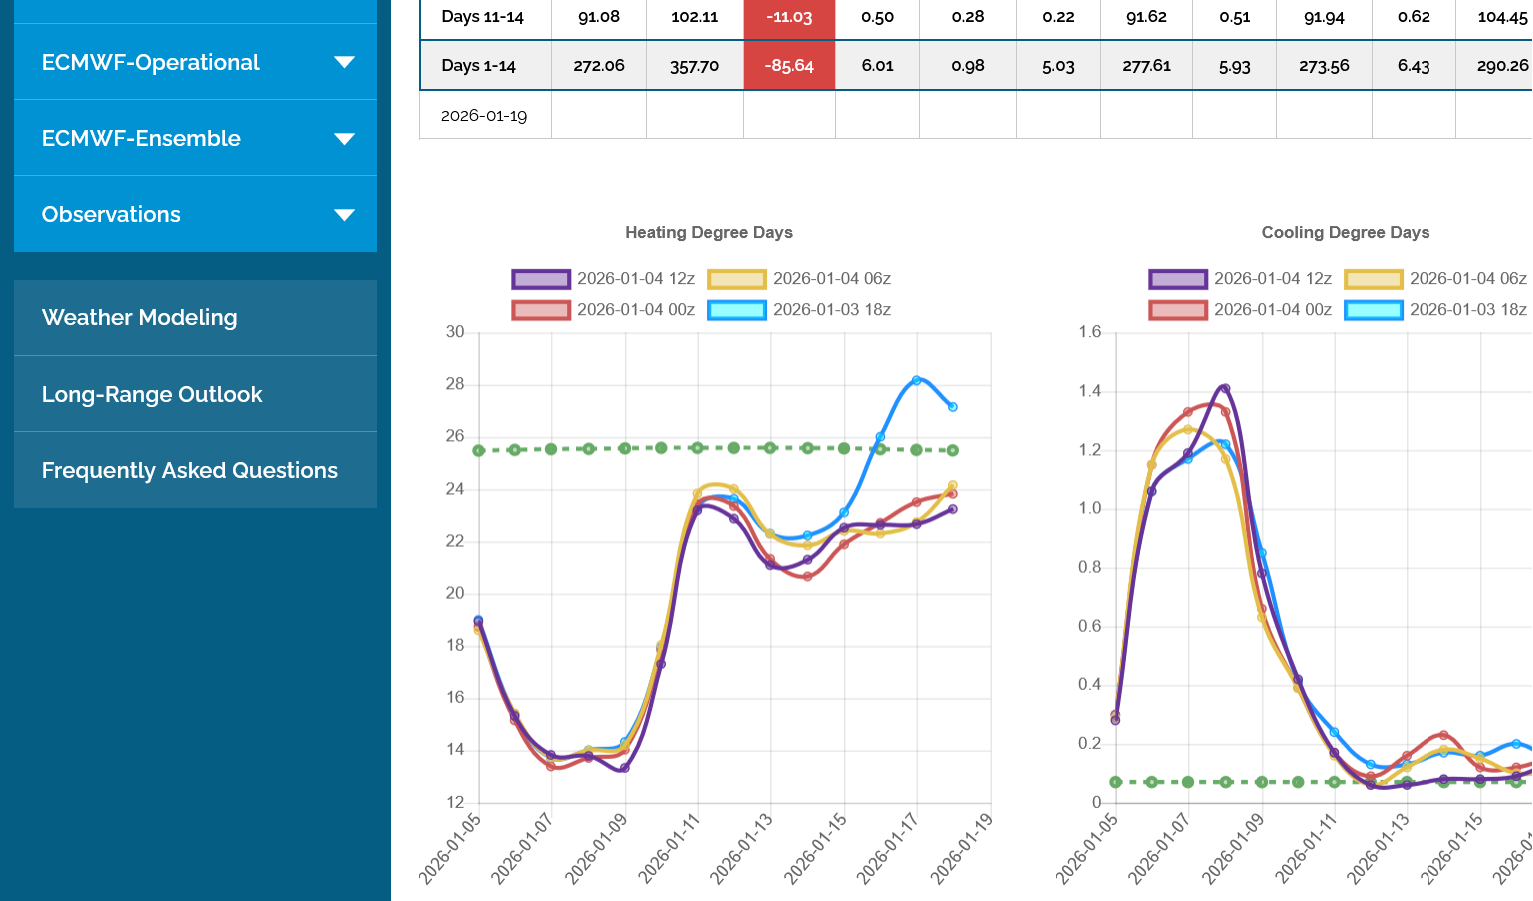
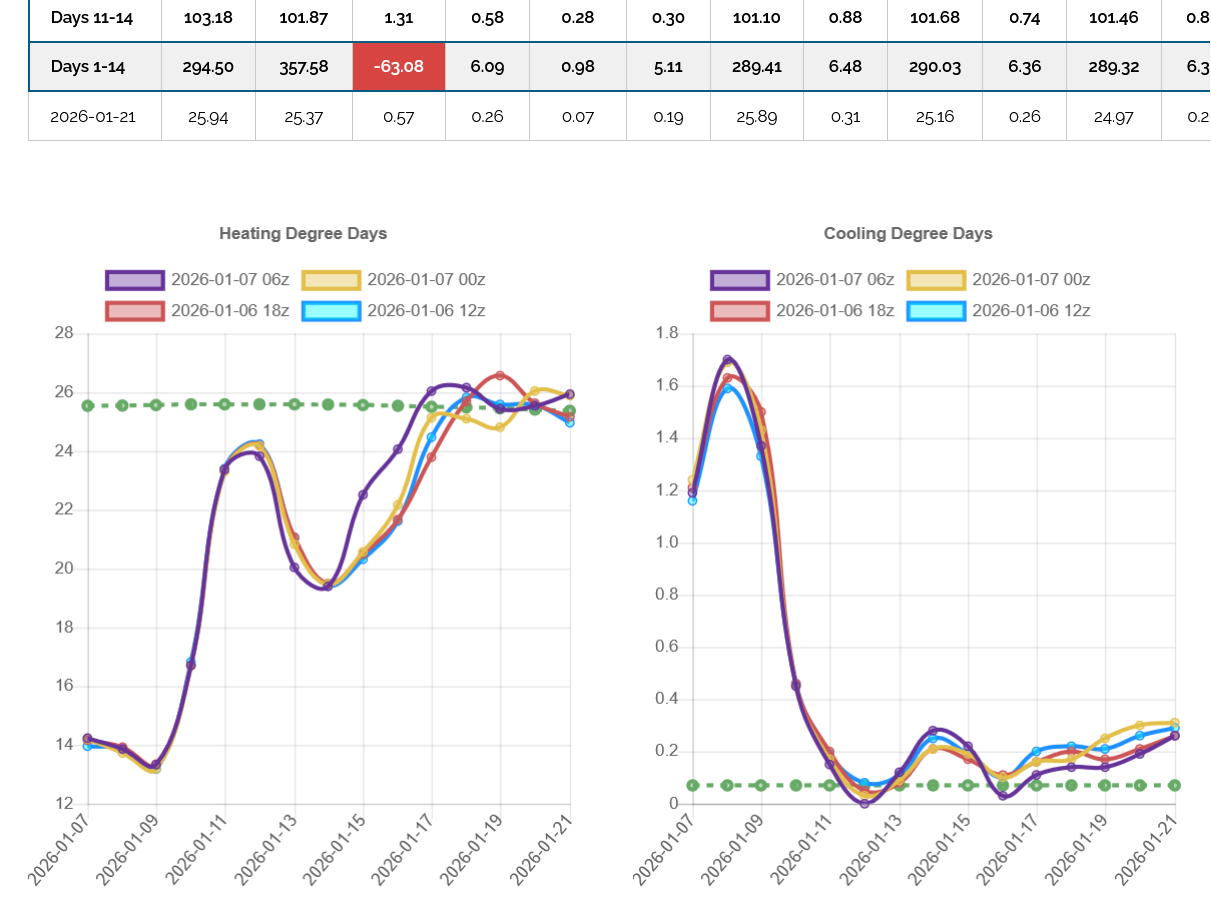
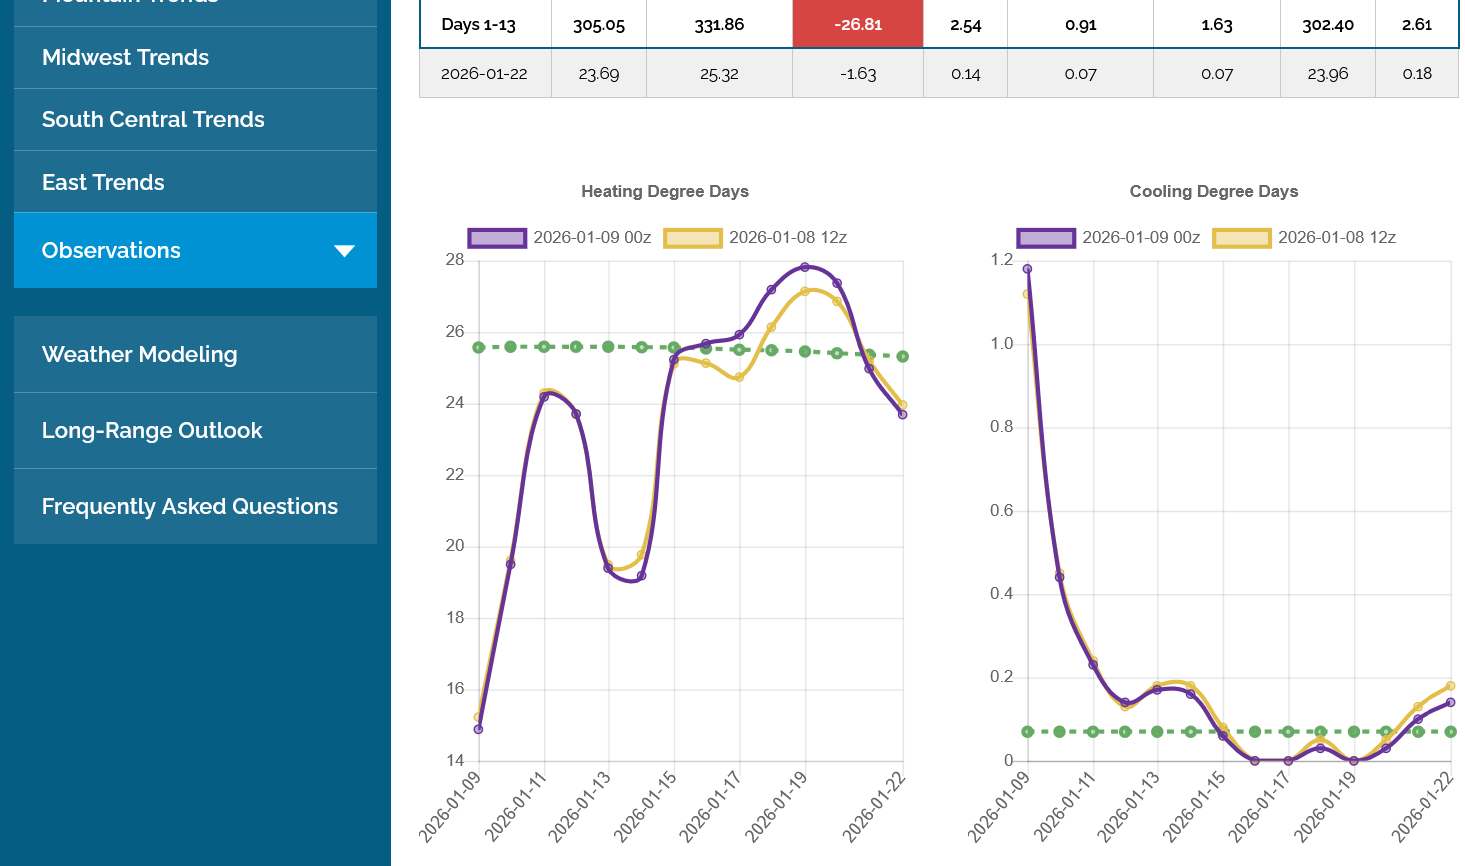
Over the weekend, HDDs increased in the forecast because the magnitude of the cold blast late in week 1 is GREATER.
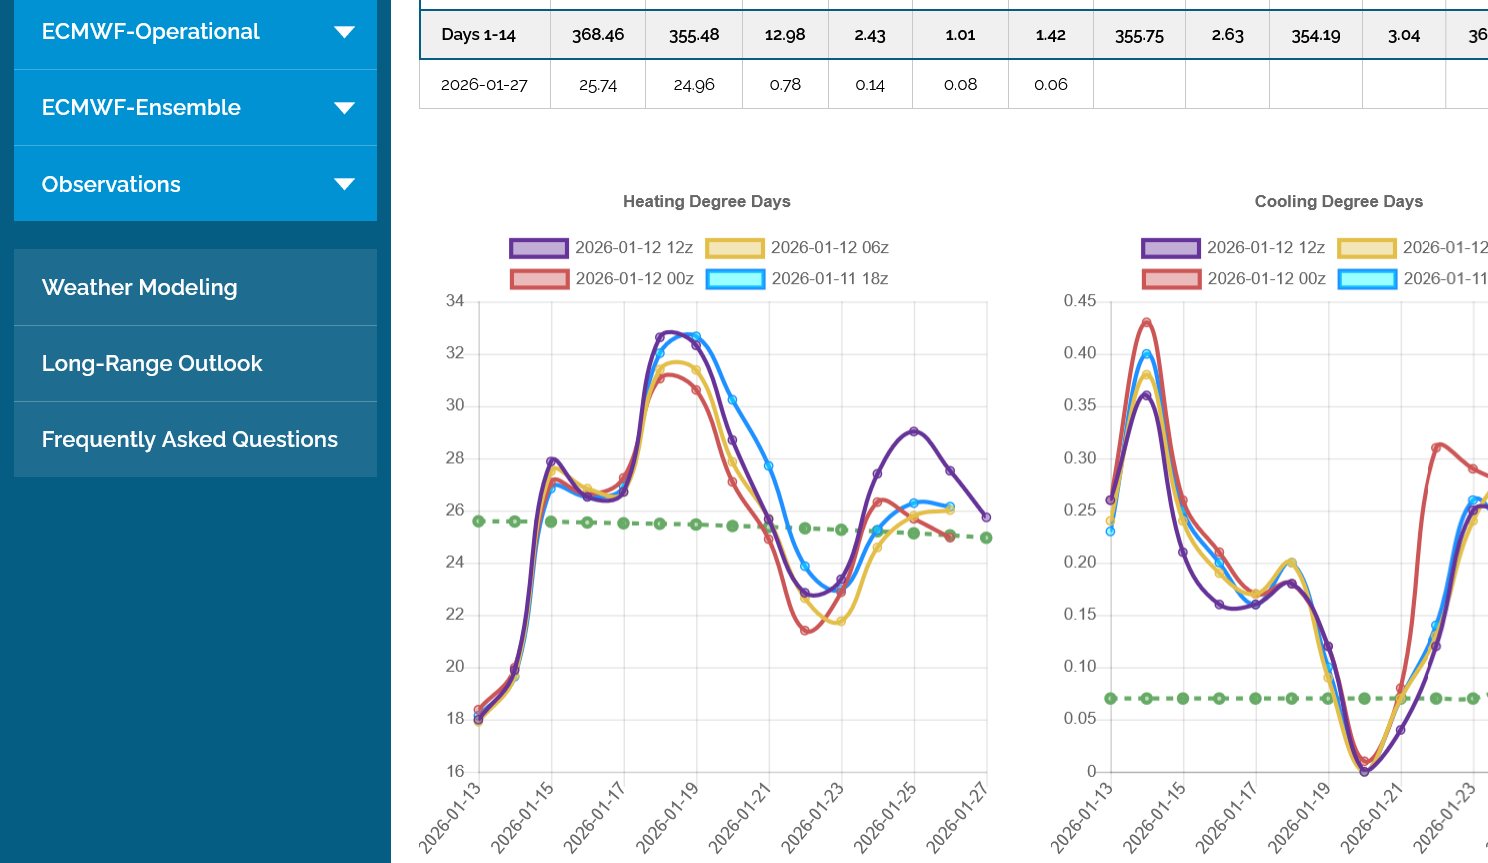
But look what happens after that. Straight down for the last 8 data points. In fact, BELOW the green average line at the end. This is a huge pattern change coming up that will blow out all the frigid air coming down from Canada(originally from Siberia) this week.
The late week 2 pattern is VERY bearish.
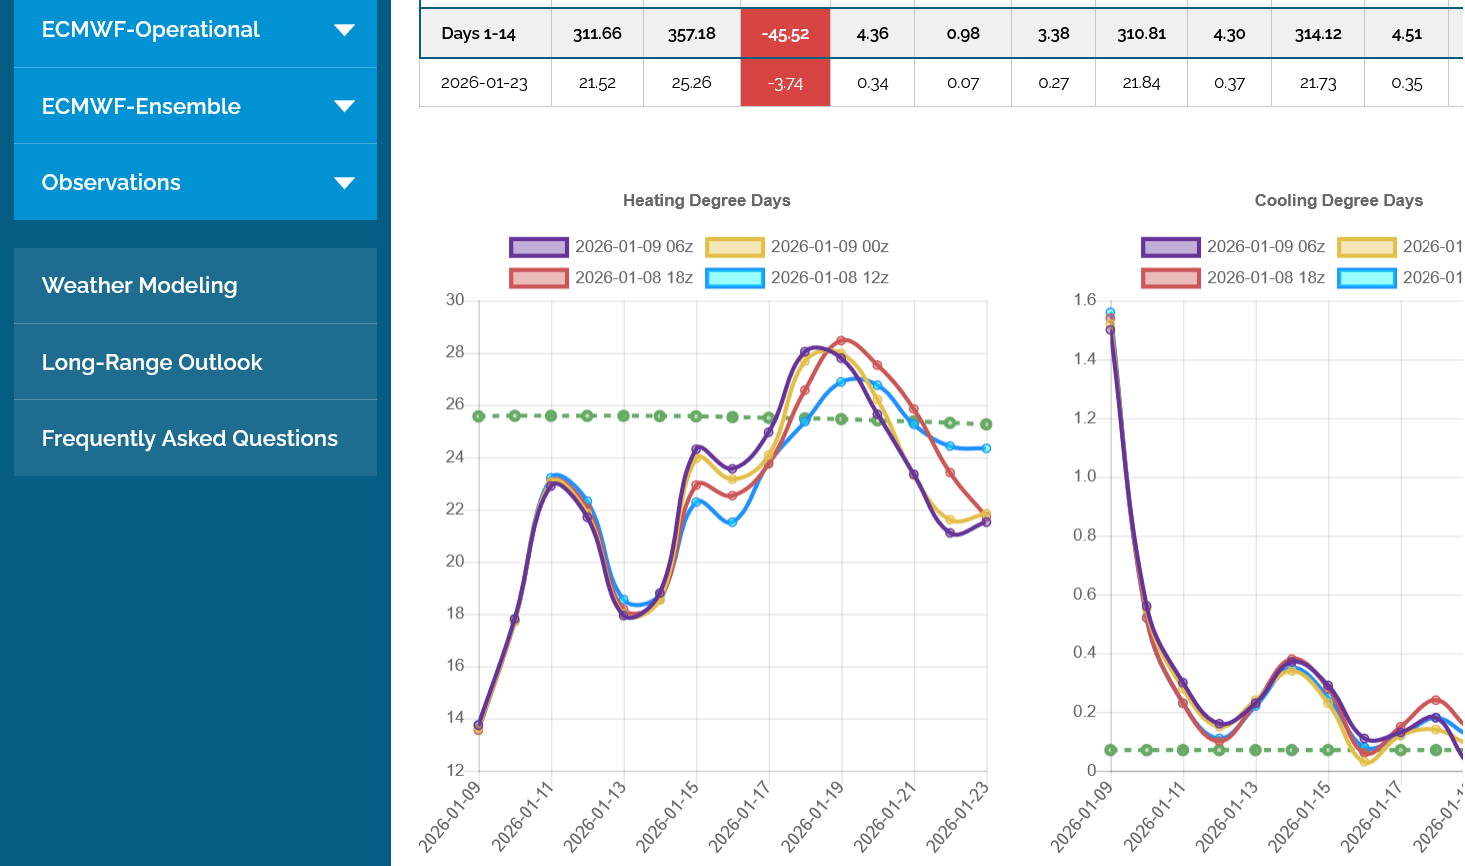
The last 12z GEFS run is in purple/left with the previous 3 runs, spaced 6 hours apart. The dashed green average/climatology is slowly dropping now that we have passed the seasonally coldest time of Winter. Each Winter is different. This is a futures market. The amount of near term cold is major but a week of extreme cold, followed by temperatures going back above average is not especially bullish.
+++++++++++++
The 12z European Ensemble model was a whopping +16 HDDs compared to the previous 0z run 12 hours earlier which is pretty dang bullish so the ng market will probably open higher tonight but the LATE week 2 pattern is still the same......straight down so it's questionable how long this extreme cold near term weather will keep the market up this week. The EE had 2 separate surges of Siberian blasts that spike the HDDs higher.
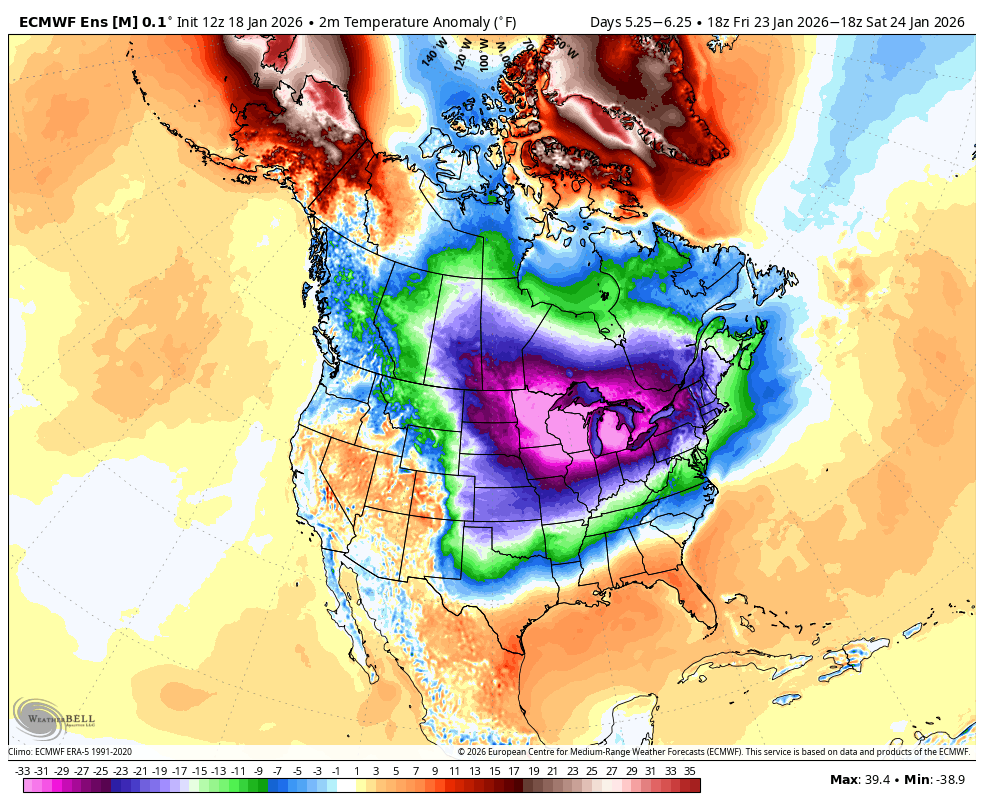
The reason for this frigid weather is that the Polar Vortex has become dislodged from it's usual location in the high Arctic.
There it is this Thursday Night with a center just north of Lake Superior but a trough extended deeply into the US. The colors below show the anomalies compared to average. The colors in the Polar Vortex are to the very extreme left on the color bar chart below.
These are the temperatures compared to average on Friday. Note that the center is the coldest color bar possible because the color bars don't go any lower than -33 Deg. F below average.
Some of those places will have highs Friday of near 40 Deg F BELOW average!