https://www.usatoday.com/story/graphics/2025/12/31/flu-cases-rising-in-us-where-maps/87945691007/
A new flu variant is sweeping across the United States, causing millions of reported cases and doubling the number of hospitalizations in a surge doctors say may not end for weeks.
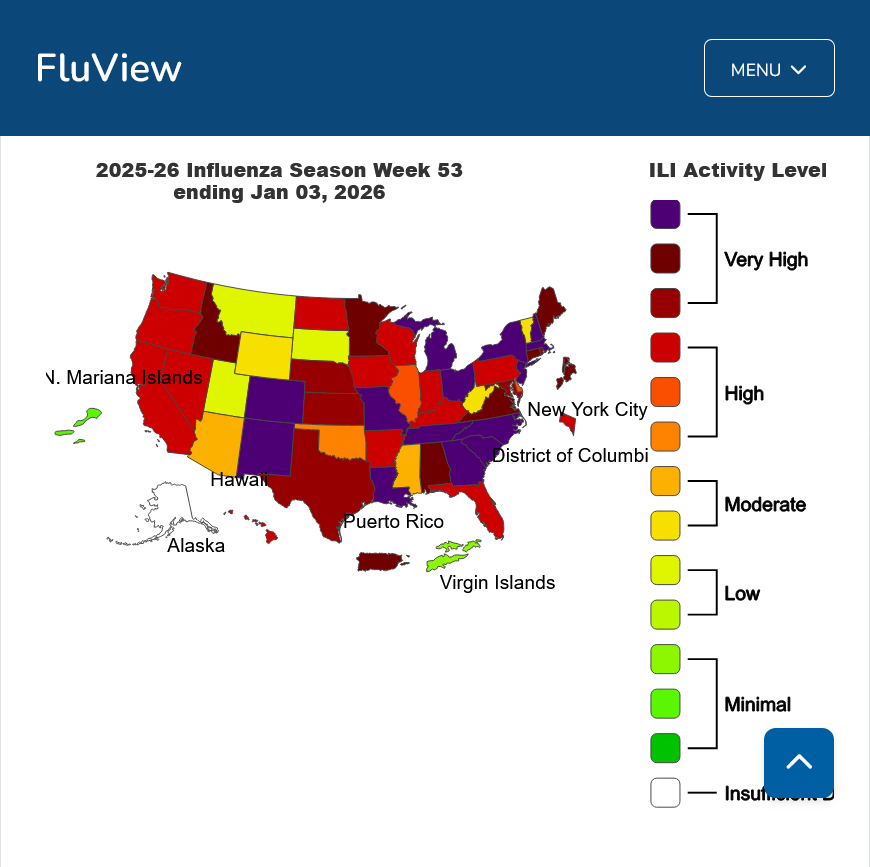
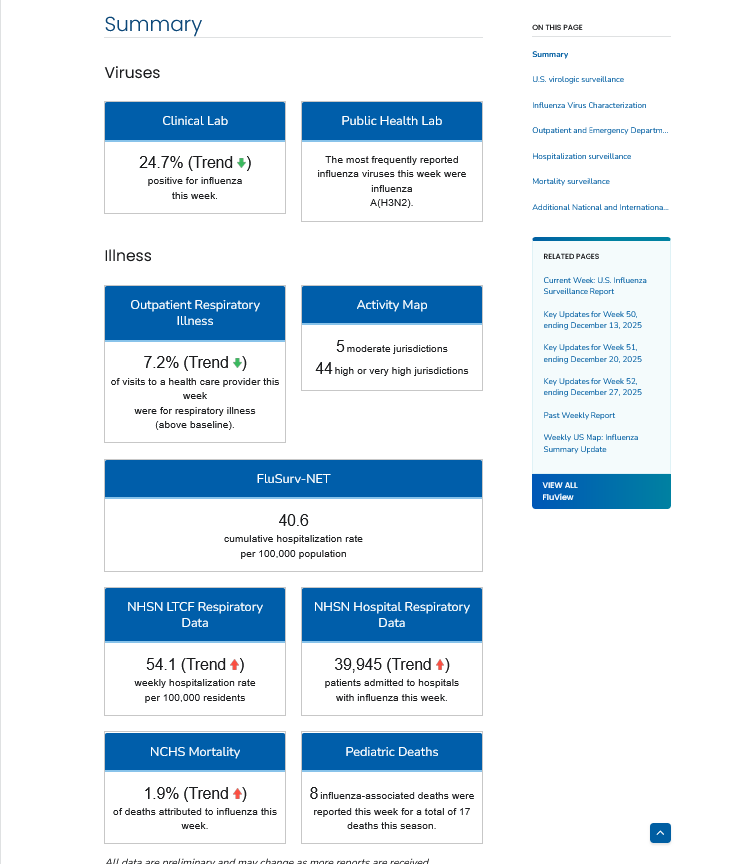
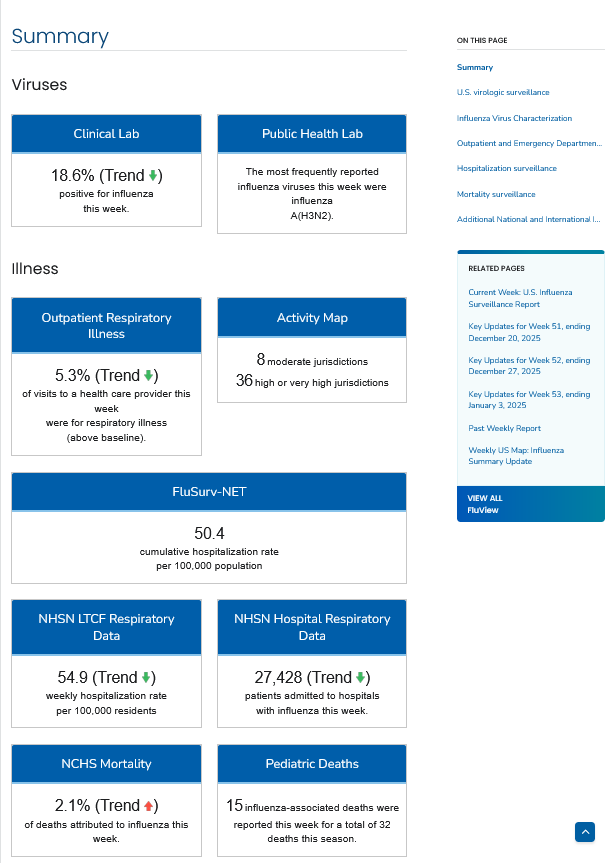
Flu activity is at "high" or "very high" levels in 32 states and jurisdictions, according to the Centers for Disease Control and Prevention's report Dec. 30. That's an increase from 17 states reported in the previous week. Since the flu season began in October, at least 7.5 million people have contracted the illness.
 Hospitalizations nearly doubled in just one week, climbing to 19,053 from 9,944 the week before, based on CDC data. About 3,100 deaths have been reported. Additionally, the count of pediatric deaths has increased to five, up from two the week before.
Subclade K (previously called A(H3N2) virus subclade J.2.4.1) is a mutation of influenza A H3N2. Influenza A is typically the virus associated with the term "flu" and has evolved into many different strains over time.
Each year, the seasonal flu shot is formulated to target the most commonly circulating strains. One of those, H3N2, has been present for decades, according to the CDC and the Gavi Vaccine Alliance, but its most recent mutation is different enough that the vaccine made to target H3N2 for the 2025-2026 season is not as effective against it.
Because it's structurally different, subclade K may also be better at dodging immune systems that have already built up protections against more familiar strains. This year's vaccine isn't useless against subclade K, however.
Preliminary data has shown that the vaccine is still providing protection and that rates of hospitalization and serious illnesses are comparable to last year in Europe, according to the Pan American Health Organization and research published in the medical journal Eurosurveillance.
Vaccinations have been dropping for the past 5 years. Anti science, anti vax rhetoric is contributing to this troubling trend.
https://www.cdc.gov/fluvaxview/dashboard/adults-65-years-and-older.html
I just got vaccinated for both the flu and covid at my pharmacy.
Been meaning to do it for some time but i had to pick up some prescriptions and this post before leaving reminded me.
I have a couple of diseases and one of them is an autoimmune disease that causes my immune system to be OVER active.
So i rarely get sick. In the last 50 years, i got the flu 1 time. I had covid 1 time in 2022. Ive had 2 colds During that time.
Being the chess coach at 5 schools, however means i get exposed to 200+ kids every week. We have a chess tournament on Saturday with 96 students and 100+ parents.
If you wanted an environment to spread a virus, this would be it. Before each round, when we put up the pairings everybody in each division smashed together like sardines to see where they and their next game is with the pairings posted on the wall.
I guess this happens frequently during the day at school too but not when I’m there.
2.5 days will be long enough for my immune system to start producing protective antibodies but the benefits max out at around 2 weeks.
After getting the shots, people often feel crappy the next day or 2 as their immune system reacts to the DEAD virus.
The benefits out weigh the risk by several orders of magnitude, even for somebody like me That rarely gets sick.
I just started tracking this recently and will continue the updates when there's time.
I tracked COVID every week for 2 years using CDC and NY Times data.
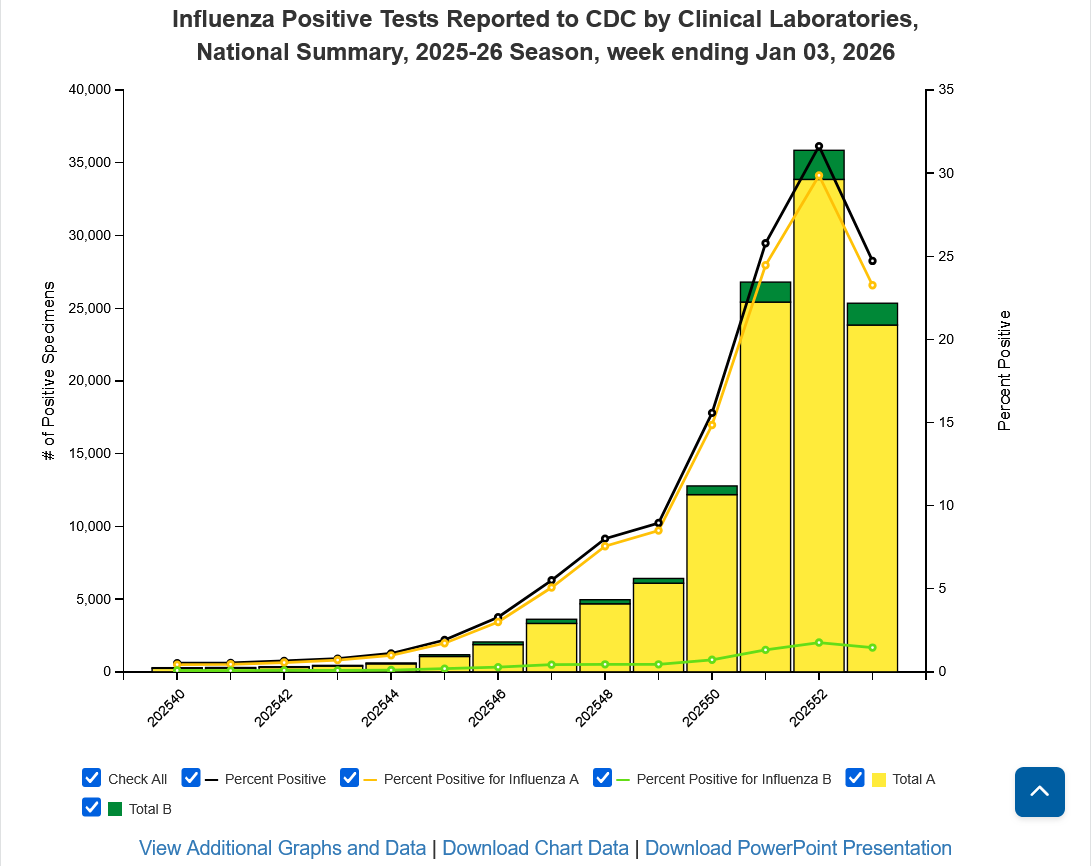
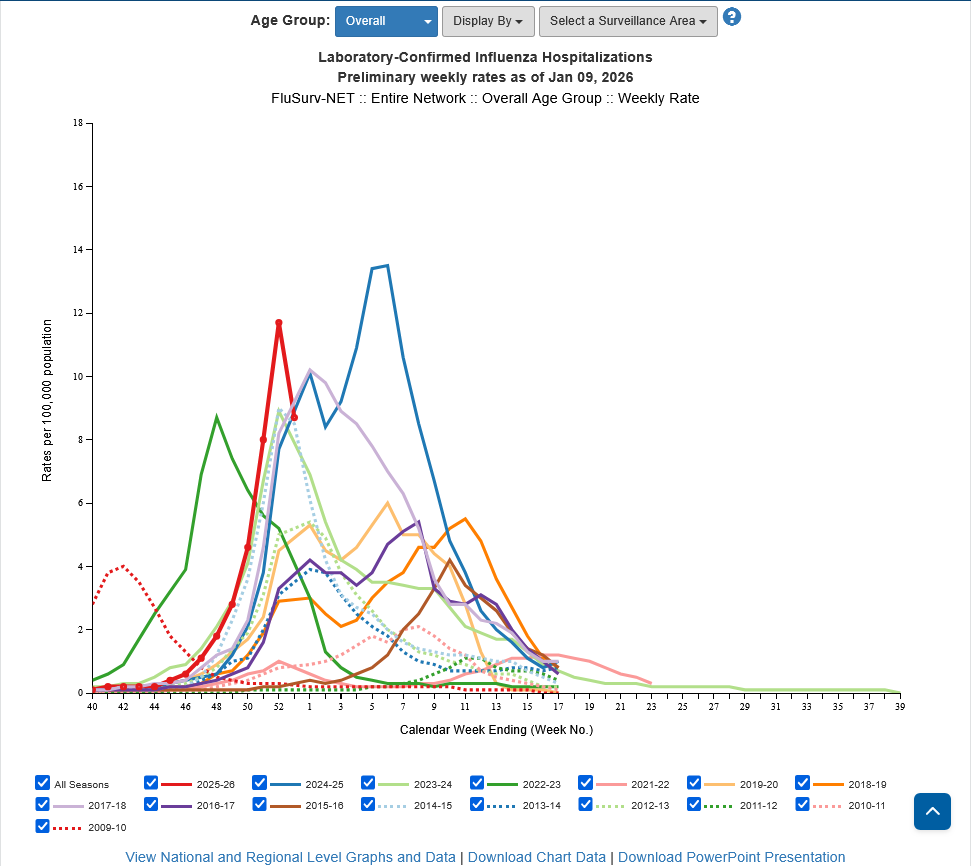
It appears that this seasons big flu outbreak may have just peaked. We need more data (at least 1 more week) but the number of new cases dropped for the first time this season.
The number of HOSPITALIZATIONS continued to increase but this is a LAGGING indicator.
The reason for that to be the case: After people are infected with the flu, it takes a couple of days before the virus rapidly multiplies at an exponential rate in their bodies to make them sick enough to get tested at a medical facility.
A viral unit replicates to 700 additional units every 7 hours. In 14 hours, that equates to 700 X 700 =49,000 viral units. In 21 hours, that means 49,000 X 700 = 34,300,000 viral units. Basically, adding almost 4 more 0's to the number every 7 hours. Adding over 11 more zeros to the number every 24 hours!!!
It takes our immune systems a couple of days to recognize the specific virus's genetic code in order to start manufacturing specific antibodies to target that specific virus.
People with compromised immune systems especially can't do this in time before the virus has multiplied to a number that would fill half the line on this page and they get REALLY sick several days later. This is when they become a hospitalization statistic.
The final, most lagging statistic/metric is deaths for obvious reasons.
The peak will first show up with the number of new cases dropping, even while hospitalizations are still going up from the previous weeks new cases getting severe enough to go to the hospital. After NEW hospitalizations peak, deaths should peak then or shortly after.
1 week of data that reverses down needs to be confirmed with a 2nd week! I'll try to report that in this thread, starting with the next post.
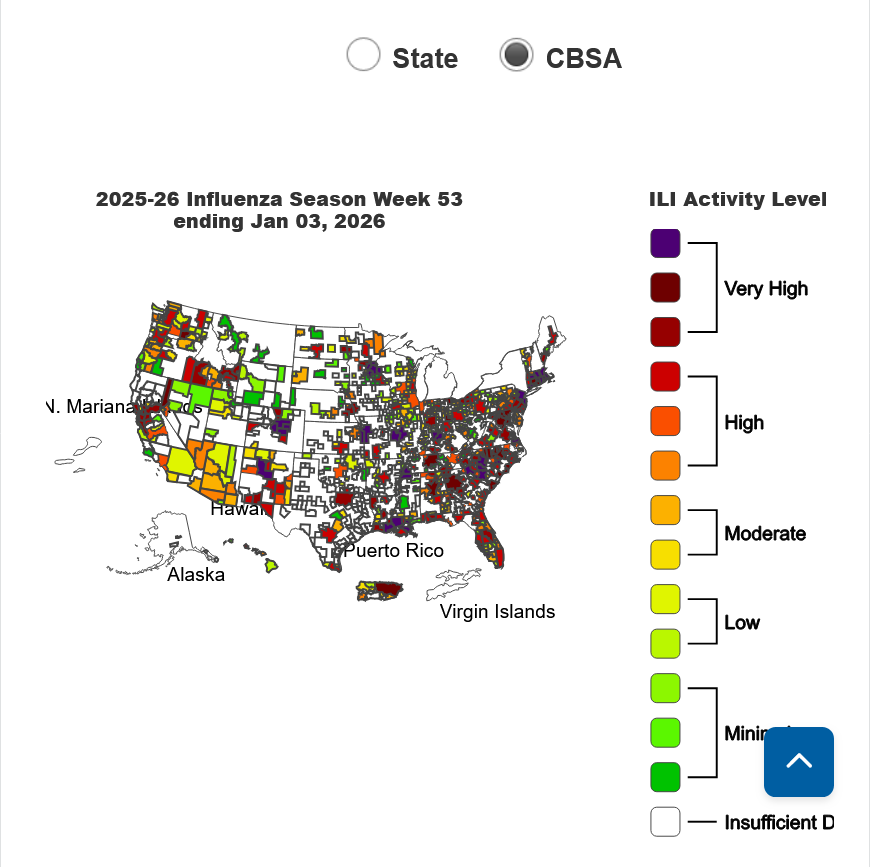
https://www.cdc.gov/fluview/surveillance/2025-week-53.html
Seasonal influenza activity remains elevated across the country.
Unlike COVID that hits older people the worst, the flu clobbers babies/the youngest hardest. This is because their immune systems are still undeveloped and can't respond as effectively.
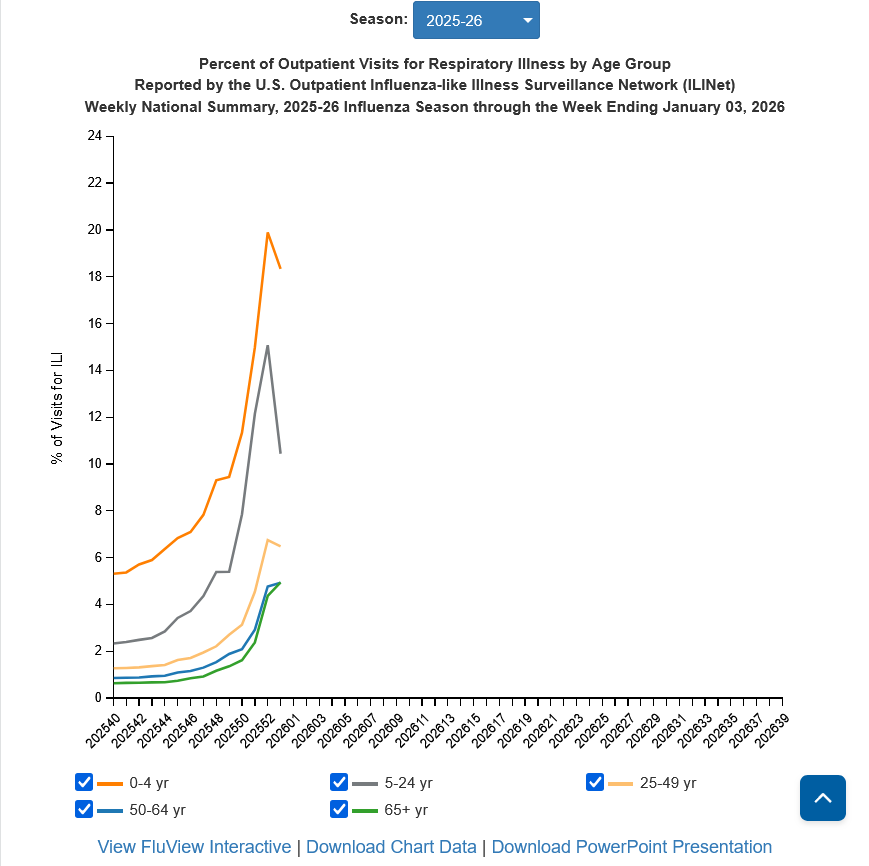
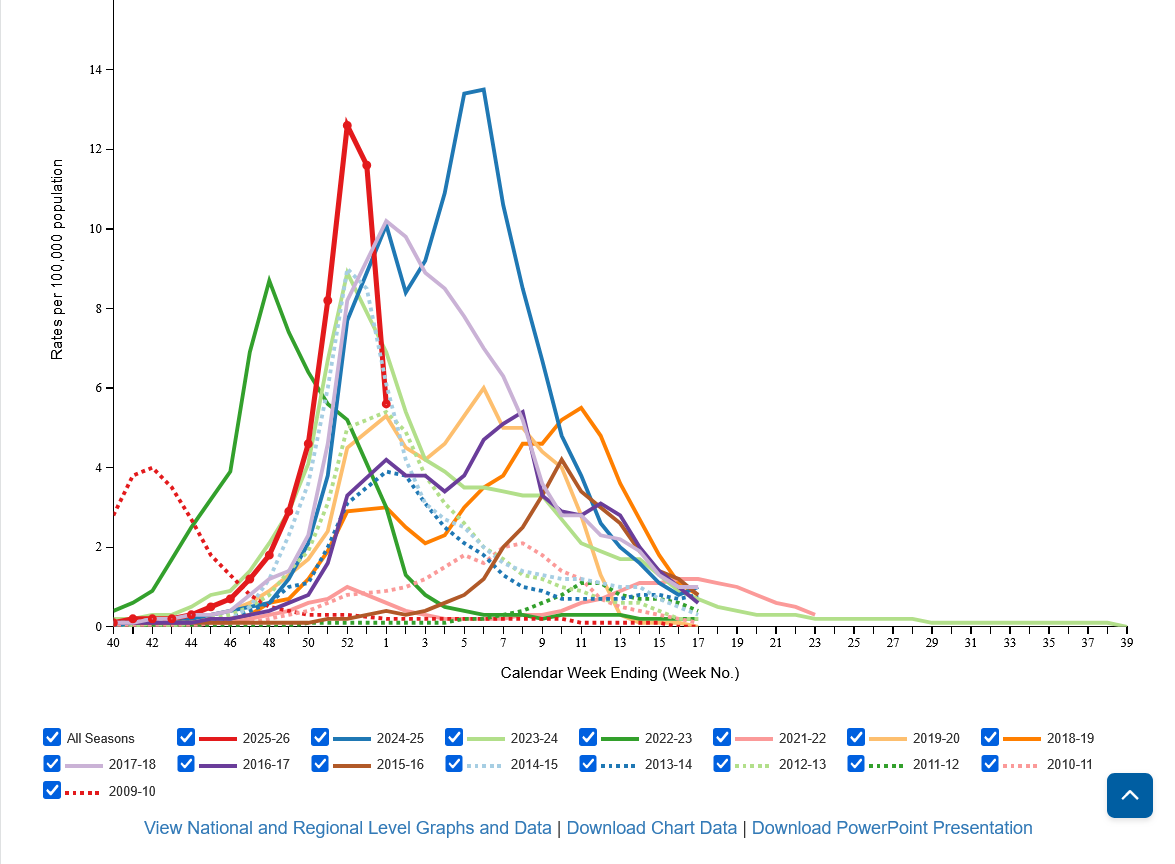
The graphic below is awesome. Go to the link at the top/source to get it. Then you can vary to data to show different break downs.
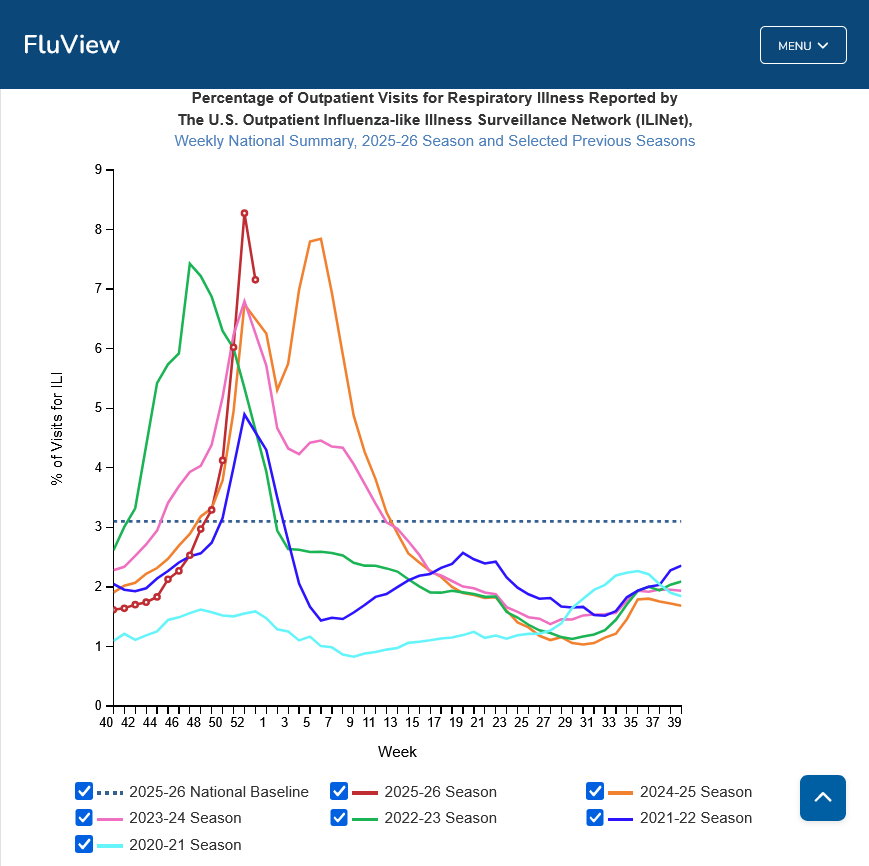
Note below that I chose to graph ALL years that makes it sort of cluttered. The worst year was last year. Most bad years have spike peaks but last year, featured a peak, small drop then surge to new highs. There is an extremely wide range in the timing of the peaks with more of them being around a month from now. However, some of the bad years peak early.
For this particular week, here in early 2026 we are close to the highs in previous years at this time. I noted there is no graph for the 2020-21 season. COVID hit hard, starting in March 2020 so we can assume that the CDC had all hands on deck focusing on COVID cases and neglected the flu that year.
++++++++++++
Hospitalizations and deaths have not peaked yet:
As we suspected earlier this month, the flu season has apparently peaked. It's possible we could have another peak but flu cases are PLUNGING!
https://www.cdc.gov/fluview/surveillance/2026-week-01.html
+++++++++++++++
Deaths above are the most lagging indicator and last metric to improve. Everything else has been improving fast.
++++++++++++++++++
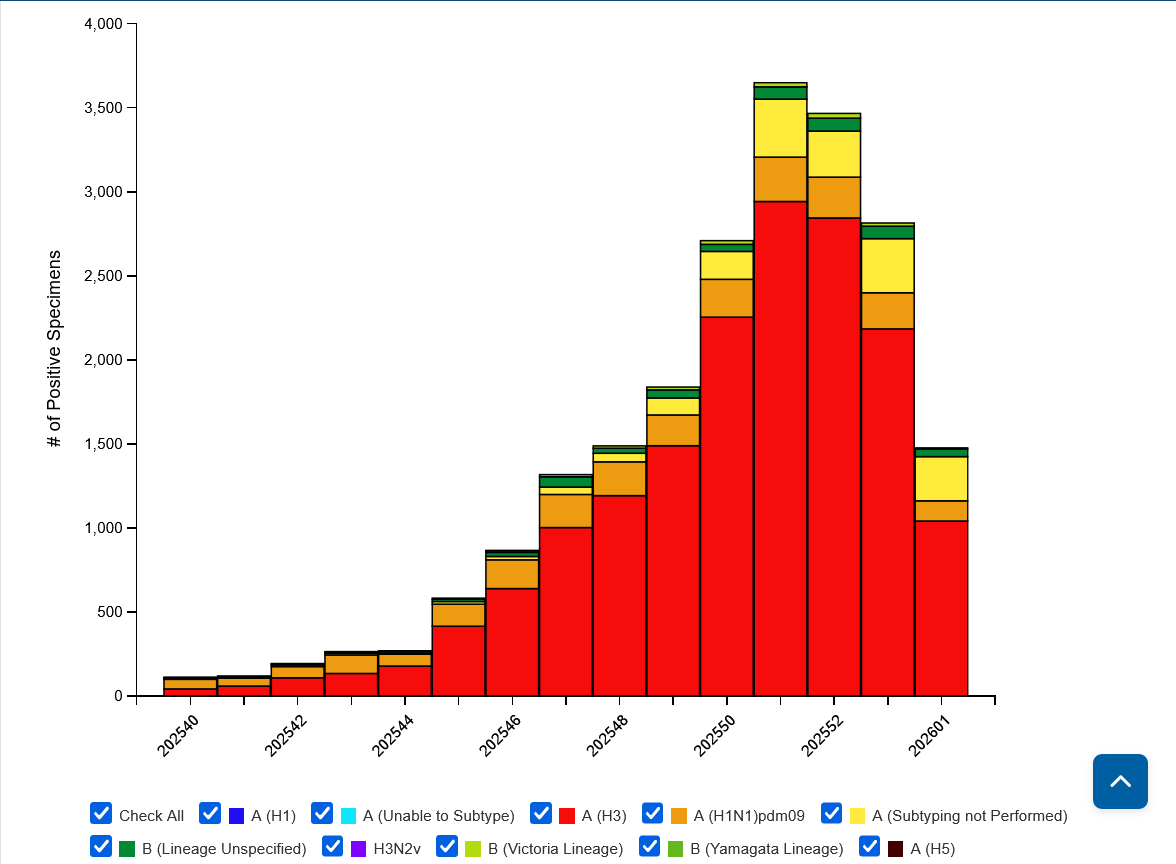
You can see the current season below in red, having peaked the highest in 16 years but peaked early.