This was the previous thread:
USDA Grains 11-13-25
54 responses |
Started by metmike - Nov. 13, 2025, 3:59 p.m.
The USDA report today was a huge bearish shocker! Not sure what the USDA was thinking but it lines up with their many other past shockers that seem to defy reality, suggesting motives to create shockers to benefit their friends who are positioned before the release.
I have 0 solid proof of that. Just tons of repeated patterns of circumstantial evidence from somebody gifted in interpreting data.
·
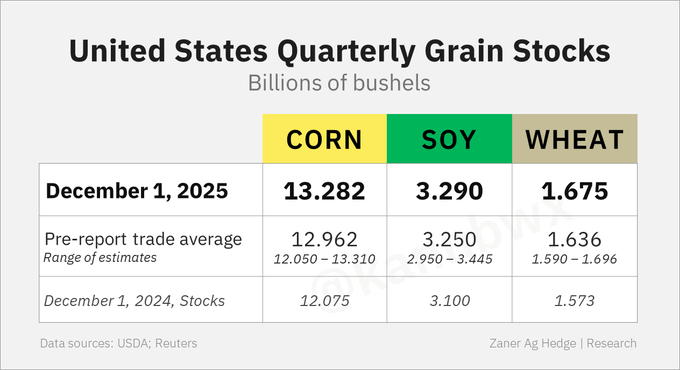
U.S. corn production comes in above expectations, soybean production lands slightly above.
U.S. corn stocks come in at the high end of expectations with the larger crop. Soybean stocks are higher on lower exports, and wheat stocks were also higher on lower use.
U.S. corn harvested area was raised significantly from September, pushing production over 17 billion bushels. That's up 4.5 million acres since the June acreage survey, which is completely unprecedented.
Dec. 1 U.S. corn stocks land above all trade estimates. Soybean stocks were very close to expectations and wheat was safely above.
U.S. farmers planted a few more winter wheat acres than the trade expected, but area is still slightly down from a year ago.
·
U.S. corn harvested area comes in 1.3% above the September estimate on increases in both major and minor states. 91.26 million harvested corn acres is the highest since 1933.
2025 U.S. corn yield comes in at a record 186.5 bu/acre. Iowa and Illinois didn't do as well as previously expected, but plenty of other states, particularly Minnesota and North Dakota, notched very strong results.
U.S. corn harvested area comes in 1.3% above the September estimate on increases in both major and minor states. 91.26 million harvested corn acres is the highest since 1933.
2025 U.S. soybean yield ends up at a record 53 bu/acre. Nebraska was the highest yielding state at 65.5 bpa. Notable reductions in the I-states once again, but enough offset among the other producers to keep national yield unchanged from November.
++++++++++
The end of the 2025 growing season was not nearly as harsh as the end of the 2024 growing season, so we should not have expected huge cuts, like the ones which shocked us a year ago.
++++++++++++++++
USDA January 10, 2025/grains
Started by metmike - Jan. 10, 2025, 11:38 a.m.
https://www.marketforum.com/forum/topic/109451/#109481
By metmike - Jan. 10, 2025, noon
EXTREMELY BULLISH!!!!!!!!
+++++++++++++++++
However the amount of new crop that they suddenly discovered in January 2026 since the last report is a pretty bearish shocker.
USDA confirms the following U.S. export sales for delivery in 2025/26:
204,000 tons of soybeans to China110,000 tons of soybeans to unknown60,000 tons of soybeans to unknown (plus an extra 75kt for 26/27)260,000 tons of corn to Japan500,302 tons of corn to unknown
+++++++++++
U.S. corn export sales last week were the week's best in five years. Soybean sales were easily a record for the week (irregular purchase timing), China had 1.2 mmt. Cotton sales were a MY high (340k RB).
+++++++++++++
Conab reduced Brazil's 2025/26 soybean harvest by 1 mmt from last month citing lower yields. 176.1 mmt is still a record and is below USDA's latest estimate of 178 mmt.
+++++++++++++
KareNOPA Dec. 2025 U.S. crush:224.991 million bushels of soybeansUp 8.9% YOY; 2nd largest for any monthSlightly above avg trade est (224.809 mln)Soyoil stocks 1.642 bln lbs+33% YOY; largest since May 2024Below avg trade est (1.686 bln)
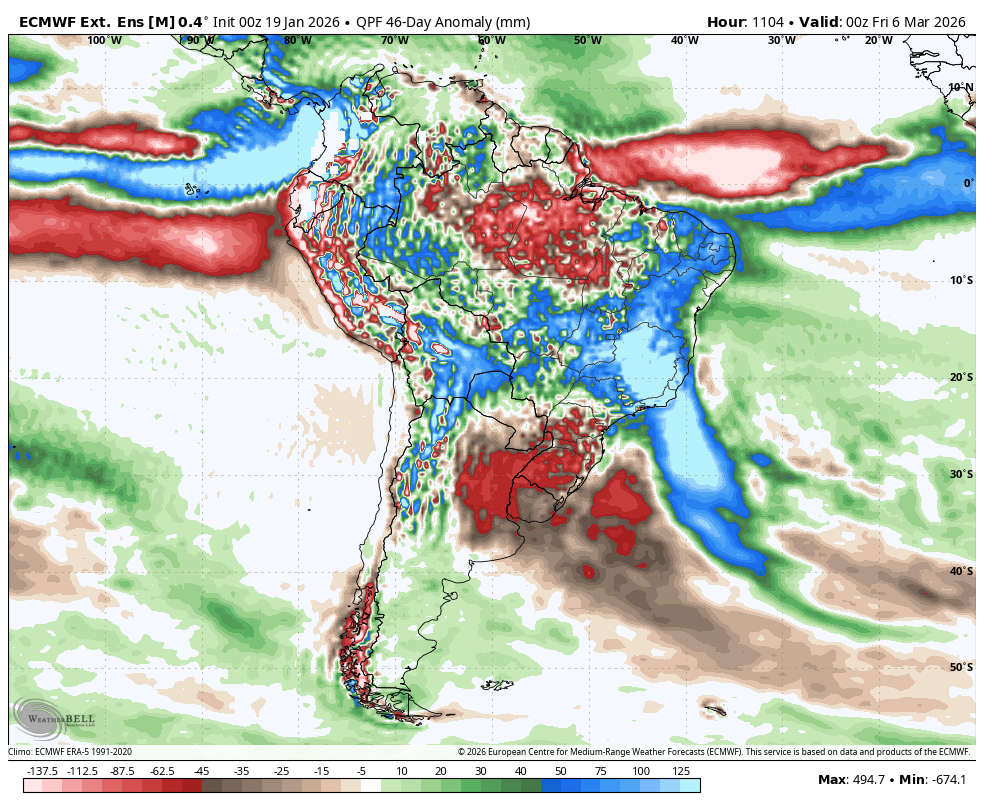
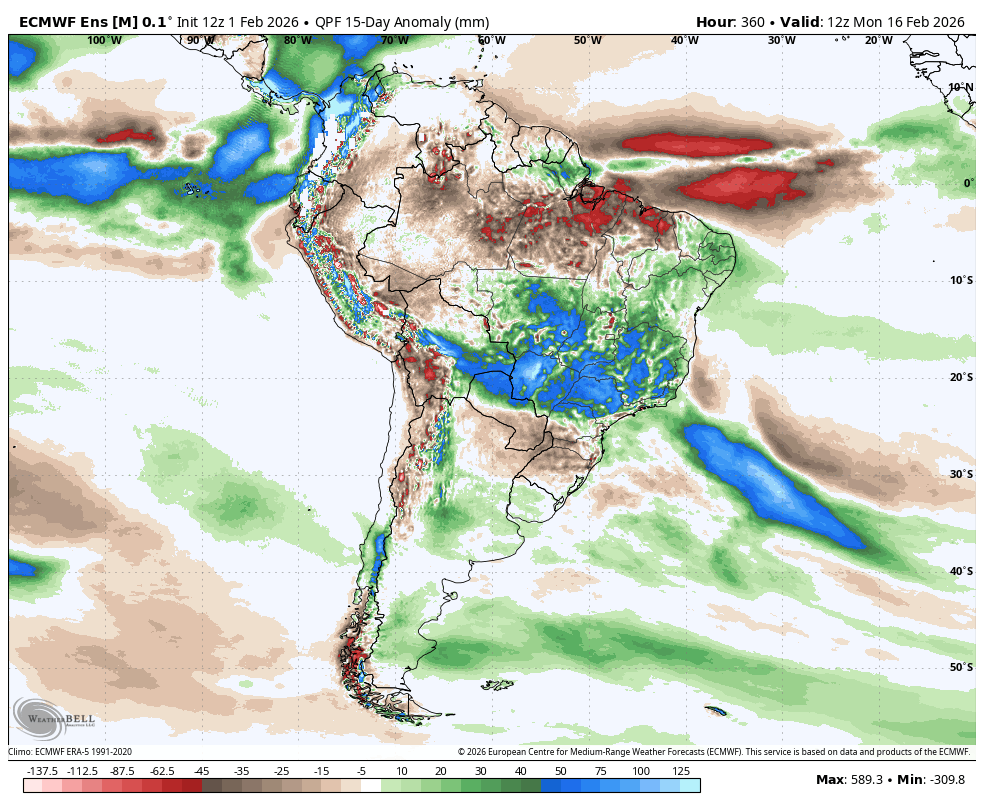
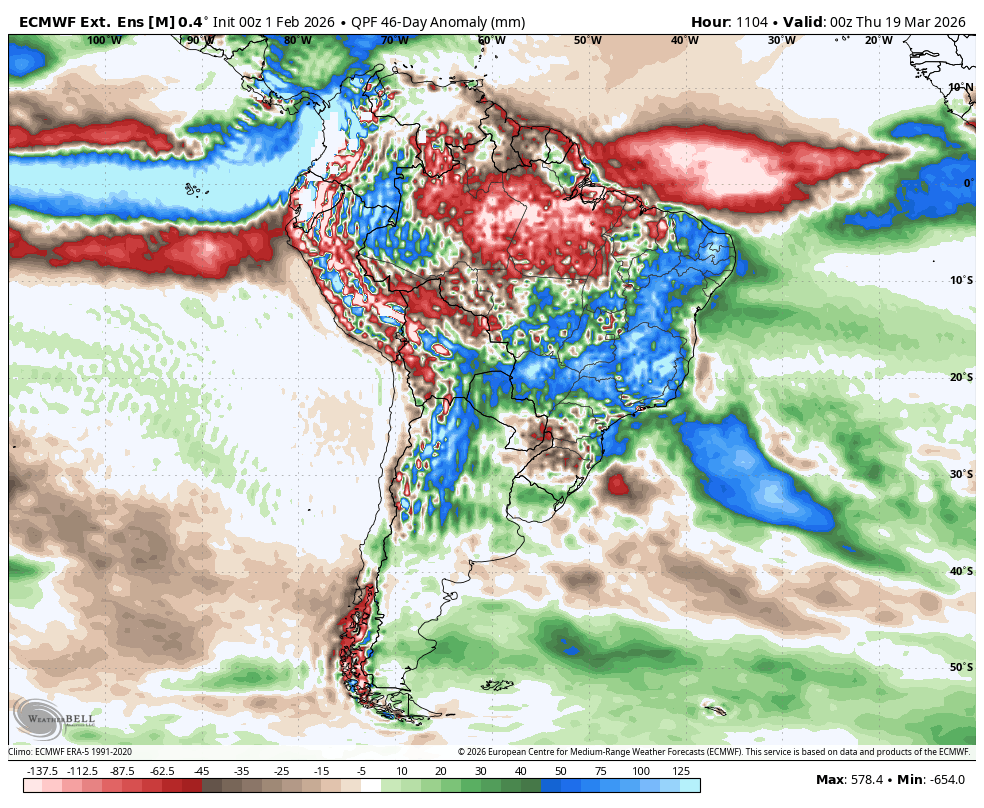
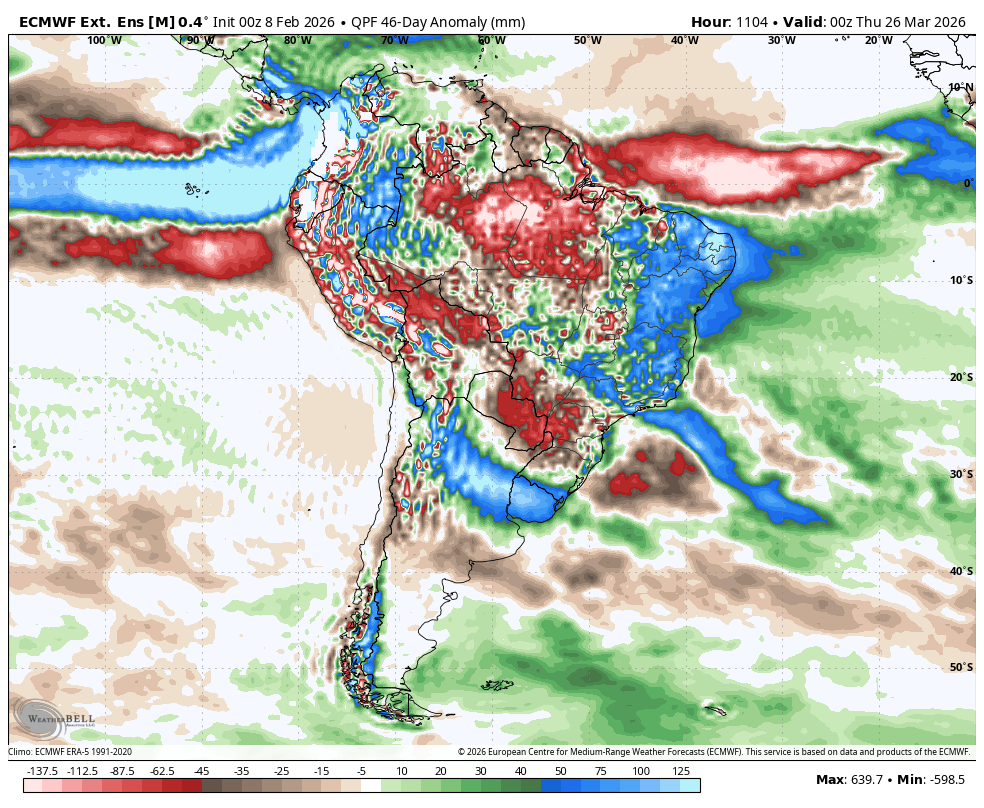
The weather in S.Brazil/Argentina has turned BULLISH!
Next 2 weeks rain anomalies from the 12z European Ensemble model.

Same model but thru early March:
https://ipad.fas.usda.gov/countrysummary/default.aspx?id=BR
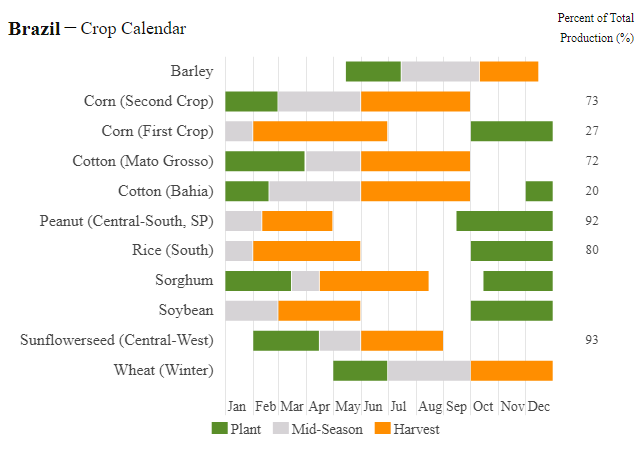
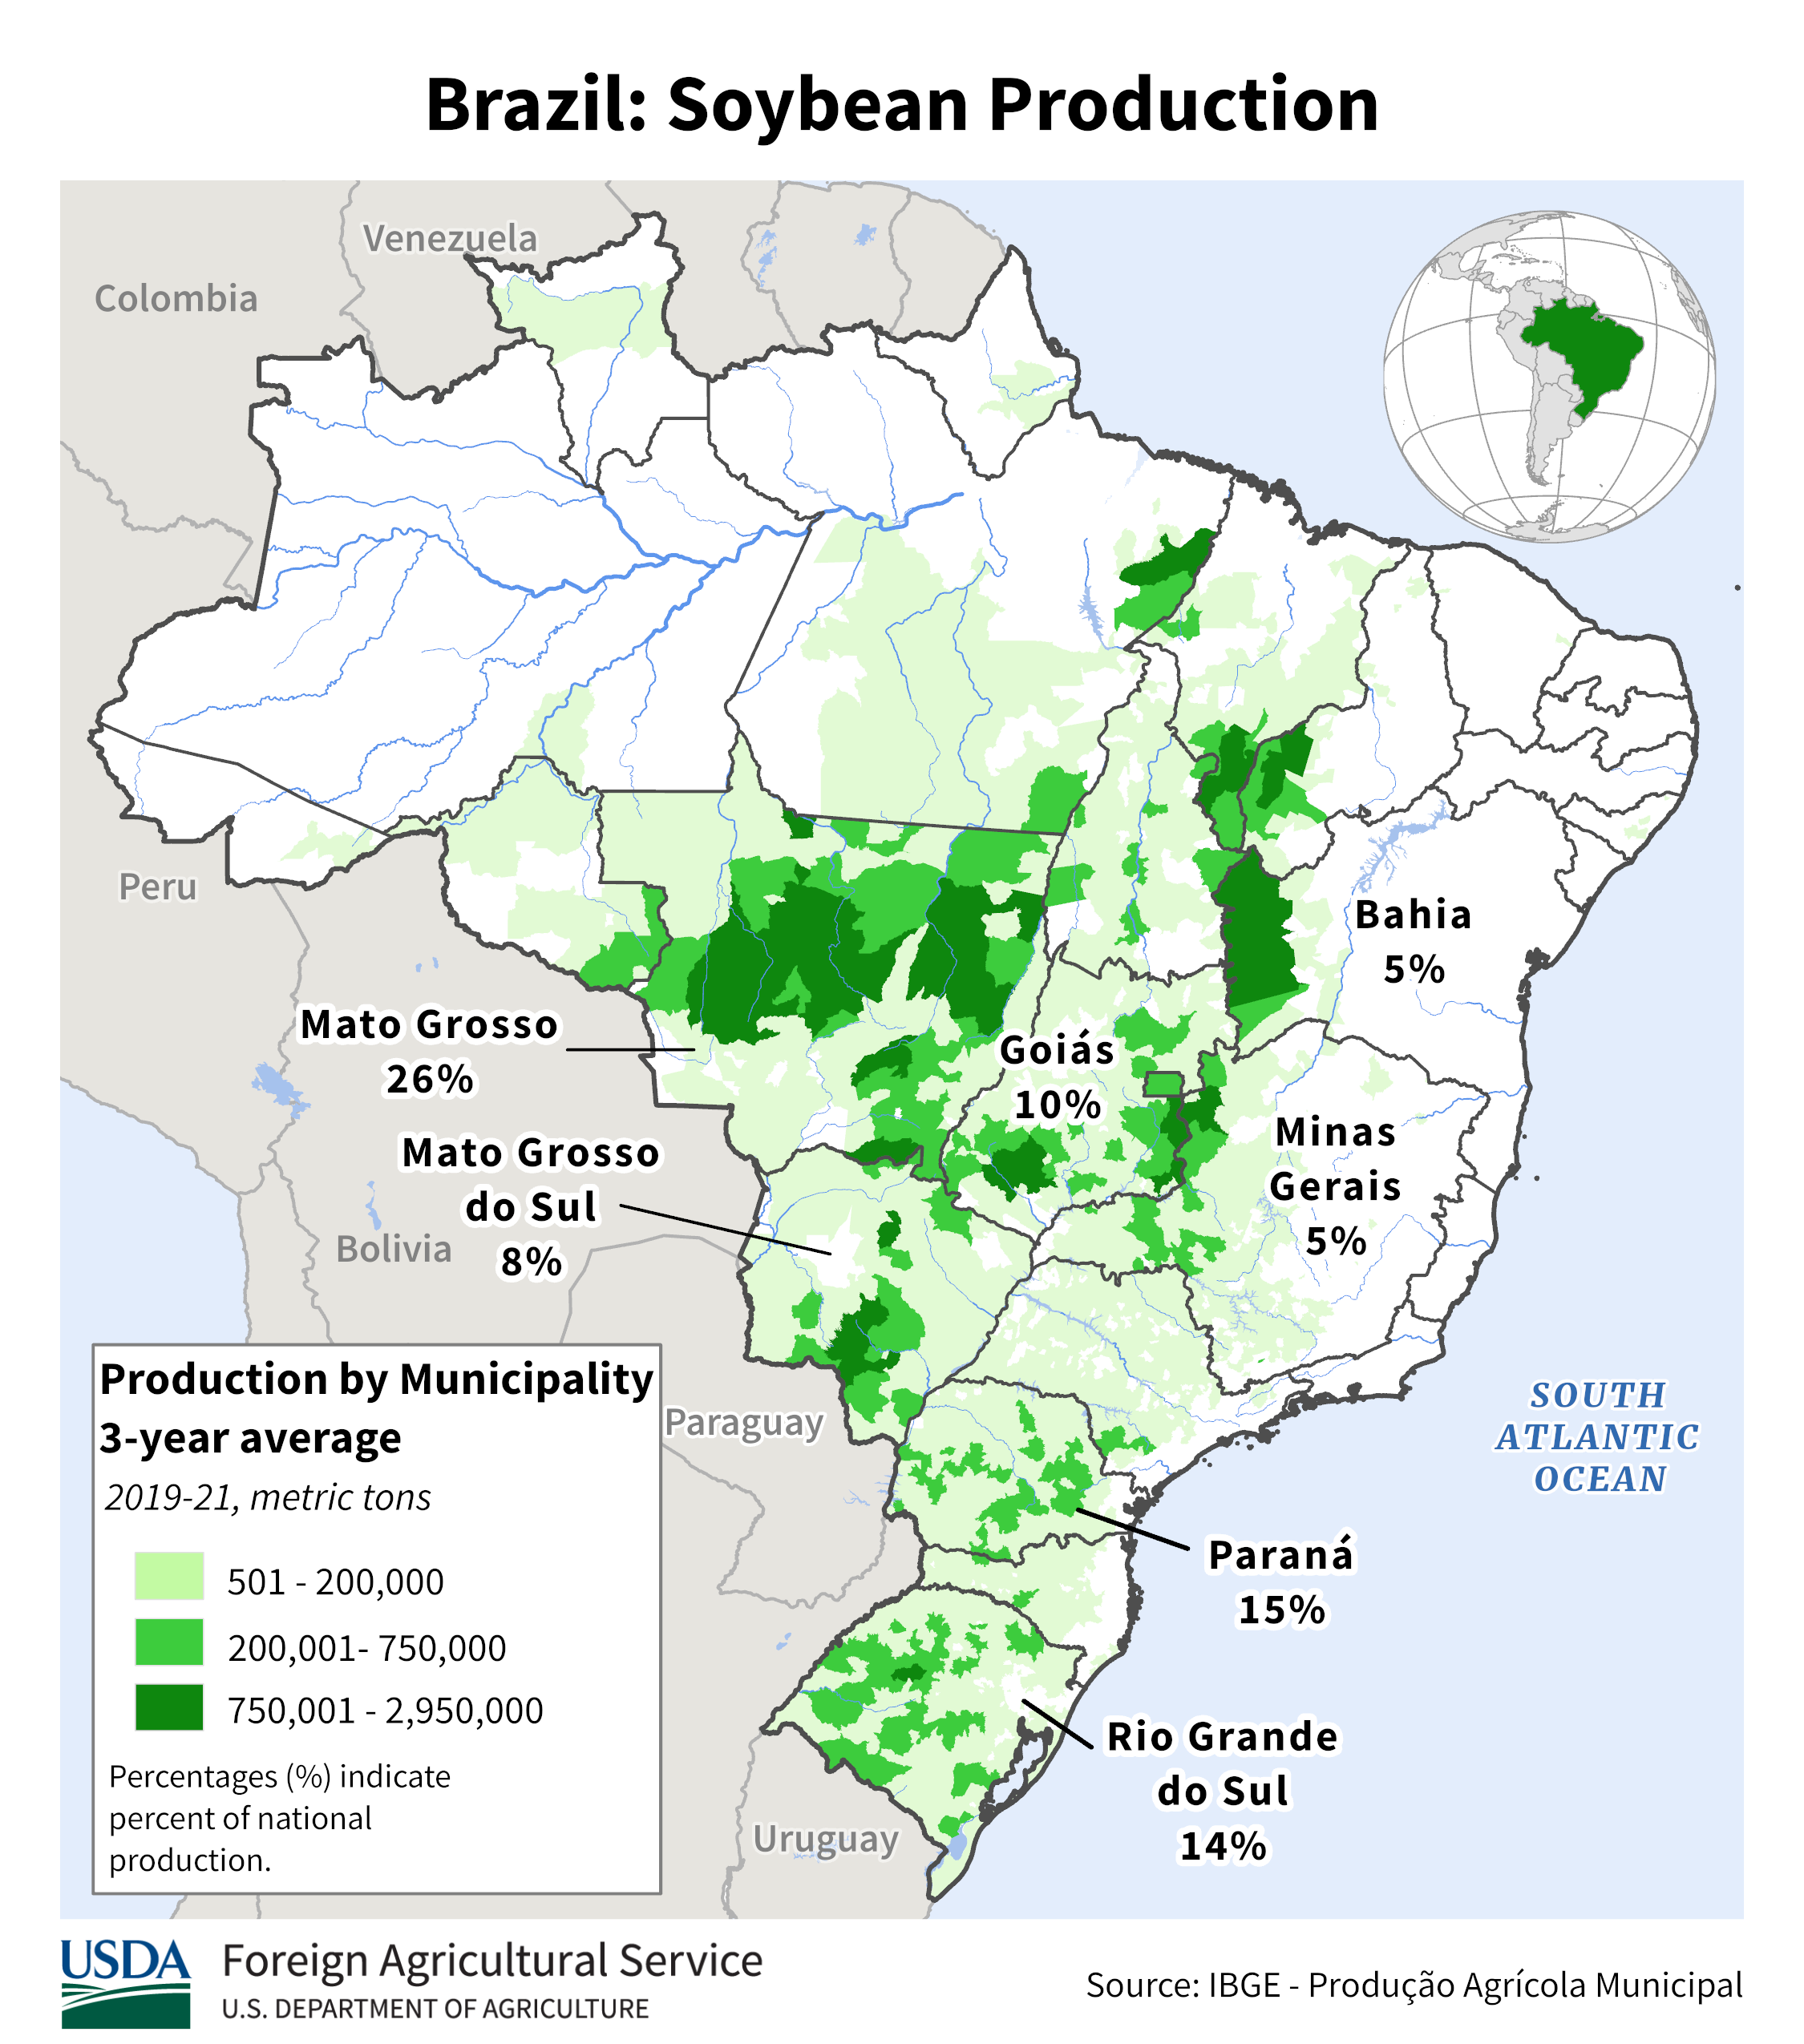
https://ipad.fas.usda.gov/rssiws/al/crop_production_maps/Brazil/Municipality/Brazil_Soybean.png

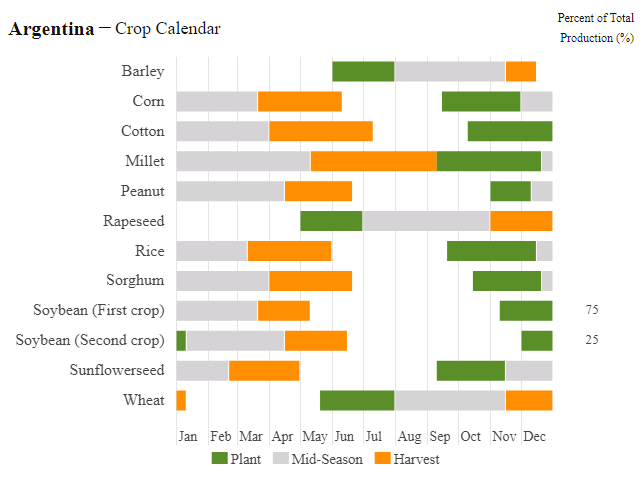
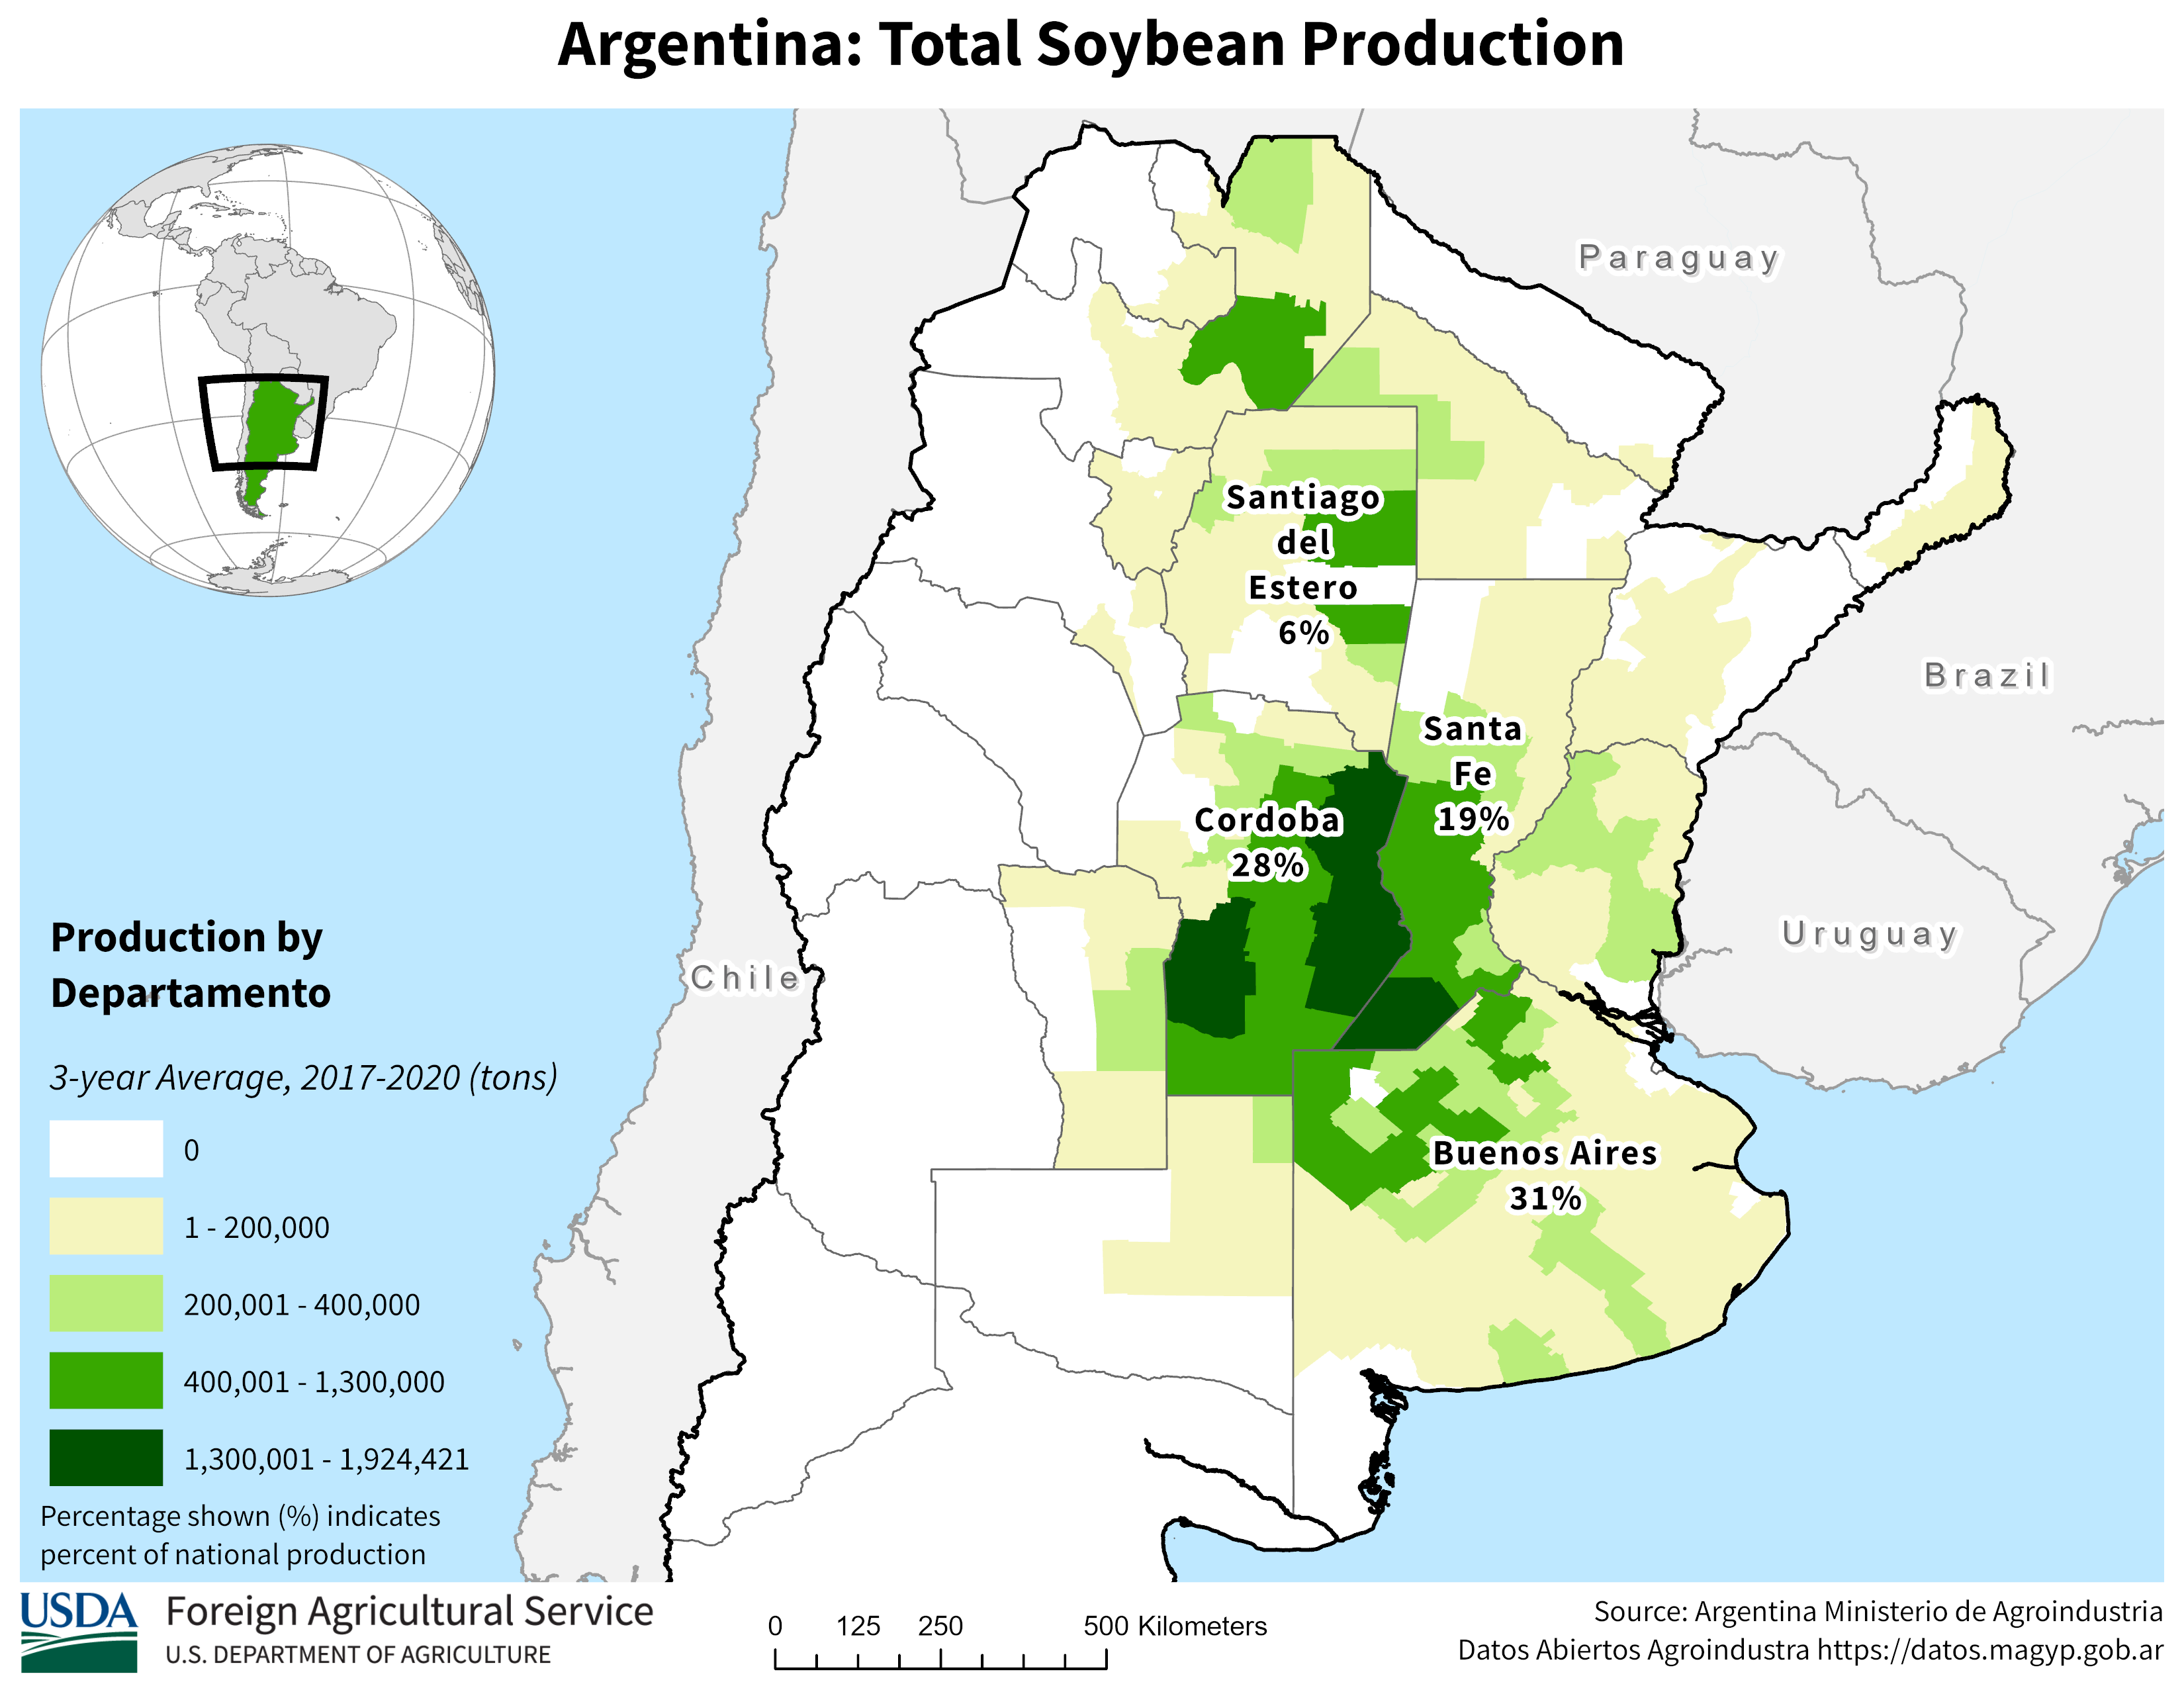
https://ipad.fas.usda.gov/countrysummary/default.aspx?id=AR
It looks like rains in that area that will dry out have been pretty good the past month, so they can hold out for awhile.
However, these maps below show that most of Brazil and Argentina have had below average rain with some spots having been well below average. It's hard to make a case for big yields considering the deficient rains.
The USDA in their last report a week ago INCREASED soybean production in Brazil. Unless they found a bunch of acres, this seems inconsistent with the rain amounts below.
https://www.cpc.ncep.noaa.gov/products/Precip_Monitoring/Figures/global/n.30day.figb.gif
https://www.cpc.ncep.noaa.gov/products/Precip_Monitoring/Figures/global/n.90day.figb.gif
The weather for Argentina and S.Brazil continues to be BULLISH.
These were the last 12z GEFS rain departures from average for the next 16 days.
Still bullish for Argentina growing areas but not AS bullish/dry as earlier this week. 2 week rain anomalies below from the 0z European Ensemble model.
Matt was in with our weather this morning!
https://www.youtube.com/watch?v=MCSTyJ2W7hg
Still modestly bullish for Argentina. These were 2 week rain anomalies from the last 12z European Ensemble model.

Still bullish Argentina weather. Possibly too much rain in S.Brazil.
1. 2 week rain departures from the last 0z European Ensemble model
2. Total rain departures into early March.

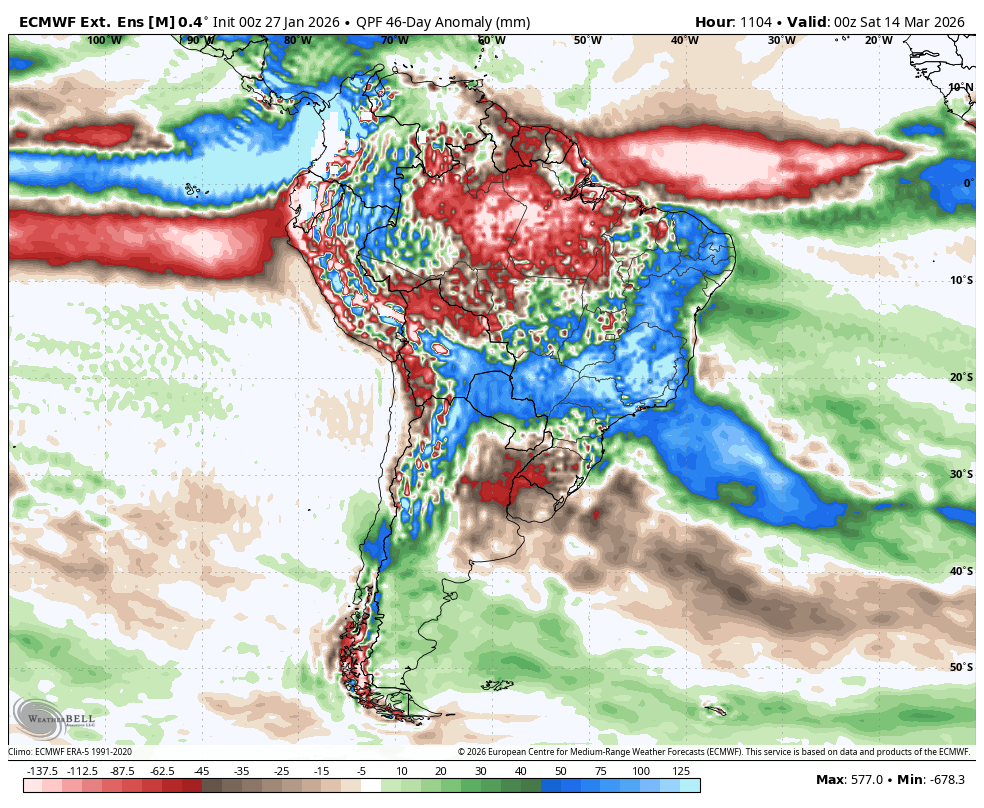
Awesome Eric was in with our weather on Friday!
Weather has turned bearish for Argentina.
1. 2 week Rain departures from the last 12z European Ensemble model. Slightly above average rain for Argentina now. Still a bit too much rain in central parts of Brazil.
2. Total rain departures thru mid March. Similar pattern continues.
Discussion of solar effects starts at 14:00.
Feb 3, 2026: West Pattern Change | Eastern US Warmth | Solar Cycle, Sunspots, & Drought?
Thanks very much, cutworm!
After my wife gets off of her conference call, I'll listen this and look again at this signal.
In the past, I was unable to find a strong correlation.
The bidecadal variability of the solar output seems too small to produce a significant response within Earths coupled ocean-atmosphere system.
Climate change and land use change has in fact trumped all the other growing season signals for the Cornbelt.
Higher moisture in the atmosphere along with tens of millions of tightly packed corn that converts solar energy from heat to stored chemical energy in the plants via the miracle of photosynthesis is much more important.
Daytime temps from extreme heat as well as the most severe droughts have significantly been reduced the past 3+ decades in the Midwest.
In addition, across the entire planet during the growing season ALL the plants are much more robust because of the increase in CO2 from 290 parts per million to around 430 ppm now. The planet greening up from photosynthesis is not only REDUCING drought, it's making the plants more drought tolerant.
This is likely to dampen out signals from natural variations in the solar cycles but we still don't know everything about it.
If the climate scientists and others would just be honest and compare recent weather to the 1800s when global temperatures were over 2 deg. cooler and CO2 was 130 ppm lower, this climate CRISIS nonsense would vanish.
Those conditions returning would cause 2 billion people to starve within 5 years(my estimate in understanding the science and agronomy).
Yet, we are being taught the complete opposite.
As if the conditions before the Industrial Revolution were perfect and the deviation since then has disrupted the climate, is unnatural and all bad.
Look at what the 1800s weather/climate was REALLY like in the United States below and see how its SO much better now.
Re: Re: Re: Re: Re: Death by GREENING!
By metmike - Feb. 2, 2025, 7:54 a.m.
In the past, I was unable to find a strong correlation.
The bidecadal variability of the solar output seems too small to produce a significant response within Earths coupled ocean-atmosphere system.
Matt comes to the same conclusion.
Thanks cutworm!
You and I both appreciate this wonderful source for weather information and how it impacts our crops/agriculture.
Also, the fact that the fake climate crisis exists because:
1. They take the bad stuff, exaggerate it massively and give it 10 times more weighting than it deserves when applying it to LIFE on this planet.
2. They ignore or downplay the good, most important stuff.
A planet massively greening up with MUCH more food for all the creatures living on it along with the booming biosphere and LESS extreme cold(that kills more life than heat) by itself negates the narratives about us destroying the planet from a climate CRISIS.
We are destroying the planet for other reasons, like using up natural resources and installing wind farms all over the place as well as polluting but we have made the climate MUCH BETTER for most life and the increase in CO2 actually rescued life from extreme, adversely LOW CO2 conditions, barely above the threshold for photosynthesis to shut down.
CO2 is the building block for all life and is still not quite half the optimal level.
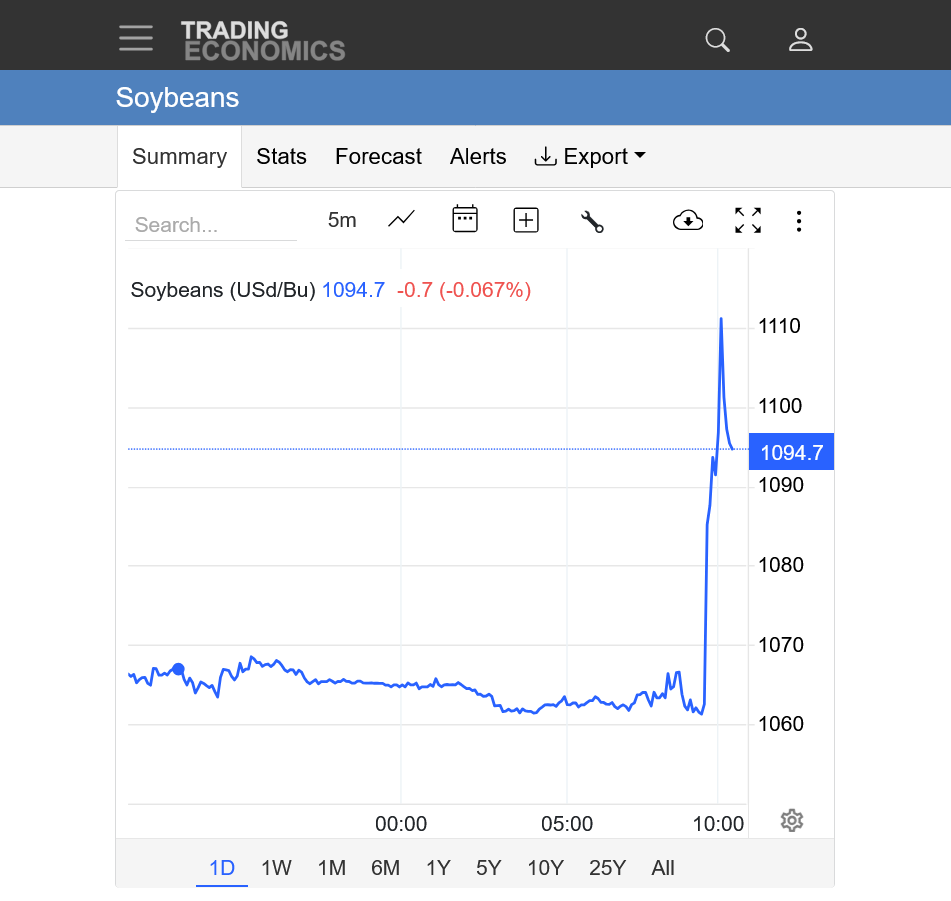
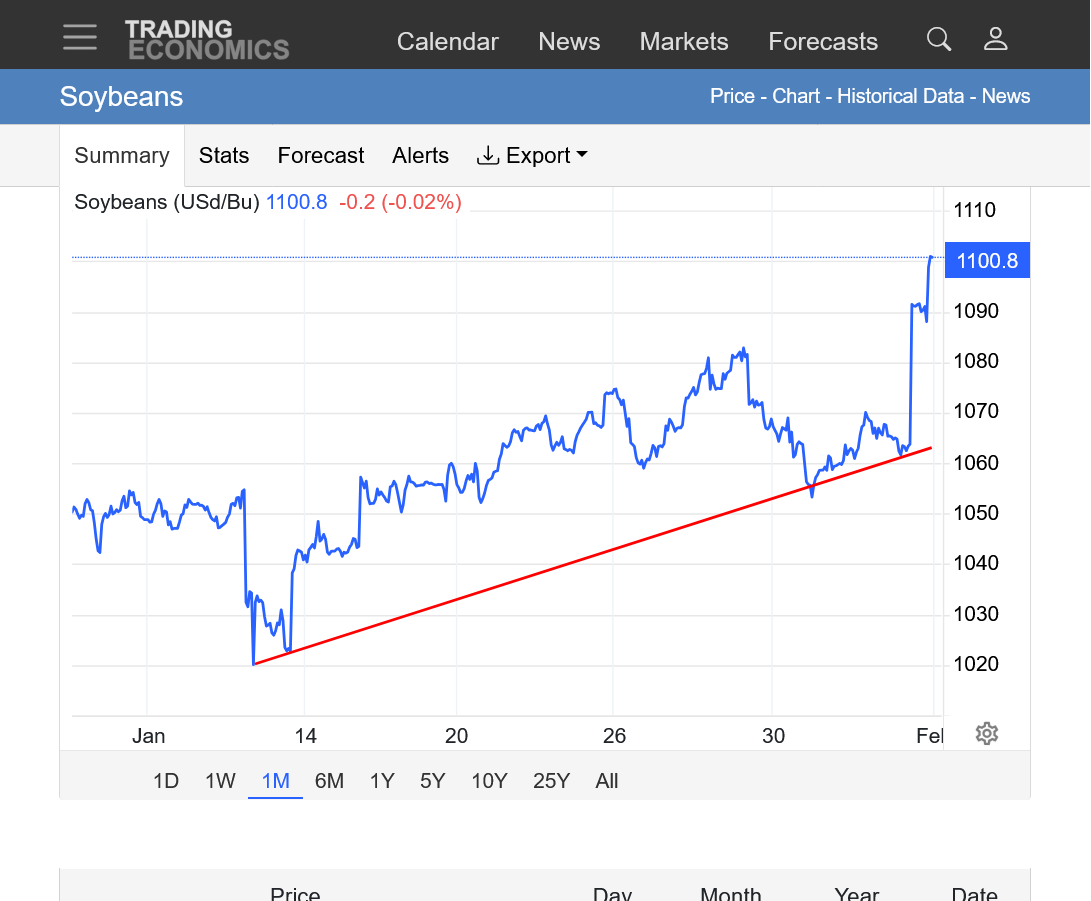
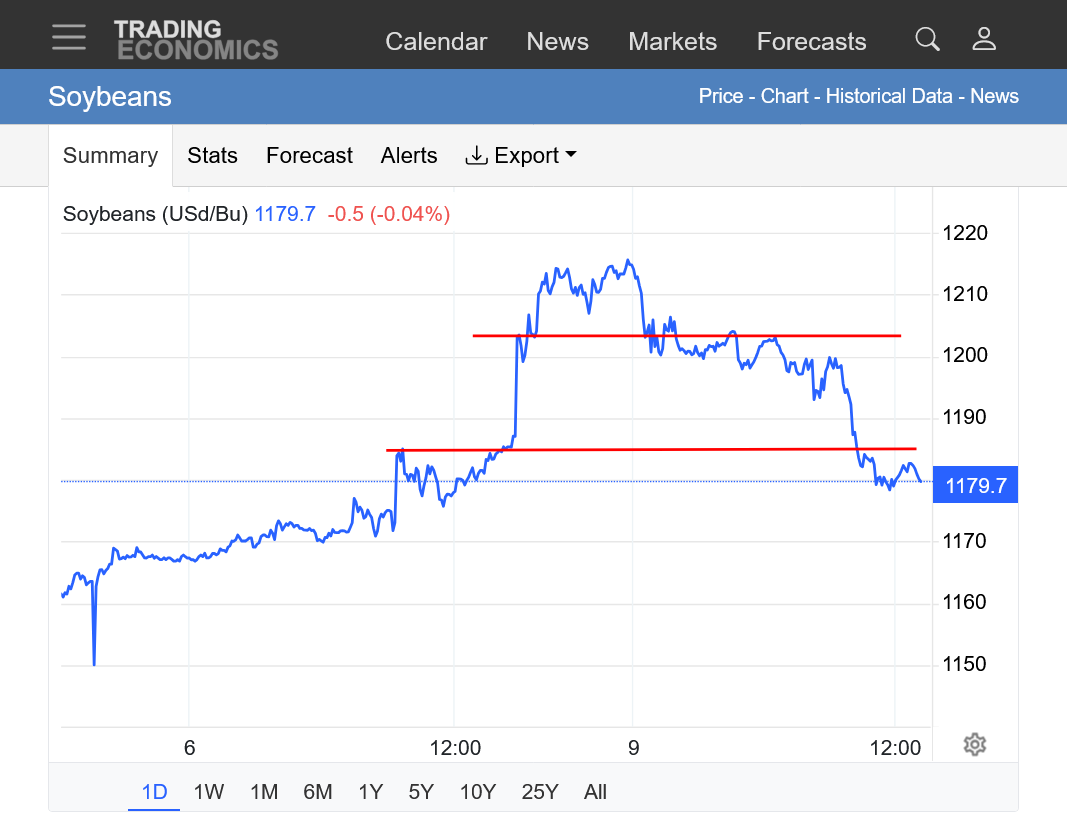
At 9:39 am CT(the time stamps here are ET) beans took off like a rocket. SH26 was up by almost 50c at the peak, now up around 30c. Can't find the news yet but this WAS from news.
I'll guess it had to do with China demand.
https://tradingeconomics.com/commodity/soybeans
1 day chart below.
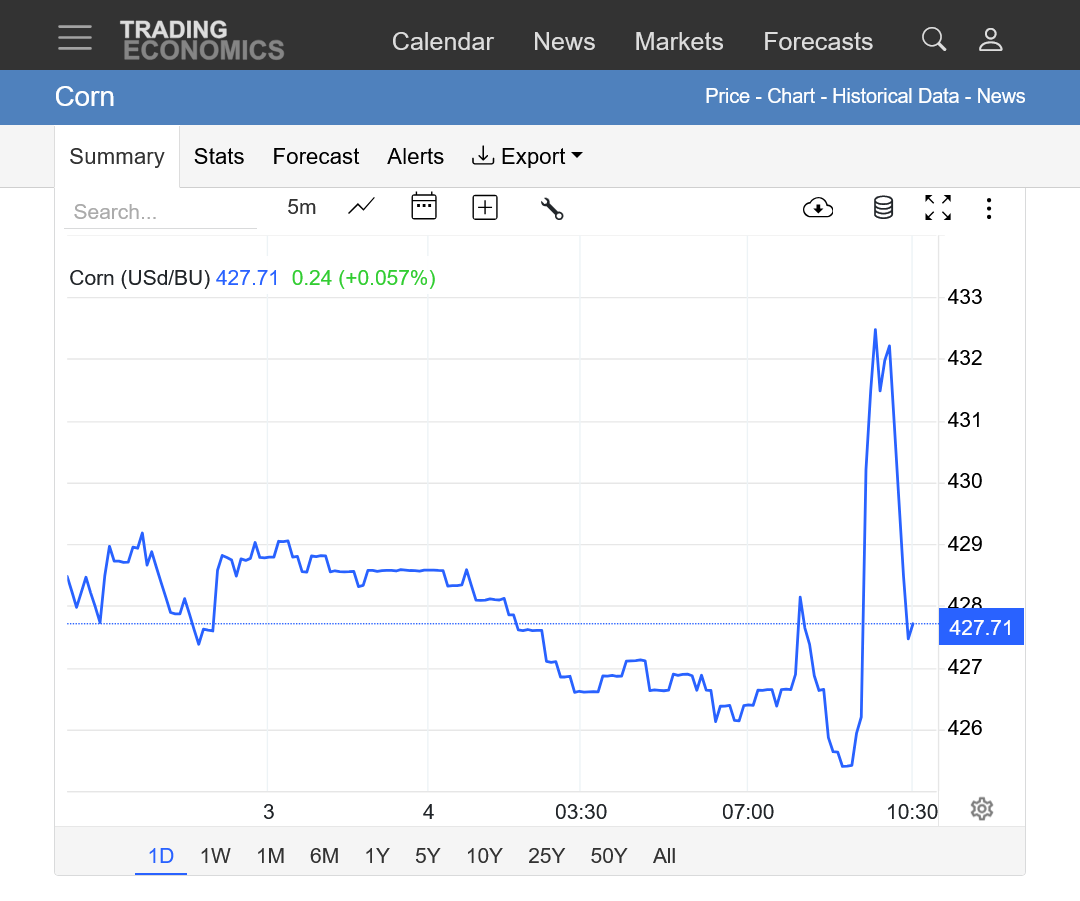
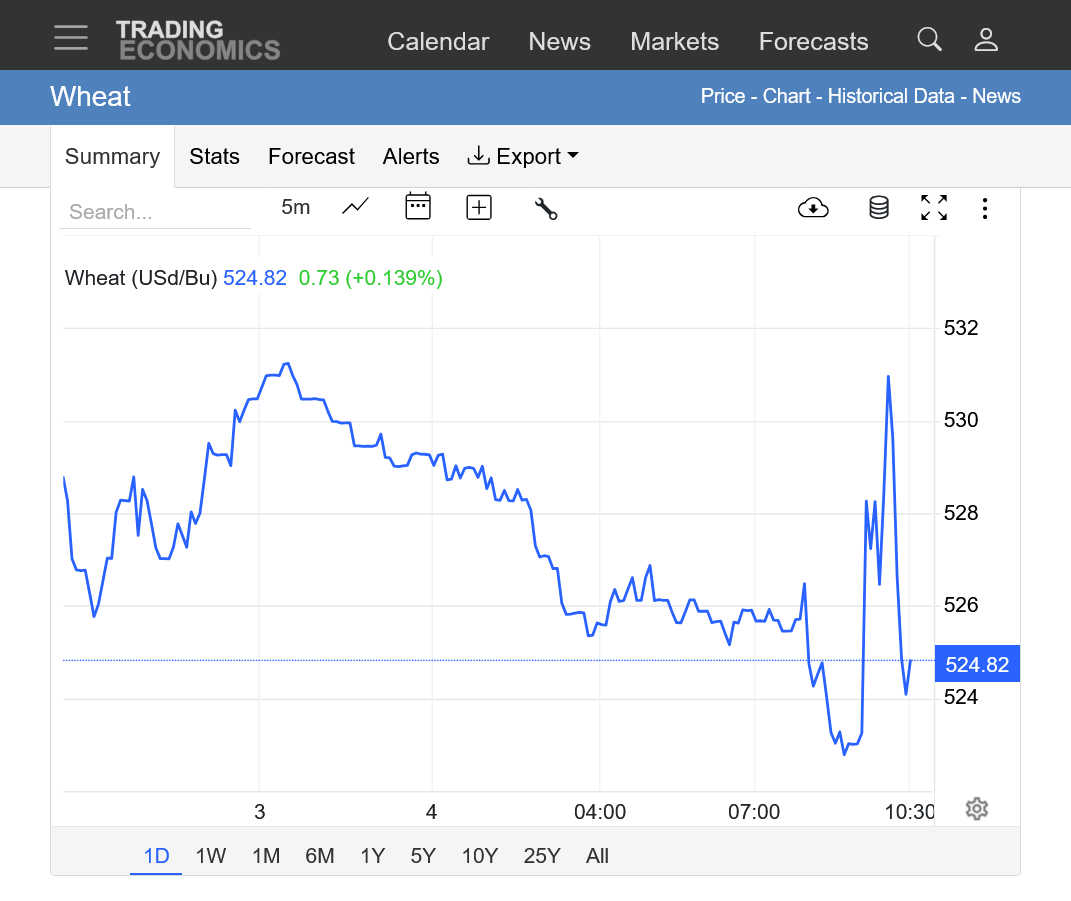
Corn and wheat spiked up in sympathy initially but came back down.
Corn-1 day below:
https://tradingeconomics.com/commodity/corn
Wheat-1day below:
https://tradingeconomics.com/commodity/wheat
trump tweet that China going to but another 8 mil tons beans
Thanks, cutworm!
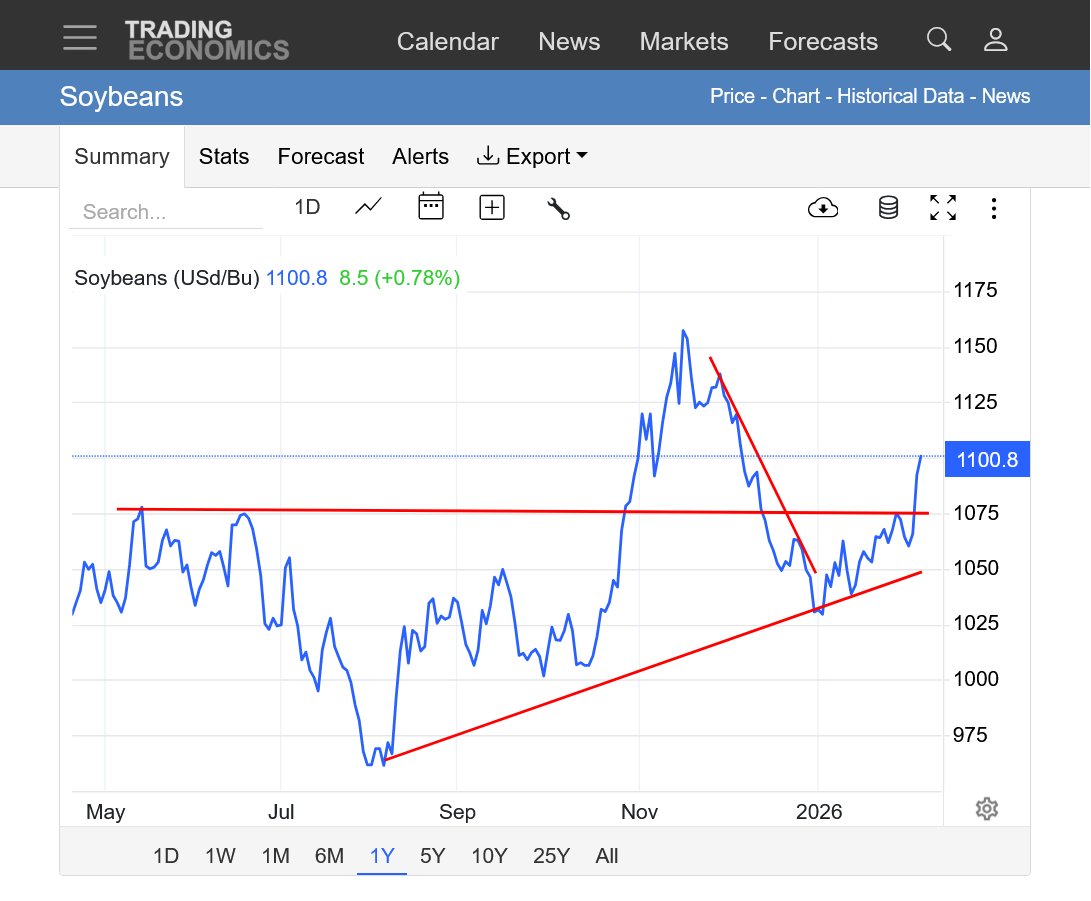
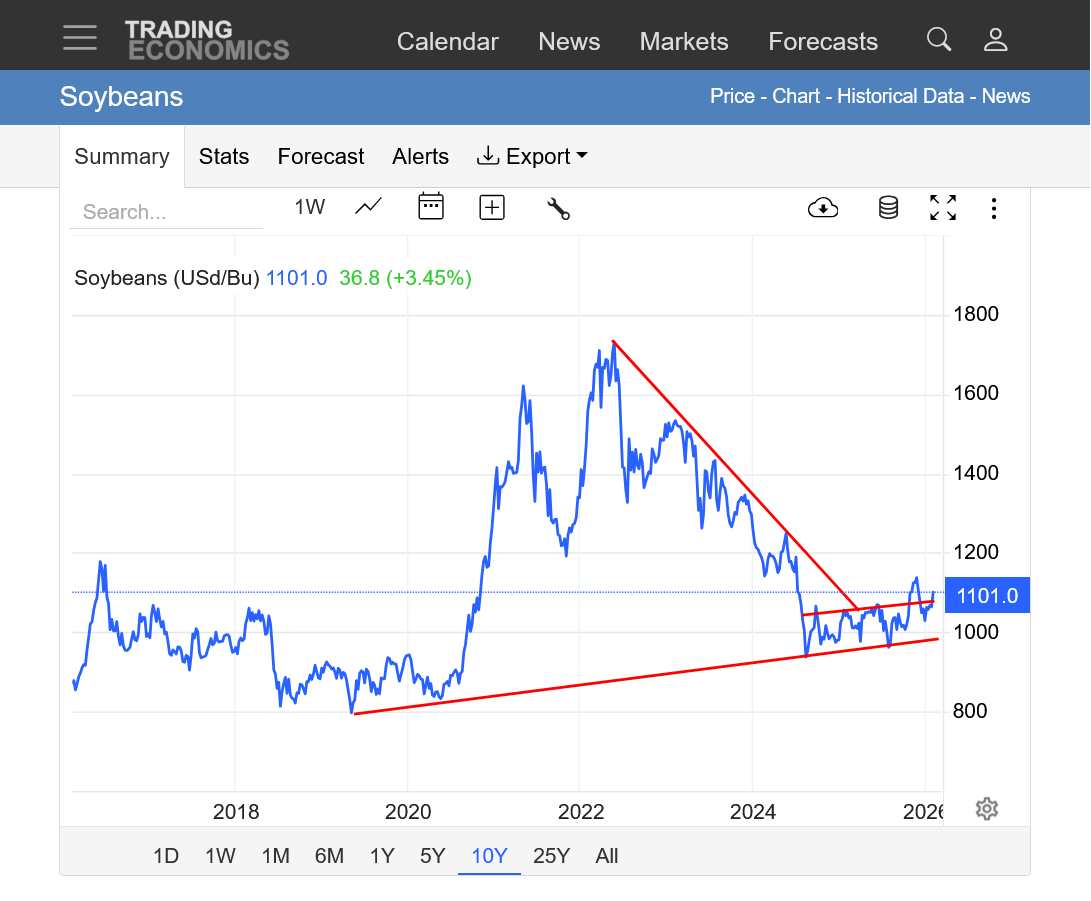
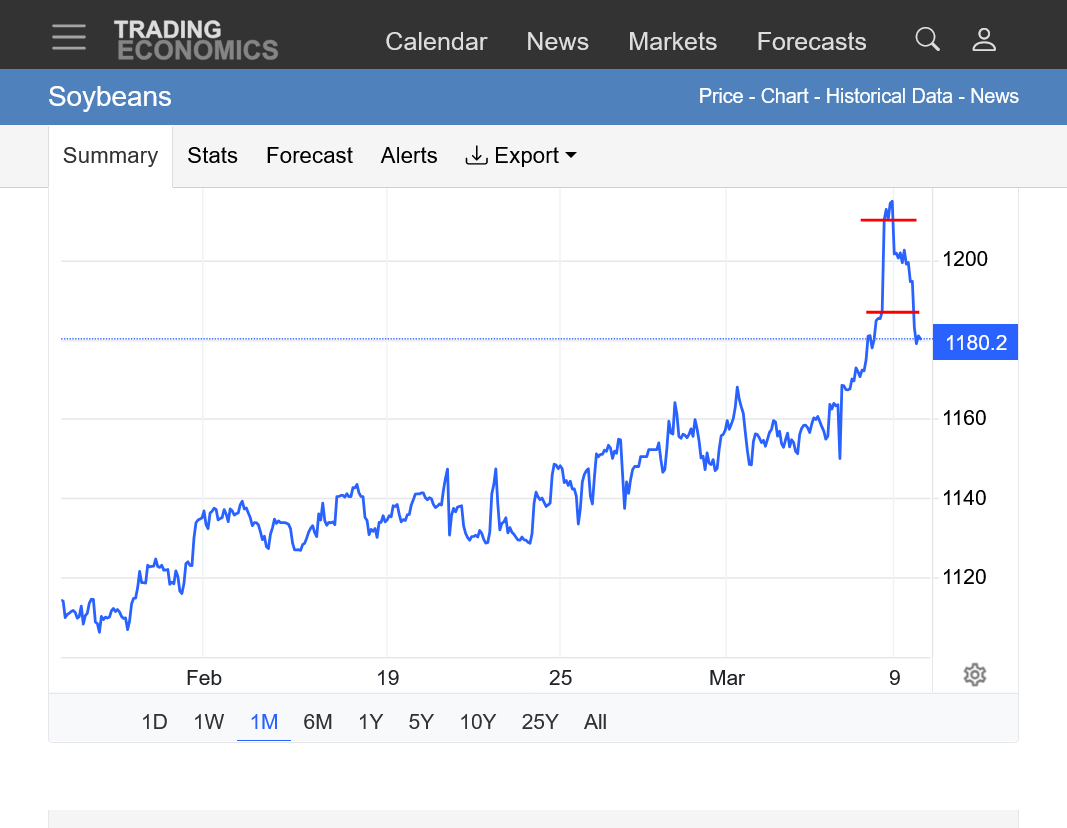
The price charts below do not accurately depict the high for the front month, March today which was 1115.
https://tradingeconomics.com/commodity/soybeans
1. 1 month: New highs for 2026
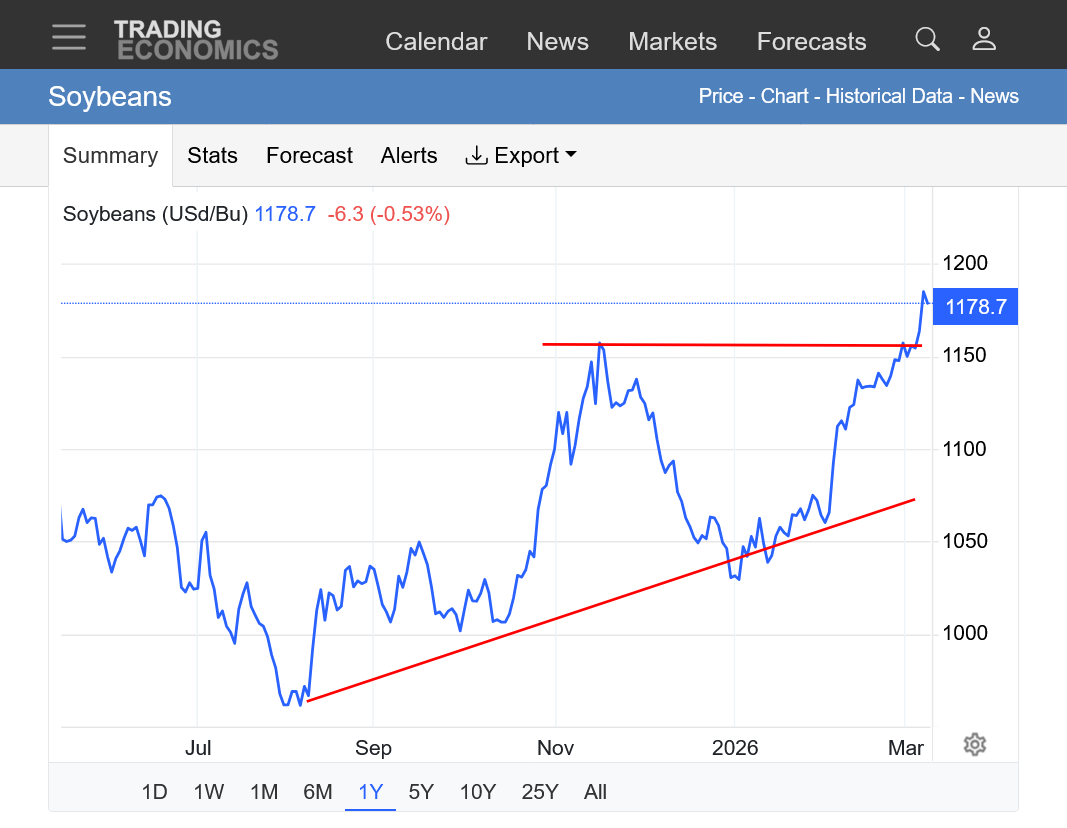
2. 1 year: Bullish posture. Higher lows.
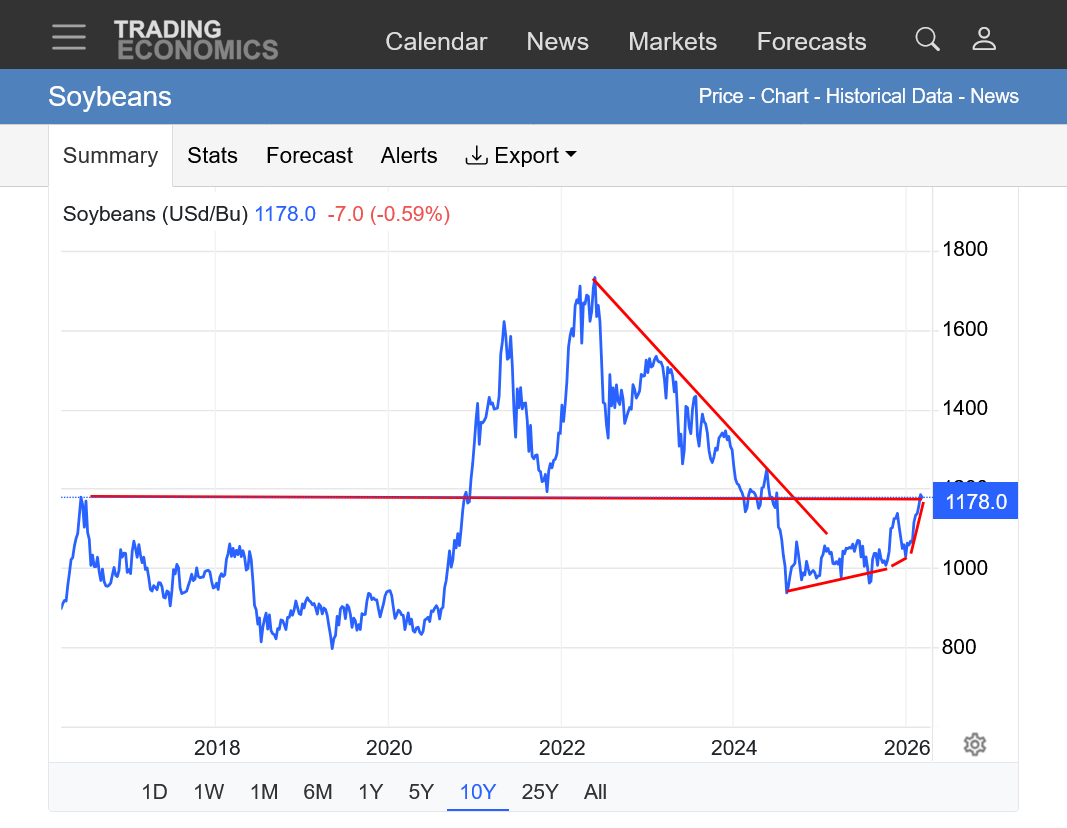
3. 10 years: Longer term uptrend/higher lows. Above the uptrend channel again. Longer term symmetrical wedge/triangle with higher lows and lower highs which is violated to the upside because we're beyond the apex of the triangle.
Eric was in with our weather on Friday:
https://www.youtube.com/watch?v=V0c4pp71CnM
2 week rain anomalies from the last 12z European Ensemble model. Robust rains to finish off the crop in Argentina. Dry-ish end to parts of S. Brazil.

Same pattern thru most of March:
USDA report tomorrow Feb 10th
Thanks very much, cutworm!
I was unaware of that.
More on the USDA report this evening:
Feb 10, 2026: Cali Storms | Overwintered Drought |
Karen Braun
@kannbwx
U.S. corn ending stocks decrease from last month as USDA bumps exports to 3.3 billion bushels. Minimal/no changes in wheat and beans.
·
USDA pushes Brazil's 2025/26 soybean harvest to 180 million metric tons. No changes to corn or to Argentina's crops
.
USDA's estimates for global corn and wheat ending stocks come in below expectations/last month (ending wheat's run of surging each month as harvests surpassed predictions). Soy stocks are up on a massive 180 mmt Brazilian crop.
Immediate report reaction: Higher US corn exports & 180 mmt Brazil soy crop = justified. Notable that world wheat stocks finally stopped surging. Seems USDA took Trump's week-ago comments seriously. Reads to me like USDA might have otherwise lowered US soy exports this month?
Eric was in with his awesome weather this morning:
Feb 11, 2026: Very Active Pattern Next 2 Weeks | 20°F Above Normal Temps Midwest/Plains | ECMWF vs..
Matt's weather for us on Thursday!
Eric did our weather on Friday!
Feb 13, 2026: 100” of Snow in Sierra Nevada Mts | Deepening Western Trough | Svr Storms South...
USDA first look at crop acres will be Thursday morning.
'Might' be a cycle timeframe to get long C and S. Friday is March option expiration, so premiums not excessive.
Two cents.
Thanks very much, cutworm and tjc!
Much of the country would appreciate much more precip before planting to recharge the depleted soil moisture. An impending El Nino reduces the threat of a widespread Cornbelt drought(La Nina's increase that) but we've been locked in a very dry(and cold) pattern long enough. This new pattern is better for moisture but this very dry start to the new year has elevated the threat of drought to start the growing season(in my opinion).
Matt was in with our weather:
https://www.youtube.com/watch?v=VAoYCQFibwo
+++++++++++++++++++==
Re: Re: Re: Re: Re: Weather May 2022
Soilmoisture anomaly:
These maps sometimes take a day to catch up to incorporate the latest data(the bottom map is only updated once a week).
https://www.cpc.ncep.noaa.gov/products/Soilmst_Monitoring/US/Soilmst/Soilmst.shtml#
![]()

++++++++++++++++++++++++++++
Updated daily below:
https://mrcc.purdue.edu/cliwatch/watch.htm#curMonths
Support for all MRCC-hosted products and services is currently suspended as of April 17, 2025, due to a lapse in federal funding from the Department of Commerce through NOAA.

NEW LINK:
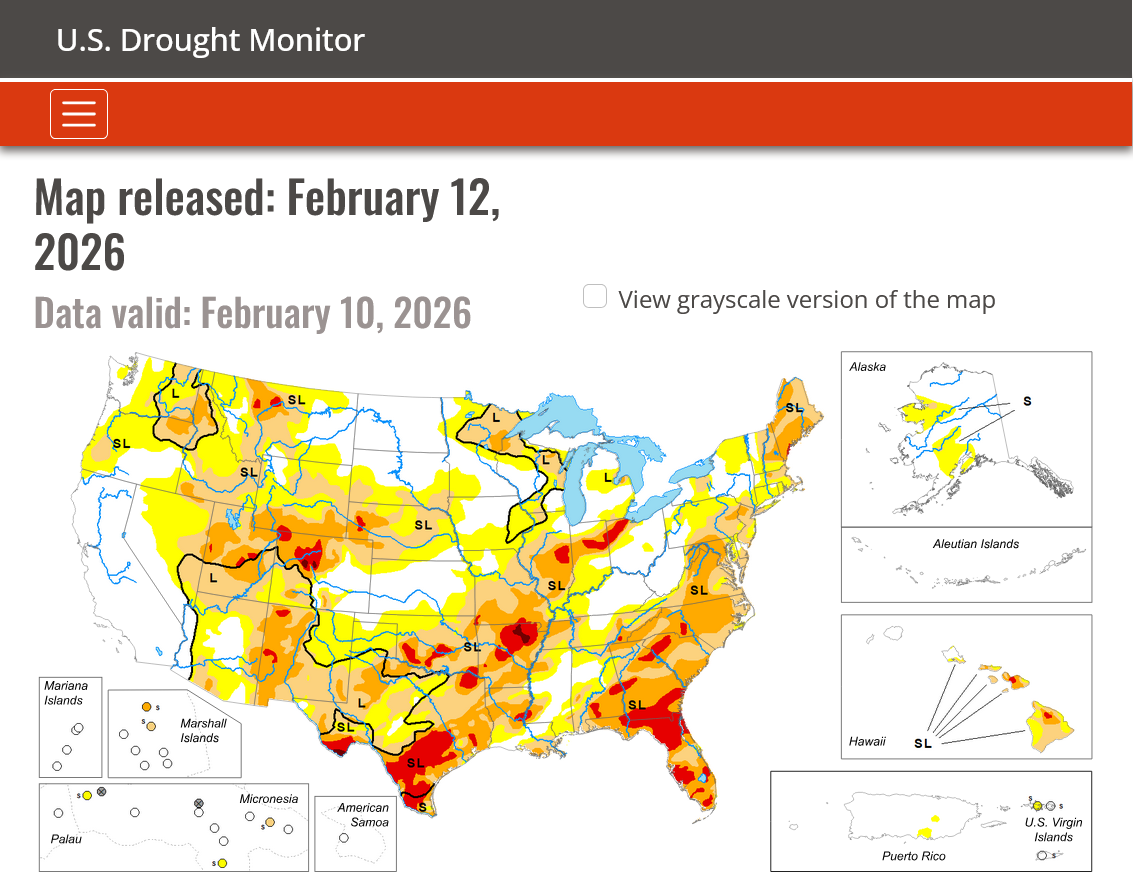
https://www.drought.gov/current-conditions
Thru February 10, 2026
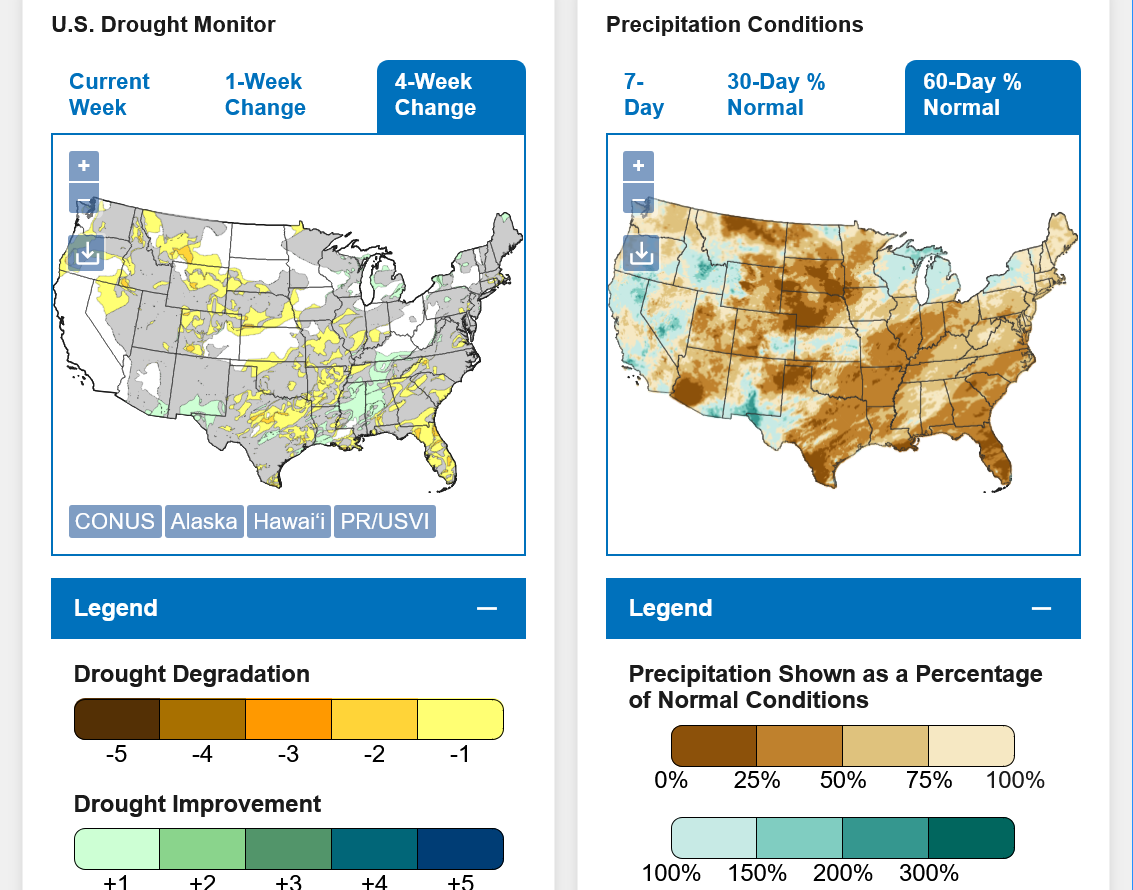
DROUGHT MONITOR
https://droughtmonitor.unl.edu/
Drought expanding this Winter from Southern Plains, northeastward.
7 Day Total precipitation below:
http://www.wpc.ncep.noaa.govcdx /qpf/p168i.gif?1530796126

2-17-26 El Nino, here we come-FAST!
Started by metmike - Feb. 17, 2026, 11:54 a.m.
https://www.marketforum.com/forum/topic/117969/
This is usually good news for crop production but not all El Nino's are the same.
+++++++++++++
Andrew was in doing our weather this morning:
This article is from Nov 4th. This is why exports are down in beans.
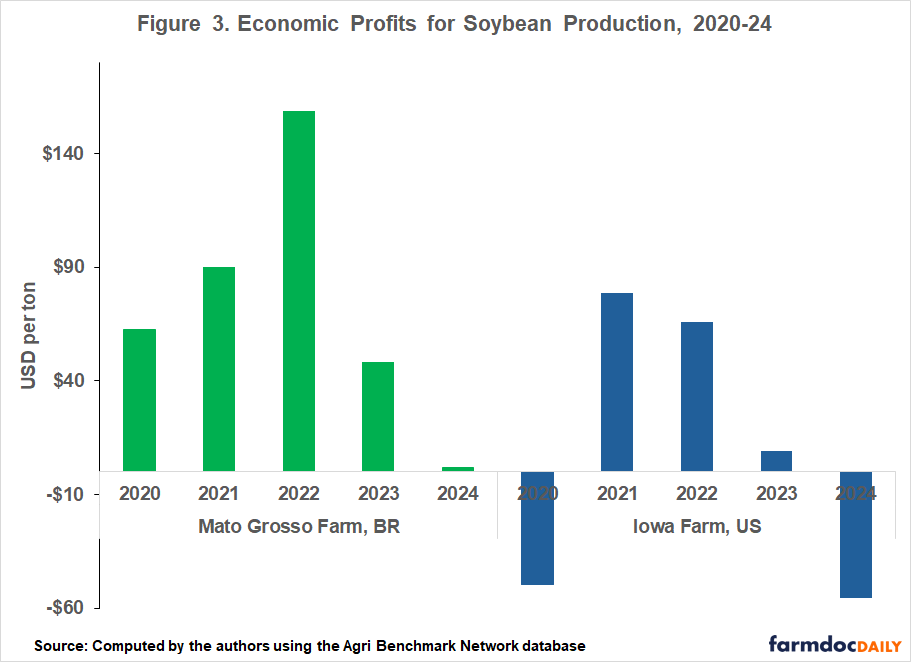
Key Factors Behind Brazil Soybean Price Spread Advantage to U.S. - Ag Bull Trading
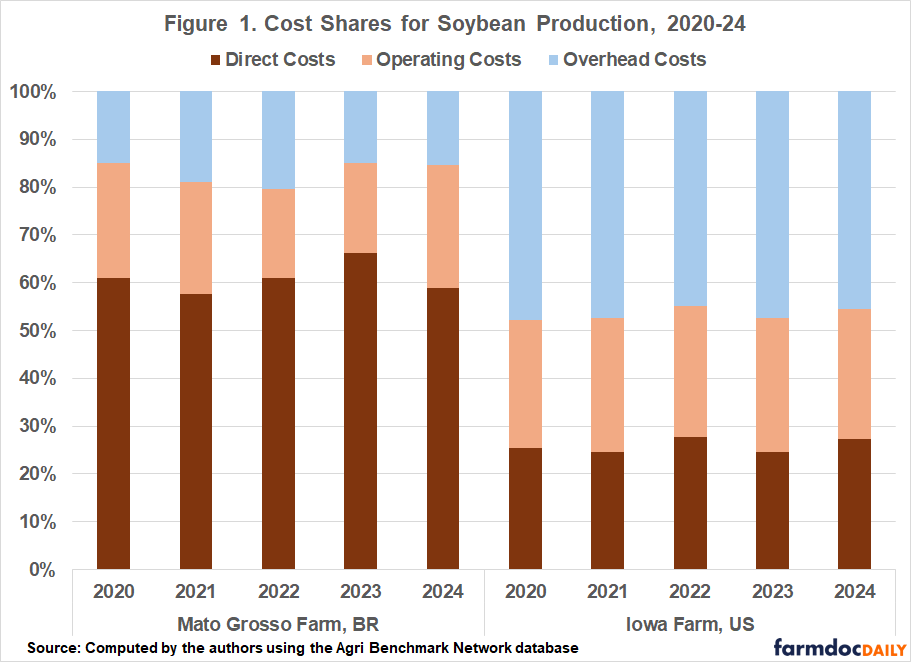
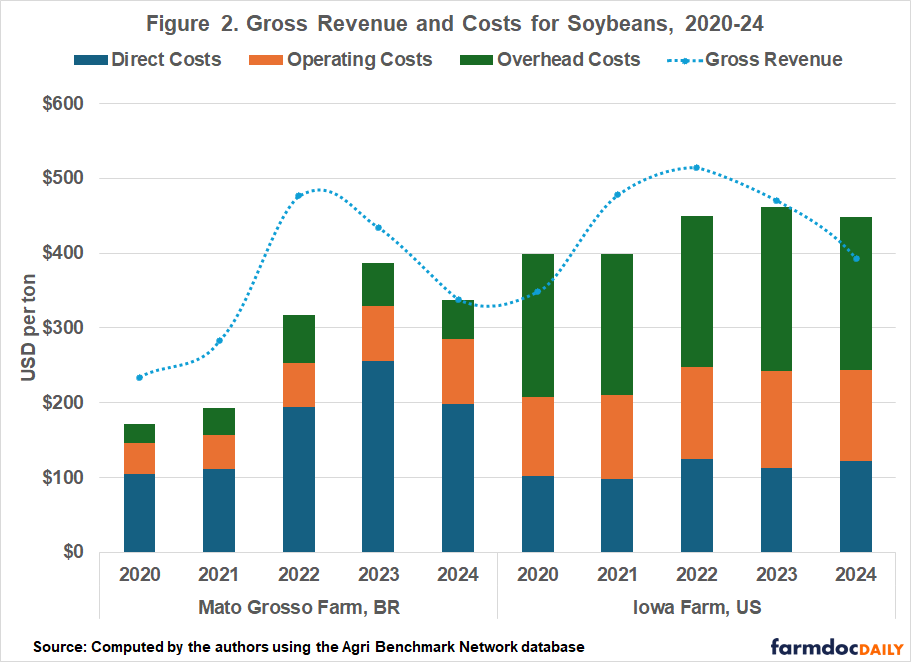
Key Factors Driving the Price Spread
1. Brazil’s cost of production and export competitiveness
USDA’s Economic Research Service (ERS) study (link) comparing Brazil vs U.S. shows:
2. Currency & exchange‐rate effects. Brazil benefits from a weaker Brazilian real (BRL) relative to the U.S. dollar (USD), which improves its export competitiveness in USD terms. The USDA study specifically notes that currency devaluation boosts Brazil’s competitiveness because costs in local currency may increase, but the USD value of domestic output increases more.
When the USD is strong vs the BRL (or when USD denominated world prices rise), Brazilian exports become more attractive relative to U.S. origin.
3. Timing / seasonality and planting vs harvest dynamics
4. Competitive pressure from Brazil’s rising export share
Brazil’s export share has grown significantly: Brazil’s soy export share (and production) has risen, especially since the U.S./China trade war during President Trump’s first term.
This rising supply means Brazil needs to compete actively on price (especially for December–January shipment) to maintain or grow market share.
5. U.S. futures/cash price run-up and global basis effects
Is Brazil Selling Below Cost?
Upshot: Brazil is not broadly selling well below its structural cost of production — rather it is selling at a competitive margin and making use of its cost base, logistics advantage, and currency/competitive dynamics to offer lower delivered price than U.S. origin.
Why the Spread is Especially Large for Later Shipment
There are a few additional reasons for this time-structure effect:
Bringing It All Together
In summary:
------------------------------------------------------------------------------------------------------------------------------------------
AI says
As of early 2026, Brazilian soybeans are generally more cost-competitive and cheaper than U.S. soybeans, often trading at a discount in global markets. Lower production costs, particularly for land, capital, and seeds, allow Brazil to maintain lower export prices, often capturing higher market share in China.
Key Price Comparison (2025-2026):
 US$8.67/bu compared to
  US$9.85/bu in the U.S..
Factors Affecting Price Differences:
Thank you, cutworm!
Feb 23, 2026: Northeast Blizzard | Florida Freeze | Clippers… | Model Battle on Temperatures...
US vs. Brazil Soybean Production Cost Explained - YouTube
The discussion starts a 0:45
Excellent article, cutworm!
Here it is in it's entirety with lots of other great articles from the same source:
![]()
https://farmdocdaily.illinois.edu/2026/2
https://www.agbull.com/key-factors-behind-brazil-soybean-price-spread-advantage-to-u-s/
A weaker dollar is not always a bad thing. It helps increase exports a great deal!
https://tradingeconomics.com/united-states/currency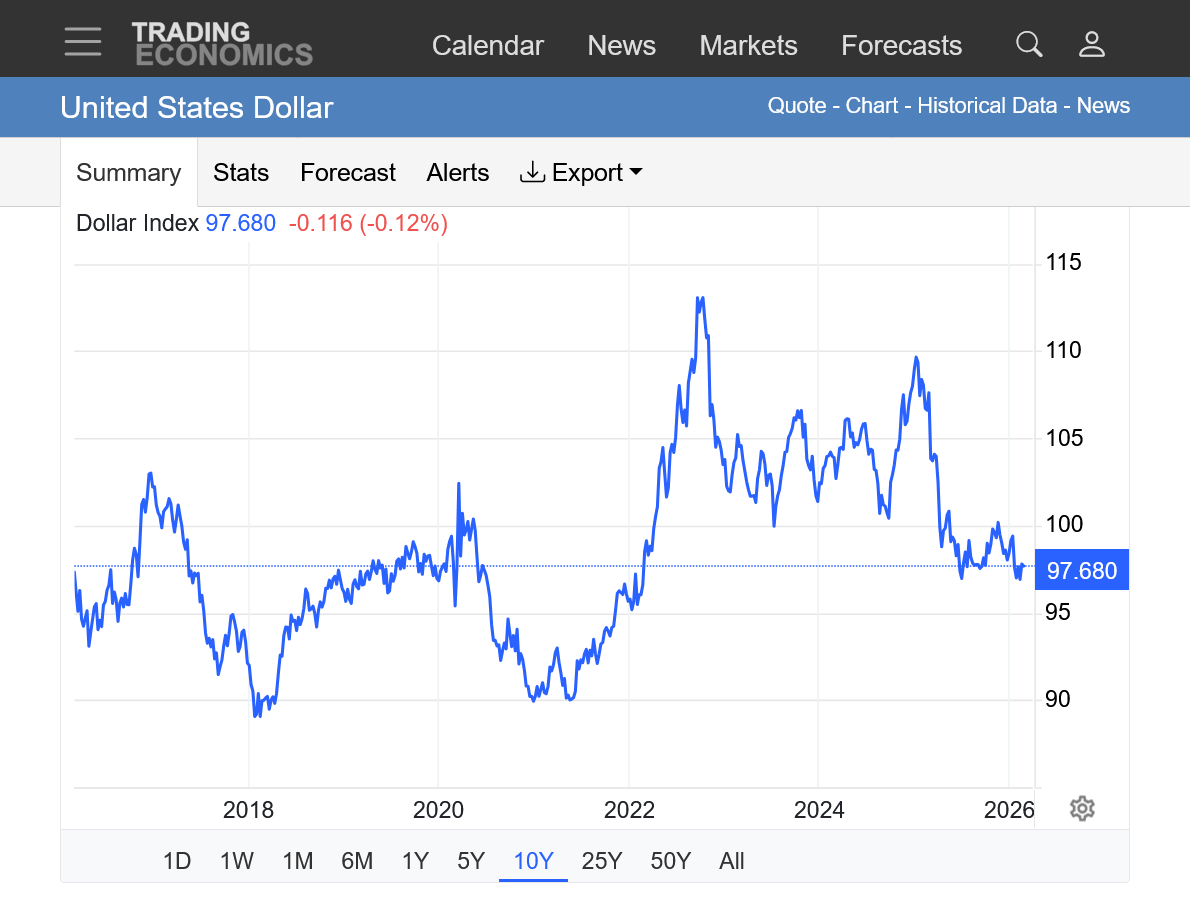
Hypothetically, if beans were selling at $10/bushel and nothing changed except the US Dollar dropped 10%, then the price to our foreign customers goes down to $9.10/bushel.
So demand and sales of US soybeans goes up from cheaper prices. If the price that US farmers received still stayed the same and input costs were the same and they weren't making much money before, then selling more beans isn't that helpful.
However, there's a chain reaction that happens to establish an equilibrium/balance.
Selling more beans draws down US stocks/supplies which makes beans more valuable and the price goes UP in the US from the laws of demand/supply/economics.
So the price that our risk taking producers get goes UP from $10 to let's say.......$10.50/bushel as the rest of the world is paying something like $9.50/bushel from the US dollar discount.
This is only meant to demonstrate the POSITIVE impact of a weaker dollar with a hypothetical example, while keeping many other important factors unchanged.
https://www.youtube.com/watch?v=-40h-2VwV8Q
MASSIVE drought relief on the way!!!!
My concern has been a Spring that turns too wet with the burgeoning El Nino
Still plenty of time to dry out after this very wet spell recharges soil moisture and have timely planting this Spring.
Why War in the Middle East is Moving Grain Prices
Upcoming trade talks with China.
best trade in July wheat since July 2025 6:00
fund positions---- fund buying ---9:20
crop ins
2026 crop acres
Edit fertilizer prices, he said that fertilizer dealers may pull their bids.
Thanks very much, cutworm!
Gap and crap buying exhaustion signals in C, S and W.
The highs were emotionally triggered extreme spikes on the open last night.
Mar 2, 2026: Heat Surging East (but don’t get used to it) | Severe Storm Risk Increasing | Models..
https://www.youtube.com/watch?v=fZ0B7TXzjSE
++++++++++++
A wet FIRST HALF of March is on the way.
Re: Re: 2-27-26: Excessive rains early/mid March
The top guy, Eric was in with our weather this morning!
Mar 4, 2026: 3-Day Severe Storm Risk with Local Flooding | Major Cold Signal Near Mid-Month for...
Mar 5, 2026: Latest Euro Summer Forecast | El Niño | Severe Setup | Dry Trend
new crop dec corn; new highs (4.71) for the move, above resistance (4.6475) , break outs can be bought?
new crop beans: new highs for the move, a little late to buy??? 2 days late, parabolic move up possible. gap tonight on the may contract.
corn and beans trading like energy products?
I don't post my trades; it messes with my mind.
I do not trade options except to sell, and very seldom.
Great thoughts, cutworm.
You have 2 layers of skin in the trading game.
Besides being a trader/speculator, you are also a producer that risks massive capital in the markets every year based on the market prices for the crops that you grow........whether you like it or not!!!
I'm extremely happy for you to see the recent gains in crops that you grow.
The main grain trading season is approaching with the US planting, then really important growing season.
I'm sure that our readers note that many of our weather posts here make it a top priority to consider the impacts on soil moisture, planting, growing, pod filling, harvest and other elements that play a key role in crop conditions and final production/yields.
You and me disagree a great deal on some politics but are the perfect example of a great friendship that TRANSCENDS political differences.
I have the utmost respect for you as an intelligent human being. I'll try to increase my grain trading posts this week after taking care of some chess tournament recognition announcements for the 139 students at our 2+ dozen schools.
fund positions grains at the 16;25 time
ADM 'picked up' my offer on 2000 bushel. Now, 4 hours later, I wish I had offered in 4000 bushel, haha!!
Huge gap and crap lower for ALL the grains at very significant new highs is a powerful buying exhaustion formation and MAJOR top indicator. This is a news dominated market in the short term. Could be we overextended the bull move or could be we reached the pinnacle earlier than would have happened eventually but later.
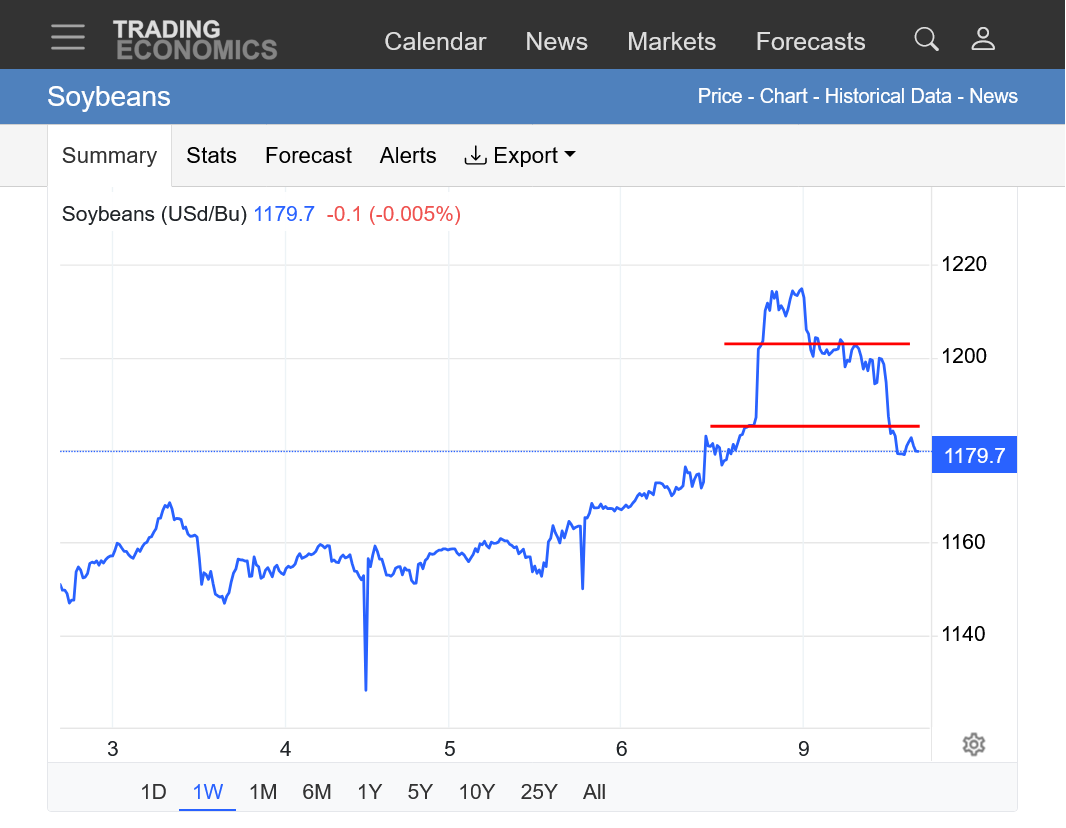
https://tradingeconomics.com/commodity/soybeans
1. 1 day with gap filled.
2. 1 week with the gap filled
3. 1 month with map filled but still well above previous highs and strong uptrend
4. 1 year: Uptrend already in place with an Upside break out above November 2025 highs
5. 10 years: Early 2022 high from the Ukraine war. Steep downward channel after that into 2024, then major lows with a NEW uptrend, starting in 2024. That uptrend slope ACCELERATED in 2025 into early 2026. We hit major longer term resistance/prior support lines overnight at the same time as the gap higher and reversal lower.
WSADE report 11:00 am on 3-11
not much change expected
Thanks, cutworm! I found out about the last several reports thanks to you!!!!
Looks like the report was yesterday!
Karen Braun

@kannbwx
USDA leaves U.S. ending stocks unchanged from last month's forecast.
25/26 U.S. soybean crush was increased 5 mbu to 2.575 mbu, but imports were increased by the same amount = offsetting effect. Avg wheat price was increased 5 cents to $4.95/bu. Otherwise, no changes to U.S. corn/soy/wheat balance sheet items.
Also a little shift on the U.S. soybean oil balance sheet. Not a really big deal, but definitely something to be aware of.
World corn stocks come in above expectations on larger crops in Brazil and Ukraine. Slight downward adjustment in wheat stocks and minimal movement in soybeans. Chinese soy/corn/wheat demand assumptions were unchanged.
USDA increased Brazil's corn crop but lowered both corn and soybean production in Argentina.


