Sold one at 6954.00 risking yesterday's close.
I bit of a hunch really. I was noticing gold underperforming silver in this metals bull mkt. Then looking at the S&P grinding higher it strikes me as underperforming gold. Stocks look tired. Also today's range is larger on the downside which might indicate acceleration to the downside.
This goes against my thesis that stocks should be ok for the coming 6-12 months with Trump attempting to take over the Fed and implement radically low interest rates.
Thanks very much, joj!
There is nobody that understands the current elevated risks more than you, the biggest one is probably the release of a decision by the Supreme Court related to Donald Trumps illegal, ruinous tariffs.
When that decision comes out, there will certainly be some stock market fireworks.
I agree a lot with your thinking with this position but I have a bearish bias, while at the same time, appreciating that the money flows that keep the market going up can keep coming longer than anybody expects.
Previous threads:
the stock markets, now short ...
21 responses |
Started by kris - Jan. 7, 2026, 9:10 p.m.
https://www.marketforum.com/forum/topic/117057/
+++++++++++++++++
This was the last post from kris at that thread.
By kris - Jan. 14, 2026, 2:26 p.m.
++++++++++++++
This was one of my last posts:
Re: Re: Re: the stock markets, now short ...
By metmike - Jan. 11, 2026, 6:31 p.m.
++++++++
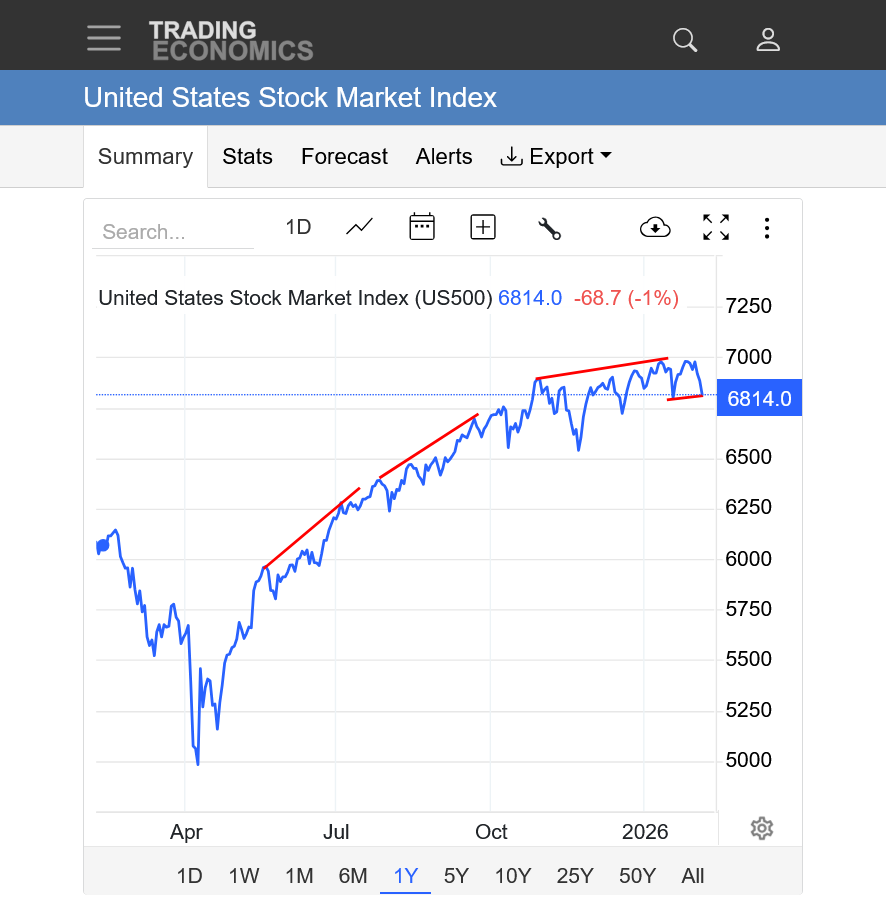
The rounded top formation is still valid but that's never how parabolic moves end(this one has been losing steam).
Took my loss overnight at 6991.
Thanks for sharing with us, joj!
I'm only using current pattern recognition with the analysis/chart below.
Each situation is different and although developing patterns often evolve into outcomes that increase the predictability of the future price, I'm thinking that the resolution of this current chart is NOT going to match the one at the bottom that a rounding top predicts.
The current pattern is only an indication of the stock market losing steam/momentum because of the flattening slope of the uptrend.
The previous trend was parabolic at times, so that in itself is not especially bearish necessarily but it clearly does tell us some things.
1. Traders are no longer as interested in buying at the market, regardless of the price as they have been in much of recent times.
2. Upside break outs to new highs often provide buy signals to trading programs which helps to provide positive reinforcement to the upside break out, even when the old highs can be tested.
3. Recent new highs are by a weaker and weaker margin(flattening slope) and are unable to attract upside breakout money flows and follow thru.
4. The overall trend is still clearly up, with bulls STILL stepping in to buy the small corrections(bull flags/waves) but make no mistake that the upside momentum is petering out.
5. Donald Trump is the rich and powerful person's president and focus's much of his agenda on things that make the stock market go higher. He has bragged about how he caused the stock market to go higher dozens of times. It's huge for him. That has greatly assisted in the psychology/mentality that gave the bulls their buying incentive when the stock market was flying higher and making new highs by wide margins.
6. However, this rounding top formation and stock market losing steam is a clear indication that the rich people, with the rich people's Ponzi Scheme are LOSING CONFIDENCE in their biggest advocate, Donald Trump's ability to lead. Too much chaos, too many counterproductive, unhinged decisions that are backfiring AGAINST the bullish and very strong forces that still underpin the stock market. For instance, the market knows that Donald Trump is still the most powerful man in the world and is still obsessed with doing things to make the stock market go higher at any cost.
7. The market is extremely vulnerable because of the unpredictability of Donald Trump. One example is the upcoming ruling by the Supreme Court on his ruinous tariffs. That upcoming decision, by itself could be the biggest factor causing the bulls to avoid buying fresh upside break outs. When that decision comes out, its impossible to NOT imagine the stock market having an extreme reaction that day and possibly longer.
Ruling that his tariffs are illegal, which they crystal clearly are because he imposes them, often with no rhyme or reason and for NON economic(political) criteria that he suddenly manufactures over and over is indisputable evidence of his illegal use of tariffs. But the Supreme court has a majority of conservatives and they must know what the consequences will be if they shoot down Trump's illegal tariffs.
8. That was just the biggest short term risk. There are numerous others that include the growing likelihood that Donald Trump will not finish his 2nd term. This is not me stating what I want to happen, it's entirely based on the objective, authentic factors that are important to the price of the stock market
9. Just to reiterate. The stock market trend is STILL higher and this loss in momentum could be temporary. For instance, if the Supreme Court could rule that Donald Trump is justified in imposing illegal tariffs and the market could explode higher and never look back.
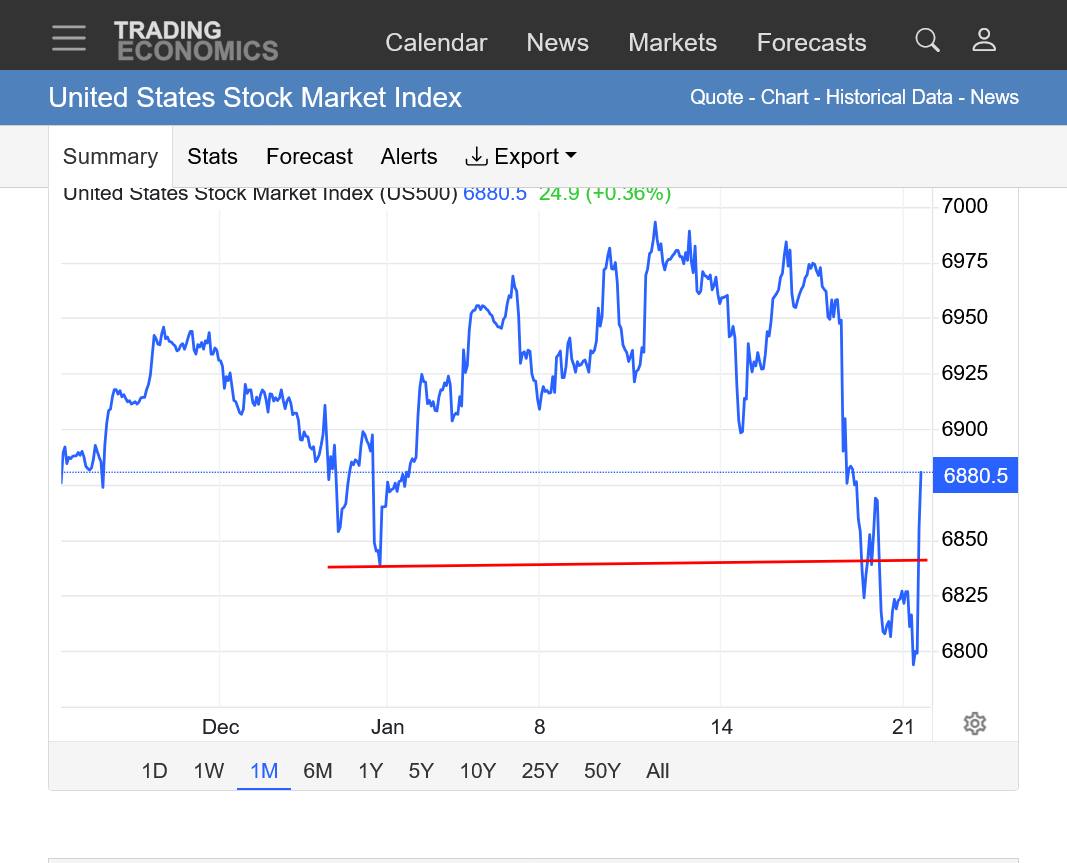
https://tradingeconomics.com/united-states/stock-market
https://www.ebc.com/forex/rounding-top-pattern-explained-how-to-spot-market-reversals

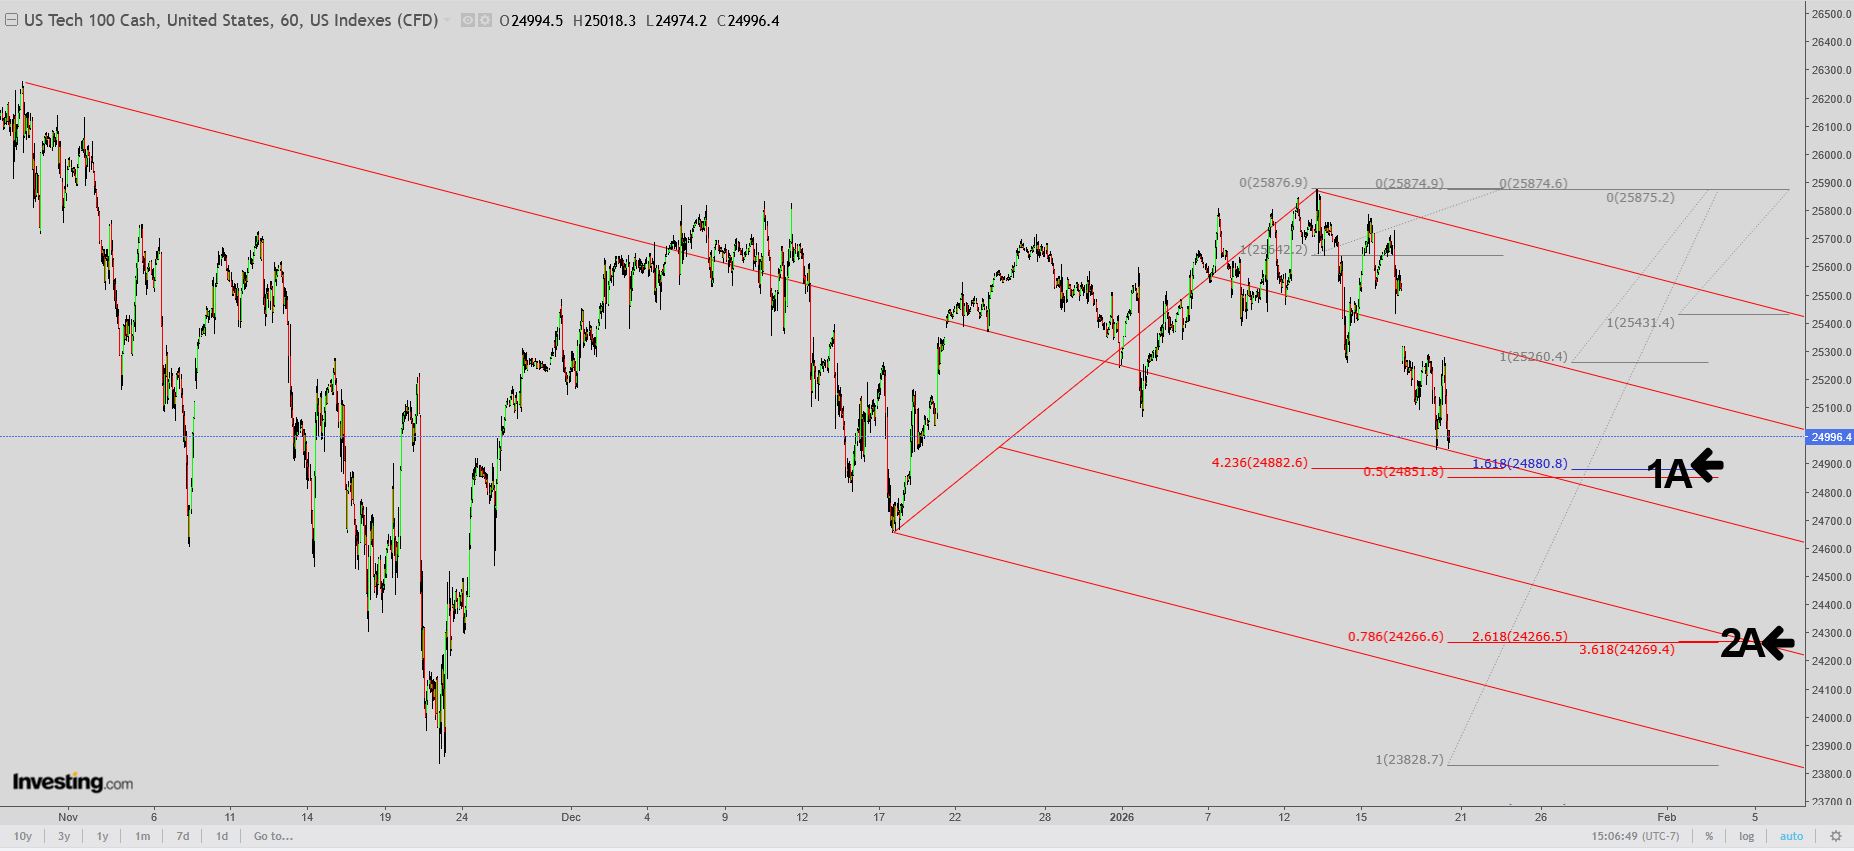
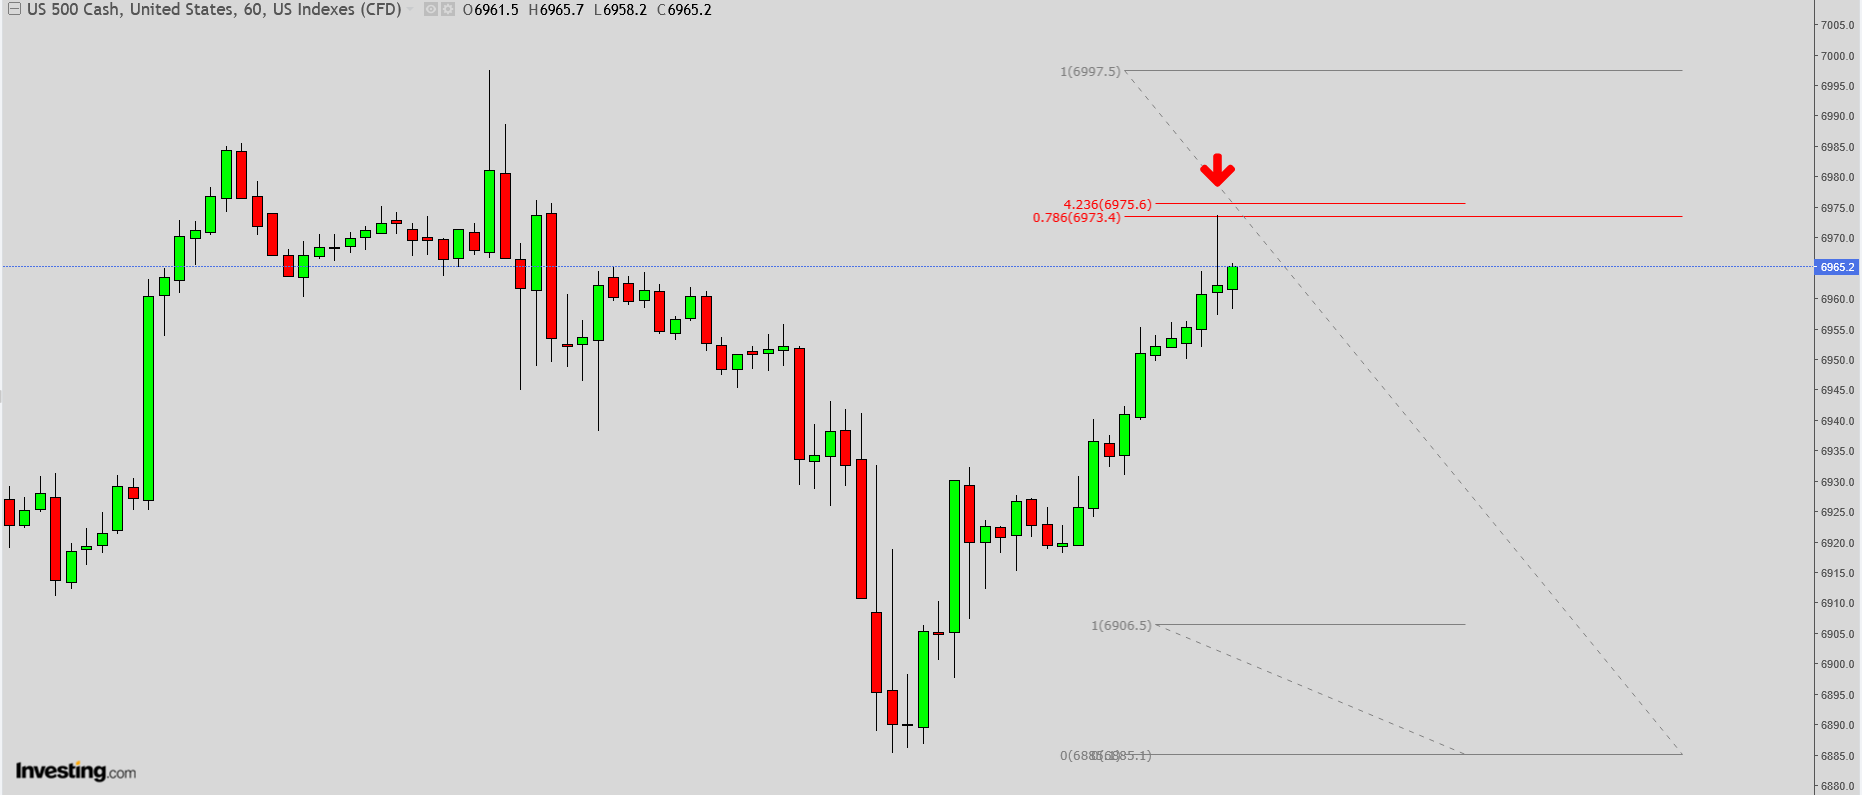
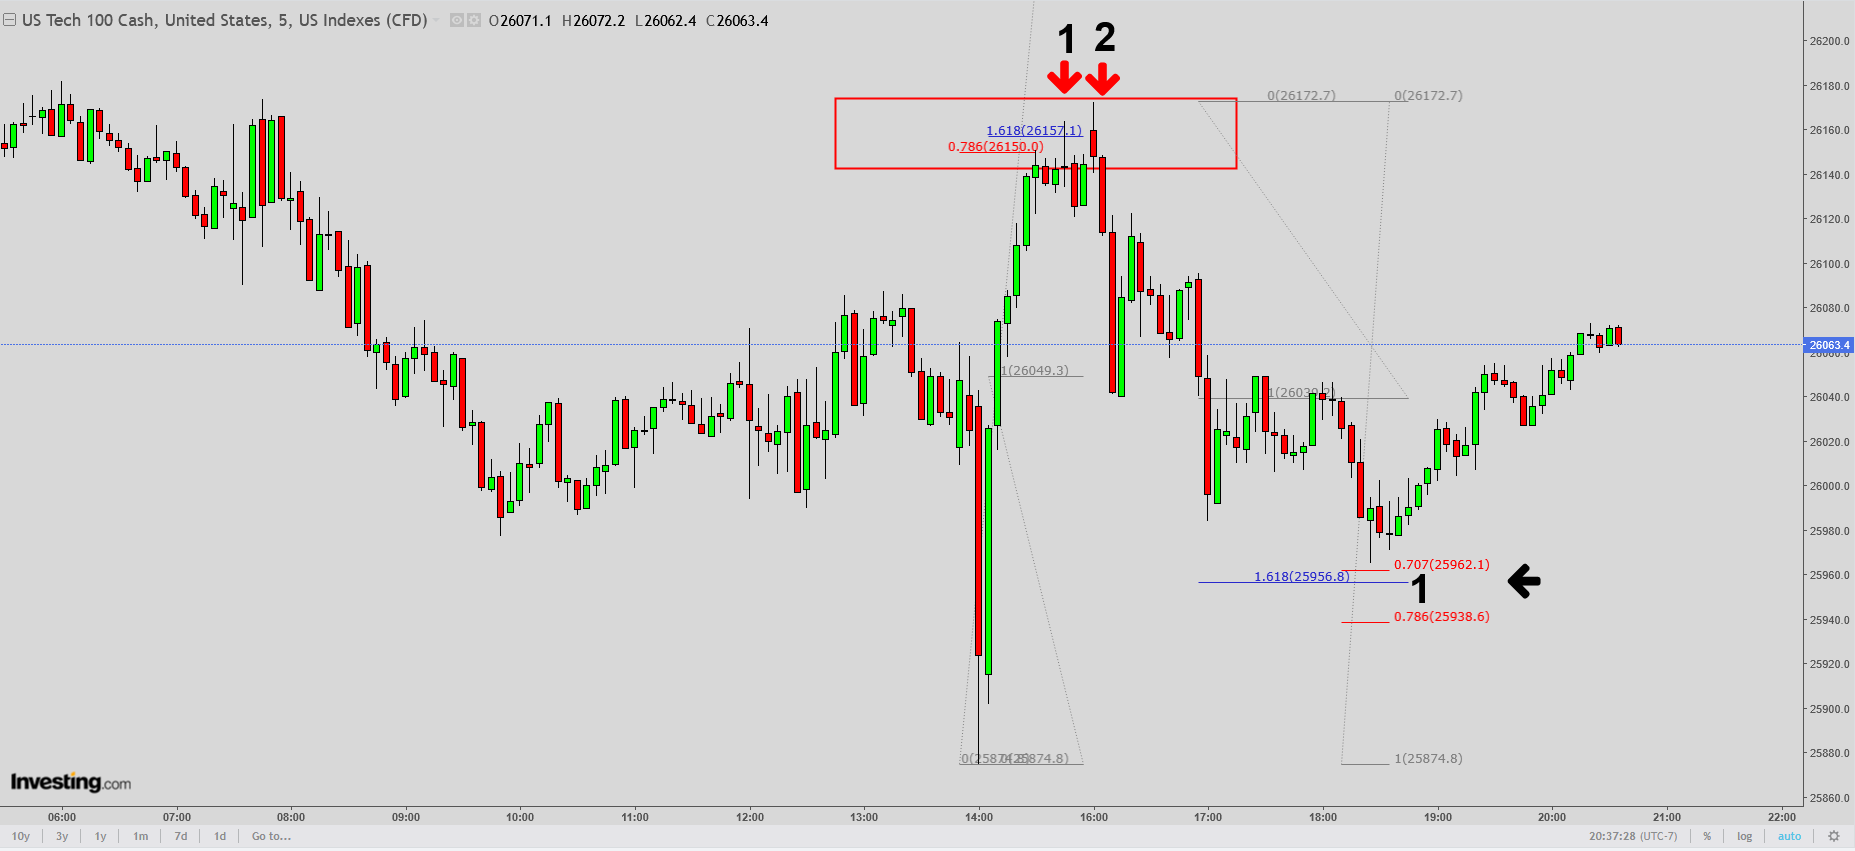
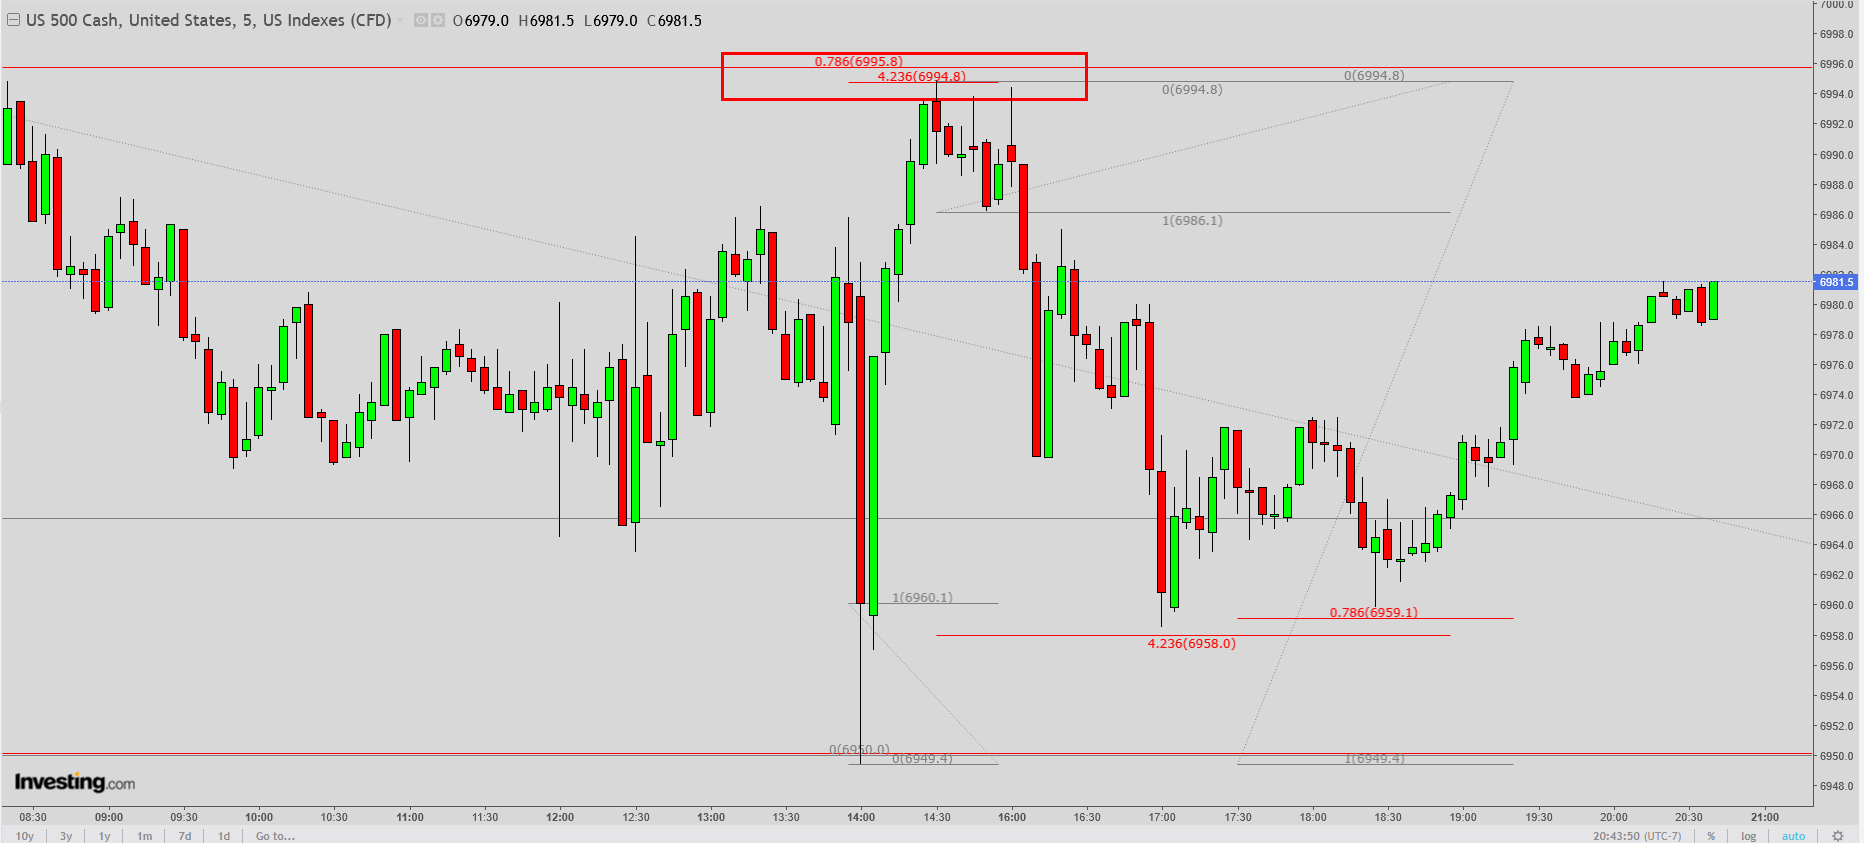
One could take another shot at a short ES at this level :
In my humble opinion, all major indexes will close ATH Friday
https://tradingeconomics.com/united-states/stock-market
1. The top red line was the low on Friday and the top of the Donald Trump chaos gap lower this evening.
The bottom red line was the low last WEEK, which was also, very close to the high tonight. It's the bottom of the Donald Trump chaos gap lower. So last weeks lows are now strong resistance. Very bearish at this place. Unfortunately, the biggest factor impacting the stock market and metals right now has the initials D.T.
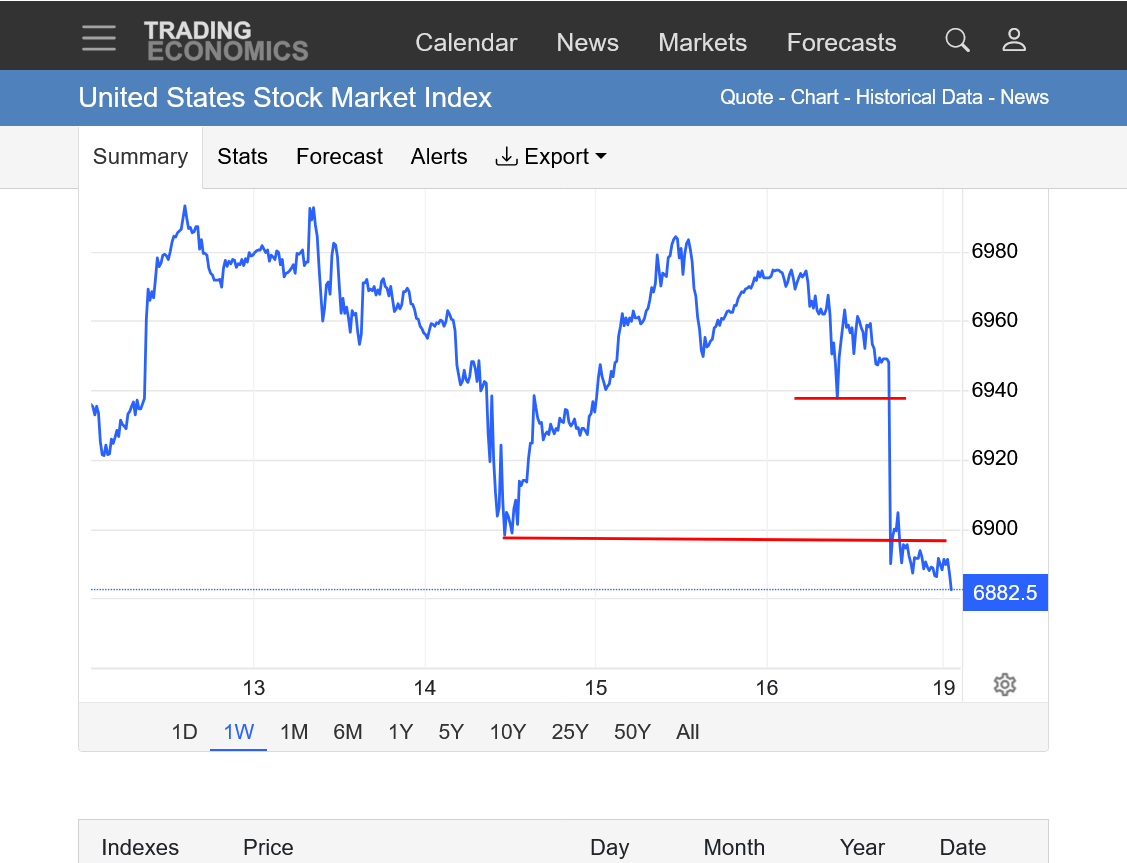
Trump stating more insane things about Greenland being about his Nobel Peace Prize snub is feeding the sell off.
https://tradingeconomics.com/united-states/stock-market
The short red lines were the Friday close and Sunday Night, Donald Trump gap lower. The longer red lines are the Friday low and last week's low.
This is a market reaction to Donald Trump news.
The downside gap from historically high prices recently is an ominous buying exhaustion formation but with the rich peoples Ponzi Scheme and law of self fulfilling prophesy controlling money flows, BAD news, when it goes away had repeatedly resulted in the return of the self fullfilling prophesy big money flows.
Previous thread:
Money flows are dumping in from rich people based on the principle of a "selffulfilling prophesy".
https://philonotes.com/2024/12/robert-k-mertons-theory-of-the-self-fulfilling-prophecy ...
Congrats on calling it, kris.
You've been short for 2 weeks, good for you!
the stock markets, now short ...
21 responses |
Started by kris - Jan. 7, 2026, 9:10 p.m.
https://www.marketforum.com/forum/topic/117057/
++++++++++++++++++++++
https://tradingeconomics.com/united-states/stock-market
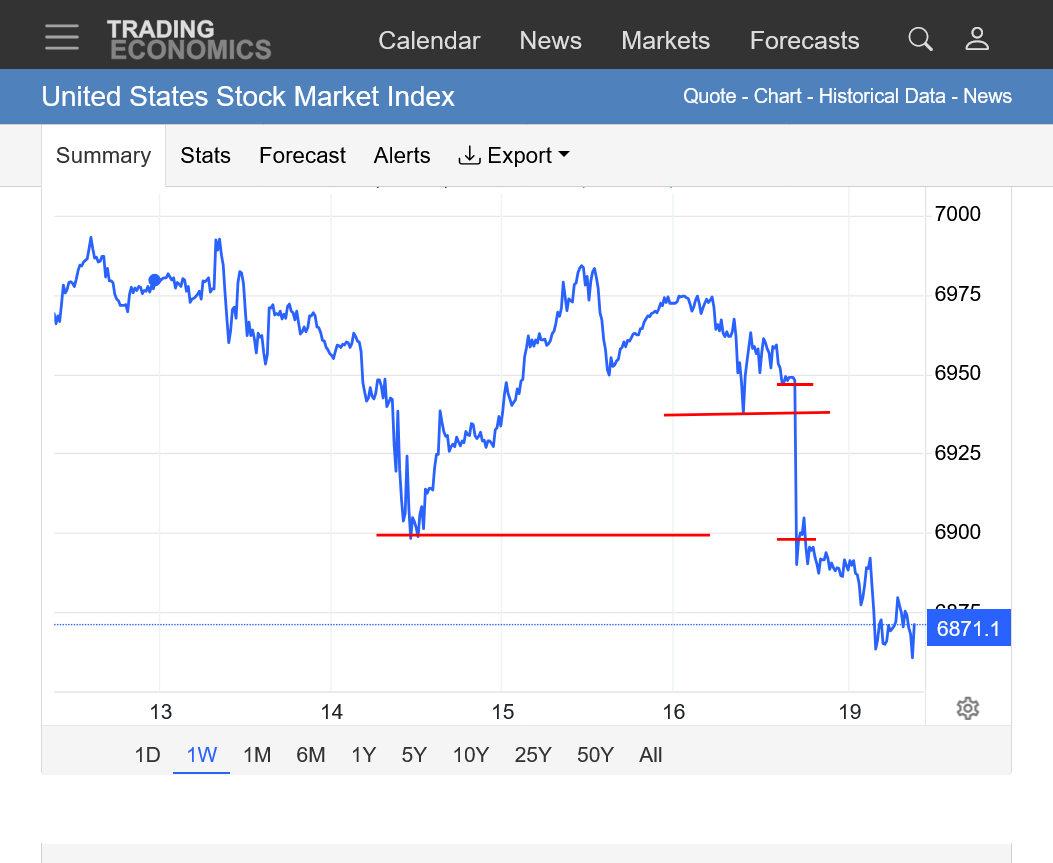
1. 1 month chart: Donald Trump Greenland chaos gap lower of the right with Friday's lows and Sunday's open/highs. Upper, long red line was last weeks low. Lower red line was January's previous low.
2. The long term trend is still up but the market has been losing momentum as previously shown. Struggling to add to gains(have follow thru) when making new highs. Continuing to trade BELOW previous record highs after making new record highs.
Regardless, just a reminder that we've not violated any longer term uptrend channels. This could be just another bull flag/wedge.
joj,
You were just a tad early. However, nobody can predict what Donald Trump will do and when he might do it.
What's interesting is that Donald Trump pays close attention to the stock market and this has the best chance of causing him to come to his senses on the impossible Greenland position.
So the 2 most likely scenarios are tied to Donald Trump's actions.
1. Donald Trump continues with his unhinged Greenland position, the market will be held down.
2. Donald Trump adjusts his position(to be less confrontational about Greenland) so he doesn't hurt the rich people in the stock market and caves............then we soar back higher and this might look like another bull flag. However, I think the big money knows that the next chaotic Donald Trump decision is right around the corner and this is part of why the stock market has been losing buying momentum from the big traders willing to buy new highs.
This assessment is based purely on market fundamentals and the most important factor impacting the stock market at this exact point in time.
0 to do with my personal opinion of Donald Trump. Please go to the NTR forum to get a boat load of that at countless threads.
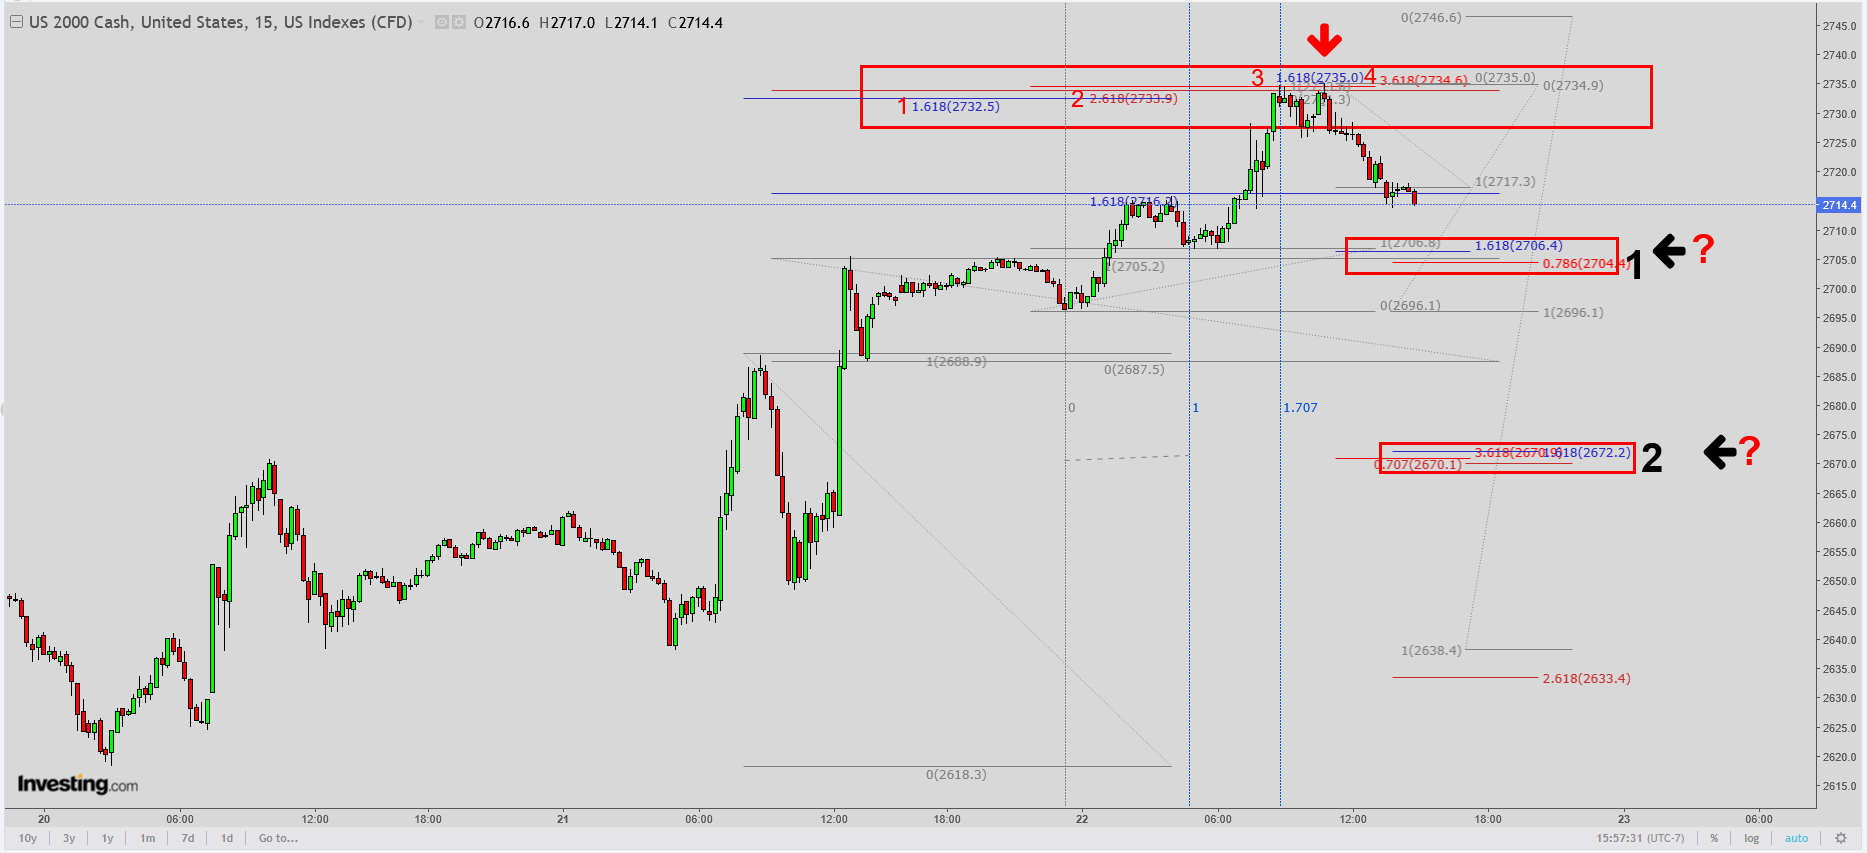
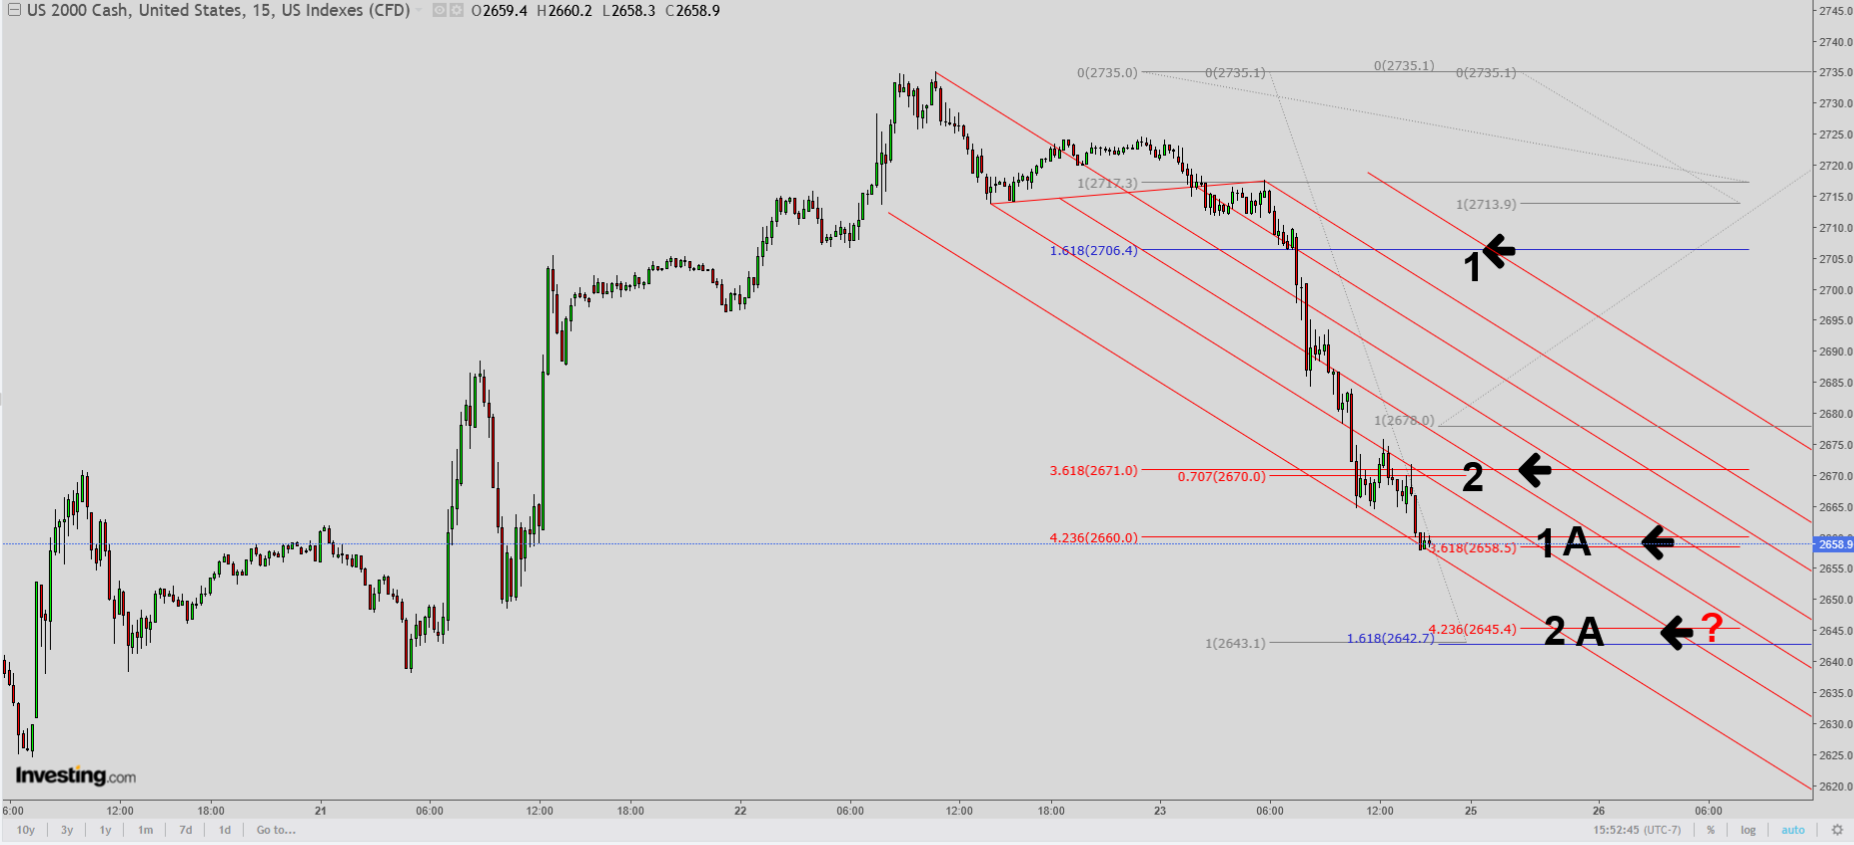
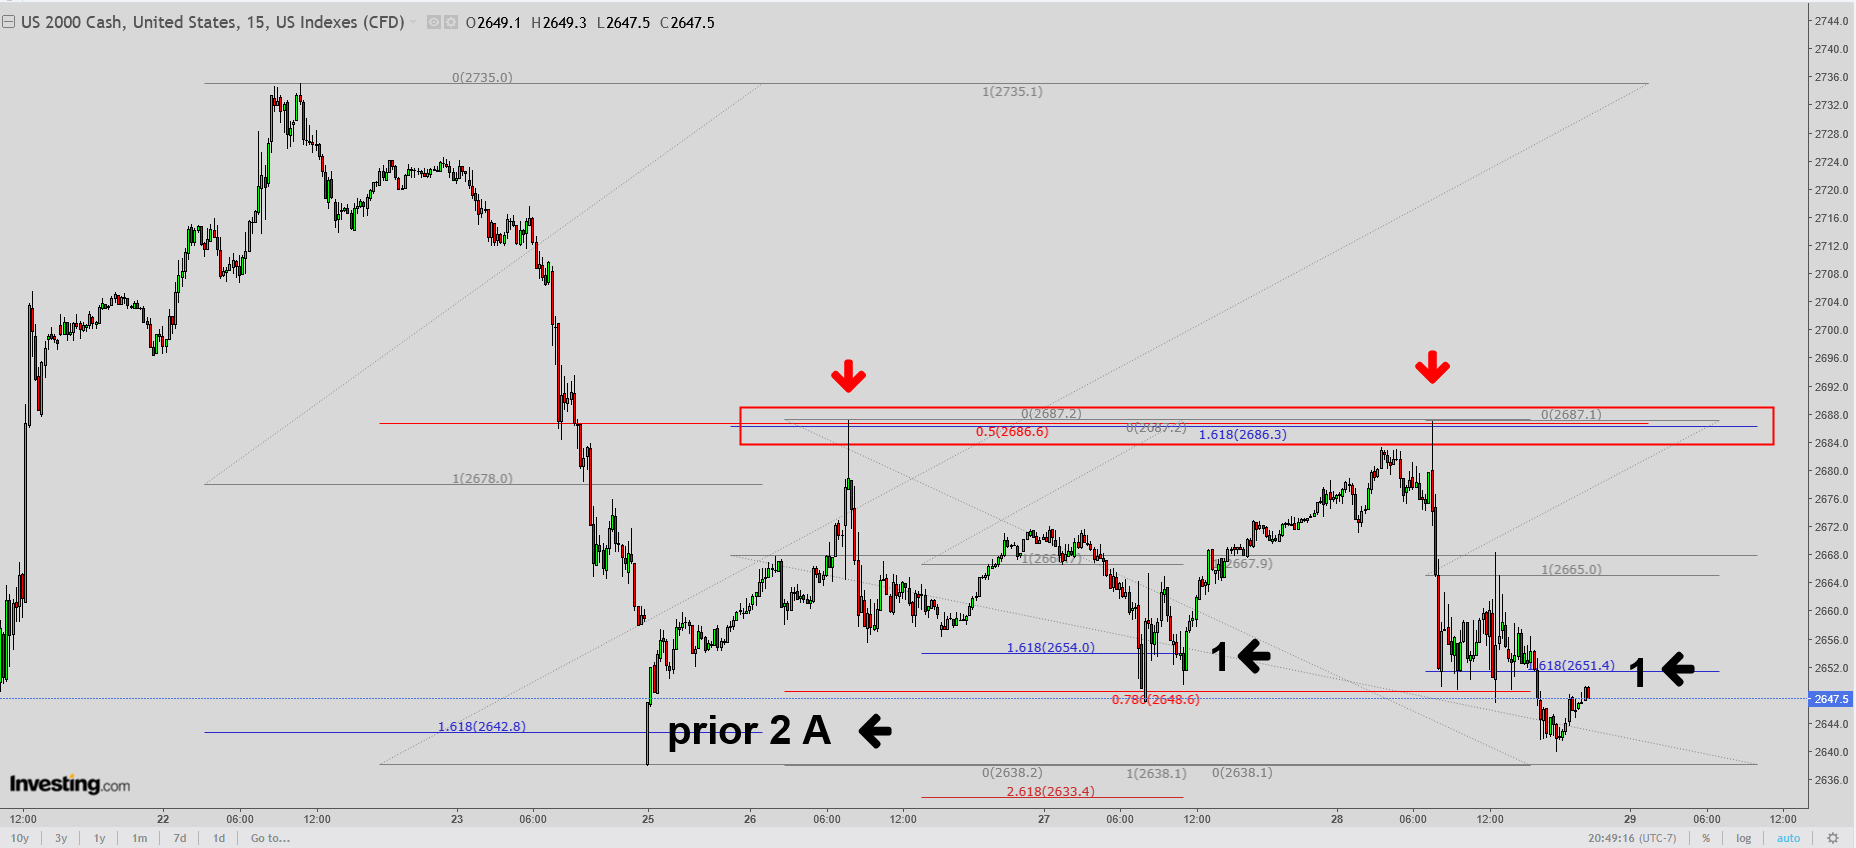
The Russell 2000 was the last of the 4 majors to put in a new high (last Friday)
The below chart (current) shows the possibility for a short
Can't rule out going for a double top either (top right hand corner 1.618 extension)
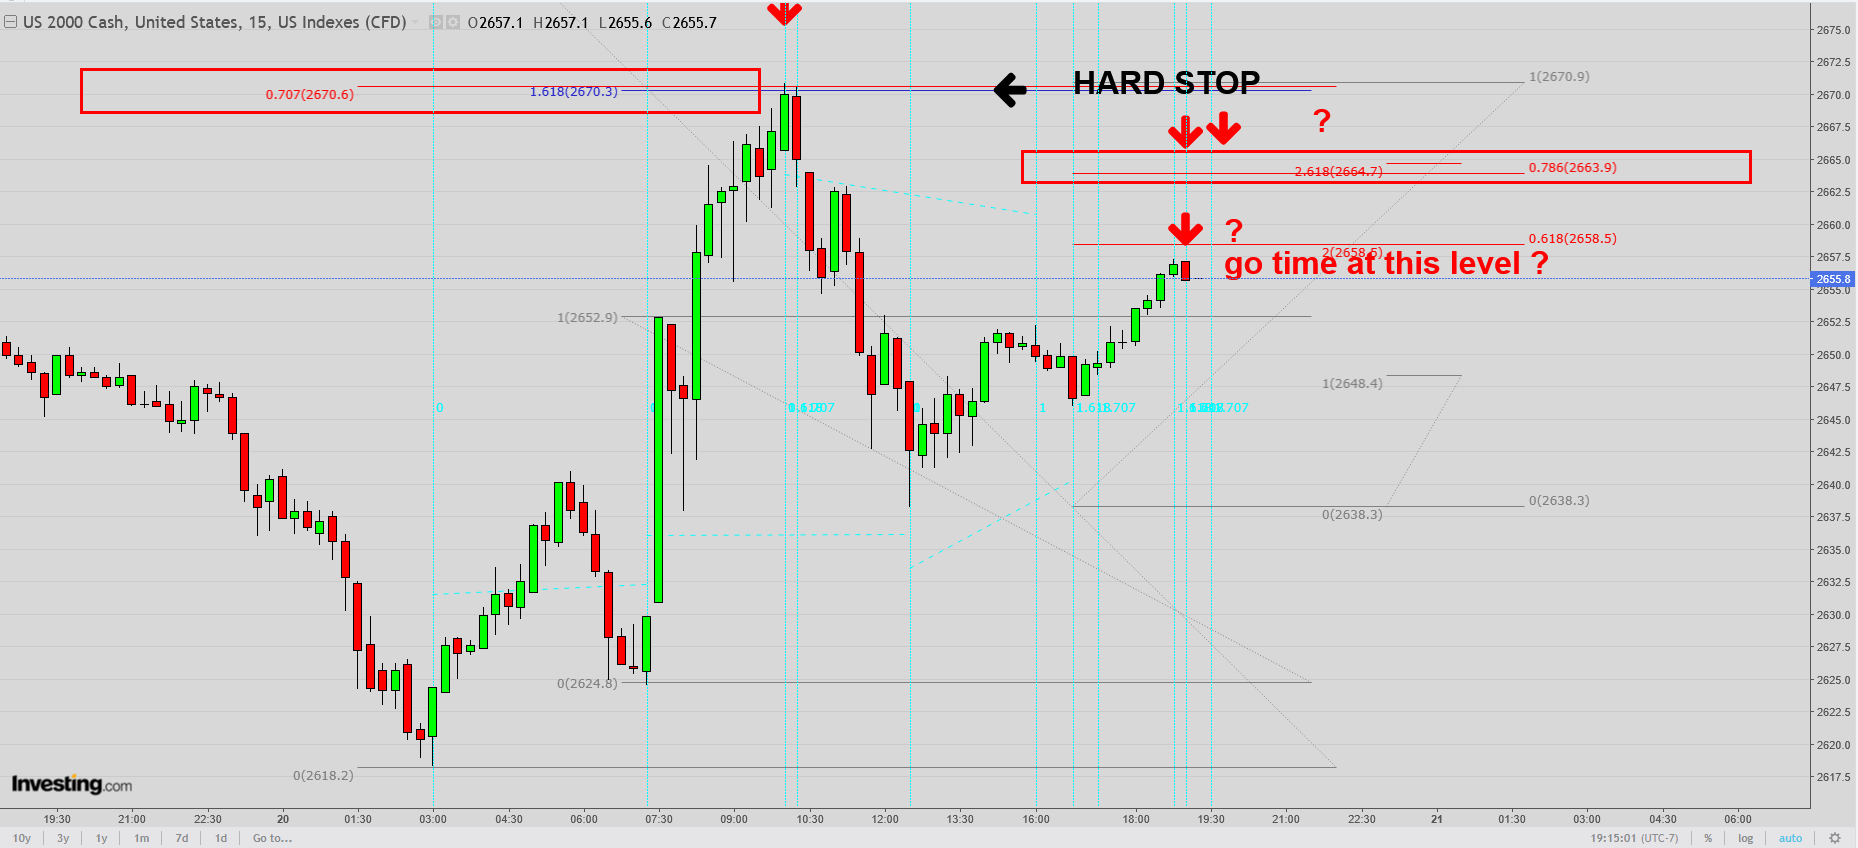
that's why : HARD STOP
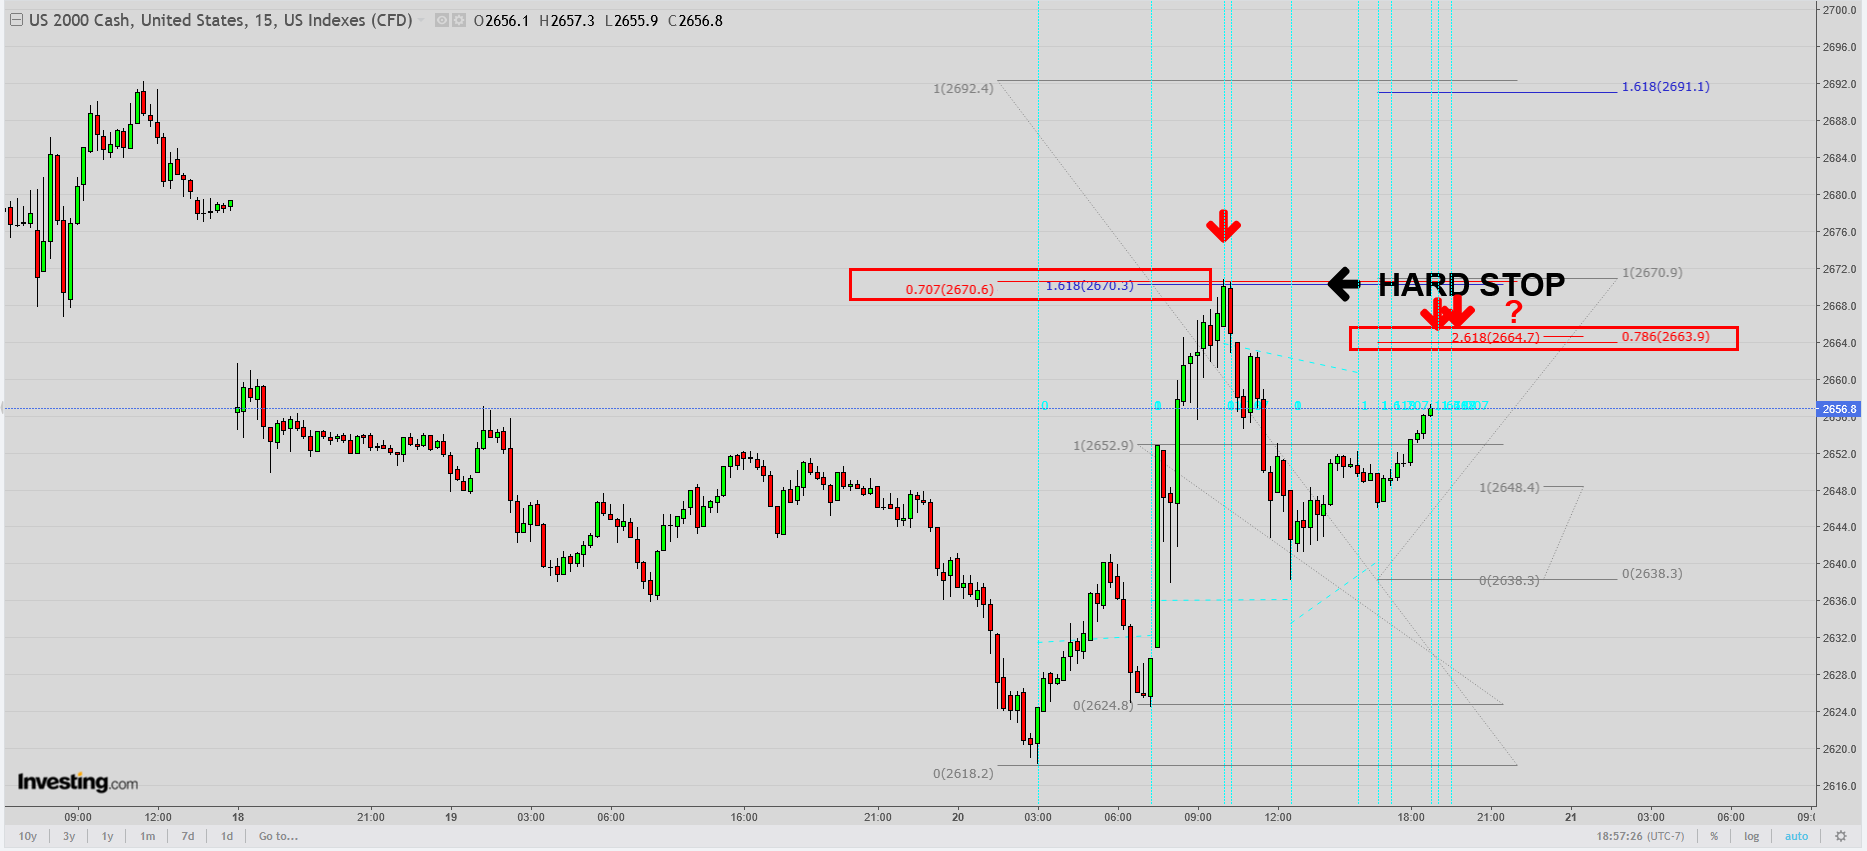
Hard stop now at this level ...
Thanks for the wonderful analysis, kris!
On my previous comment above:
"What's interesting is that Donald Trump pays close attention to the stock market and this has the best chance of causing him to come to his senses on the impossible Greenland position."
So the 2 most likely scenarios are tied to Donald Trump's actions.
2. Donald Trump adjusts his position(to be less confrontational about Greenland) so he doesn't hurt the rich people in the stock market and caves............then we soar back higher"
+++++++++++++++++++++++++++++++
The news today from the link below: "US stocks were higher on Wednesday, trimming the sharp loss from the previous session as markets reassessed their pivots away from US assets following fresh remarks from President Trump in the World Economic Forum. The S&P 500, the Dow, and the Nasdaq 100 were nearly 1% higher. Trump stated the US would not use force in its mission to get Greenland, triggering some respite for US equities and sovereign bonds"
https://tradingeconomics.com/united-states/stock-market
Back above the previous January Low/red line.
++++++++++++++++++
But here's the thing this time. THIS time is different. Donald Trump's progressive dementia and positive reinforcements/enabling from Congress, MAGA, Fox News and others have encouraged him to get away with more and more but THIS time, he went way too far. There is no hiding it now. The entire world just got a very close look into the mind of a deranged, Megalomaniac that is obsessed with conquest. That includes the rich and powerful people in the stock market who can't possibly have confidence in him anymore. They must also be dialing in the very high chances that Donald Trump will be removed from office before the end of his term.
That is my MARKET assessment based on what the people who control money flows see.
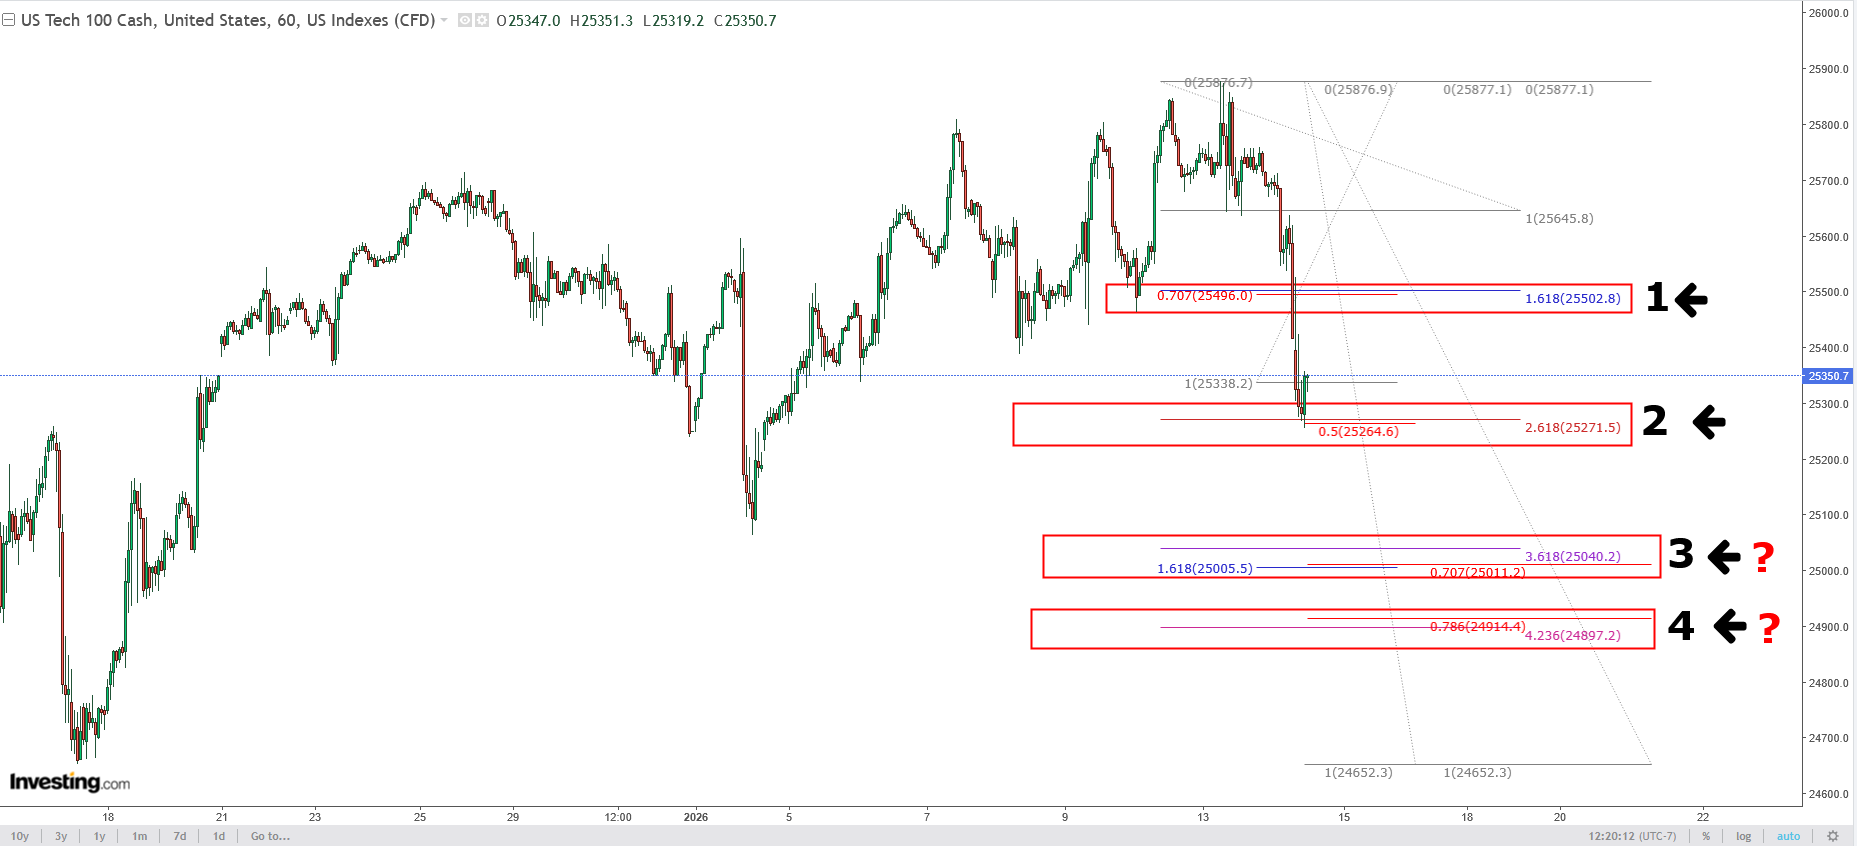
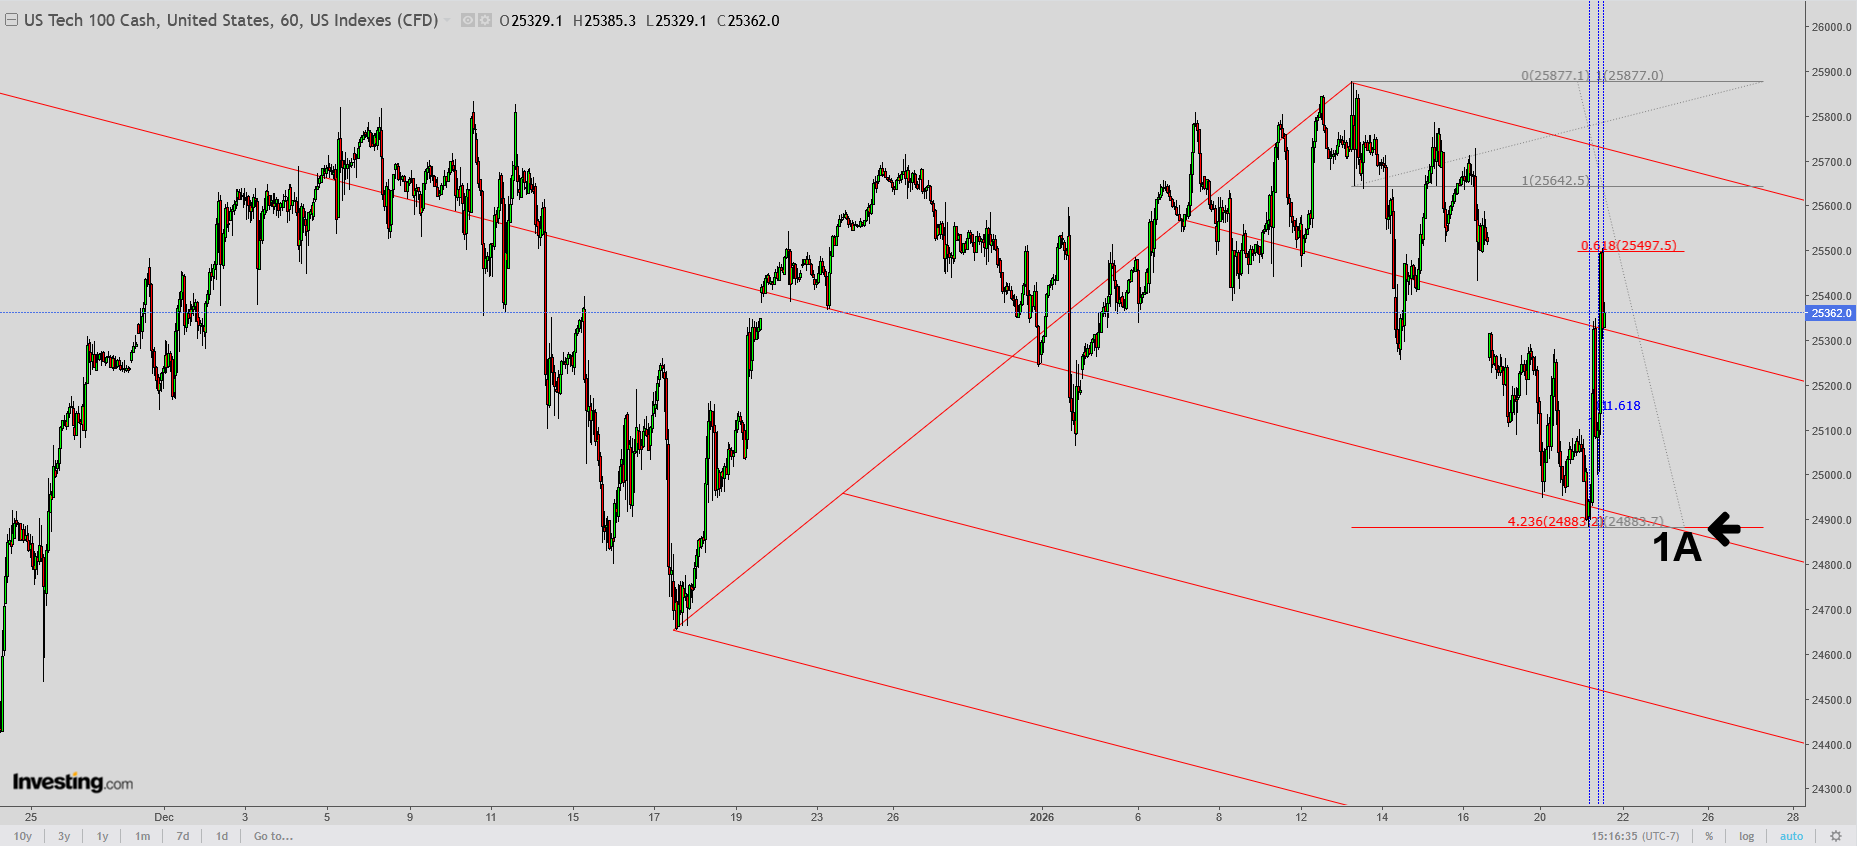
NQ A1 was achieved over night, gap fill was achieved during the day session, wait and see mode ...
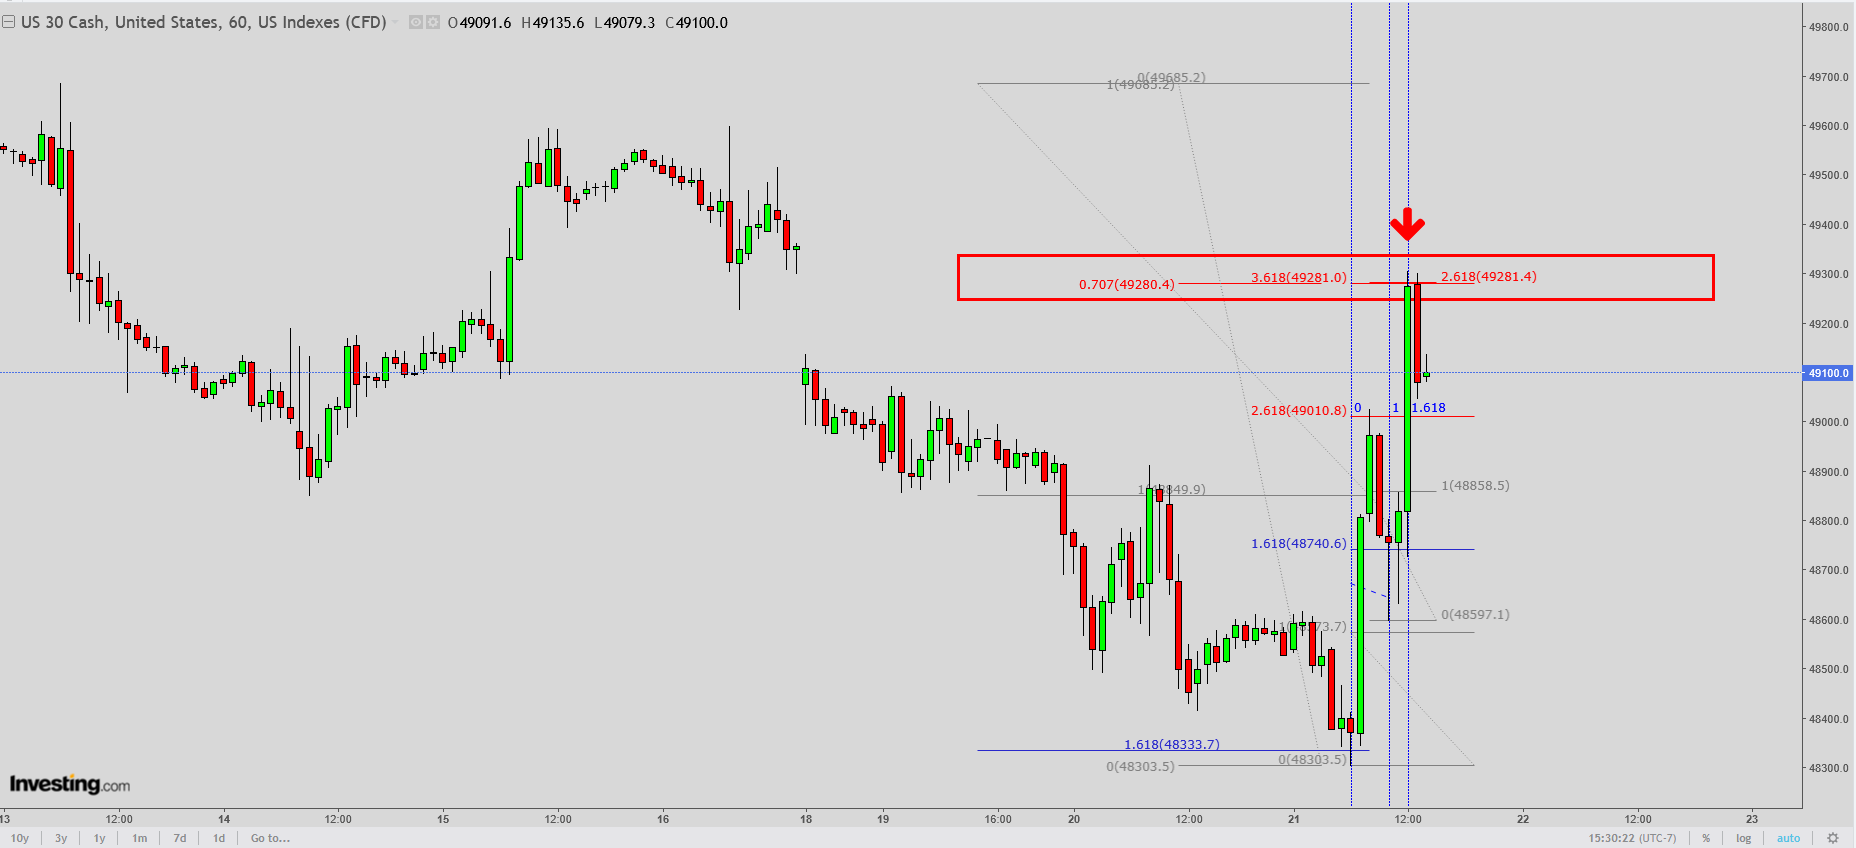
Dow at a critical juncture here as well, worth a short ...
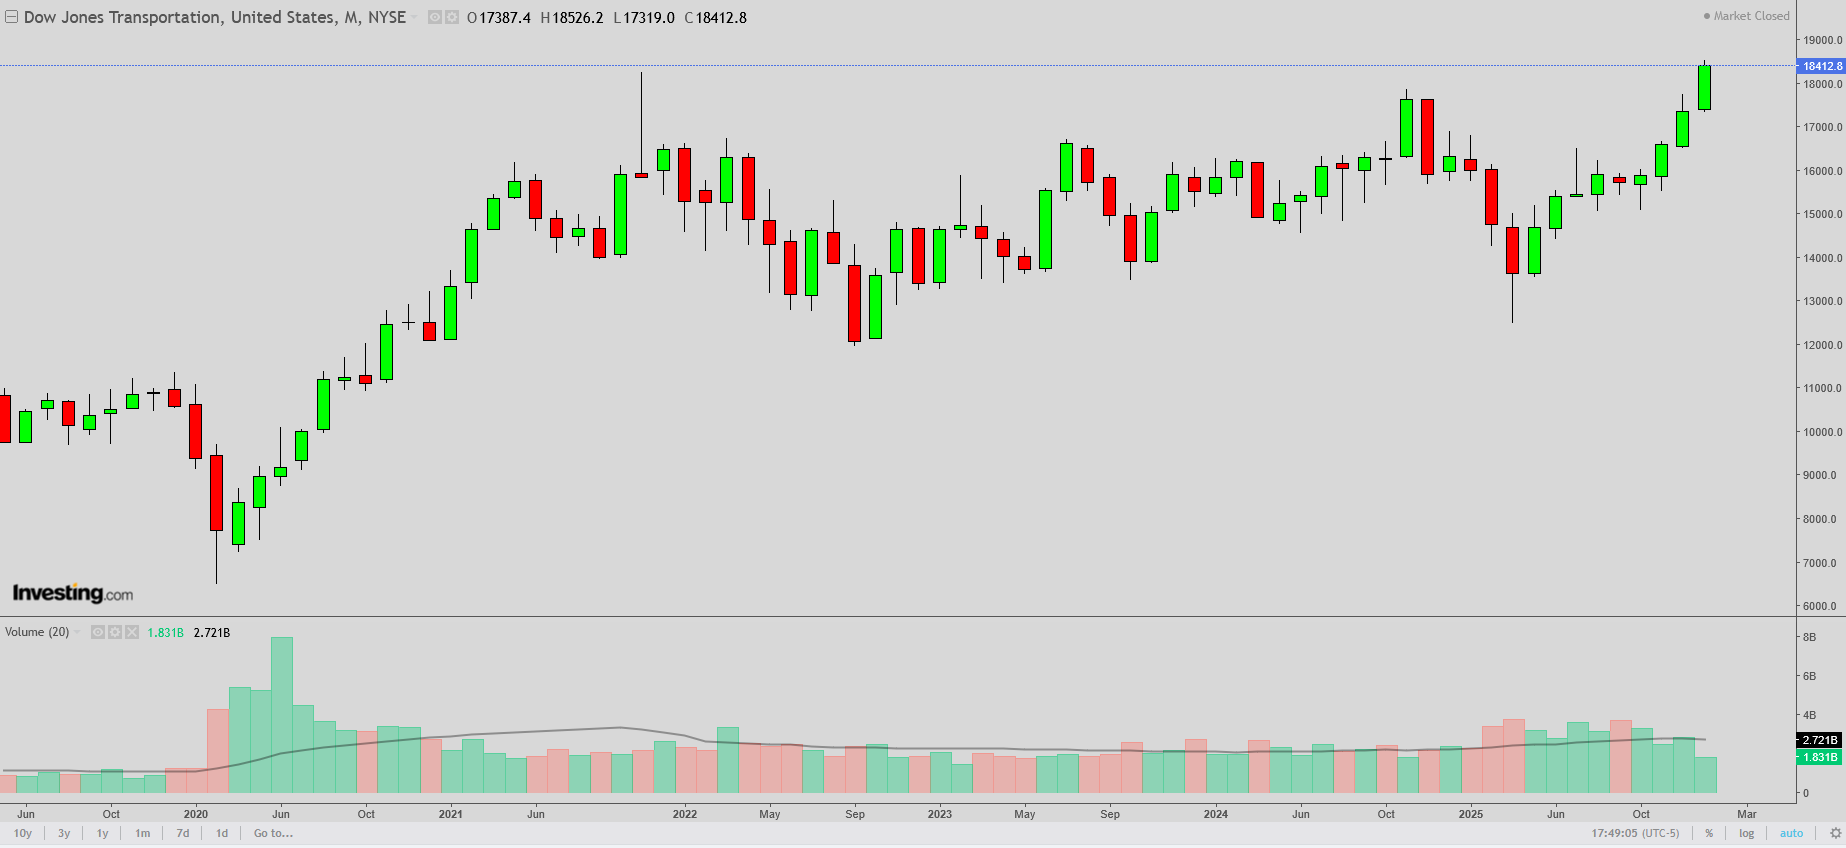
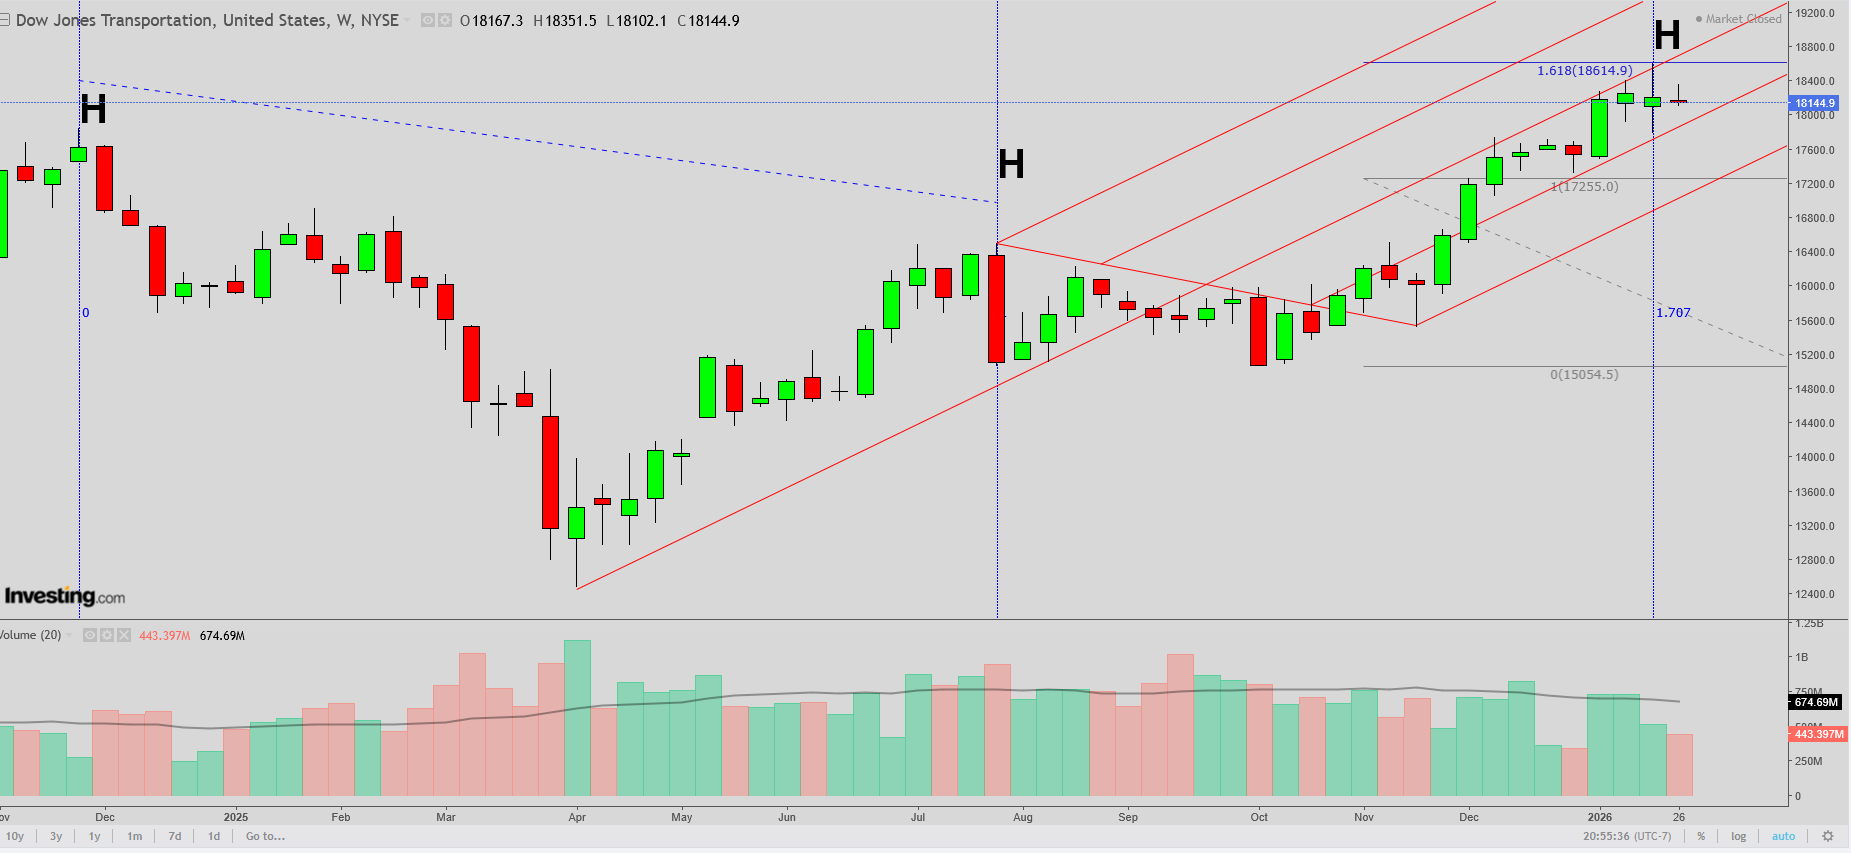
Dow Jones Transports monthly chart: new highs, still leading all majors, generally a good sign for the economy
Wonderful observations, kris!
https://tradingeconomics.com/united-states/stock-market
Top red lines: Friday's close and Sunday's open= Greenland chaos gap lower from Donald Trump.
Bottom line: After the market crash from Donald Trump's Greenland insanity on Mon/Tue(his top priority is rich people and keeping the stock market higher), Donald Trump completely backed off of the Greenland insanity to boost the stock market. We have filled most of that gap and are on the highs today.
Long red line: January low. We spiked below that but Donald Trump changed his Greenland position to reverse the market higher yesterday.
Took a stab at a Russell short, many numbers coming together, wait and see ...
Thanks for generously sharing, kris!
Seems extremely uncertain right now with several powerful forces tugging in opposite directions.
The graphs below are just 1 source(Index). As you expertly noted, there are other ones telling us a different story because the current picture is mixed.
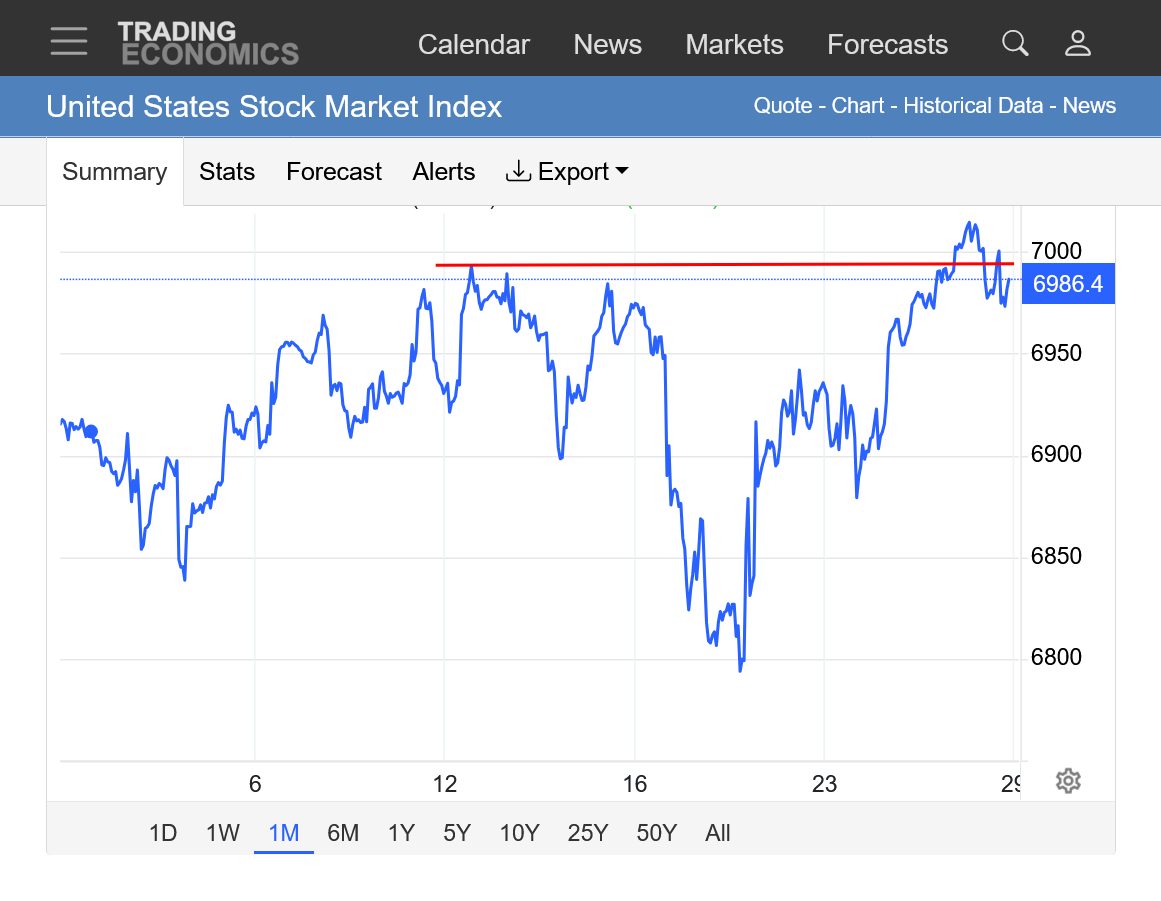
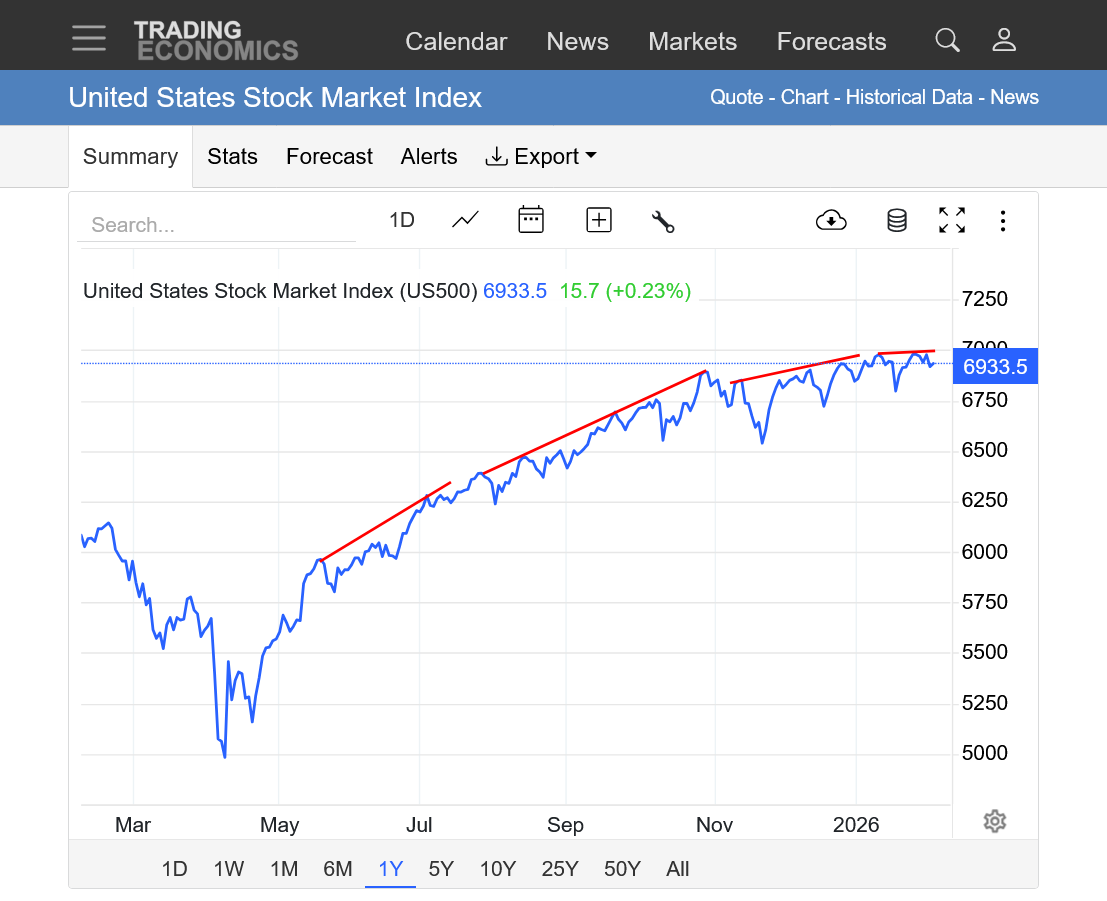
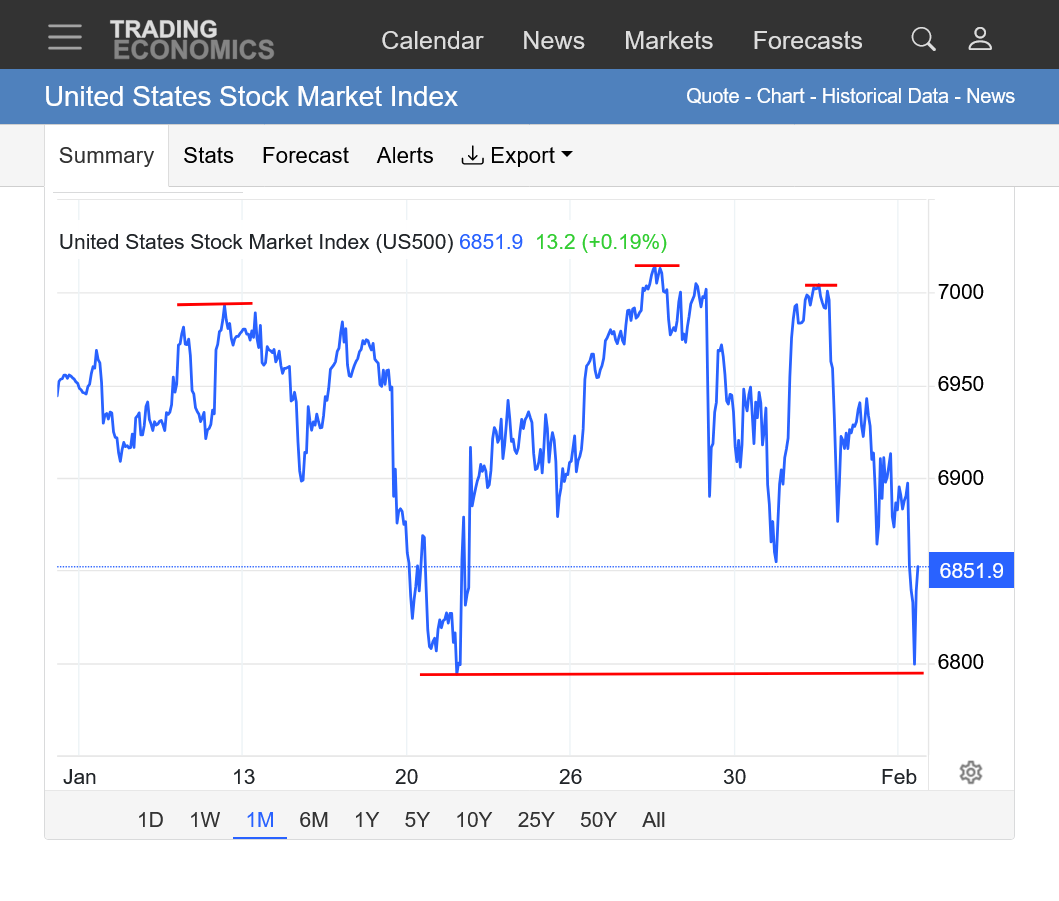
1. 1 month. We spiked thru but successfully held the January lows. Currently sitting just above mid-range for January, close to the high for this week but we haven't quite filled the gap down on Sunday Night. We really need to close above around 7000 (new highs) to look bullish again.
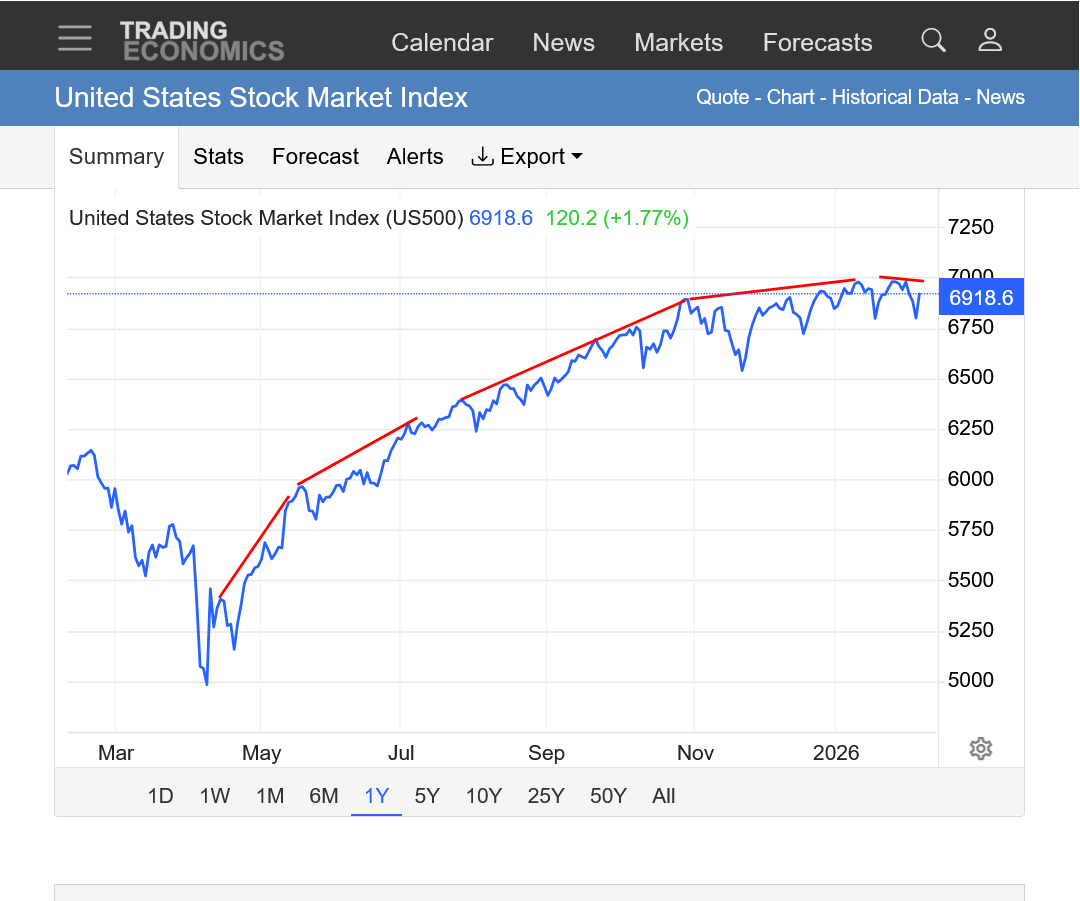
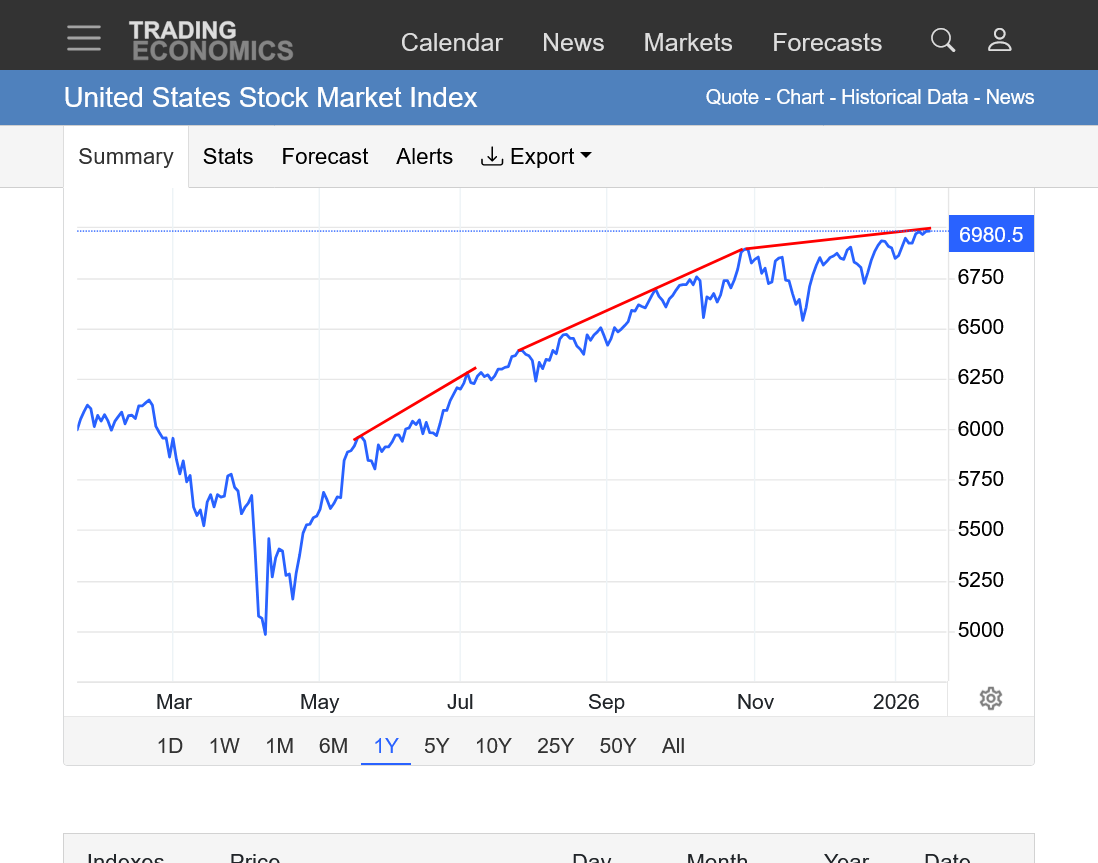
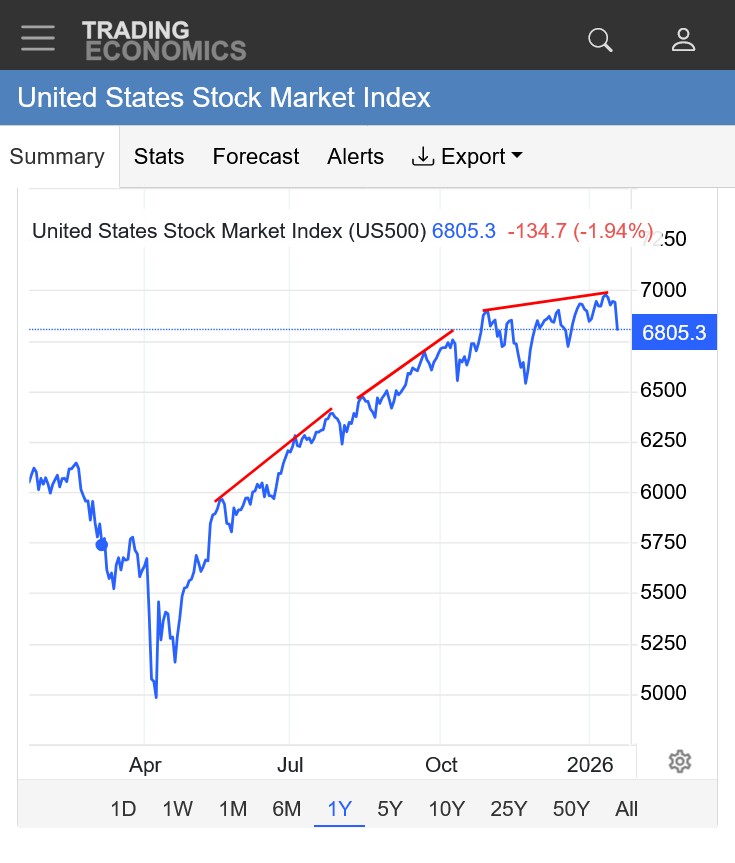
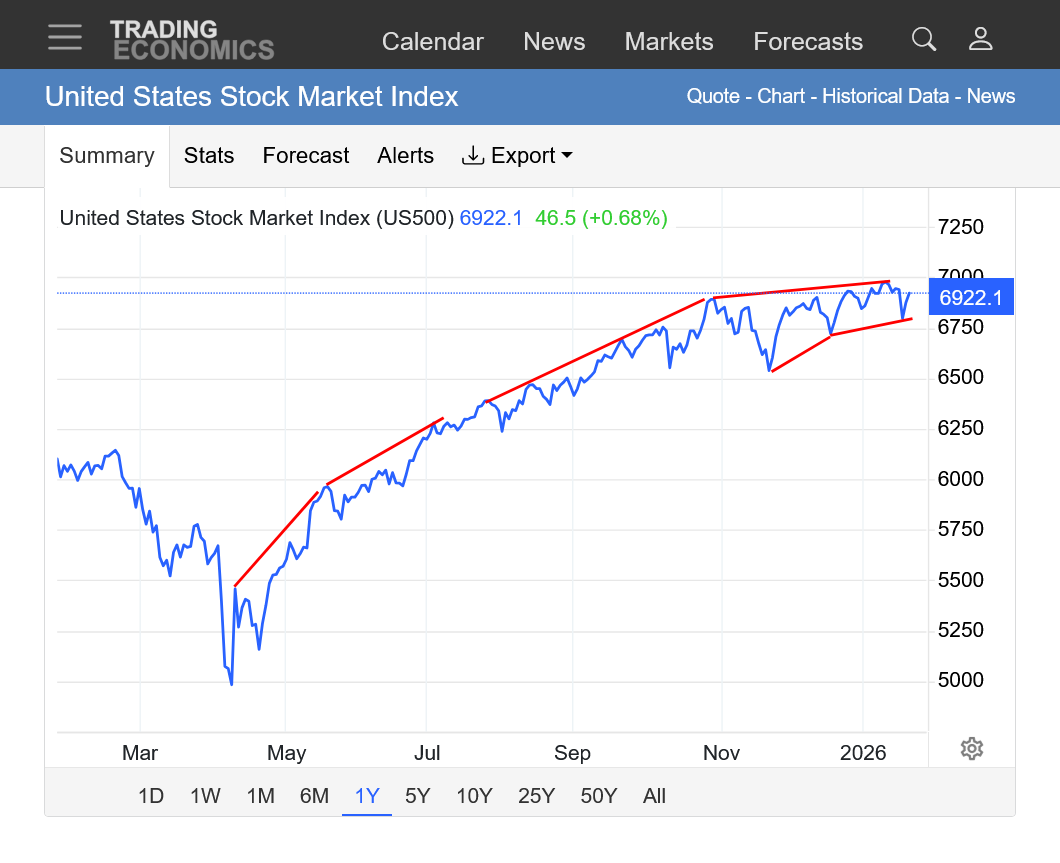
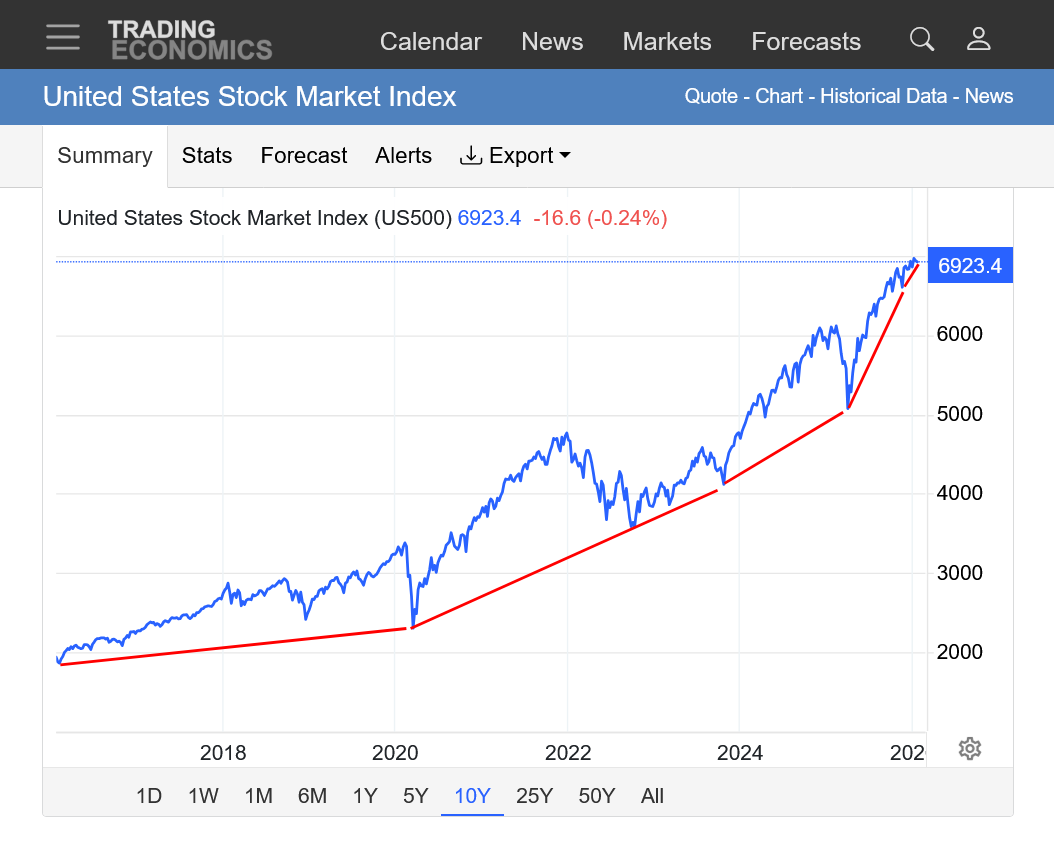
2. 1 year. ROUNDING TOP formation is still valid. The slope of the uptrend has been flattening as we lose momentum and struggle more and more to find follow thru buying ever time we make new highs. Despite that, HIGHER lows still barely maintain the bullish trend case.
3. 10 years. Still a very strong uptrend that had been steepening but is starting to lose momentum. The previous parabolic type move with a steepening uptrend is morphing to a decelerating/flattening slope.
Price charts only tell us what has been happening. Chart patterns are great for telling us what Wyckoff's "Composite Man" is and has been thinking/acting and have the greatest predictive power in markets/a world that doesn't have huge surprises changes. (the trend is your friend, for instance)
They are just 1 of countless tools that a trader can use to capitalize on price moves before they happen based on numerous indicators/tools predicting the same direction of price movement.
kris actually trades the stock market. I just have fun analyzing it and trade only weather markets(energy/crops).
There can be a big difference in a person's mentality when they have skin in the game!
https://tradingeconomics.com/united-states/stock-market
The stock market has stalled out a tad under the top of the Sunday evening gap, so the gap is still not filled on the index that I use here. Not because it’s the best but it’s free for others to access too.
No doubt other indices have closed the gap, depending on what part of the economy they represent, as kris has shown With the Dow Jones Transports Which is the most bullish!
Traders might remember last weekend’s surprise and are trying to minimize exposure and for sure there’s incredible uncertainty.
The Russell today down 2.20%; that worked out beyond expectations ...
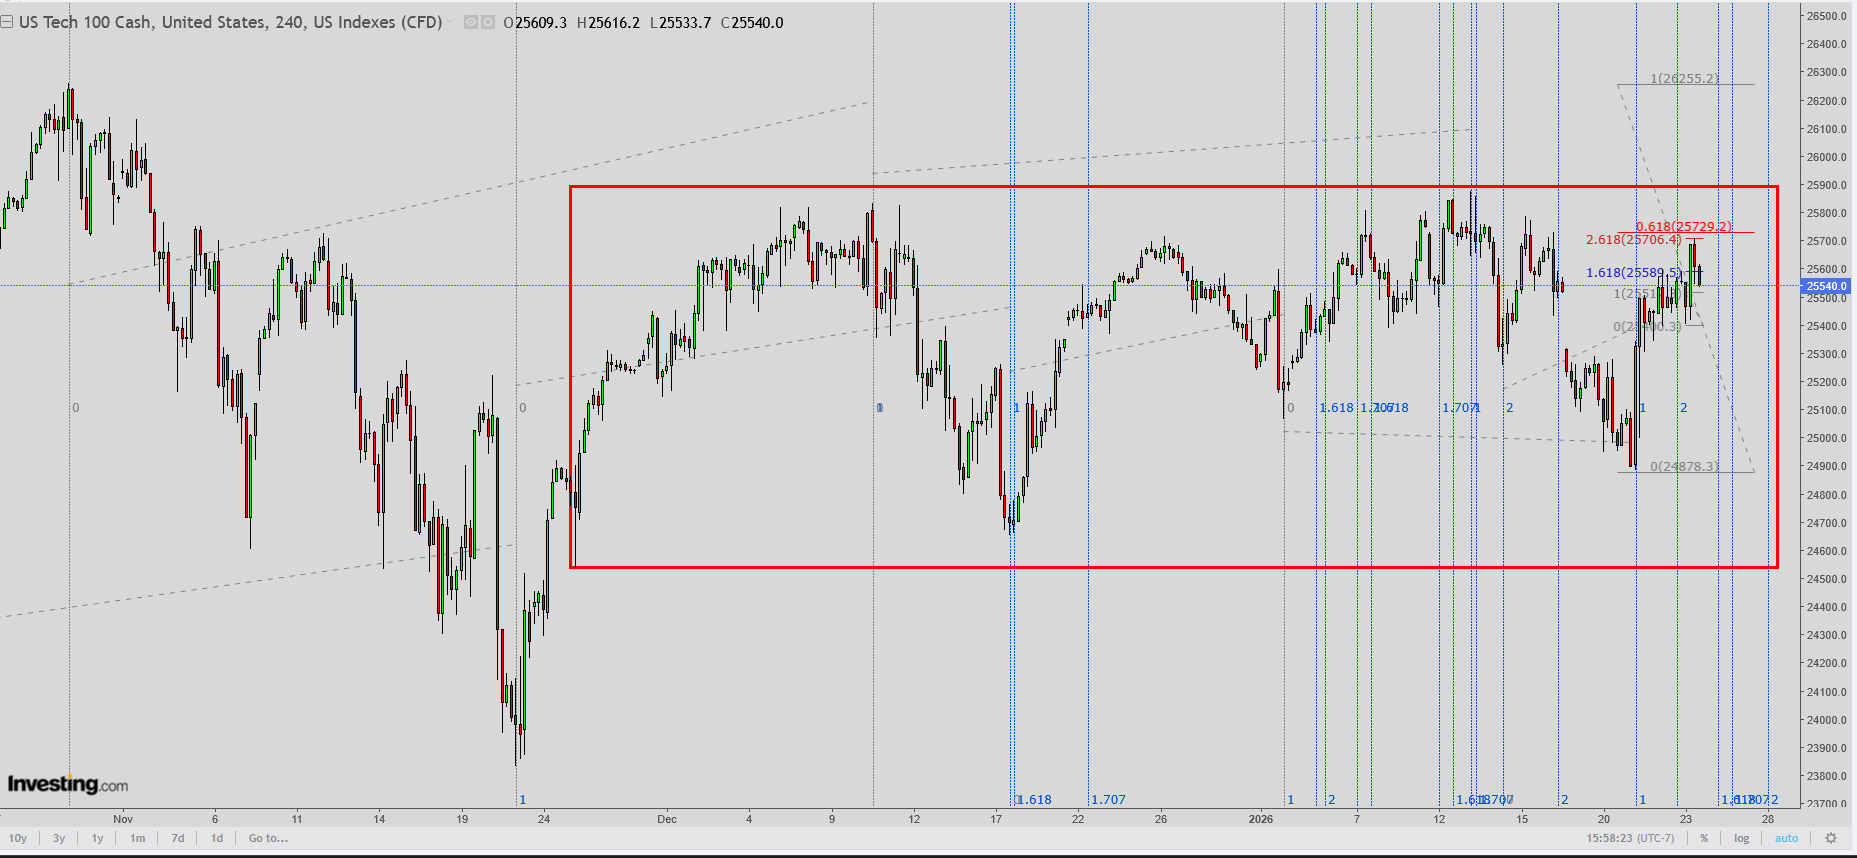
NQ 4hr chart today, since the late October high (still intact) we have been sideways for the last 8 or so weeks, we may not see a resolution either way until the first week of February, hold, wait ans see ....
Kris
GREAT chart. LOAD up your buy stops!! (Your top red line)
MetMike's favorite President just reset the chart for another justified (based upon EPS) advancement inasmuch as this past Tu/Wed was a daily '36' day cycle low on the 39th day at a half primary 9th week low! (Watch for a 3 day test of last Wednesday low, which would be Monday, sometimes 4 days thereafter, Tuesday, to BUY!)
Are not tech earnings reports due this week?
Thanks very much, tjc!
I especially appreciate your joking reference to my opinions about Donald Trump which tells me you aren't taking this personal. ..........which is how it should always be, especially amongst good friends.
Hello, MarketForum
I am a true believer in most of Mr. Trump's POLICIES, but he can irritate the absolute strongest personal believer. I personally wish he would take a day or two vacation from the media, but he never will.
The irrational "I vote only democrat" still buys gasoline and reluctantly admits he/she has more disposable income each week. Likely we all will have more $ once income tax returns are prepared and filed. I hope HE swallows his proposed tariff giveaway and instead reduces the debt. Eliminating the waste of ILLEGAL, NONCITIZENS receiving 'free' money (costs each of us tax paying CITIZENS) should also help balance the budget.
I DO reluctantly favor some type of mortgage assistance program; however, unless the supply of housing is increased, the only result will be higher prices (usually to Seniors not really needing assistance).
I DO AGREE with you---fun to disagree so long as we attempt to do so rationally
Thanks very much, tjc!
I'll leave almost all my opinions about Donald Trump to the NTR forum(Non Trading Related) that we created to minimize politics here.
I realize that you don't post there and welcome all your views here.
Also, I have mentioned Donald Trump 10 times more than anybody else here on the Trading Related forum and sometimes its unavoidable for it to not be political.
The important thing is that we continue to respect each other as is almost always the case here and that includes something that is extremely difficult in our world....respecting other's right to have opinions when we are absolutely convinced that they are wrong and find it imperative to prove it to them.
And to separate differing political opinions from friendships and human commonalities that bond all of us, regardless of party, religion, race, sexual identity/gender or country.
Gap lower but still well above last weeks highs.
Dollar Index HUGE gap lower.
Gold and Silver both had big gaps higher. On every time frame a very bullish upside break out gap higher. Filling it would represent a gap and crap buying exhaustion.
My personal feeling is that the market is dialing in the inevitability of Donald Trump being removed from office.
The trend up continues in the rich persons Ponzi Scheme and Self Fulfilling Prophesy!
Although we need a very strong move higher to negate the rounding top formation and loss of momentum.
Previous post with stock market analysis:
By metmike - Jan. 26, 2026, 4:38 p.m.
metmike: "The US Dollar has been MUCH lower than this before!"
https://www.crescat.net/the-history-of-the-us-dollar-cycles/
++++++++++++
Jan 26, 2026 at 01:23 PM EST
https://www.newsweek.com/chart-showing-us-dollar-crashing-takes-off-online-11418772
https://tradingeconomics.com/united-states/stock-market
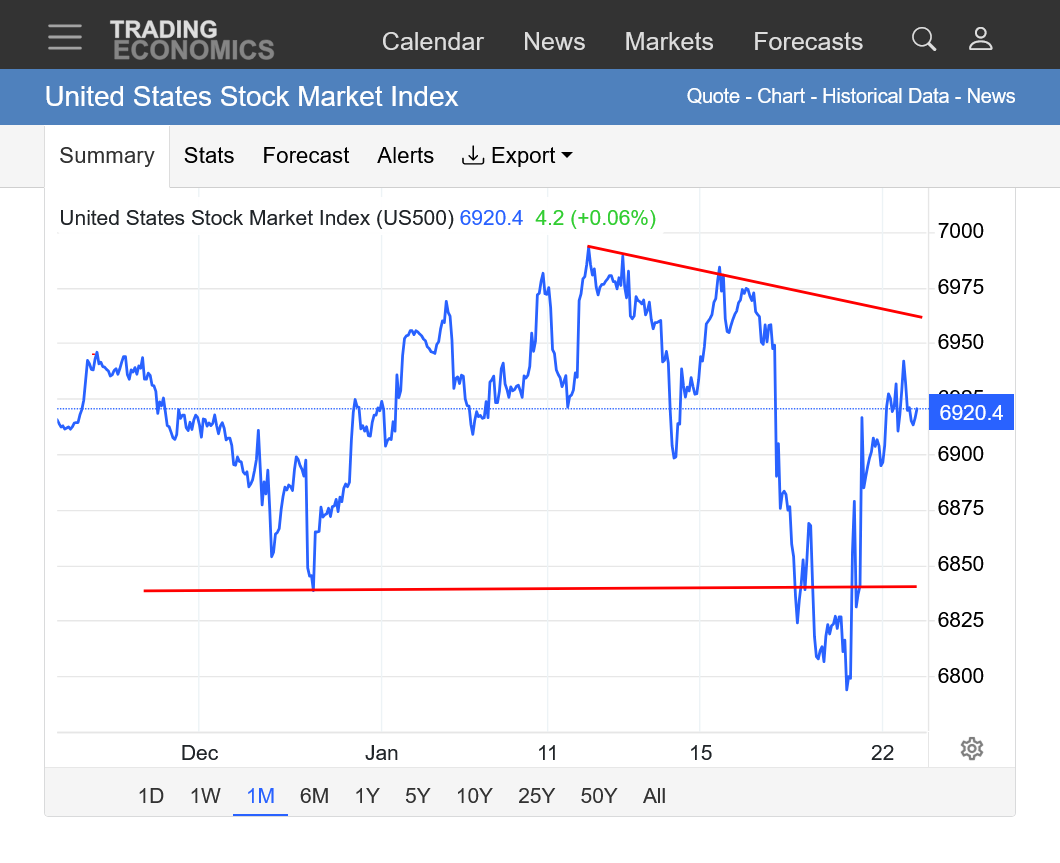
Higher lows and continuation of the trend higher. However, the slope of the new highs is flattening which is loss of momentum and a rounding top signature.
Red lines on a chart here don't tell us what the latest news will be in this extraordinarily chaotic time period in history.
Alot going on this week!
this week, attention shifts to the Federal Reserve’s policy meeting on Wednesday, where interest rates are widely expected to remain on hold at 3.50%–3.75%. The earnings calendar is equally packed: mega-cap tech reports arrive midweek, with Meta Platforms, Microsoft and Tesla on Wednesday, followed by Apple and Amazon on Thursday.
Investors will also hear from major defense contractors, credit-card giants Mastercard, Visa and American Express, and energy heavyweights Exxon Mobil and Chevron.
Thanks very much, cutworm!
https://www.fool.com/investing/2026/01/28/this-signal-just-flashed-for-1st-time-in-8-years/
By tjc - Jan. 27, 2026, 1:10 p.m
KRIS
Breakout???
It is definitely a possibility that the breakout is for real, however: I shorted the NQ again today, see the chart below.
The last hour upthrust was powerful and if we do break above these last hour highs then we should see another substantial advance, as the saying goes: the tape will tell the tale ...
Was just short of my # 1 target so far ...
S&P also reached a critical juncture in late afternoon trading ...
Meanwhile the Russell keeps laying "golden eggs" .......................
Thank you, kris.
https://tradingeconomics.com/united-states/stock-market
Once again, the market made new highs but couldn't get much follow thru. Loss of momentum and struggling. We're also getting buying at higher lows. The long term trend is still UP.
Keeping a close eye on the transports, this is a weekly chart at a critical junction.
If this starts deteriorating it can spell trouble for the markets in general ...
Thanks, kris! Keep us posted, please.
Rounding top formation still valid! Loss of upside momentum.
https://tradingeconomics.com/united-states/stock-market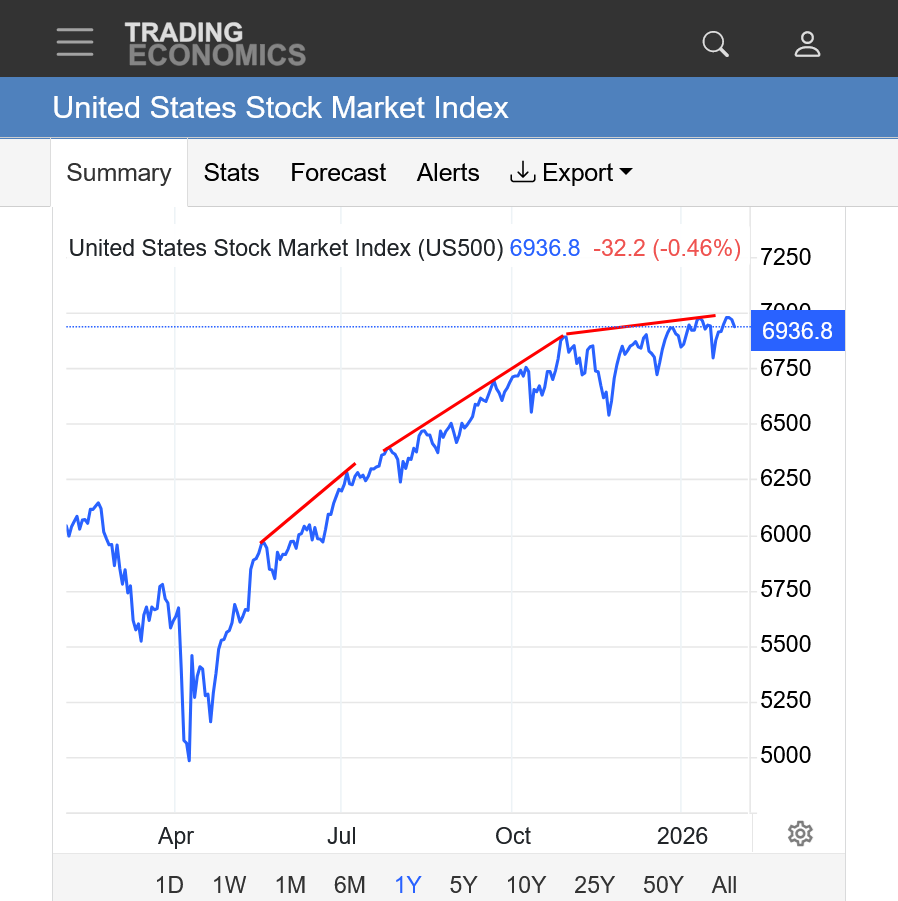
https://www.ebc.com/forex/rounding-top-pattern-explained-how-to-spot-market-reversals
https://tradingeconomics.com/united-states/stock-market
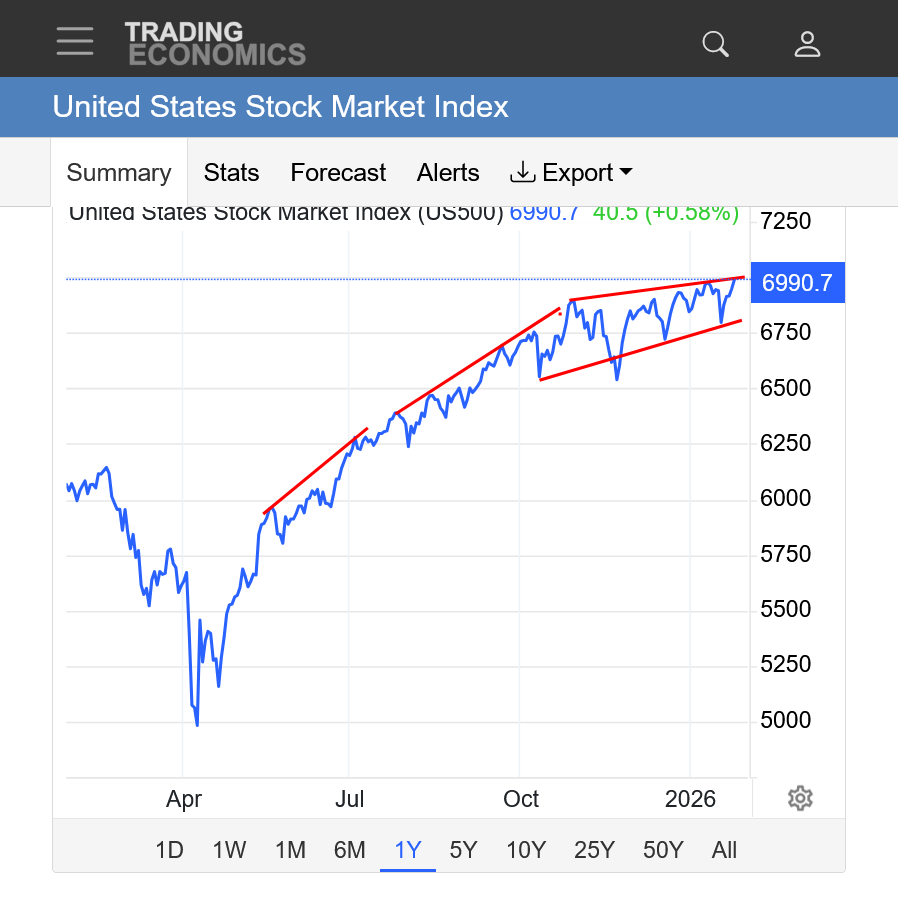
1. 1 year: Rounding top formation STILL valid from a market losing momentum and struggling more and more to see any follow thru at new highs.....but still an uptrend with higher lows.
2. 1 month: Still an up tend with higher lows but also looking like a topping pattern with the market pulling back quickly every time it's tried to get above 7000!
I put this in the wrong thread earlier by accident:
By metmike - Feb. 5, 2026, 10:01 a.m.
++++++++++
This is NOT good. The rich people's Ponzi Scheme is vulnerable.
However, the trend is still up(and we are at support) and the stock market, with its deranged interpretations to continue the self fulfilling prophesy could spin this as BULLISH because now we can get lower interest rates to stimulate the WEAK economy(which is bullish for stocks) and best for rich people.
If we come back and close higher, that's exactly what the interpretation is.
Up is down and down is up!
January worst month for job cuts since 2009
Started by metmike - Feb. 5, 2026, 9:48 a.m.
https://www.marketforum.com/forum/topic/117766/
++++++++++++
https://tradingeconomics.com/united-states/stock-market
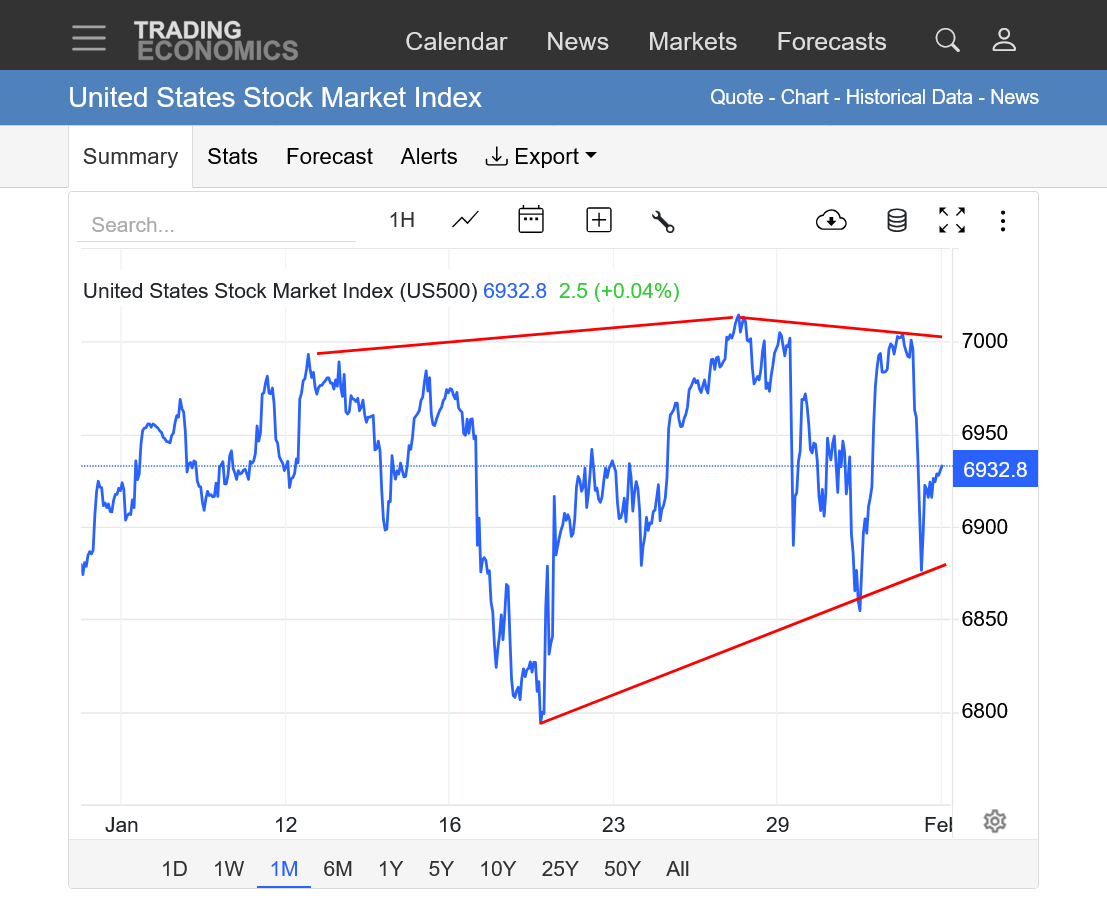
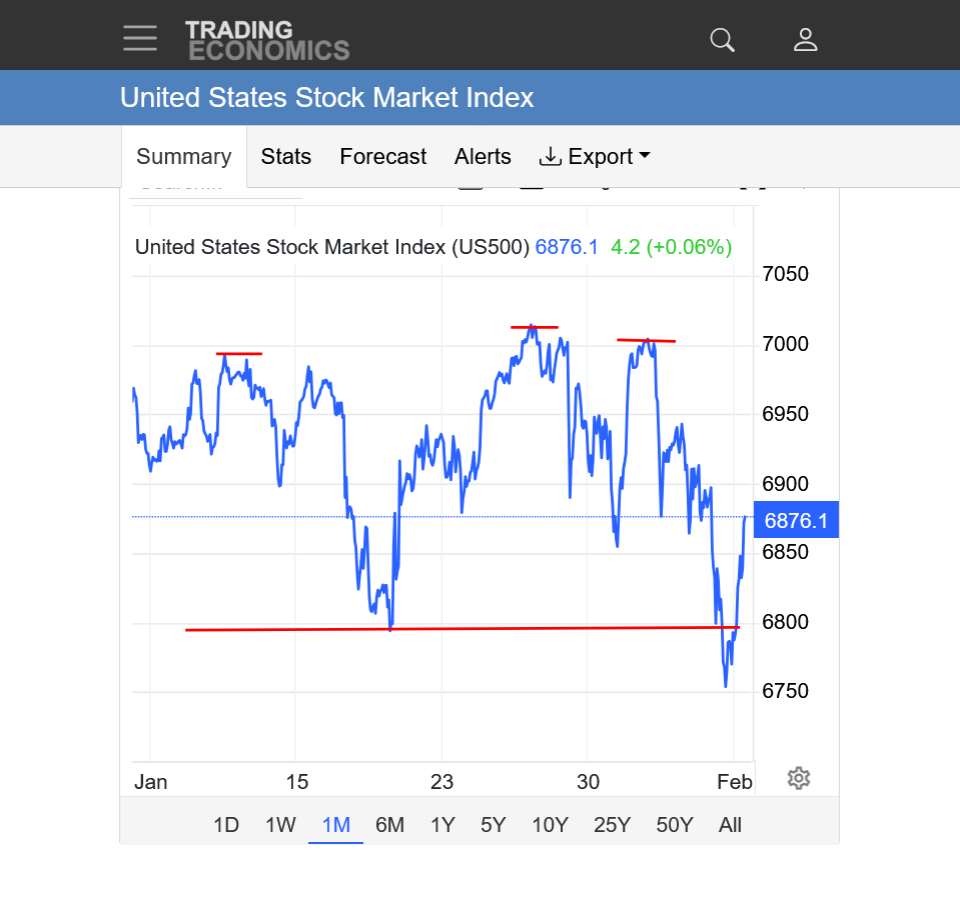
11:45am: We held support again! So far at least. The market has been losing steam. Note there is no longer any follow thru every time we make a new high.
Exciting times .... !
That's for sure, kris!
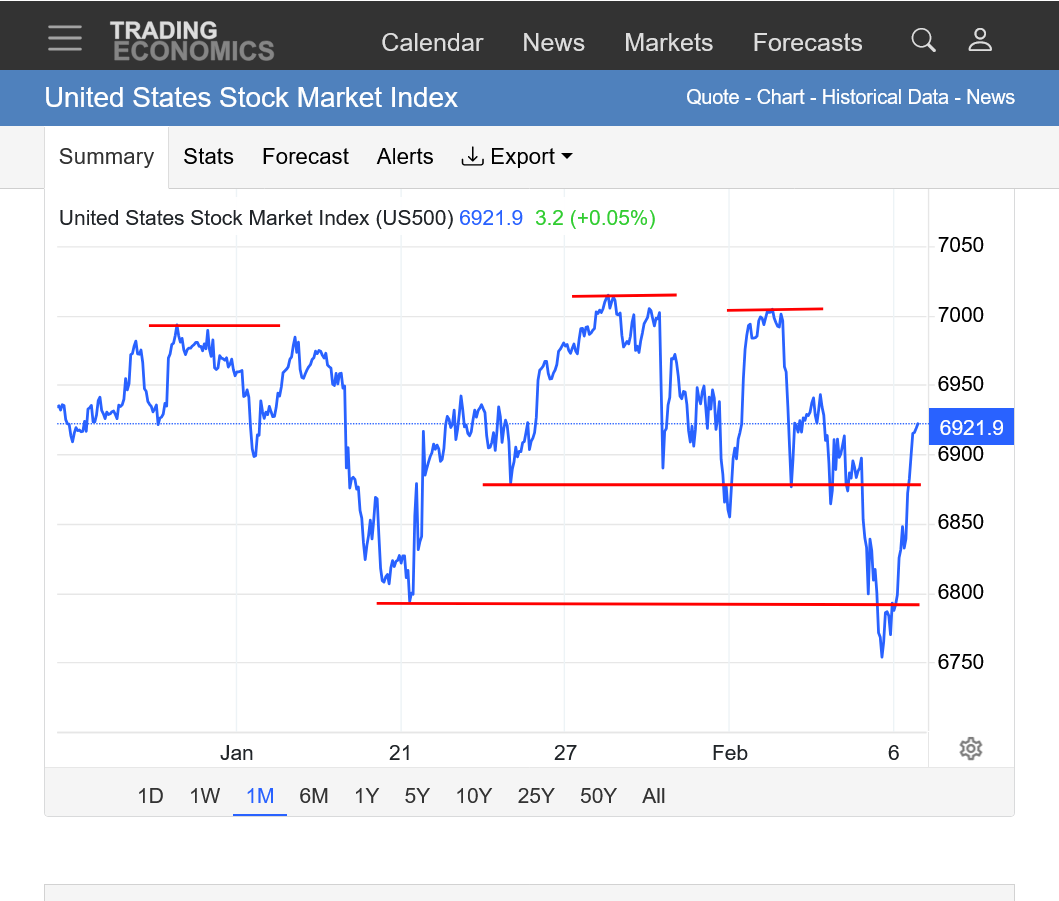
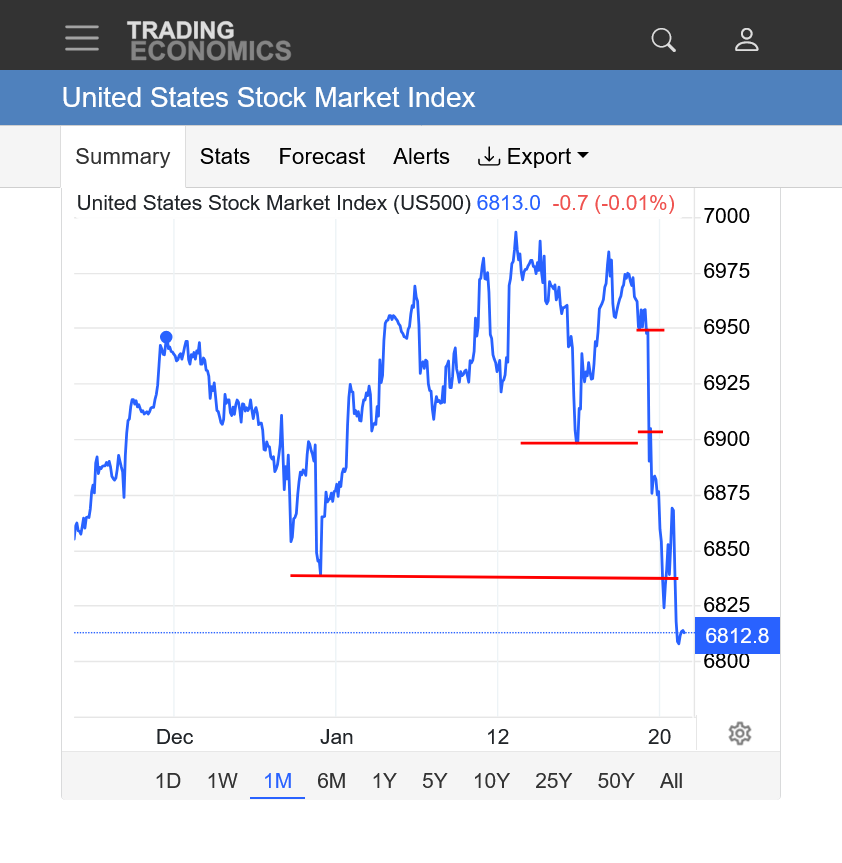
https://tradingeconomics.com/united-states/stock-market
1. Flattening slope of the new highs.
2. 1st horizontal line =2026 lows=just below that
3. 2nd horizontal line =December lows.
4. 3rd horizontal line =November lows.
VERY interesting to follow as well as the metals which I've never traded in my life!
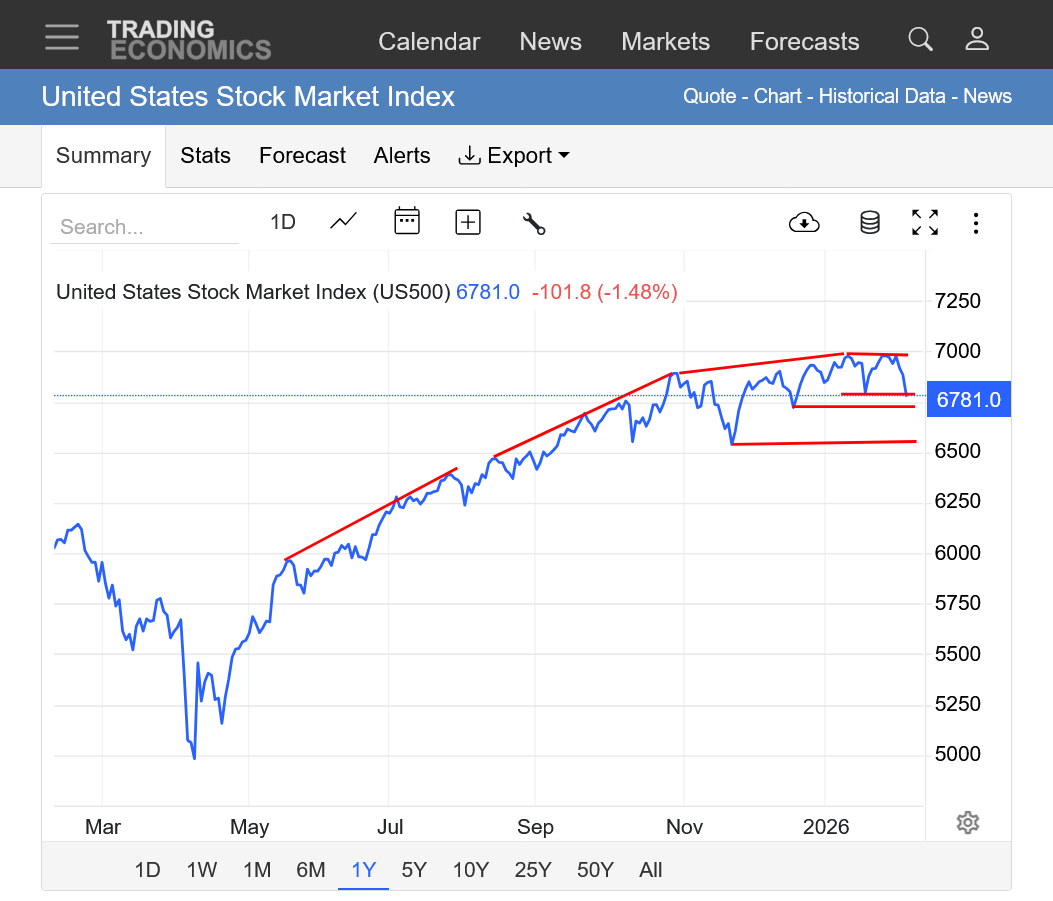
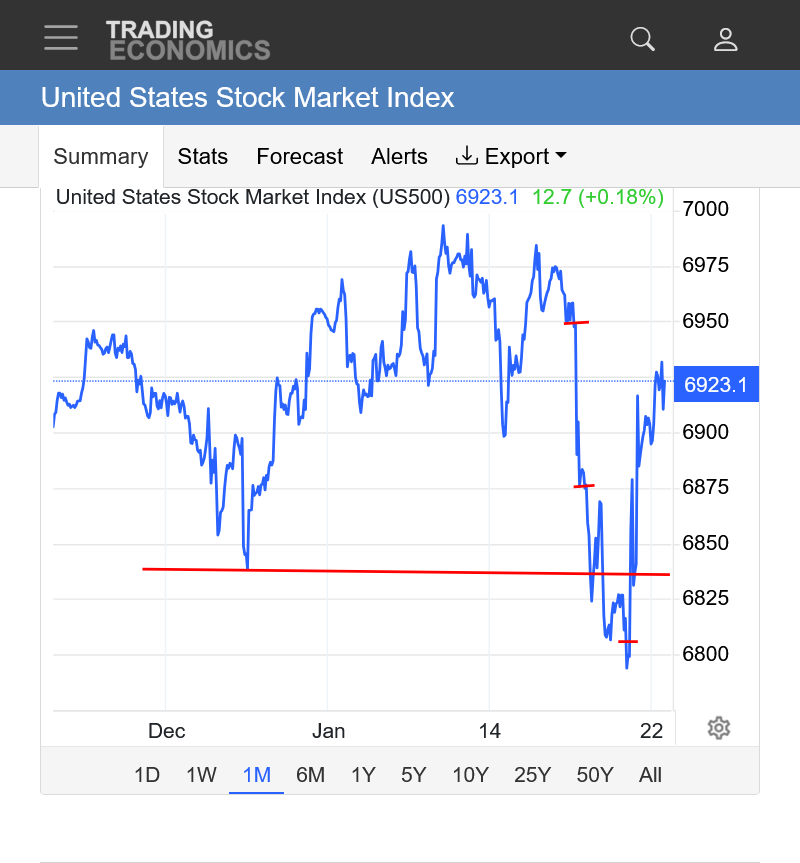
Spike thru support/2026 lows and back above it again.
It looked like a potential head and shoulders top(1 top-head, with 2 slightly lower tops on either side-shoulders, then the neckline support being the 2026 lows.
We're back above the neckline at the moment, although this formation may not have completely played out and it could still verify if we drop back to new lows.
It can be completely negated with new highs. New highs by a wide margin would also weaken the case for the rounding top formation that has remained for numerous months.
https://www.investopedia.com/terms/h/head-shoulders.asp
:max_bytes(150000):strip_icc()/dotdash_Final_Head_And_Shoulders_Pattern_Sep_2020-01-4c225a762427464699e42461088c1e86.jpg)
Strong finish to the week for this stock index. Long term trend is still up but with a loss of momentum on many time frames.
https://tradingeconomics.com/united-states/stock-market