This cold will stick around for awhile!
Re: Re: Re: Re: Re: Weather May 2022
By metmike - April 30, 2022, 8:41 p.m.
Highs for upcoming week:
https://www.wpc.ncep.noaa.gov/medr/medr_max.shtml


Lows for upcoming week below:
https://www.wpc.ncep.noaa.gov/medr/medr_min.shtml
Re: Re: Re: Re: Re: Re: Weather May 2022
By metmike - April 30, 2022, 8:41 p.m.
Extended weather.
https://www.cpc.ncep.noaa.gov/products/predictions/610day/ | |||||||||
| 6 to 10 day outlooks | |||||||||
| Click below for information about how to read 6-10 day outlook maps Temperature Precipitation | |||||||||
| Click below for archives of past outlooks (data & graphics), historical analogs to todays forecast, and other formats of the 6-10 day outlooks ArchivesAnalogsLines-Only FormatGIS Data | |||||||||
Temperature Probability | |||||||||
Precipitation Probability | |||||||||
This is the Heating Degree forecast from the last 12z European Ensemble Model.
Note the spike up to day 11, January 28th, followed by a HUGE warm up after that.
3 days later, on January 31st, temperatures have warmed up to average (green line) .
Note the green line is now dropping since we've just passed the coldest average (climatological) temperatures of Winter.
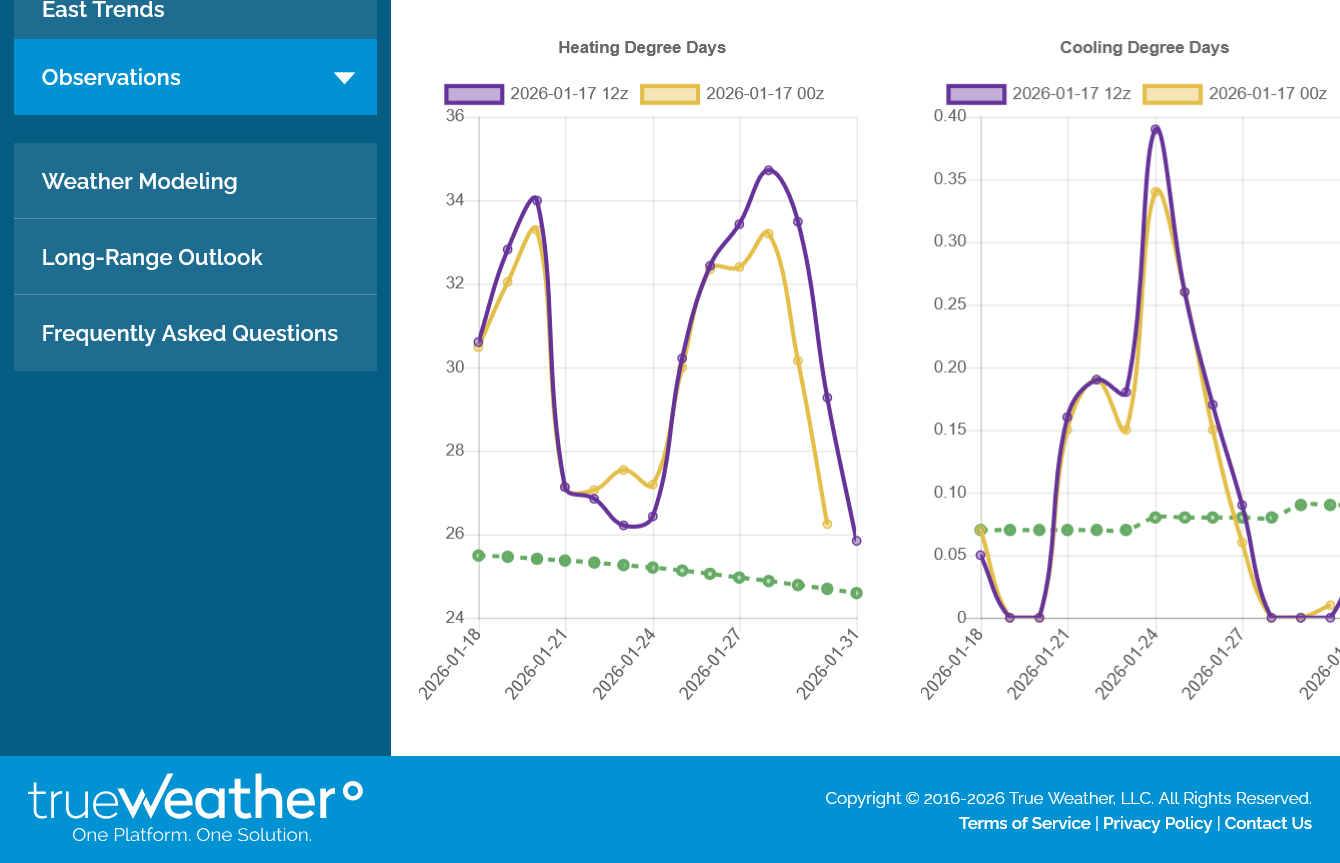
3pm Sunday The last 12 run of the European
The 12z European Ensemble model was a whopping +16 HDDs compared to the previous 0z run 12 hours earlier, so the cold is even more intense but is followed by a huge warm up late in week 2.

Late yesterday evening, we had a tiny dusting of snow, about the lightest that can be measured .1 inch.
There was no snow in the forecast, in fact the guidance was at 0% chance. However, no matter how advanced our technology, it's still impossible to forecast an ISOLATED small patch of extremely light snow that hits 1 spot. This is a great link to use if you want to go back to see past radar or precipitation amounts for any areas of interest.
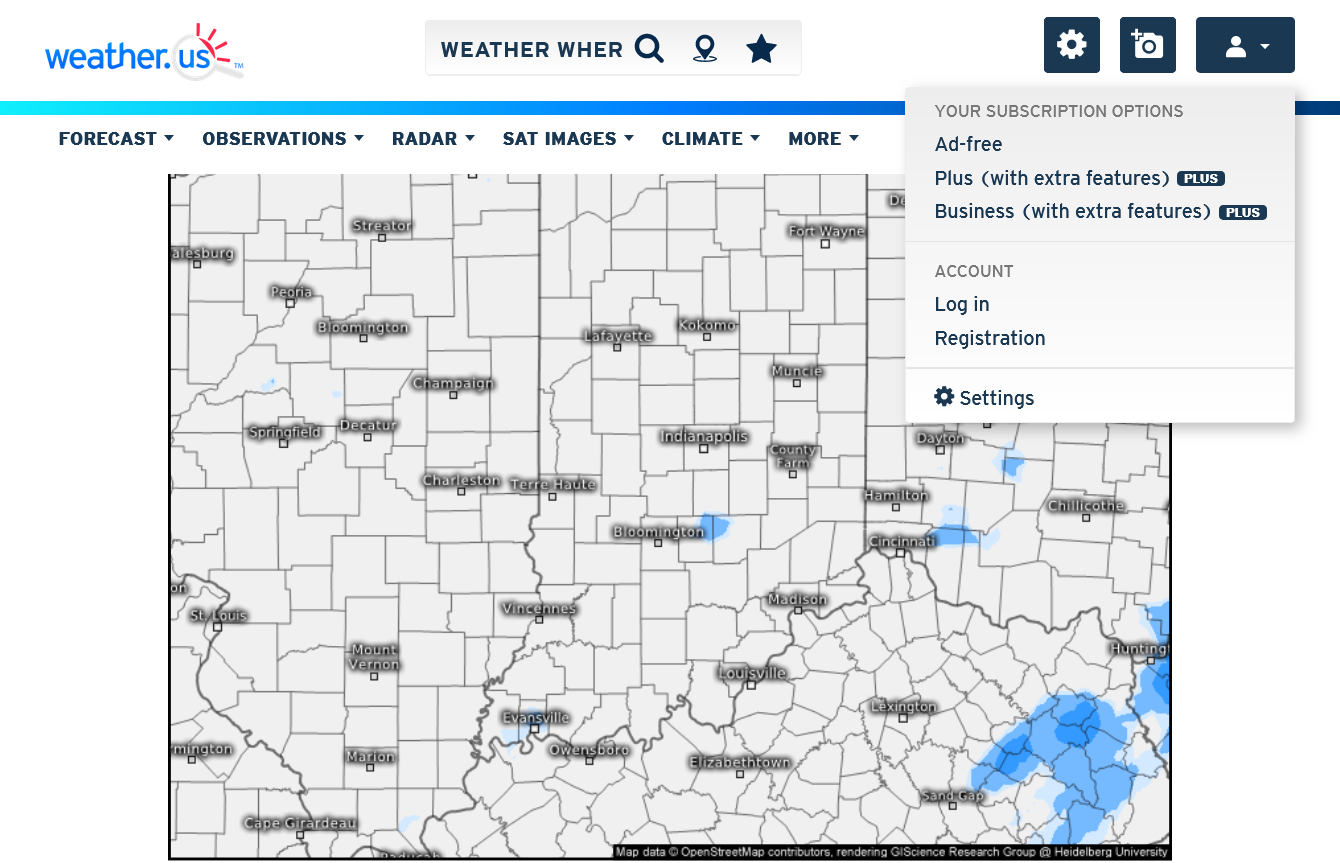
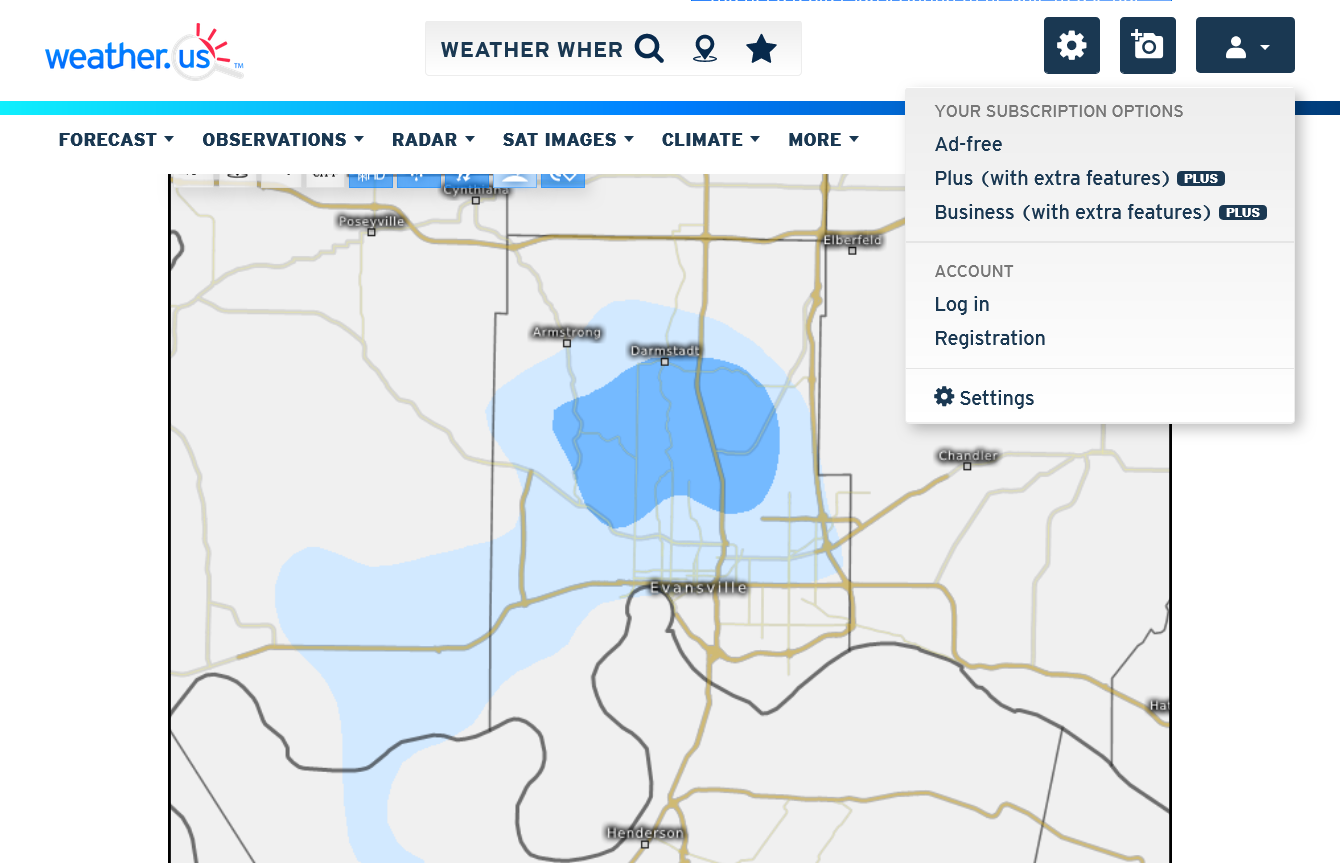
1. This was the snow amounts for Indiana at that time. During that time frame. You can't even see our snow because it's underneath the "Evansville" in southern Indiana.
2. This was the snow amounts for just Vanderburgh County. We were on the northeast corner of that blue blob and got 1/10th of an inch of snow. Since we had been well before freezing, it stuff to the roads/pavement and made things slippery for a short while.
https://weather.us/precipitation/indiana/us-preciptotal-1h-in/20260118-0400z.html
++++++++++++
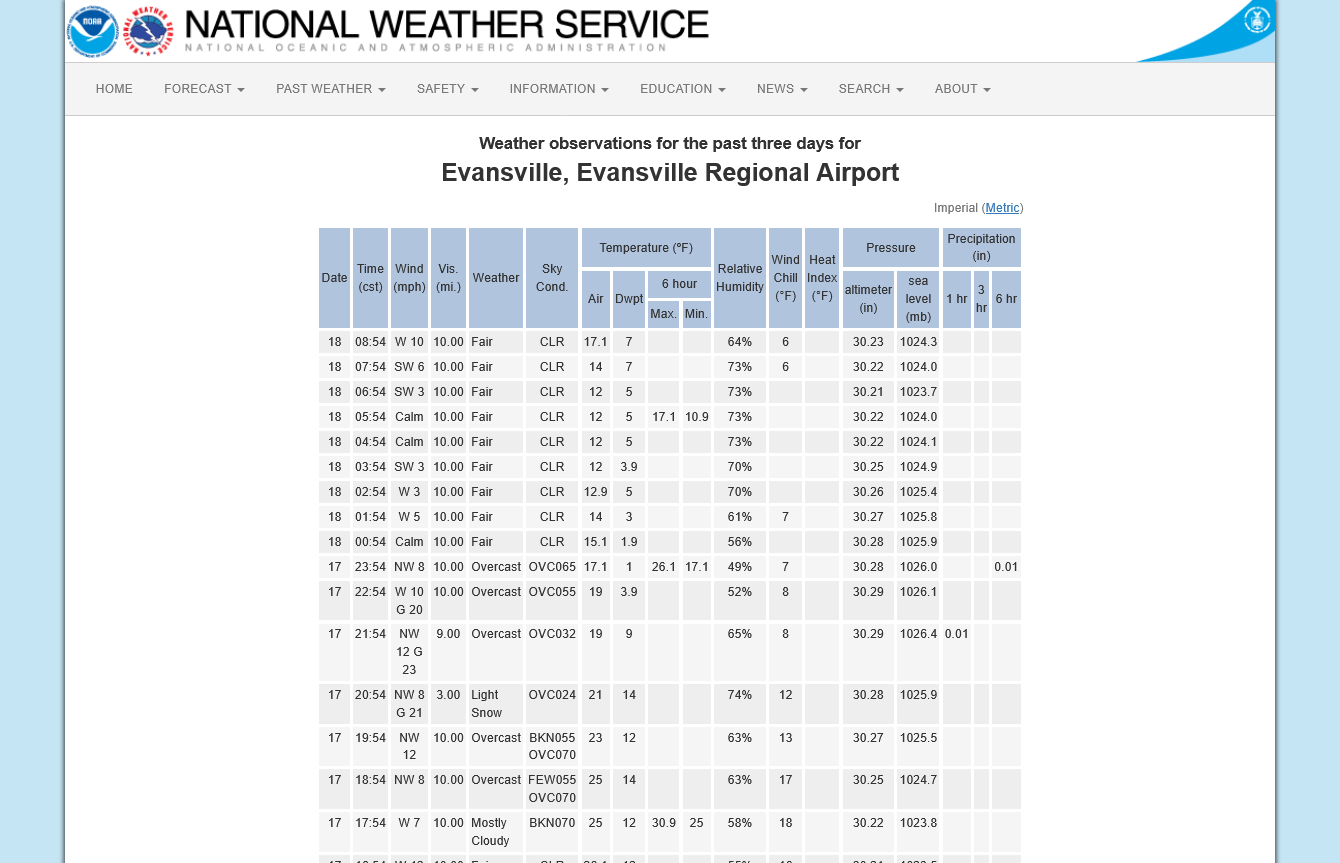
Here it is from the NWS observations between 9pm and 10pm, reported as .01 liquid equivalent which is around .1 inches of snow. At temperatures that cold, actually it was probably more like .2 inches (2/10s) of snow AT THE NWS measuring site 2.5 miles south of us because of a 20 to 1 ratio and DRY snow in the cold air.:
https://forecast.weather.gov/data/obhistory/KEVV.html
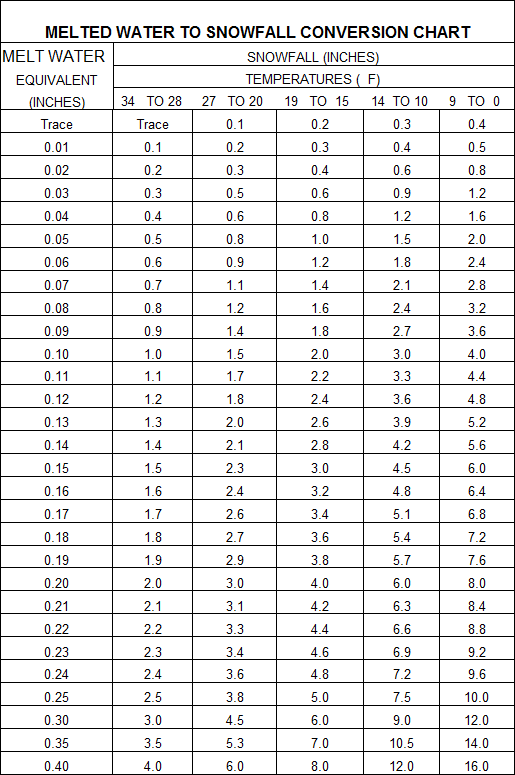
Water to snow equivalents/ratio's:
I'll have to CORRECT this source below that shows a 10 to 1 snow to water ratio for the warmest temperatures. It's more like 5 to 1 in our heavy wet snows around 32 degrees and I've seen a ratio closer to 3 to 1 a few times with temperatures just above freezing(at the surface).
Regardless, at 19 degrees last night when our dusting of snow fell, areas that got .01" of melted water equivalent received .2 inches of snow.
If it has been 10 times that for instance, at .1 inches of water, that would have been 2 inches of dry snow(not good packing for snowballs or making a snowman)
![]()
https://www.eldoradoweather.com/current/misc/snow-to-water.html
+++++++++++++++++
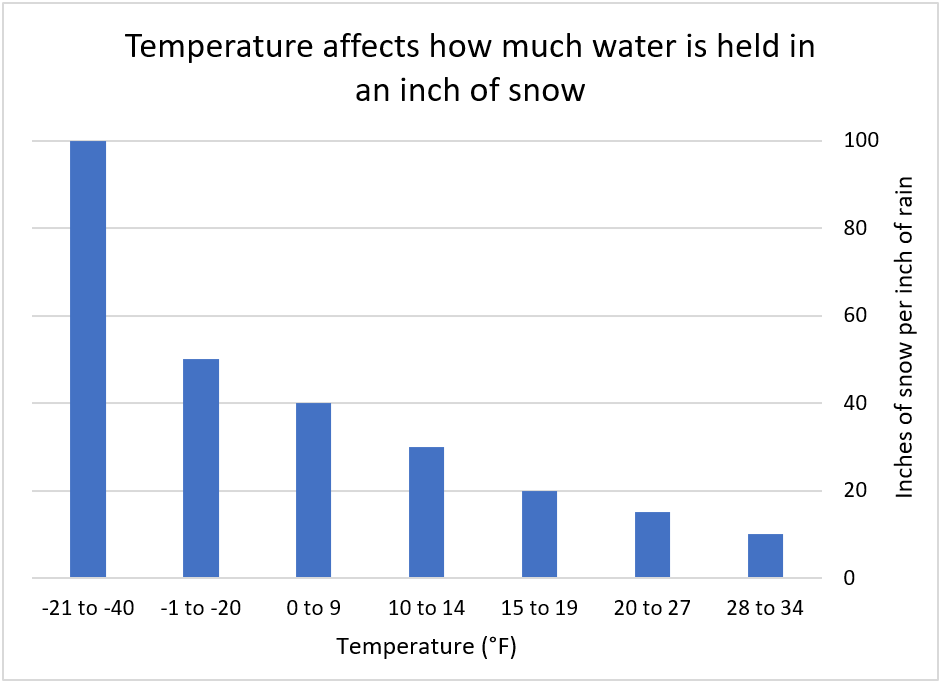
Here's a really nice bar graph that gives a better image of this concept with 1 picture.
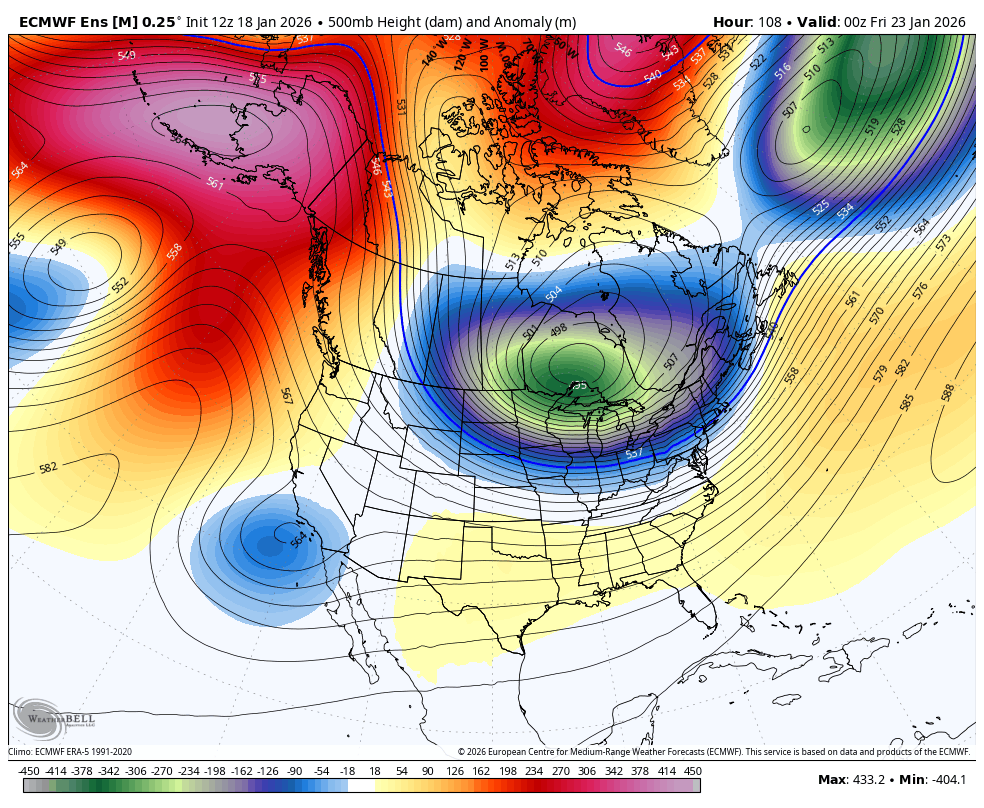
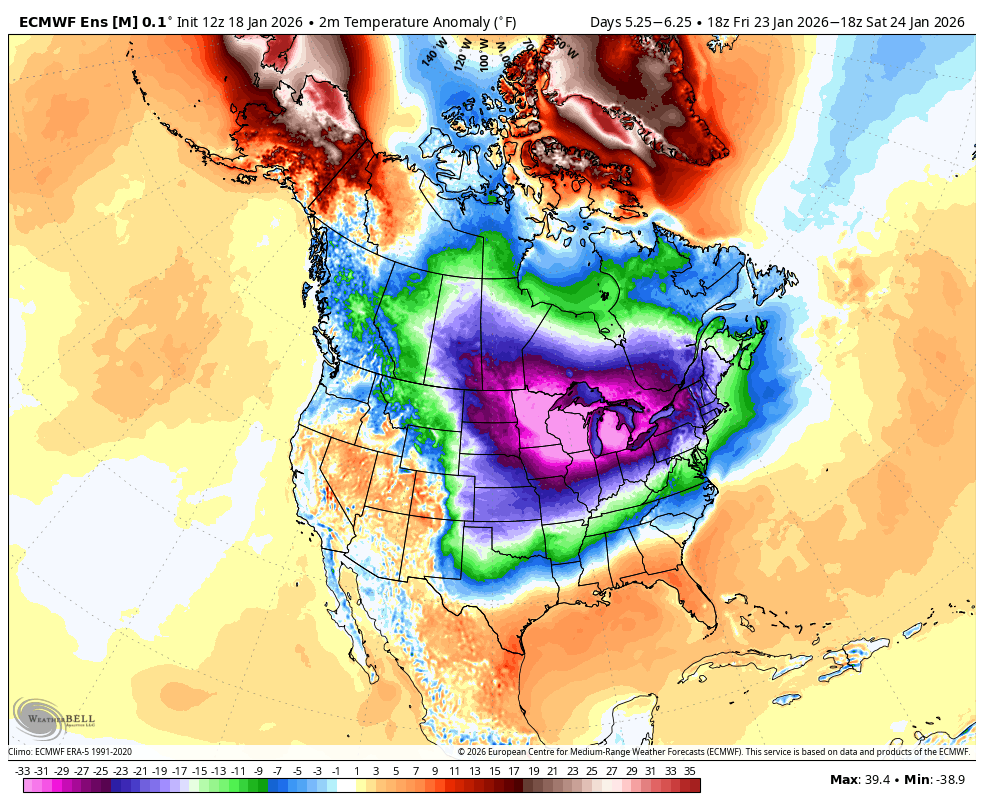
The reason for this frigid weather is that the Polar Vortex has become dislodged from it's usual location in the high Arctic.
There it is this Thursday Night with a center just north of Lake Superior but a trough extended deeply into the US. The colors below show the anomalies compared to average. The colors in the Polar Vortex are to the very extreme left on the color bar chart below.
These are the temperatures compared to average on Friday. Note that the center of the most extreme cold is the coldest color bar possible because the color bars don't go any lower than -33 Deg. F below average.
Some of those places will have highs Friday of near 40 Deg F BELOW average!
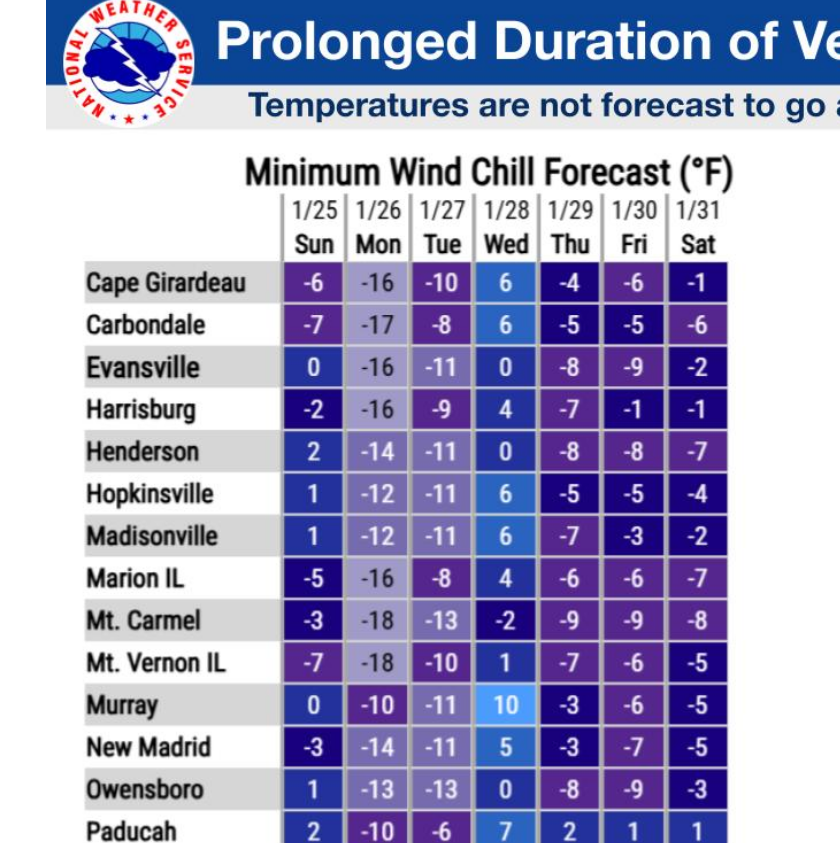
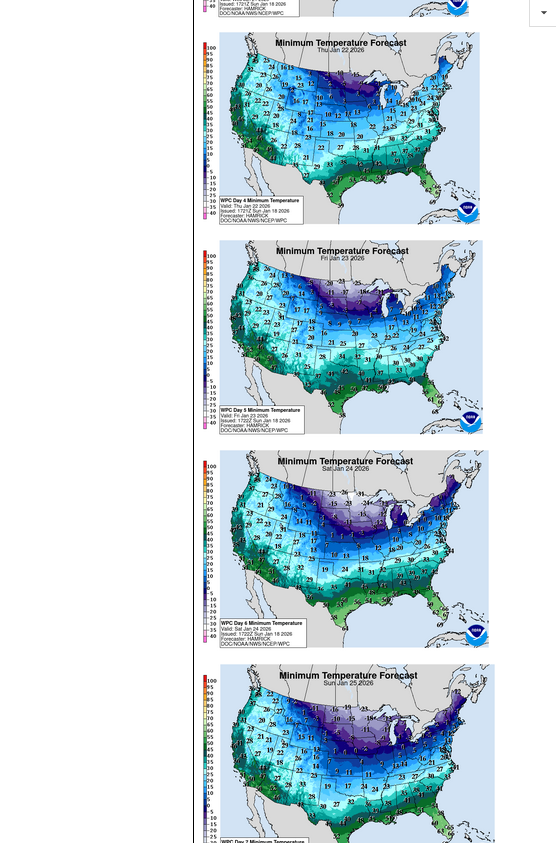
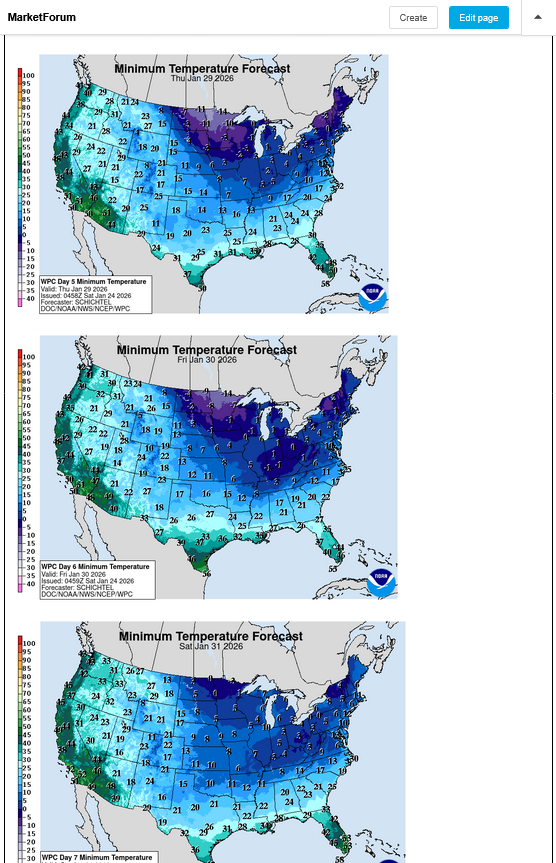
These are the low temperature forecasts or next Thu-Fri-Sat-Sun. The 4 coldest mornings for many cities in the Midwest during the next week.
https://www.marketforum.com/forum/topic/83844/#83851
OK, Larry and MetMike---why were you not long late friday afternoon??
tjc,
I moved these natural gas posts to the natural gas thread. Great discussion for sure and I appreciate your questions and contributions wherever they come.
Thanks
By metmike - Jan. 19, 2026, 1:45 a.m.
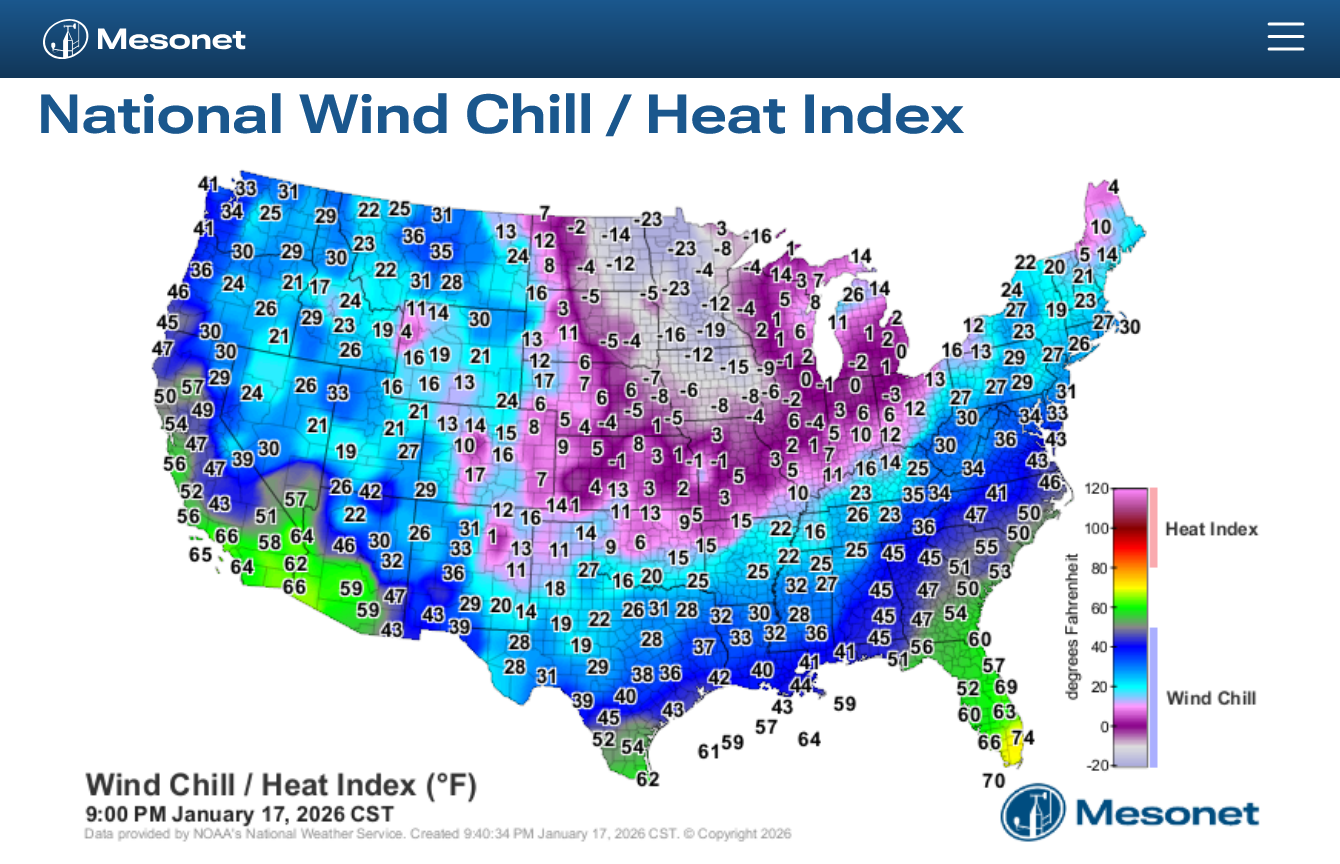
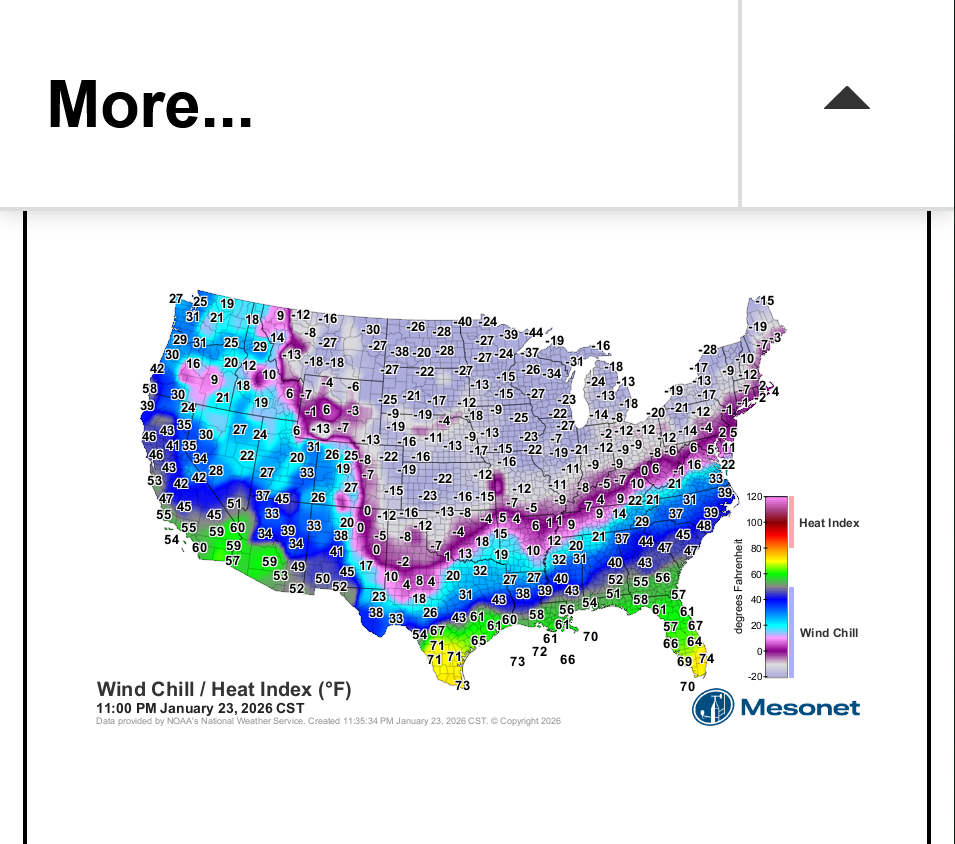
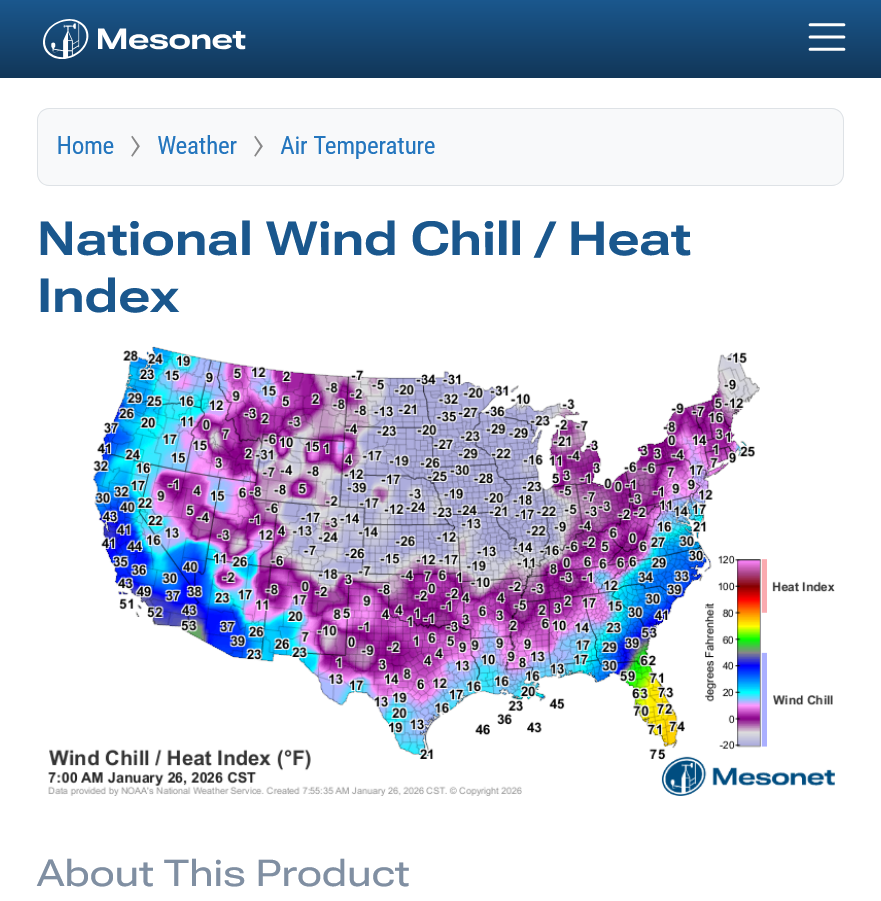
Current wind chills. They are lower than the lowest color bar!
That's a -40 Deg.F in northwest MN.
https://www.mesonet.org/weather/air-temperature/national-wind-chill-heat-index
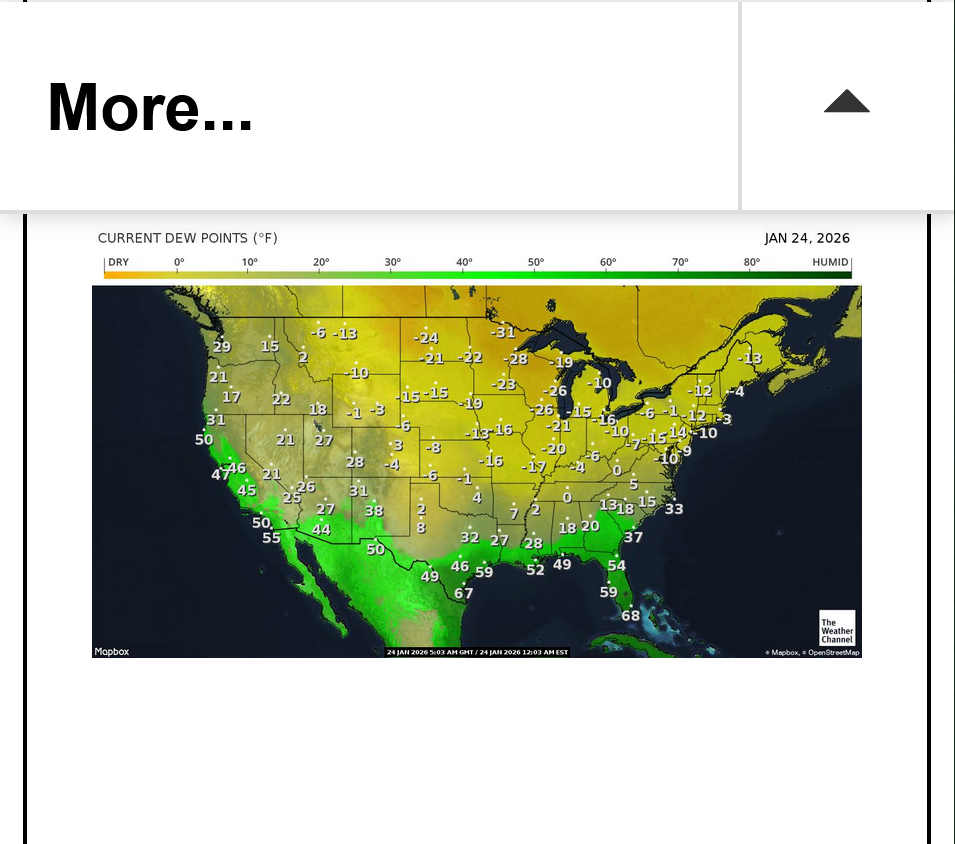
Incredibly dry air and low dew points. Unusual to see this much snow with surface air so dry and NORTH winds pushing even more Arctic air in. However, the mid/upper levels will have tremendous dynamics and they will generate heavy precip with southerly winds that moistens up the lowest levels from precipitation that falls from above, not from southerly winds at the surface.
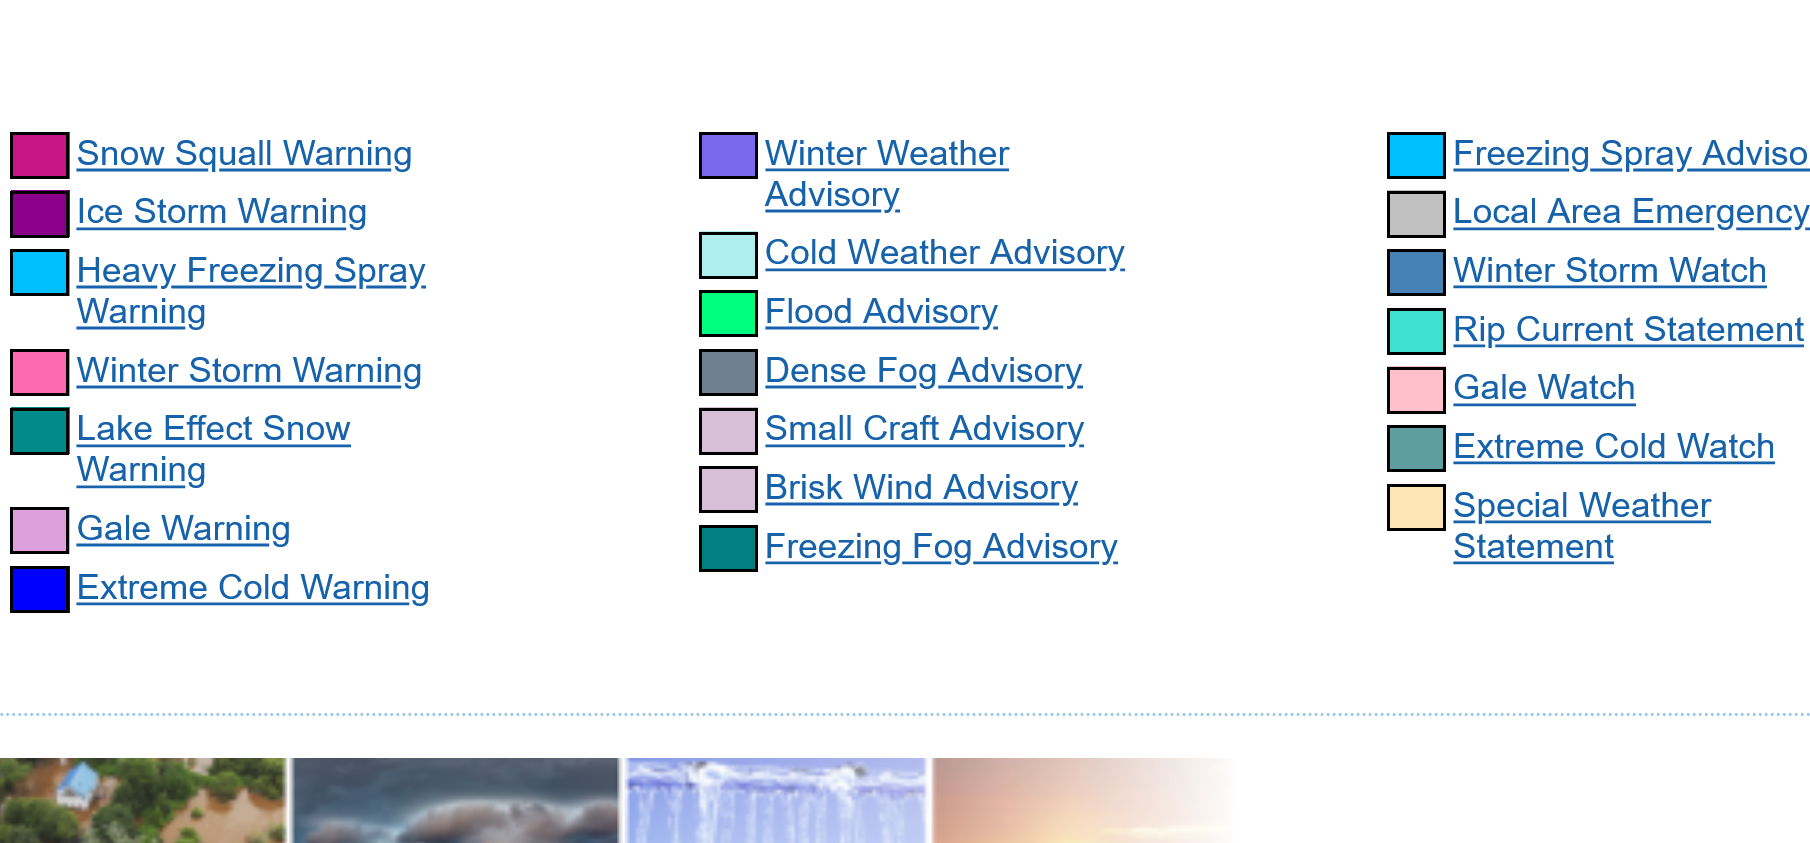
Current Hazards at the link below.
For your NWS and county, go to the link below.
Then you can hit any spot on the map, including where you live and it will go to that NWS with all the comprehensive local weather information for that/your county.

Here's what the colors on the map above stand for:
https://www.wunderground.com/maps/radar/current
https://www.marketforum.com/forum/topic/83844/#83851
Lows next week, freeze frame images:
Single digits above 0 to just below 0 every early morning!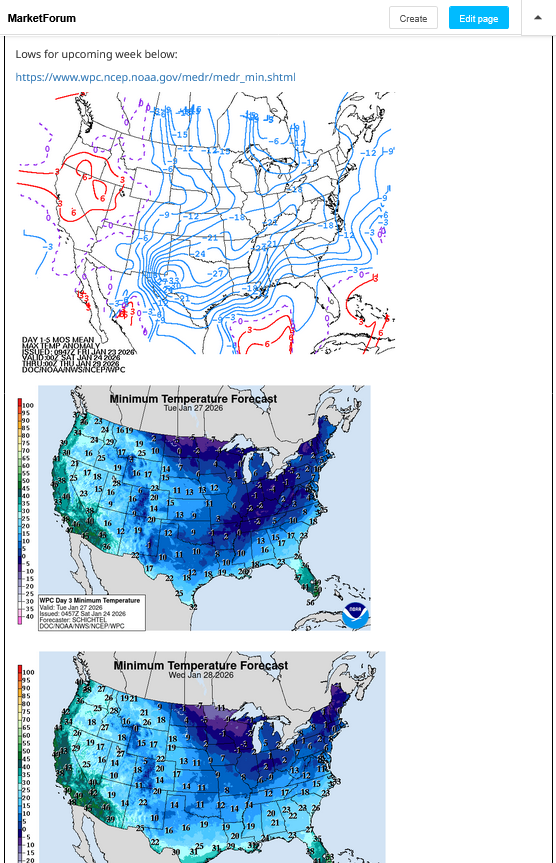
No sign of any big warm ups in February. This was the last long range forecast for mid-February from the GEFS model. These are temperature ANOMALIES (compared to average).

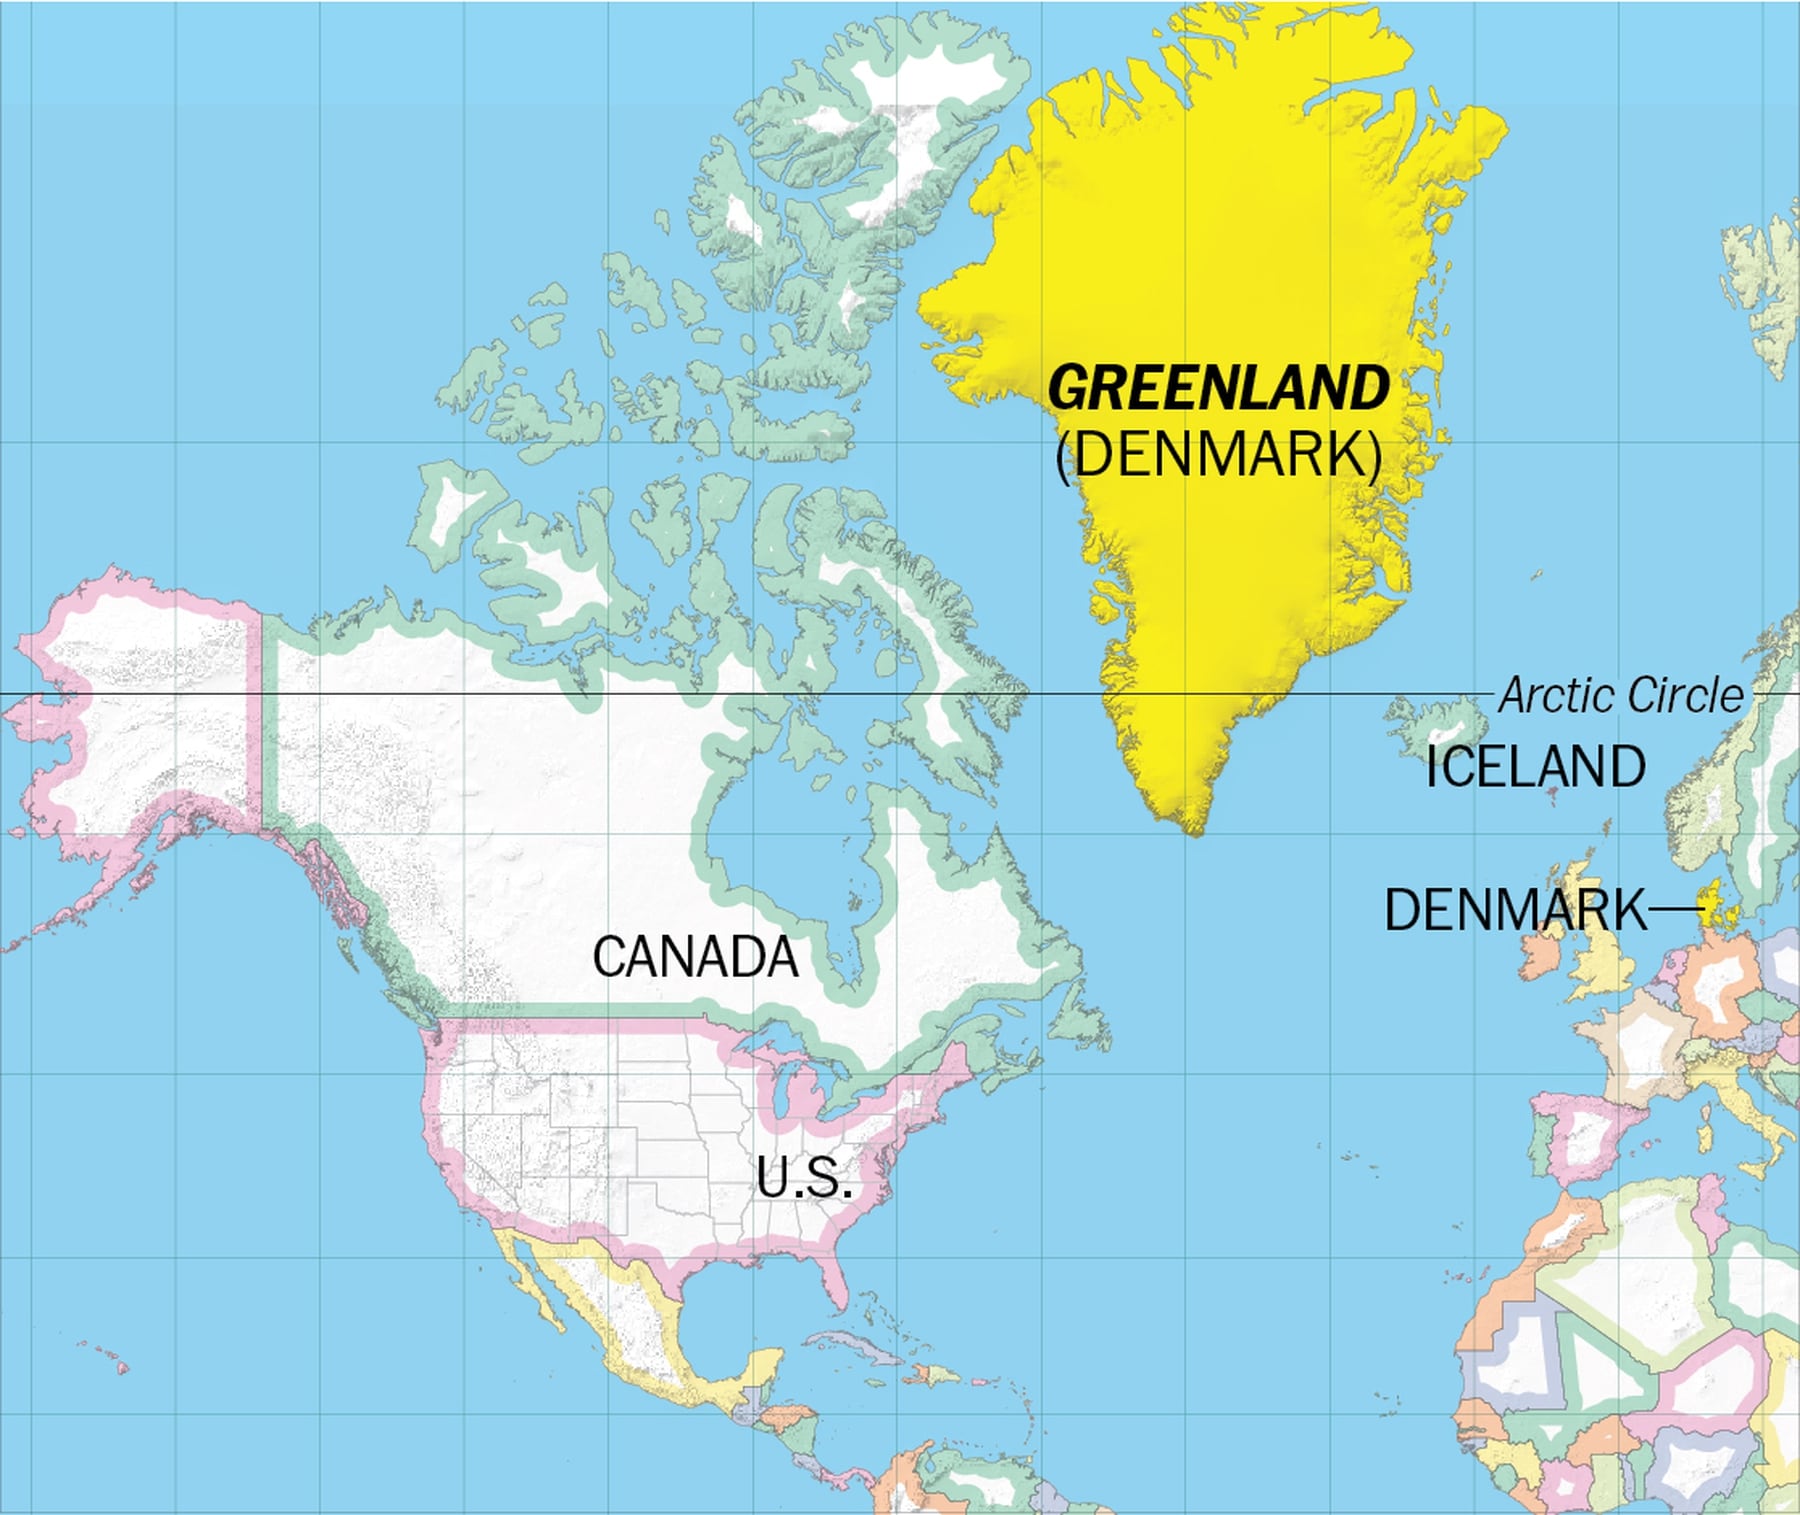
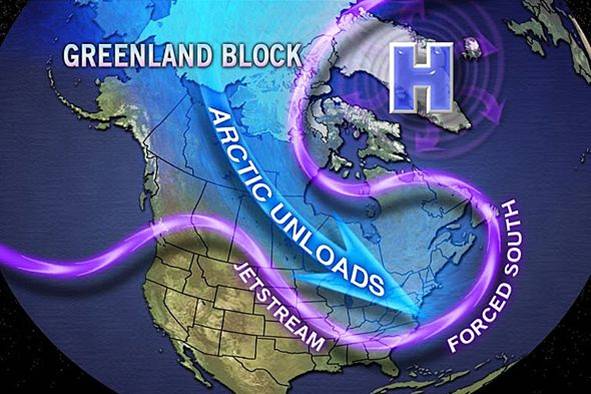
We've heard enough about Greenland this month to last the rest of our lives. However, the pattern with a strong upper level high over Greenland and negative anomolies in the Northeast is part of a Greenland Block type pattern.
In this case, the positive anomalies extend across the highest latitudes, with an additional positive across western North America(+PNA).
https://www.psl.noaa.gov/map/images/ens/ens.html#nh
NCEP Ensemble t = 360 hour forecast 
NCEP Ensemble t = 360 hour forecast 
+++++++++++++++++++
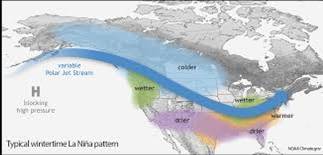
La Nina Winters have more amplified, merional type flow........from north to south and a Greenland Block is more likely during a La Nina, like we have currently.
The patterns/forecast maps we are getting right now are an AMPLIFIED version of the La Nina signal depicted below.
https://www.hometownforecastservice.com/2020-2021-winter-outlook/
++++++++++++++++
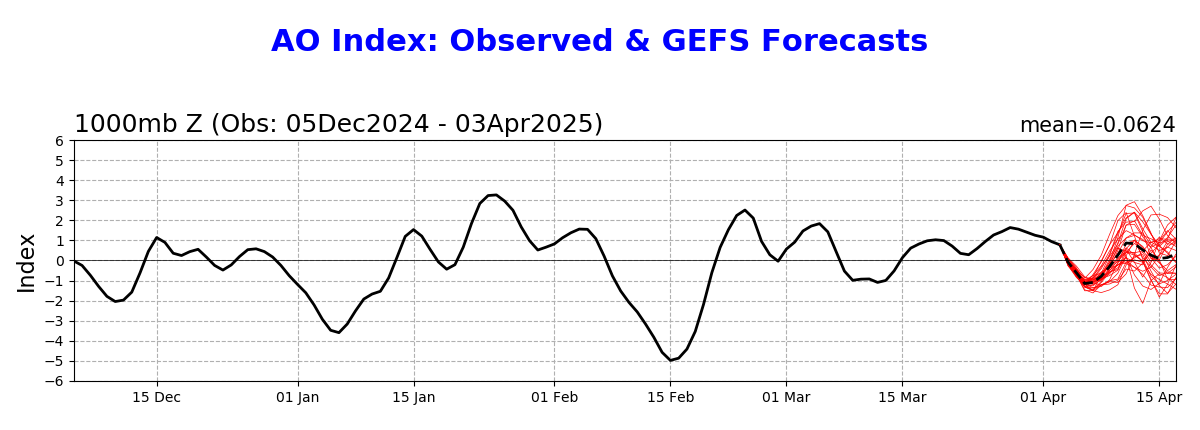
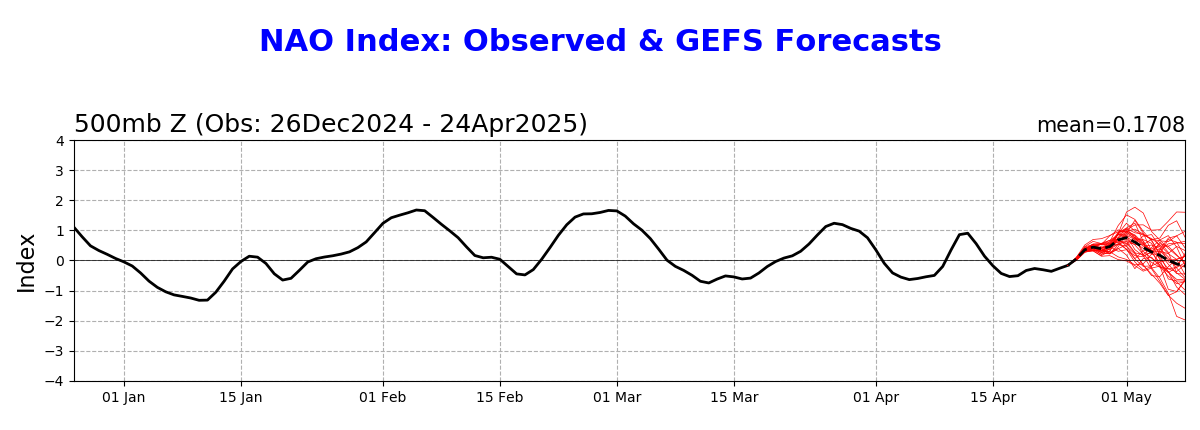
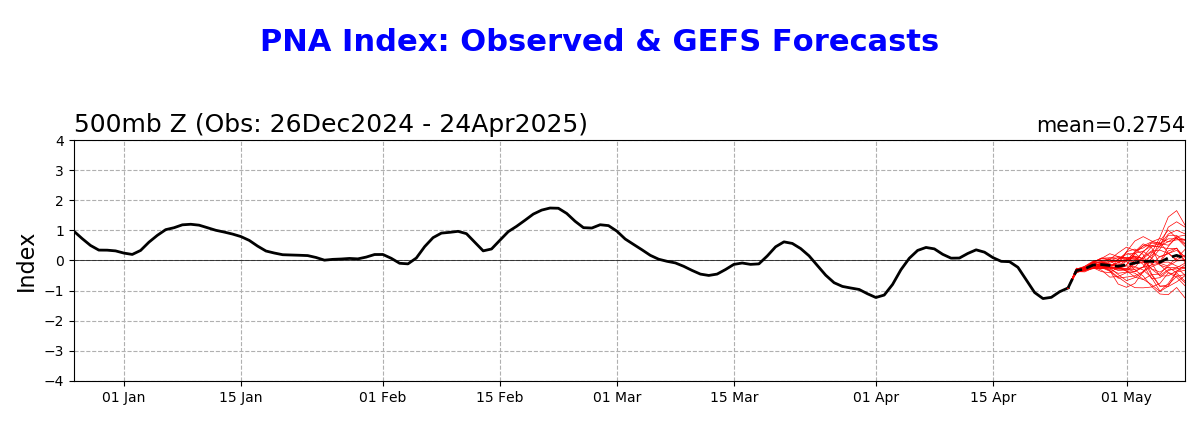
Latest forecast for some key indices. Red lines are the forecast for each ensemble member. Dashed black is the ensemble mean.
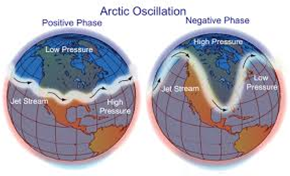
1. The -AO is literally, almost off the graph, with a magnitude not predicted by the models a week ago!!! See explanations below.
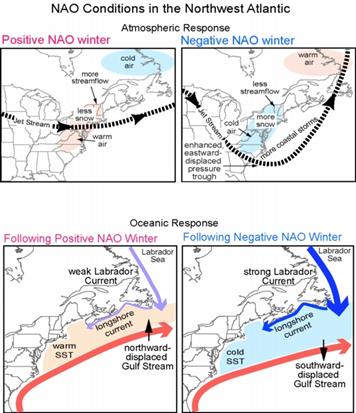
2. The modest, -NAO was also predicted to be higher(less cold).
3. The PNA was predicted to be lower (less cold). See explanations below.
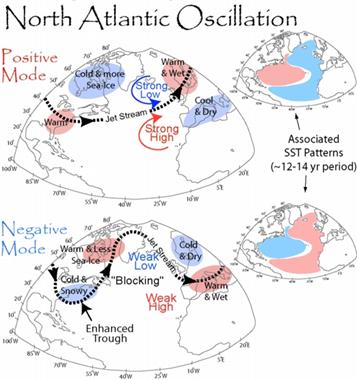
Arctic Oscillation Index, North Atlantic Oscillation Index, Pacific North American Index.
https://www.cpc.ncep.noaa.gov/products/precip/CWlink/daily_ao_index/ao.shtml
https://www.cpc.ncep.noaa.gov/products/precip/CWlink/pna/nao.shtml
https://www.cpc.ncep.noaa.gov/products/precip/CWlink/pna/pna.shtml
++++++++++++++++=
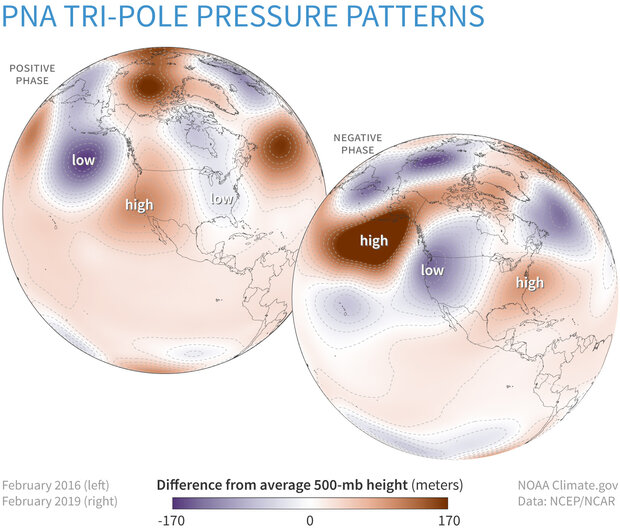
Climate Variability: Pacific–North American Pattern
++++++++++++
By metmike - Dec. 8, 2025, 11:48 a.m.
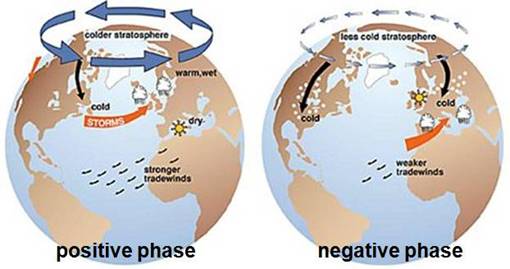
http://appinsys.com/globalwarming/ao_nao.htm
AO BELOW
+++++++++++++++++++++++++++++++
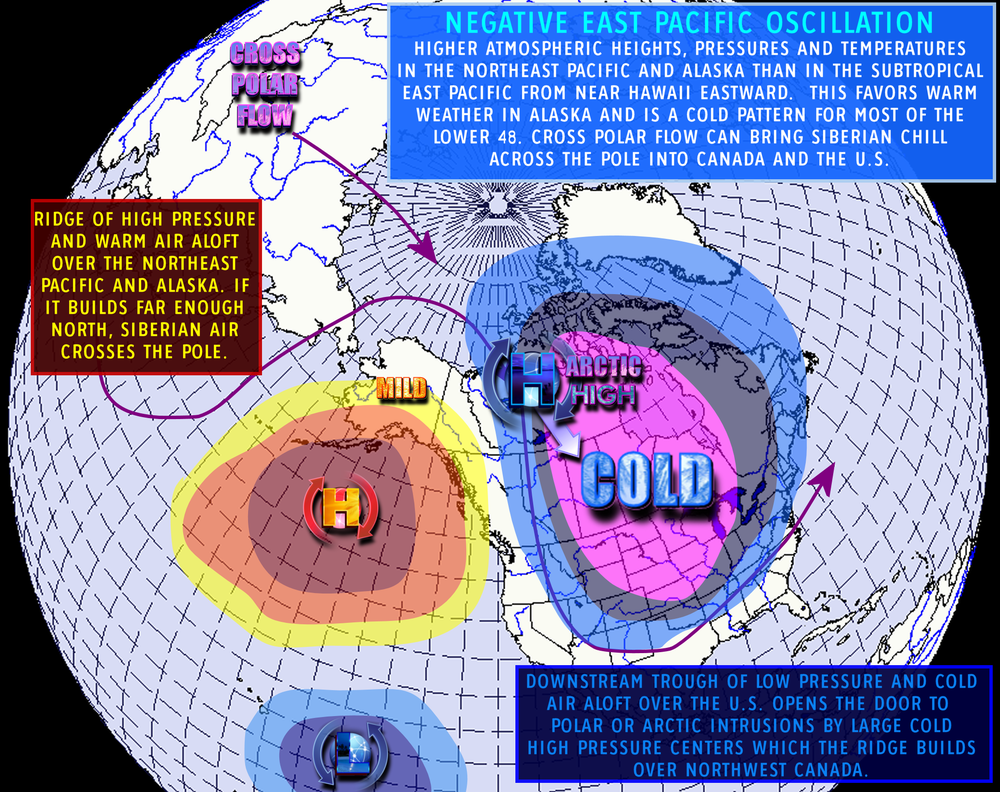
This is the pattern we've been seeing recently
https://www.daculaweather.com/4_epo_index.php
Current Hazards at the link below.
For your NWS and county, go to the link below.
Then you can hit any spot on the map, including where you live and it will go to that NWS with all the comprehensive local weather information for that/your county.
Here's what the colors on the map above stand for:
A fresh, deep snowpack can cause temperatures to be 10 deg. F colder than bare ground under clear skies.
https://www.mesonet.org/weather/air-temperature/national-wind-chill-heat-index
Snap shot below at 7am.
These were the 7 day average temperatures from the last week.
The coldest color bar on the anomaly map(2nd one) is -16 even though this extreme cold had -18 and -20 deg. F isotherms that were colder than the coldest color bar.
Seasonally, we've past the climatological mid point of Winter and coldest time of year ON AVERAGE. February looks to continue cold compared to average but probably not as cold as what we just experienced.
https://www.cpc.ncep.noaa.gov/products/tanal/temp_analyses.php

Weeks 3 and 4 for mid/late Feb. More cold:
https://www.cpc.ncep.noaa.gov/products/predictions/WK34/

A location in Cuba went down to 32F for the first time in recorded history:
https://x.com/extremetemps/status/2018715146642767916?
Also, Tampa had snow flurries for the first time since the great 1/19/1977 Arctic plunge that gave Miami flurries!
Incredible, Larry!
It’s been close to that several times but that was the record.
I imagine that some of the tropical vegetation was damaged but should likely recover, however, maybe some of their cold sensitive crops were damaged?