This was the last NG thread:
NG 1/1/26+
74 responses |
Started by WxFollower - Jan. 1, 2026, 1:33 a.m.
https://www.marketforum.com/forum/topic/116915/
++++++++++++++
Current thread on Frigid weather:
Frigid Blast
Started by metmike - Jan. 17, 2026, 10:44 p.m.
https://www.marketforum.com/forum/topic/117282/
+++++++++
Upcoming snow events week of 1/18/26
Started by metmike - Jan. 18, 2026, 4:49 p.m.
https://www.marketforum.com/forum/topic/117294/
These were the last 2 posts on ng earlier this afternoon:
By metmike - Jan. 18, 2026, 1:42 p.m.
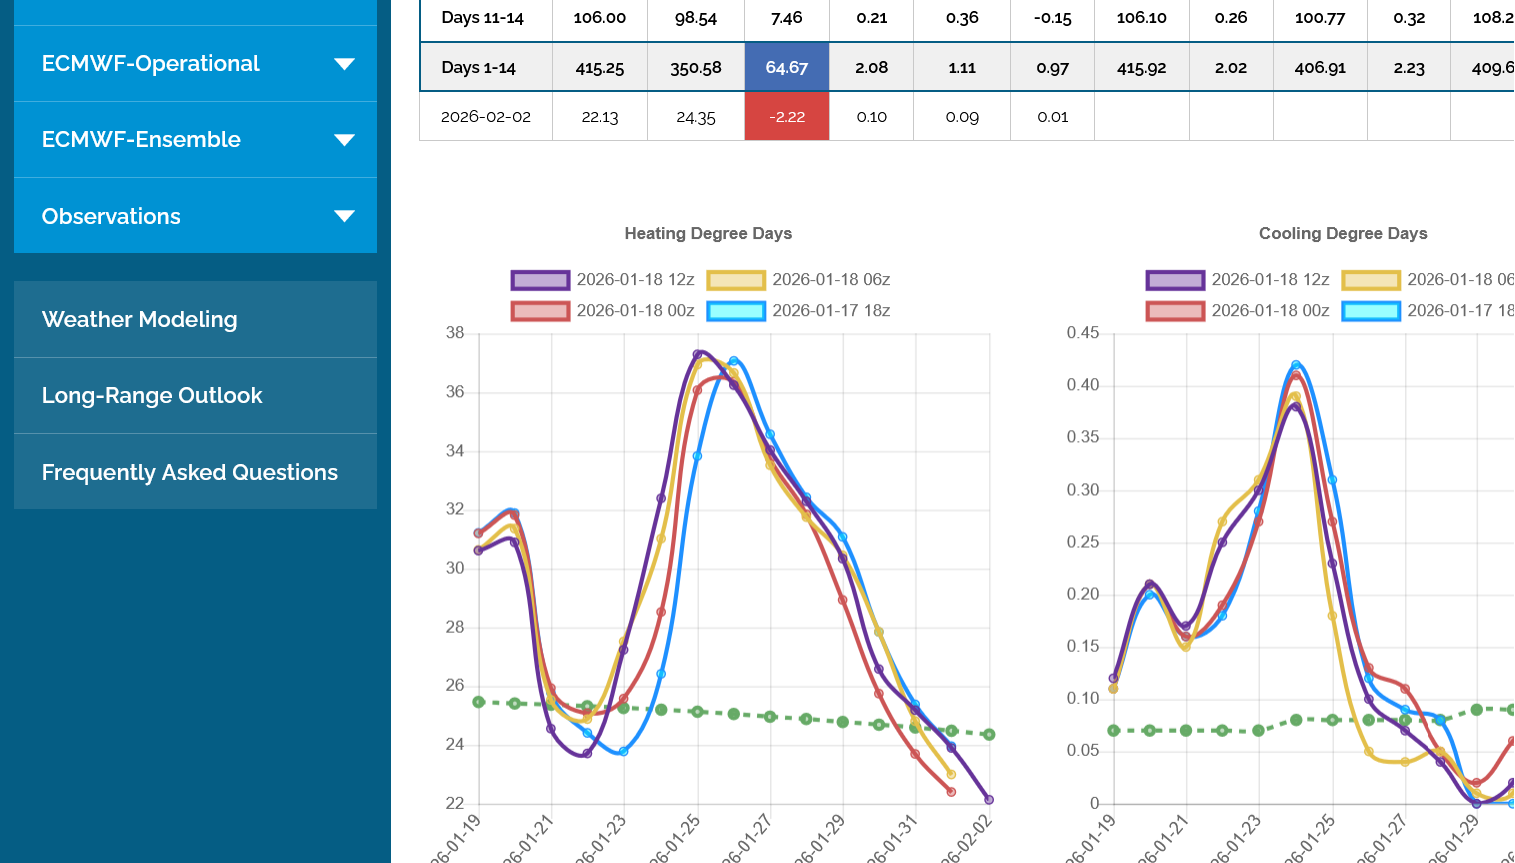
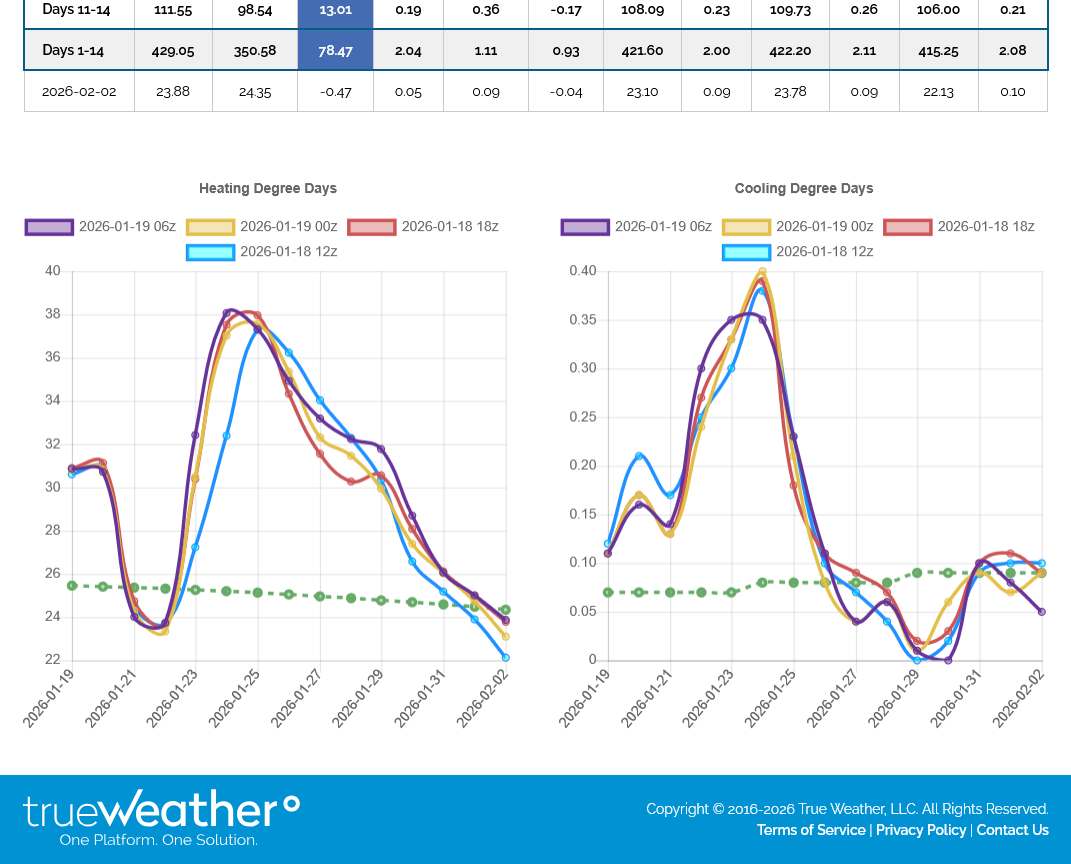
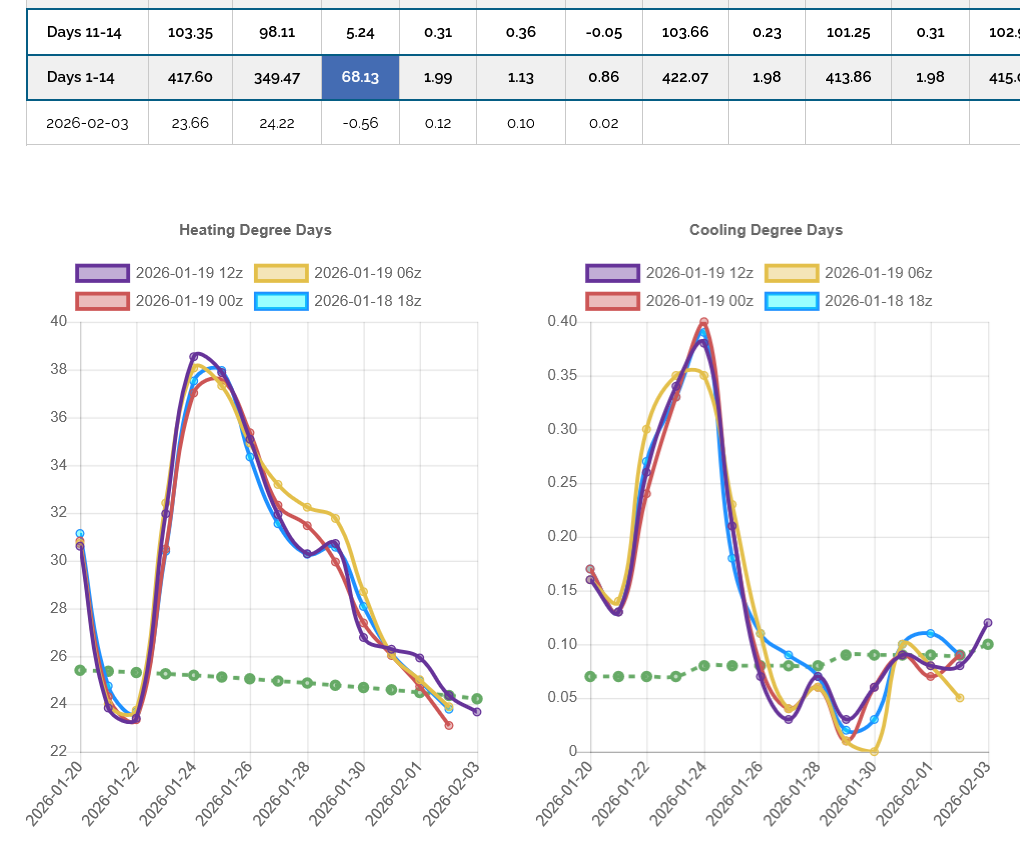
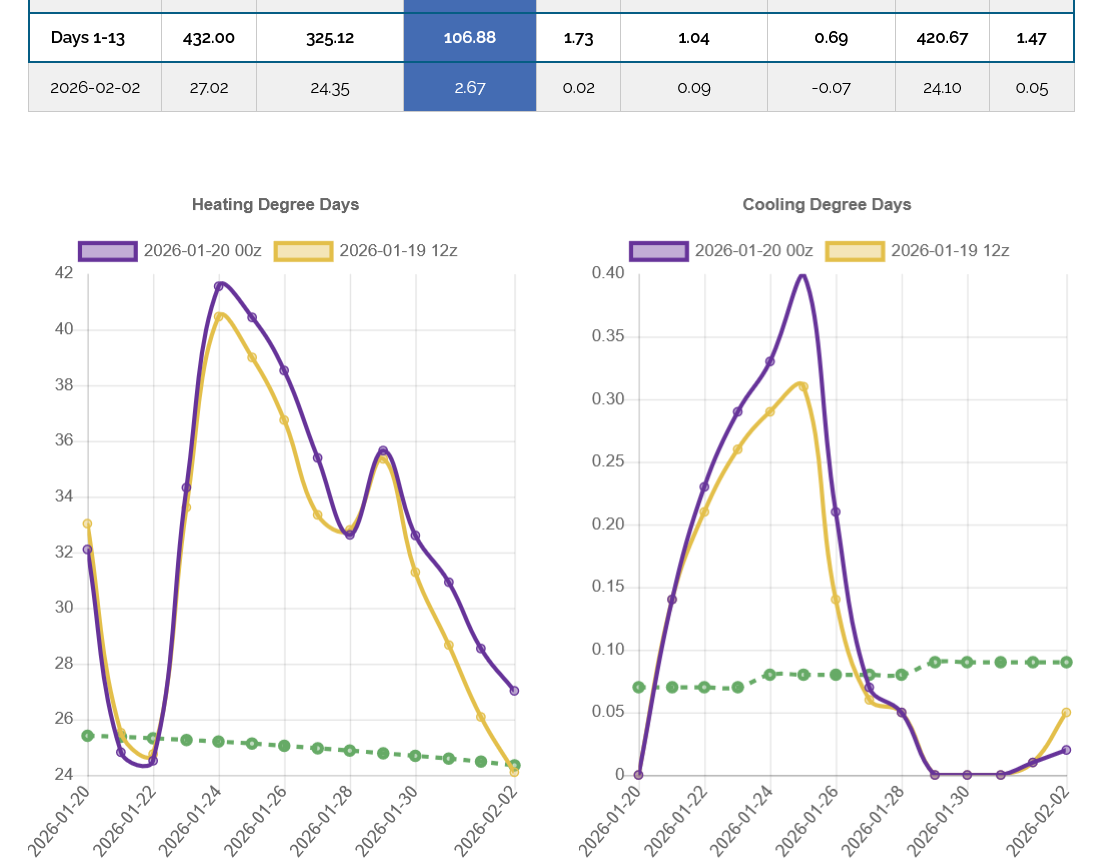
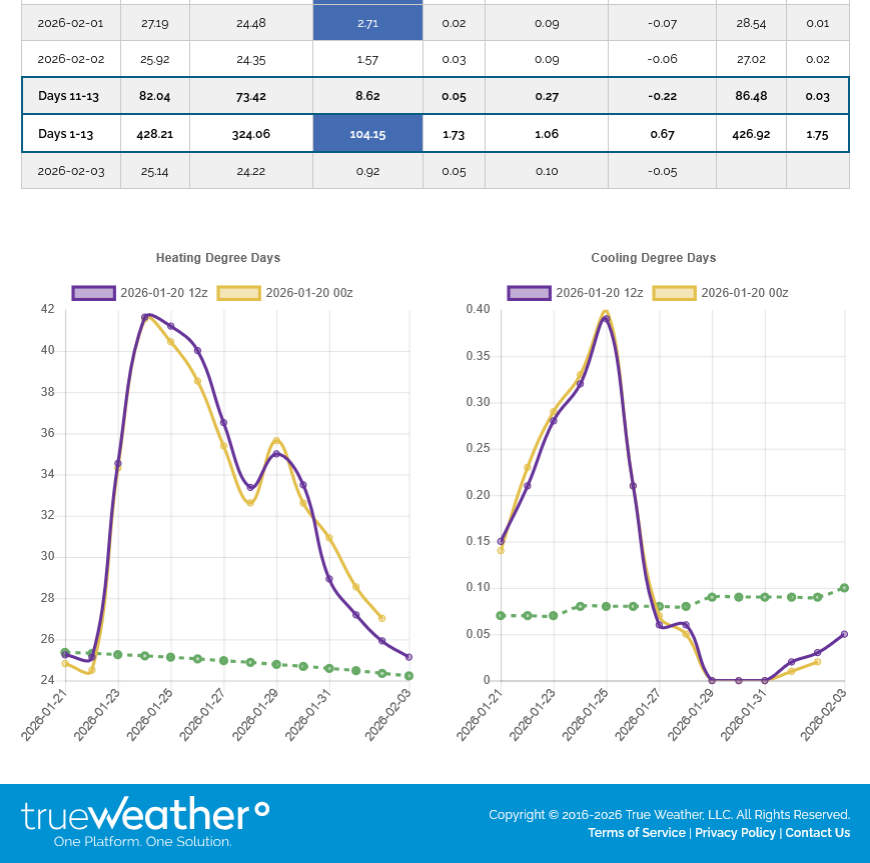
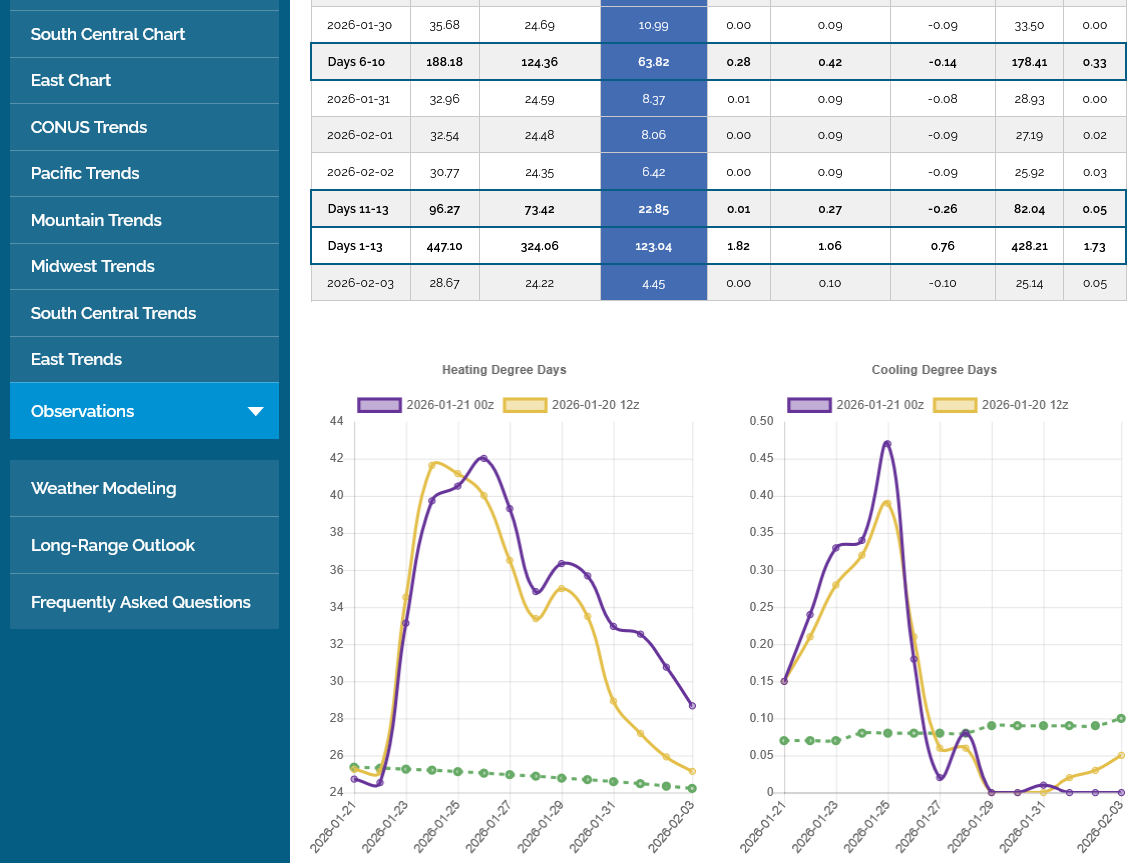
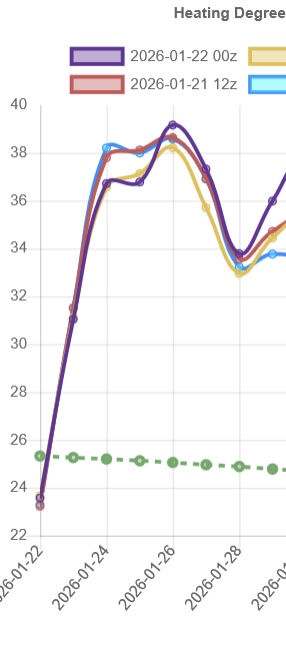
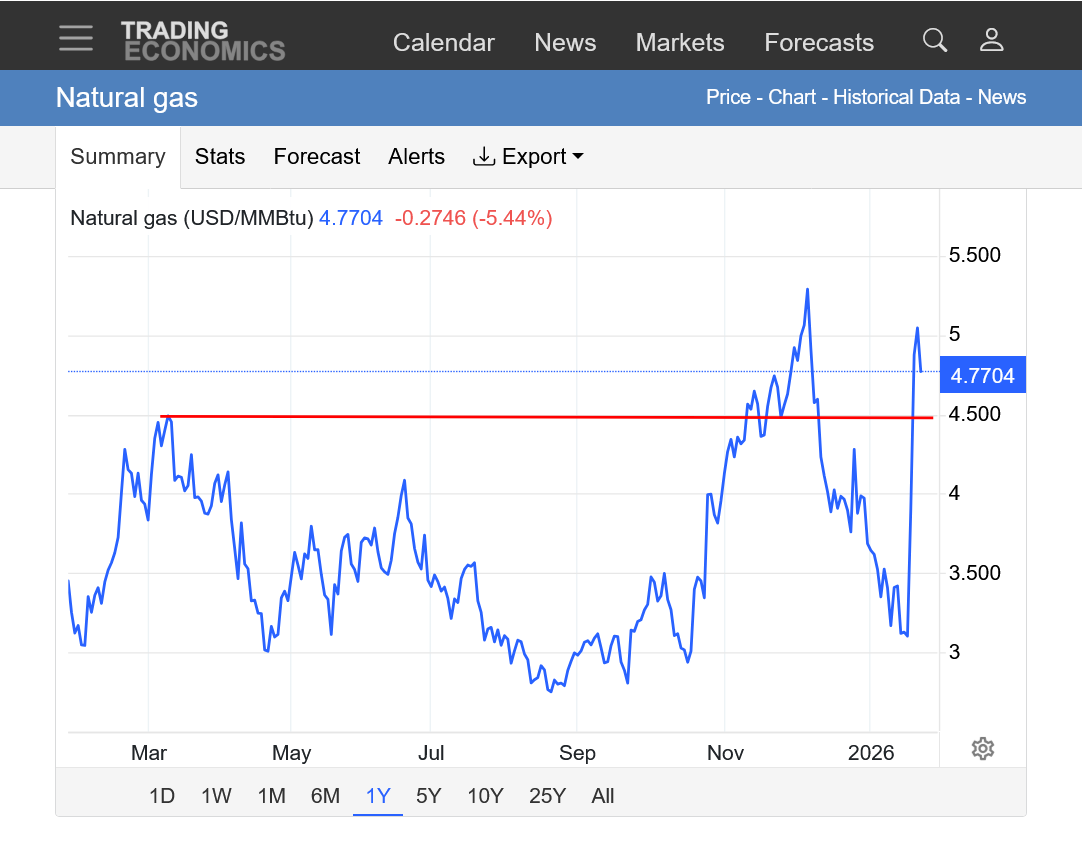
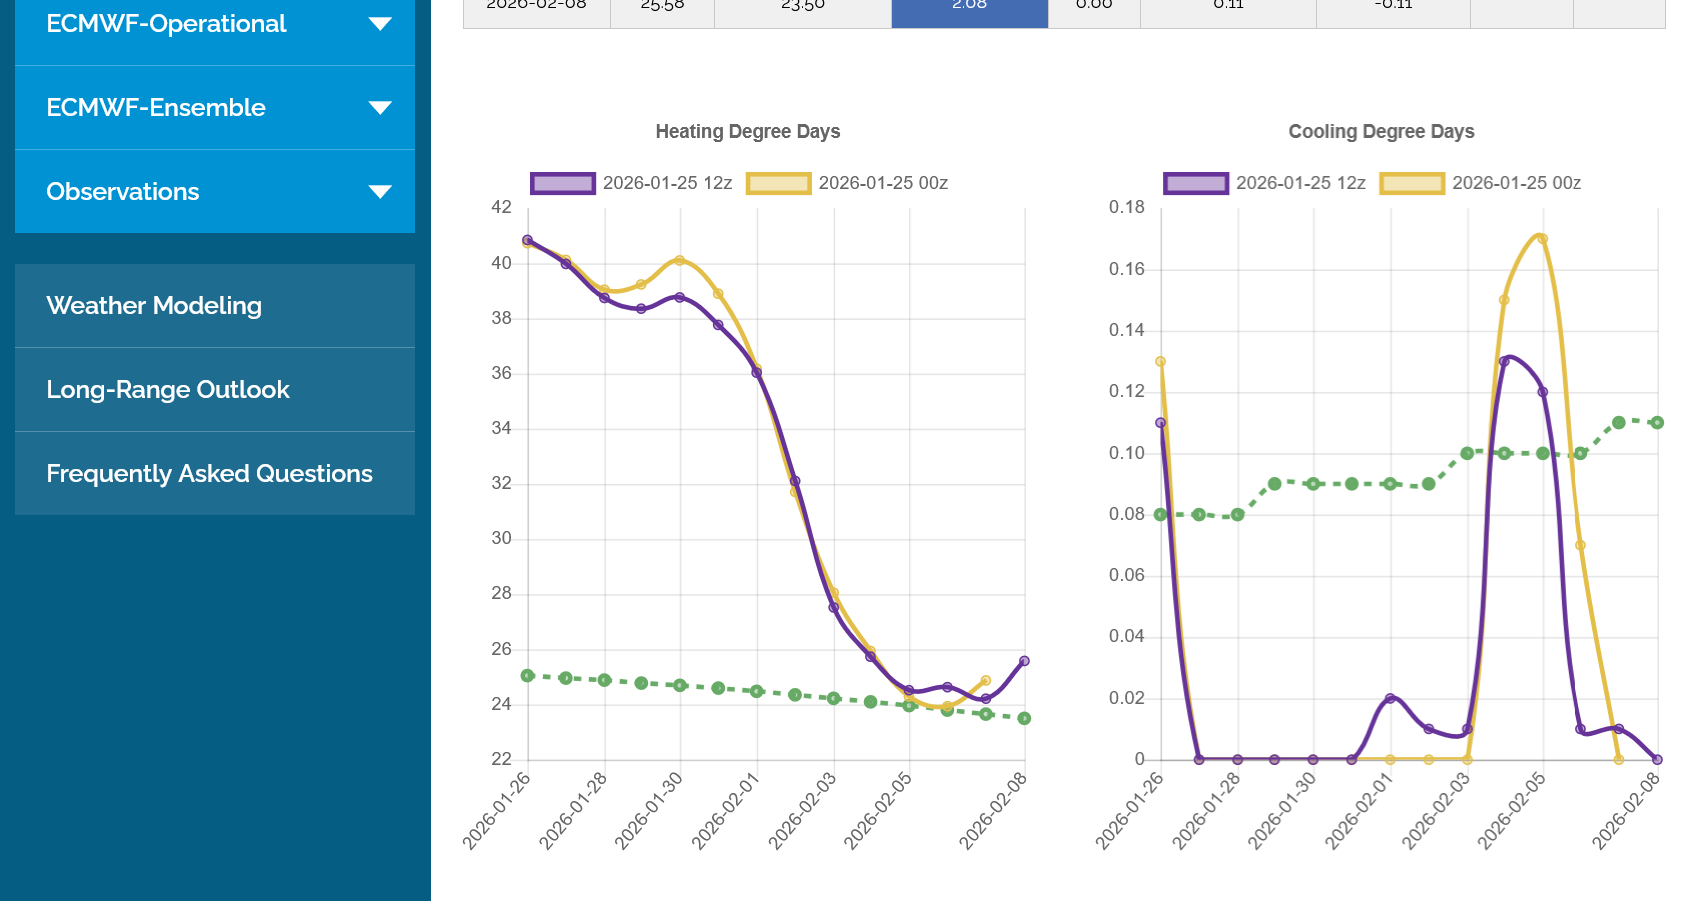
Over the weekend, HDDs increased in the forecast because the magnitude of the cold blast late in week 1 is GREATER.
But look what happens after that. Straight down for the last 8 data points. In fact, BELOW the green average line at the end. This is a huge pattern change coming up that will blow out all the frigid air coming down from Canada(originally from Siberia) this week.
The late week 2 pattern is VERY bearish.
The last 12z GEFS run is in purple/left with the previous 3 runs, spaced 6 hours apart. The dashed green average/climatology is slowly dropping now that we have passed the seasonally coldest time of Winter. Each Winter is different. This is a futures market. The amount of near term cold is major but a week of extreme cold, followed by temperatures going back above average is not especially bullish.
+++++++++++++
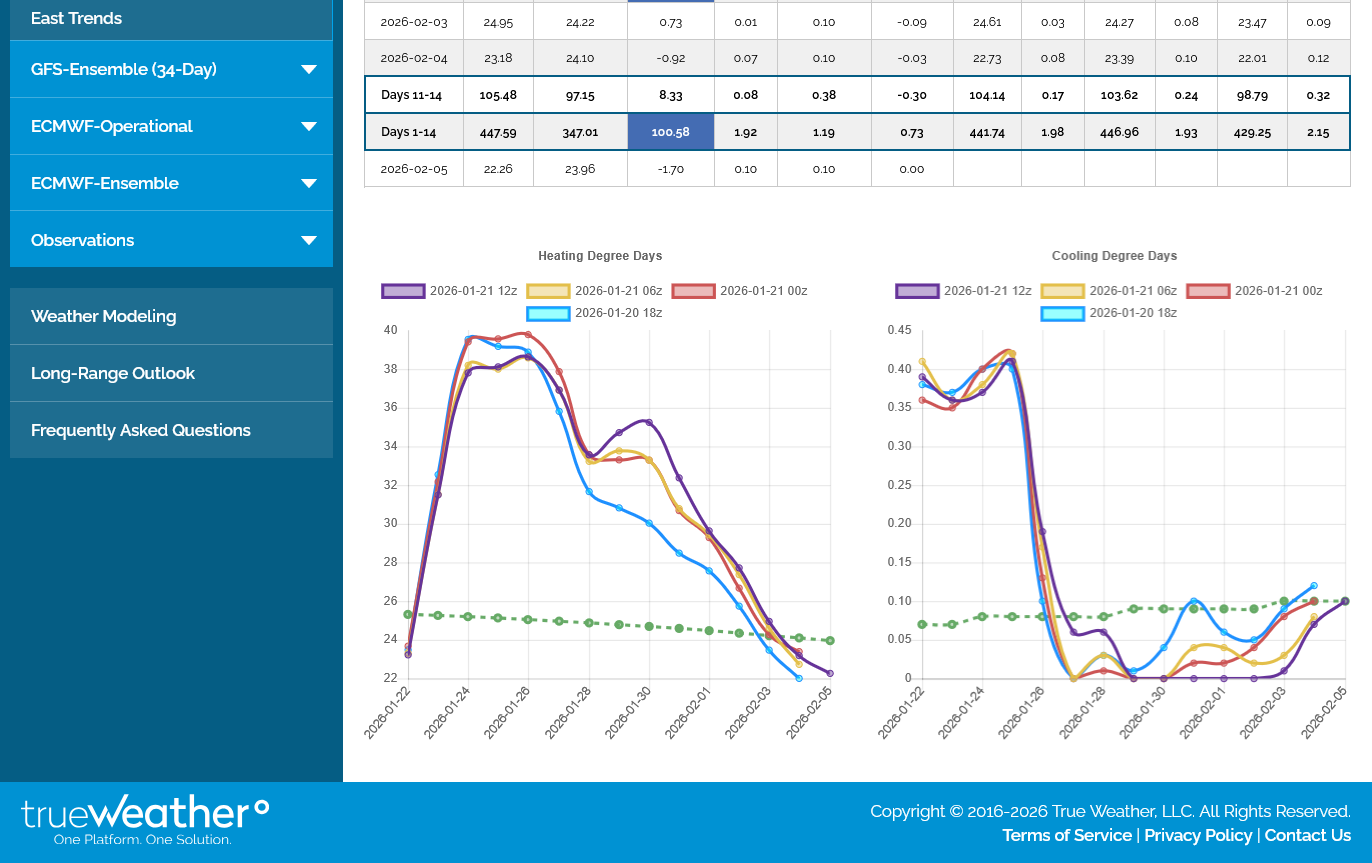
The 12z European Ensemble model below was a whopping +16 HDDs compared to the previous 0z run 12 hours earlier which is pretty dang bullish so the ng market will probably open higher (sharply higher) tonight but the LATE week 2 pattern is still the same......straight down so it's questionable how long this extreme cold near term weather will keep the market up this week. The EE had 2 separate surges of Siberian blasts that spike the HDDs higher.

By metmike - Jan. 18, 2026, 4:35 p.m.
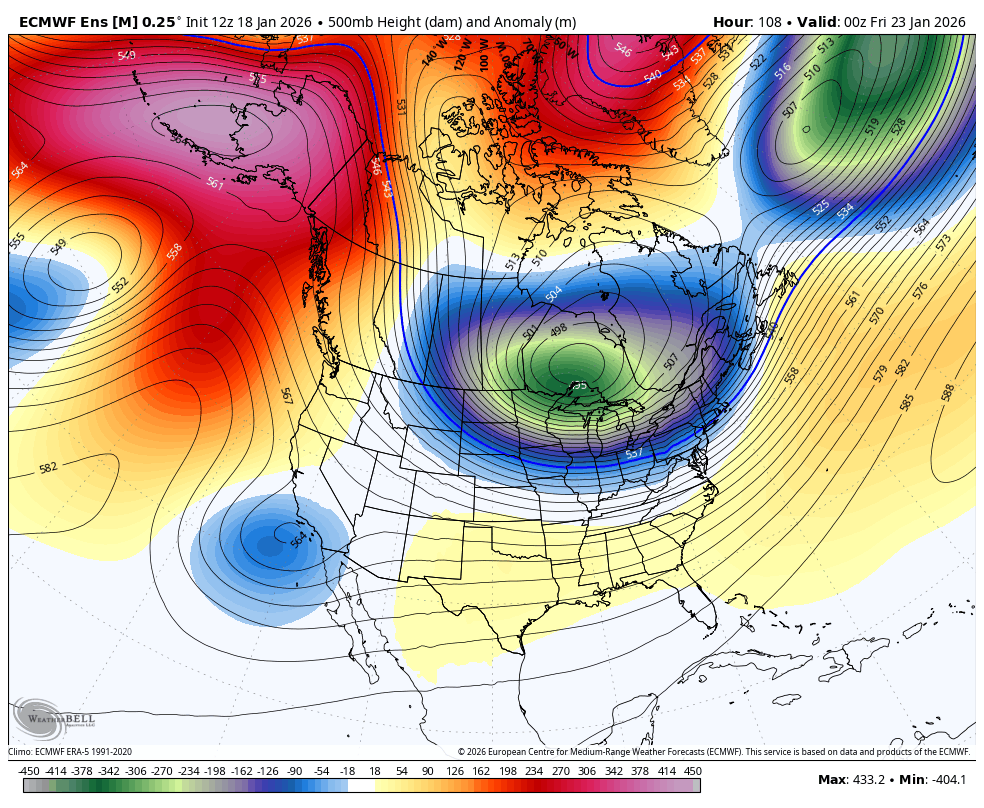
The reason for this frigid weather is that the Polar Vortex has become dislodged from it's usual location in the high Arctic.
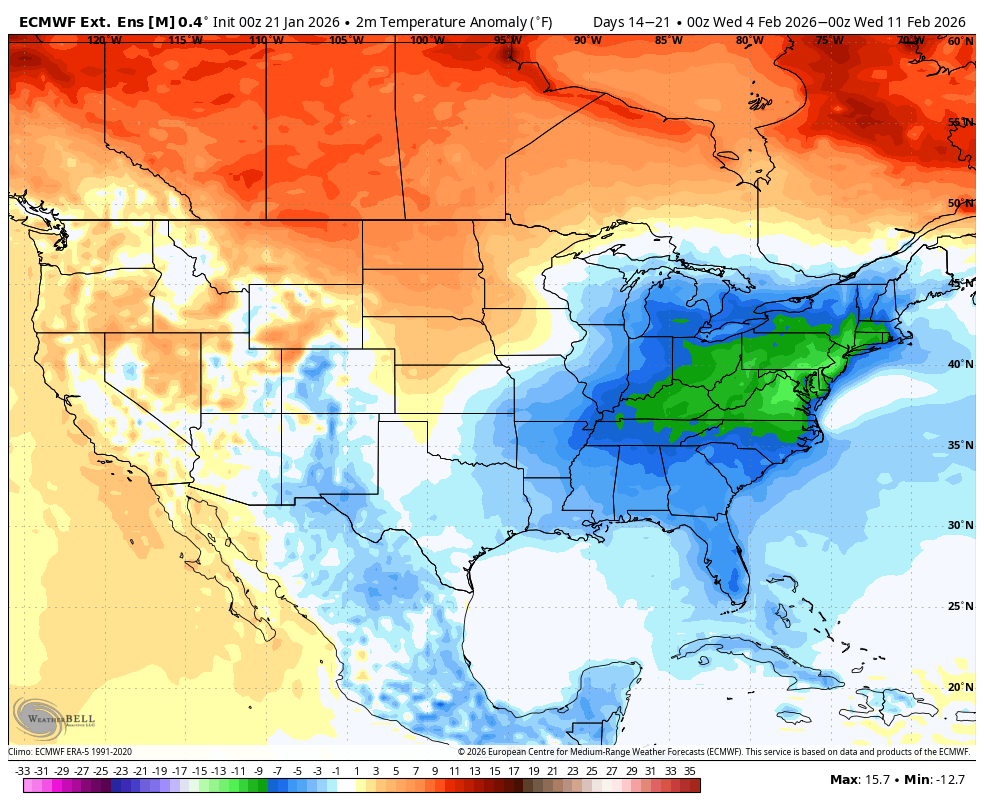
There it is this Thursday Night with a center just north of Lake Superior but a trough extended deeply into the US. The colors below show the anomalies compared to average. The colors in the Polar Vortex are to the very extreme left on the color bar chart below.
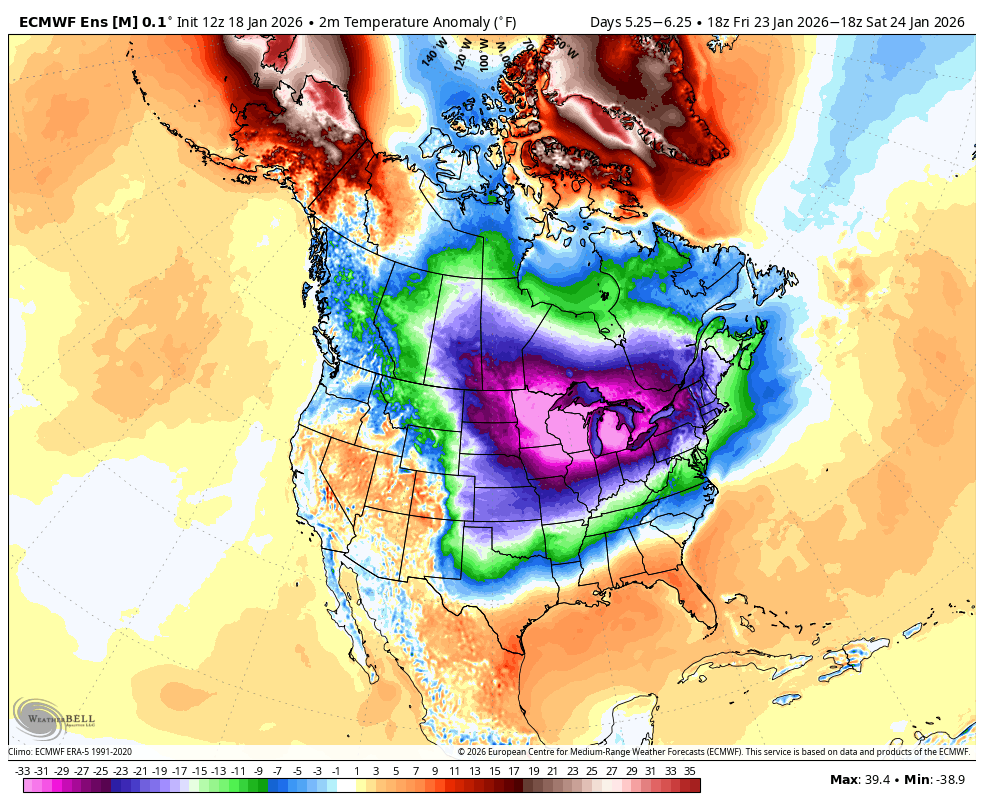
These are the temperatures compared to average on Friday. Note that the center is the coldest color bar possible because the color bars don't go any lower than -33 Deg. F below average.
Some of those places will have highs Friday of near 40 Deg F BELOW average!
Let's try to see how this huge, surprise higher gap on the price charts looks, on the polar vortex dropping 1,000 miles farther south on the forecast maps over the weekend).(I contend that we will likely fill it when this cold is dialed in fast, unless it sticks around longer than 10 days).
https://www.marketforum.com/forum/topic/83844/#83851
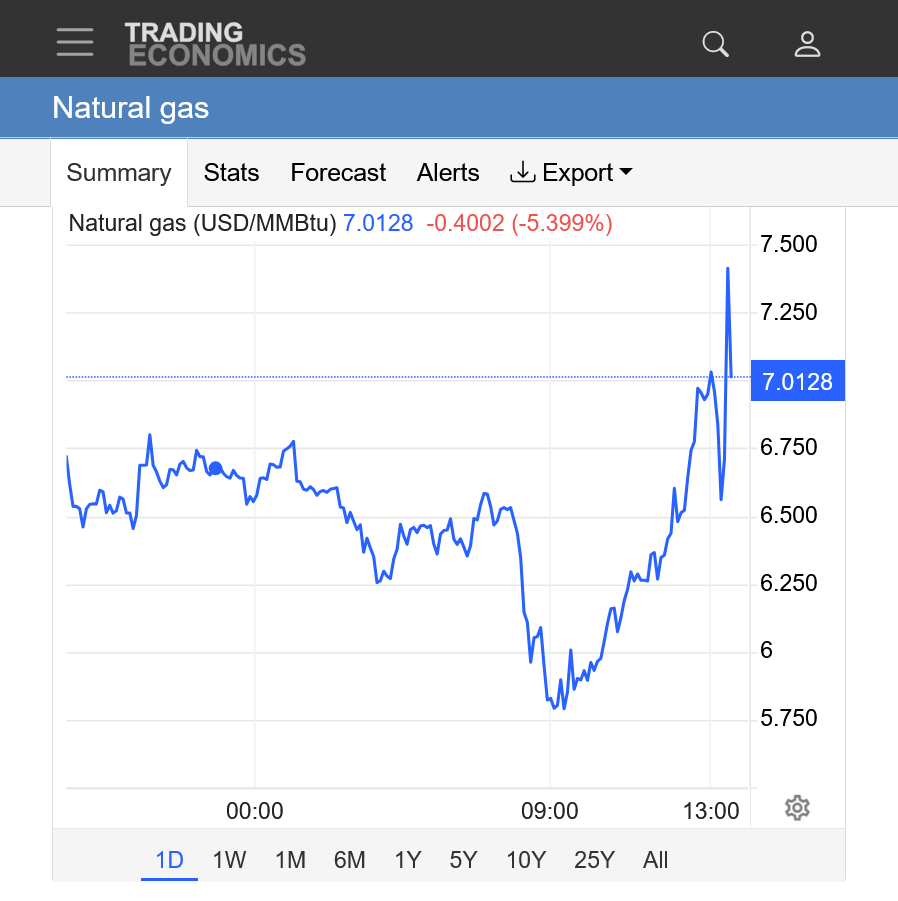
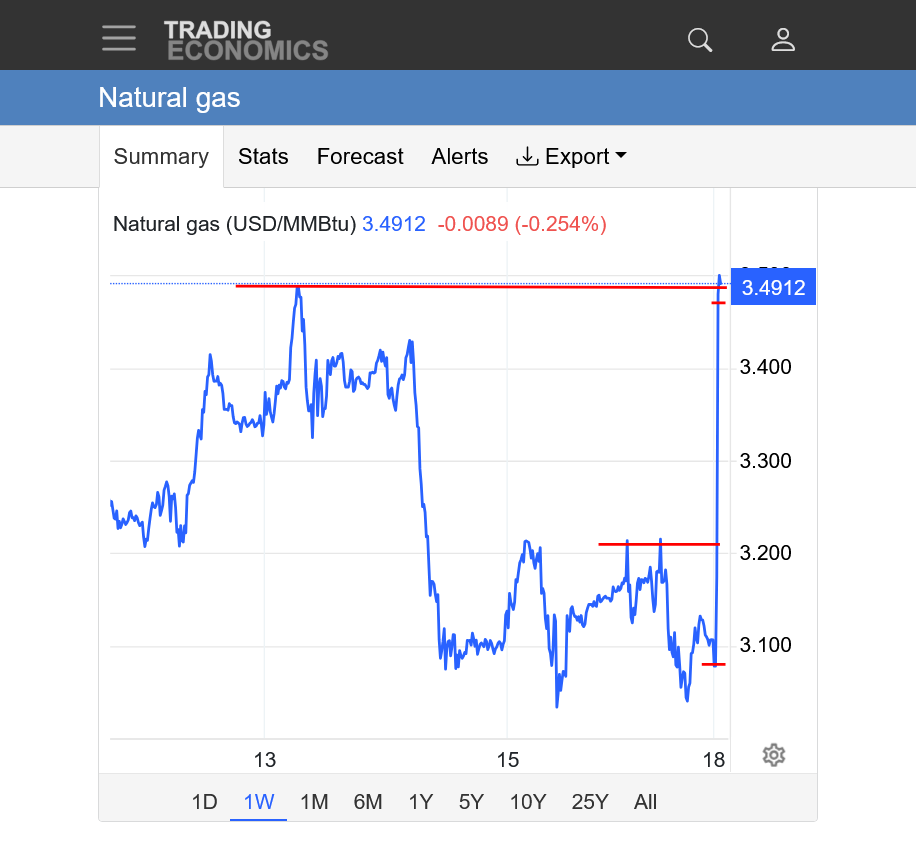
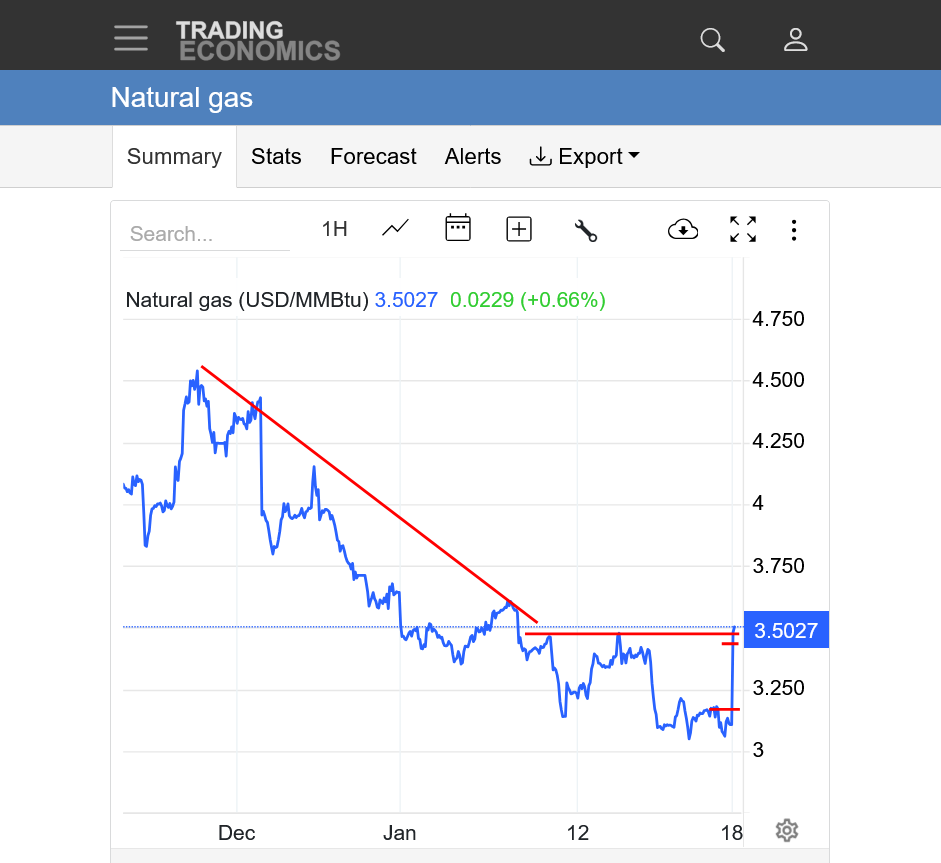
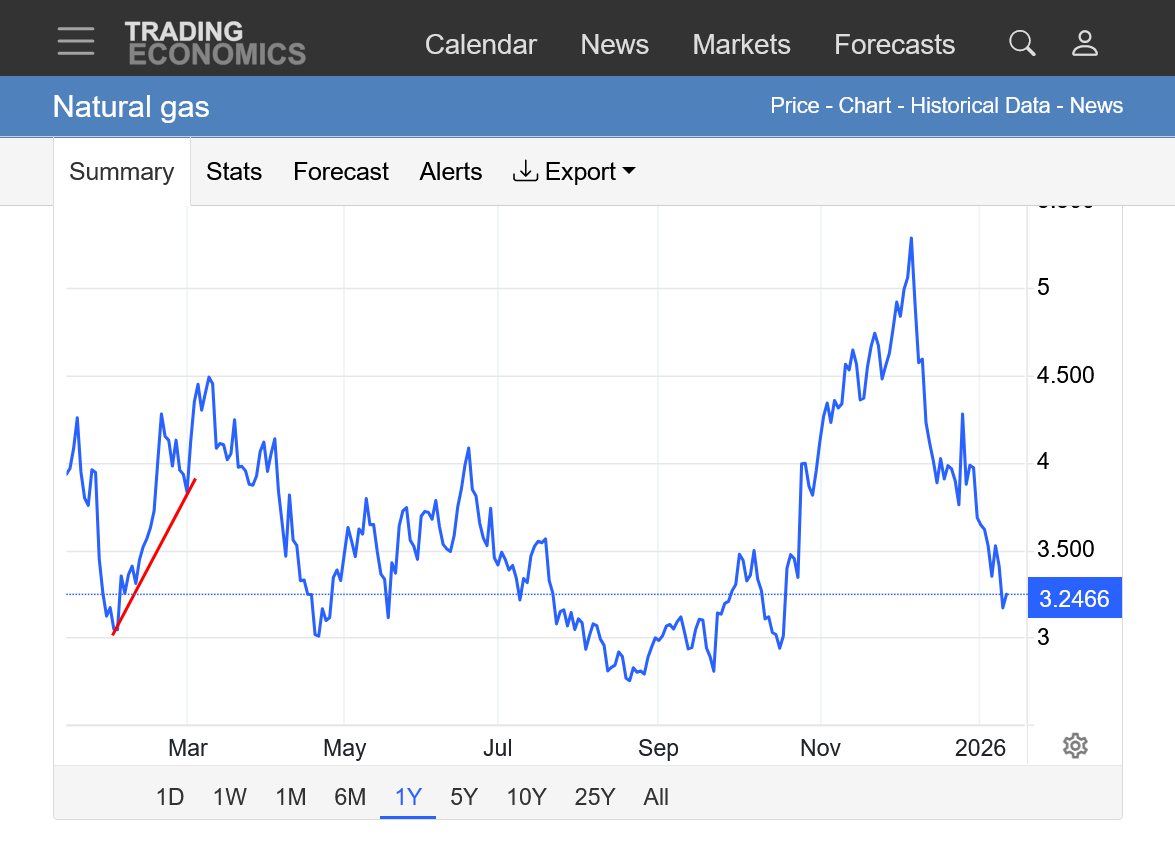
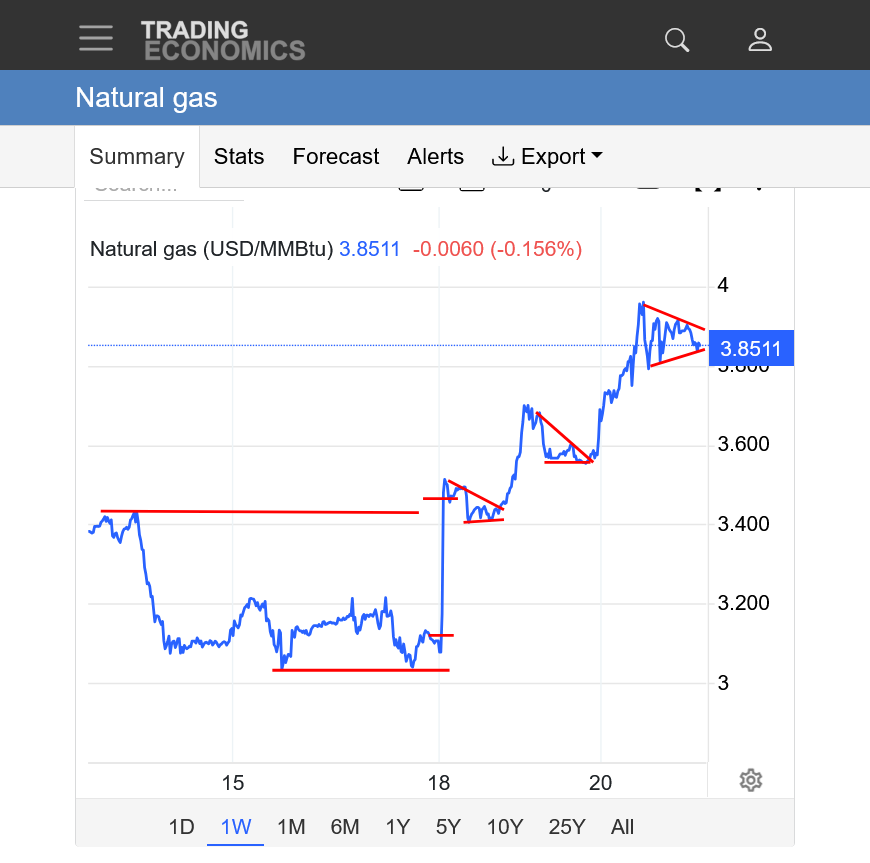
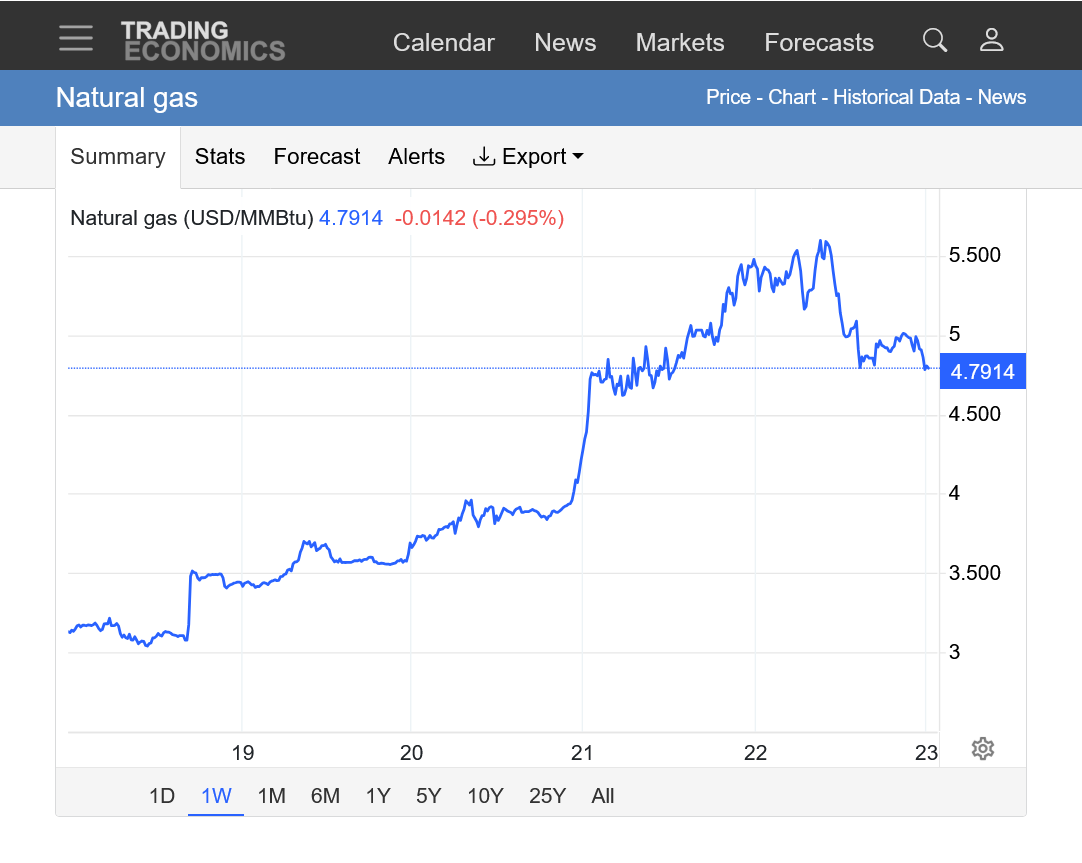
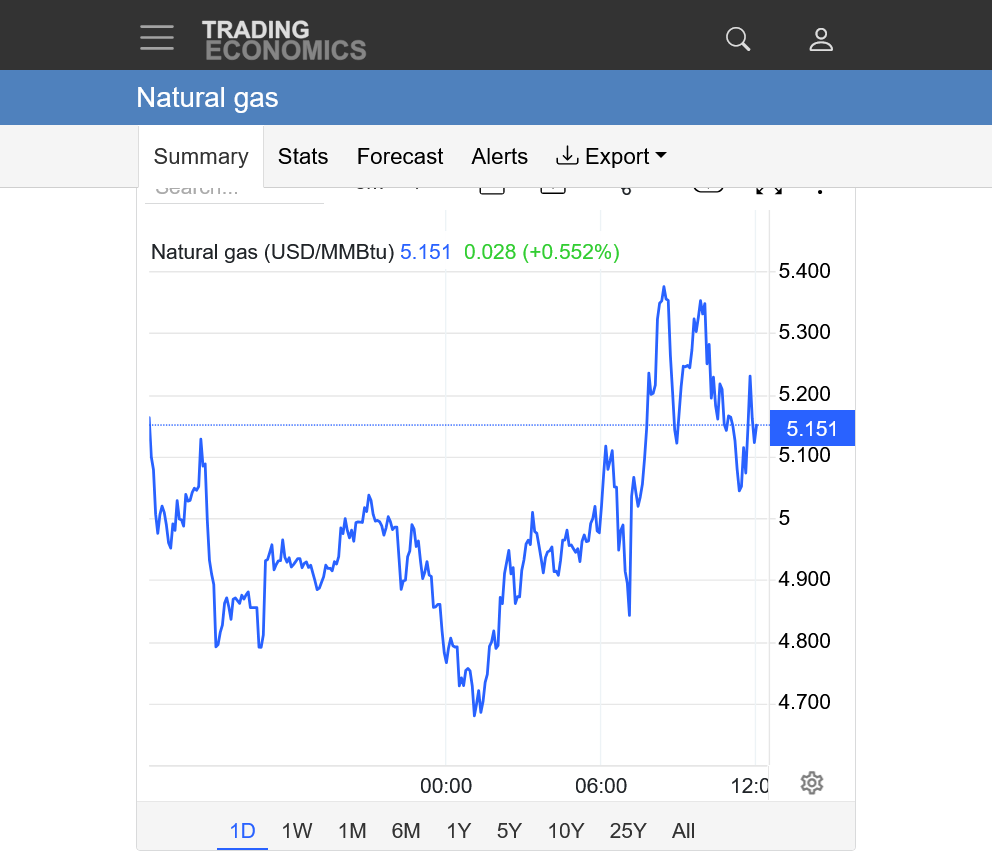
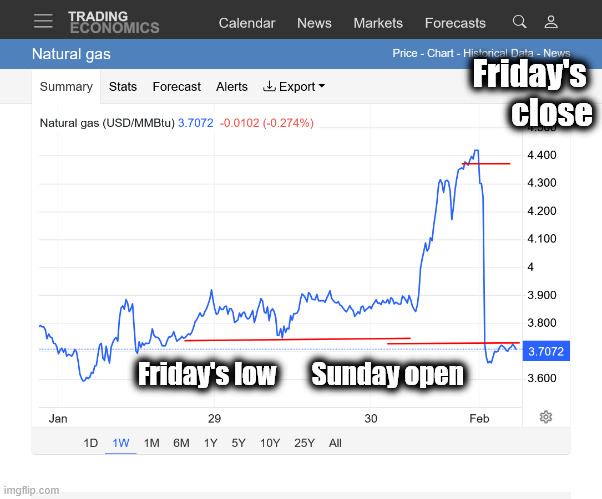
1. 1 week; Bottom, short red line was the Friday close. Top short red line was the Sunday open. The long red line was Friday's high. The gap between the Fri high and tonights low/open is the DAILY gap higher of over $2,500/contract. The long red line at the top was last week's high. This was NOT a weekly gap higher but we got $500/contract above those highs earlier and are now just below them.
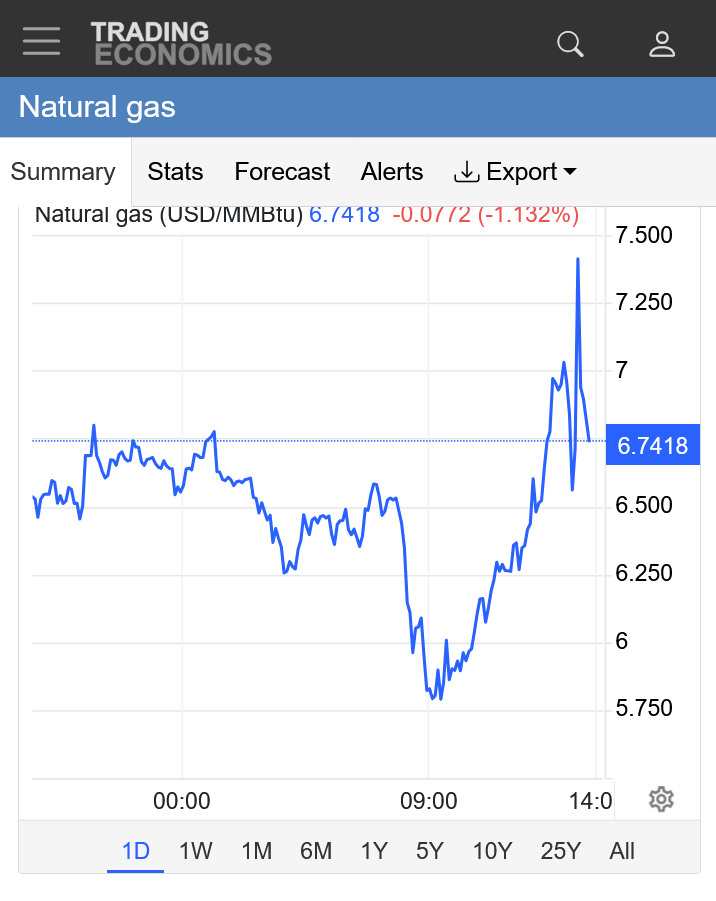
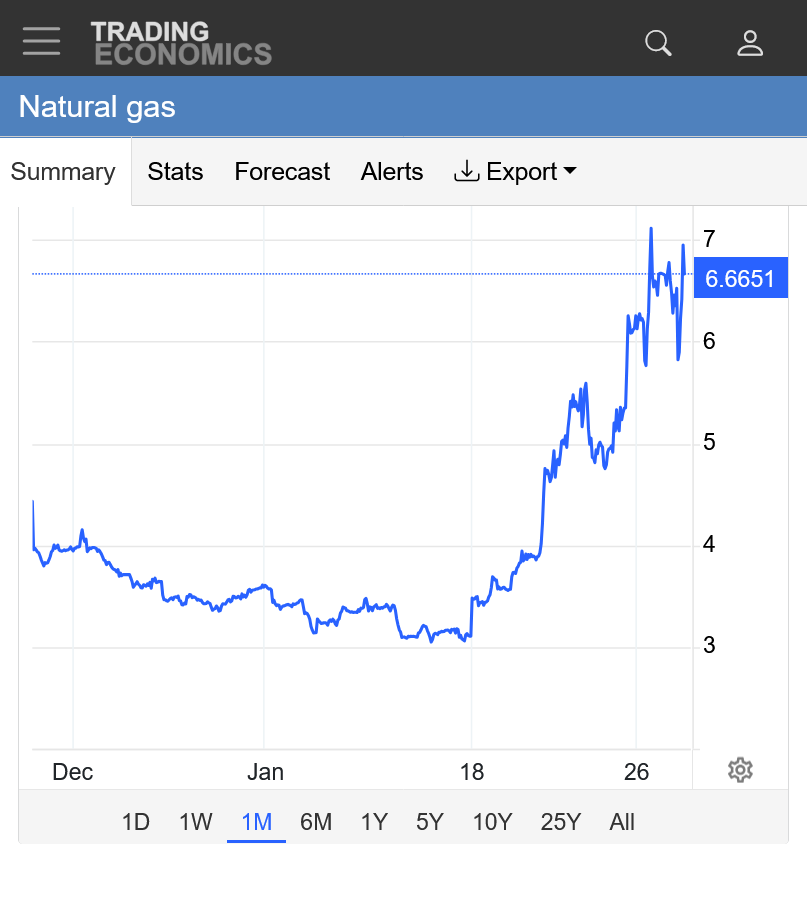
2. 1 month: After a sharp drop o $15,000/contract in a month, this could be several things. Potential double bottom last week just above $3. This would be 2+ months early for the seasonal bottom. If this pattern does not end after 11 days, then that becomes more likely. If it does end and we go back to mild, then this will be a bear flag and shorting opportunity as we fill the gap and likely go back down.
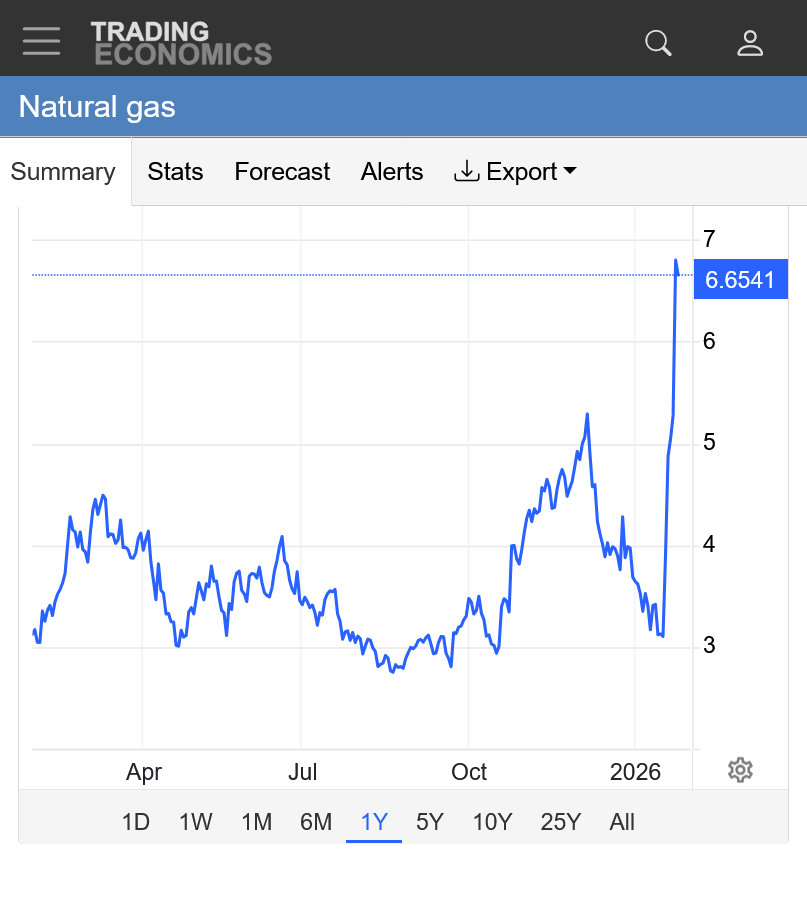
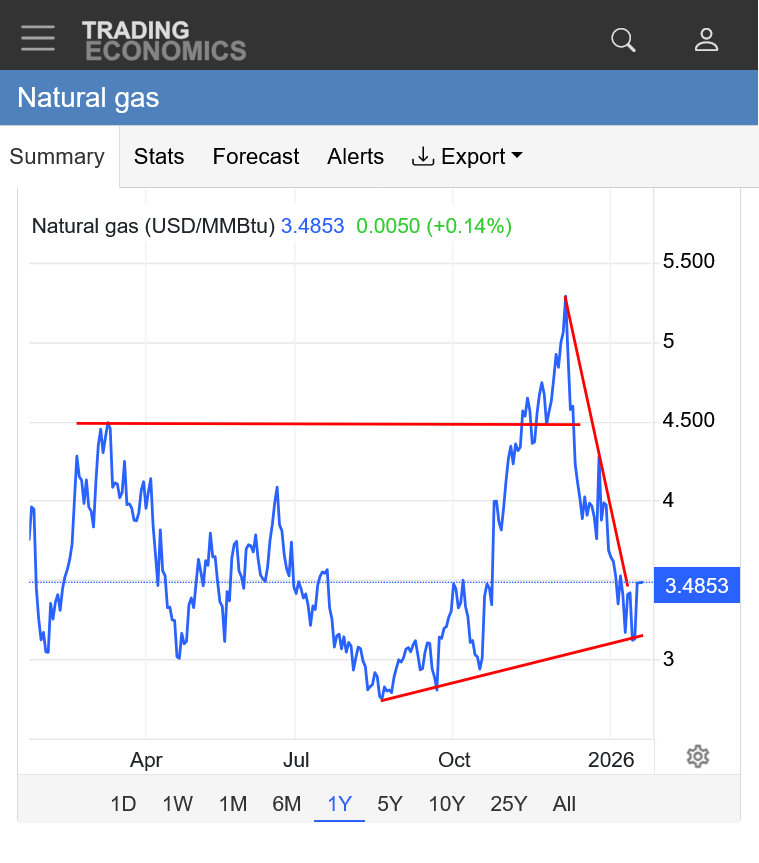
3. 1 year: Alot of stuff going on, including a symmetrical triangle with higher lows(from the August/September lows and last weeks HIGHER lows) and SHARLY lower highs as we dropped $20,000/contract real fast after the blow off top in early December.
The horizontal line was the fake upside breakout above the March 2025 highs.
Tonight's price is +$4,000/contract compared to the closes on Friday and looks HUGE on the daily/weekly but is still just a small glitch on the year that will be another bear flag and shorting opportunity IF the weather does what the weather forecasts indicate..........turn much milder with a HUGE patter change that will start the first week in February with ABOVE AVERAGE temps.
The February NG has been unable to follow thru with more gains and is on the lows after 1 hour. Typical of NG on Sunday's open, we saw an initial OVER reaction to a huge change in the amount of cold(heat in the Summer). What happens is that everybody suddenly has the same idea at the same time and there aren't enough orders on the other side to fill it unless the market goes very deeply into the depth of the order deck, in this case, the amount of buy at the market orders were massive enough that the price had to open $4,000/contract higher to match up enough sellers with those buy at the market orders, RIGHT AT THE OPEN!
We're off the highs by $900/contract and if I had guts, selling earlier would have already paid some profits but the cold coming up is pretty dang extreme. It's impossible to know that all of it got dialed in with 10 minutes of the Sunday Night open.
I'm not going to get carried away over analyzing based on 1 hours worth of market reaction. When we get more weather model updates, then there will be new information. The warm up is still 10+ days away. Too far away to declare we aren't going even higher first.
IF, IF i had had the guts, I would have had my friday 345 pm cst CALL!
Market was ripe for BOUNCE and 'weather' goof.
Cycle was extended for a low!!
tjc,
I moved your natural gas posts in the weather thread to the natural gas thread:
++++++++++++++++++++++++++++++++++++
By tjc - Jan. 18, 2026, 8:19 p.m.
OK, Larry and MetMike---why were you not long late friday afternoon??
+++++++++++++++++=
By metmike - Jan. 18, 2026, 9:14 p.m.
Thanks, tjc!
1. I have chess practice T-W-Th-F the last 2 hours of NG trading with 5 different schools I coach at until early April so I can't monitor the market.
2. I have not held a position over the weekend in NG for over a decade.......even on non chess days.
3. I've just been day trading but the cool thing is that I can trade on margins that are just a fraction of the overnight margins. They are just $1,000 for each contract of ng. If I want, I can trade double digit contracts with an account that isn't big enough to do that...........but MUST be out before the close.
4. I actually thought about a few contracts long but for the same reason that the market was not this high on Friday, there wasn't enough evidence to have confidence that the polar vortex was going to do this. If there had been, NG would have been sharply higher on Friday.
5. I'm way past playing the should have, could have and only if I would have done this or that game. For every, "if only I had done this" there's just as many "good thing I didn't to that's". This is the exact WRONG mentality to have for a professional trader. We accept the consequences of decisions, learn a lesson if there is one, then move forward with a clear mind. Failing to do this is the downfall of traders that think they have to get back a loss. Or that use emotions too much(However, as you know I do suffer from not pulling the trigger on some trades because I have too much fear-I don't count this one as being that).
Holding a position over a weekend is taking an unnecessary risk that I don't want in my life anymore. I can get in and out with massive positions from Sunday Evening thru Friday Afternoon and I'm cool trading that way. In the past I was mainly a POSITION trader and that was awesome, especially before my 6 figure account was stolen on October 31, 2011 at MFG by Jon Corsine, then the new one I opened at PFG Best with borrowed money and the returned MFG money was stolen again in July 2012 by Wasendorf.
MFG Bankruptcy
https://www.congress.gov/crs-product/R42091
PFG Bankruptcy
https://en.wikipedia.org/wiki/Peregrine_Financial_Group
++++++++++++++++
Regardless of the response, that was an outstanding question.
If I believed the coldest model on Friday, the Canadian model than this result was a distinct possibility. This was the last run of the Canadian Ensemble at mid day Friday on day 8, over 4 hours before the close:
https://weather.gc.ca/ensemble/charts_e.html?Hour=192&Day=2&RunTime=12&Type=gz
You can see numerous members of the ensemble were pretty bullish with the unusually far south Polar Vortex. However, the warm up after that was looking pretty big and ng has only gone up on days when the models get MUCH colder for the past 5+ weeks.
++++++++++++++++++++=
By tjc - Jan. 18, 2026, 10:36 p.m.
Sorry MetMike, my Q did, in retrospect, come off as most critical.
I guess I am trying to point "mere" weather is not the only trading criteria.
1. Grossly oversold 2. Daily cycle timeframe for low 3. Weather "baked in"? 4.Low RFSI and Percent R buy
Eventually, models predicting cold had to win out??
The next best question is: Will cold prevail long enough to allow more than a Sunday night blimp?
+++++++++++++++++++=
By metmike - Jan. 19, 2026, 1:40 a.m.
No problemo tjc!
You are exactly right that there are other factors besides weather but I disagree with you about them being bullish.
It's the exact opposite in my opinion.
As mentioned numerous times last week the market UNDER performed on cold weather because of those bearish items. (Seasonals/supplies jumping much higher vs last year/strong trend down after the blow off top early last month).
If not for the Polar Vortex coming much farther south this would not have happened tonight.
As as you just witnessed (again) for the umpteenth time this evening, the market continues to struggle to hold gains when not being hit hard by much colder weather.
We were over $1,500 off the highs a short while ago before the 0z GEFS AND Canadian model came out colder again.
If that's not weather, I don't know what is. At times when the models don't look as cold, almost every single time the past 6 weeks, the price went down, sometimes hard.........and it just happened again this evening before, again those 2 models came out colder.
So instead of the market being independent of weather as you suggest, its actually reacting very strongly to the weather with a bearish bias superimposed. Any time the weather is neutral, the market goes down. When the weather is bearish it goes down faster. When the weather is slightly bullish, it struggles to maintain gains. When its very bullish, the market goes up. The polar vortex doesn't go this far south too often so the next 10 days are almost as bullish as it gets for the Midwest where the high population centers will be burning massive amounts of natural gas.
After the very cold 0z models stopped the dropping (-$1,700 from the highs), the 6z GEFS lowered the boom again in purple with the coldest run yet, +7 HDDs from the already frigid 0z GEFS and a whopping +14 HDDs above the last 12z Sunday run that the model had when we opened up yesterday evening!
The trajectory in week 2 is still undeniable but the amount of cold is even MORE extreme and the market is paying close attention!
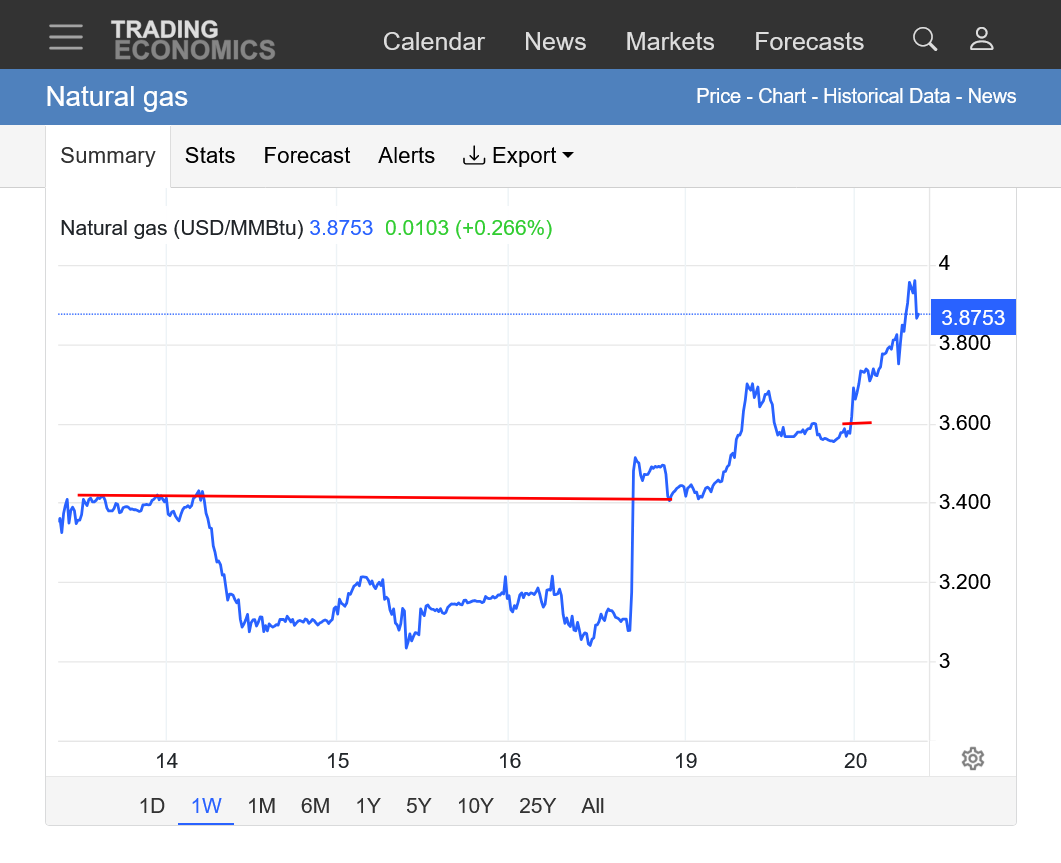
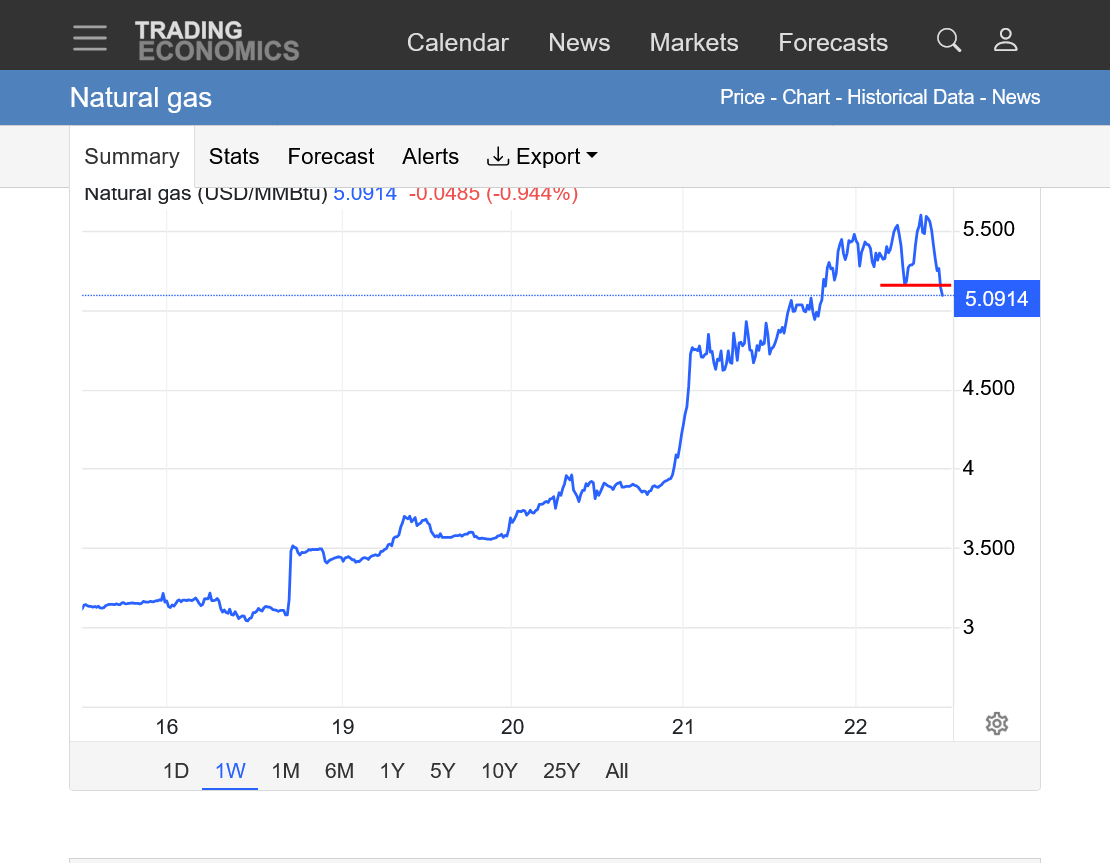
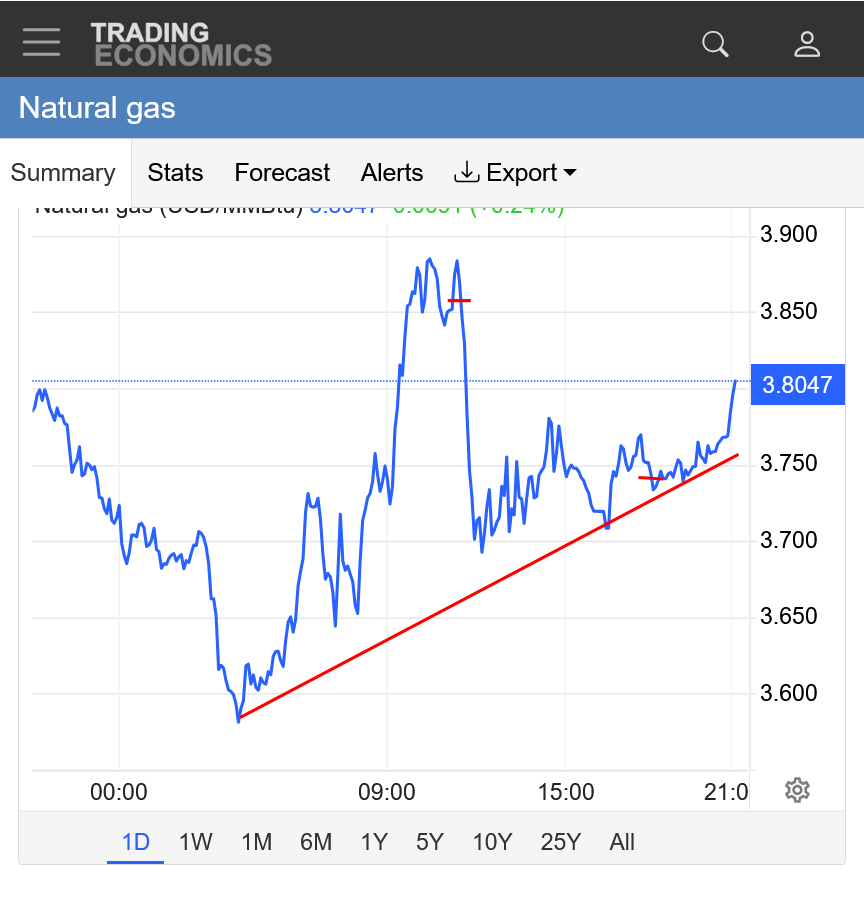
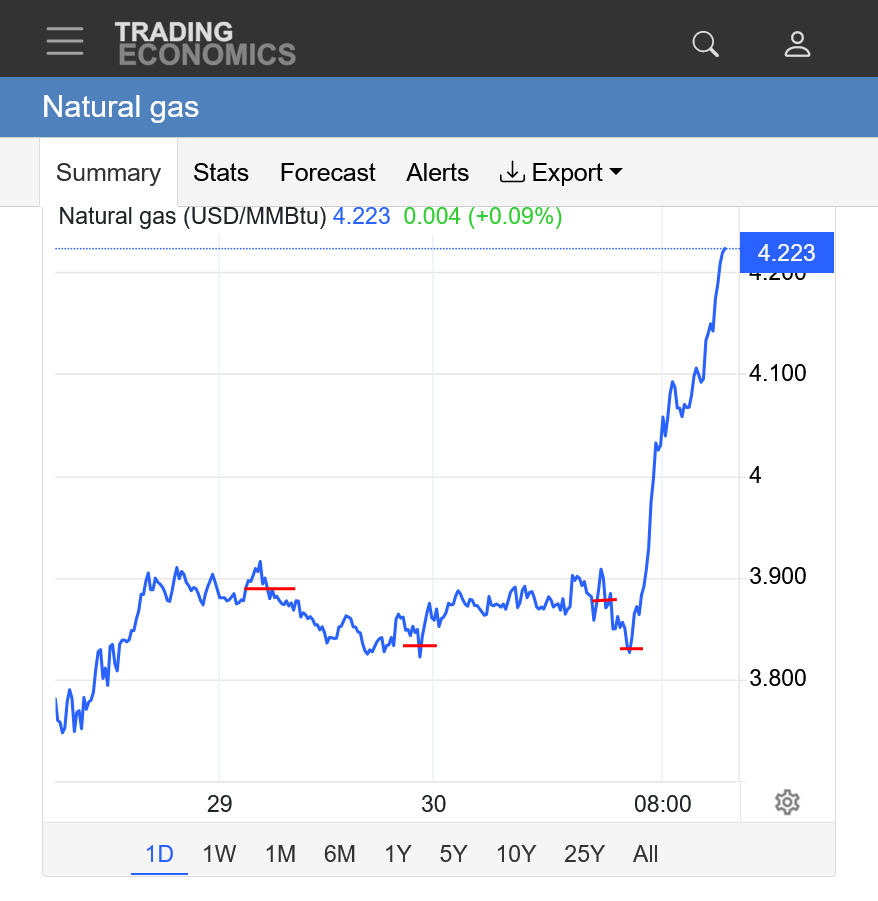
https://tradingeconomics.com/commodity/natural-gas
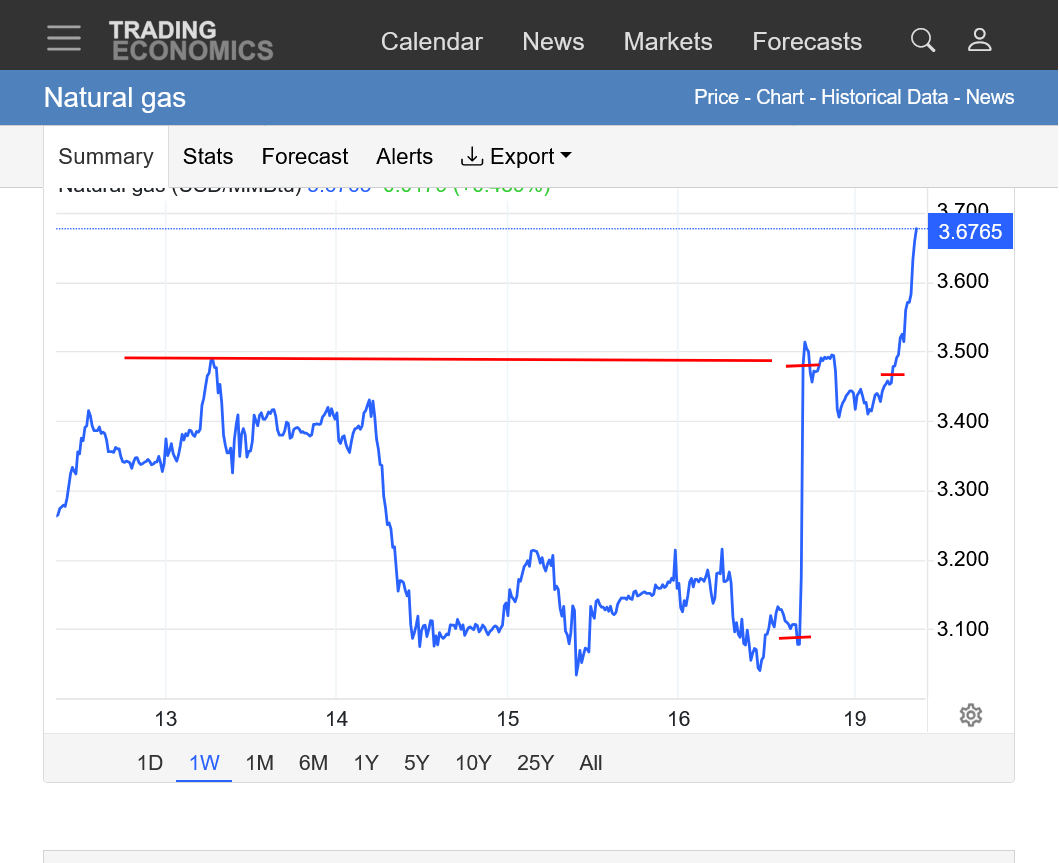
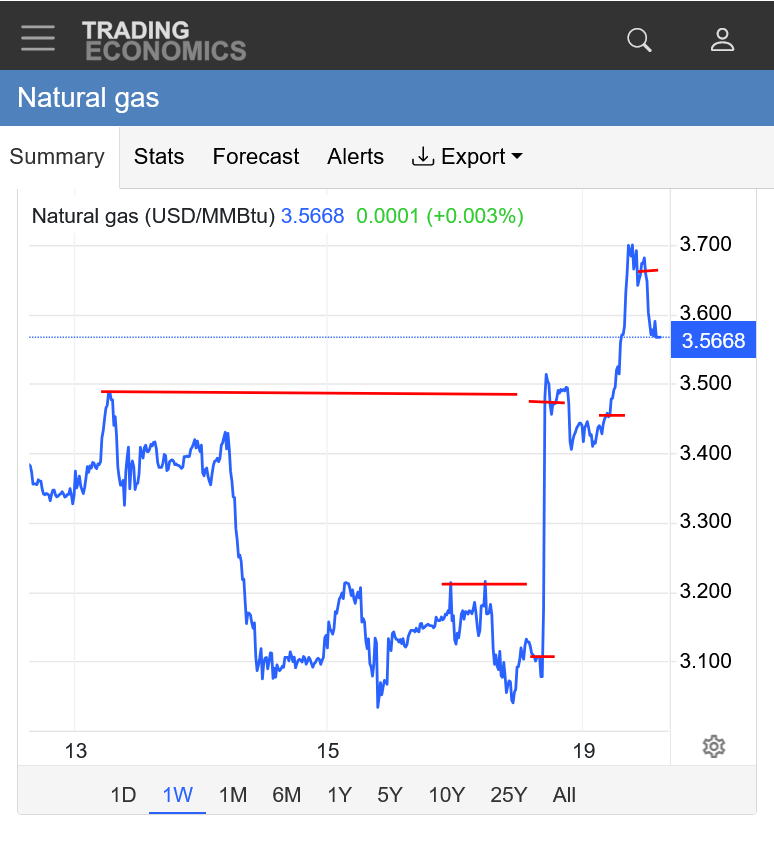
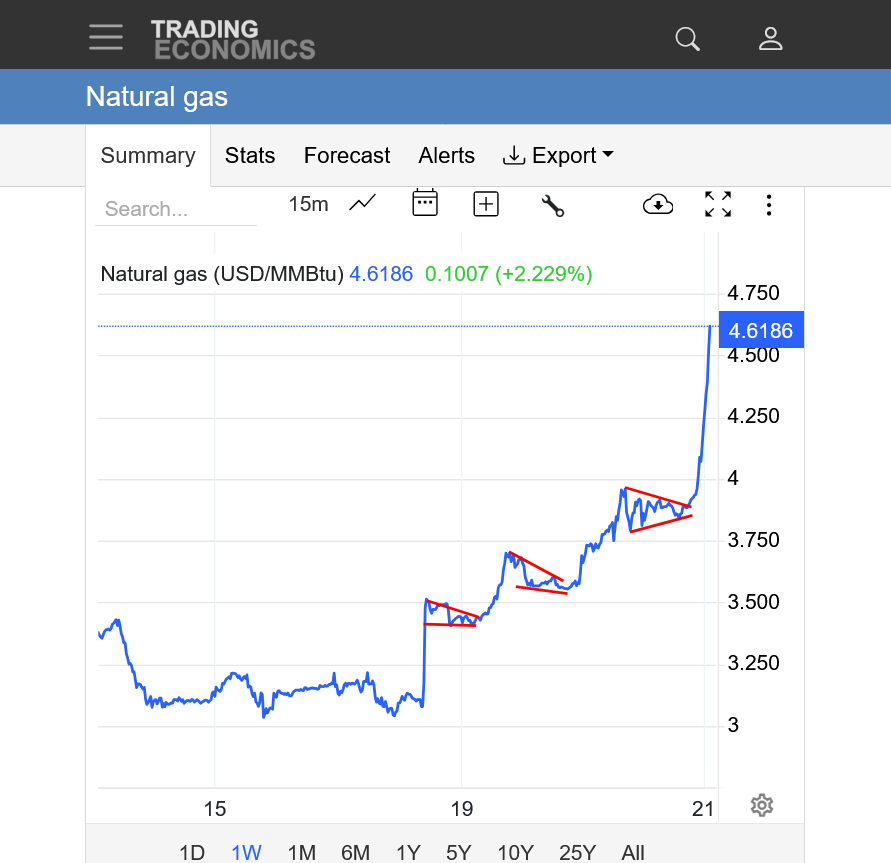
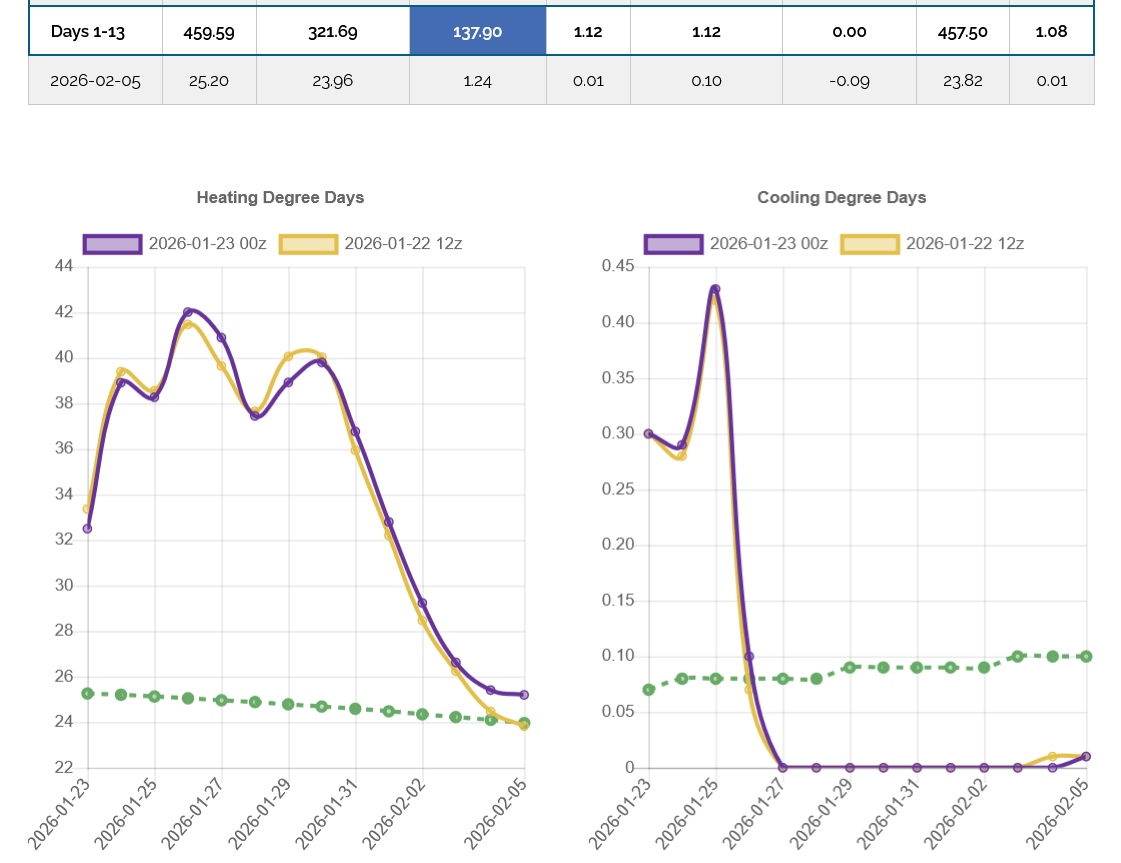
1. 1st short red line=Fridays close.
2nd short red line=Sundays open(HUGE GAP BELOW)
3rd short red line=06z GEFS model coming out even COLDER
Long red line=last weeks highs. We broke out above those with the last colder run.
True enough---Ngas making new highs as I type!
Also, Feb leading March, which is totally logical.
My perception IS you(Larry) will be focused on timing the next price level to SELL.
Bull spread even at apex? Bull spread working on way up (cold)! Feb expires 28 Jan
Thanks, tjc!
Your timing for the low last week was perfect but needed the Polar Vortex to cooperate.
BTW, Larry stopped trading several years ago because the extreme, sometimes unpredictable gyrations from big traders using algorithms were making it too crazy(this is making it almost too crazy for me too) and it has greatly curbed my actions.
You are correct about wanting to sell but if I had not been up to 2:30 am, maybe I would have bought shortly after 5am when the coldest yet 6z GEFS came out? Probably not but the dang cold 0z run before that had me extremely tempted but I just couldn't do it.
Jut sharing my overnight thoughts.
Here's another one. If I had been long over the weekend and had the massive pay day on the open, there is NO WAY, that I would have stayed long for the $1.700/contract downside correction after the early evening high(before the models turned EVEN COLDER overnight).
1. Yeah, tjc, as MM said I haven’t traded in several years. I don’t know if/when I’ll resume, but it’s probably a bit more than likely to some extent.
2. It’s currently up 19%!! When was the last time it was up anywhere near that much intraday? Are we talking years? That’s my guess.
Gentlemen
Thank you both for very prompt replies.
Mike, I can tell you as recently as last week---WHEN one gets an INSTANT winner, you MUST take it, OR AT A MINIMUM, place stop!
Ngas 'intrigues' me, but it appears only available to weather geeks with the very best weather technology!
Crazy for sure today!
Up almost +$6,000/contract!!!
Makes the -$1,700 correction last evening look like a gift/buying opportunity, which put us up less than $3,000/contract.
Too many traders leaning to one side(short) the last month+ just makes the reaction to the opposite side that much greater from short covering.
That was one thing that tjc was looking at in picking the bottom, which in hindsight looks brilliant!
From a week ago(BEFORE the market(and me realized the Polar Vortex was headed this far south)
By metmike - Jan. 11, 2026, 7:47 p.m.
NG traders should never be short in April or May without a good reason.
NG traders should not be long the Feb/Mar futures without a good reason. Extreme cold early last year was the BEST reason to be long then.
++++++++++++++++
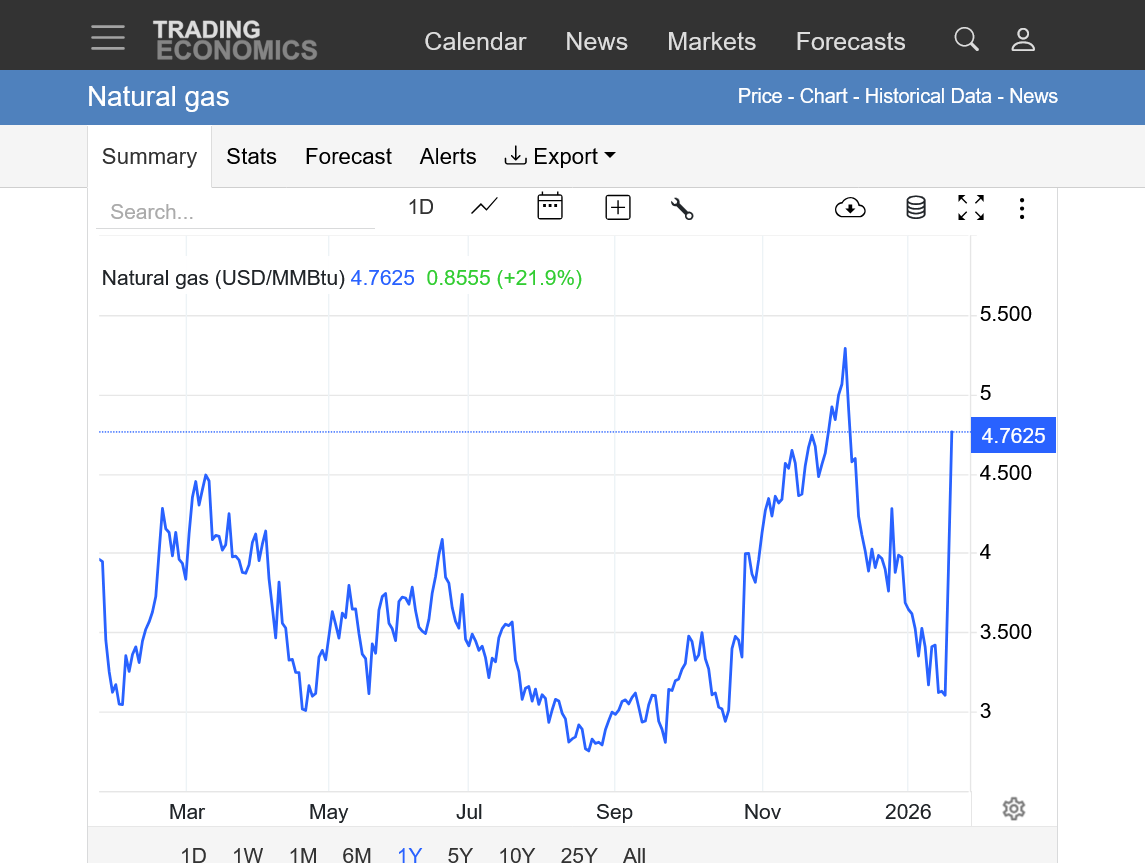
Here's the exact example of what it took last year. In 2025, there was a huge spike up between January 31 and the top on March 10 on the far left of this 1 year price graph.
Note the temperatures in Mid February last year!
https://www.cpc.ncep.noaa.gov/products/tanal/temp_analyses.php

++++++++++=
january 19, 2026: Similar impact this week!!! The change from high to low a year ago started at $3 and went to $4.5, so $15,000/contract but it took several weeks. No way am I saying this will be the same thing..........UNLESS the models keep extending the length of the intense cold. Then it WILL be the same thing.
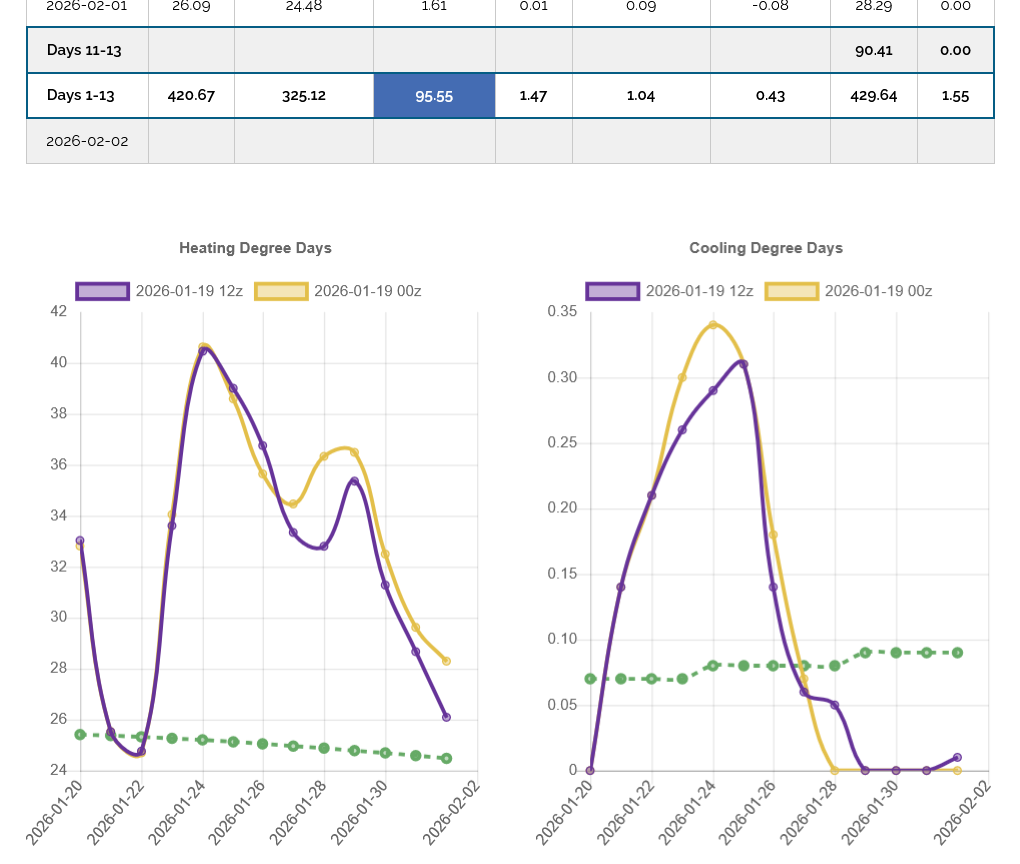
Not as cold 12z guidance........natural gas gives up gains. -4+ HDDs on the 12z GEFS. EE will be/was even less cold.
2:30pm. The 12z European Ensemble model below (purple/left) was -9 HDDs compared to the previous 0 run from 12 hours earlier. The market sold off over $1,000/contract when this was coming out.
++++++++++++++
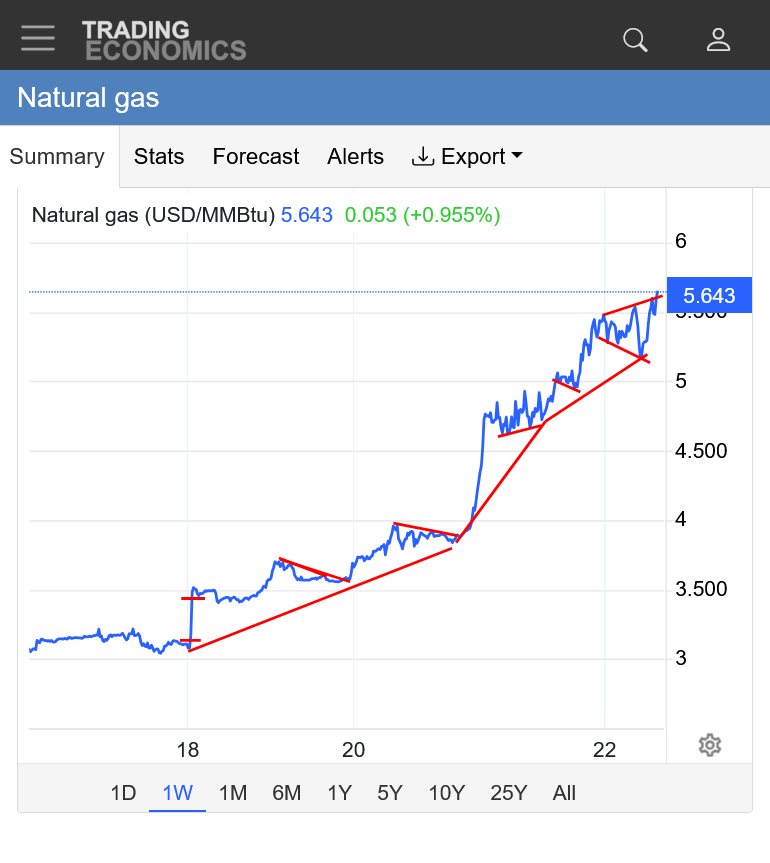
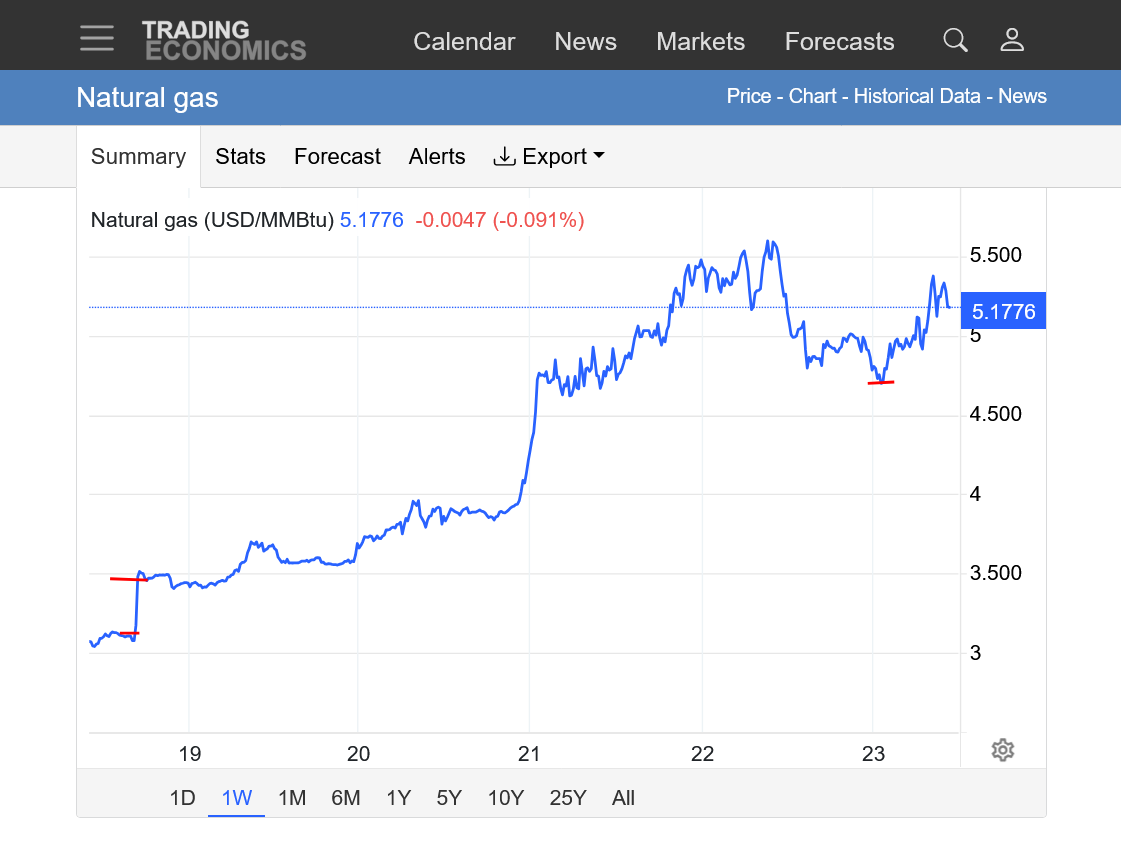
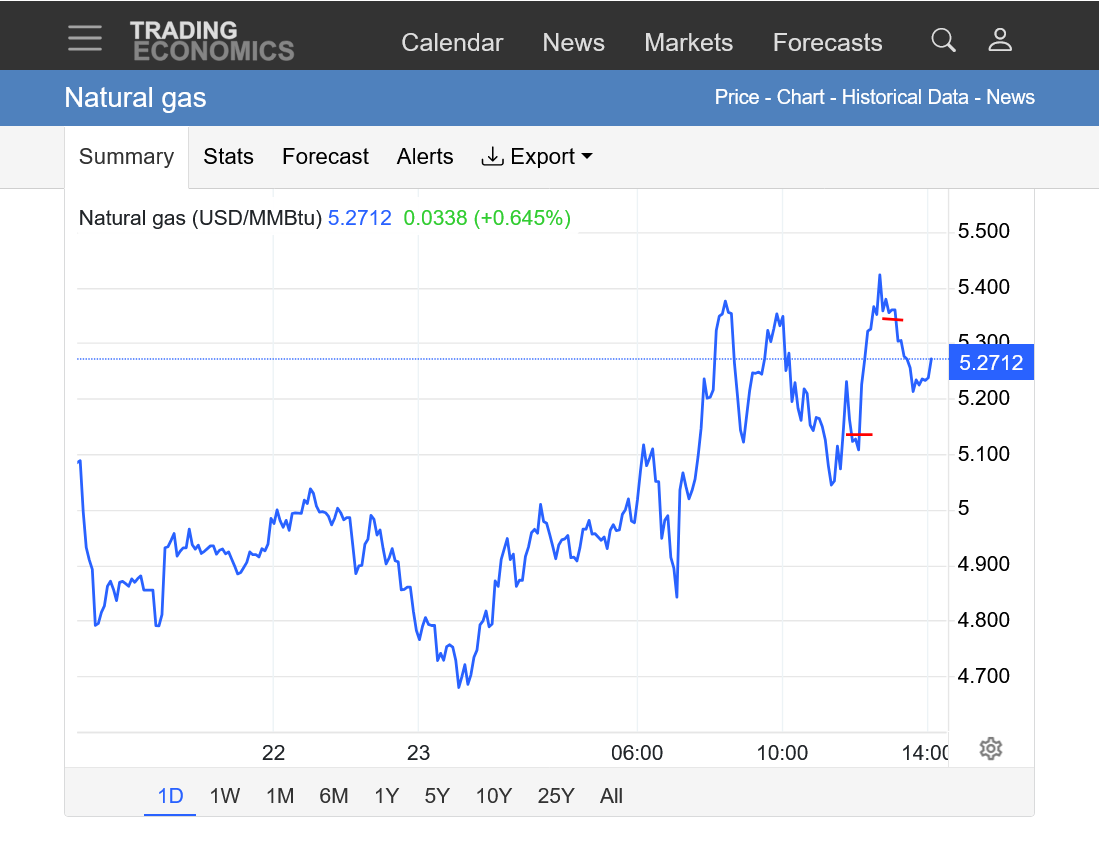
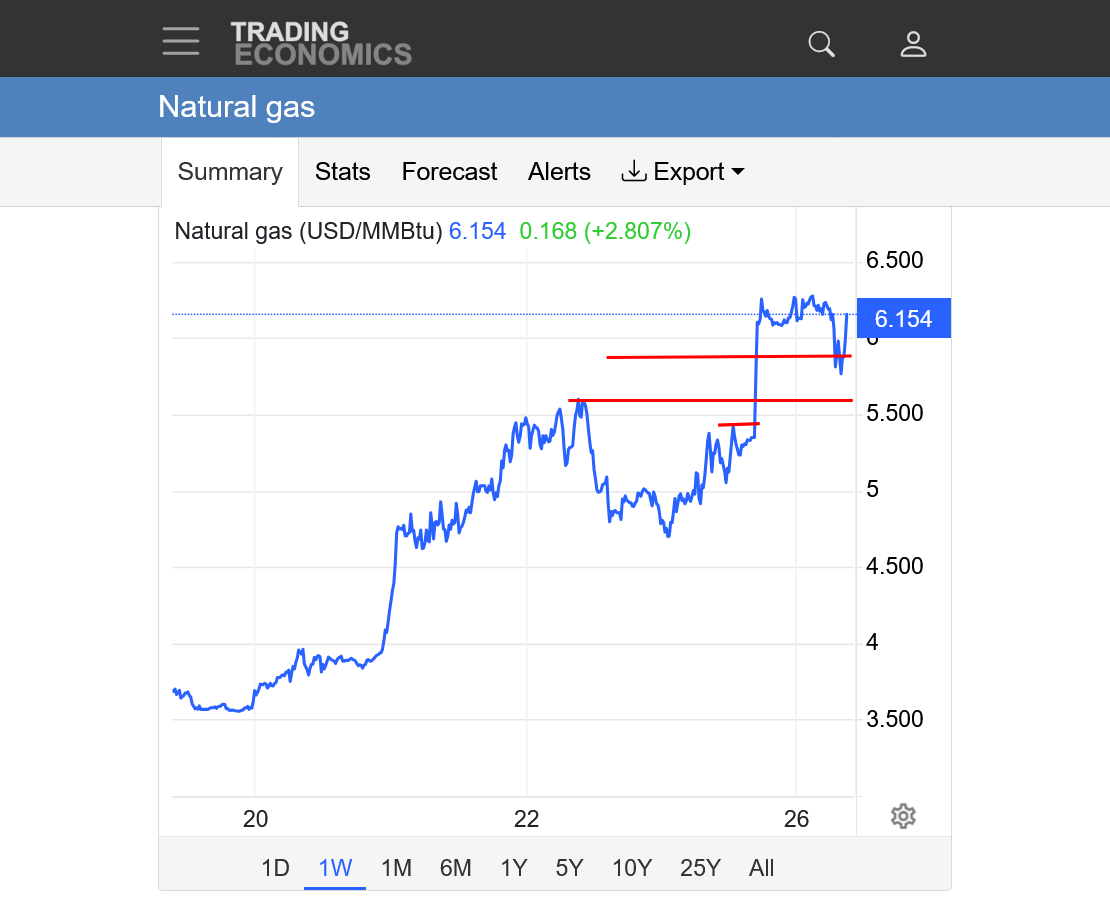
https://tradingeconomics.com/commodity/natural-gas
Lines everywhere. Long line below was the high Friday, above that the high last week.
Short red lines are, from left to right: close Friday, then open Sunday, then COLDER 6z GEFS run, then LESS cold 12z models shown above(last red line).
The market closed early, at 1:30pm today.
The longer range European model thats updated daily and goes out to early March cooled off the month February a great deal this afternoon. I'm not so interested in shorting unless the 2 week models have a huge milder change in any of the upcoming runs.
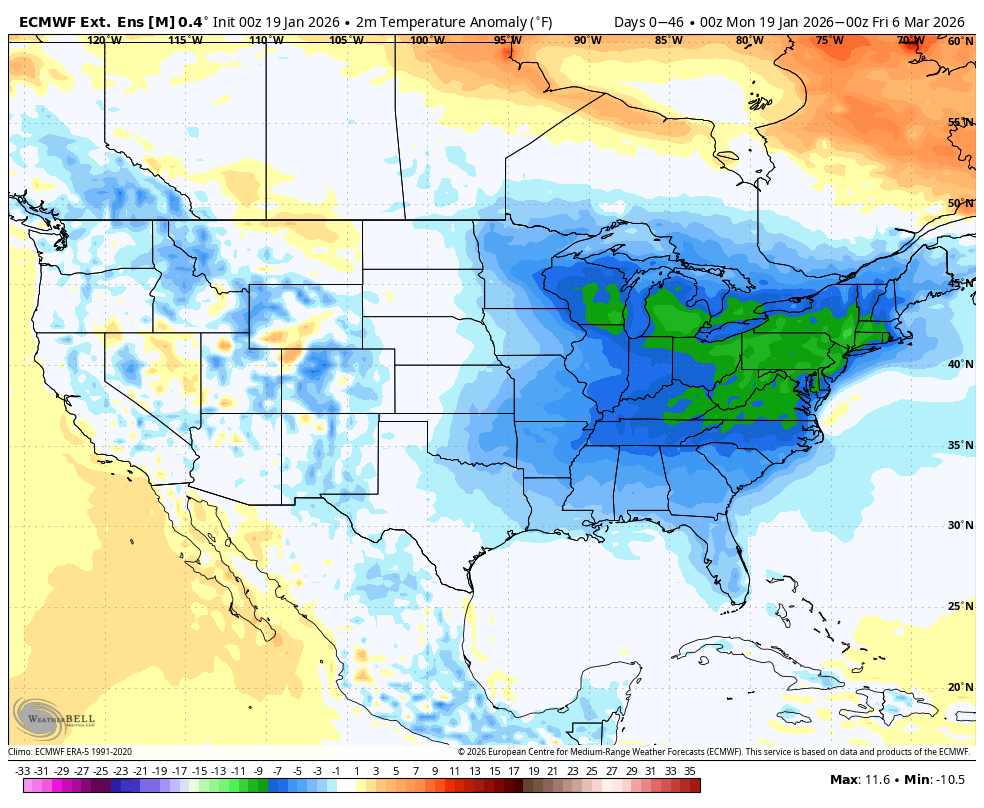
This was the last forecast for the next 46 days.
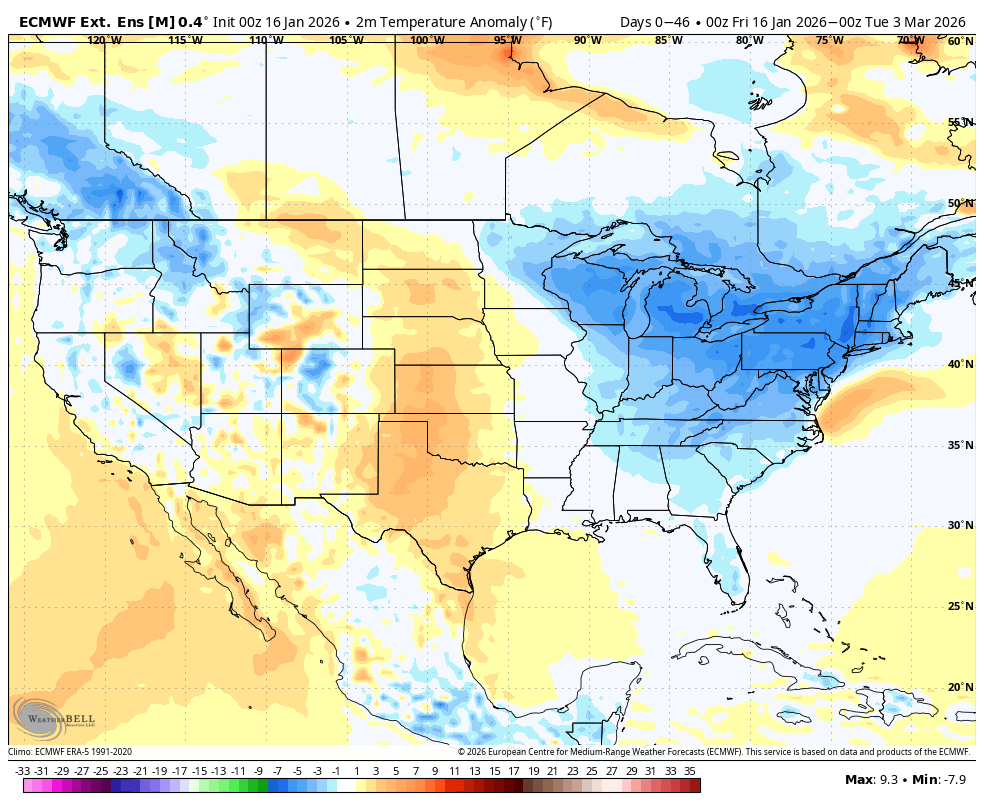
This was the same forecast last Friday, 3 days ago.
The models got COLDER again over night and NG added MUCH more to the gains, at one point in the spike higher earlier this morning it was +$9,000/contract compared to Friday's close.
The last 0z European Ensemble model in purple/left that started coming out around midnight(GEFS just before that) was another +12 HDDs compared to the previous run.
+++++++
https://tradingeconomics.com/commodity/natural-gas
Below, I drew just 2 lines this time.
1. Long red line was last weeks high
2. Short red line was when the overnight guidance came out colder yet just before midnight.
This sure fooled the models compared to late last week:
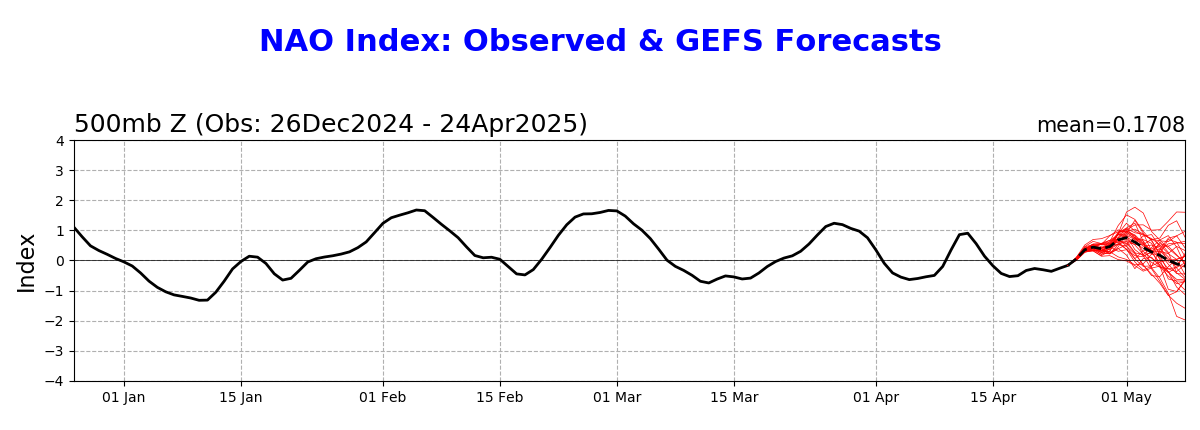
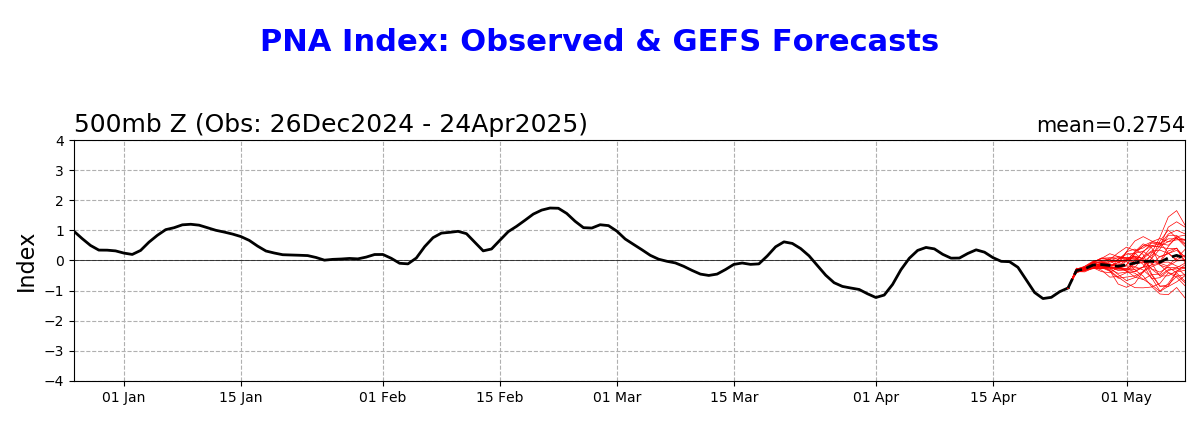
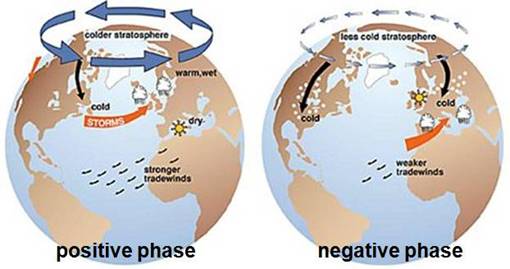
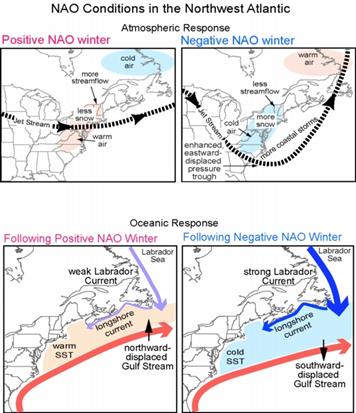
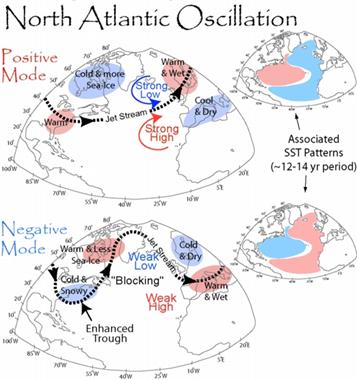
The magnitude of the ------AO not predicted. The -NAO was supposed to be +. The +PNA is also higher.
Arctic Oscillation Index, North Atlantic Oscillation Index, Pacific North American Index.
https://www.cpc.ncep.noaa.gov/products/precip/CWlink/daily_ao_index/ao.shtml
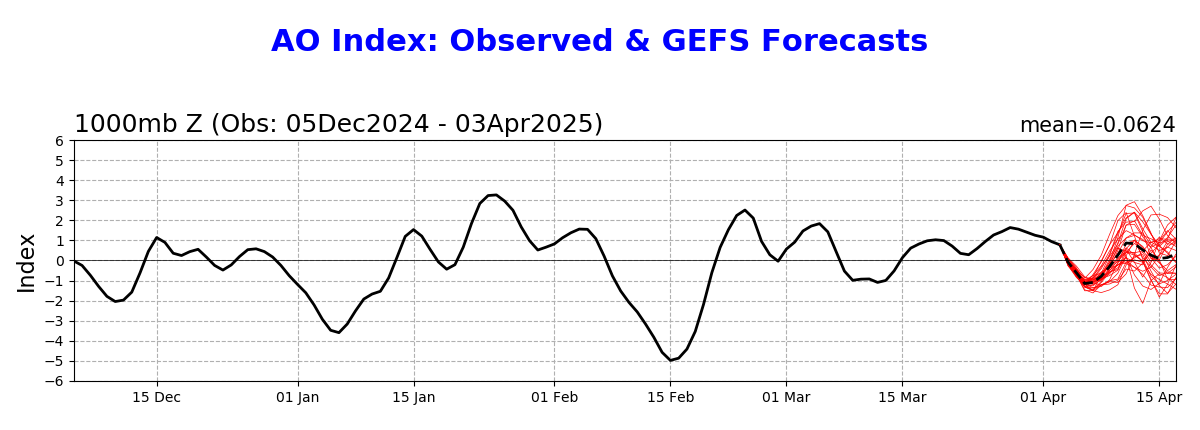
https://www.cpc.ncep.noaa.gov/products/precip/CWlink/pna/nao.shtml
https://www.cpc.ncep.noaa.gov/products/precip/CWlink/pna/pna.shtml
+++++++++++++++++
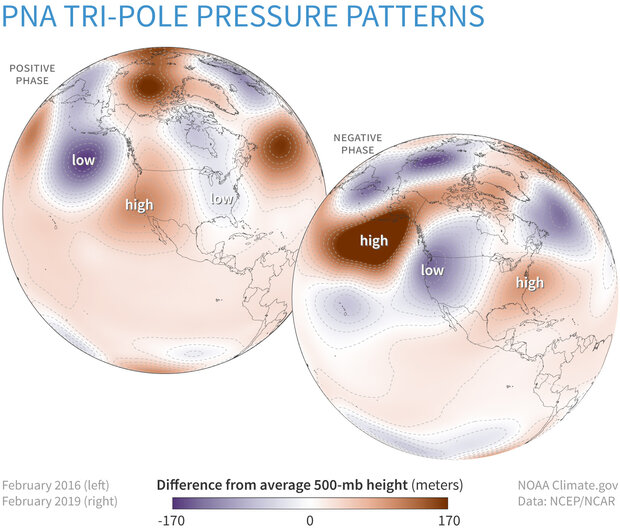
Climate Variability: Pacific–North American Pattern
++++++++++++
By metmike - Dec. 8, 2025, 11:48 a.m.
http://appinsys.com/globalwarming/ao_nao.htm
AO BELOW
The longer range European Ensemble model was colder again for February so I'm hesitant about shorting unless the 2 week models suddenly turn MUCH milder overnight.
The last EE 2 week model purple/left was slightly LESS cold with less HDDs below. This caused NG to back off the early morning highs.
1 week chart below.
Note the huge gap higher from the Friday close to the Sunday open. The long horizontal line is last weeks high. Looks like we've had 3 different bull flag type formations since Sunday Night. Each upside break out from the 2 wedges came from the models hitting the market with a COLDER solution.
If the models get colder again overnight, we could break out again. However, the price popped +$10,000/contract from last weeks low to this week's high in a short of a period for this to be sustainable for tto much longer. We can go higher still but there might be increasing resistance above.
The biggest reaction to a weather pattern change is usually when the market reverses and blows out all the traders that were position trading, using the previous weather pattern in their favor.
tjc's call for a major low last week sure looks MUCH better than us weather traders and my outlook last week. Even on Sunday Night, with the gap higher I was not convinced. ..........and missed it.
The bottom red line on the chart below was just above $3, when tjc was declaring a low in natural gas was due. Again, that was almost $9,000/contract lower than the latest price.
Holy Cow! Natural gas is up another $7,000/contract in just the last 3 hours. That's makes 3 bull flags that we broke out to the upside from in just over 2 days of trading. WOW! +$16,000/contract since the low late last week!
1:10am now up $8,000/contract
The 0z models turned MUCH colder in week 2. That's the time frame that is supposed to warm up but now, the warm up looks less and less. HDDs were way up too. 0z GEFS in purple/left below. +16 HDDs compared to the previous 18z. Wow!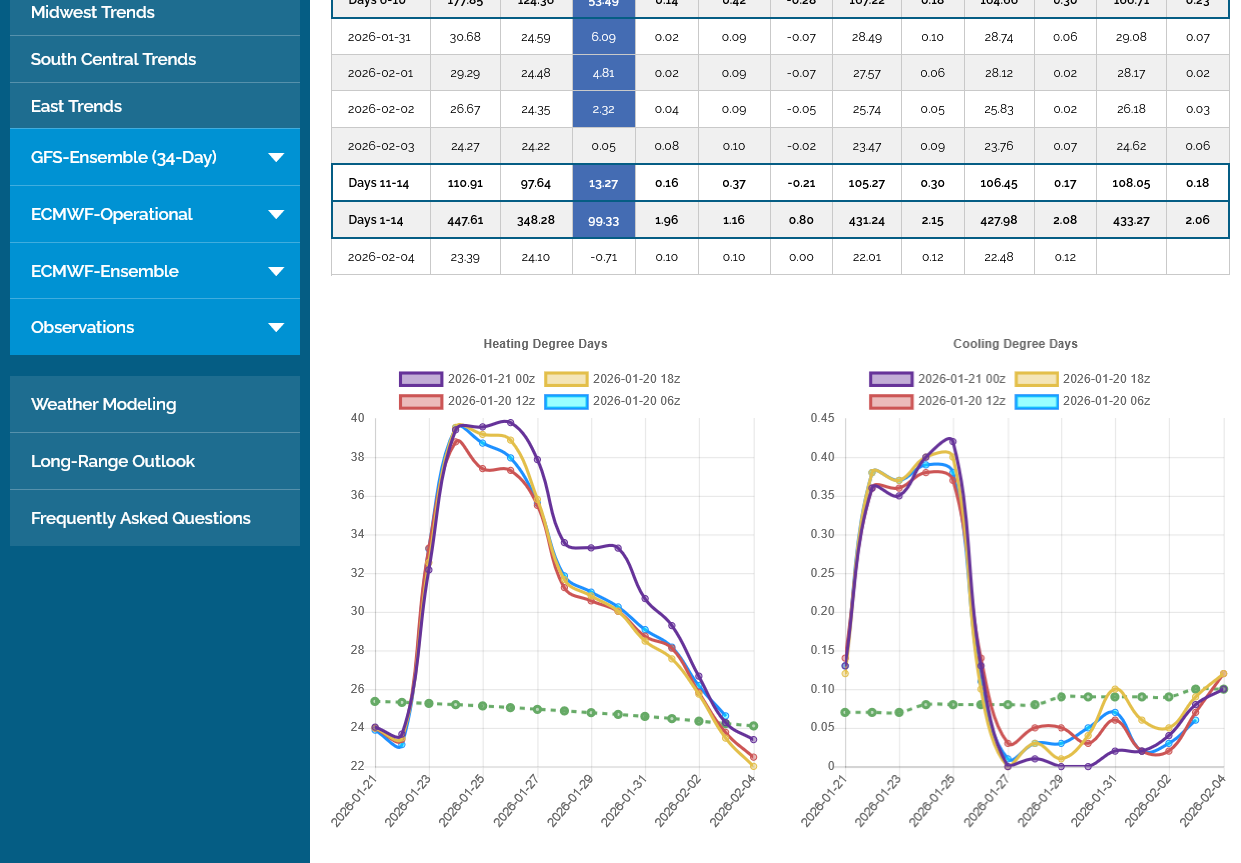
EE 0z run forecast for February 3 change in temperatures from the previous 12z run below.

NG has been as much as $10,000/contract higher a short while ago. Insane. REALLY insane.
The source graphically can't even graph is right. The high was actually 4.950. We're dropped $2,000/contract from the high in just a few minutes.
The spike higher at the end of the graph should does not show the spike to just below $5 earlier. I've never seen anything like this. In less than 3 market days, natural gas went for the low to high by almost $20,000.
We were blown away from the first $10,000 but the 2nd +$10,000 happened even faster.
The amount of added cold since last Friday is more than I ever remember in such a short period but the market reaction seems to be greatly overdone, even for that amount of cold.
The last 0z European Ensemble(purple/left) mean was an amazing +19 HDDS compared to the previous one 12 hours earlier. The models are continuing to be blind-sighted by the magnitude of the upcoming cold by an incredible amount!
The 12z GEFS is, once again coming out colder, AGAIN still not out completely.
So NG is +$3,000 from the morning lows and back challenging the highs again. I've never seen anything like this in natural gas in 34 years of trading commodities!
+++++++++++++++++
Volume today for the front month, February, so far is an incredible 280,000+
Open interest for this soon to expire contract is only 62,000!!!!!
This MIGHT be another blow off top, similar to the one on December 5th..
If models stop getting colder, that will be the case. If they keep getting colder, all bets are off.
Re: Re: Re: Re: Re: Re: Re: NG 12/1/25-
By metmike - Dec. 8, 2025, 11 a.m.
+++++++++++++++
12:30pm: The 12z GEFS did come out another +6 HDDs compared to the 6z run. You can see the purple line on the left ABOVE the other lines in the middle of the period. However, this was not enough for us to build on previous MASSIVE gains. Odds are increasing the ALL the cold is dialed in, especially with this type of reaction.
Temperatures for tomorrow's EIA storage report. MILD!!
So the number will be bearish compared to last year and seasonal averages. That was dialed in LAST week and before then when prices were collapsing lower. Now, the market is trading temperatures that will impact reports IN FEBRUARY!.
https://www.cpc.ncep.noaa.gov/products/tanal/temp_analyses.php

This afternoon's 46 day European model came out MUCH colder for February again today and that launched natural gas to fresh highs above $5, up $11,000/contract for the day!!!!
This was the updated temperature anomolies for week 3 in early February below.
Compare that to the same forecast period last Friday:
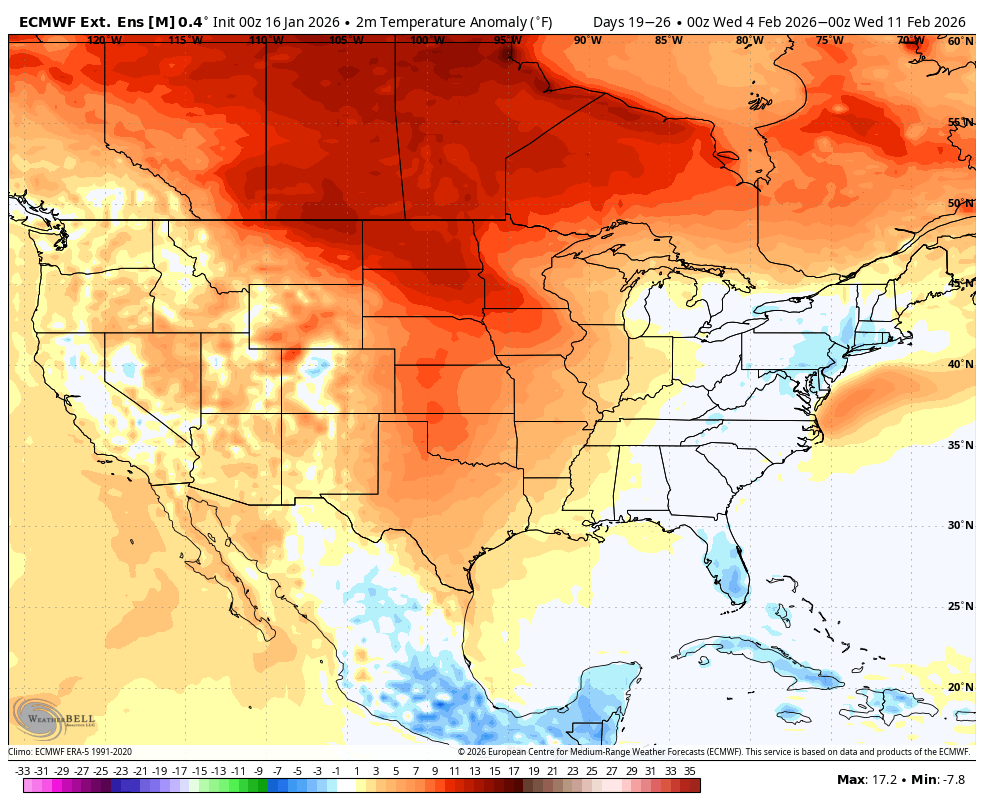
The forecasts have gotten colder and colder and COLDER every day this week by an amount now that is pretty unprecedented since these new products have been used for X number of years.
Natural gas is up $20,000/contract in 3 days of trading!!!! That also is close to, if not an all time record.
Another +12 HDDs on the last 0z GEFS compared to the previous run! Purple/left line.
Instead of going up, we sold off $2,000/contract this time.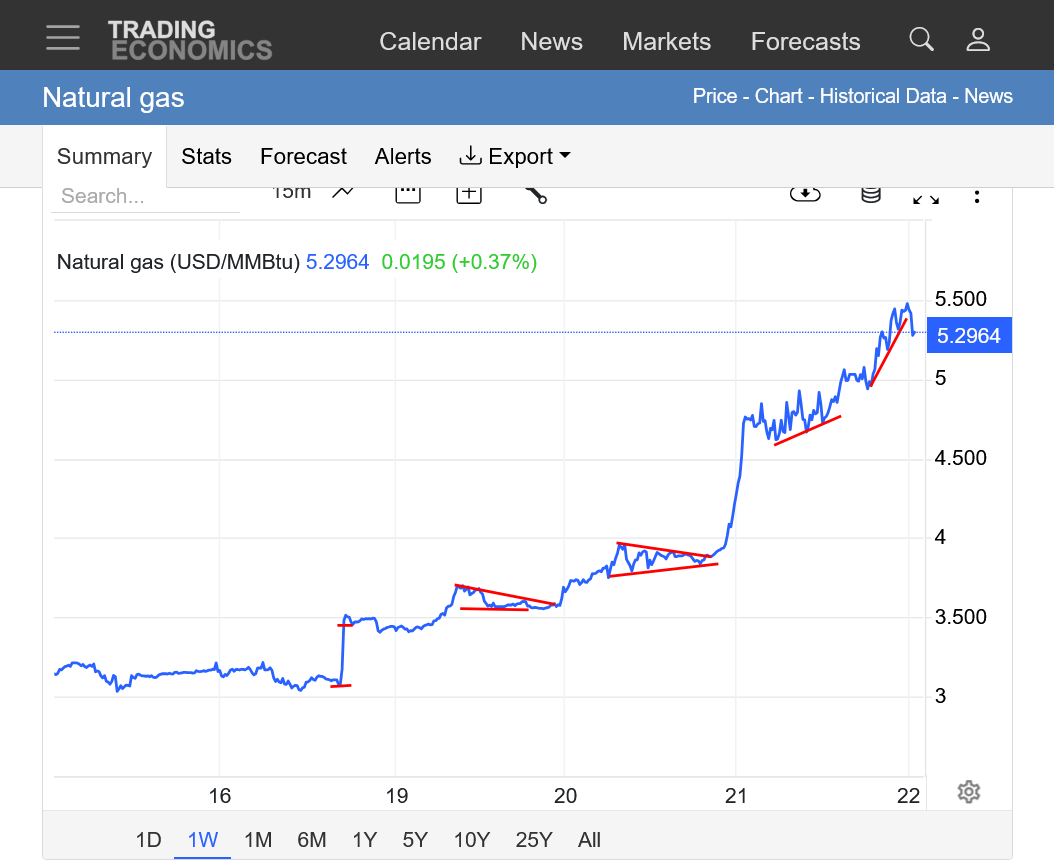
This last 6z GEFS is a bunch colder yet!
Never seen anything like this,
Crazy!
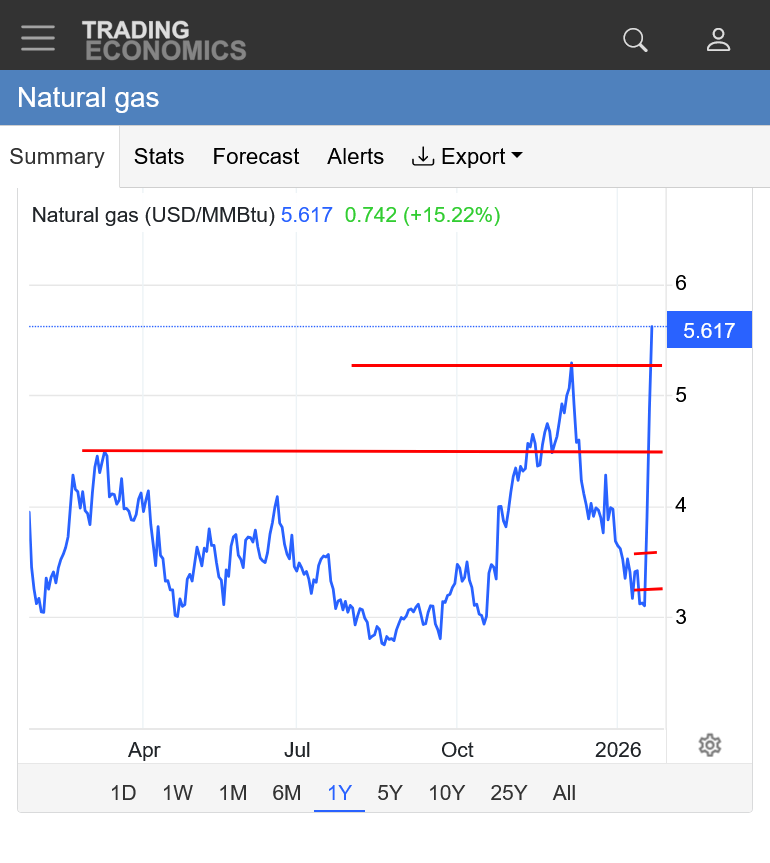
1. 1 year:
a. After the false break out to new yearly highs last month, we plunged to $3 last week.
b. 2nd from the top line was the March 2025 high.
c. Top line was the December 2025 high that was a fake break out.
This week's gains are around $25,000/contract. At this time scale, it looks like straight up. However...........
2. 1 week: Every time another model comes out MUCH colder, we've been breaking out to new highs........but sometimes, we spike down first. Looks like a ton of bull flags with an unprecedented week of trading as we approach the front month(Feb) expiration next week.
Feb is now $19,000/contract HIGHER than the next month, March. What will happen when this product rolls over to the new front month, is that it will look like a massive price gap lower on the continuation charts that NEVER happened
![]()
metmike: I understand what has happened. Look at the graph below and notice the blue line has now broken OUTSIDE THE RANGE. NG in storage is higher than last year and higher than the highest amount in storage the past 5 years. Note the verbiage that I underlined below. This is extremely bearish. The market KNEW this was going to happen earlier this month and big traders were shorting the heck out of ng ahead of that. They had an EXTREME bearish bias thru last week, especially in the front month, February which also has extremely negative seasonals in January.
When the weather made an historical change to colder and colder and colder the last 4 trading days, those huge traders that were loading up on their shorts were all caught on the exact wrong side of the trade. And February is going off the board soon. So they all had to get out at the same time...........with nobody wanting to sell ng when the models were adding massive cold, especially not the contract that will be expiring soon.
So this was huge panic type buying at the market which could only be matched with enough selling size by soaring MUCH, MUCH higher to uncover offers to satiate the panic buying.
for week ending January 16, 2026 | Released: January 22, 2026 at 10:30 a.m. | Next Release: January 29, 2026
| Working gas in underground storage, Lower 48 states Summary text CSV JSN | |||||||||||||||||||||||||
|---|---|---|---|---|---|---|---|---|---|---|---|---|---|---|---|---|---|---|---|---|---|---|---|---|---|
| Historical Comparisons | |||||||||||||||||||||||||
| Stocks billion cubic feet (Bcf) | Year ago (01/16/25) | 5-year average (2021-25) | |||||||||||||||||||||||
| Region | 01/16/26 | 01/09/26 | net change | implied flow | Bcf | % change | Bcf | % change | |||||||||||||||||
| East | 632 | 664 | -32 | -32 | 621 | 1.8 | 655 | -3.5 | |||||||||||||||||
| Midwest | 752 | 790 | -38 | -38 | 753 | -0.1 | 784 | -4.1 | |||||||||||||||||
| Mountain | 242 | 251 | -9 | -9 | 231 | 4.8 | 180 | 34.4 | |||||||||||||||||
| Pacific | 300 | 302 | -2 | -2 | 271 | 10.7 | 228 | 31.6 | |||||||||||||||||
| South Central | 1,139 | 1,178 | -39 | -39 | 1,048 | 8.7 | 1,041 | 9.4 | |||||||||||||||||
| Salt | 343 | 355 | -12 | -12 | 301 | 14.0 | 300 | 14.3 | |||||||||||||||||
| Nonsalt | 796 | 823 | -27 | -27 | 746 | 6.7 | 741 | 7.4 | |||||||||||||||||
| Total | 3,065 | 3,185 | -120 | -120 | 2,924 | 4.8 | 2,888 | 6.1 | |||||||||||||||||
| Totals may not equal sum of components because of independent rounding. | |||||||||||||||||||||||||
Working gas in storage was 3,065 Bcf as of Friday, January 16, 2026, according to EIA estimates. This represents a net decrease of 120 Bcf from the previous week. Stocks were 141 Bcf higher than last year at this time and 177 Bcf above the five-year average of 2,888 Bcf. At 3,065 Bcf, total working gas is above the five-year historical range.
For information on sampling error in this report, see Estimated Measures of Sampling Variability table below.

Note: The shaded area indicates the range between the historical minimum and maximum values for the weekly series from 2021 through 2025. The dashed vertical lines indicate current and year-ago weekly periods.
MM/tjc/others,
For those who don’t follow NG closely, why is this historically rapid NG price rise happening? It’s almost entirely related to a much colder E US vs how it looked last week.
Check out this absolutely insane comparison of GEFS US pop weighted HDD for Jan 22-29th on the Jan 14th 12Z run vs the 0Z Jan 22nd run. I don’t know that I’ve ever seen anything more extreme than this amazing colder change over just a 7.5 day elapsed period:
Jan 14th 12Z run (purple) 1/22-29 US pop wted HDD:
26+23+24+27+26+25+25+23=199 or 25/day (near the green line, which straddles the normal of 25/day):
 ———————————
Jan 22nd 0Z run (purple) 1/22-29 US pop wted HDD:
24+31+37+37+39+37+34+36=275 or 34/day (MA normal)!
NG is $5,000/contract off the highs. Is the blow off top high in??? I will say yes but was really wrong about this market at the end of last week and start of this one.
1. Storage is at the highest in years.
2. Winter is over half over
3. We blew out all the huge shorts leaning the wrong way already that had to cover the front month ahead of expiration
https://tradingeconomics.com/commodity/natural-gas
The last 0z GEFS was -10 HDDs WARMER(purple line/left graph) so NG is under a lot of aggressive selling pressure!
https://tradingeconomics.com/commodity/natural-gas
1. 1 week
2. 1 year
Did the European Ensemble model coming out a bit colder overnight, reverse the market back higher after midnight, after a -$7,000/contract lower reversal down(correction) from the highs yesterday??
The NG market is not very traceable right now, with the front month expiring in a few days making it extremely volatile.
The back months including the next one, March are NOT following the Feb this much higher. In fact March NG is stil $10,000/contract LOWER than it's December high. This tells us that much of this incredible move higher is tied to the front month, ready to expire dynamics.
Being so close to expiration, ties that front month much more closely to the physical market and spot/cash prices that spike extremely high during events like this.
The 12z GEFS is coming out LESS cold which is likely contributing to the selling pressure right now.
Under these current conditions, when front month ng is having daily ranges of well over $5,000 contract, holding a position for 2 days while the market is closed is extraordinarily risky.........even by the extremely risky ng standards.
This was just the last day: $7,000/contract wide range from lows to highs. We're closer to the highs and well above $5 at the moment.
https://tradingeconomics.com/commodity/natural-gas
NG spiking back up to the highs of the day! This cold be related mostly to the extreme cold hitting next week, which will cause spot/cash prices to spike thru the roof at the same time that the front mont, Feb. expires and needs to converge with the spot price.
+++++++++++++++++
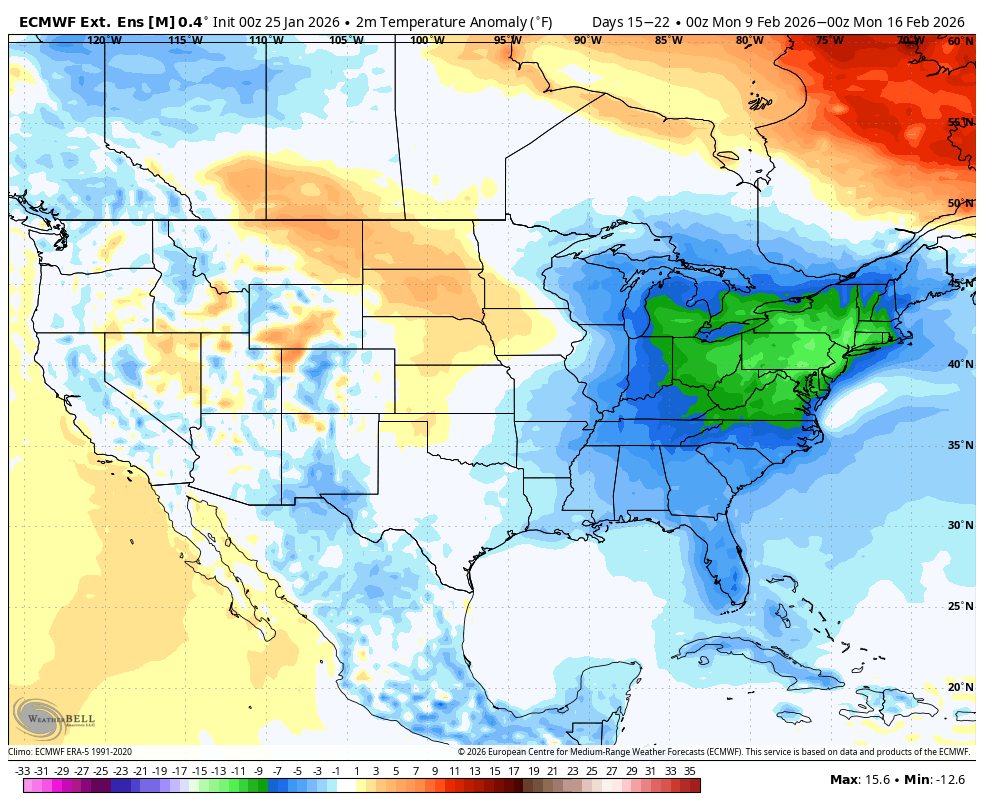
1. The European Ensemble model comes out after the GEFS. The end of the 12z EE model shows another visit from the Polar Vortex at 500 mb below. Exactly when the models had been predicting that temperatures would warm back to average again!!! The colors represent the anomalies which is the disparity below or above average. Extreme trough in the east, along with ridging in the West and over Greenland are very powerful cold air delivery and transport couplets that make cold in the East a sure thing if this occurs.
2. This is the incredible change from the previous, 0z run of the same model.
3. This is the change in temperatures just from the previous 0z run. That cold change is aimed at the US for the start of week 3.
4. This red lines show when the 12z EE was coming out. We spike to NEW HIGHS for the week/move because of this solution but have backed of a bit. If I was short over the weekend, a solution like this would have just ruined the rest of my weekend So why not be long? If it goes the other way, it's just as bad for the bulls and it CAN go either way, so this would be more gambling. We're up over $21,000/contract since last Friday at this time because of the unprecedented cold changes to the weather forecast that have grown almost every day. This last 12z EE run is adding to it to give the ng market a bullish kiss to end this amazing week.


Larry/MetMike
Monday, maybe Sunday night, exhaustion to a HIGH (chart, not weather)??
Hi, tjc!
I missed all the move higher (I actually made money being long when we were still going down )
This is a selling set up as you recognize with your trading set ups when markets get extreme near tops and bottoms.
However, I need a weather pattern change to the opposite kind of weather that caused the extreme. In this case, that means moderating. Although we can't keep this magnitude of cold going for more than a week, all the weather guidance is suggesting that February will also be very cold in the East.
Just some thoughts below:
At these lofty levels and Winter running out, it's possible that may not be enough to sustain the move up but we have an extremely unique factor this week. The Feb is expiring at a price that's currently $17,000/contract higher than the next month, March.
I believe much of the record spike higher from this record cold has been from the looming expiration and the need for that front month to converge to cash/spot prices on expiration. As you know, spot/cash prices during such extreme, long duration cold can spike to many times higher than the futures price for brief periods in some locations. This is especially widespread and long duration cold with the huge speculators leaning the wrong way, being short initially.
How much of that is already in the market? Maybe ALL OF IT????
Now that we have this historic Winter storm almost behind us, will the market sell off?
How much is/was overdone?
How will Feb act between now and expiration which is Wednesday, January 28th?
With the current extreme cold this entire week, there could be(COULD) a brief mega spike higher at some point.
Weather models going out the next 6 weeks keep the cold coming for the East. That's still bullish weather.
This was the just updated week 3 forecast from the European Weeklies which continues in weeks 4, 5 and 6:
Although still very bullish, it's LESS bullish from this extreme and we are on the back half of Winter and most importantly, current storage is completely ABOVE the 5 year range in storage for this time of year so no matter how much cold we have and how huge the upcoming draw downs are, we will not be running out of natural gas.........which is why the back months are trading -$17,000 lower than the front month.
What will the market do when March is the front month and trading $17,000 less than the current price of February with tons of cold coming the next 6 weeks.
This was an extremely cold period last year/2025 and the market made its highs in March(when the market almost always makes its lows).
1. This will make storage vs the previous year seem less bullish.
2. Will the same extreme cold in February 2026 also cause the market to act contra seasonal, like it did in 2025?
++++++++++++
Last year, the coldest air was in the center of the country. February's cold will be farther east, where more people live.
This would be a tailor made weather trade (short) if we had a huge pattern change to milder. Unfortunately, this will likely be one of those times when the move up just get's exhausted BEFORE the weather models turn bearish and I just can't be short when the weather is still this bullish.
With this 1 big exception. If weather models overnight, suddenly take away alot of cold.
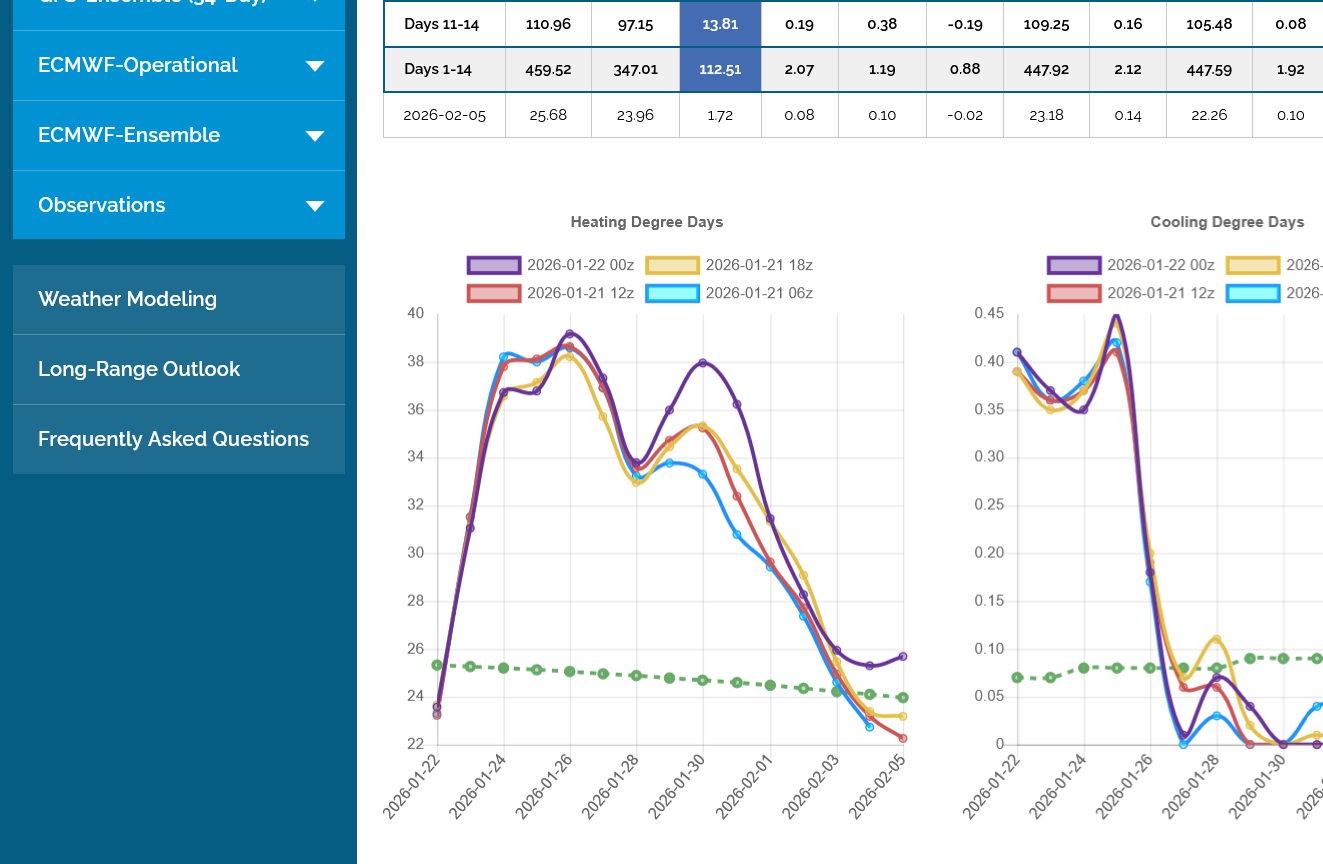
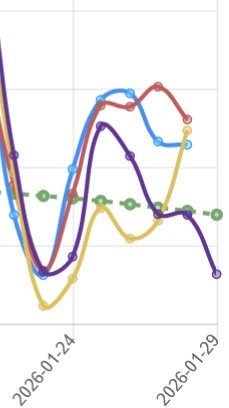
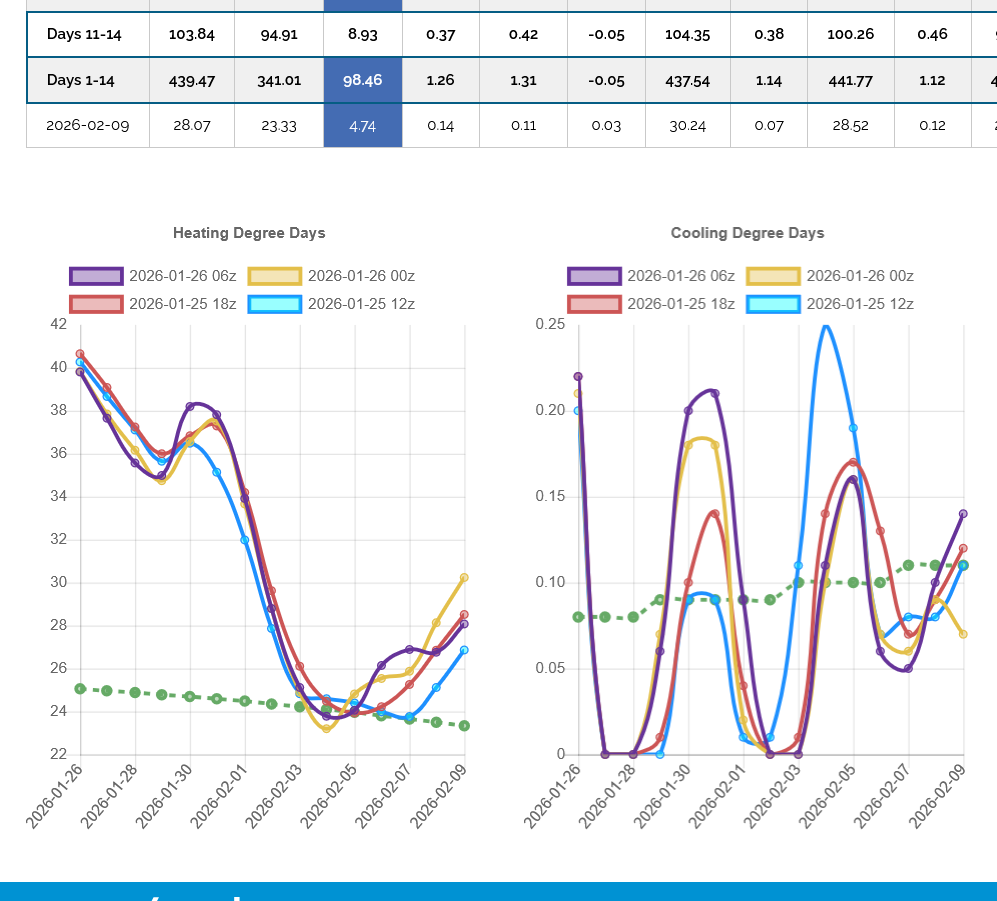
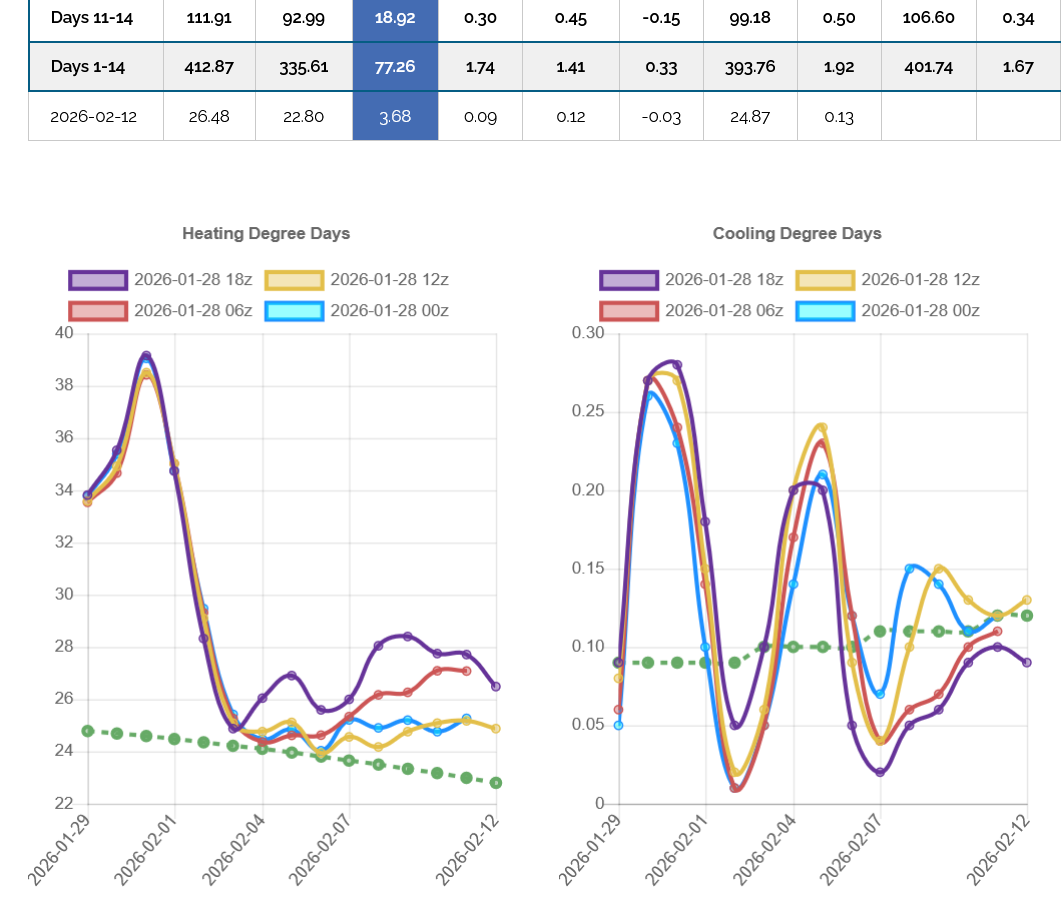
Speaking of which: The latest HDD data was actually less bullish, with a few less HDDs compared to the previous runs. Also, note the huge drop in week 2 in the predicted HDDs. However, for the past 8+ days the models have predicted this huge week 2 plunge. According to the weather models a week ago, we should be warming up this week. Every day the models delayed the warm up. Also, although we drop close to average, the definitive week 3 and beyond pattern is to go back to cold. But cold in mid February can't be this cold anymore. It can still be XX below average but averages are going up, noted by the slowing dropping green line.
If this graph went out another week, it would show the lines on the left going back higher(but staying less than half way below the current point higher).
It looks like natural gas is going to have a decent sized(HUGE) gap higher.
Not just a gap higher on the daily/weekly/monthly but for the move and the highest prices in years.
So if we fill a huge gap higher at such a significant place, it's an especially powerful gap and crap buying exhaustion.
Not being filled makes it an upside break away gap higher.
NG did gap much higher and is now +$8,000/contract.
Market says cold way into February!
Yes indeed, tjc!
The expiring front month, February is now priced $22,000/contract higher than the next month, March!!!
(I 'guess' the bull spread was the way to go!!)
Yep!
The seasonal trade, up to last year was BEAR spreading the Feb and March ng with Apr/May/June(that bottom first) with 90% frequency from history.
+++++++++++++
7:30pm Front month, Feb HO also had a small gap higher too! March not quite a gap and not up as much right now. NG for sure way more bullish on weather.
1030pm est--------Has ng topped?
too much cold in the forecast for me to be short!
The last 0z EE was a bit colder again and the 0z Canadian model has the polar vortex impacting our weather towards the end of week 2 but we can't keep going higher like this forever.
However, picking a top with weather models still bullish…….another month+ of cold on the way is what to avoid.
tjc,
It's possible we did top yesterday evening but I doubt it.
As mentioned previously, NG is going to top this week WITHOUT the weather turning bearish.
After a less cold period in week 2, with temperatures getting back to near average briefly, the models bring in the next round of frigid weather and another southward intrusion of the Polar Vortex. So the weather continues bullish.
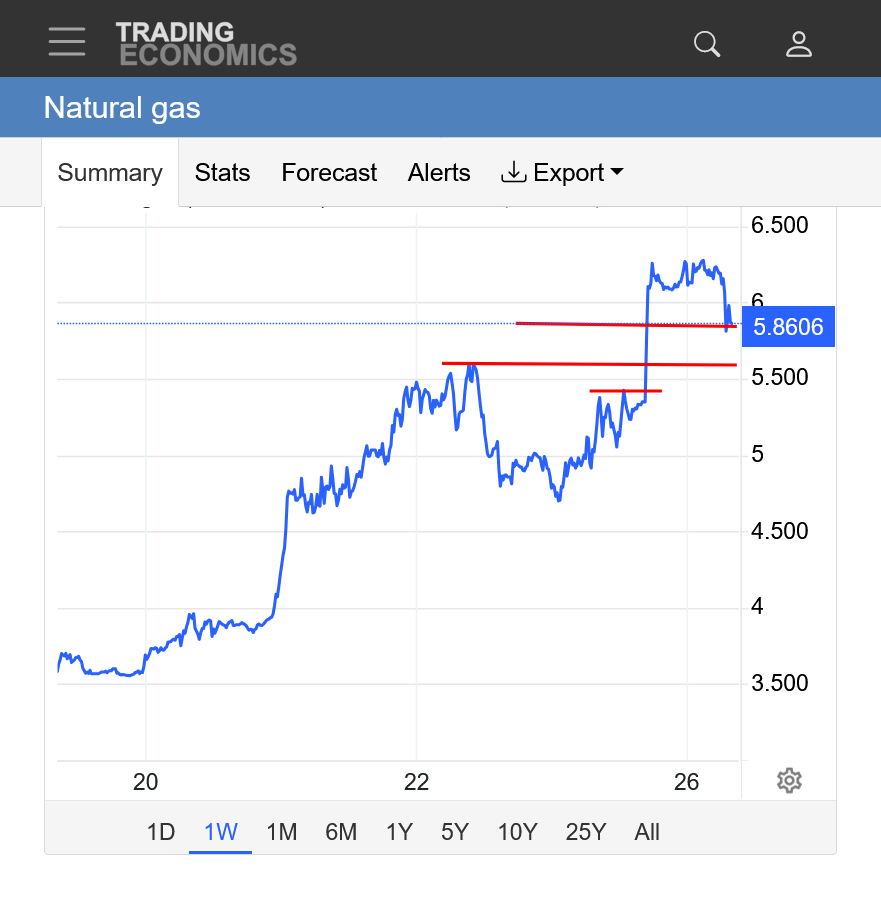
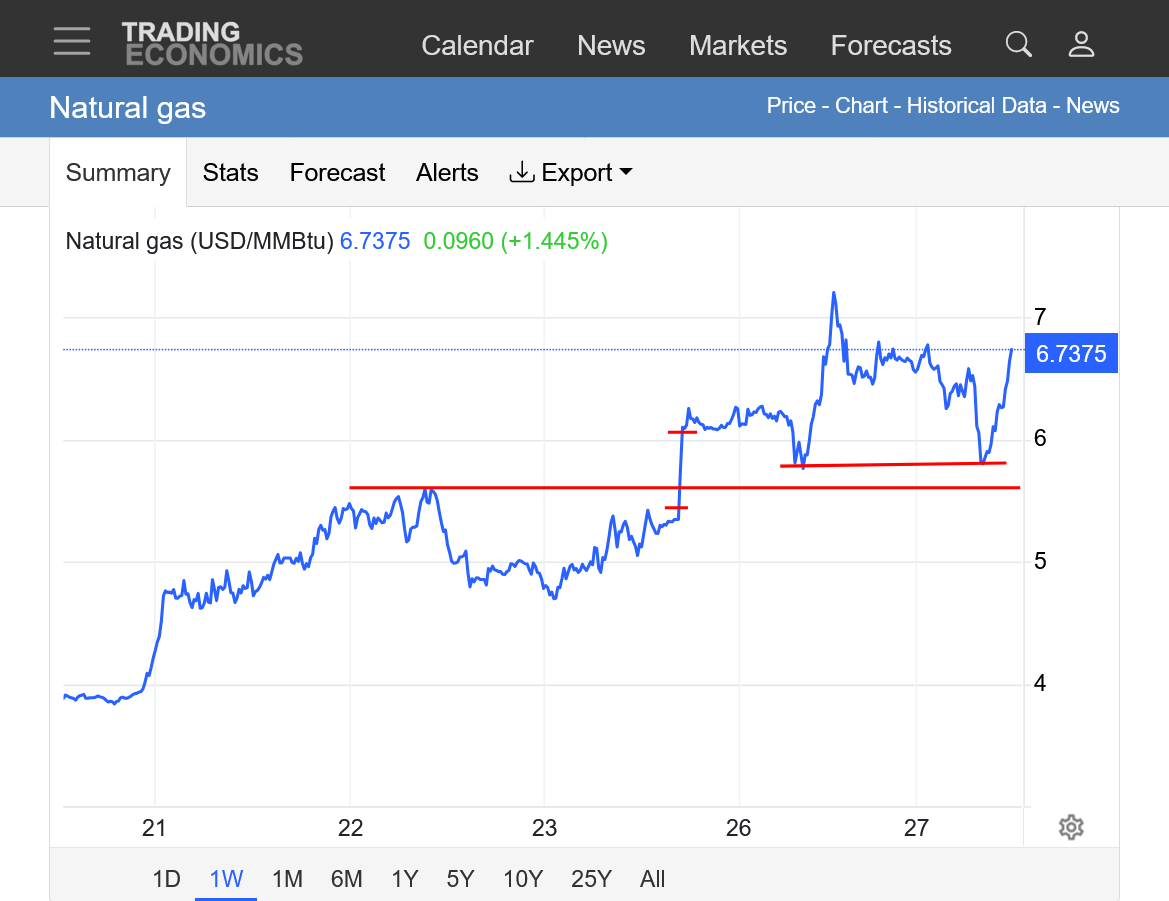
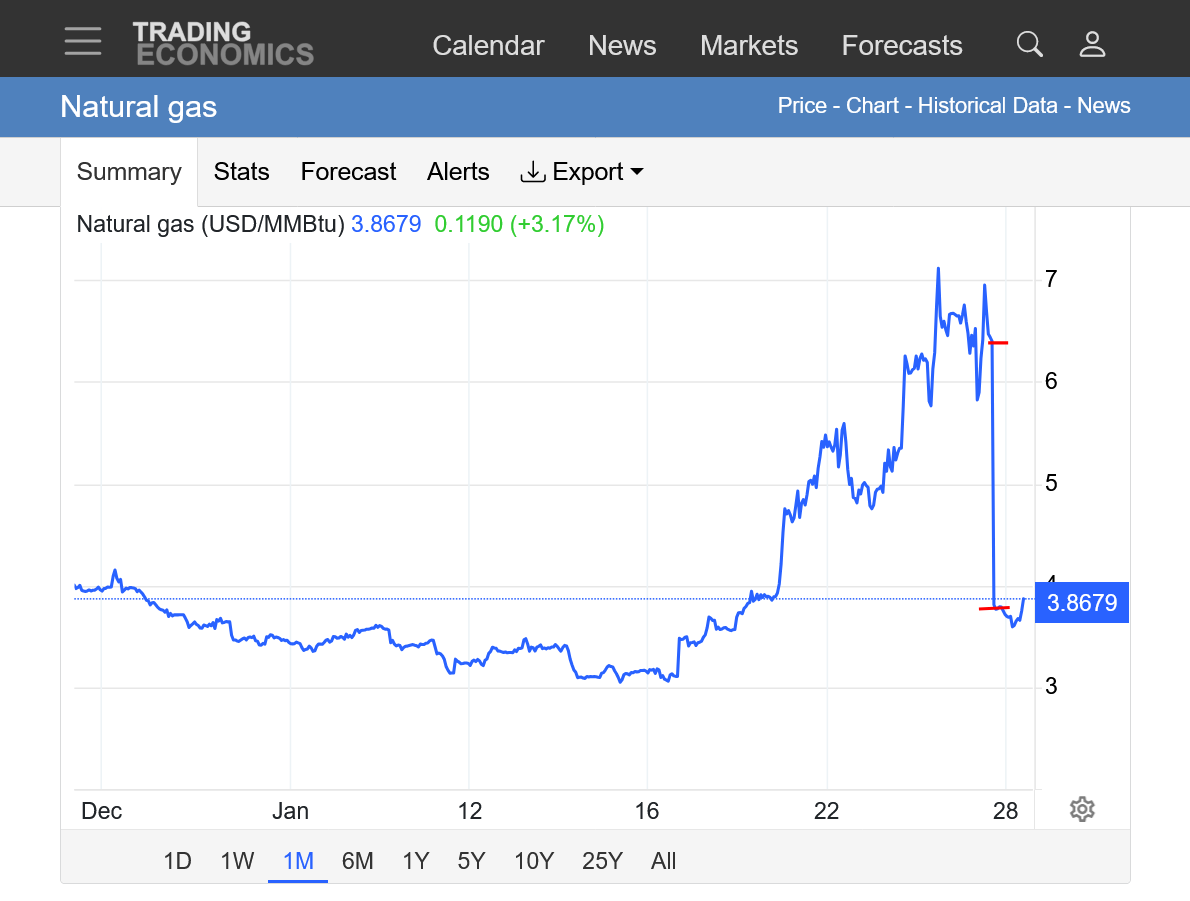
https://tradingeconomics.com/commodity/natural-gas
1 week graph. Lower line was Friday's close. 2nd line up was last week's high. Top line was the huge gap higher to start this week. We spiked several thousand/contract above that early yesterday evening, held that until around 6am, then sold off back to the open last night and top of the gap which is starting to be eroded.
8:15 am: Extremely volatile here. We spiked up by $2,000/contract from testing the gap in just 5 minutes. Impossible to stay short.
The top of the huge gap higher was tested........and held!!!
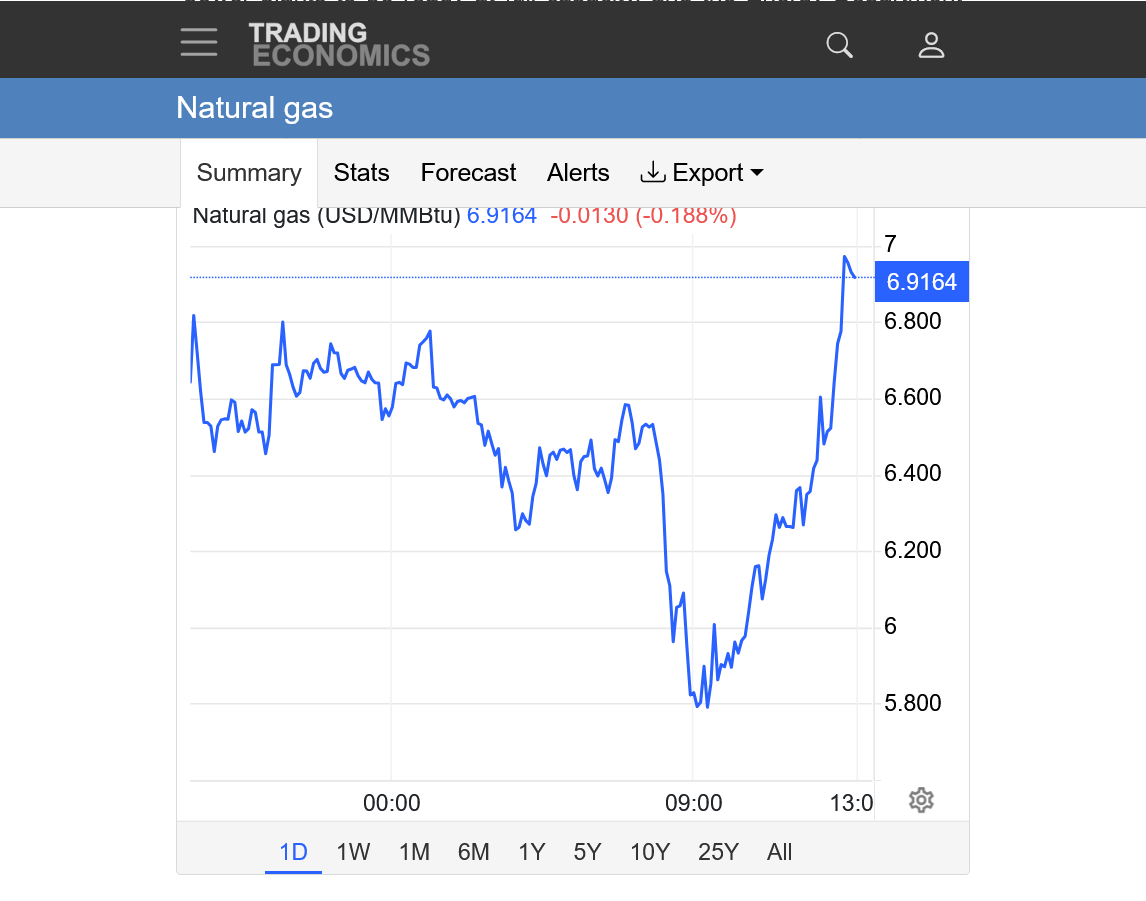
https://tradingeconomics.com/commodity/natural-gas
NG just spiked to $16,000/contract higher For the day. This might be unprecedented but I was leery something similar could happen as we approach contract expiration with the front month converging with sky high cash/spot prices this week from extreme cold.
This is looking like the potential for another blow off top like we had the first week in December.
That one seemed almost unprecedented But this spike is making that one look tame.
The weekend after that blow off top we saw the forecast weather models start taking out cold
This top is likely not going to feature that so I’ll just have to wait for better weather trading set ups.
NG is not tradeable right now.
The weather pattern remains COLD. Moderation next week, then another visit from the Polar Vortex.
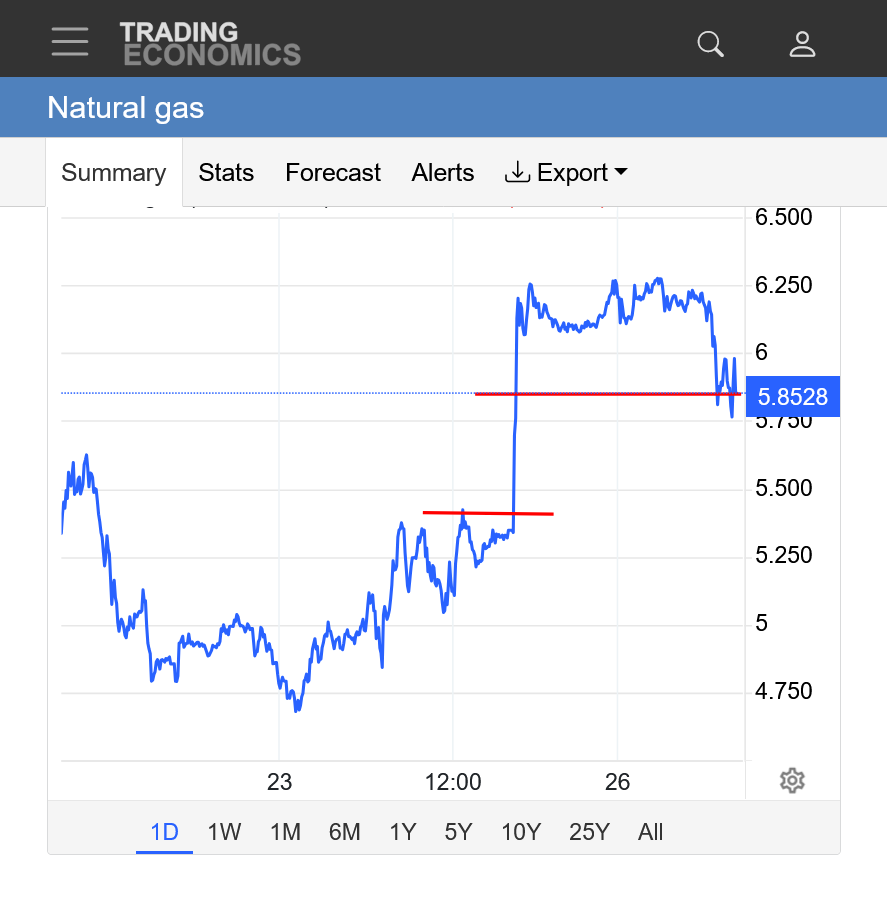
https://tradingeconomics.com/commodity/natural-gas
The long line was last weeks high and the previous contract high. The next one up was the low for this week, just tested a short while ago.
The short lines represented the high on Friday, and above it, the huge gap higher on the Sunday open. We have NOT closed the daily or weekly/monthly gaps higher, even though we eroded the top of the gap but the gap held. So it's still an upside breakaway gap higher that still projects higher prices.
But here's the thing. The front month, Feb below expires tomorrow. This source will likely start graphing the March price tonight but start without adjusting the prices we see below for the February, so it will look like an unbelievable gap lower.
February is currently trading at a premium of $29,000/contract compared to the March price. No kidding. March is just over half the price of February. As mentioned, this extreme cold is causing a massive spike higher in spot/cash prices and this is likely causing the expiring month to converge with the cash market because any positions NOT covered before the expiration, are no longer just paper but instead are legal obligations.
If you are long Feb Natural gas after expiration, you could be subject to delivery of the natural gas, PHYSICAL PRODUCT that you just bought on the actual market.
If you are short Feb. NG after expiration, you just sold
10,000 million British thermal units (MMBtu). Failing to deliver can result in penalties.
So traders that actually deal with the physical product and want to buy natural gas short term on the physical market would see value in buying the Feb. contract BEFORE it expires because the spot price is off the charts. This is pulling the Feb contract much, MUCH higher right now.
12:55pm: just since I copied that chart, a few minutes earlier, the continued impact of the European Ensemble model that came out much colder again in week 2, caused another spike higher. Along with the expiration dynamics explained earlier. This source has been unable to keep up with accurate prices. The high was 7.076, higher than they show below on this 1 day chart.
OK, we spiked to a new high of 7.146. Feb is trading $32,000/contract higher than the next month, March. This is unprecedented for at least the past 2 decades, especially with storage higher than at any point the last 5 years.
However, February continues to look extremely cold.
It got even more insane as NGG spiked almost to 7.5 briefly.
As mentioned previously, this is NOT a market that I can trade right now.
The range today was $17,000/contract, traded in just over 4 hours. That has sometimes been the range in price for natural gas for the entire year in some years.
And we did that in a matter of hours!
Over 54,000 contracts traded today in the ng contract that will be going off the board in less than 24 hours. That may have happened before when I wasn't watching but normally, volume in the expiring month has vanished.
Again, the spread in price in just 4 hours time(starting just after 9am) going from the low to the high was $19,000/contract!!!
When they change to graphing the March price tonight, it will mess up any analysis comparing the prices for X amount of time to these prices from the February 2026 incredible spike higher.
Just think, only 8 trading days ago the price was barely above $3!!! We were almost 2.5 times that with our spike high earlier.
1. 1 day
2. 1 month-the high was almost 7.5 not what they show!
3 . 1 year-the high was almost 7.5, not what they show.
The last 12z European model cranked up the cold again in week 2 as we expect February to turn colder again. The cold will be focused on the East which has the highest population density.
Instead of it being a progressive pattern, where the warmth spreads east pushes out the cold, it's the complete opposite. A high level BLOCKING pattern, that weakens briefly then AMPLIFIES at times!
https://www.psl.noaa.gov/map/images/ens/ens.html#nh
NCEP Ensemble t = 360 hour forecast 
NCEP Ensemble t = 360 hour forecast 
Arctic Oscillation Index, North Atlantic Oscillation Index, Pacific North American Index.
https://www.cpc.ncep.noaa.gov/products/precip/CWlink/daily_ao_index/ao.shtml
https://www.cpc.ncep.noaa.gov/products/precip/CWlink/pna/nao.shtml
https://www.cpc.ncep.noaa.gov/products/precip/CWlink/pna/pna.shtml
More detailed explanation:
By metmike - Jan. 20, 2026, 9:47 a.m.
Above average drawdown on the way this Thursday at 9:30am?
Mild where not many people live.
Cold where a lot of people live.

As I've been stating about my graphing source, with last night's open they rolled over from the front month Feb(expires today) to the Mar contract.
With the March trading almost $30,000/contract lower, it shows up as a monstrous gap lower of epic proportion.........that doesn't exist. It messes up any chart analysis here.
When we get time frames that show ONLY the March contract, it will be a viable product again.
https://tradingeconomics.com/commodity/natural-gas
1. 1 month
The reality, is that March natural gas had a spike high of $4 this week and we are not far from it. The Feb contract graphed below, spiked close to $7.5, actually HIGHER than depicted below. This source has been rendered unreliable and not helpful(other than to demonstrate what I'm pointing out about what just happened). I will show it again when its able to do better.
Too bad, since overnight, when the 0z models were milder, ng had a spike down that last lasted several hours that we can barely see below.
For instance, the daily chart will be just the March after 1 day.
The weekly chart will be just March after 1 week.
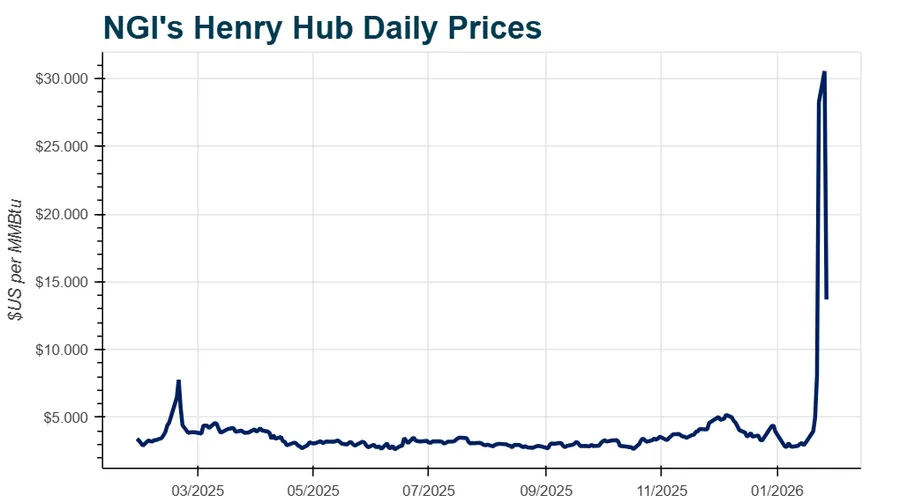
This is an example of the how extreme the spot price of natural gas gets (Henry Hub) during a massive Arctic outbreak that features widespread freeze offs.
The price went up by more than 6 times at the peak of the spike up.
++++++++++
U.S. LNG feed gas nominations have climbed by about 50% over the past two days as the market recovers from Winter Storm Fern, but more disruptions could occur in the days ahead as another round of cold is forecast to spread southward.
The last 18z GEFS was a WHOPPING +19 HDDs compared to the previous 12z run!
Purple/left line.
https://tradingeconomics.com/commodity/natural-gas
1 day chart with just March NG. The 12z models came out milder=first red line/top. The 18z GEFS came out MUCH colder=2nd red line.
Strong upward trending channel the past day.
Natural gas storage number will be huge!
+++++++++++++++
9:31 am: -242 Bcf was huge!
9:45 am: NG had a brief, small spike up but is selling off from a buy the rumor, sell the fact mentality. Extended models are still very cold but the EE and Canadian models are MODERATING the cold in week 2. If this continues, the highs will be in for now.
++++++++++++++++
Next week's EIA number will be a monster! The one after that will be massive too. However, the market dialed that in earlier this week when it traded THE FUTURE.
The market is now trading the weather for the entire month of February, which is expected to be very cold. If it's just cold-ish, that will be bearish!. If the cold forecasts intensify and we see another Polar Vortex invasion, that will be bullish.
![]()
for week ending January 23, 2026 | Released: January 29, 2026 at 10:30 a.m. | Next Release: February 5, 2026
| Working gas in underground storage, Lower 48 states Summary text CSV JSN | |||||||||||||||||||||||||
|---|---|---|---|---|---|---|---|---|---|---|---|---|---|---|---|---|---|---|---|---|---|---|---|---|---|
| Historical Comparisons | |||||||||||||||||||||||||
| Stocks billion cubic feet (Bcf) | Year ago (01/23/25) | 5-year average (2021-25) | |||||||||||||||||||||||
| Region | 01/23/26 | 01/16/26 | net change | implied flow | Bcf | % change | Bcf | % change | |||||||||||||||||
| East | 577 | 632 | -55 | -55 | 561 | 2.9 | 603 | -4.3 | |||||||||||||||||
| Midwest | 676 | 752 | -76 | -76 | 673 | 0.4 | 722 | -6.4 | |||||||||||||||||
| Mountain | 228 | 242 | -14 | -14 | 214 | 6.5 | 170 | 34.1 | |||||||||||||||||
| Pacific | 291 | 300 | -9 | -9 | 249 | 16.9 | 219 | 32.9 | |||||||||||||||||
| South Central | 1,050 | 1,139 | -89 | -89 | 920 | 14.1 | 967 | 8.6 | |||||||||||||||||
| Salt | 313 | 343 | -30 | -30 | 239 | 31.0 | 270 | 15.9 | |||||||||||||||||
| Nonsalt | 737 | 796 | -59 | -59 | 682 | 8.1 | 697 | 5.7 | |||||||||||||||||
| Total | 2,823 | 3,065 | -242 | -242 | 2,617 | 7.9 | 2,680 | 5.3 | |||||||||||||||||
| Totals may not equal sum of components because of independent rounding. | |||||||||||||||||||||||||
Working gas in storage was 2,823 Bcf as of Friday, January 23, 2026, according to EIA estimates. This represents a net decrease of 242 Bcf from the previous week. Stocks were 206 Bcf higher than last year at this time and 143 Bcf above the five-year average of 2,680 Bcf. At 2,823 Bcf, total working gas is within the five-year historical range.
For information on sampling error in this report, see Estimated Measures of Sampling Variability table below.
Note: The shaded area indicates the range between the historical minimum and maximum values for the weekly series from 2021 through 2025. The dashed vertical lines indicate current and year-ago weekly periods.
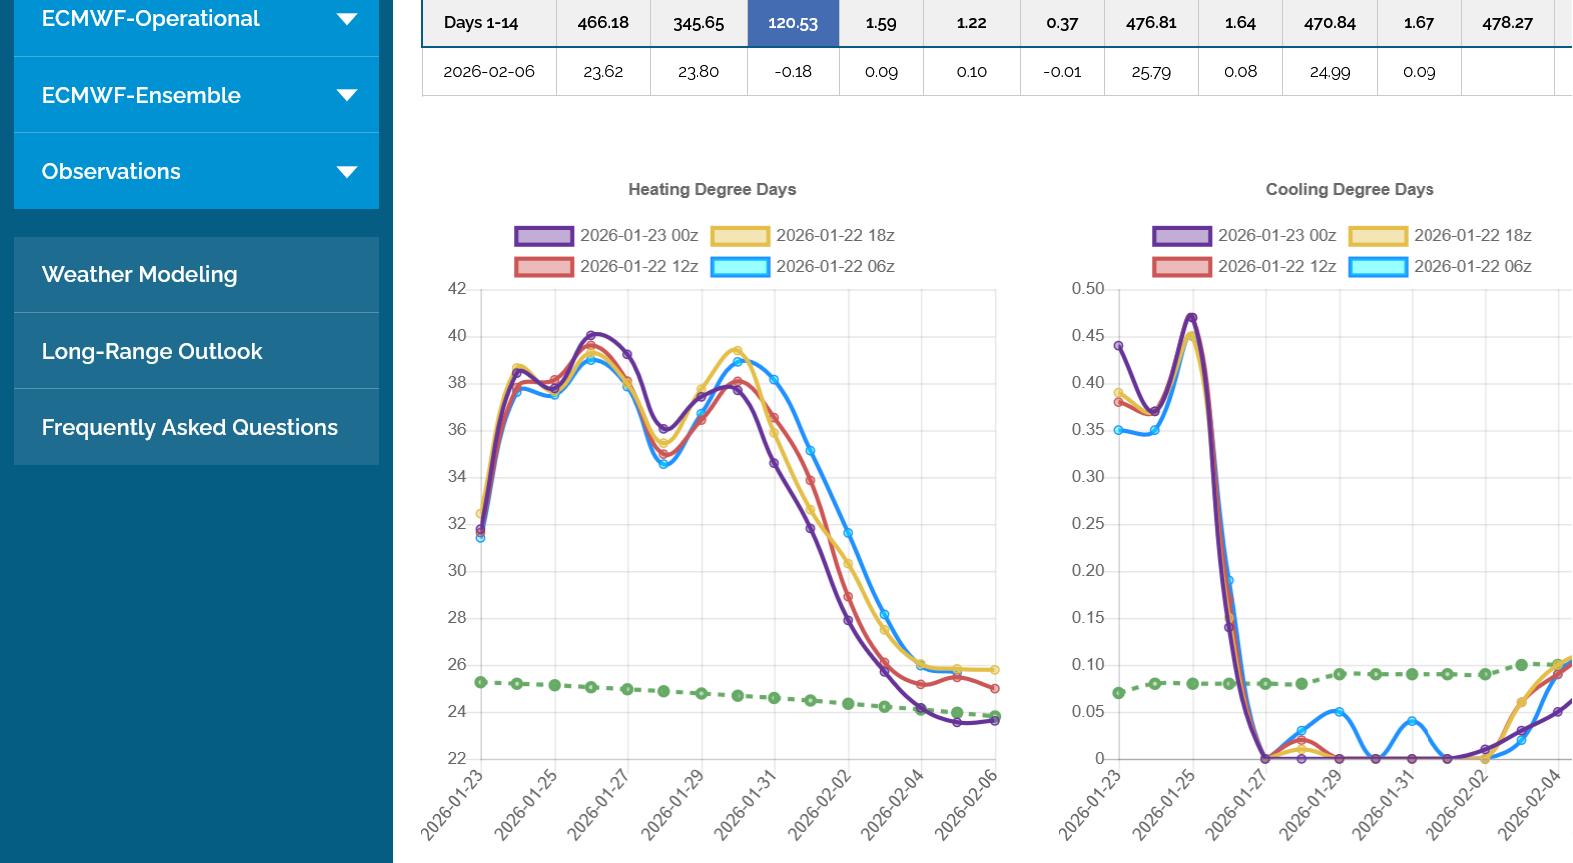
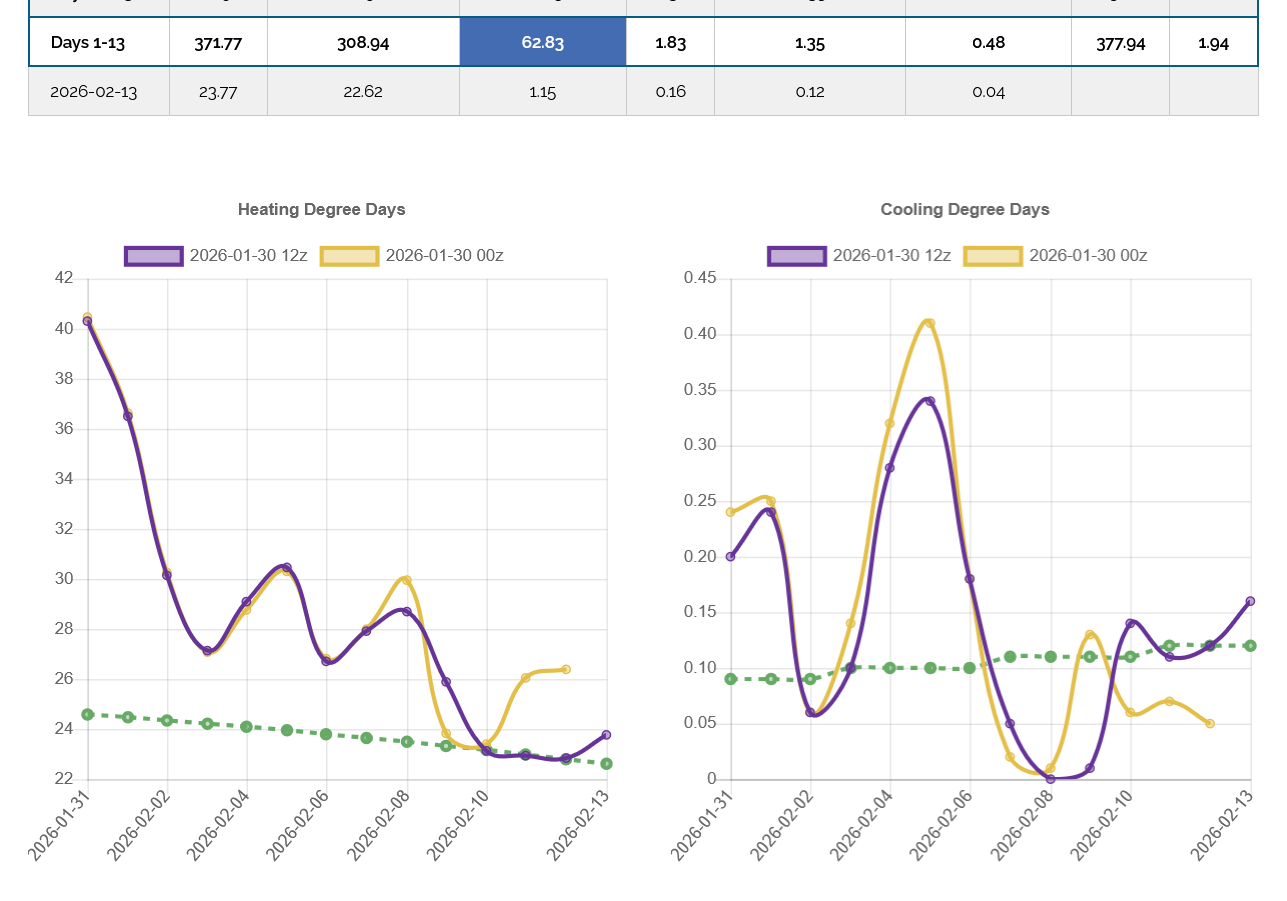
The 12z European Ensemble model (purple/left) got COLDER again causing NG to go higher again.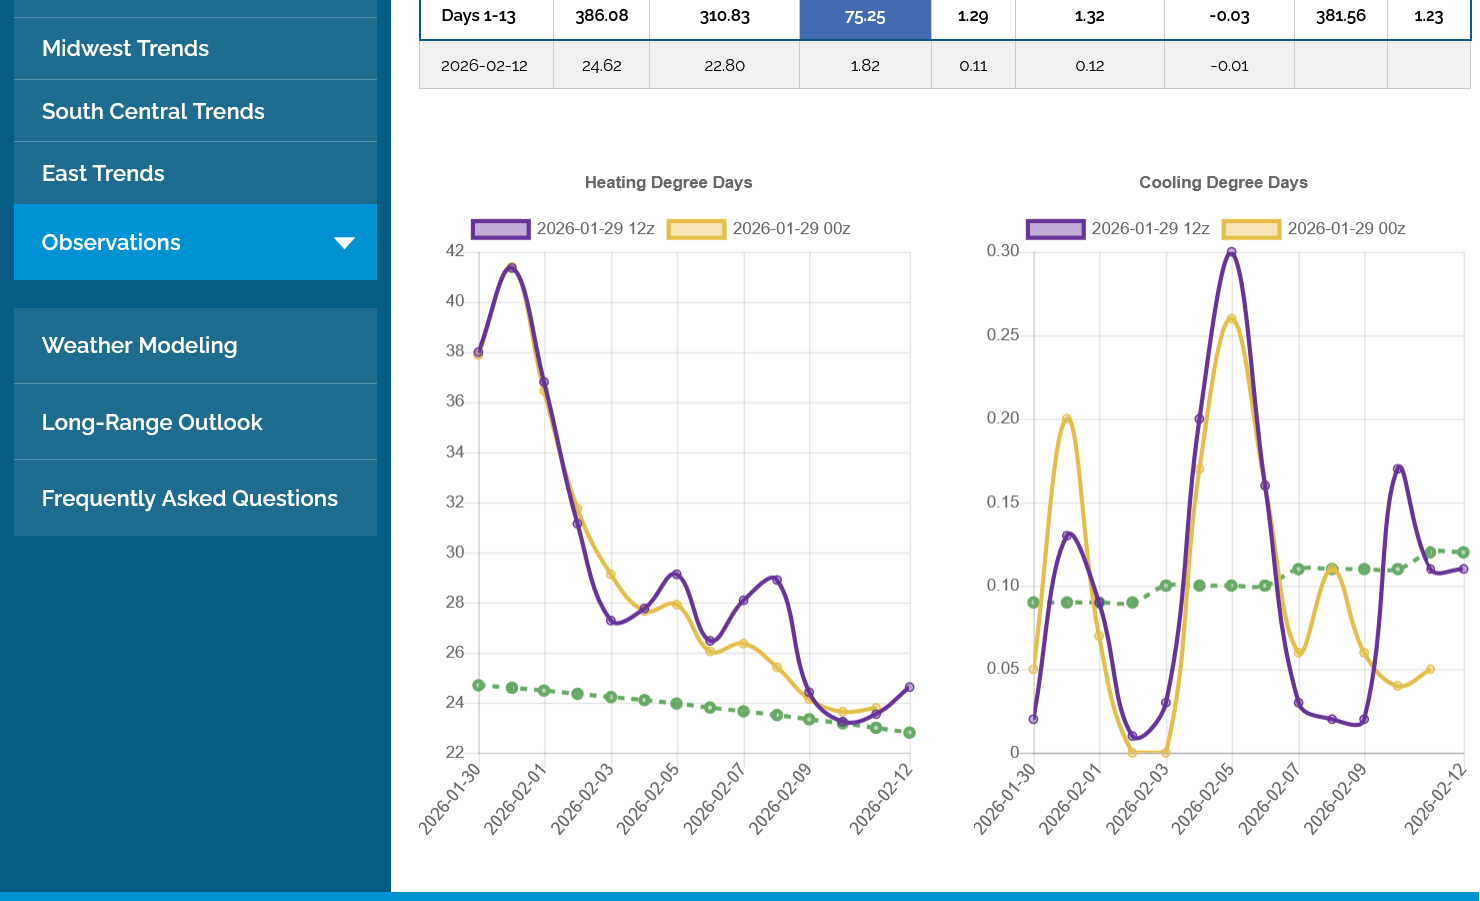
Hey Mike,
That’s absolutely amazing for 1/31/26 to be at 41.3 HDD, a whopping 17 pop weighted HDD above normal for the US! Do you happen to know the last time there was a day that cold or the last time there was a +17 anomaly?
Thanks, Larry. Yes, extremely impressive. Not sure when the last time that happened was.
The market did something odd shortly after the 6z GEFS, (purple/left) came out with -12 HDDs(bearish). When the large volume daytime traders came in the bought aggressively and NG took off like a rocket. +$3,000/contract from the lows, after weakness from the bearish HDDs.
Look THE PATTERN at the end of 2 weeks for our answer(bottom). The market is trading a return of frigid weather in week's 2 and 3, even if that last solution warmed up individual days in week 2.
1. High latitude blocking, ---AO. Ideal for transport of cold from high to mid latitudes
2. -NAO Ideal for cold in the East
3. +PNA Ideal or cold to penetrate deeply into the US
https://www.marketforum.com/forum/topic/83844/#83949
https://www.psl.noaa.gov/map/images/ens/ens.html#nh
NCEP Ensemble t = 360 hour forecast
NCEP Ensemble t = 360 hour forecast
Arctic Oscillation Index, North Atlantic Oscillation Index, Pacific North American Index.
https://www.cpc.ncep.noaa.gov/products/precip/CWlink/daily_ao_index/ao.shtml
https://www.cpc.ncep.noaa.gov/products/precip/CWlink/pna/nao.shtml
https://www.cpc.ncep.noaa.gov/products/precip/CWlink/pna/pna.shtml
+++++++++++++
https://tradingeconomics.com/commodity/natural-gas
1. 1 week. We can see how the rollover from the front month Feb to Mar messed up our graphing.
2. 1 day: Red lines.
a. 18z GEFS came out warmer.
b. 0Z EE came out colder
c. 6z GEFS came out milder, -12 HDDs
d. 6:45 am. Day traders came in buying with anticipation of increasing cold for week 2-3 forecasts next week.
Weeks 3 and 4. More cold:
Seasonally, we've past the climatological mid point of Winter and coldest time of year ON AVERAGE. February looks to continue cold compared to average but probably not as cold as what we just experienced.
https://www.cpc.ncep.noaa.gov/products/predictions/WK34/

+++++++++++++++++
These were the 7 day temperatures for next Thursday's EIA report.
The coldest color bar on the anomaly map(2nd one) is -16 even though this extreme cold had -18 and -20 deg. F isotherms that were colder than the coldest color bar.
Since this was also just past our coldest time of year and the cold impact some high population density regions, the EIA drawdown number next week will be massive.
https://www.cpc.ncep.noaa.gov/products/tanal/temp_analyses.php

Compare that to temperatures from yesterday's report (below) that featured a -242 Bcf draw down.
Will the EIA next Thursday be more than -300 Bcf? What do you think Larry? How many have been that big before?
The 12z European Ensemble model (purple/left) had -6 HDDs compared to the previous 0z run, which caused a small drop but NG was on a tear higher today because of the cold February forecast and the fact that March is priced pretty low vs the February that just expired/went off the board.
Next weeks EIA storage number will be a massive draw down.
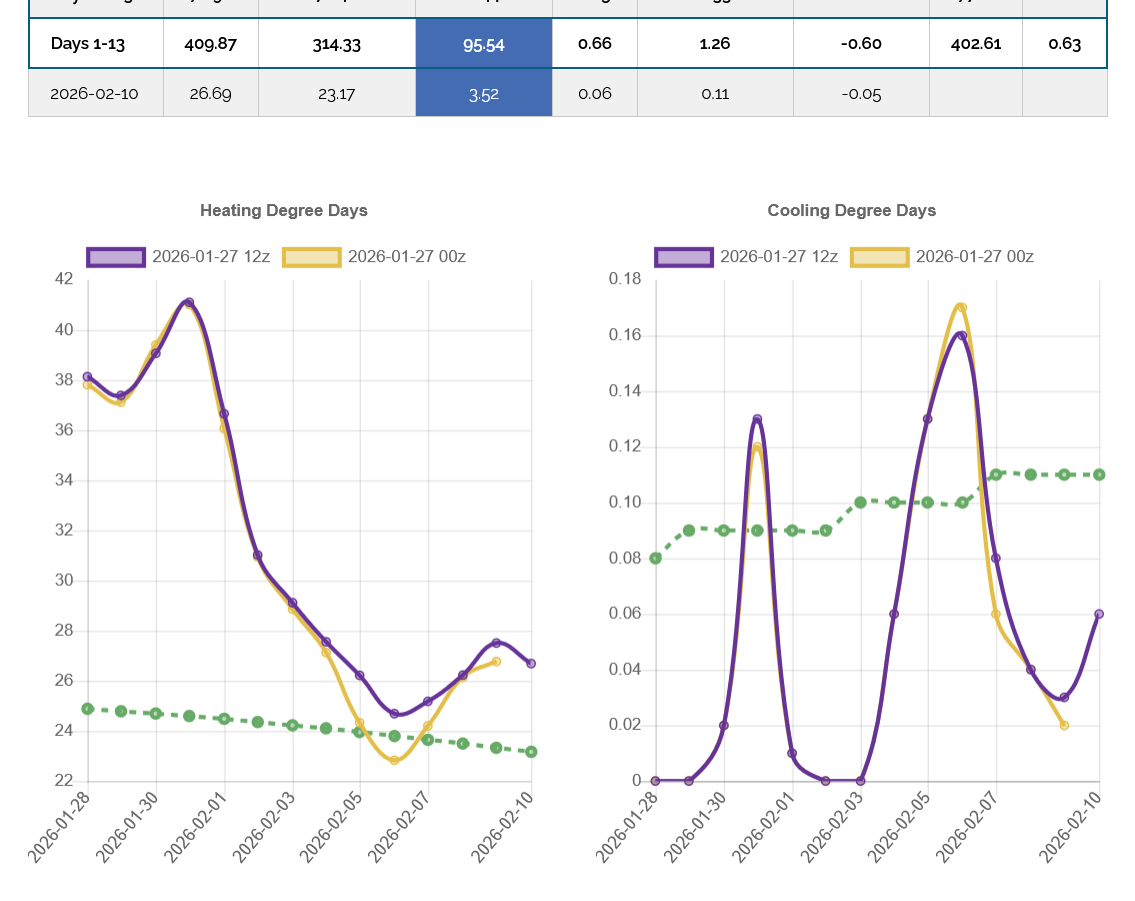
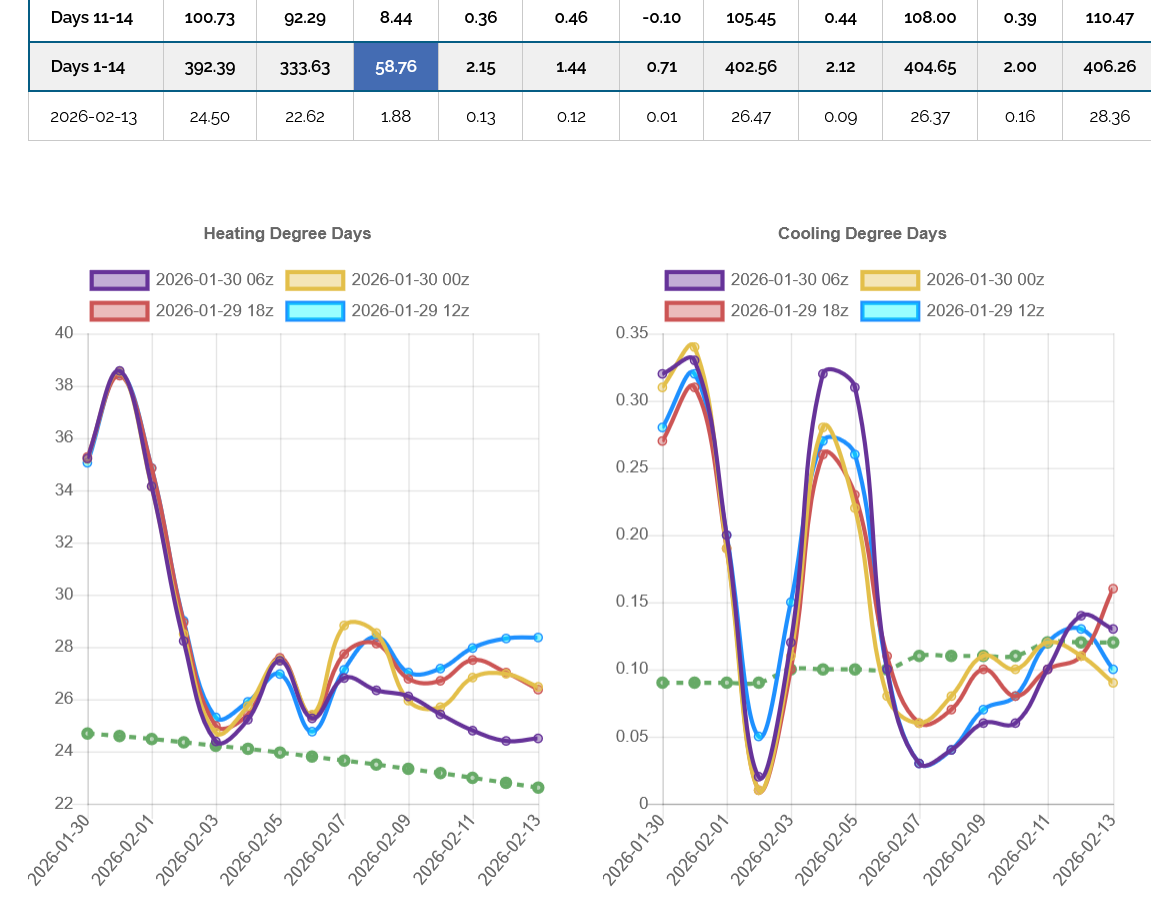
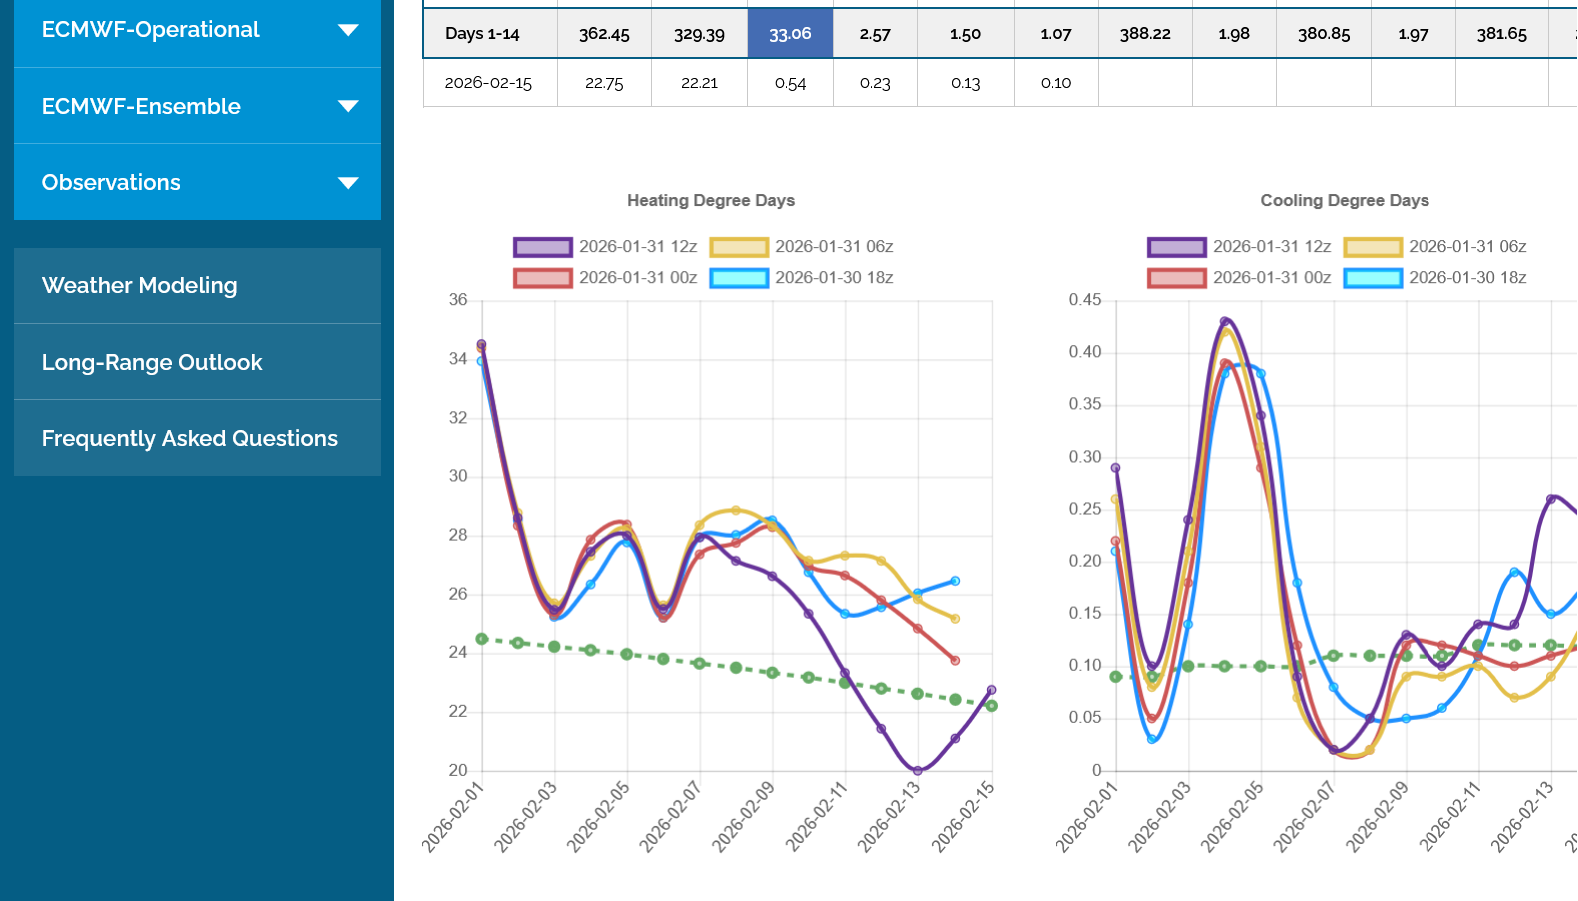
Holy Cow! This last 12z GEFS (purple/left) was incredibly milder in week 2.
The European Ensemble was also milder but not by this magnitude. The NG price was +$5,000/contract and closed on the highs on Friday suggesting a gap higher open on Sunday Night but this change in the weather suggests a MUCH LOWER open..........if it holds.
+++++++++++++++++++
8pm: The last 18z model in purple below, took back some of the warm up(12z run now in yellow/left) but is still MILDER than all the previous runs before that:
SHARPLY lower open!
4:55pm: HUGELY lower open!
Even though we were +$5,000/contract higher on Friday, our gap today was a DOWNSIDE gap lower!!!
$6,000/contract lower on the open. The time to short was Saturday, when the models turned much milder............but the markets were closed.
I missed the open because it opened way lower than my selling price. In this sort of market, selling on Friday was too risky.
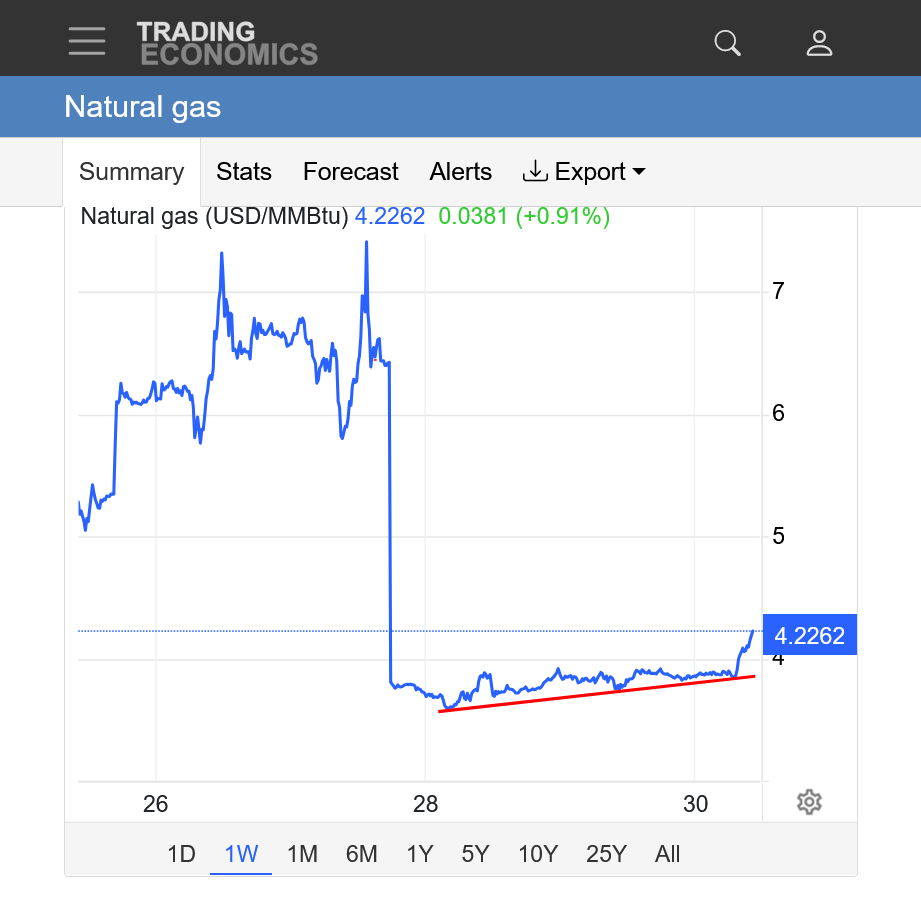
https://tradingeconomics.com/commodity/natural-gas
Top RED line was the close on Friday, +5,000/contract.
Bottom line was the open Sunday, BELOW the low on Friday and a GAP LOWER -$6,000/contract. I've never seen this happen before in 34 years of trading!
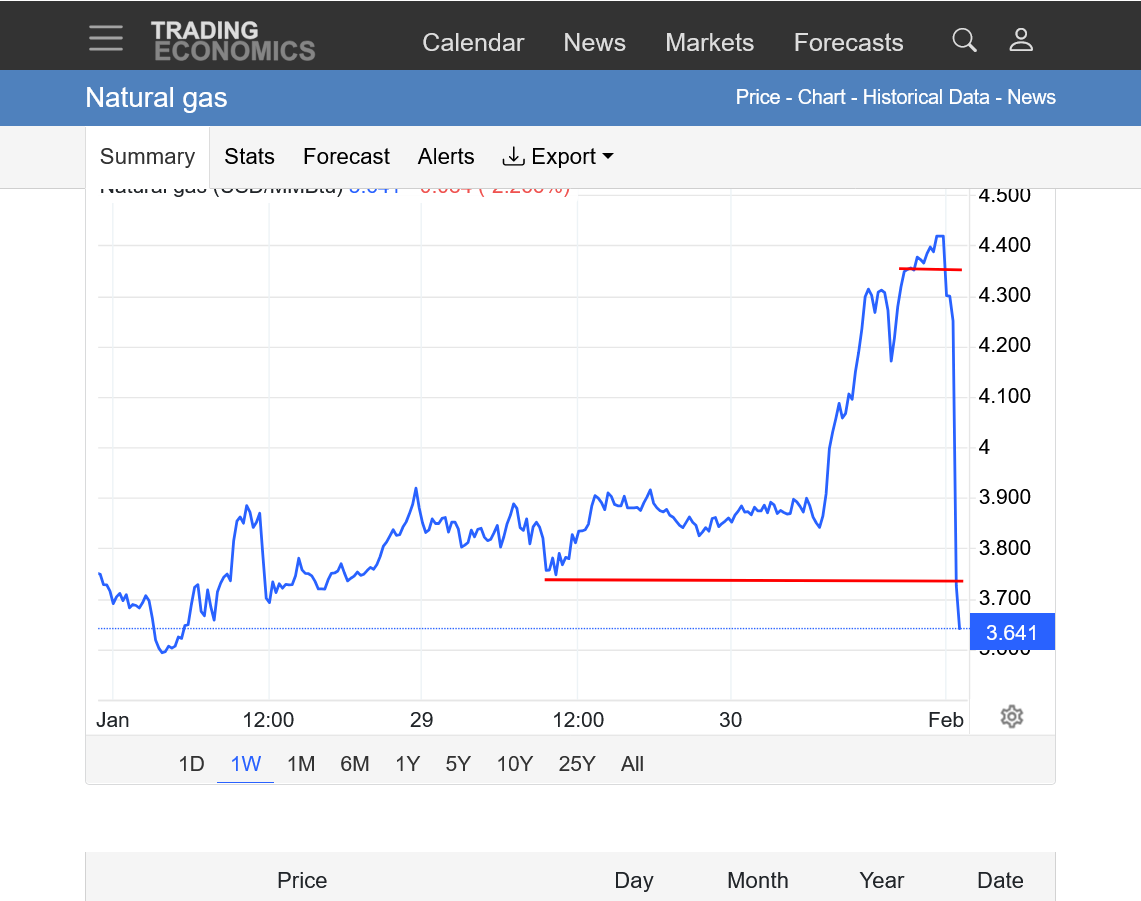
On Friday, front month March was at a premium of $3,500+ to the April.
Now at just +$700 vs the April. Of course this is overdone and we should get some sort of bounce back.
+++++++++++++++
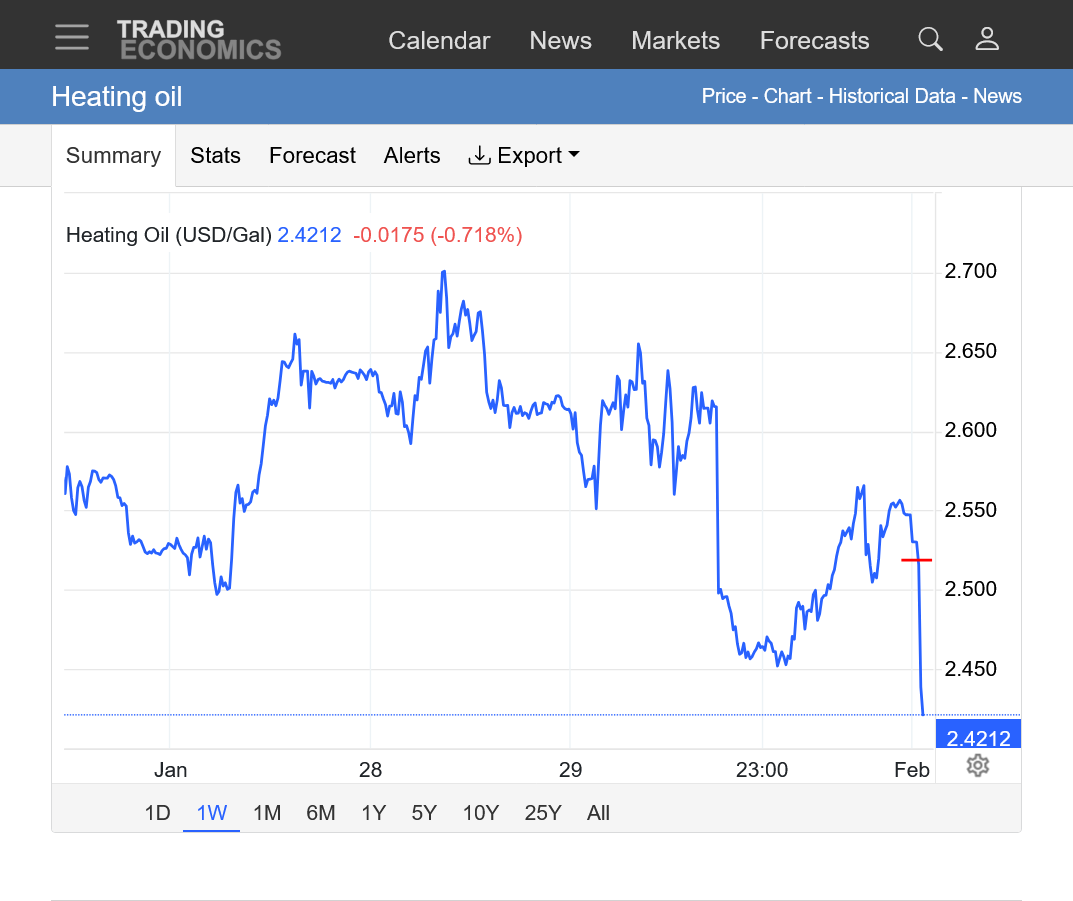
The heating oil market below, actually didn't open that much lower(no gap) red line. Traders that sold that market on the open were able to get more bang for their buck because the NG gap so incredibly low on the open. NG is a much more sensitive weather market by a mile but in this case the delayed reaction by heating oil would have been the way to go. No way would I have been able to know this before the open.
In fact, my trading program would not even show prices the first 5 minutes, other than bids/offers. Not sure if it was overwhelmed or what.
https://tradingeconomics.com/commodity/heating-oil
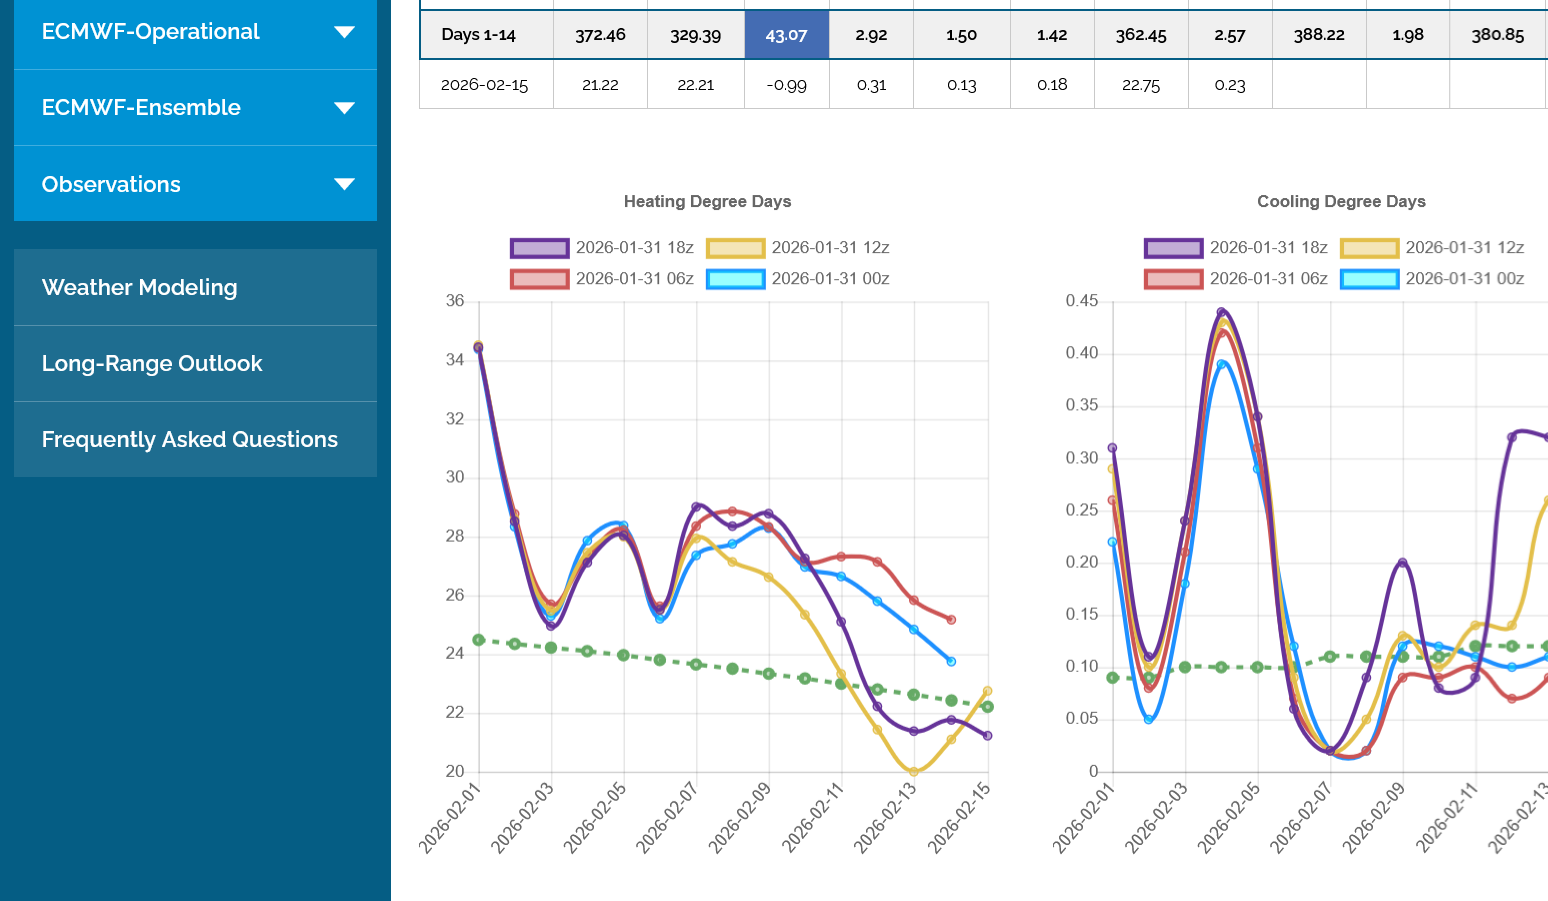
1. This was the last 12z European Ensemble model on Sunday(purple/left). HDDs in week 2 are now BELOW average(much milder temps)
2. This was the last 12z EE model on Friday. It was -6 HDDs BEARISH but the market completely ignored it after a small blip down. I had a selling set up triggered by that milder run and would have been run over by the bulls stampeding upwards Friday afternoon if short. This was actually in the early stage of the models turning milder which amplified over the weekend.
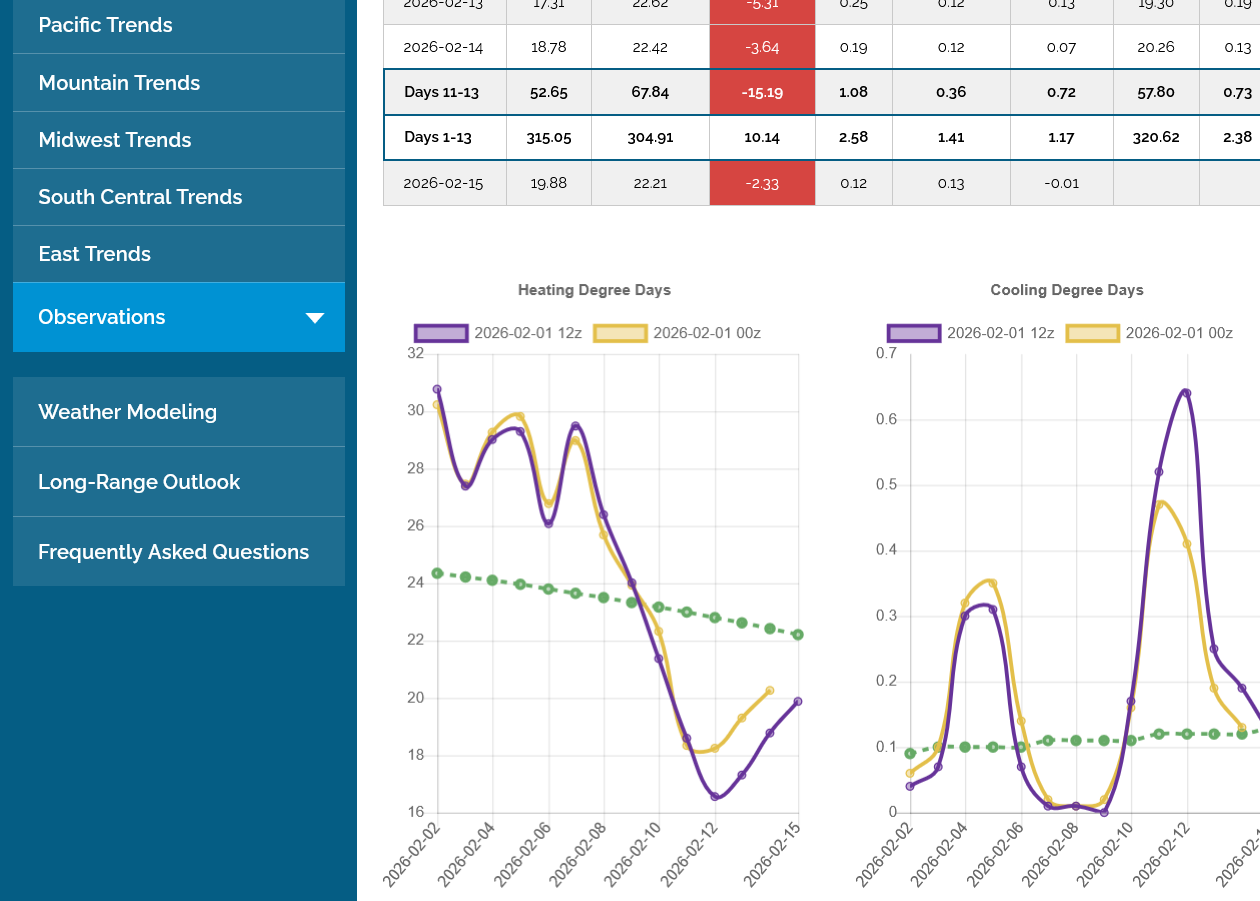
The 12z European Ensemble model (purple/left) had -6 HDDs compared to the previous 0z run,
1. Top line was Friday's close = +$5,000/contract
2. 2nd line was Friday's low
3. 3rd line was Sunday's open and high, -$6,000/contract. The space between the 2nd and 3rd line was/is a downside break away gap.
After immediately spiking to -$7,200/contract shortly after the open, we fought back up close to the open, testing the bottom of the gap/high and have fallen back close to mid range as I type.
https://tradingeconomics.com/commodity/natural-gas
Thanks, Mike.
I wonder if in addition to the Sun 12Z EE having a whopping 24 fewer HDD for 2/8-13 vs the Fri 12Z run if the warmer Sun Euro Weeklies week 3 (for 2/16-22) vs what Fri’s showed was an additional significant factor.
———
Edit at 1:20: I hope MM doesn’t mind but I started a new NG thread.
Yes, Larry that probably contributed a bit too.