Previous thread:
Frigid Blast
Started by metmike - Jan. 17, 2026, 10:44 p.m.
https://www.marketforum.com/forum/topic/117282/
+++++++++
Get all the comprehensive weather here:
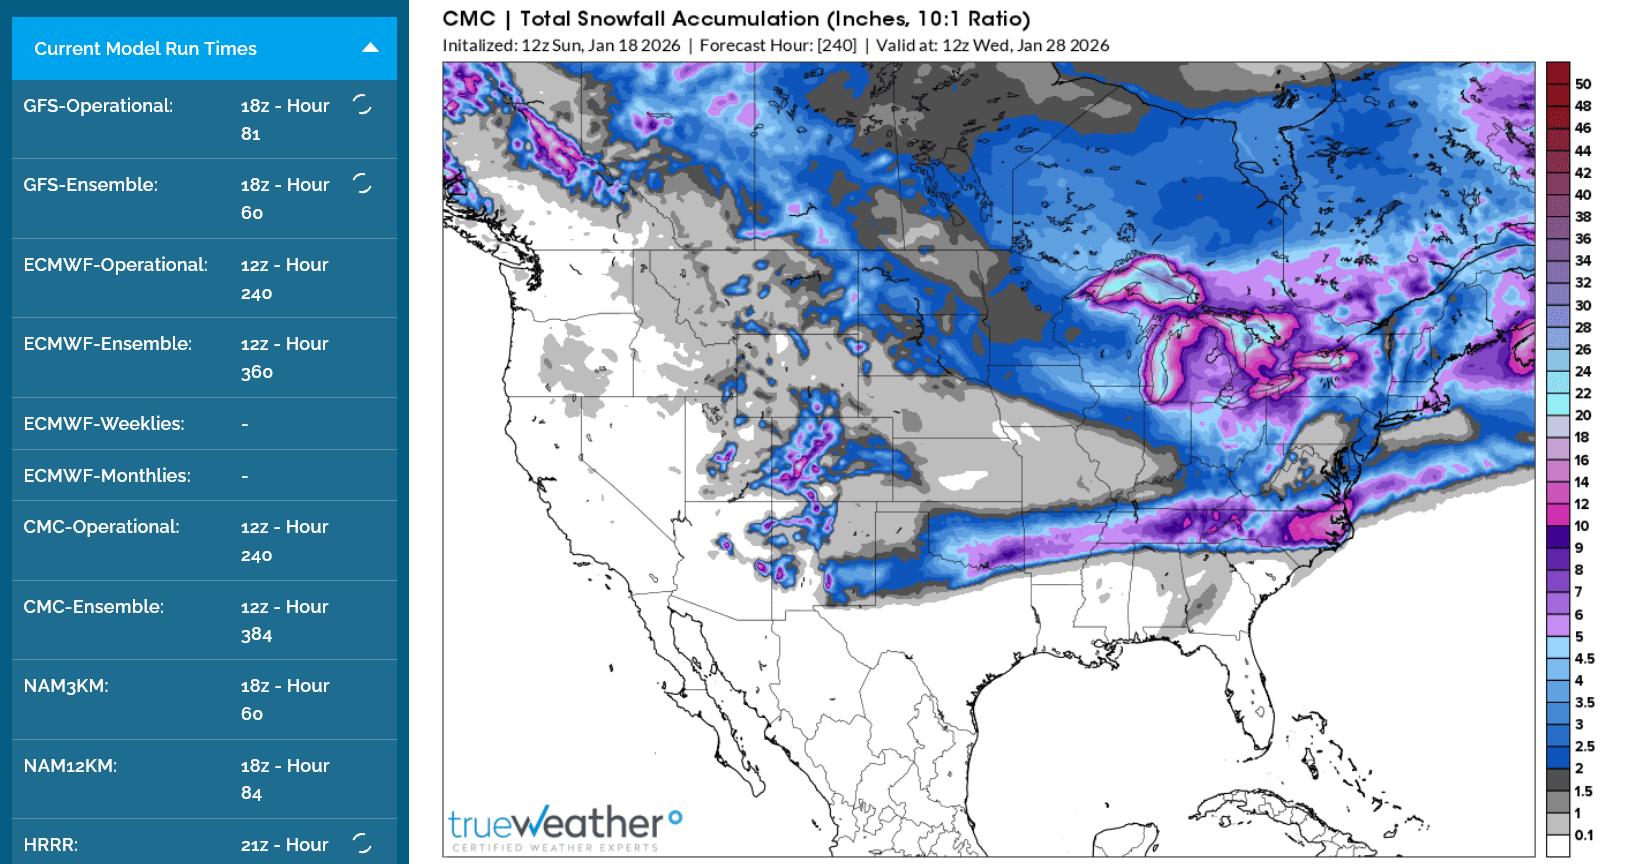
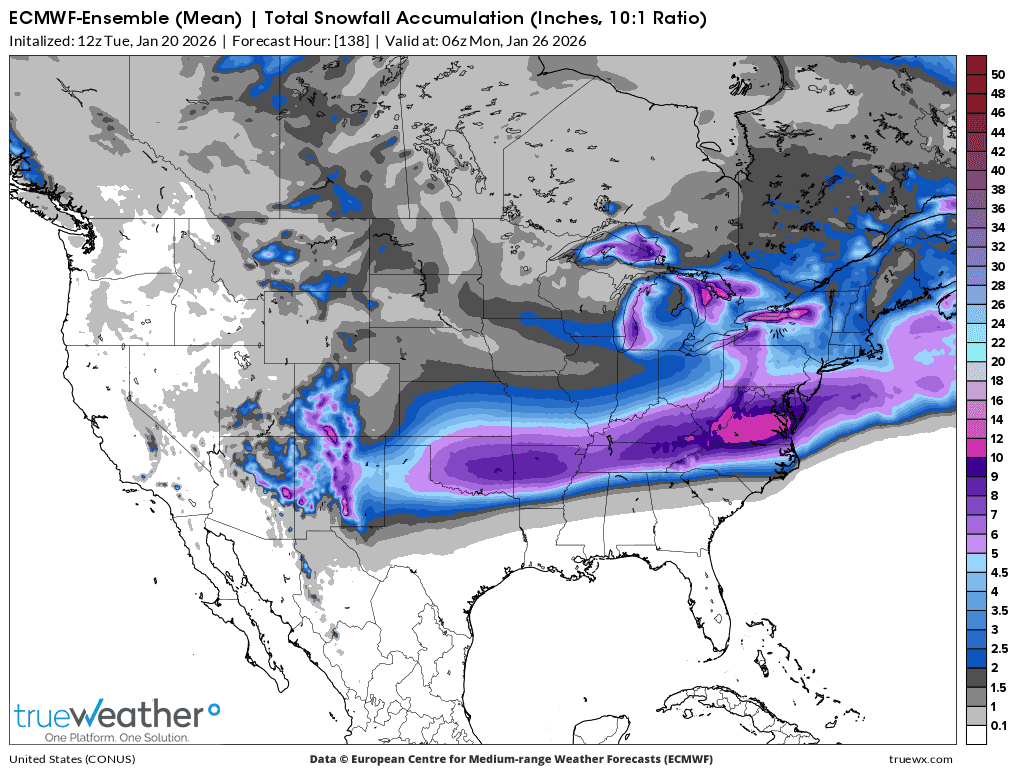
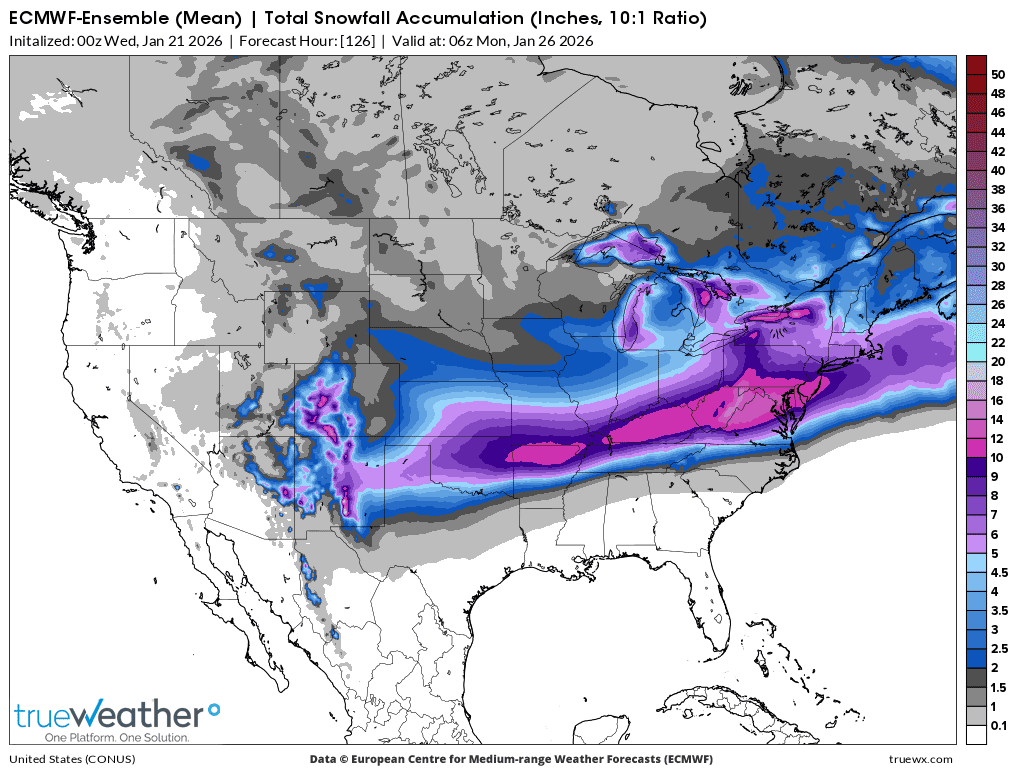
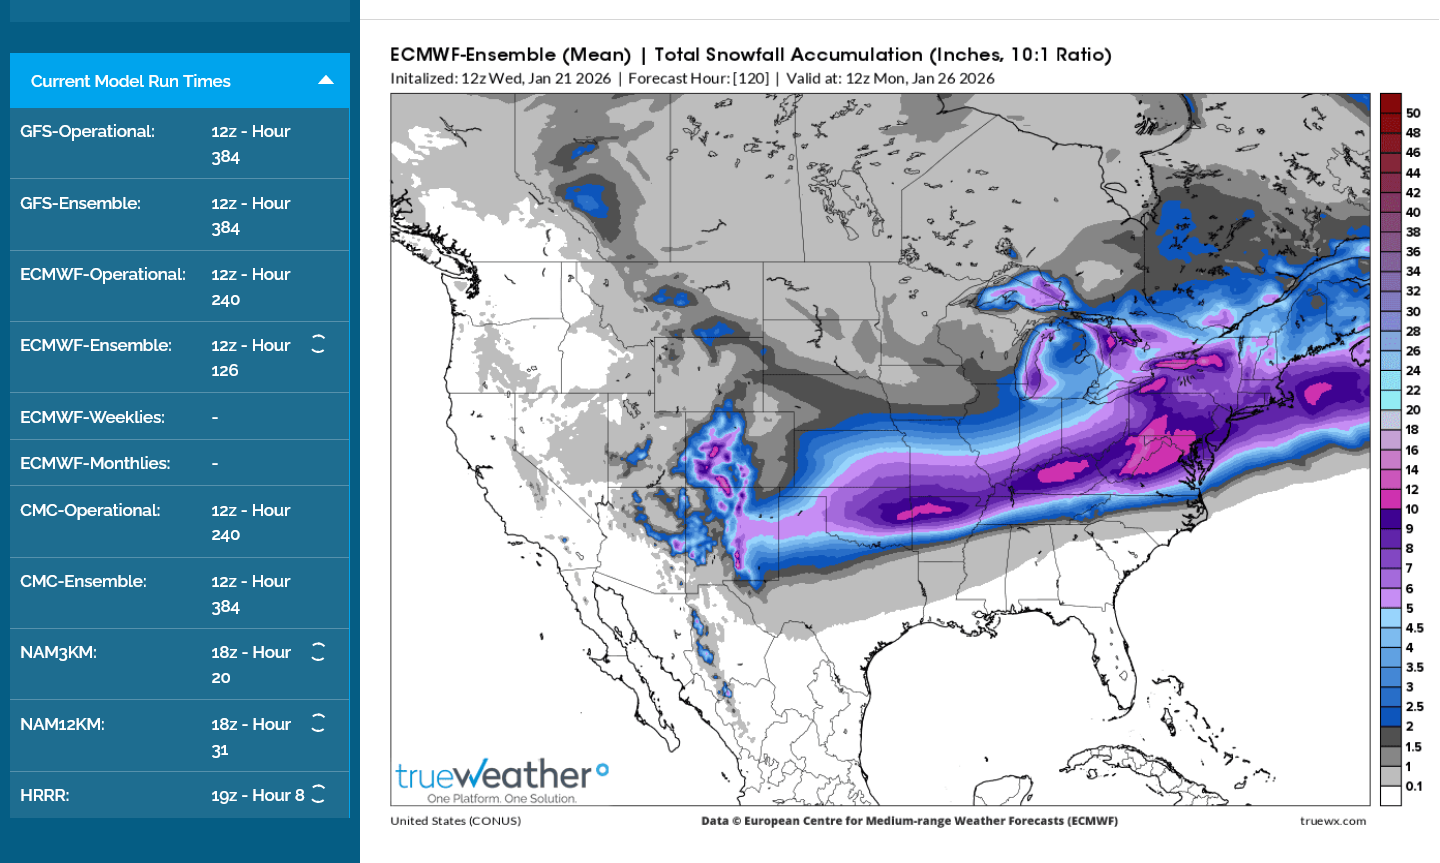
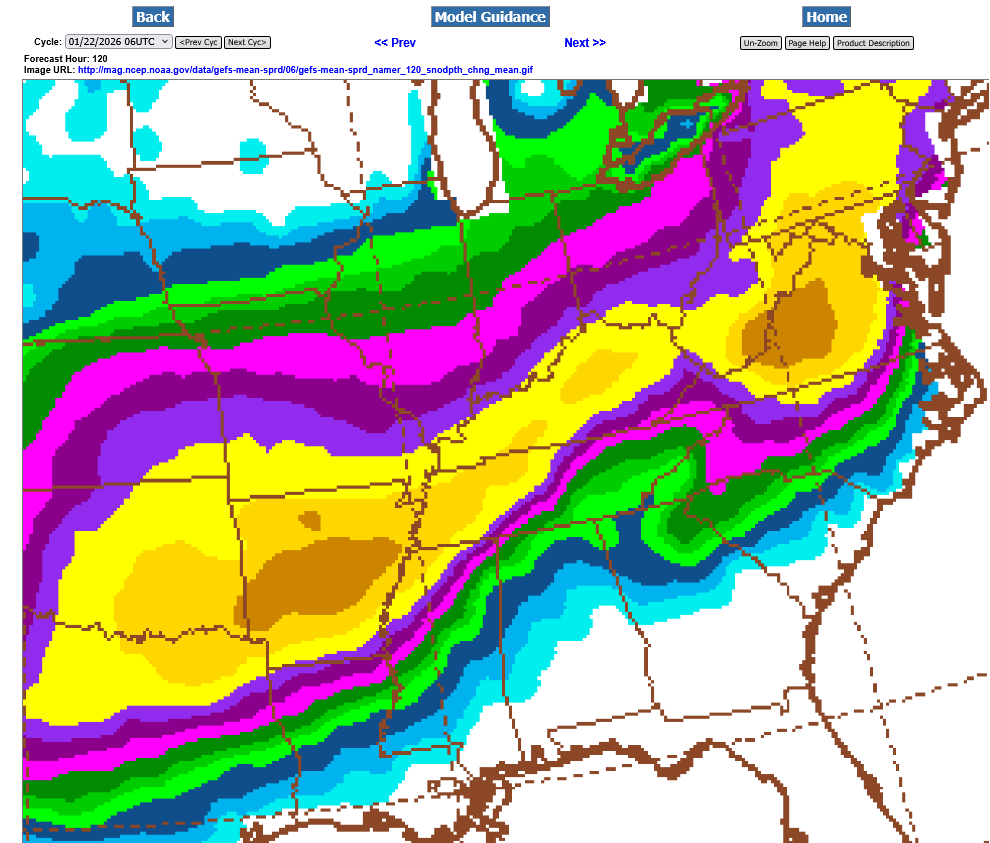
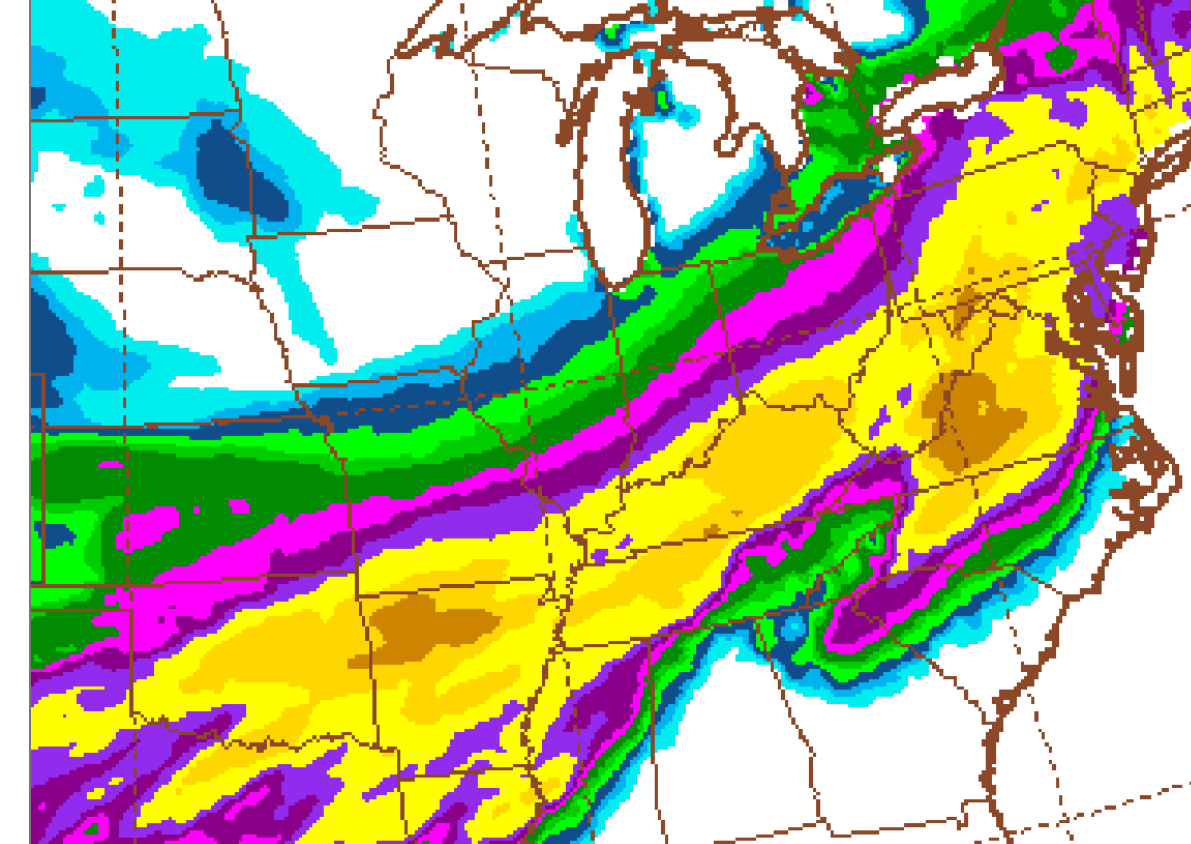
This is the total snow forecast the next 12 days from the most snow bullish model, the 12Z GEFS(American ensemble):
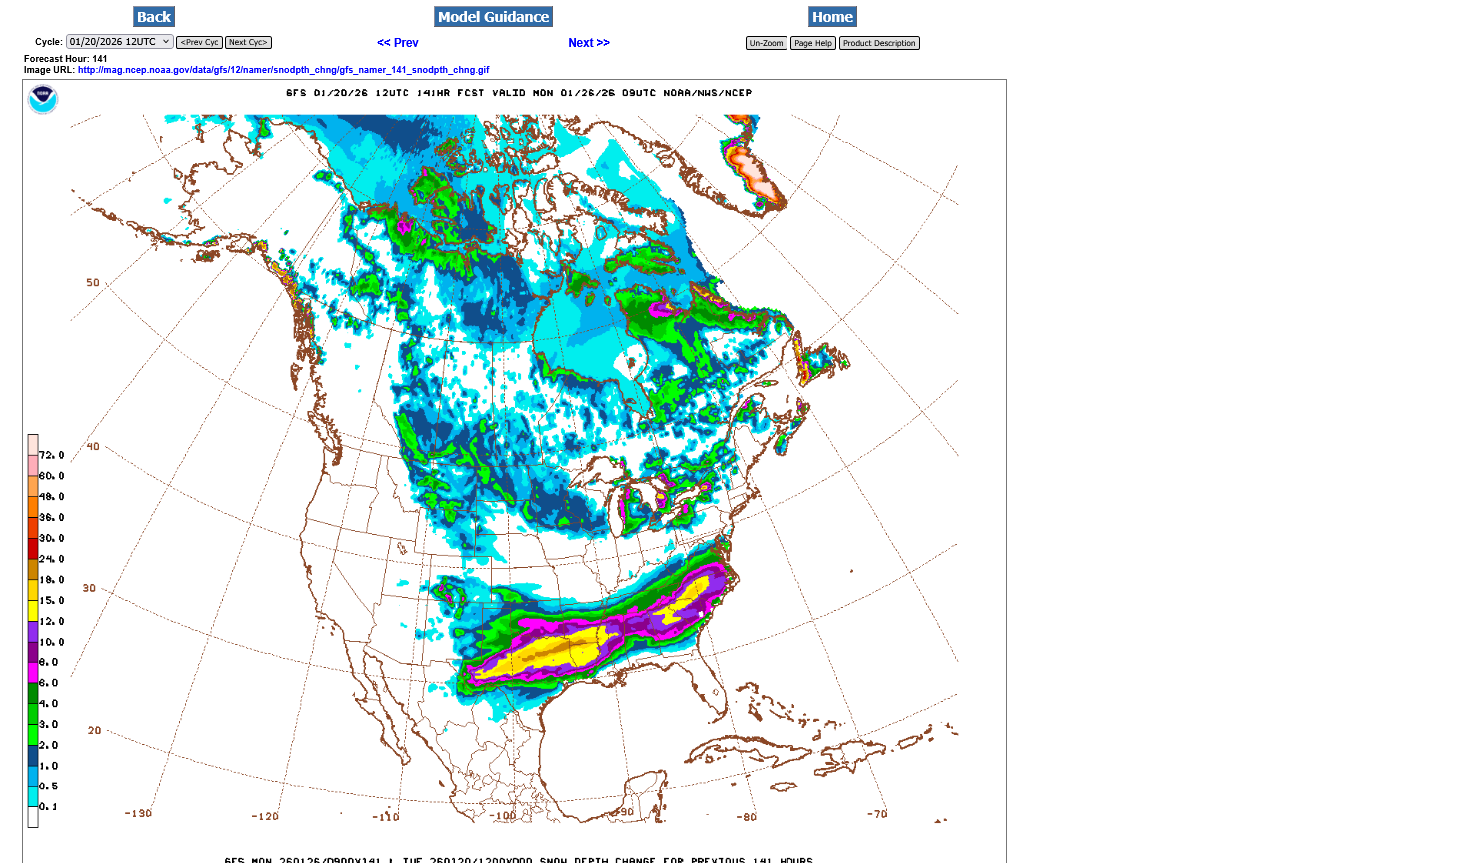
The system that just popped up in the last 24 hours is the southern system, with the heaviest amounts just south of the Ohio River. This will hit next weekend probably early. Extreme range in model forecasts, timing, locations and amounts. This COULD turn into a MAJOR heavy snow event in the Ohio River Valley or end up being a nothing burger and areas farther south getting dumped on. Just over 5 days to go before the potential impacts start.
LOOK FOR MAJOR CHANGES/UPDATES TO THE FORECAST THIS WEEK!
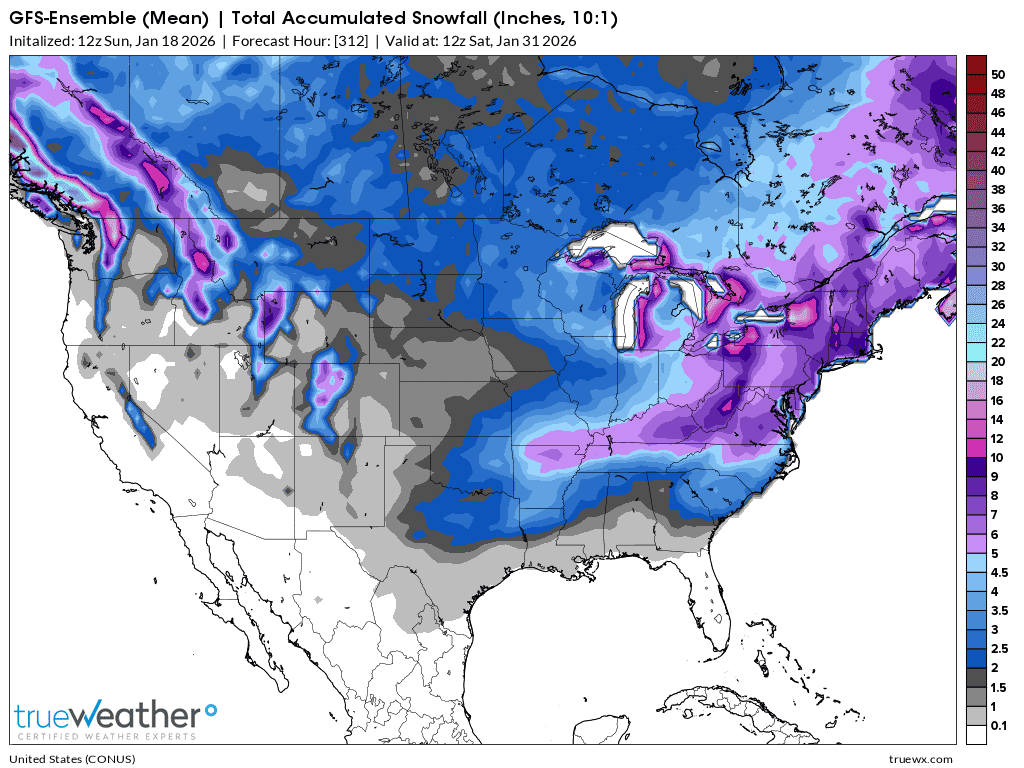
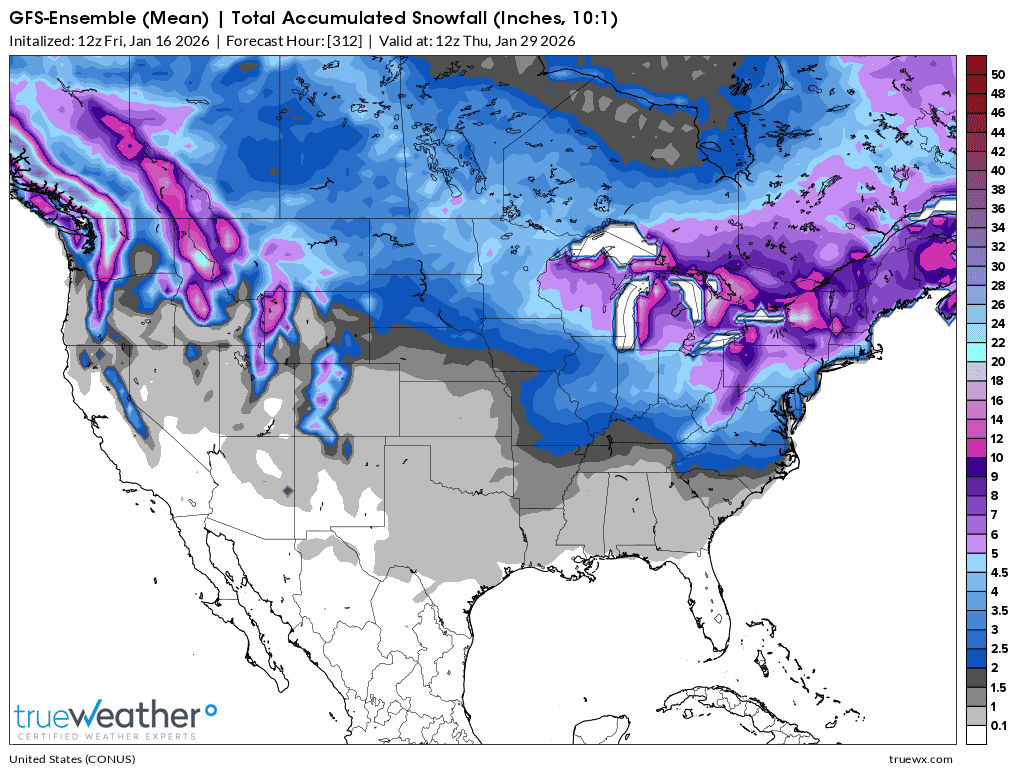
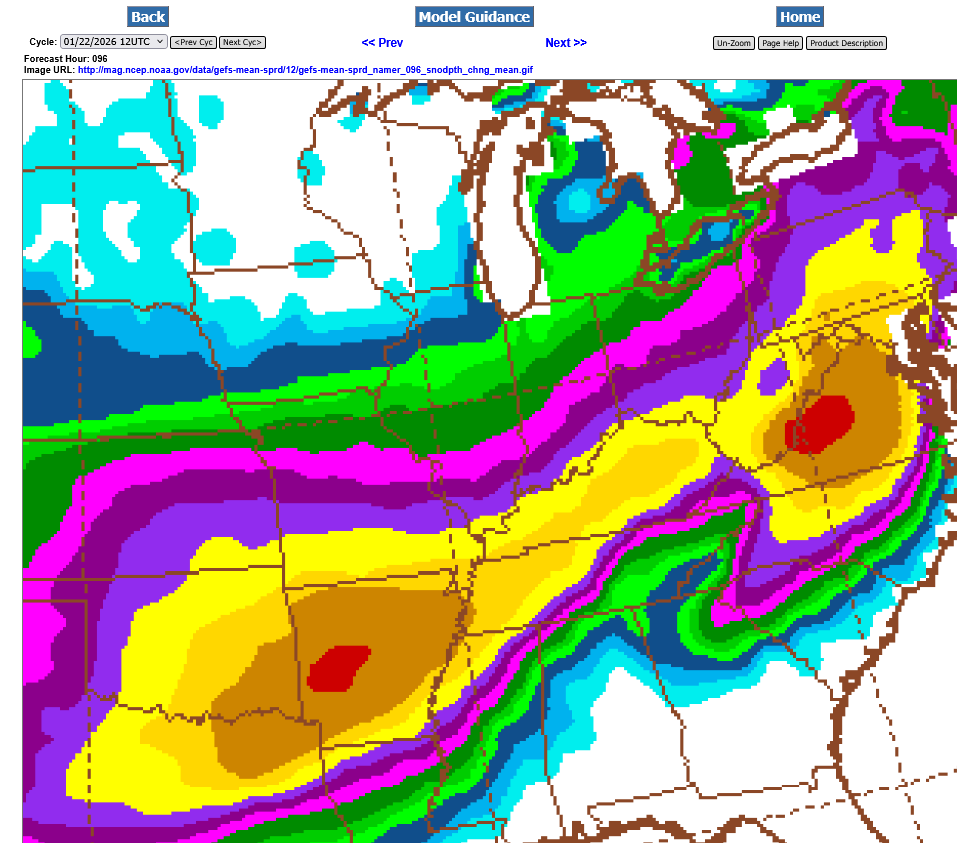
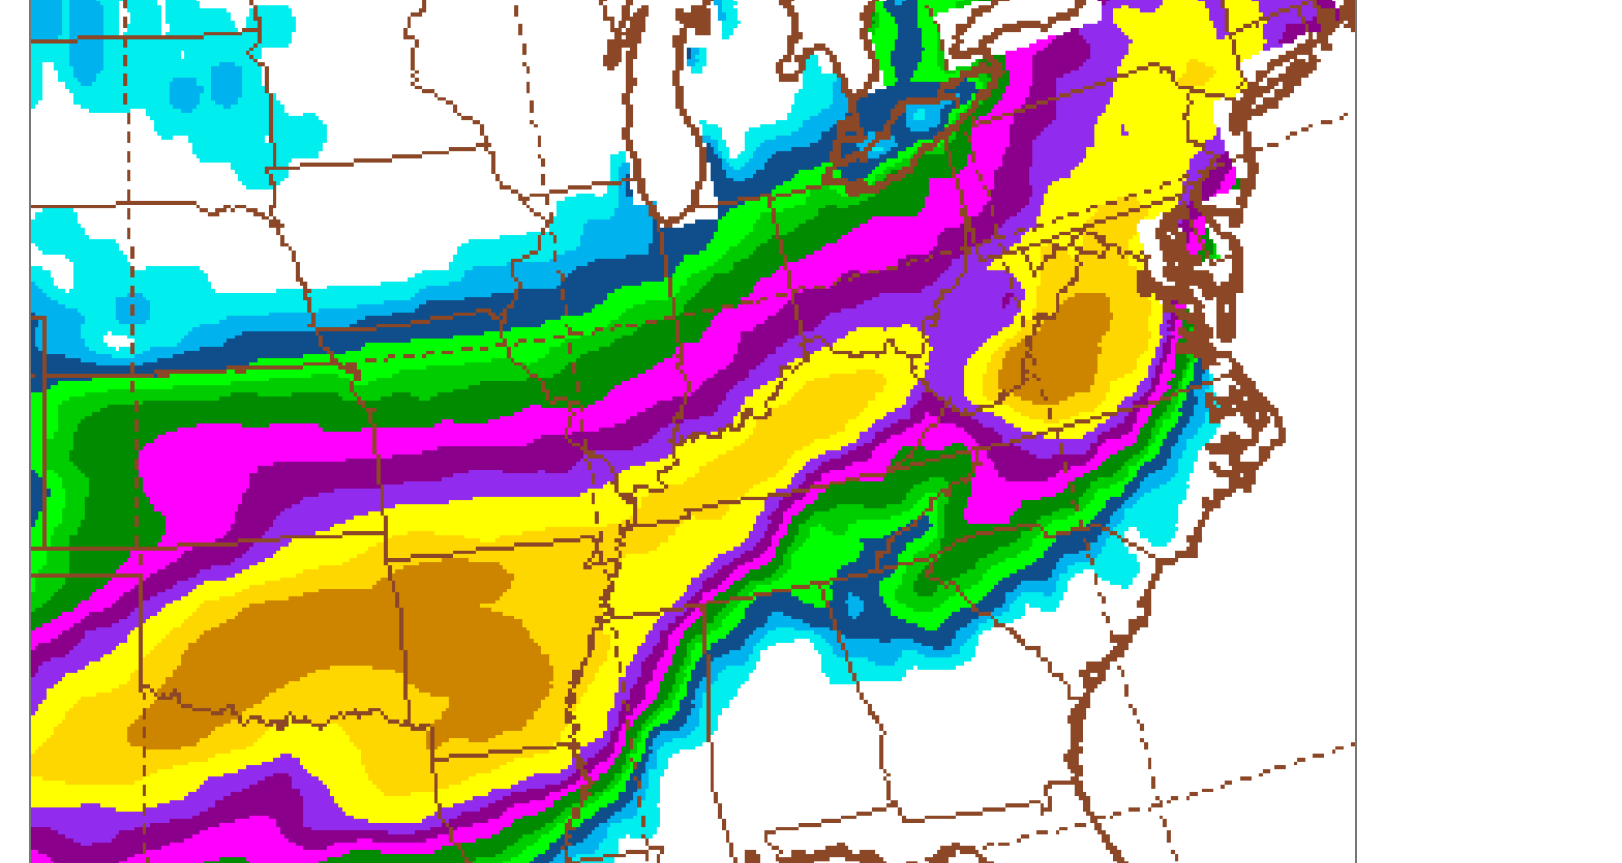
This was the same forecast just 2 days ago to demonstrate how this NEW farther south system just popped up. The forecast will continue to evolve!
++++++++++++++++++++++++++=
Some of the individual operation models have hugely different solutions:
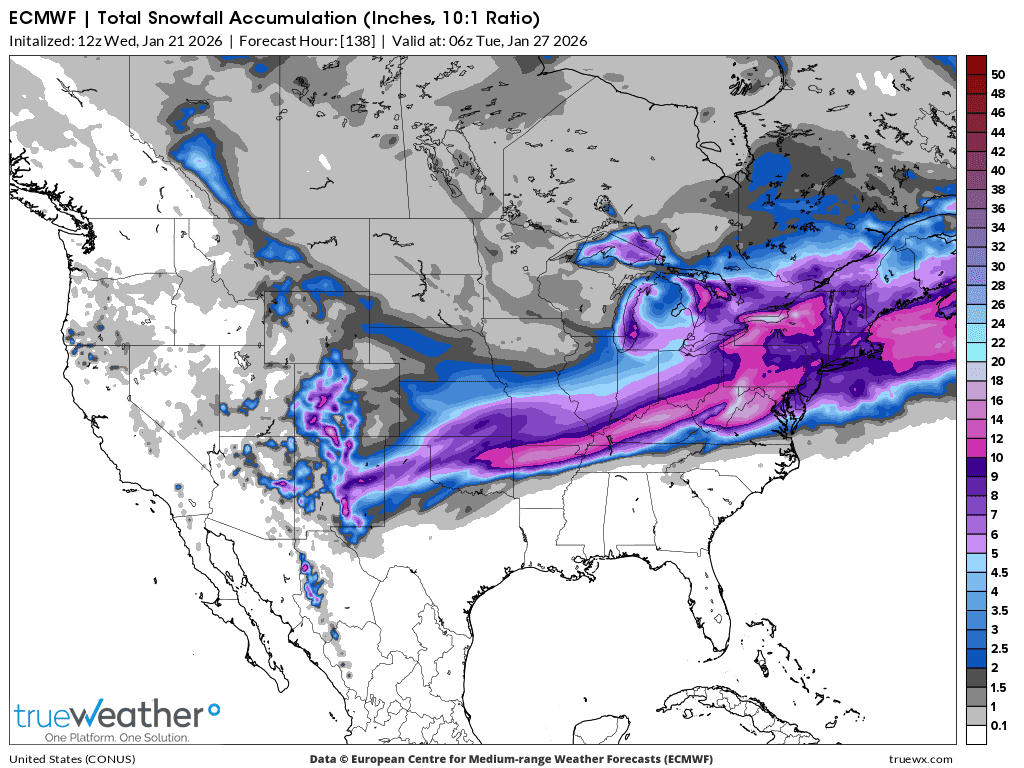
1. 12z European model Operational model 10 days
2. 12z GFS Operational model 10 days
3. 12z Canadian Operational model 10 days
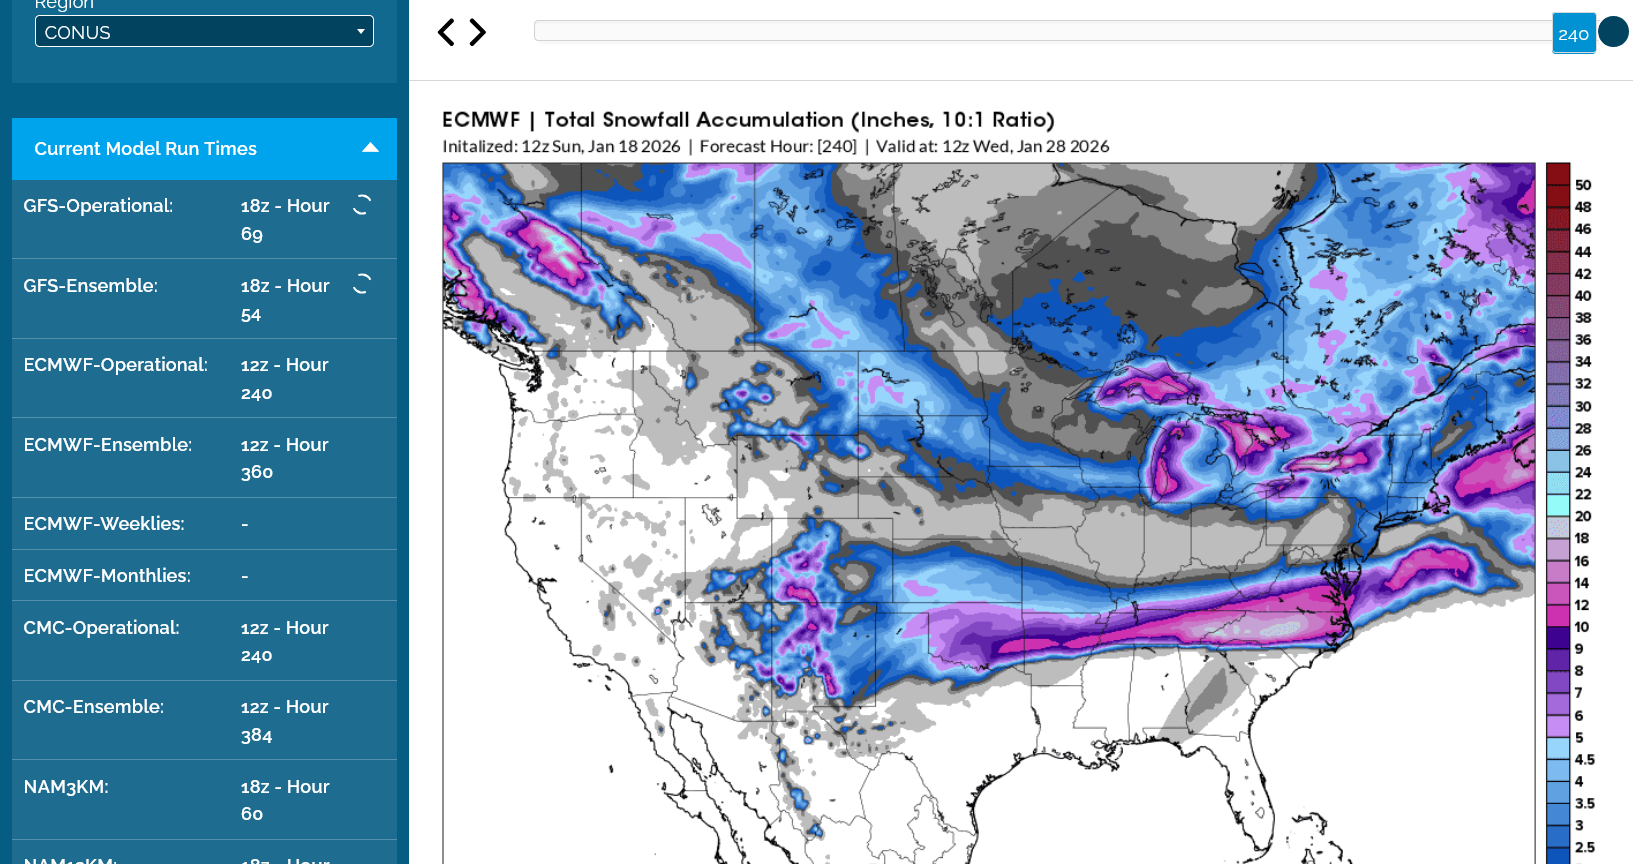
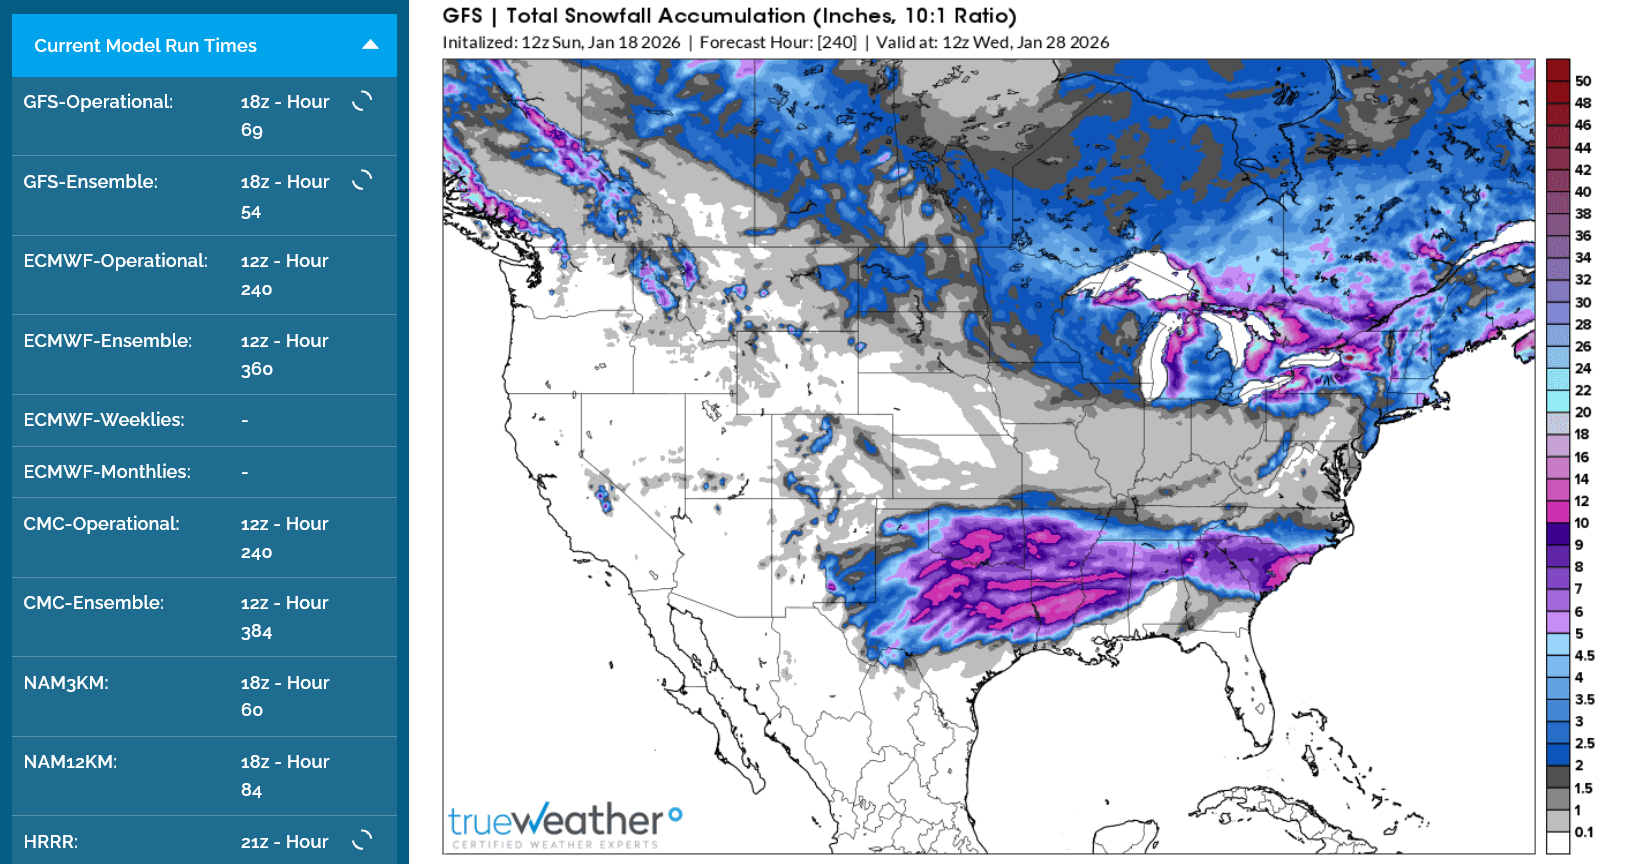
Let's focus in on just the MAIN event, especially since it's going to hit areas far south of typical of major snow events.
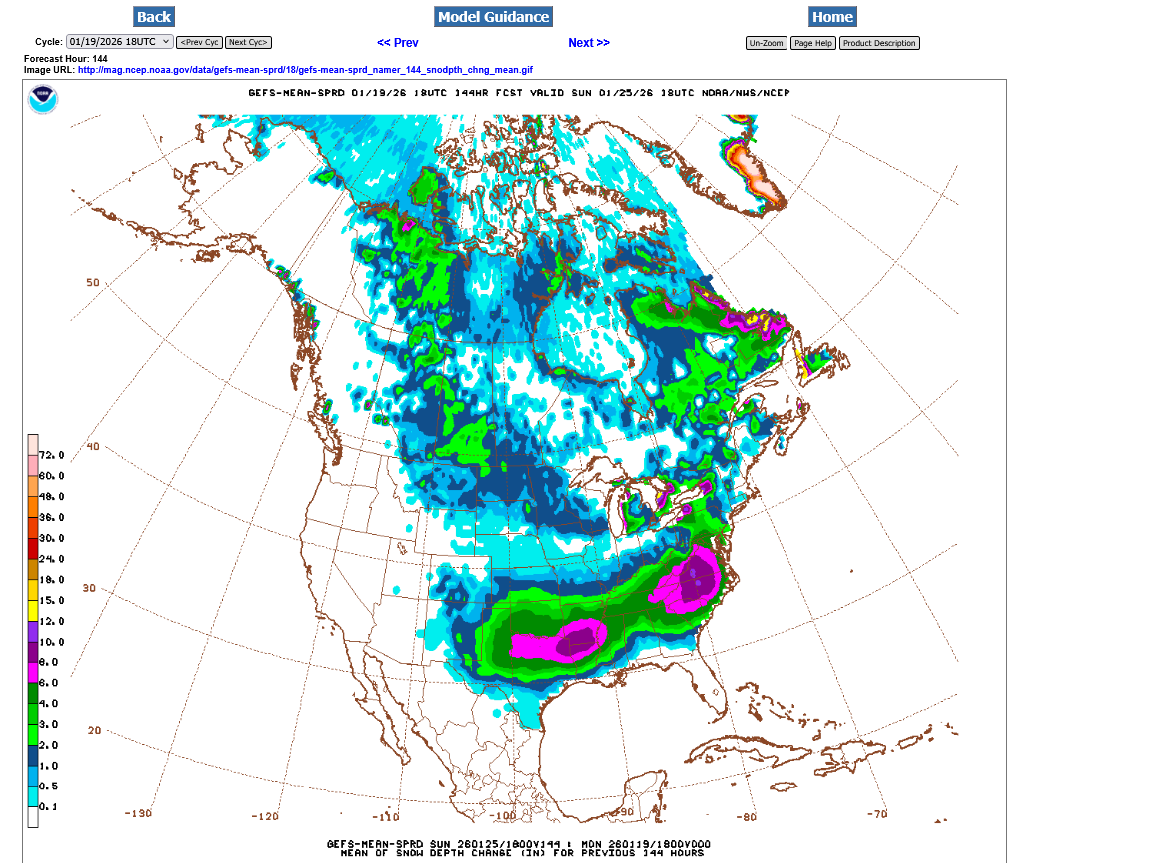
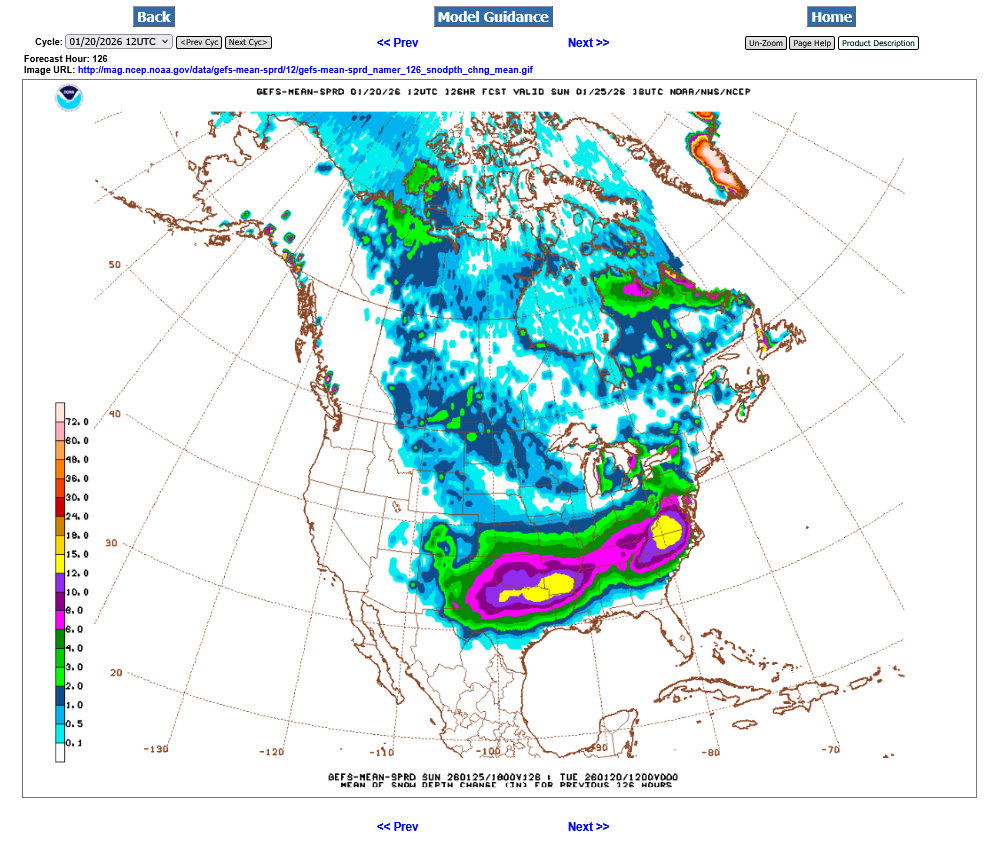
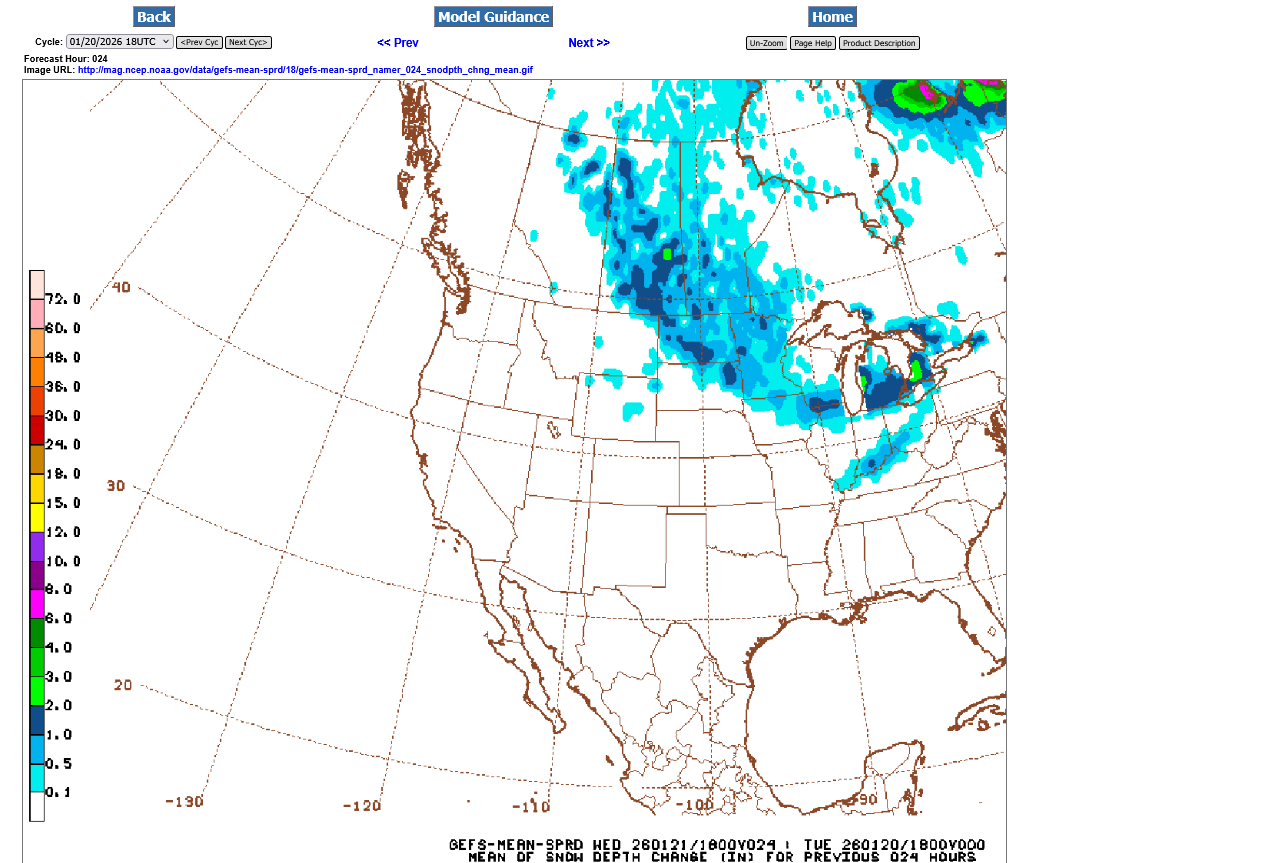
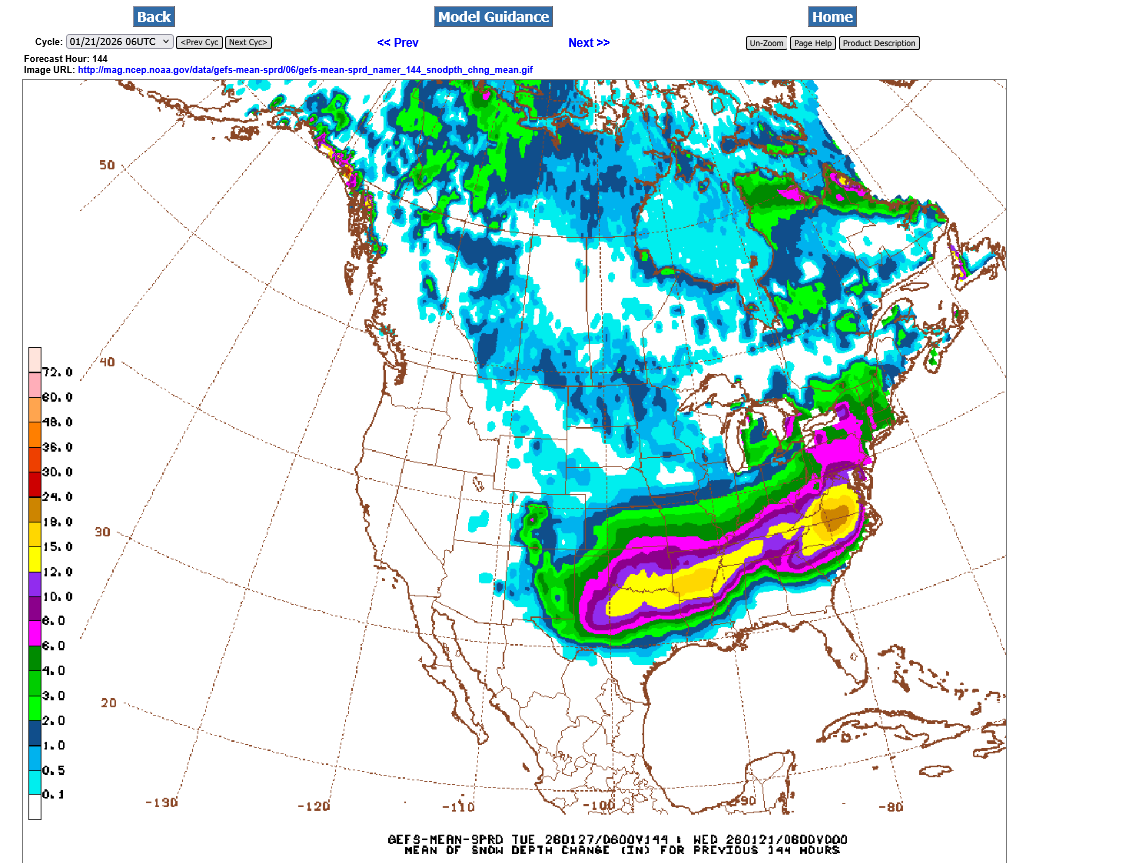
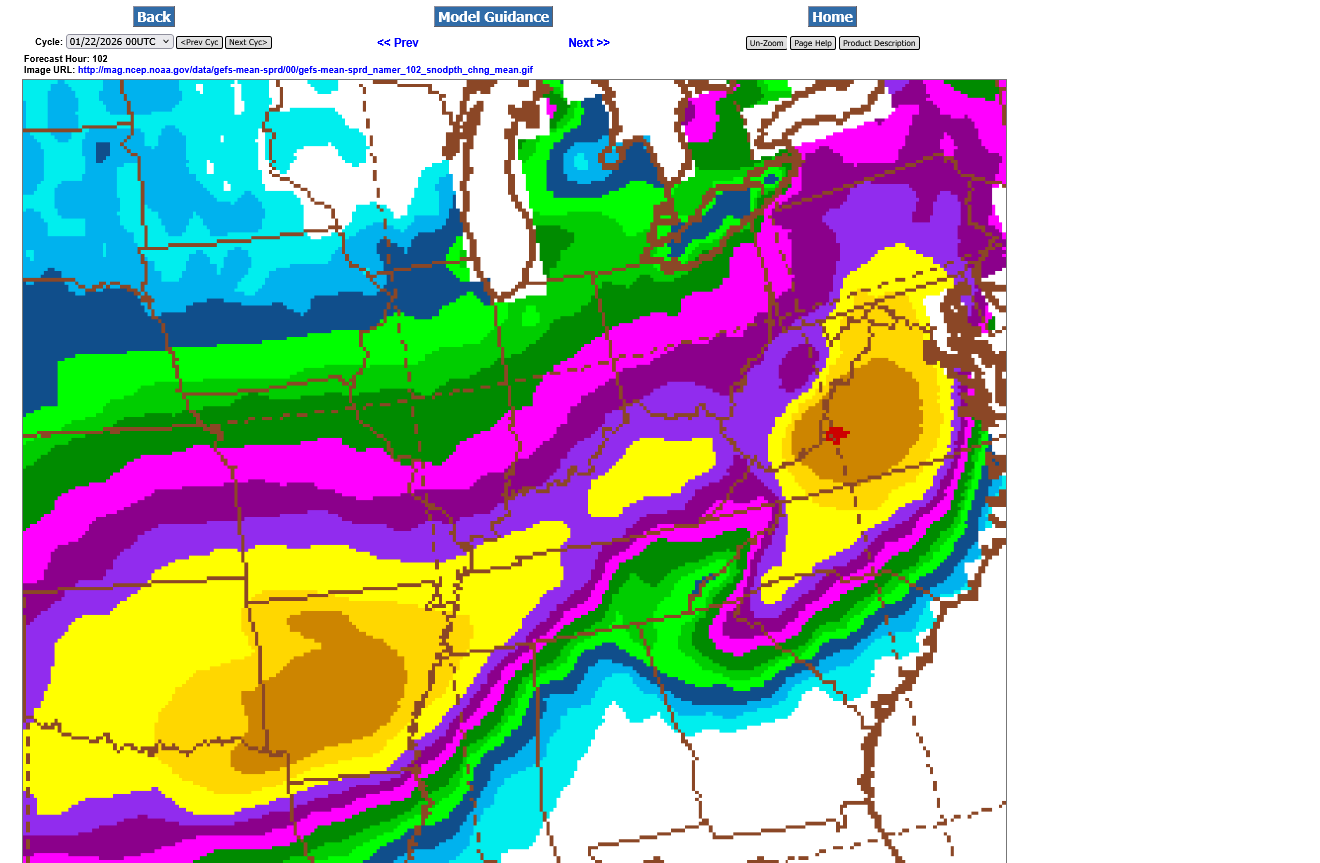
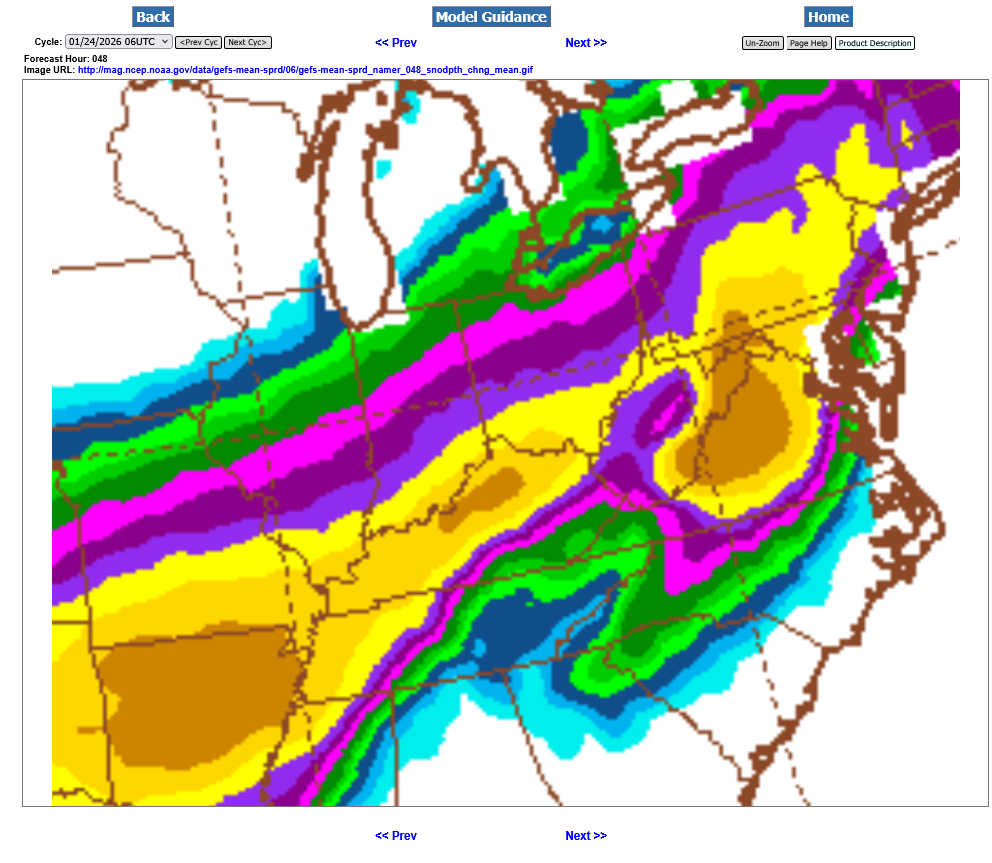
This was from the last 12z GEFS for the next 144 hours. These solutions from this particular source, the American model are available to the public for free, run every 6 hours. I also have a couple of other sources, especially awesome WeatherBell that requires a monthly fee(which WxFollower tipped me off about a couple of years ago).
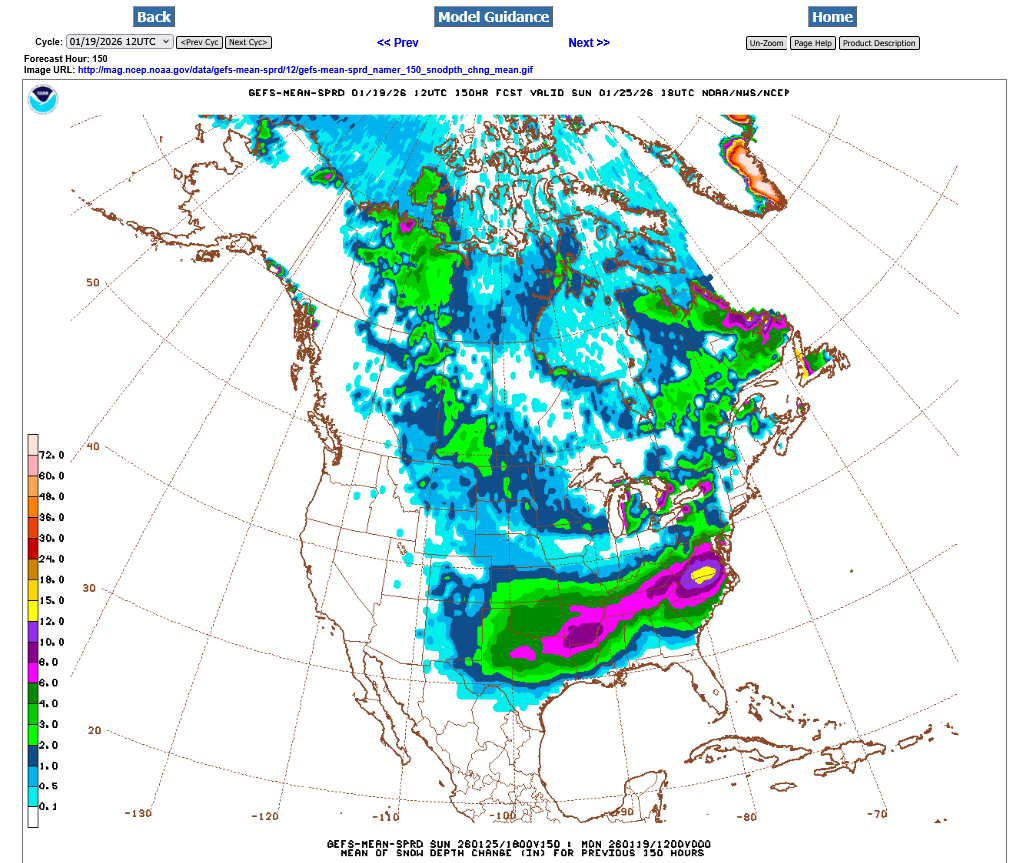
For this particular map above, the GFS ENSEMBLE(average of dozens of solutions/variations of the parent GFS model) you can go straight to #3 but I show how to get there from the main page.
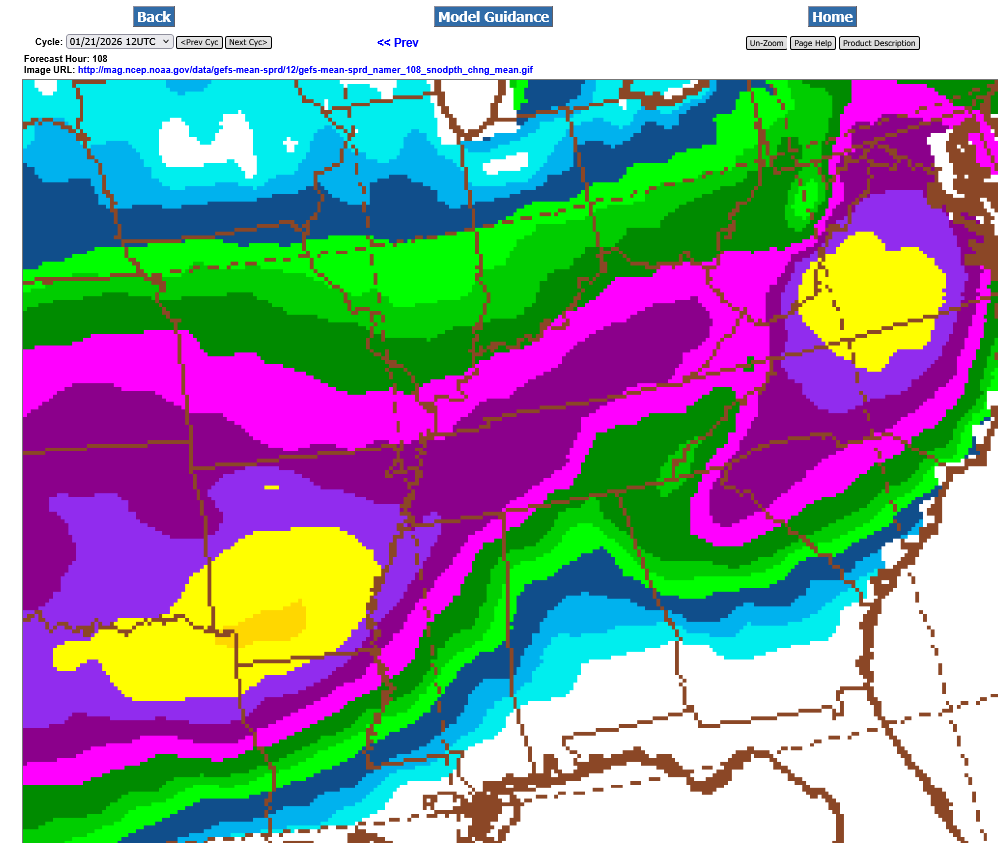
1. https://mag.ncep.noaa.gov/ go to MODEL GUIDANCE
2. https://mag.ncep.noaa.gov/model-guidance-model-area.php go to GEFS-MEAN-SPRD
3. https://mag.ncep.noaa.gov/model-guidance-model-parameter.php?group=Model%20Guidance&model=GEFS-MEAN-SPRD&area=NAMER&ps=area go to NAMER
Make this choice:
| | snodpth_chng_mean |
Go to whatever time frame that you are interested in.
++++++++++++++++
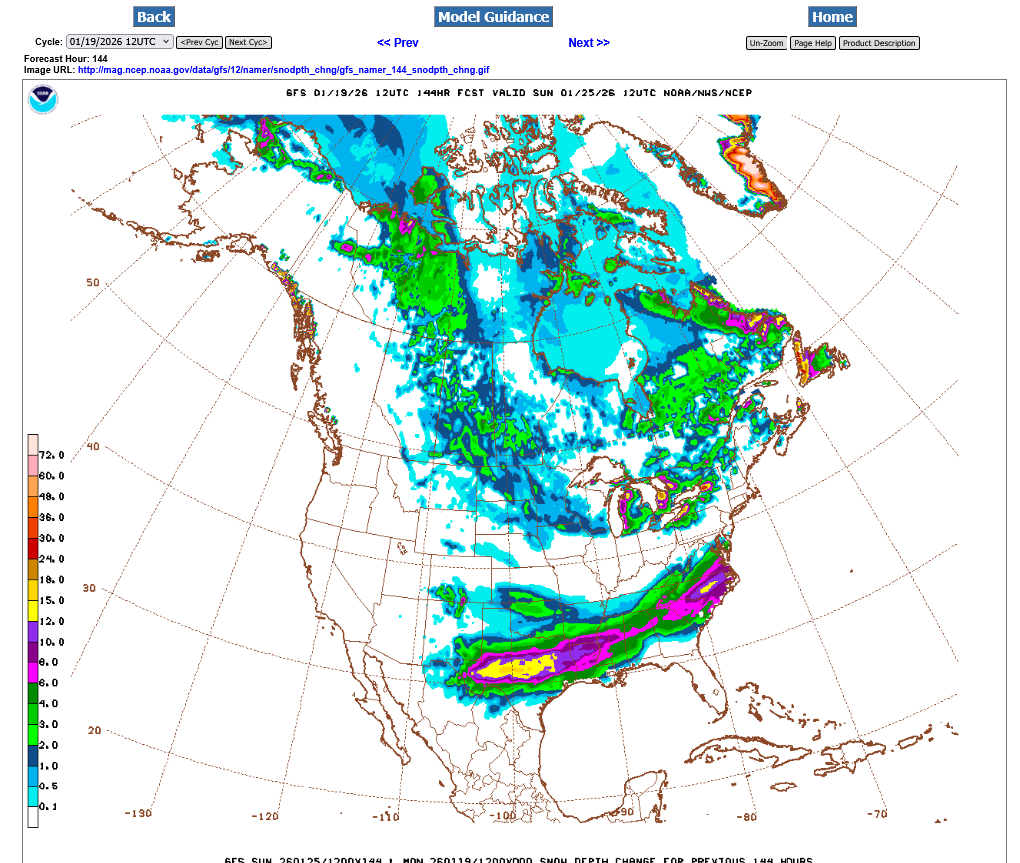
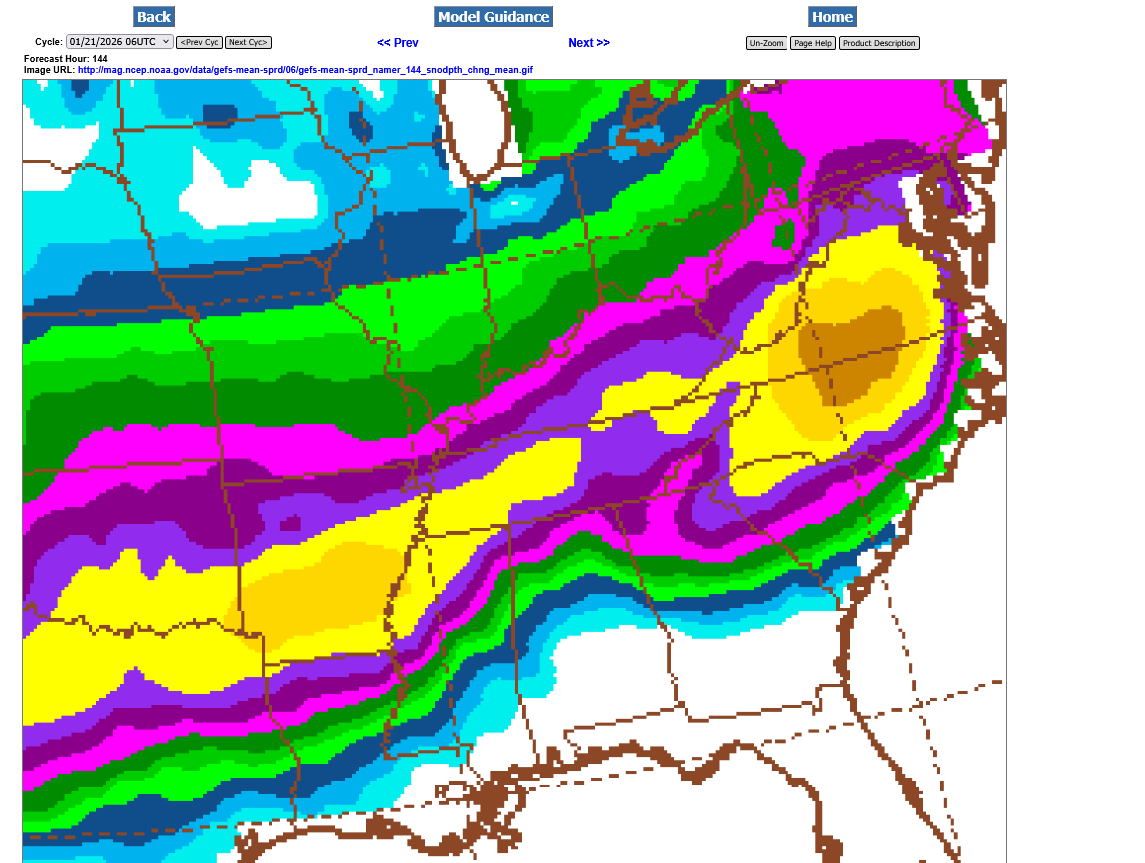
If you want to see the OPERATIONAL parent model take these steps after #1 above.
1. https://mag.ncep.noaa.gov/ go to MODEL GUIDANCE
2. https://mag.ncep.noaa.gov/model-guidance-model-area.php go to
Make this choice:
| | snodpth_chng |
This is the map you get for 144 hours
+++++++++++++=
Now that you've been trained to forecast the weather by an atmospheric scientist, you don't need to come here anymore
Seriously, I hope that provides some useful links for our weather lovers.
Winter Weather Forecasts
https://www.wpc.ncep.noaa.gov/wwd/winter_wx.shtml
Day 4-7 Outlook
Current issuance cycle: 12Z (updated 0636Z, January 19, 2026)
|
This is what the artificial intelligence thinks for Evansville IN: Just under an inch of snow:
Current Hazards at the link below.
For your NWS and county, go to the link below.
Then you can hit any spot on the map, including where you live and it will go to that NWS with all the comprehensive local weather information for that/your county.

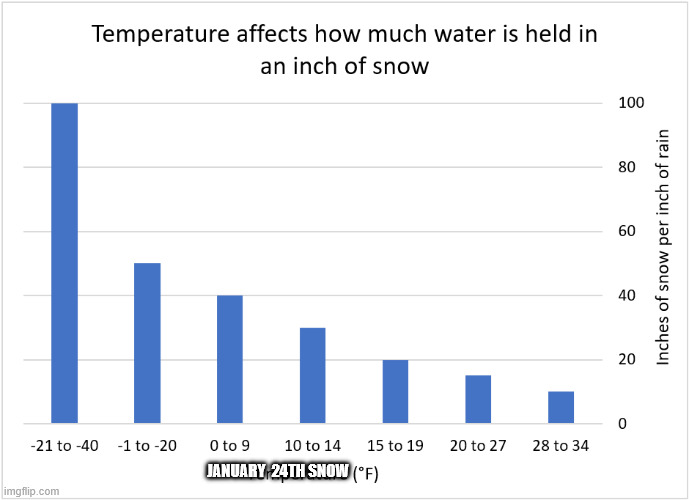
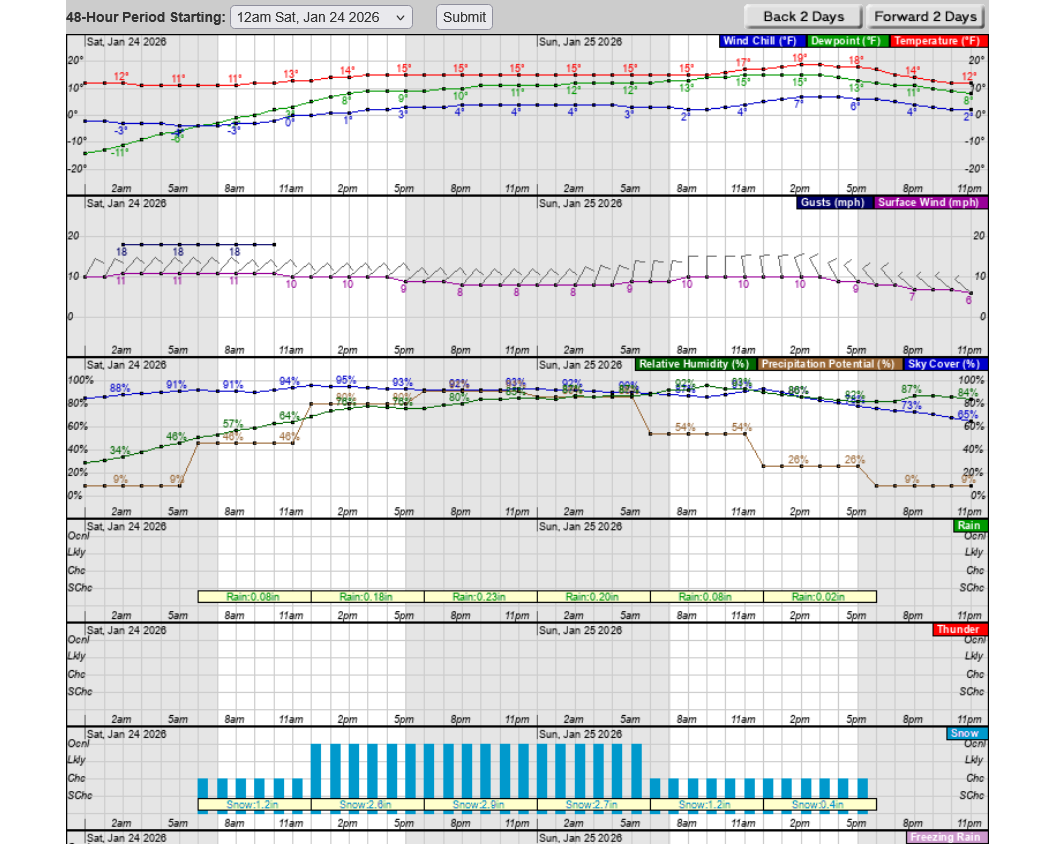
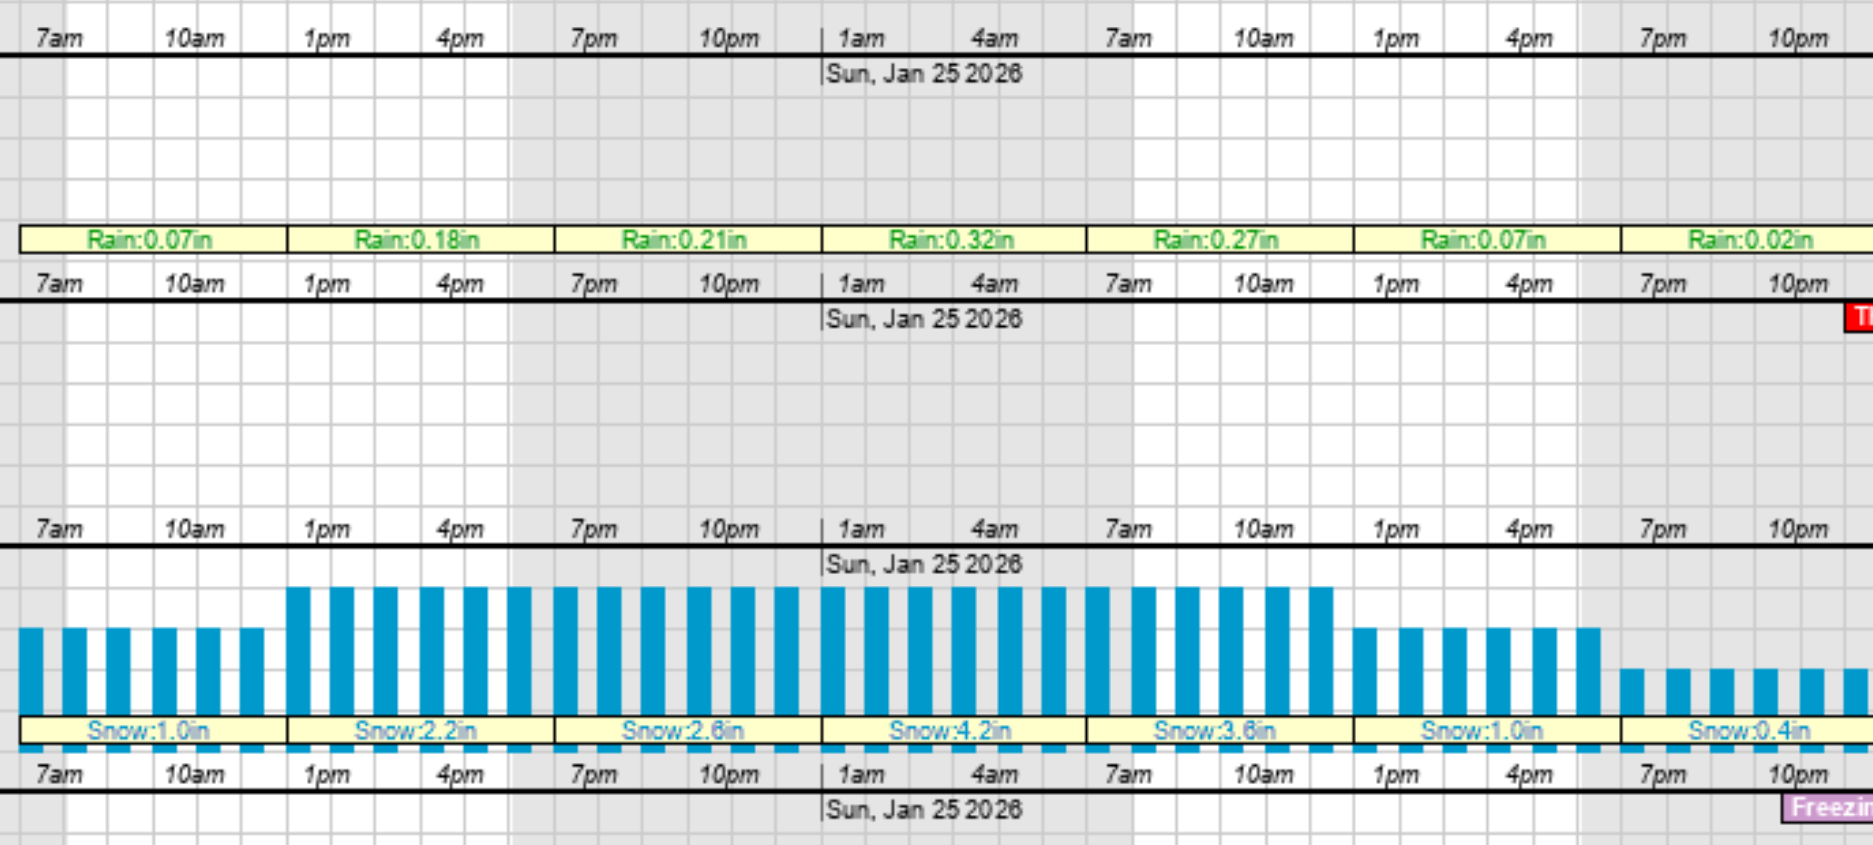
Temperatures when this extremely dry, fluffy snow falls along the Ohio River will be in the low teens.
Typically, snows here have a 10 to 1 water equivalent when the temperature is near 32 deg. F. With this snow it will be a whopping 30 to 1 ratio!!! If it's not too heavy, that's the type of snow that you can sweep instead of shovel. No snowmen for us this time around with extremely poor packing.
Here's a really nice bar graph that gives a better image of this concept with 1 picture.
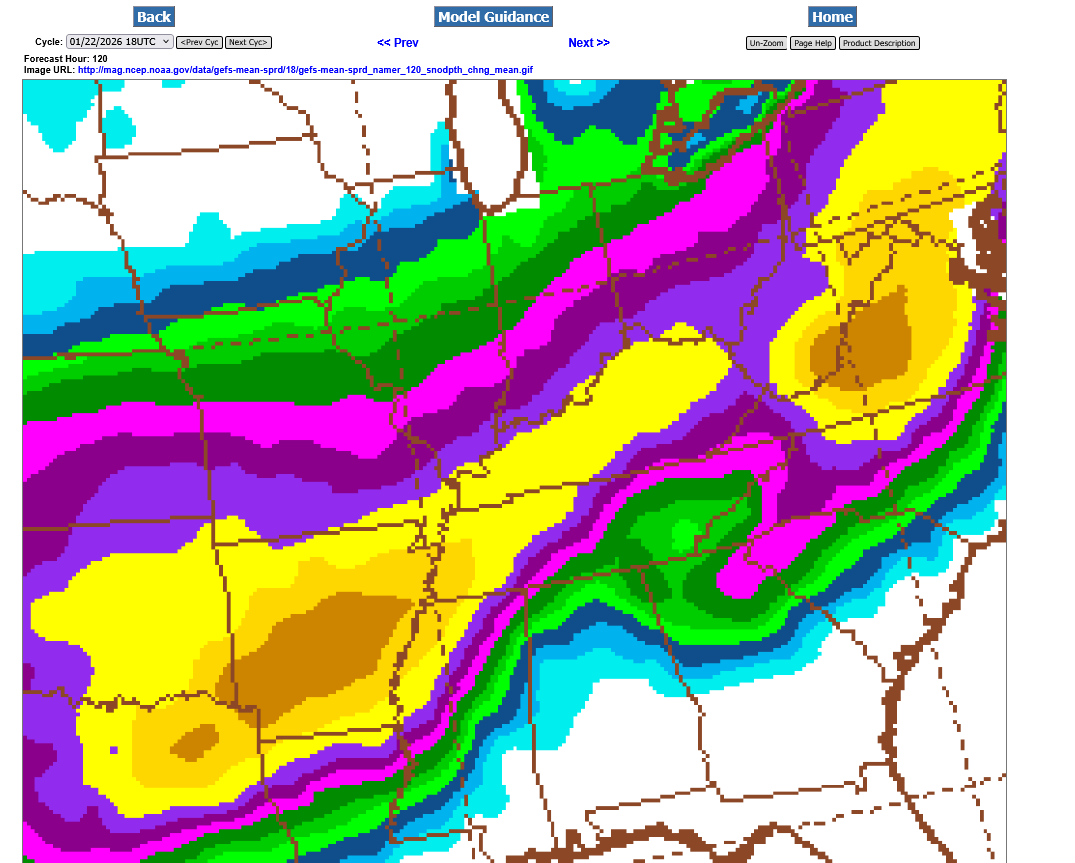
Last 18z GEFS run:
Mostly south of Indiana. That's some unusually deep snow for the deep south!!!!
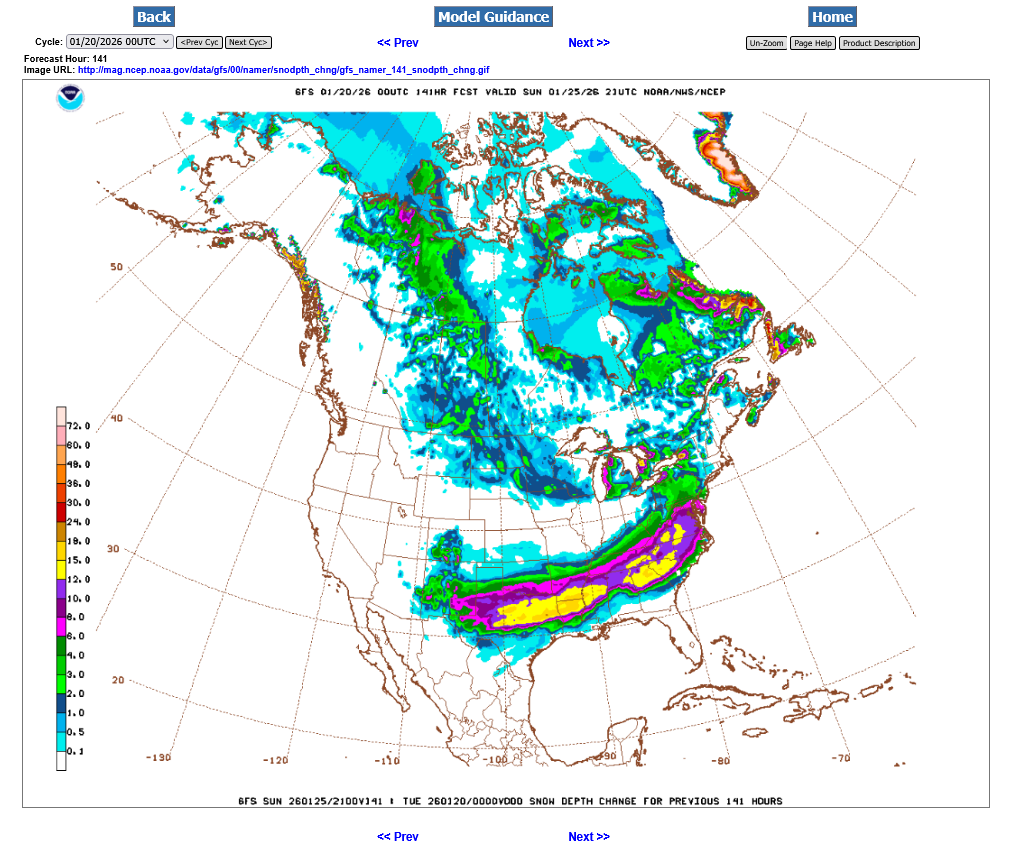
How about this for this last 0z GFS operational model. The yellow is 12"+. Inside of that is and area of 18"+ and even a couple of specs of 21+".
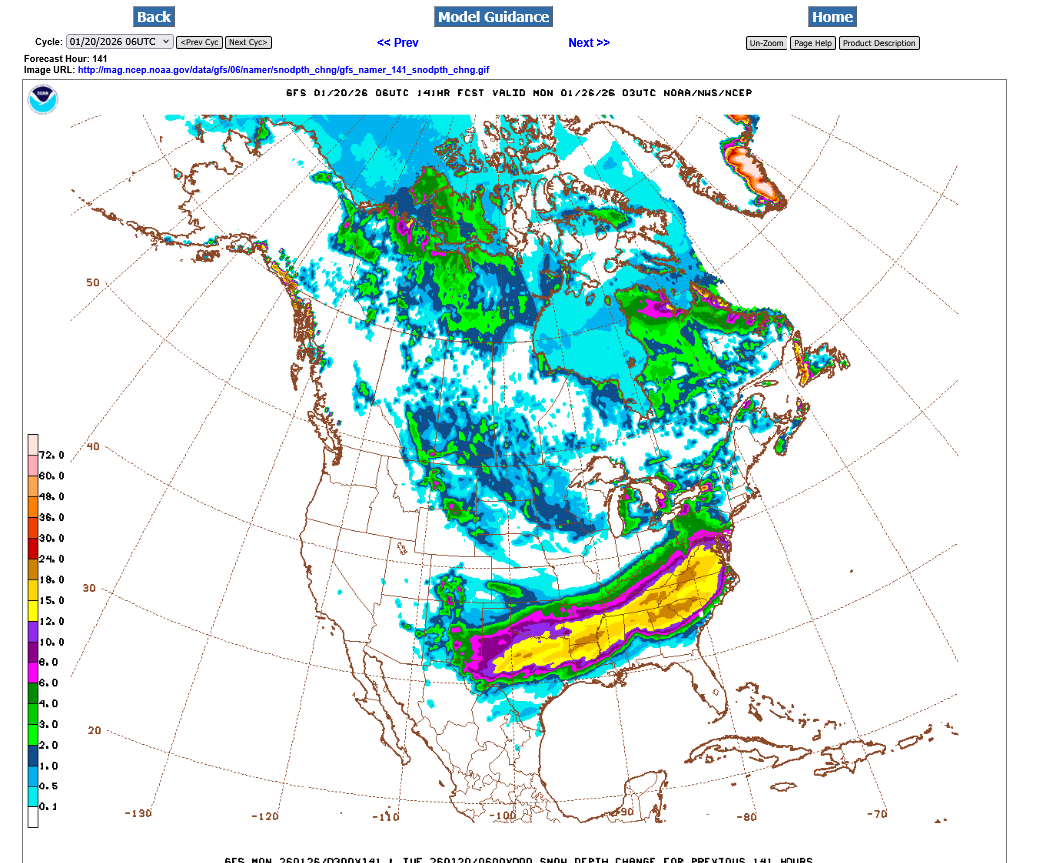
The last run of the 6z GEFS makes this an historic snow event for the South. WOW!!
It looks like this could be a super long event with some places in the path seeing the snow continue for around 24 hours. Even Southern Indiana could see several inches of fluffy snow on the northern fringe. …….if the system doesn’t shift farther south, which is possible. The snow would fall here on Friday night, continuing all day Saturday, with the farther north track.
There is a near 100% chance of this being an historic type of Winter weather event For the South. Now we just need to fine tune the amounts, type and the locations.
This forecast is likely to change.
Current Hazards at the link below.
For your NWS and county, go to the link below.
Then you can hit any spot on the map, including where you live and it will go to that NWS with all the comprehensive local weather information for that/your county.
This last 12z GEFS was incredibly different than the previous 6Z run, just 6 hours earlier. Shifting everything even farther south(completely missing S. Indiana with even the northern fringe along the KY/TN border now) and reducing the amounts. Regardless, the yellow is a foot+ of snow and that's enormous for area's that far south.
This forecast is still likely to change but as we get closer to the event, the changes will be smaller and the last forecast usually gets the most weighting.
CORRECTION, this last map below was from the 12z OPERATIONAL GFS run which is known for its erratic solutions. I put the correct 12z GEFS run below it.
Corrected 12 GEFS run below: This still has S.Indiana on the northern fringe, with several inches of powdery snow likely. This makes the most sense. This is probably like speaking Greek to non weather geeks but this map below is the one to compare to the previous page. Give the solution above low weighting at this point.
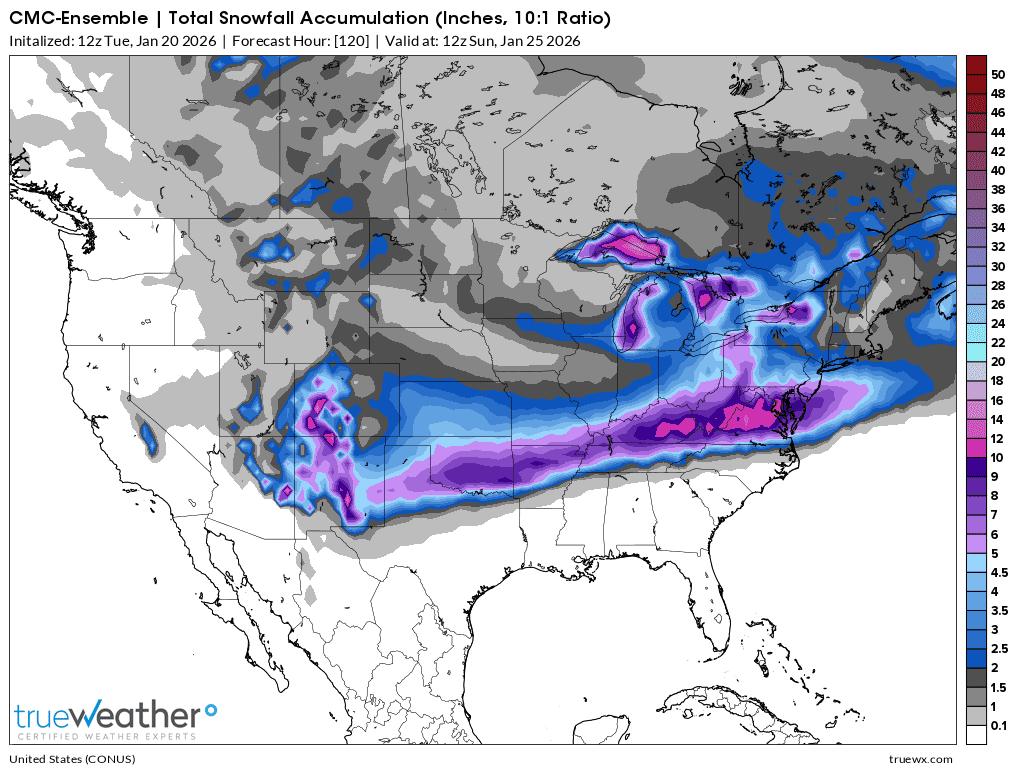
1pm Tue: This was the 12z Canadian ensemble model total snows(south of that is rain). There is still tremendous uncertainty as we can see
And below was the 12z Operational European Model.
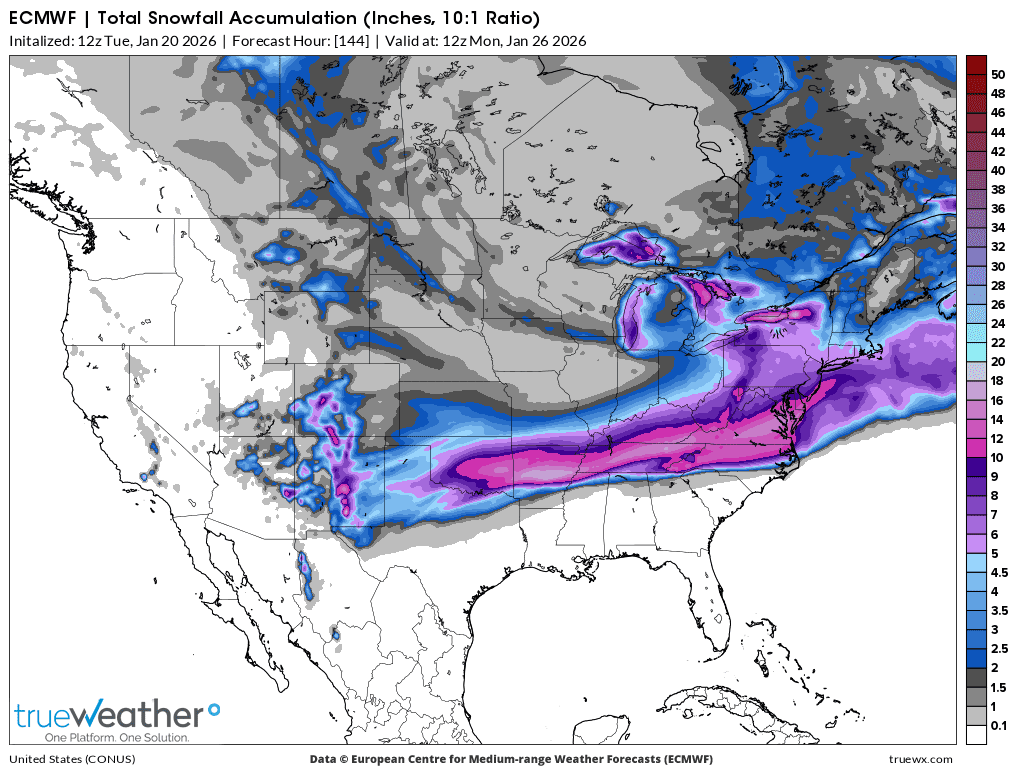
The strong consensus with most models keeps us on the northern periphery but well within the significant accumulations. The biggest change actually is in the timing. Now the starting time is around mid-day Saturday NOT very early Saturday morning.
4:45pm: Below was the last 12 European Ensemble which is considered by many of us to be the best. Despite that, its likely we still have adjustments to make with this being almost 4 days away.
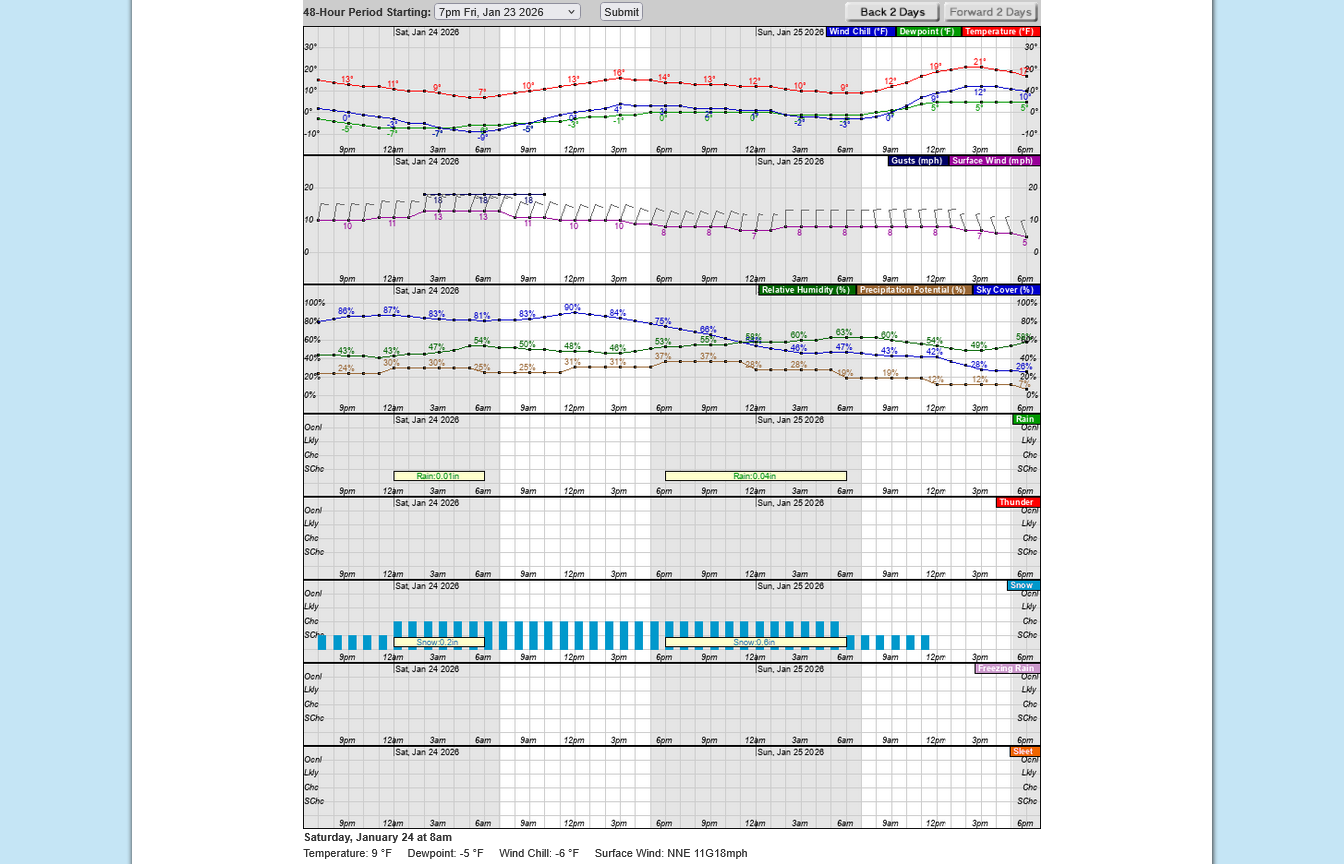
Winds on Saturday will be gusty and with the very dry snow, there WILL be some blowing snow and in some places some drifting.
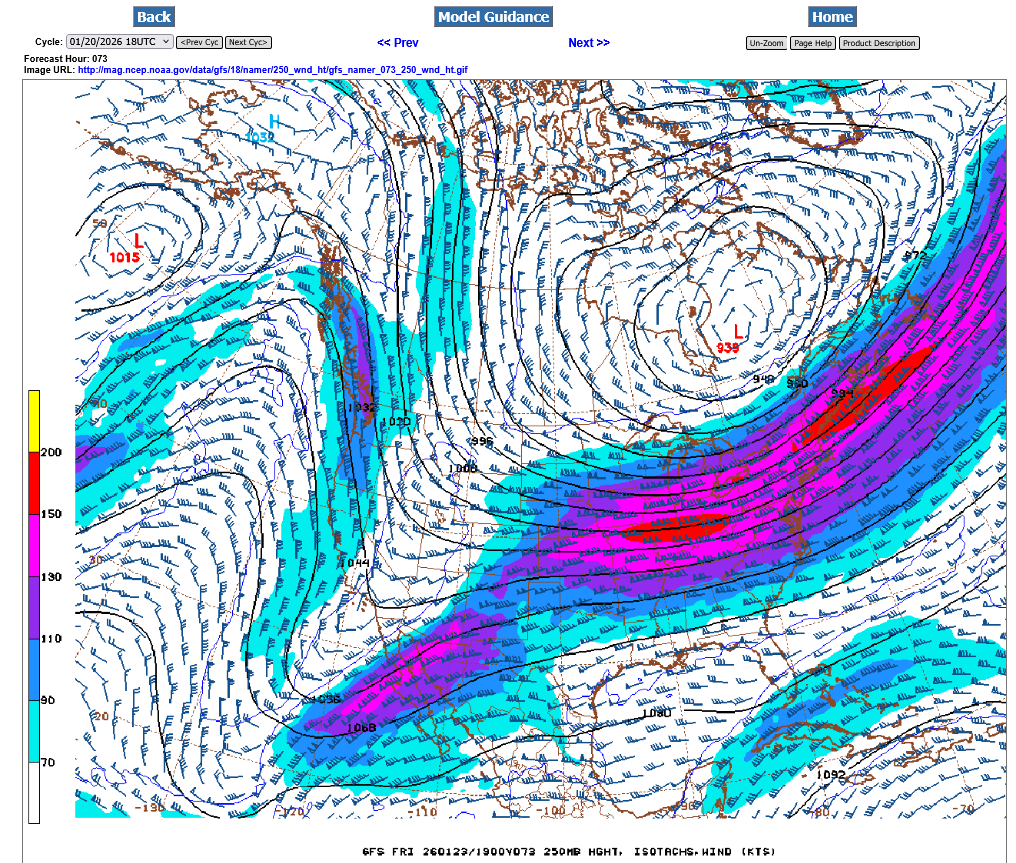
Check this jet stream out!!!
1. Friday, January 23. Very strong jet stream over us but look whats coming up from the southern stream in the Southwest US and watch what that does when it PHASES with the northern stream jet stream associated with the Polar Jet stream. That Low in Southeast Canada is the Polar Vortex, displaced over 1,000 miles unusually far south from it's typical position in the Arctic.
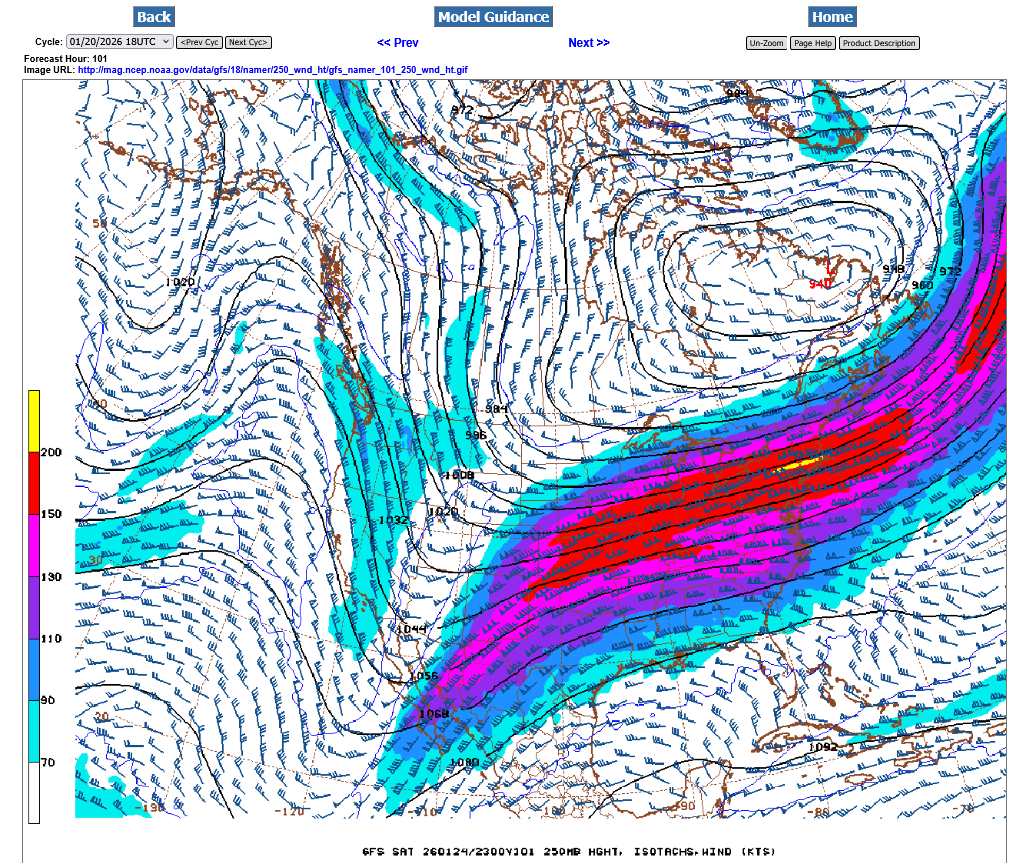
2, On Saturday, thanks to the 2 streams phasing, the magnitude of the highest jet streak winds jumps from just over 200 mph to 250 mph in around 24 hours. The units/colors below are in KNOTs. 5 knots = 6 mph. There's even a bit of yellow the top color in the jet streak/center.
While the HUGE storm later this week will steal the show, early Wednesday morning, there may be enough light frozen precipitation/snow on FROZEN ground/below freezing road temps to cause slick roads before and just after dawn in the Evansville area.
This will be coming ahead of a warm front that will quickly warm temps well above freezing by mid morning.
At worst, this might cause some 2 hour delays to let the warmer air come in and melt anything on the roads.
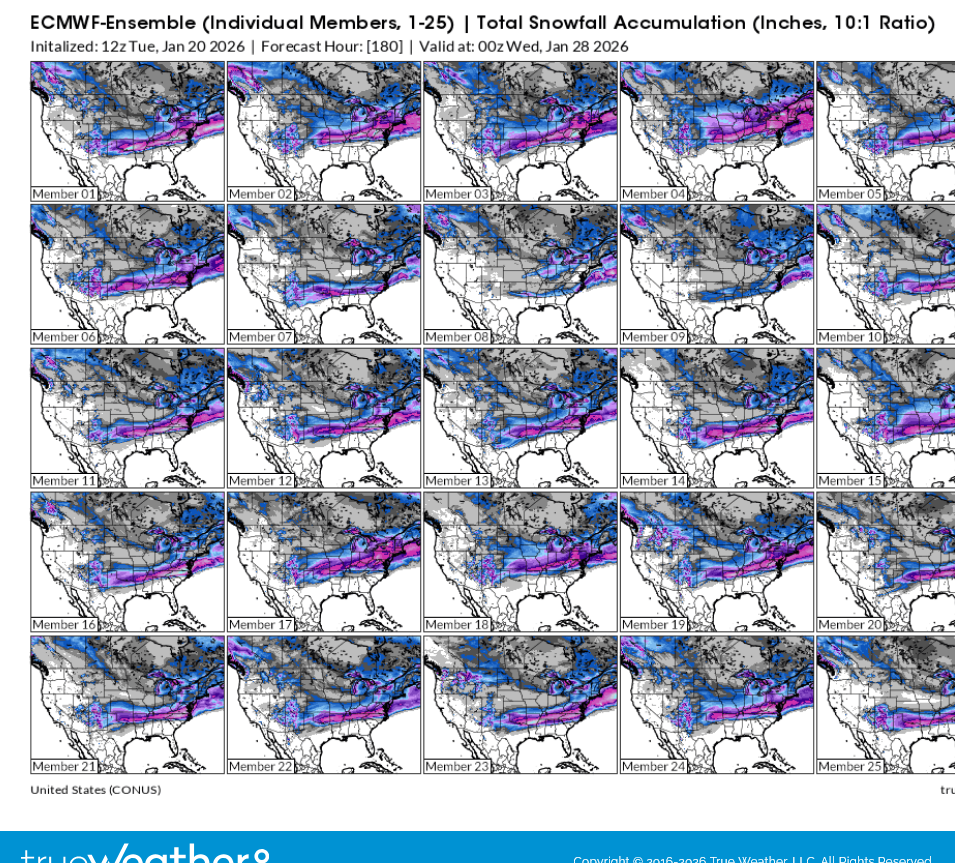
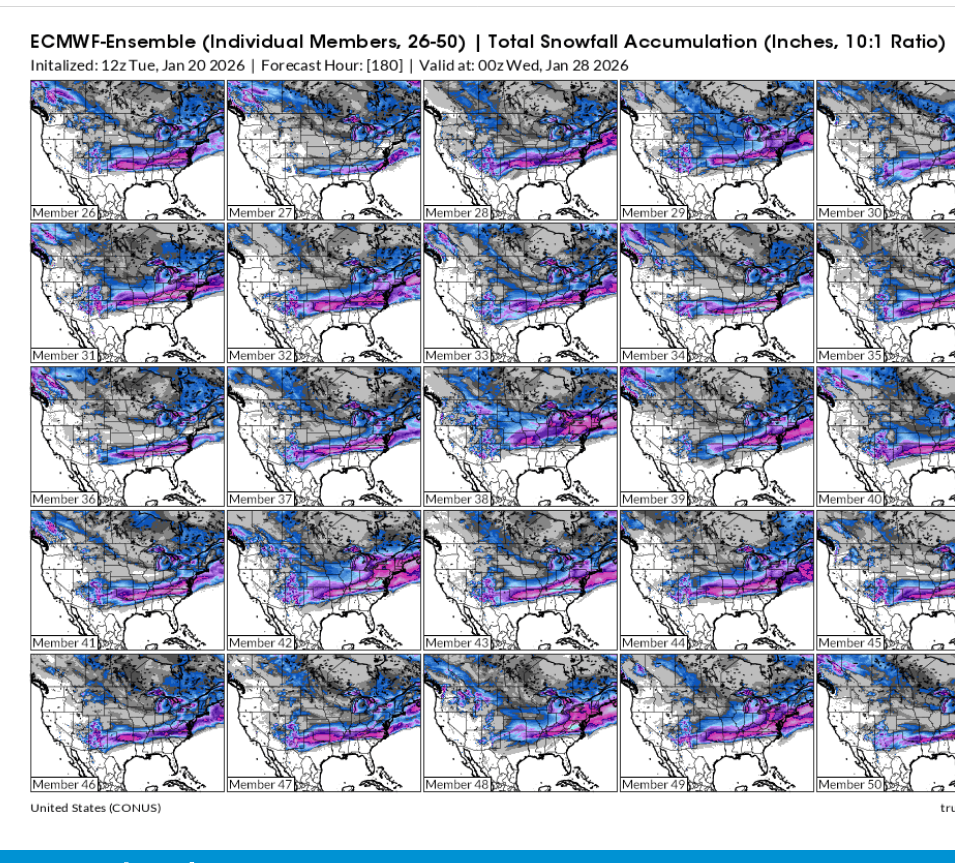
The European Ensemble Mean consists of 50 different variations of the parent model. Each one slightly tweeks a few of the equations of the many thousands because, although we clearly understand almost all the physical laws that control the atmosphere and can represent them with thousands of different mathematical equations(calculus), we are unable to apply them to perfectly represent the entire atmosphere under all conditions.
We are also unable to measure the entire atmosphere to represent the initial conditions perfectly. Small errors grow exponentially with time. The bottom line is that each of the 50 members in the ensemble is like having 50 different elite doctors giving their opinion to treat a patient. Instead of a 2nd opinion......it's 50 opinions.
Turns out that averaging them together for a mean, averages out all the extreme outliers and consistently provides us with a product that outperforms all individual solutions in the long run. Some might do better than the mean some of the time but none of them beat it most of the time.
Here's the 50 different members from the last 12z European Ensemble model run(solution shown above).
We can look at these to see how many show the same thing. For instance, if you had a set of 50 numbers from 1-10 with half of them being near 1 and the other half being near 10, the average of 5 represents NONE OF THEM.
Same with these solutions. We want to use the mean but give it lower weighting if its the average of 2 extremes and doesn't represent what the majority agree with.
This was the last 6z GEFS. Dark green is 4+ inches(Evansville). Yellow is 12+ inches. Brown is 18+ inches.
The latest AI has 5.2" for Evansville.
Current Hazards at the link below.
For your NWS and county, go to the link below.
Then you can hit any spot on the map, including where you live and it will go to that NWS with all the comprehensive local weather information for that/your county.
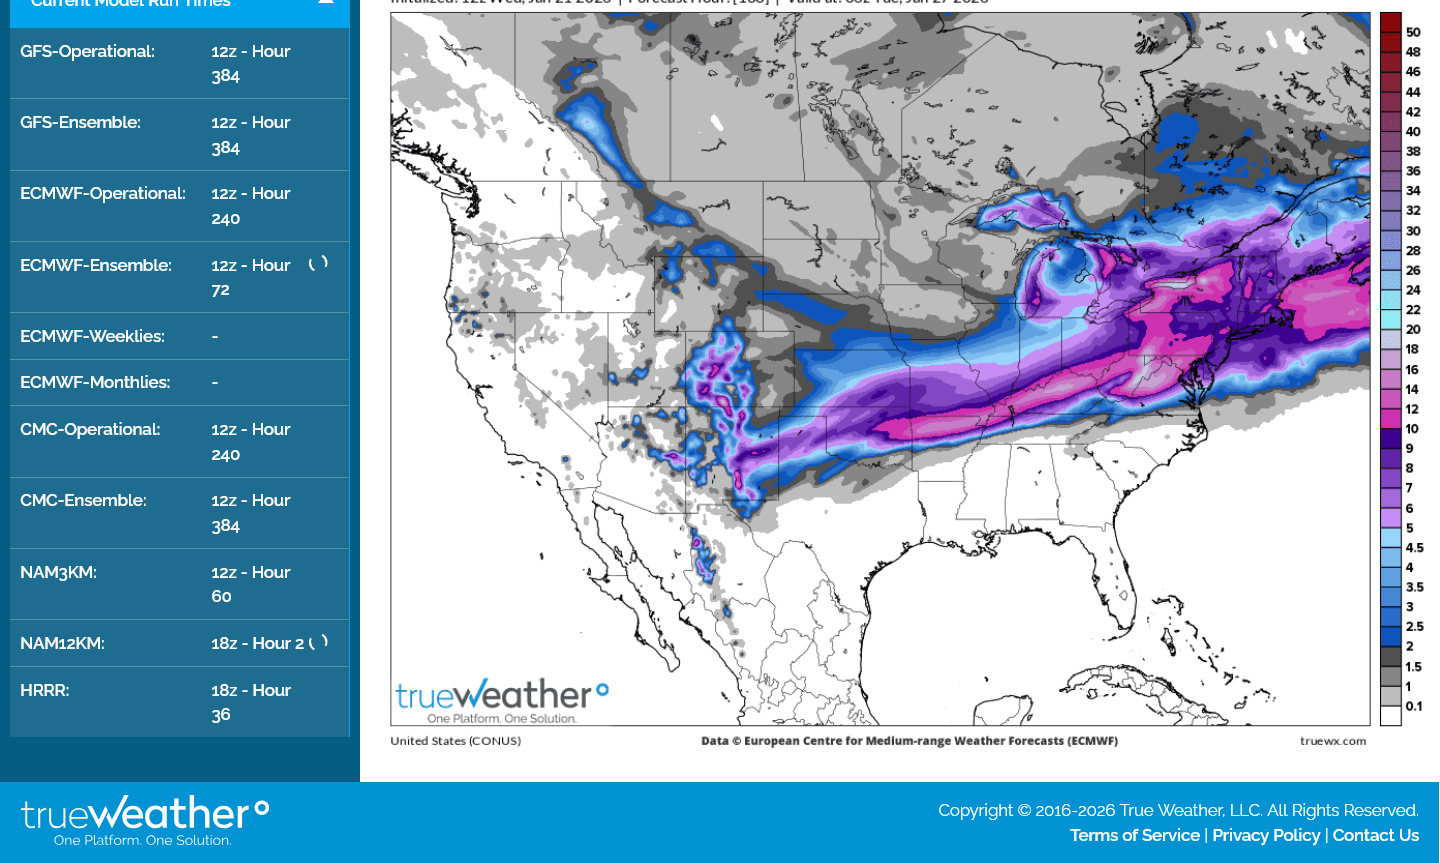
Below was the last 0z European Ensemble MEAN forecast FOR SNOW: Keep in mind that south of this there will be a huge are of freezing rain!
This was from the just updated 12z GEFS run. It's zoomed in to see better. Dark green=4+ inches. Yellow=12+inches.
There will be ICE south of the snow.
+++++++++++++++++
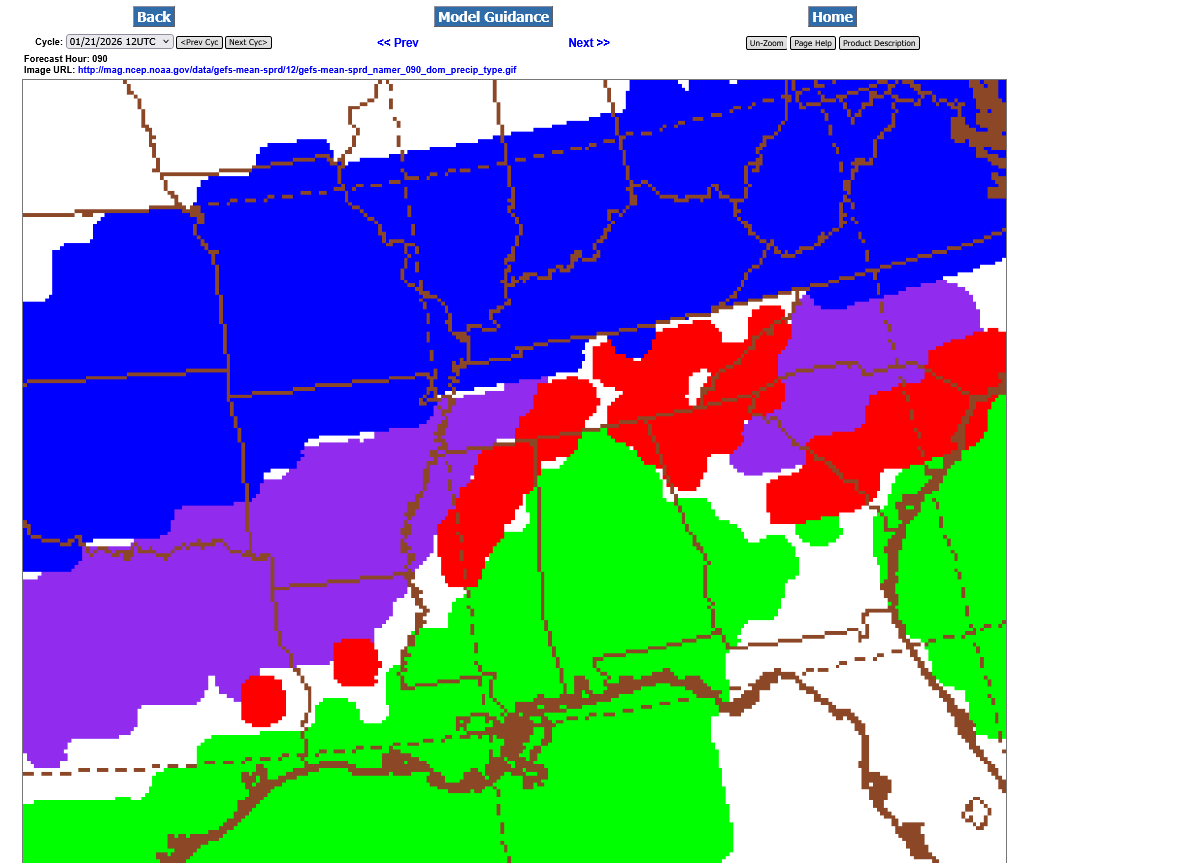
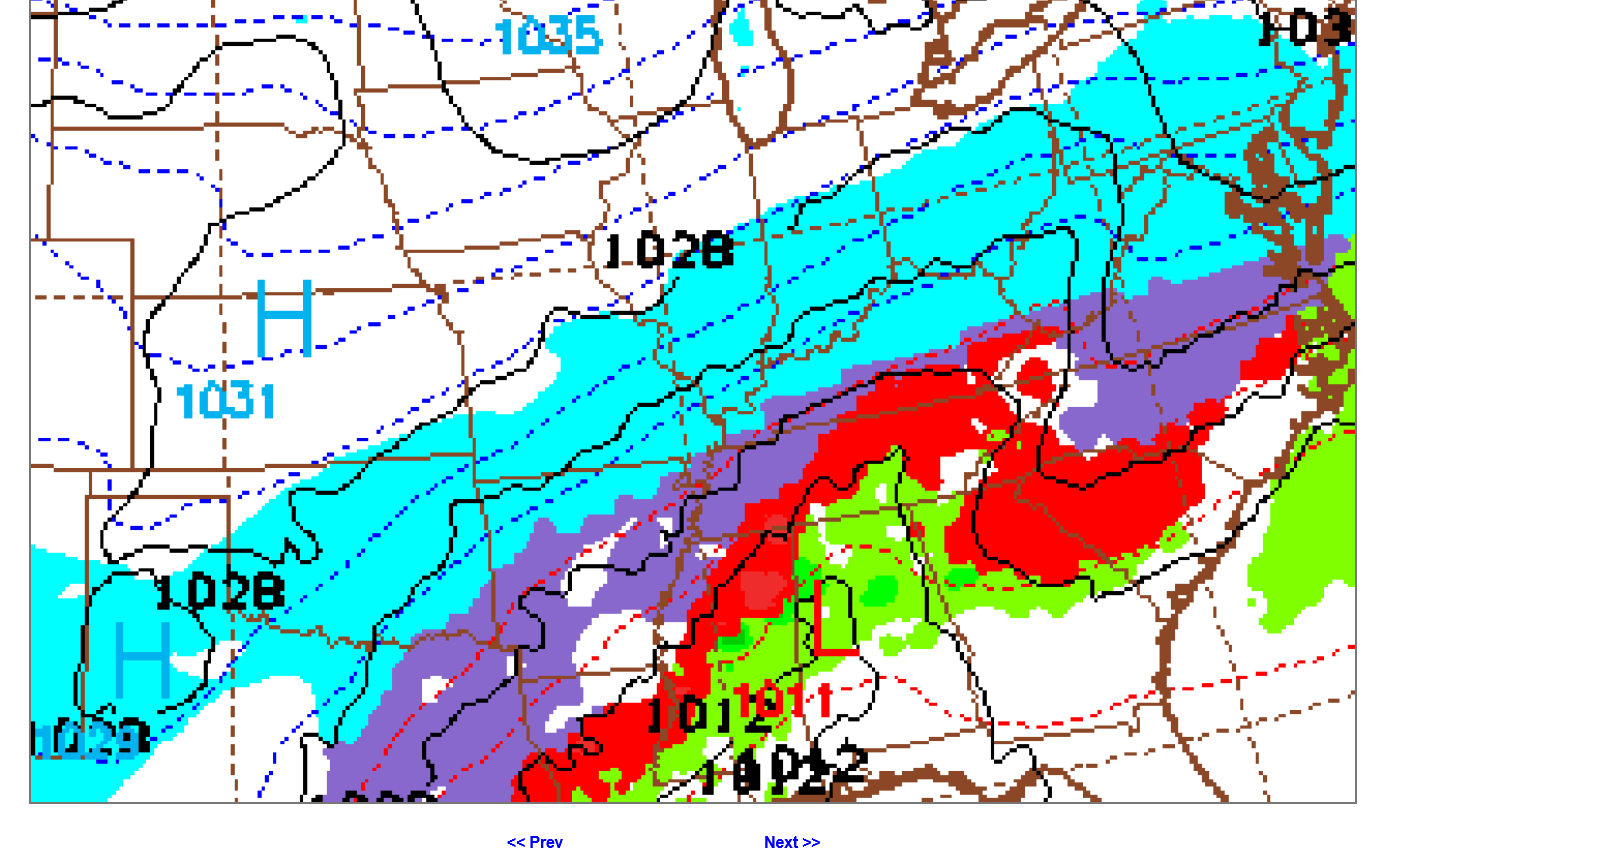
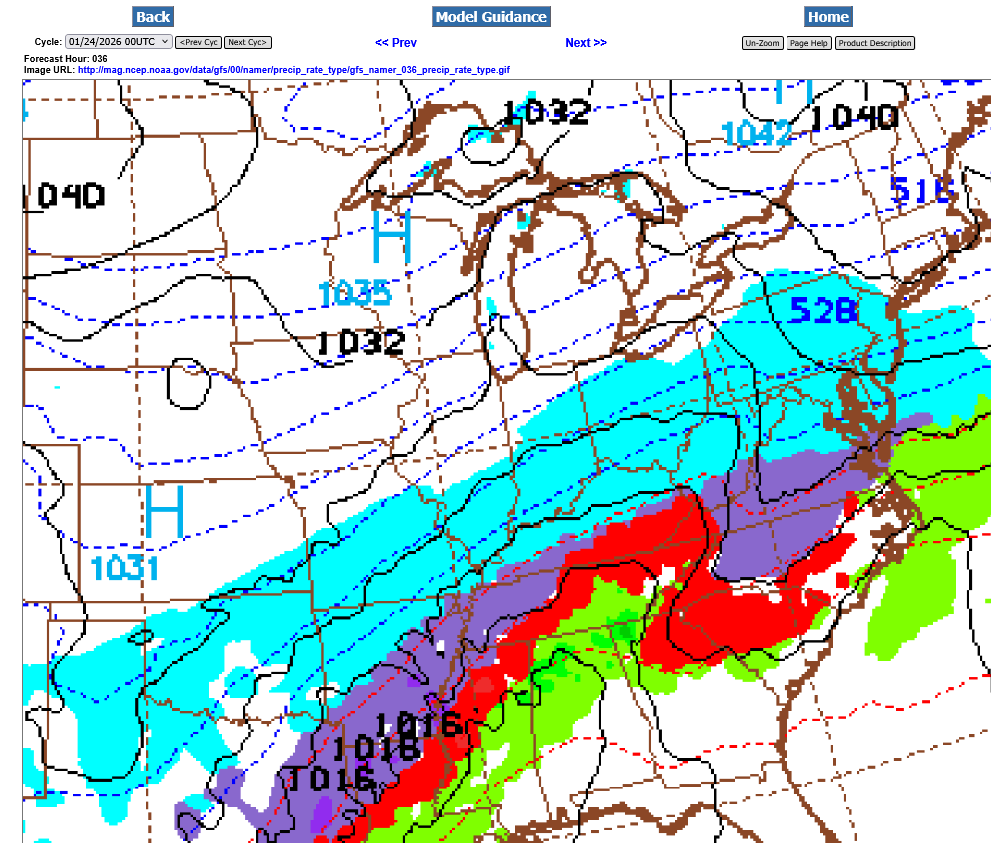
Below: Blue=snow, Purple=sleet, Red=freezing rain, Green=plain rain. This is at midnight Saturday Night when the intensity will be greatest for Evansville. The southern edge of the blue will be experiencing the highest snowfall rates.
+++++++++++++++++++++++
The 12z European operational model has 9 inches for Evansville. The pink color below is 10+Inches.
The 12z European ENSEMBLE model below has 7 inches
The 12z Canadian Ensemble model has just under 7 inches below:
I’m at North chess practice and can’t show graphics but the NWS numerical forecast(AI) has just over 10 inches on this last update!!
Considering the southern jet stream will phase with the polar jet stream and upper level winds will be roaring at over 200 mph, which will really boost the lift that condenses moisture, this is actually reasonable.
With a 25 to 1 snow to water ratio in the cold air, that’s unable to hold much moisture, .5 inches of liquid water (1/2 inch) can make a whopping 12.5 inches of snow In air this cold.
What makes this extremely odd is that there will be no surface development as surface pressures will be extremely elevated from a massive blob of Arctic high pressure that settles in.
However, the upper level dynamics are off the charts with a 200+ mph jet streak roaring overhead.
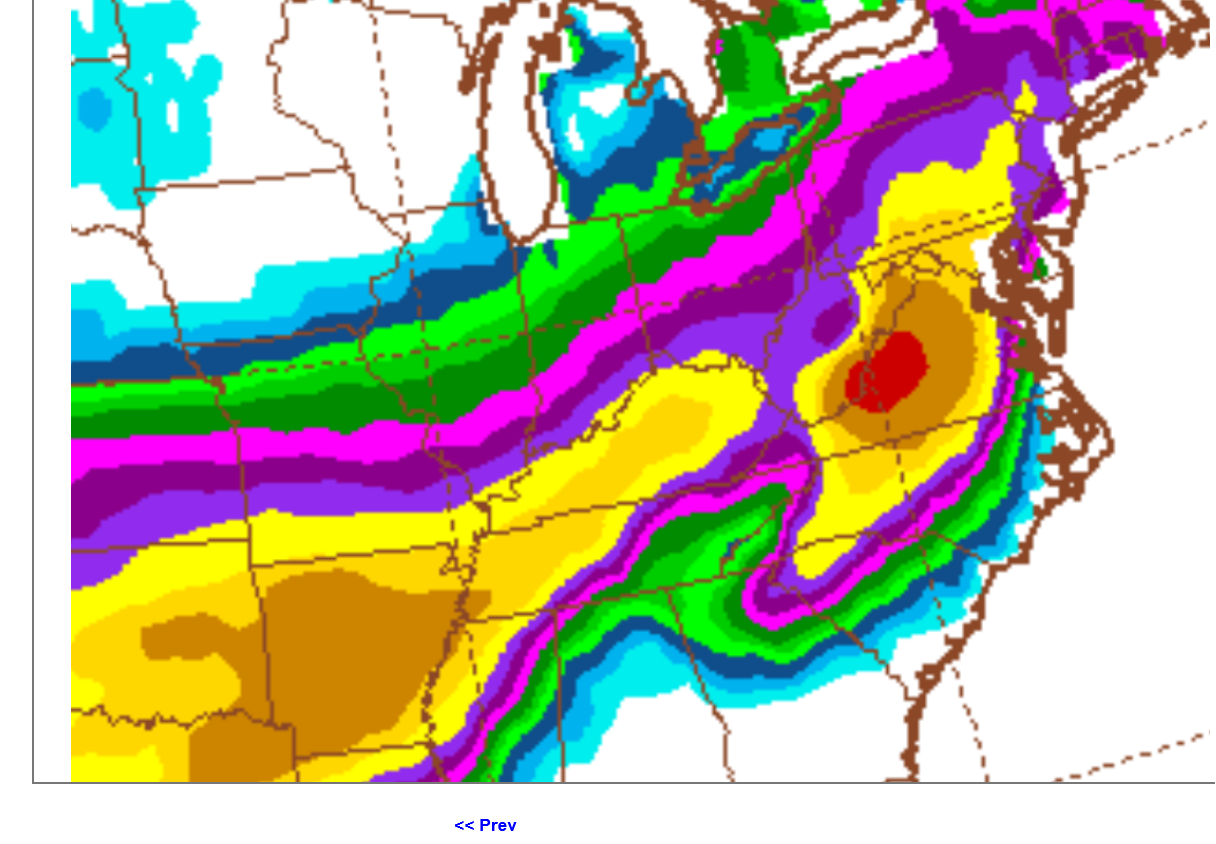
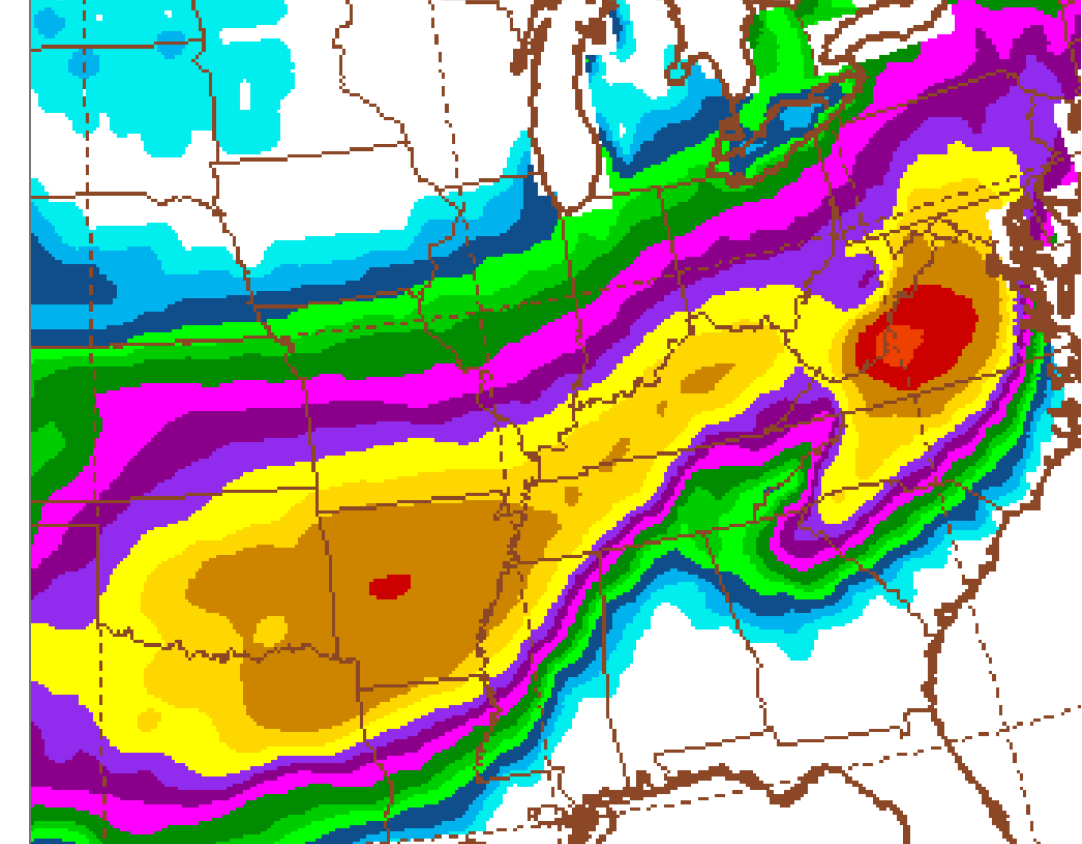
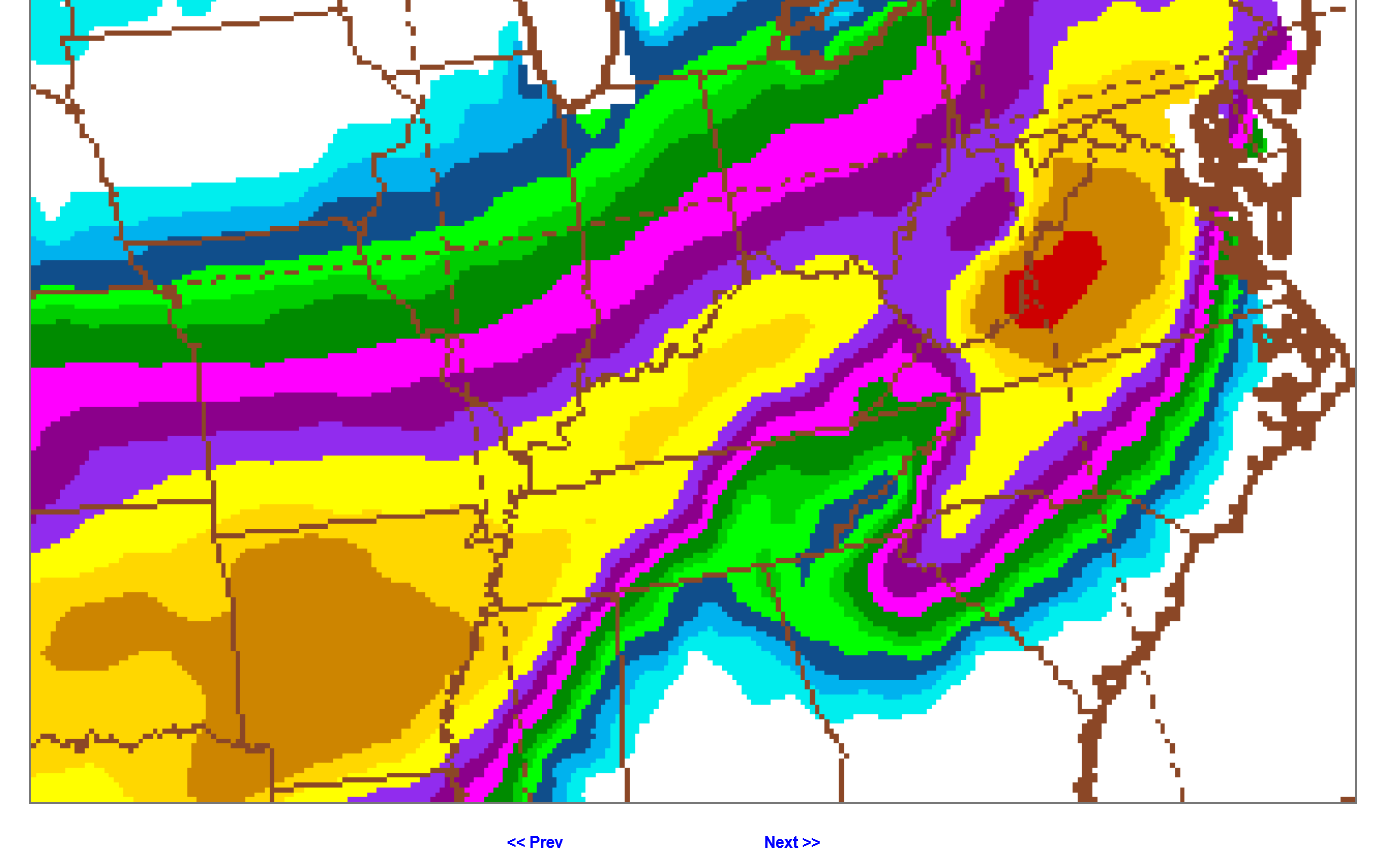
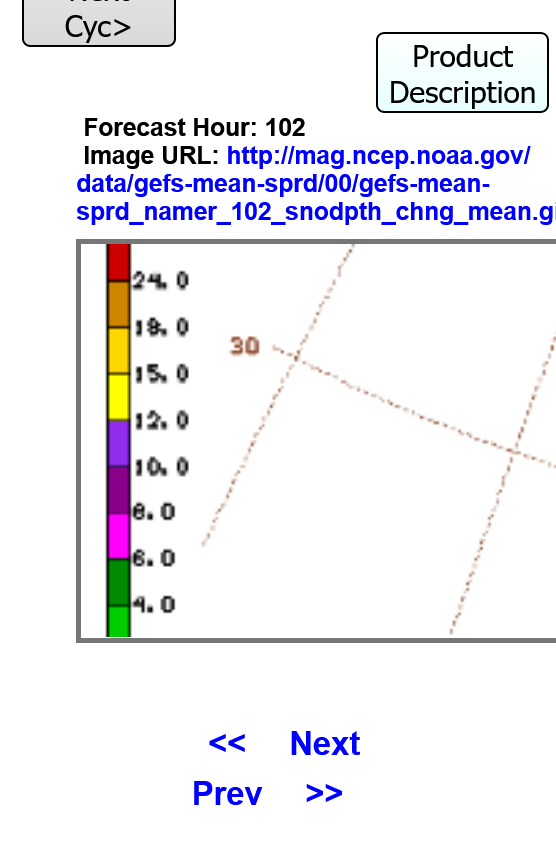
The just out 0z GEFS continues to confirm some hefty amounts in Evansville. The 10+ inch band is just north of the Ohio River. I zoomed in and put the color code below to make it easier to interpret. the yellow is 12+ inches. That red dot in the state of Virginia is 24 inches of snow.

The latest NWS numerical guidance(AI) is up to a total of 10.8 inches of snow falling! Winds are much less on Saturday so the blowing won't be terribly bad, even though this snow will be very fluffy.
It may start as early as Saturday morning. This will be a very long duration event, not diminishing until Sunday afternoon. The latest guidance has me thinking it could last well into the afternoon Sunday.
Sure looks like the schools will be closed for a couple of days next week!
++++++++++++++++++++++++++++++++++++=
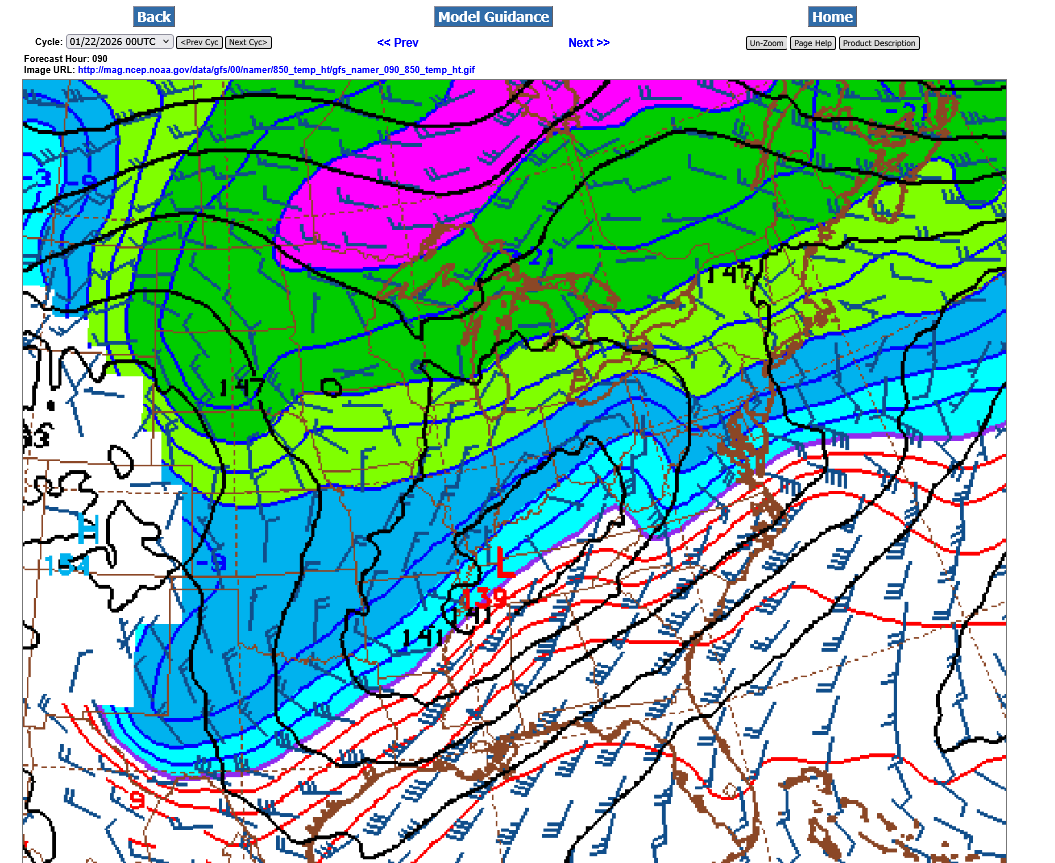
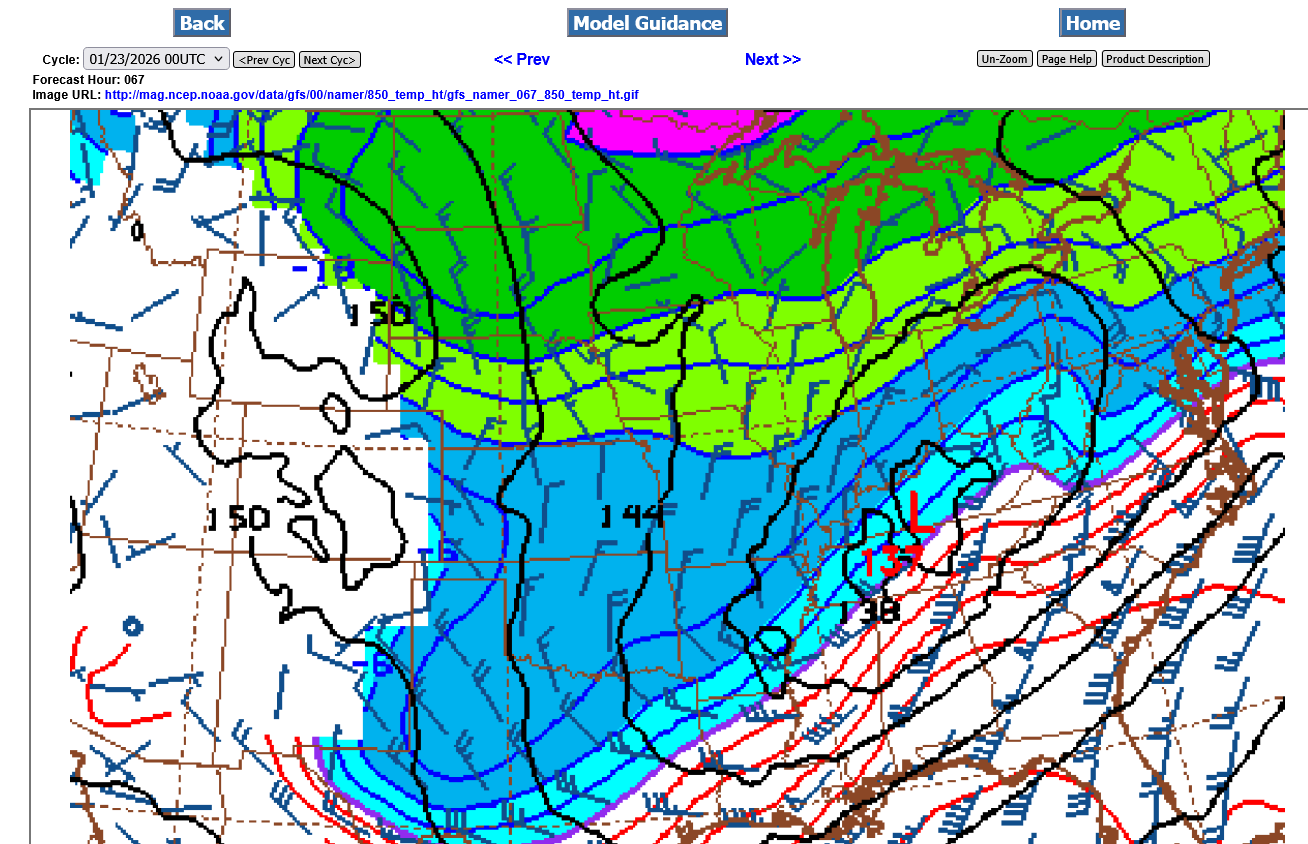
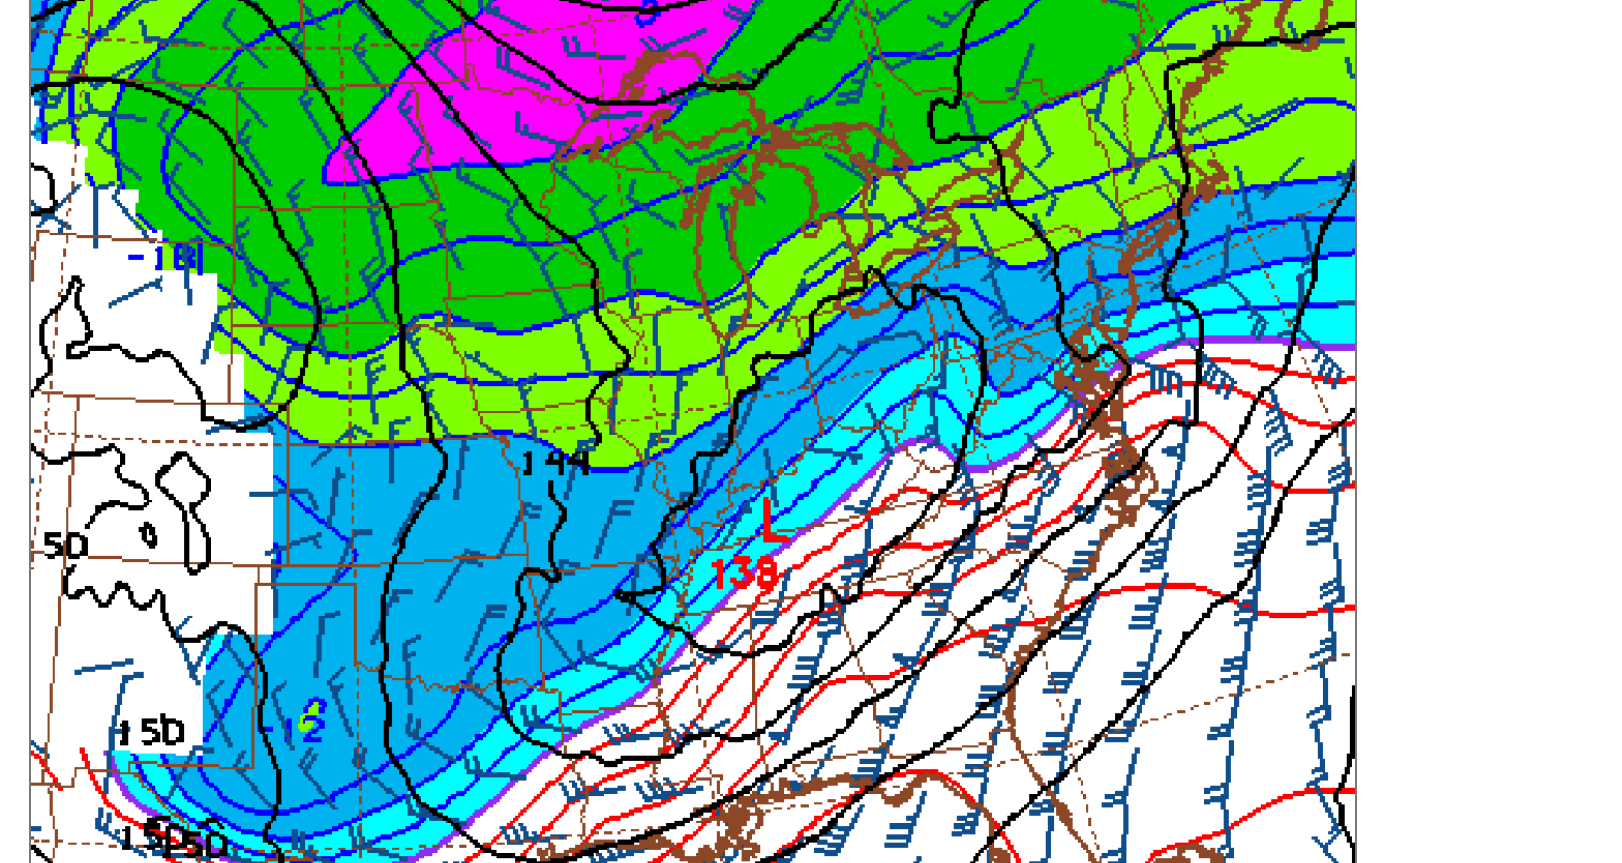
There will not be any surface development with Arctic High Pressure in charge. However, there will be a low pressure system developing around 1 mile up at 850 mb. This is Sunday midday below at 850 mb. Isotherms(temperature bands) are spaced 5 Deg. C apart. The bottom of the light blue is 0 Deg. C which is the freezing point. This will stay well south of us for the entire event.
The heaviest snows are usually just northwest of the 850 low. It will need to pass by before our snow diminishes so this is making me lean towards a longer duration event with the snow possibly lingering into the afternoon on Sunday and really piling up.
If this 850 mb low below has any sort of development, we could get a foot+ of snow.
This last run of the 6z GEFS had a tad more snow yet. The 12 inch band was up to the Ohio river!
We're getting close enough so that changes will have less magnitude as we get closer. If you live in Evansville and have been following, you clearly recognize that the models and forecast have been ADDING snow all week. That usually means they were missing something before that is being better and better represented, as the old data is updated with newer/fresher and more accurate data.
Yellow = 12 inches. Along and south of the Ohio River.
Red = 24 inches. Parts of Arkansas and Virginia.

++++++++++++++++++++++++++++++++++++++++++++++++
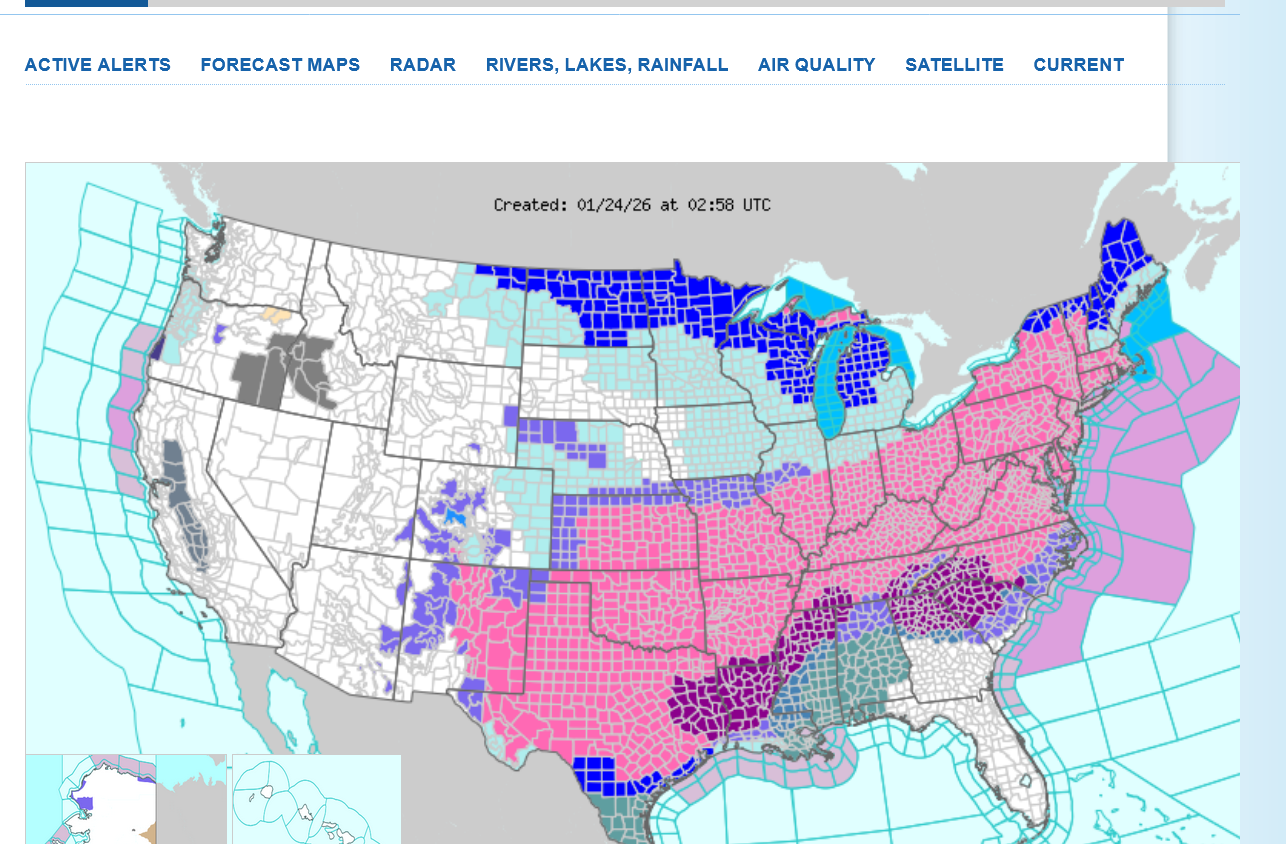
Look for the Winter Storm WARNINGS to increase later today.
Current Hazards at the link below.
For your NWS and county, go to the link below.
Then you can hit any spot on the map, including where you live and it will go to that NWS with all the comprehensive local weather information for that/your county.
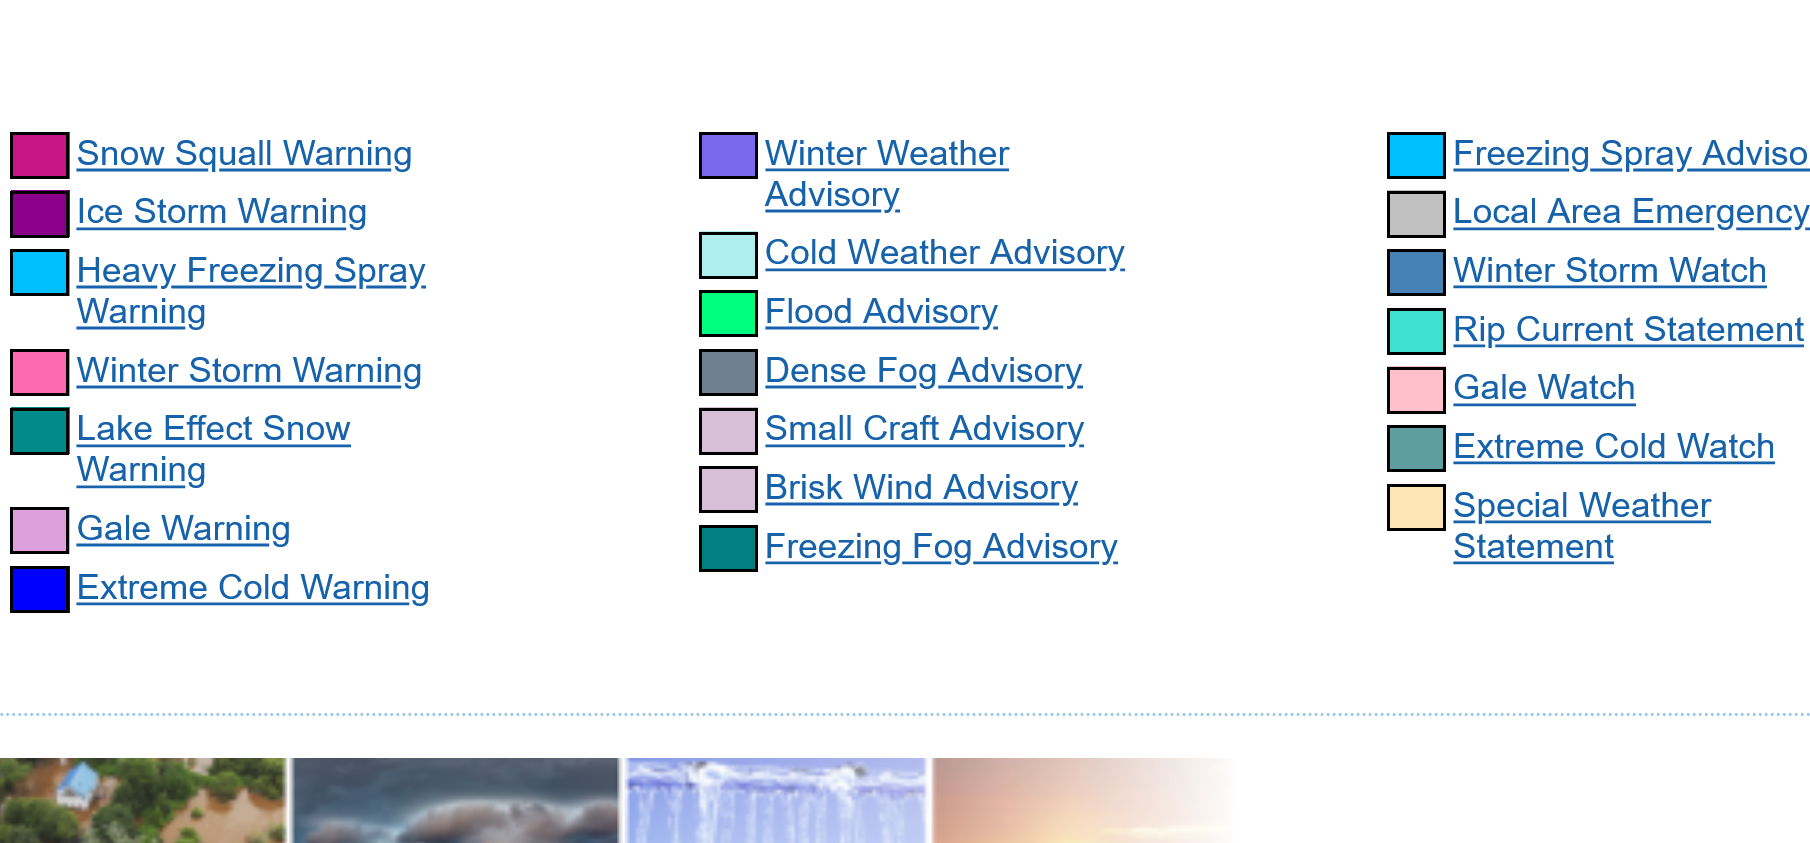
Here's what the colors on the map above stand for:

12:10pm: They just issued a Winter Storm WARNING for Southwest Indiana.
The just updated numerical guidance/artificial intelligence boosted total snowfall to 15.2 inches.
Thats been the steady trend all week (greater and greater totals)so it’s possible but we need to see additional guidance to go that high with confidence.
This last 18z GEFS run is extremely close to previous runs for snow totals.
This is the NWS numerical, artificial intelligence snowfall forecast Saturday and Sunday. This adds up to 15 inches of snow. That seems like the high end of what's possible but it is possible.
These GEFS runs come out every 6 hours. This is the latest one, the 0z run. Not much change from previous runs with the +12 inch total snow contour, light yellow up to the Ohio River and covering all of KY. I would think that most schools will be closed for at least the first 2 days of this upcoming week. Tuesday morning temps will be around 0 too which will add another school cancelling element.
The numerical snow totals are still up around 15 inches for Evansville, IN which is higher than any of the actual weather maps. This is an extremely odd system for producing that much snow. There is no deep surface low that moves south to north and pulls up surface moisture from the Gulf of Mexico.
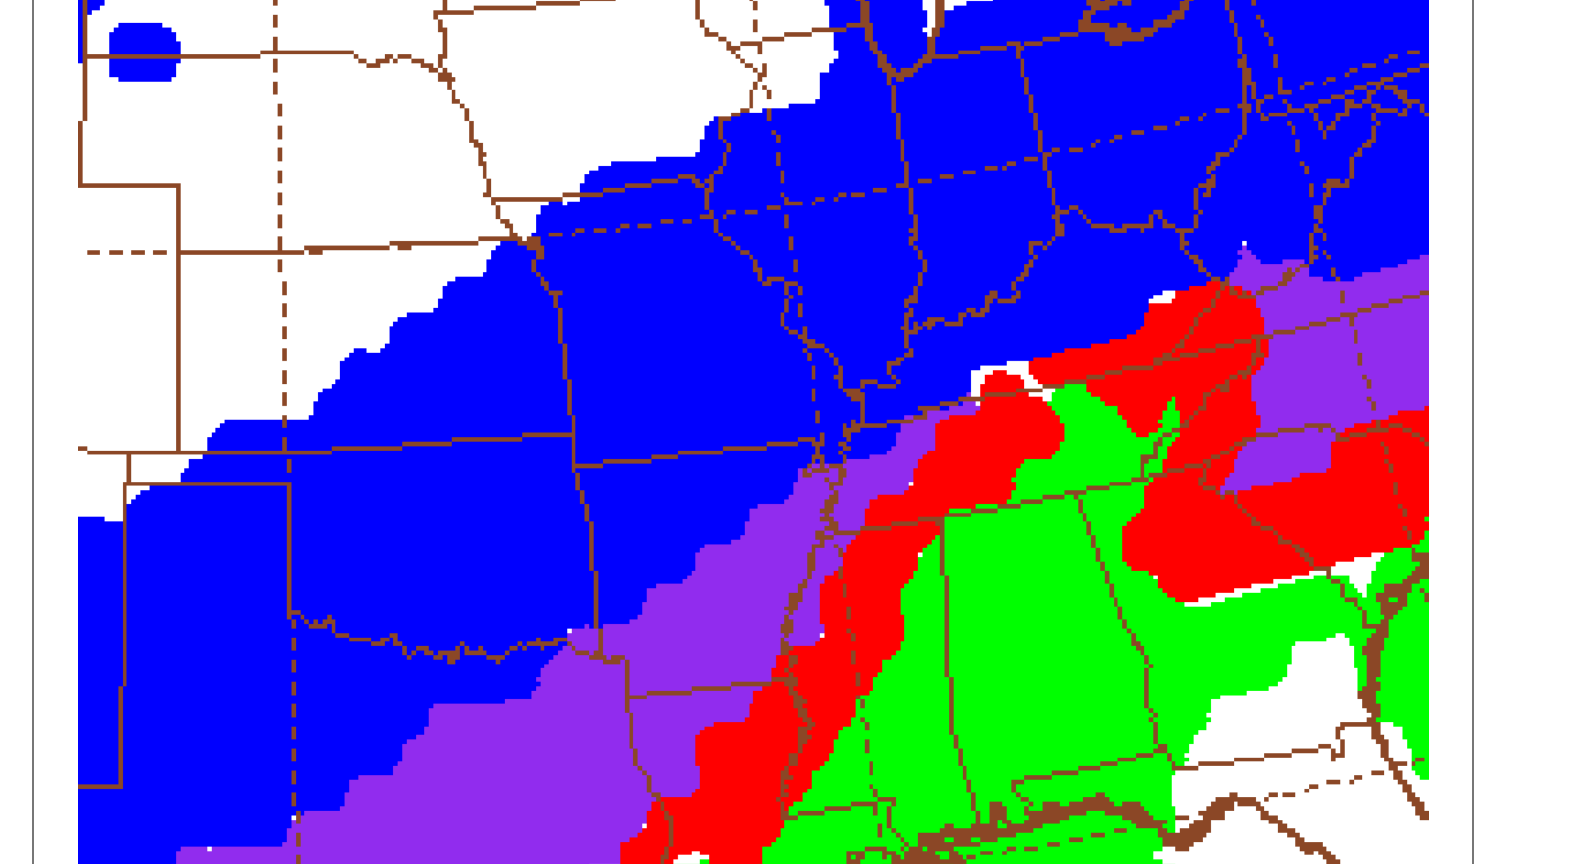
Blue=Snow, Purple=Sleet, Red=Freezing Rain, Green=Rain
+++++++++++
850 mb low below just after Noon on Sunday.
Instead of the typical 10 to 1 snow to water ratio, this time it will be more like 25 to 1. The dry fluffy snow will probably blow around when winds pick up Sunday PM.
Despite the magnitude of accumulations, it shouldn't cause tree limbs or telephone lines to come down.
However, by the same token, the dry, lightweight snow has 2 different impacts on roads.
1. The biggest one is related to temps WELL below freezing. This will make it more challenging for chemicals to melt snow on the roads.
2. It will take less heat energy to melt the snow when we finally warm up. 10 inches of heavy wet snow that falls around 32 degrees and freezes up requires almost double the warmth to melt it all compared to 10 inches of dry, powdery snow at 16 deg. F. which has less than half the density and half the amount of frozen/solid H2O.
+++++++++++++++++++++
https://compuweather.com/the-important-difference-between-wet-snow-and-dry-snow/
As has been the trend all week, snow amounts went even higher with this last 6z GEFS model! We're close enough to the event now, so that:
1. The data/observations fed into the models is more accurate.
2. The time for errors to grow is minimal.
3. As a result of #'s 1 and 2, the forecast is more reliable.
4. The 12" band is NORTH of the Ohio River now, with the 15" band covering most of KY. When we get to this lofty magnitude of snow and the likelihood that the models will still be off by an X margin of error. 15+ inches in Evansville can't be ruled out.
5. The NWS computer(AI) product has backed down to 12.5" for Evansville. It was the first product to show these huge totals a couple of days ago, when it suddenly jumped to 15"+. This is at least a good sign that maybe the amounts in the forecast have peaked.
6. That brighter red in Virginia is 30+ inches of snow! The storm will be more organized closer to the East Coast and pulling in Atlantic moisture too, along with higher elevations contributing to additional lifting in that bullseye. This is not a model artifact but instead is a distinct possibility.
7. Its impossible to predict an exact number for snow totals, like 12.5 or 10.3 or 15.4 for several reasons.
8. When you are this high, small changes in the dynamics that lead to fractions of an inch changes(.5 inches for instance in a weak system), are amplified because of the enormity of the event.
9. There will be impossible to predict HEAVY snow bands that develop (from small scale motions within the system that are impossible for models to see/resolve and predict. Some of those will surprise us. Some will probably cause heavier snow bands snow north, and lighter pockets south, instead of the perfect world, increasing/decreasing gradients depicted below.
10. The big picture we see below is still capturing the essence of the upcoming event. Despite some inevitable surprises that cause several places to have a few inches more or less than the color predicted or for a shift farther north or south, numerous days of the same but evolving picture and it being on our doorstep give it a 100% chance of happening.
11. Winds will pick up on Sunday, with gusts to 20+ mph. This will be a NORTH wind. So exposed roads that are West/East(perpendicular) will be more vulnerable to snow blowing over them. This will be a fluffy light snow that is very easy to blow. No snowman building with this type of snow.
12. A good thing is that this type of snow, unlike heavy wet snows/freezing rain does not accumulate massive weights on trees and power lines that causes damage/power outages.
13. Chemicals to treat roads will not be as effective with subfreezing temperatures all week. Some nights will drop to near 0 with the fresh snow pack being extremely effective for radiating(long wave radiation) heat out from the ground at night and reflecting solar/short wave radiation from the sun during the days.
14. How many days will schools be closed next week under these conditions as we dig out?
The event we've been advertising since last weekend is just now developing. Be thankful to live in this wonderful age of technology. Every generation in human history up to less than 100 years ago would have no clue that a system like this was on the way.
Even after several inches of snow had fallen, they would still have no idea how much additional snow was coming.
However, we live in the BEST time in human history for technology and knowledge. Young children can know things today that the smartest old men didn't understand hundreds of years ago.
The simple radar image below is very understandable to an elementary school student in 2026. In 1926, we were still decades away from having this tool for even the smartest atmospheric scientists of that age!!
And everybody reading this can get that and thousands of times more weather information every second of the day in any place with just a few clicks on their electronic devices.
Enjoy it and appreciate how fortunate we are compared to our ancestors!!
https://www.wunderground.com/maps/radar/current
This just updated 12z GEFS run has shifted the 12+ inch, yellow band to the south for the first time in awhile. Maybe this means the snow totals in the forecast have peaked? A foot of snow is likely along the Ohio River and in KY, with totals trailing off gradually headed north.
The 12z GFS Operational run below actually shifted the 12 inch band the farthest north yet, so as always we will still see late updates to the forecast.
This will be the LAST forecast that we can compare to previous ones on an apples to apples comparison by just looking at snowfall forecast totals. That's because snow already fallen will CUT DOWN on predicted NEW snowfall. We can still do a comparison of just the later periods but really the forecasting phase of this storm will morph into the TRACKING of the storm phase.
It's called NOWcasting. We can compare the actual storm with the forecast. We can follow trends. Observations will get the most weighting.
https://en.wikipedia.org/wiki/Nowcasting_(meteorology)
Nowcasting is weather forecasting on a very short term mesoscale period of up to 2 hours, according to the World Meteorological Organization, and up to six hours, according to other authors in the field.[1][2] This forecast is an extrapolation in time of known weather parameters, including those obtained by means of remote sensing, using techniques that take into account a possible evolution of the air mass. This type of forecast therefore includes details that cannot be solved by numerical weather prediction (NWP) models running over longer forecast periods.
A good thing about having a foot of snow on the ground during extreme cold spells is that it INSULATES the ground and reduces the depth of frozen ground which will help reduce the chance for broken water pipes even with a week of frigid weather.
+++++++++++++
This is the just updated 18z GEFS total snow forecast. Not much change compared to previous runs.
Below is how the precip type breaks down just before dawn on Sunday.
Blue=Snow Purple=Sleet Red=Freezing Rain Green=Rain
Surface low in Alabama. Big Arctic HIGH to the north and west.
Totally different picture at 1 mile up where all the action will be happening(with dense very cold air hugging the ground. 850 mb low along the Western KY/TN border just north of Nashville. Note the strong south winds ahead of the system at this level pumping in Gulf moisture(which is being suppressed by Arctic HIGH pressure at the surface, above.
This is a freeze frame image to save. Only 4 states out of 48 contiguous states don't have extreme Winter weather warnings.
Washington, Idaho, Nevada and California.
Current Hazards at the link below.
For your NWS and county, go to the link below.
Then you can hit any spot on the map, including where you live and it will go to that NWS with all the comprehensive local weather information for that/your county.
Just out 0z GEFS. Not much change. Snow amounts dropping west because some has fallen already.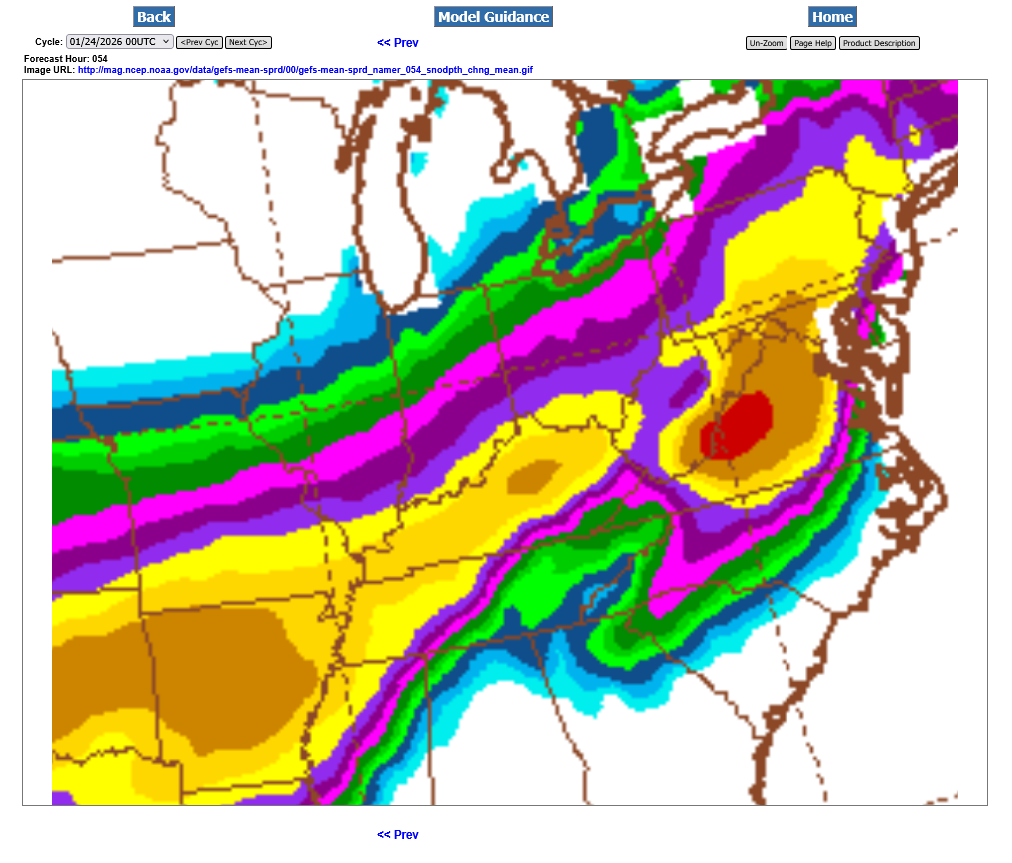
++++++++++++++++++=
Sunday morning around dawn is during a period when the snow will be coming down the heaviest. At that time sleet will be making its way north into southern Kentucky as warmer air aloft, loaded with moisture changes the snow to rain(that freezes on the way down=sleet)
Blue=snow Purple=sleet Red=freezing rain Green=rain
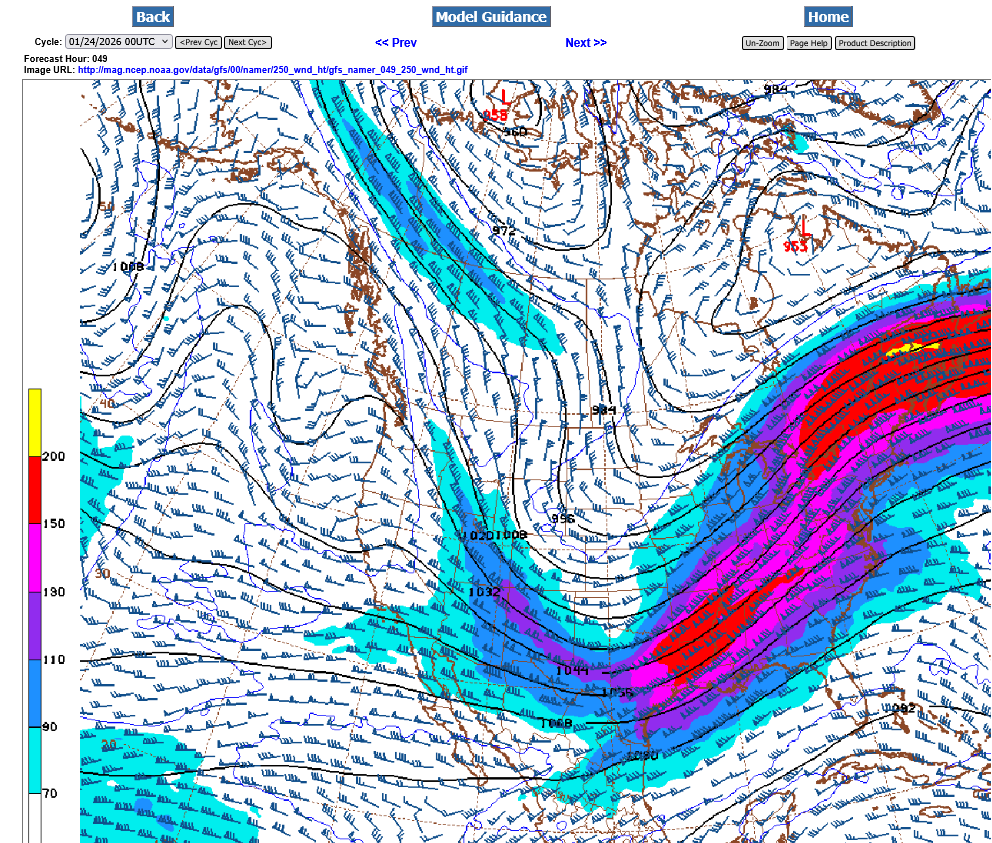
Below is the 250 mb map late Sunday, around 32,000 feet up. This powerful jet stream is the main force driving the dynamics of this storm. The northern, polar branch and southern branch are phased together with a huge piece of southern stream energy coming up from the south at this time frame.
The storm will be hitting the East Coast at this time.
The color bars are in knots. The reds are 175+ mph(150 knots). The streak of yellow is around 230 mph(200 knots), the top color bar on the left.
The LOW just east of the Hudson Bay is a piece of the Polar vortex, unusually far south with an extension deeply into the Midwest. Another reinforcing strong piece of northern stream energy is diving thru Western Canada, aimed at the US.
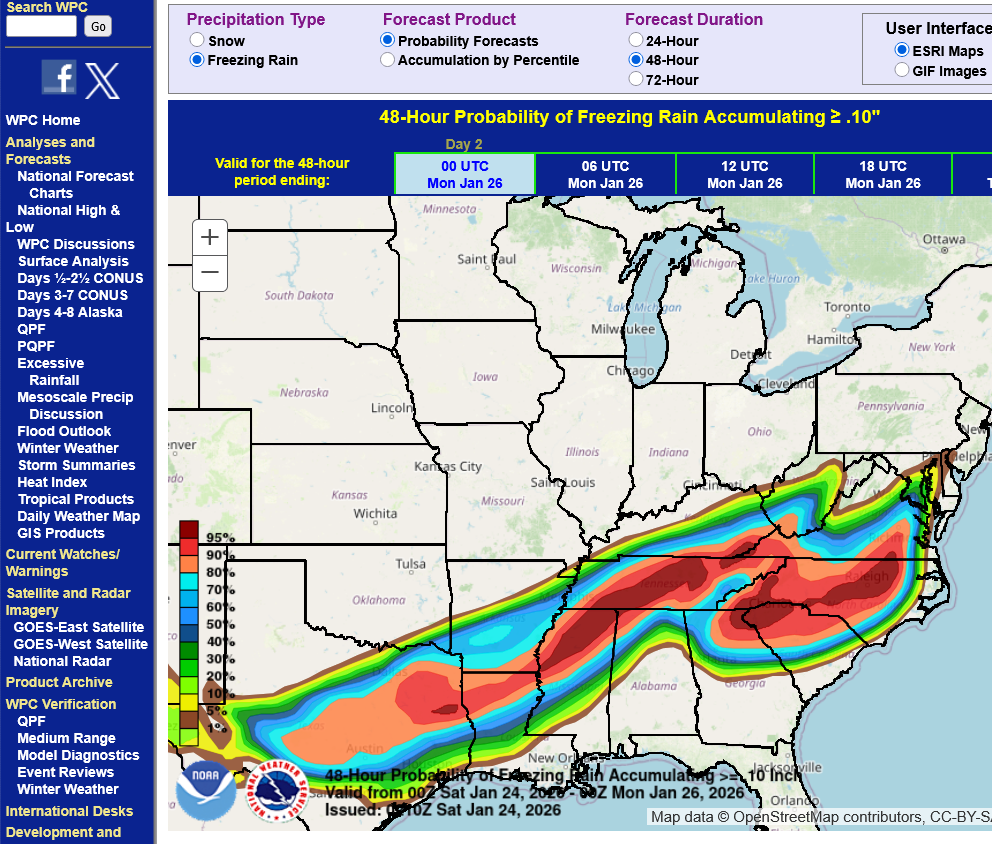
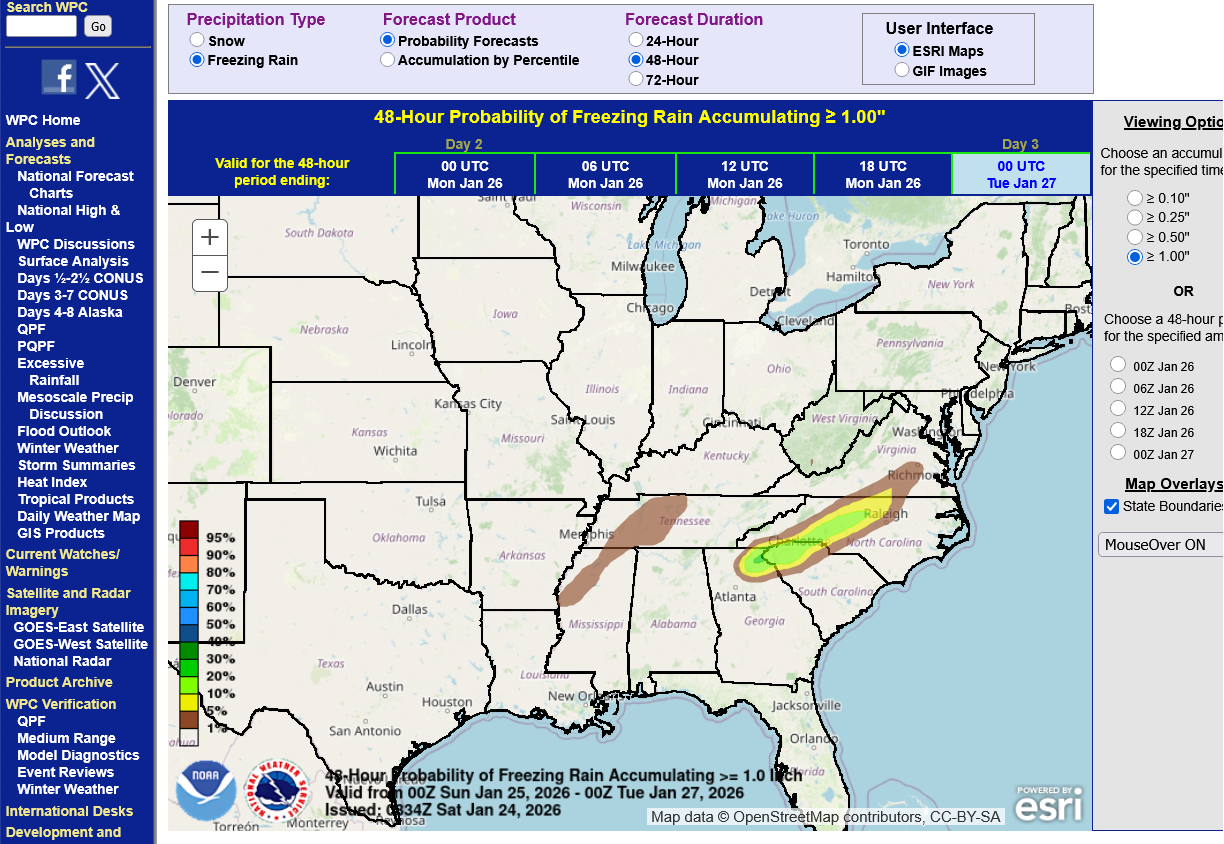
1. Probability of freezing rain greater than .10 below
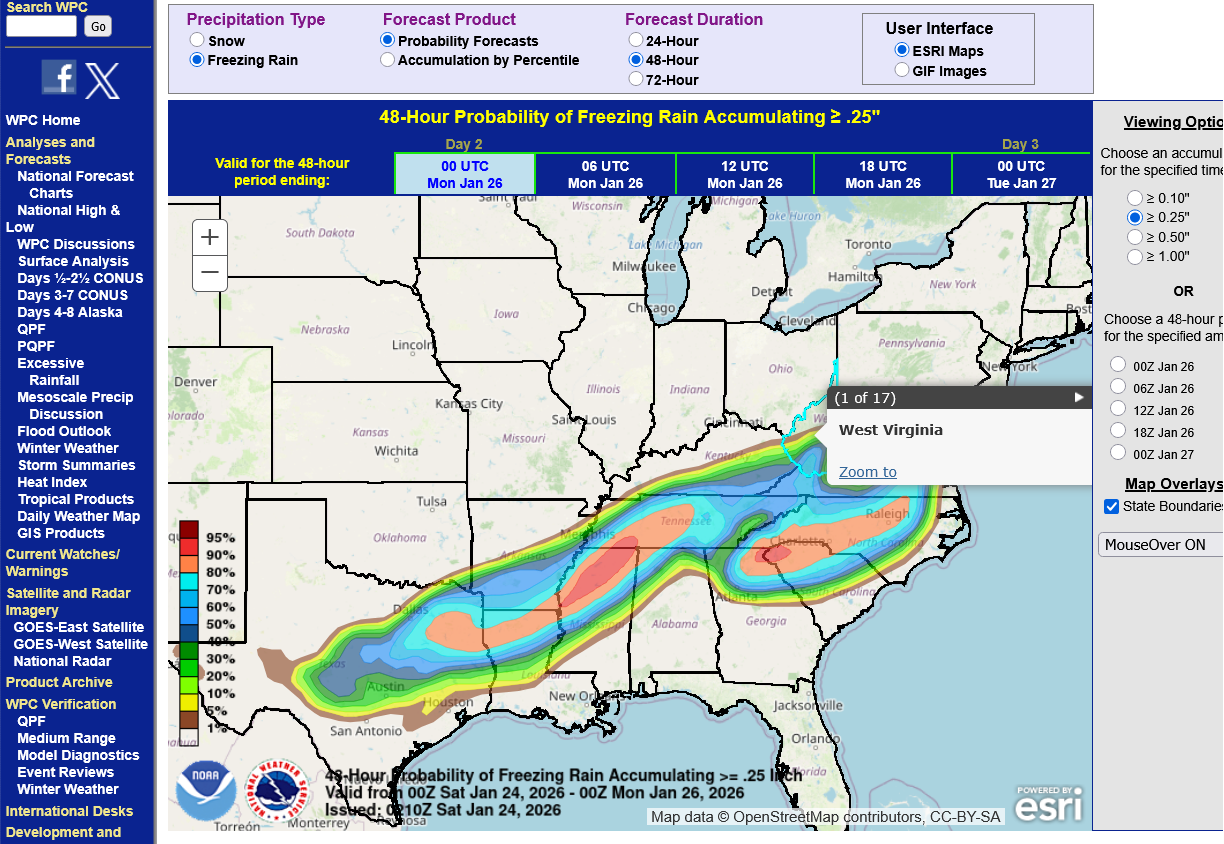
2. Greater than .25
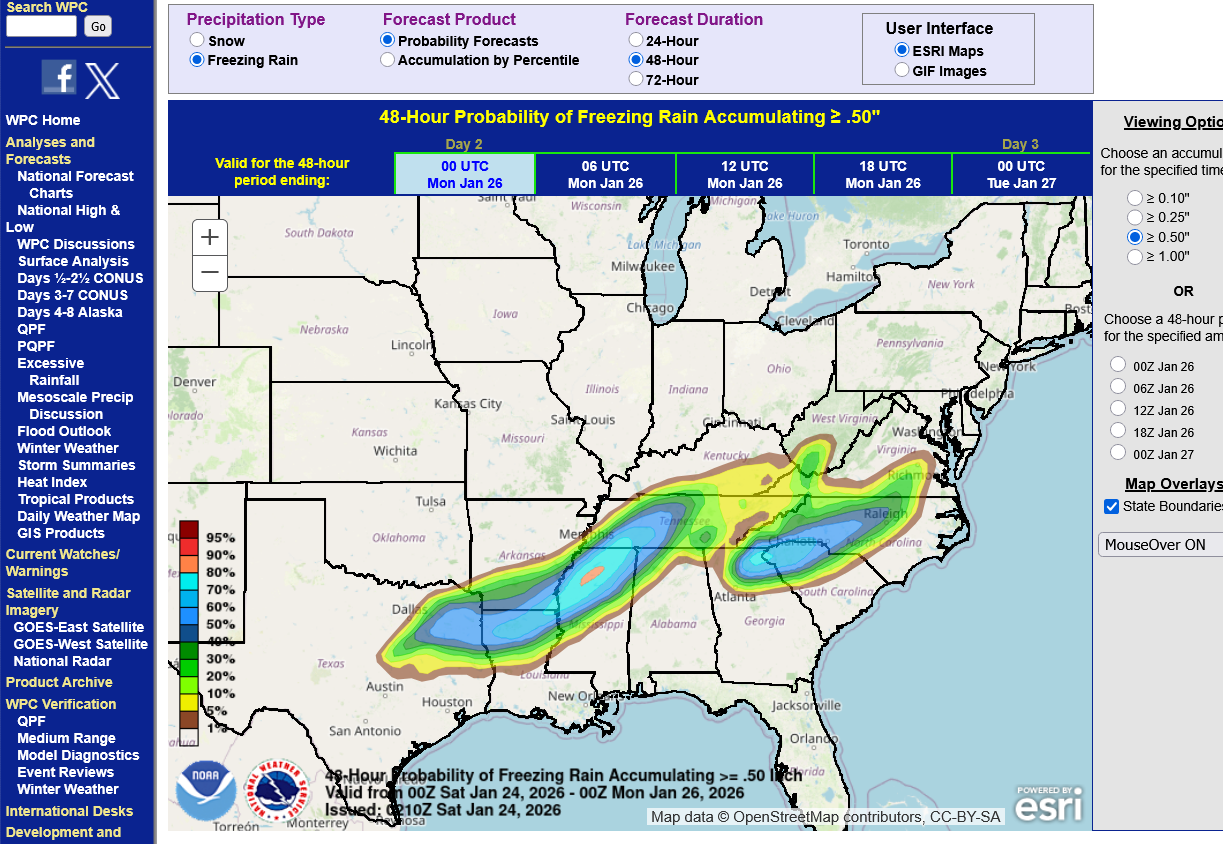
3. Greater than .50
4. Greater than 1 inch
This last run of the 6z GEFS is up to 15 inches of snow along the Ohio River! Dark brown is 18 inches.

1-23-26 Tracking the historic Winter Storm
Started by metmike - Jan. 24, 2026, 12:17 a.m.
https://www.marketforum.com/forum/topic/117428/


