
Previous threads:
Historic snow/ice, late week of 1/18/26
26 responses |
Started by metmike - Jan. 18, 2026, 4:49 p.m.
https://www.marketforum.com/forum/topic/117294/
++++++++++++++
Frigid Blast
Started by metmike - Jan. 17, 2026, 10:44 p.m.
https://www.marketforum.com/forum/topic/117282/
++++++++++++++
Get all the comprehensive weather here:

Current Hazards at the link below.
For your NWS and county, go to the link below.
Then you can hit any spot on the map, including where you live and it will go to that NWS with all the comprehensive local weather information for that/your county.

This last run of the 6z GEFS is up to 15 inches of snow along the Ohio River! Dark brown is 18 inches.
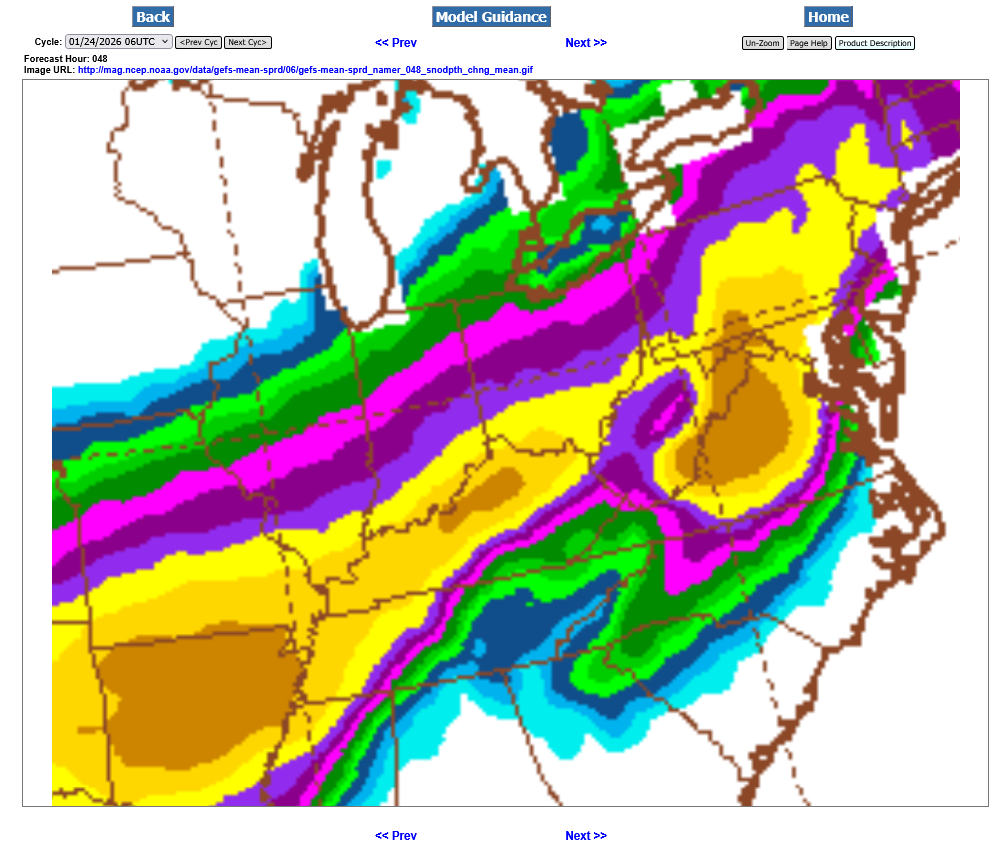
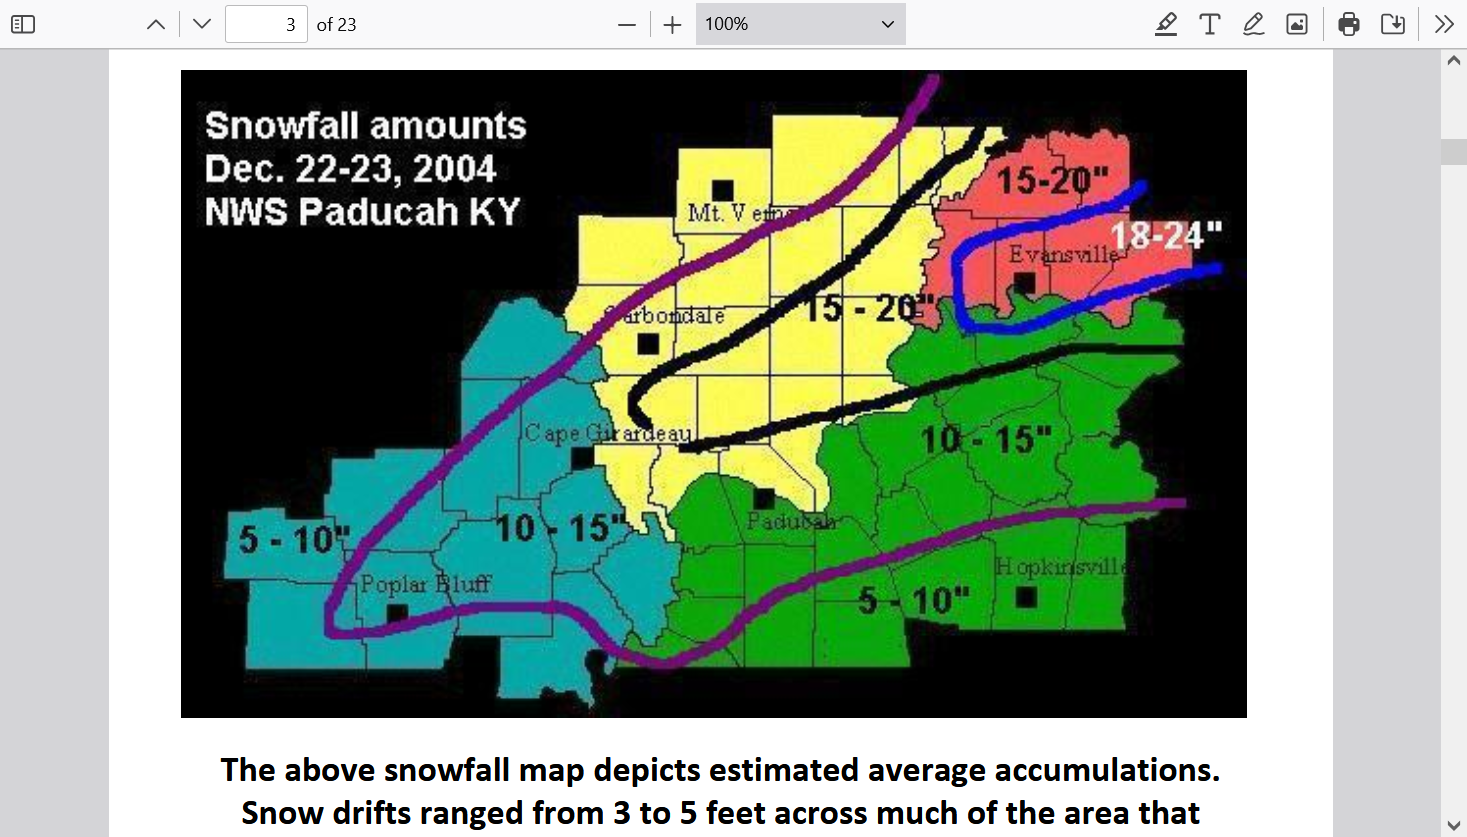
This will be the biggest snowfall since 2004 for Evansville:
https://www.weather.gov/media/pah/Top10Events/2004/Dec22_2004Snowstorm.pdf
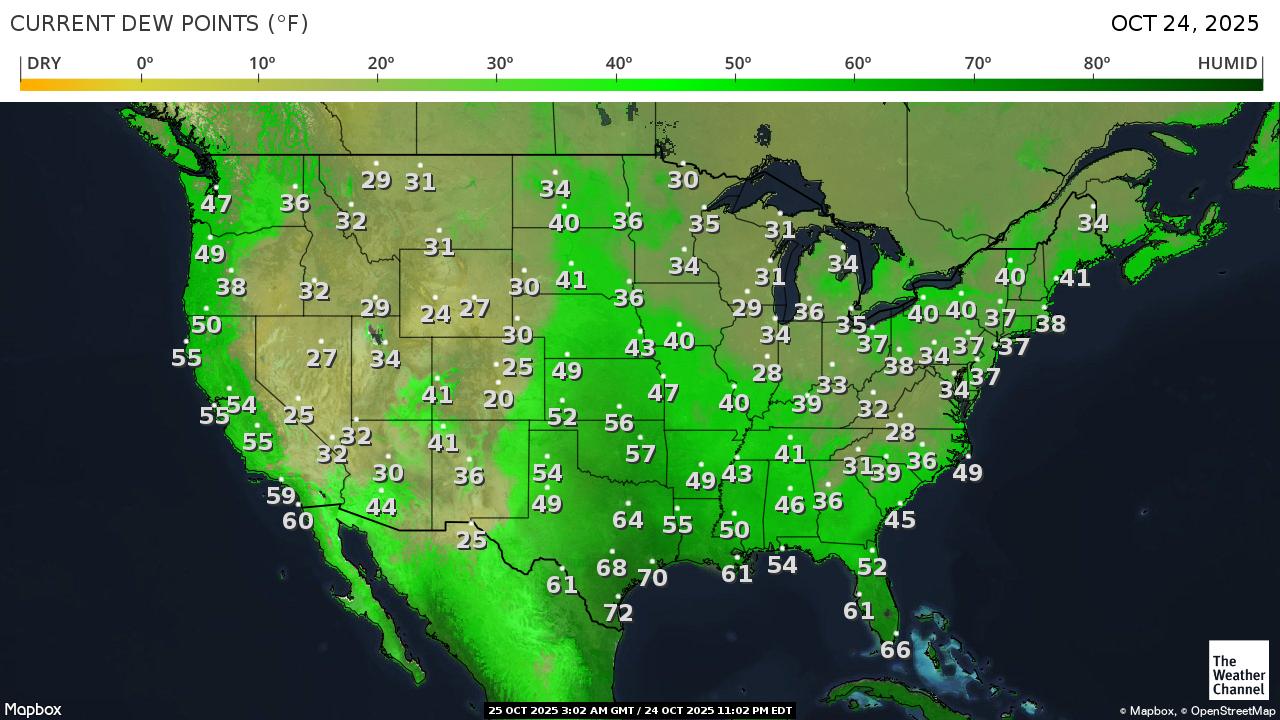
At 8:50 am, the radar below has been showing light/moderate snow for awhile but not a flake is reaching the ground(yet).
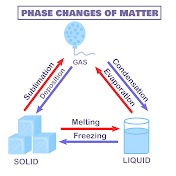
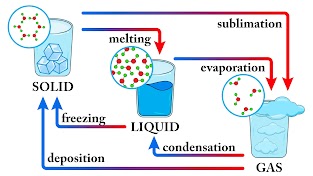
Incredibly dry air initially, with dew points below zero is causing all of it to sublimate on the way down(frozen water that goes directly to a gas without passing thru the liquid phase).
Once the air column becomes saturated, the snow will be able to reach the ground.
https://radar.weather.gov/station/kvwx/standard
Local radar Super Resolution Base Reflectivity

Sublimation:
https://en.wikipedia.org/wiki/Sublimation_(phase_transition)
Sublimation is the transition of a substance directly from the solid to the gas state, without passing through the liquid state

+++++++++++++++++
metmike: There will be a meteorology test at the end of the weekend to make sure you've been learning about the weather
https://www.youtube.com/shorts/0Zb7ocT21CU
+++++++++++++++++++++
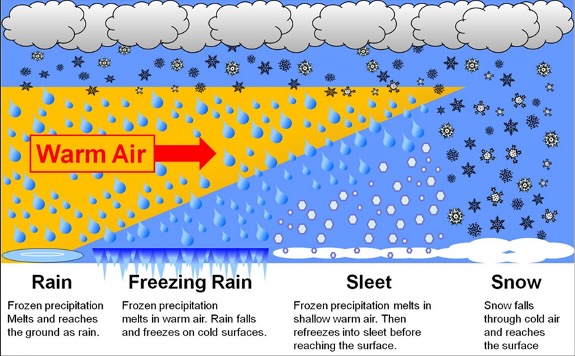
Here's some easier to understand diagrams.
+++++++++++++++++++++++++=
THE A T M O S P H E R I C R E S E R V O I R
Examining the Atmosphere and Atmospheric Resource Management
“Five Things You (Probably) Didn’t Know About Snow”
This is the regional NWS link for the Evansville area:
++++++++++++++++
Note how cold it will be for the entire upcoming week:
https://forecast.weather.gov/MapClick.php?x=285&y=90&site=pah&zmx=&zmy=&map_x=285&map_y=89
++++++++++++++
After a foot of snow falls, there will be very little melting for the next week. Main roads will be plowed, salted and traffic will melt snow so they should be in good shape by early next week.
Side streets and rural/outlying areas will take a long time to eliminate snow/slippery roads to make them safe for buses loaded with students going back and forth to school. It's conceivable that there will be no school for the entire upcoming week.
+++++++++++++++++
This graph below shows how the effectiveness of chemicals PLUMMETS as temperatures drop below freezing(use temps on the left side).
NaCl (sodium-chloride) is especially ineffective as temperatures drop into the single digits and below. CaCl(Calcium-chloride) still works with extreme cold but the melting is extremely slow.
https://www.fhwa.dot.gov/publications/research/safety/95202/005.cfm
The 30 percent concentration of calcium chloride shown in Figure 16 at the eutectic temperature is higher than the corresponding concentration of a commercially available pelletized form of calcium chloride (29.6 to 29.8 percent). Some differences can occur between individual phase diagrams of commercially available calcium chloride-water systems because of the presence and amounts of other chemical elements.
Some evidence suggest that anti-icing operations should not be conducted (using liquid, prewetted, or dry salt) when the pavement temperature is at or below about -9.5°C (15°F) (2). Some highway agencies also believe that it is not practical to use salt below -9°C (15°F) for general snow and ice control operations, at least not without calcium chloride. This experience has convinced them that salt’s action is too slow at these lower temperatures. An inspection of Figure 16 shows that the phase diagrams of NaCl and CaCl2 are not too dissimilar in the temperature range of 0°C (32°F) down to -10°C (15°F) or even down to about -15°C (5°F). Thus, the two chemical brines have about the same solidification (freezing) characteristics in this temperature range. The fact that calcium chloride has a much lower eutectic temperature than sodium chloride is not of importance for anti-icing operations.
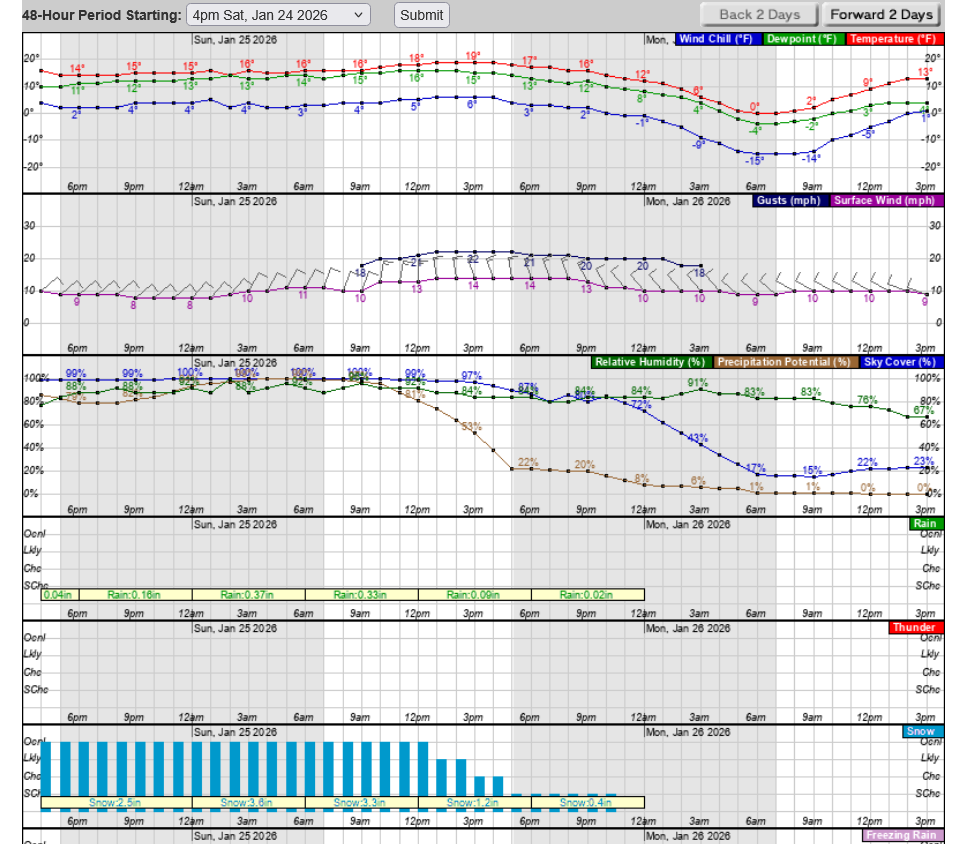
North winds on Sunday afternoon will gust above 25 mph and cause the snow to blow especially across west to east(perpendicular) country roads and wide open areas.
There could be some minor drifting because this snow will be so dry.
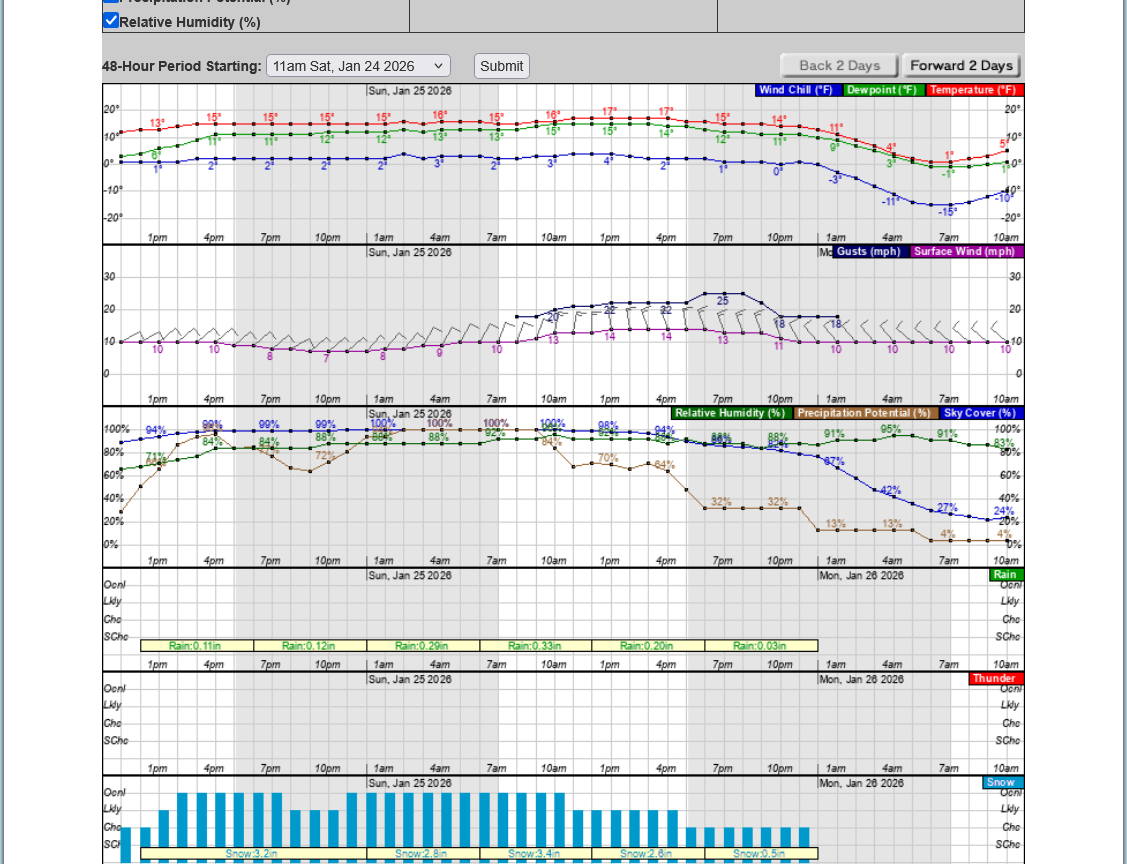
Temperatures when this extremely dry, fluffy snow falls along the Ohio River will be in the low teens.
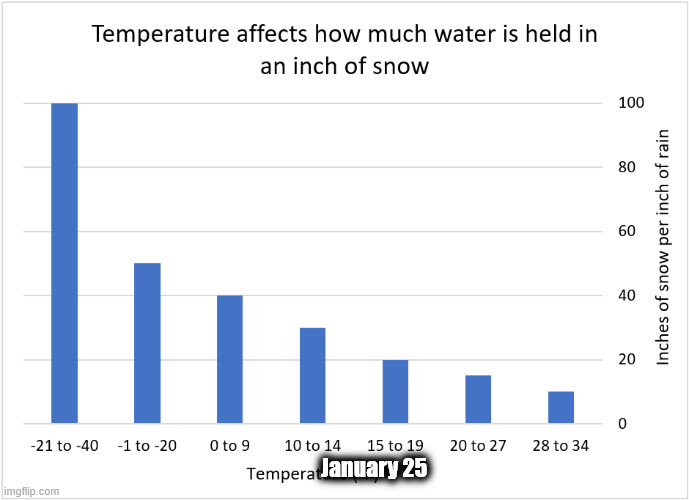
Typically, snows here have a 10 to 1 water equivalent when the temperature is near 32 deg. F. With this snow it will be a whopping 30 to 1 ratio today/Saturday!!!
If it's not too heavy, that's the type of snow that you can sweep instead of shovel. No snowmen for us this time around with extremely poor packing.
On Sunday, with temps/dew points increasing the ratio will go up to around 20 to 1, which is still just half the moisture of our typical snows.
Here's a really nice bar graph that gives a better image of this concept with 1 picture.
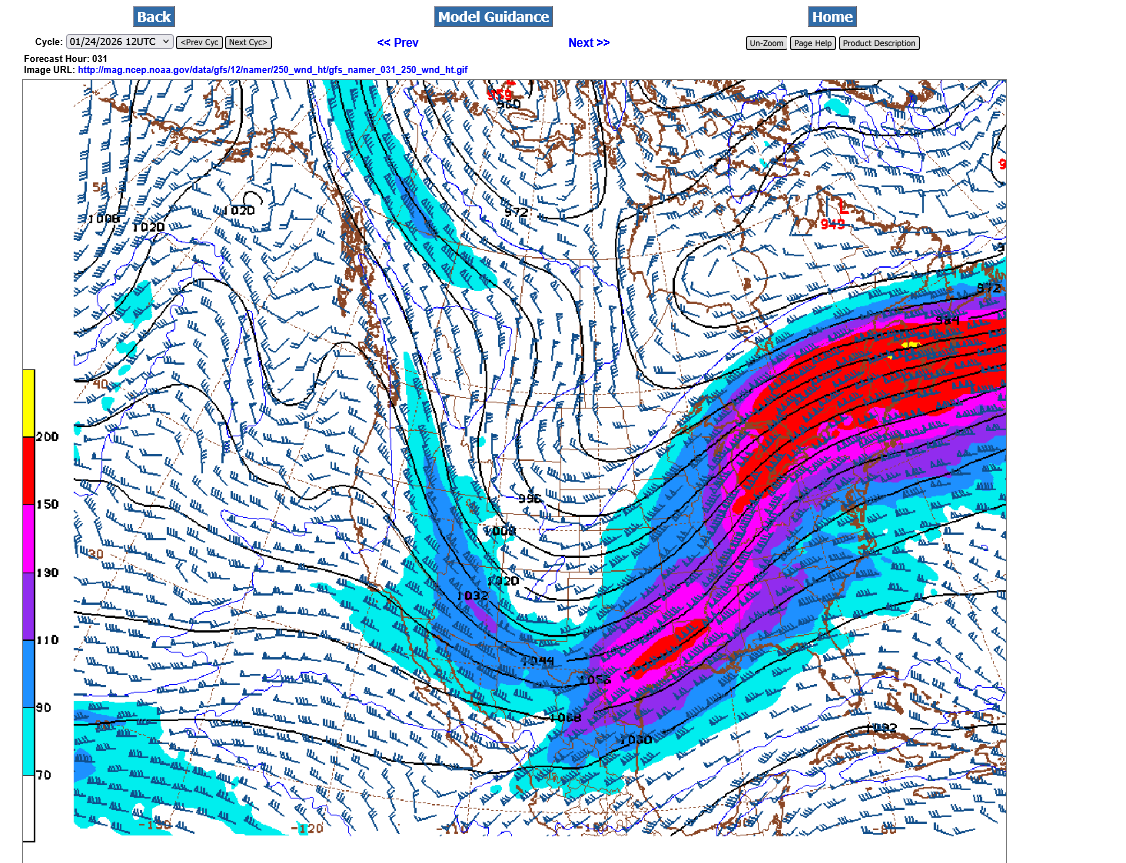
This is the 250 mb map for Sunday PM. This is around 34,000 feet above the ground.
This storm is not getting much surface development like most of our heavy snow producing Winter storms. The dynamics are especially happening in the upper levels with a POWERFUL jet stream well over 200 mph. The color bars are in knots(5 knots=6 mph).
1. Note how powerful the jet stream is. Reds are 175 mph+. The streak of yellow is 230 mph+.
2. The northern(Polar) and southern jet streams are phasing. Note the huge chunk of jet stream energy being injected from the south at that time. This is why the HEAVIEST snows won't develop until Saturday Night and especially early Sunday morning. Without that trailing blob, injecting from the south, snows would be less than half the expected amounts and over with very early Sunday.
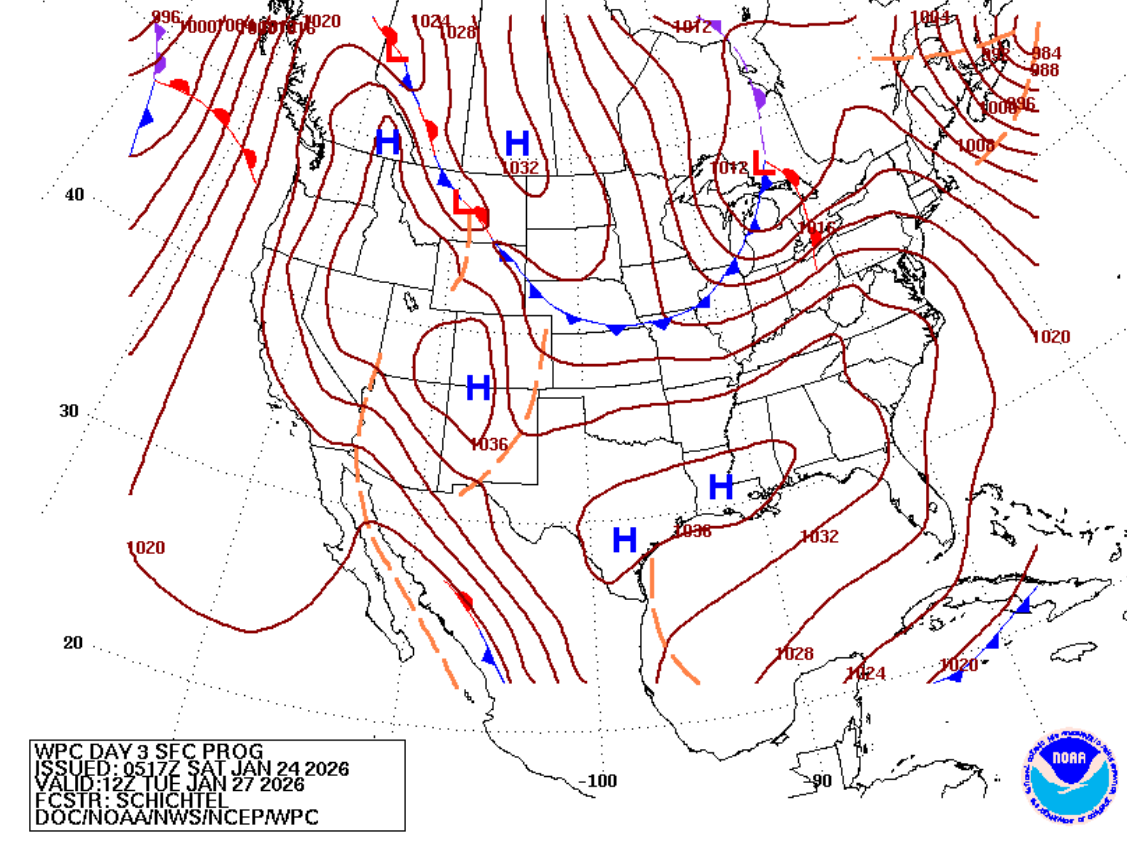
3. The Low in Southeast Canada with a trough/extension back to the Midwest is a huge piece of the Polar Vortex that's currently displaced 1,200 miles farther south than its typical position.
4. Note blue's in Northwestern Canada. This is another reinforcement/(perturbation in the flow) of the cross polar jet stream dropping thru Canada, aimed at the United States that will continue thru the upcoming week, keeping us in the deep freeze. This will usher in another SIBERIAN blast the surface (2nd map). This is CROSS POLAR flow that has been flushing Siberian air masses into Canada all month but now they are plunging deeply into the United States.
The computer numerical forecast(AI) product has updated the additional snow totals at around 11 inches (over and inch that fell so far). So that would be closer to 12". There will be heavy snow bands that develop overnight and Sunday morning which are not predictable that determine where the heaviest totals are.
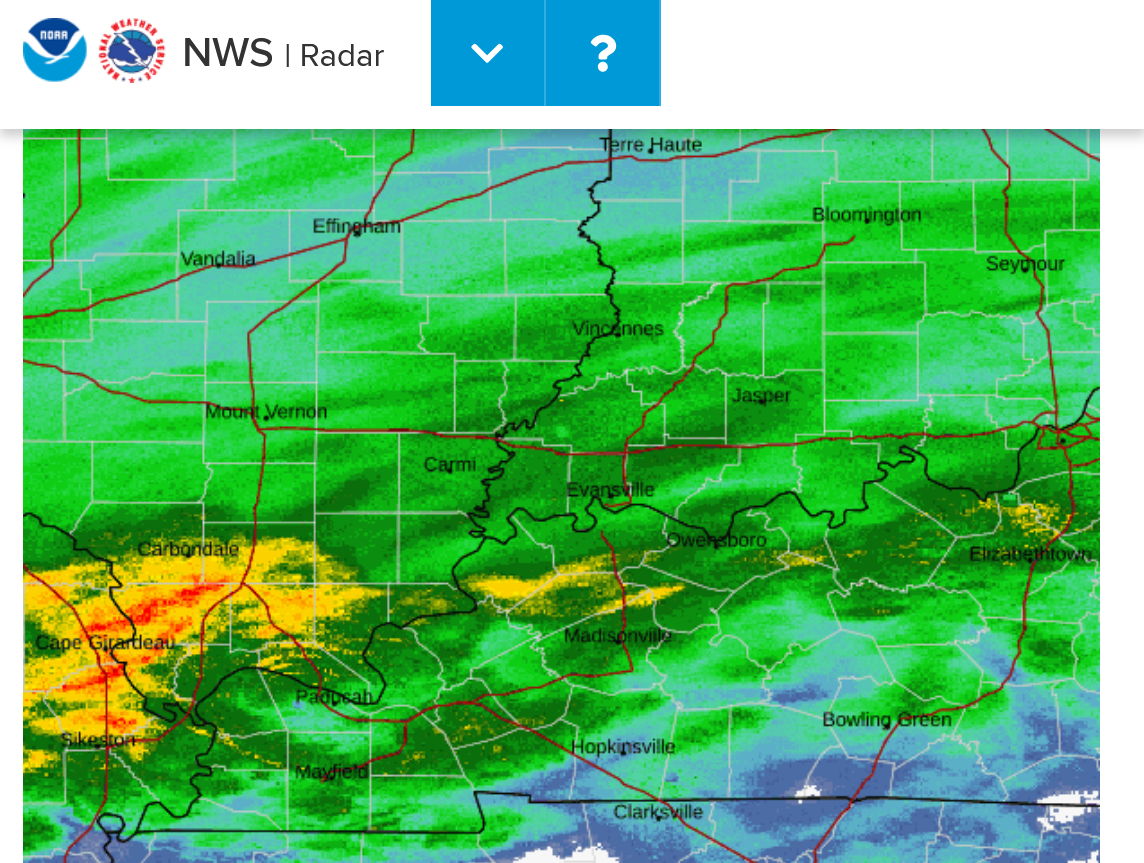
We are now into the NOWcasting phase of the storm, where the models get less weighting and observations the MOST weighting. As such, an unpredicted dry slot has developed in the southern area of frozen precip and the heaviest snow is now to the north, into central IL/IN.
This is likely to fill in later this evening when the southern stream energy approaches but it will cut down on amounts in AR and w.KY/w.TN to far s.IN for a few hours.
https://radar.weather.gov/station/kvwx/standard
Local radar Super Resolution Base Reflectivity
https://en.wikipedia.org/wiki/Nowcasting_(meteorology)
Nowcasting is weather forecasting on a very short term mesoscale period of up to 2 hours, according to the World Meteorological Organization, and up to six hours, according to other authors in the field.[1][2] This forecast is an extrapolation in time of known weather parameters, including those obtained by means of remote sensing, using techniques that take into account a possible evolution of the air mass. This type of forecast ...
+++++++++++++++++
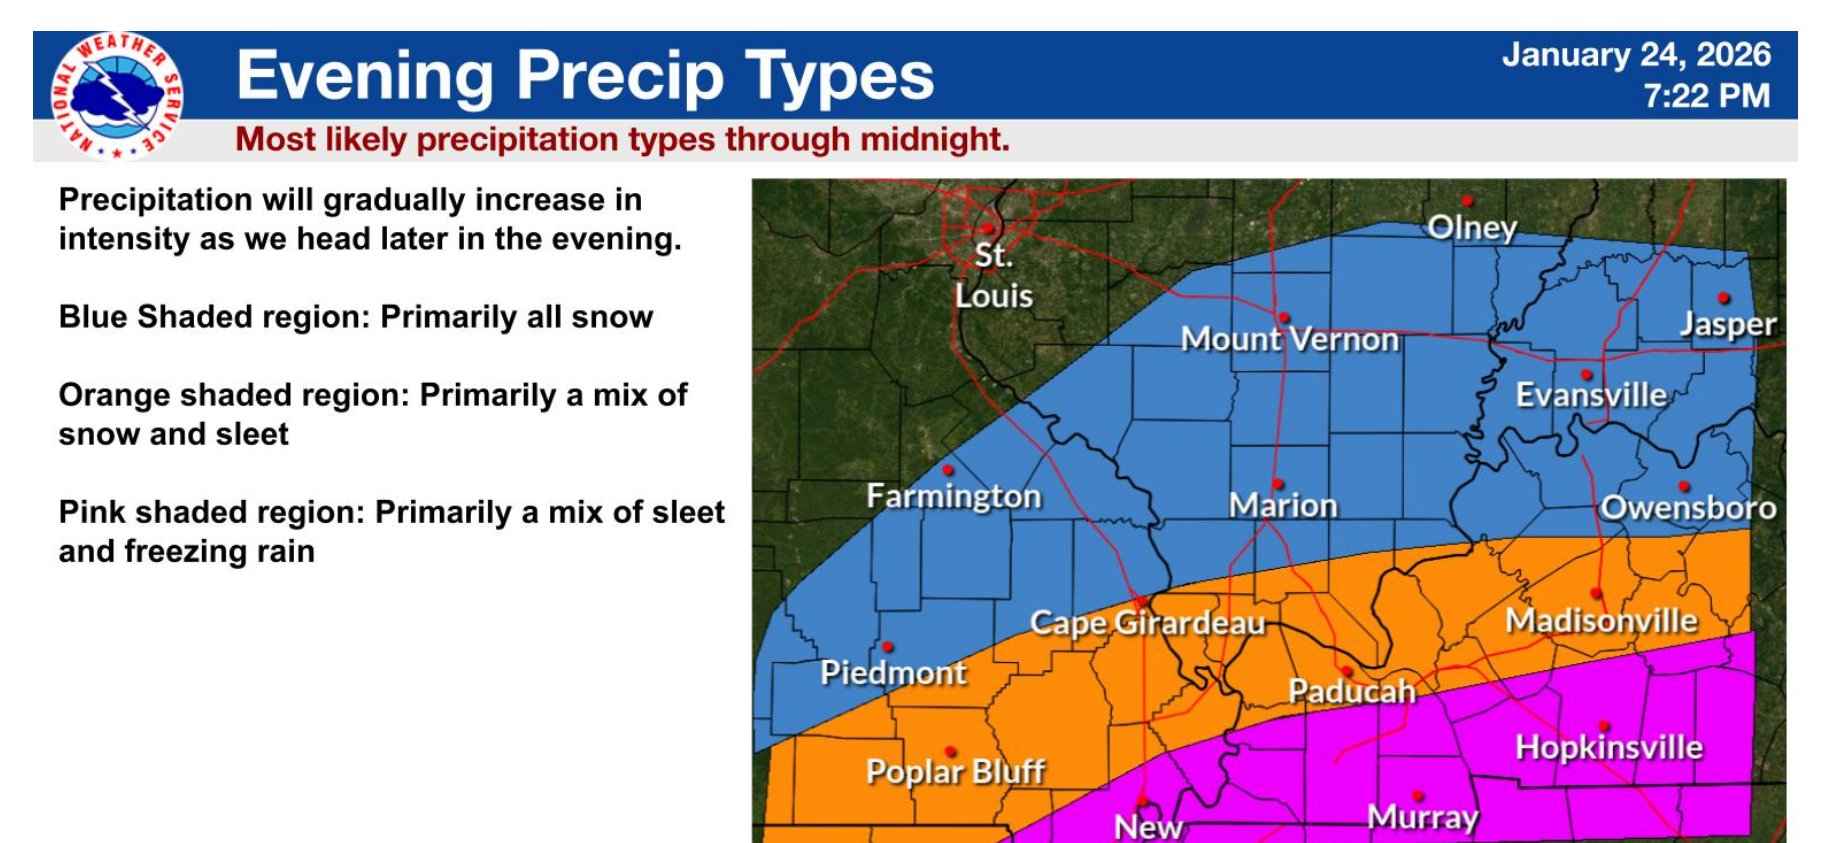
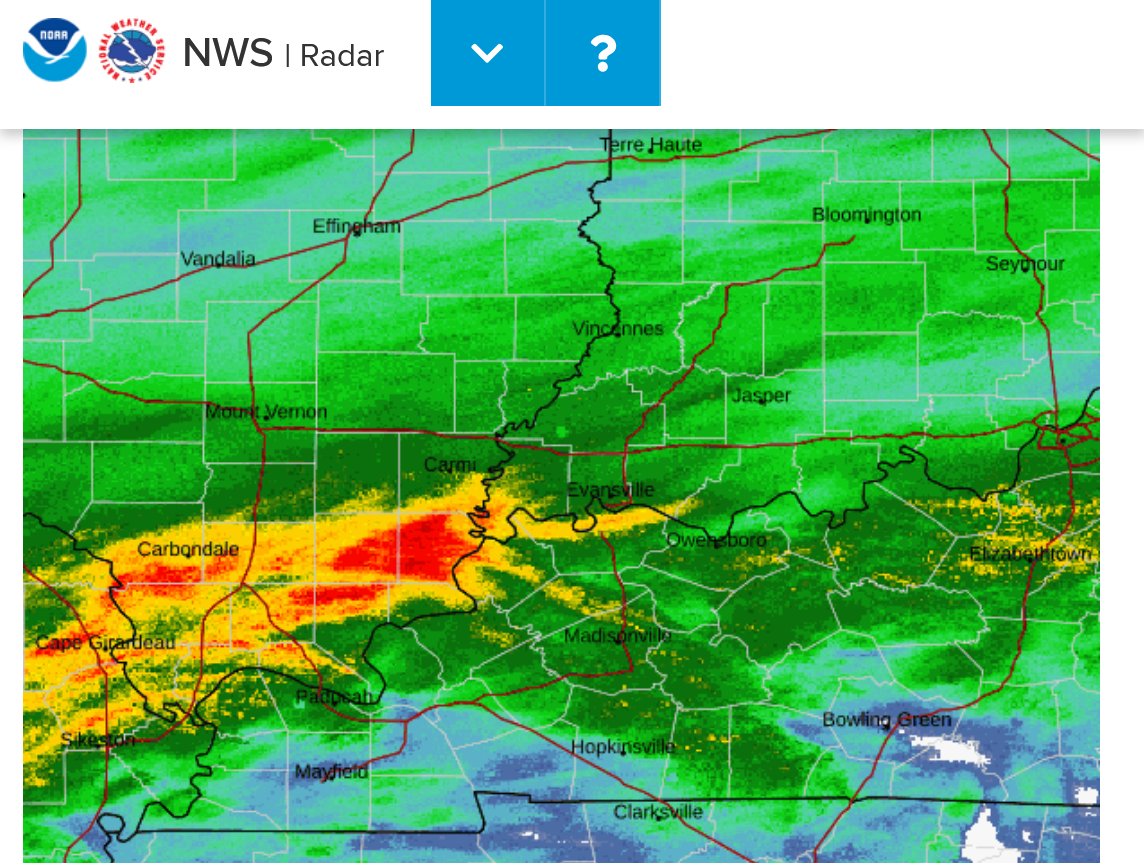
5pm: The radar returns are rapidly changing, with heavier bands randomly scattered around. Be looking for the sleet signatures that may be starting to show up in far southwest KY. Sleet(ice pellets) has some extreme reflectivity and can almost look like a thunderstorm with yellows and even reds if its heavier sleet.
6PM: No doubt about that being sleet on the radar in W. Kentucky
After a lull in activity, it should really pick up by 7pm in Evansville. That sleet is being caused by strong warm/humid air advection aloft from the approaching southern stream energy and southerly winds aloft warming the air to above freezing which is causing above freezing temps and rain aloft that is freezing on the way down, in the sub freezing air Arctic air that is hugging the ground but several thousand feet thick.
It's possible that the sleet could work up close to Evansville overnight since this southern stream wave is a bit stronger than expected according the recent guidance.
With some of the snow having already fallen, we need to add that to whatever the latest models show. However, this last model run was taken from empirical data observed/measured at NOON Central Time. Before Evansville really had much accumulation.
Regardless, the just updated 18z GEFS, which has a starting period of NOON Central has an updated forecast with the 18 inch snow band over the Ohio River, including Evansville.
The AI product still has just 10 inches to go on top of around 2.
+++++++++++++
The difference between 12 inches and 18 inches is probably less than .3" of water equivalent at the dry snow density of 20+ to 1.
https://radar.weather.gov/station/kvwx/standard
It's snowing at least an inch/hour now. The heaviest snow looks like its setting up over and close to us.
9pm: I measured 3 inches.
Heavy stuff in southern IL looks like sleet in it. Evansville could have a bit of sleet mixed in with the snow in just over an hour. That could cut back on snow totals later tonight if the sleet shifts farther north than expected. .
Heavy precip coming the next several hours!
++++++++++++++++++++
Sleet=rain freezes before reaching the ground. Ice pellets. Not much worse than snow on roads. Slides off of rooftops. Doesn't stick to trees/power lines.
Freezing rain=rain that freezes ON the ground and exposed surfaces. Icy. Bad on roads if it falls without snow underneath. Can collect on trees/power lines.
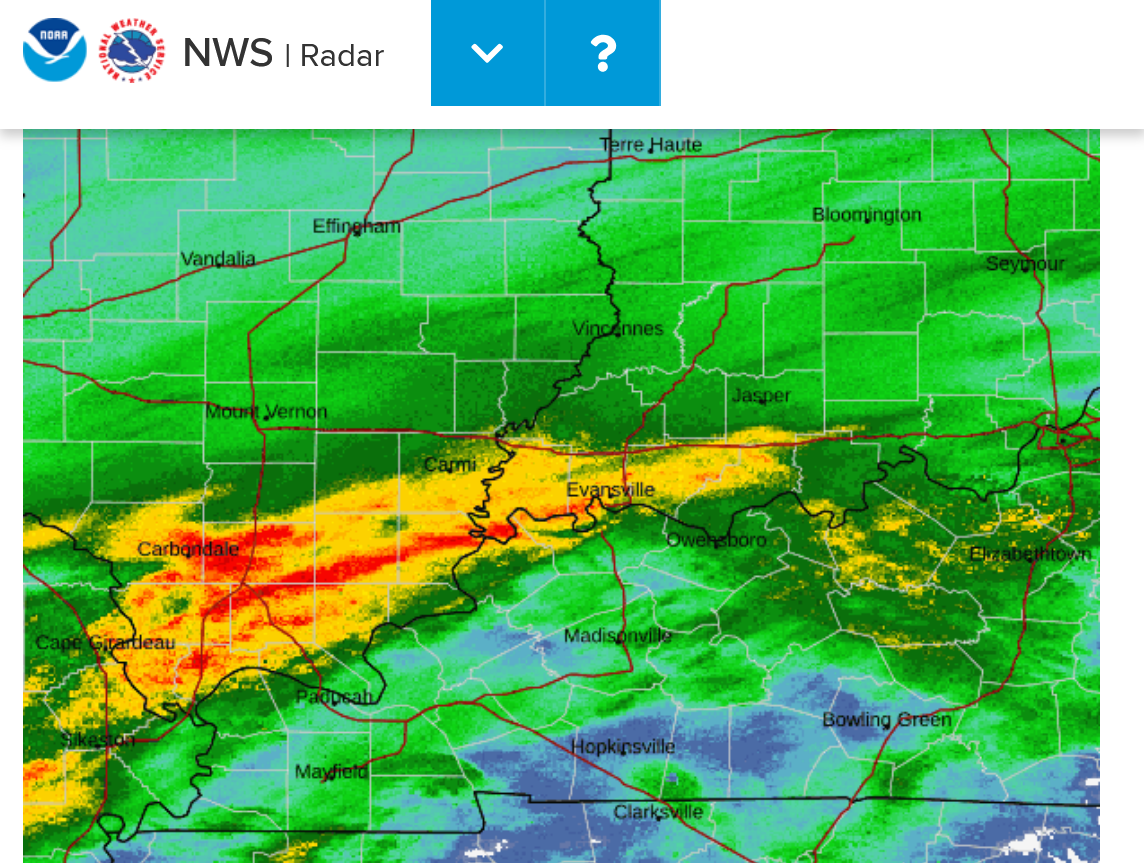
11pm: Looks like it snowed close to 2 inches the last hour. OK, now this is likely some big time sleet pushing across S. Illinois below: It's likely that within an hour the snow over Evansville will be mixing in with or temporarily turning to sleet.
This is clearly farther north than expected or what the models predicted.
Midnight below. WOW! The suspected sleet is 50 miles farther north than any of the models or forecasts earlier today. However, everything has shifted farther and farther north every day this week and this is just another BIG shift north.
If this is sleet it would cut back on snow amounts in Evansville.
12:45pm: The intensity of the yellows and oranges have dissipated moving northeast. With some of the lighter yellows over our house, I went outside to see if there's any sleet?
Nope! Just giant snowflakes and heavy snow falling at around 2 inches/hour. If all that yellow north of the Ohio River is heavy snow, then amounts are going to pile up quickly.
I measured just over 9 inches outside. This is preliminary and just a few spots outside the back door in a sheltered area.
This site has 24 hour snow reports but they are all over the place and many haven't been updated for a long time. Hit the + button to zoom in more, then put your cursor over the individual dots.
A spot 1 mile north of Evansville measured 10 inches 3 hours ago, which was the highest amount close by. Not sure how reliable that is.
https://www.weather.gov/source/crh/snowmap.html
++++++++++++
The NWS automated instrumentation at Evansville went bonkers just after midnight so there's no way to know what happened there.
++++++++++++++=
9am: I measured a few more spots farther out from the front door and got just over 10 inches.
+++++++++
10am Another strong wave is coming up from the south but it looks like the upper level system has shifted far enough east that most of the precip with this wave will pass just southeast and east of us. It will be very close though, with us on the northwest side of the snow shield. There's still the chance we could have a few more hours of moderate intensity snow but the window is closing.
We'll get more light snow on the BACK side of that but we are now on the back side of this weather event. Not a great deal of snow left today. Maybe we'll end up with 12 inches but not much more.
++++++++++
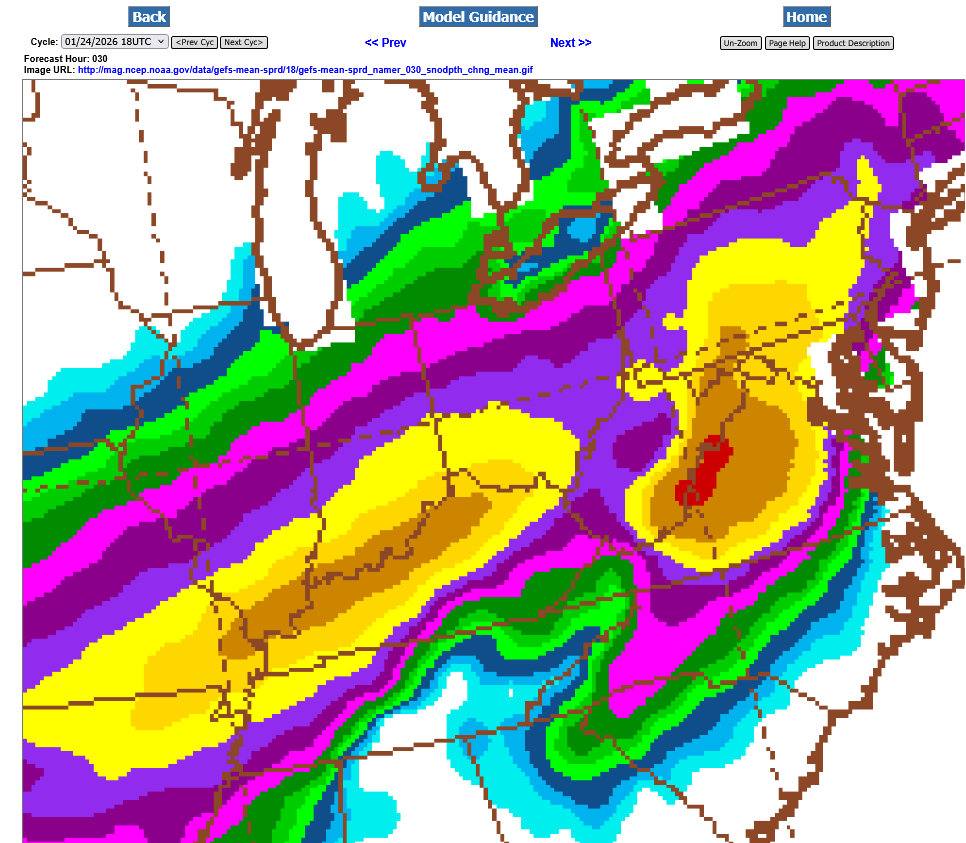
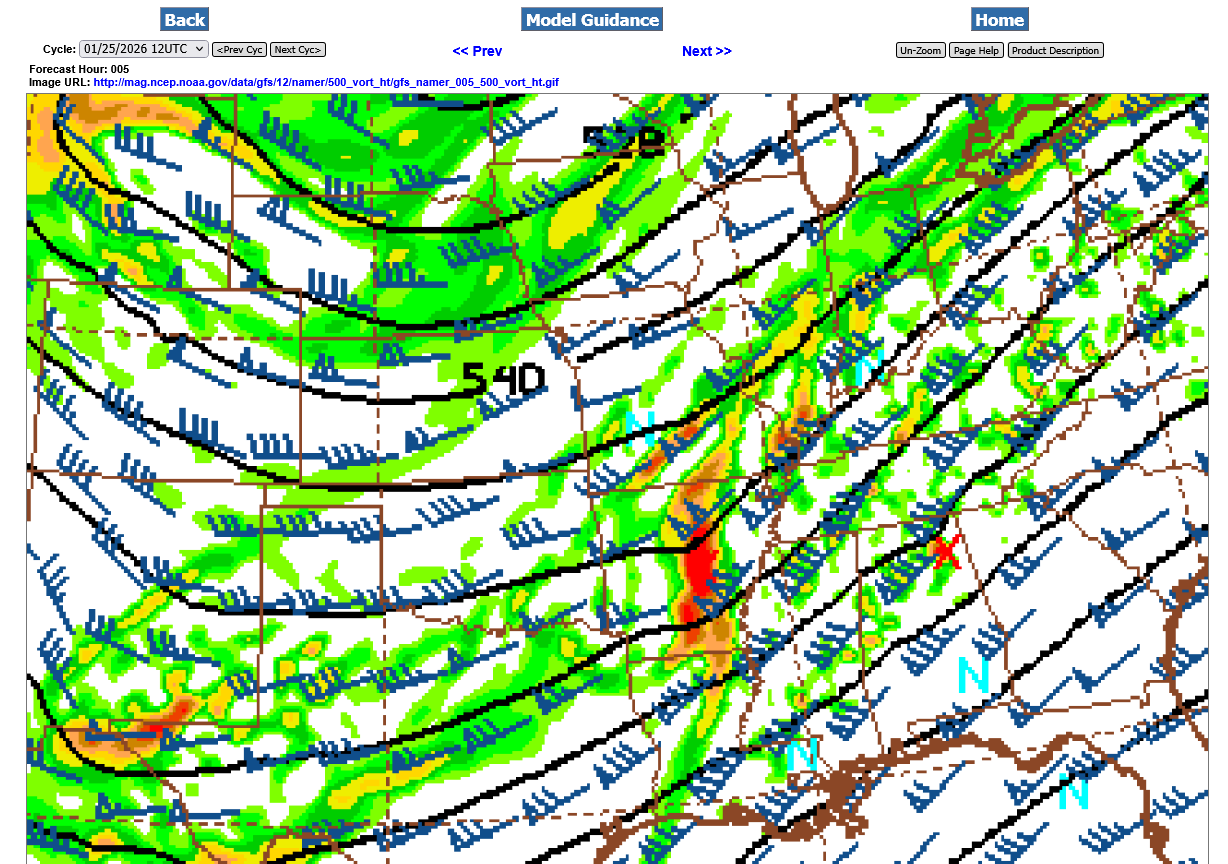
10: 30 am. Below is the upper level wave triggering the big increase in precip to our south/southeast right now. This is a vorticity map at 500 mb or around 16,000 feet up in this cold air. Vorticity is a measure of the spin in the atmosphere which causes LIFT, instability and precip when there is strong positive vorticity advection, like there will be with the strong vort max.
The PVA(positive vorticity advection) from this system happens as it moves thru the prevailing flow(that is defined by the streamlines-lines of constant heights). This vort max will pass SOUTH of Evansville the next 3-4 hours with Evansville getting some PVA but the greatest amount will be to our south, then our east after that.
After that happens early in the afternoon, only minor accumulations will be possible from very minor perturbations in the flow as the main dynamics/energy move away.
The way that the current radar looks, the PVA with this system is almost all staying to our southeast and there may not be much more SIGNIFICANT accumulating snow today.
11am: Here's a wonderful link/site to check out past radar images from any location and time frame.
https://www.ncei.noaa.gov/maps/radar/
You can set the images to whatever location you want to view and any 5 minute time frame.
Maybe when this is over, I'll do a thread that shows all the radar images for this entire event from start to finish
++++++++++++++++
11:30 am: AI just dropped the additional snow total from 2.6 to 1.5 as it catches on to the Nowcasting that a human being saw first!
+++++++++++
The back side filled back in and the snow is back on.
AI has 1.2 inches to go.
++++++++++
1:30pm: Winds are gusting above 20 mph so west to east roads that have long track flat ground exposure to the north will be vulnerable to blowing snow.
Well defined back edge of the snow shield of this very long lived, historical snow storm has just passed thru.
https://radar.weather.gov/station/kvwx/standard
The western horizon is brightening up and we could have a bit of sunshine(thru broken clouds) before it sets!
https://www.weatherstreet.com/midwest-us-weather-satellite.htm
Midwest U.S. Color Satellite Loop | |
|
Pretty amazing Winter Storm. A week ago, Evansville was on the northern periphery of the significant snows with the heavier amounts predicted to be much farther south.
Each day, the heavy snows in the forecast shifted slightly farther north.
Even late Friday, when the Winter weather had already started in the Plains and was just hours away......although that north shift had captured the essence of the changes in the big picture.........it was still not enough.
Evansville got just LESS than a foot of snow which was easily the most snow since the December 2004 all time biggest snow but the heaviest snows of 12+" were all north and west of Evansville.
https://www.weather.gov/pah/weatherstory
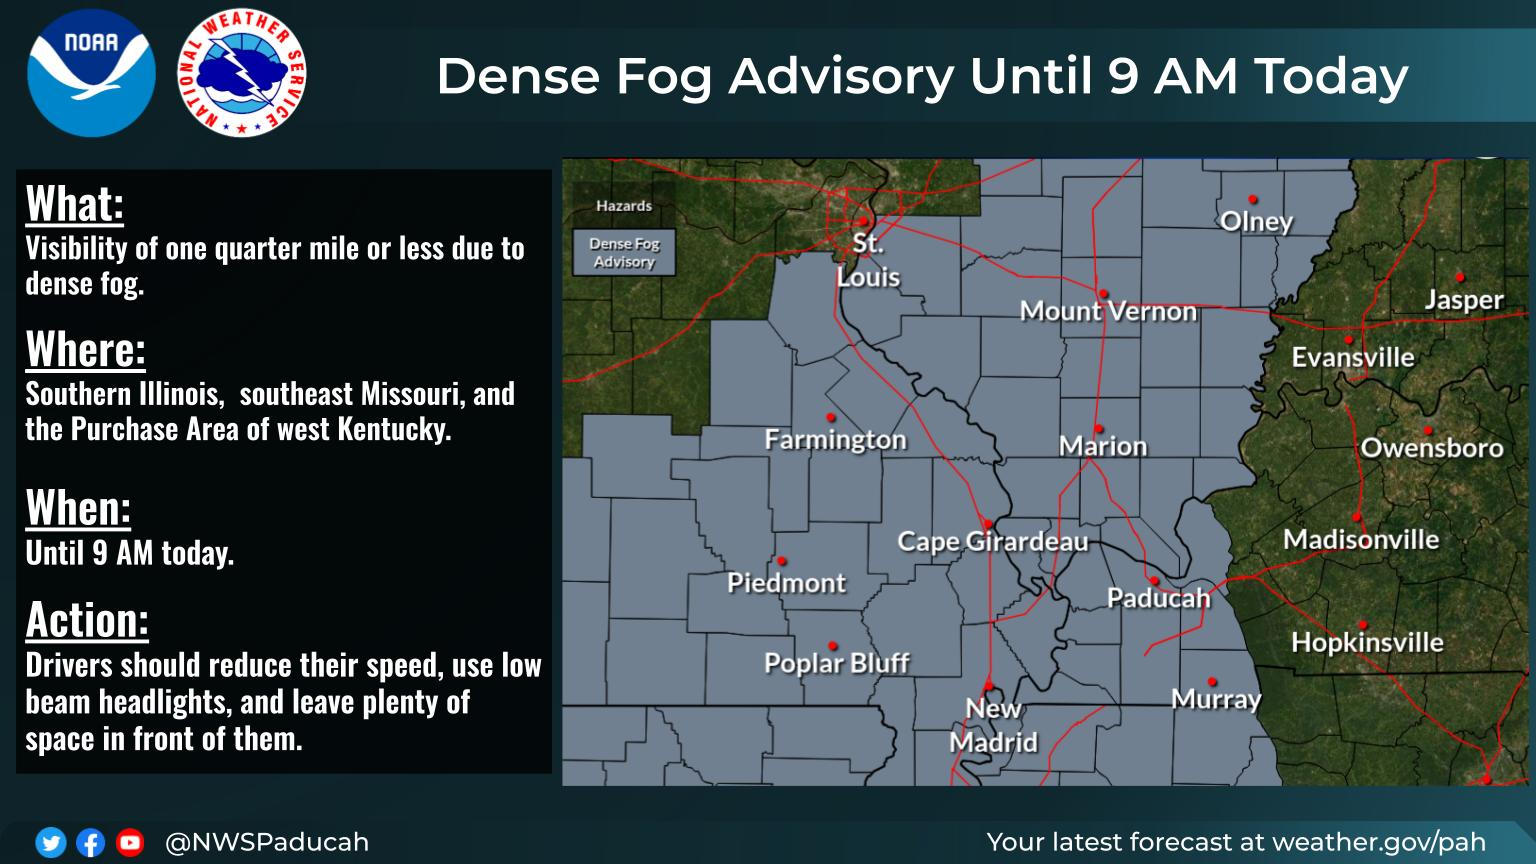
https://www.weather.gov/pah/weatherstory
Thank you very much, National Weather Service, especially our local office in Paducah that provides us with all this data that allows us to be super informed in 2026, as well as for helping to save countless lives by issuing timely weather watches, warnings, bulletins, advisories and emergencies BEFORE and during high impact events.
Allowing operational, commercial/private industry and broadcast meteorologists to be effective at doing our jobs.
+++++++++++++
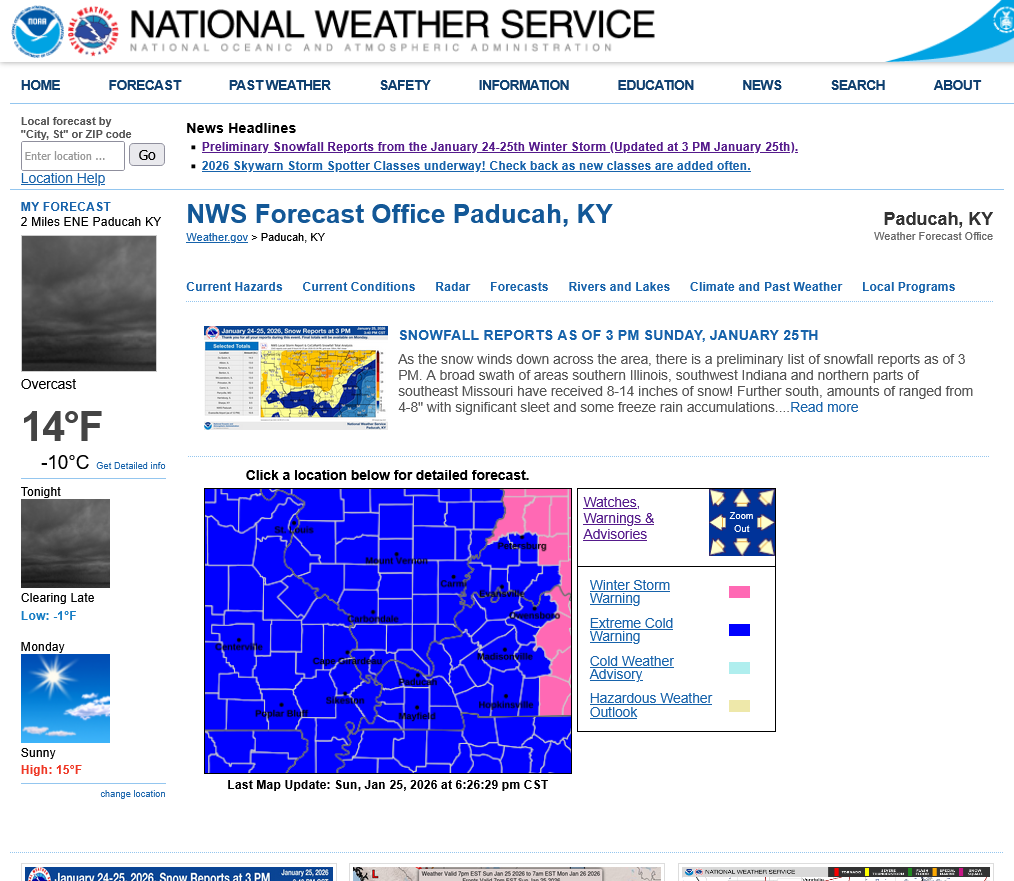
This is our own wonderful local/regional NWS page/link:
++++++++++++++++++
Current Hazards at the link below.
For your NWS and county, go to the link below.
Then you can hit any spot on the map, including where you live and it will go to that NWS with all the comprehensive local weather information for that/your county.
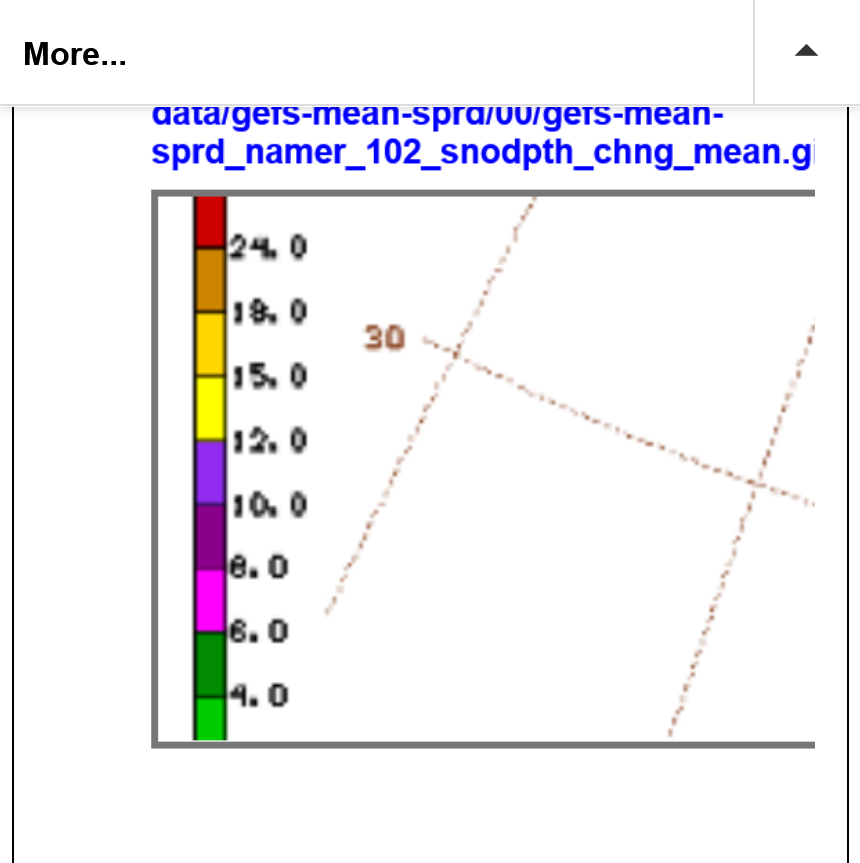
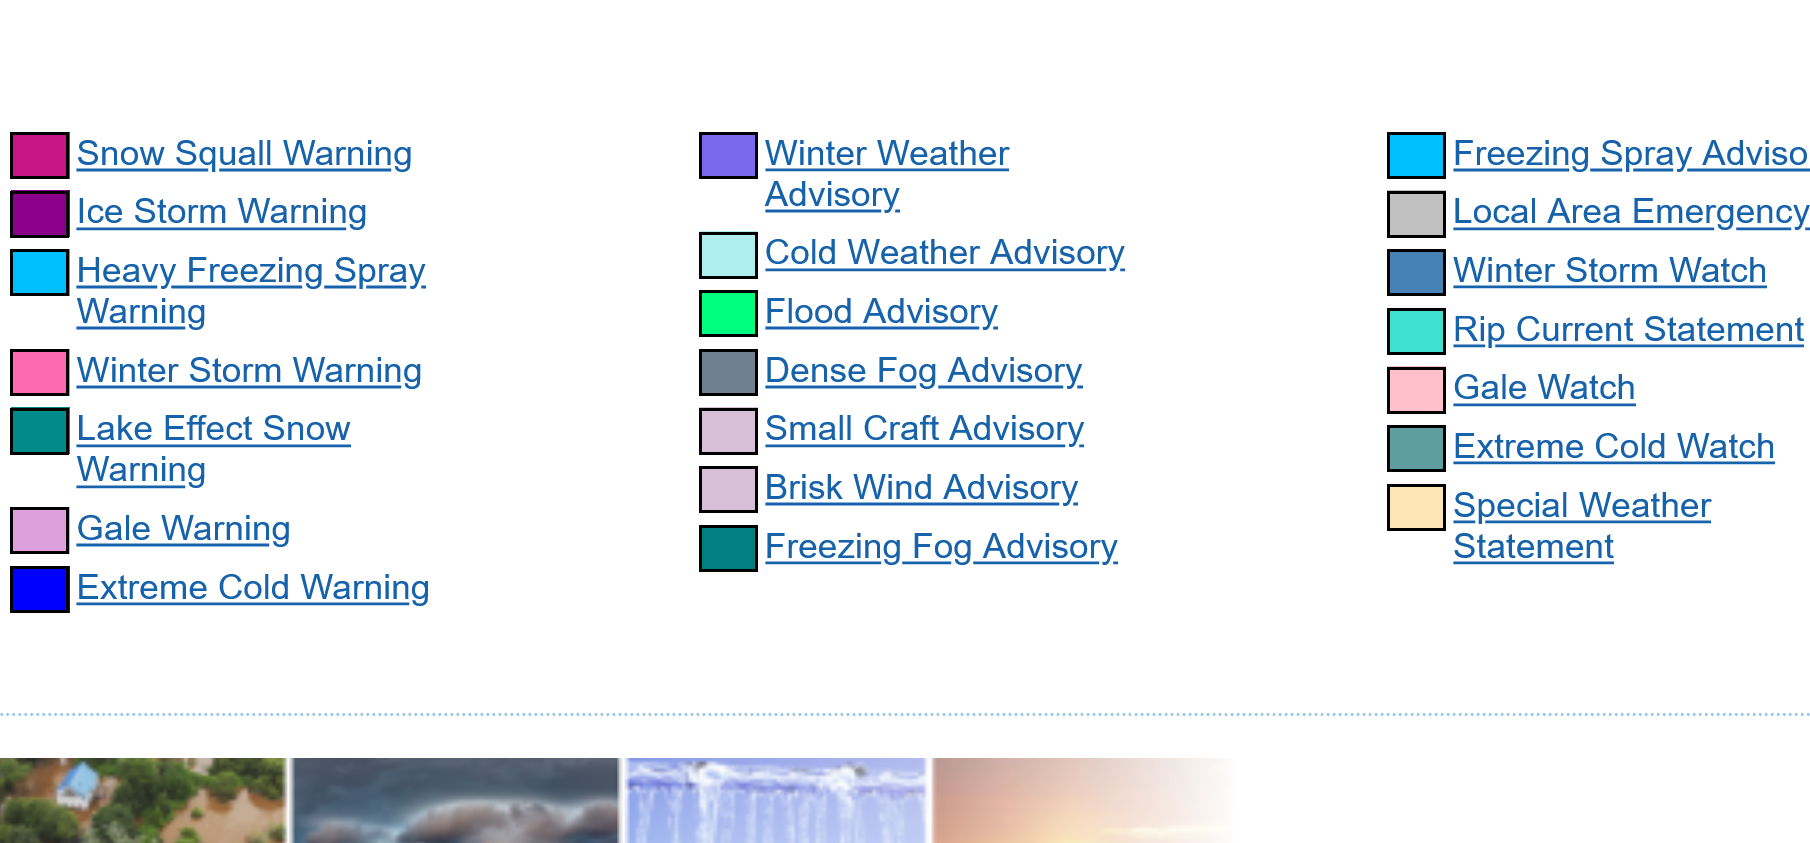
Here's what the colors on the map above stand for:
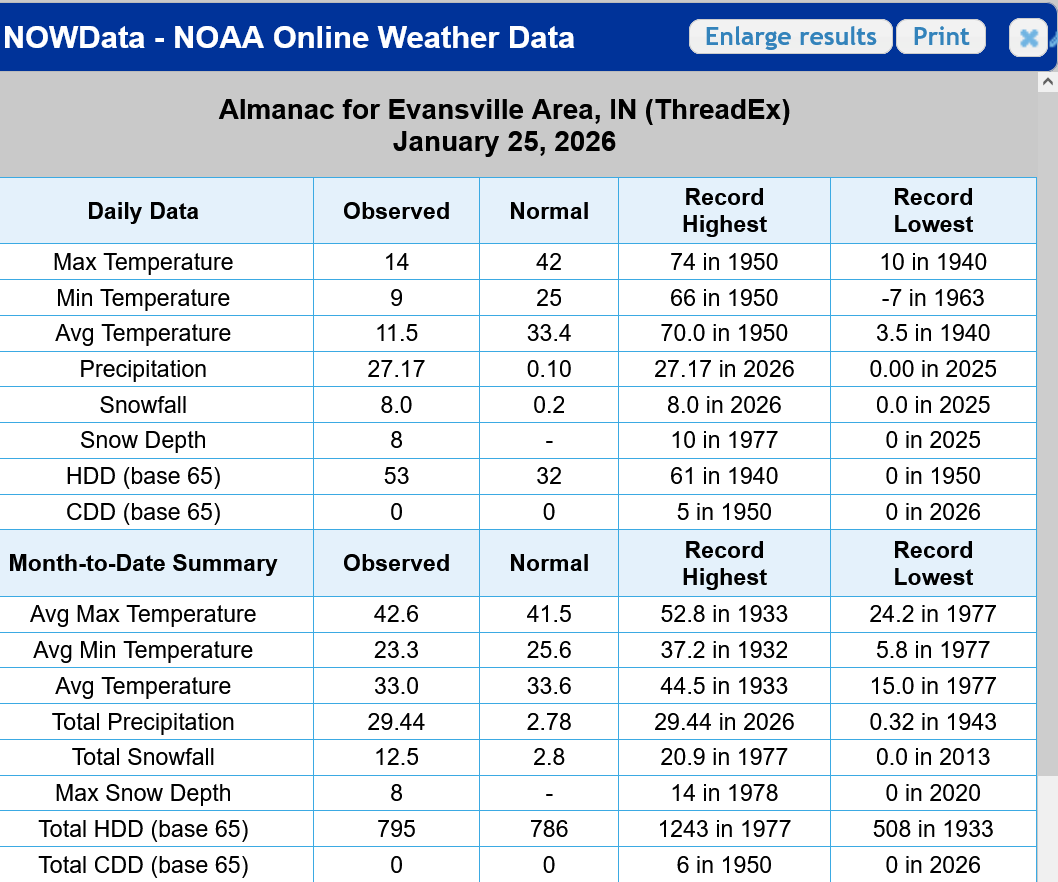
The official snow total from the NWS in Evansville was 12.5 inches.
4.5 inches on Saturday 1-24-26
8.0 inches on Sunday 1-25-26
https://www.weather.gov/wrh/climate?wfo=pah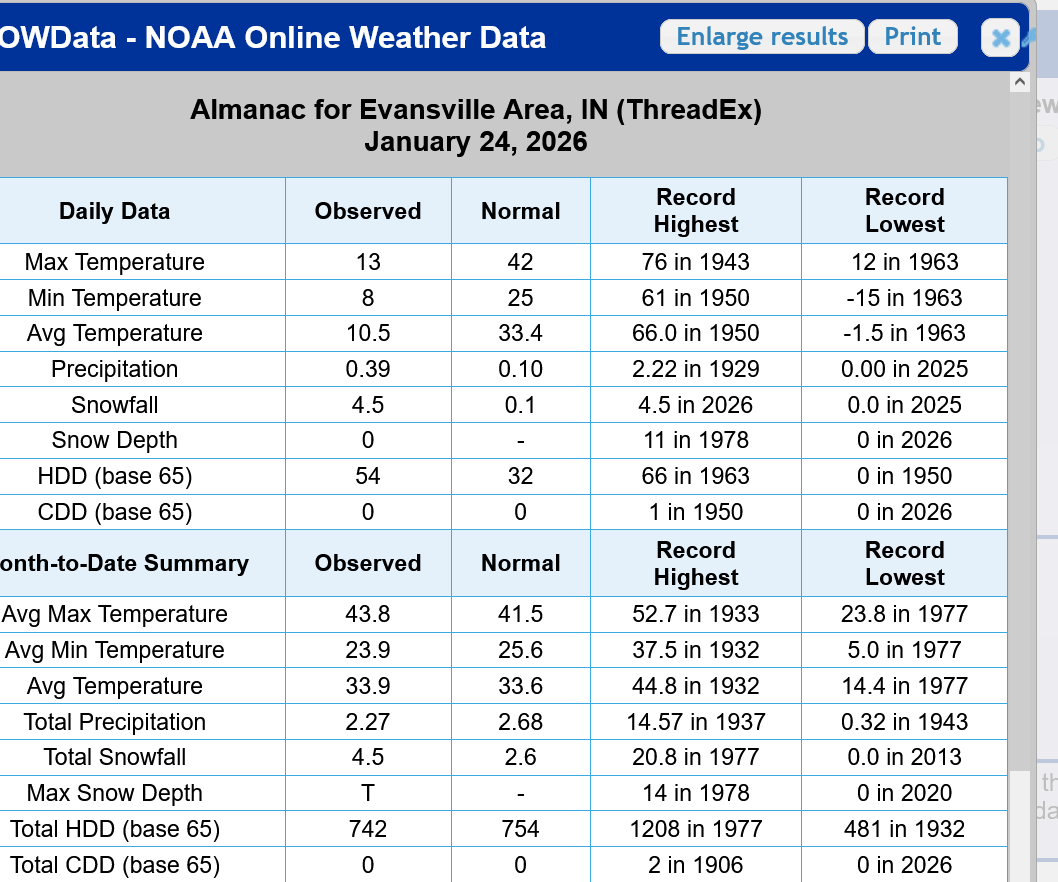
+++++++++++++
We should note above that the record snow depth on the ground in January was 1978 when 14 inches was on the ground.
The record amount of snow in January to this date as in 1977, when 20.9" had fallen.
Most residents of Evansville have heard about the blizzard of January 1978. Grandparents like me, remember is vividly.
However, I was a student at the University of Michigan at the time, living in Ann Arbor, MI, studying Atmospheric and Oceanic Science. Transferred from the University of Detroit where I studied actuarial science.
It was the first time in the schools history for it to close down(that's saying a lot). I was living in an all men's dorm at the time, Fletcher Hall because it had no meal plan but instead had a kitchen with a refrigerator/stove for us to store food and make our own meals. I was a competitive body builder that didn't want to eat the meal plan like most of the students.
During the blizzard of January 1978, everybody was stuck in their rooms so I decided to provide some entertainment.
At the time, streaking was a popular thing. As a competitive body builder and playing 3 sports in high school(where all the guy showered together), I wasn't bashful about being naked.
We had over a foot of snow on the ground. So I stripped down and put on just a pair of snow boots and ran around the outside of the dorm half a dozen times while all the guys had their windows open, cheering loudly as I passed by their window!
48 years ago today!
The blizzard of January 25,26 1978.
Indianapolis, IN
Weather Forecast Office
https://www.weather.gov/ind/blizzardof78
++++++++++++++++++
https://en.wikipedia.org/wiki/Great_Blizzard_of_1978
On January 26, the third-lowest atmospheric pressure recorded in the mainland United States, apart from a tropical system, occurred as the storm passed over Mount Clemens, Michigan. There, barometer readings fell to 956.0 mb (28.23 inHg).[3] In Detroit, air pressure fell to 28.34 inches of mercury (960 mbar). At around the same time, the absolute low pressure was measured at Sarnia, in Southwestern Ontario, Canada, where barometer readings decreased to 955.5 mb (28.22 inHg).[3] Toronto pressure fell to 28.40 inches, breaking its record by 0.17.
The 956.0 mb (28.23 inHg) barometric pressure measurement recorded in Mount Clemens, Michigan, was the third-lowest non-tropical atmospheric pressure recorded in the mainland United States[7] and the lowest in the Central United States.[3] The lowest confirmed pressure for a non-tropical system in the continental United States had been set by a January 1913 Atlantic coast storm.[3] The lowest central pressure for the 1978 blizzard was 955.5 mb (28.22 inHg) measured in Sarnia, Ontario.[3] On rare occasions, extra-tropical cyclones with central pressures below 28 inches of mercury or about 95 kPa (950 mb) have been recorded in Wiscasset, Maine (27.9") and Newfoundland (27.76").[8] In addition, the blizzard is the highest-ranking winter storm on the Regional Snowfall Index, with a maximum value of 39.07, and one of only 26 storms to reach Category 5 on the scale.[9]
An important factor for the next week will be the daytime melting in sun exposed areas, that causes runoff on drives/walkways that refreezes quickly in the early evenings, leaving extremely slick ice in areas where people walk.
Be prepared to re-treat those areas every evening as the runoff from the melting the next day is likely to wash off(or dilute) the chemicals you put down the day before.
This will continue to be especially prevalent where shoveled snow was piled up at the edge of the driveway or walkway.
I just watched Stacie May on WEHT. She had a graphic that lists this 1 storm, making it the 5th snowiest January in Evansville history. That is INCORRECT!!
She only took statistics from the last 75 years and called that "in Evansville history"
Also, the Evansville Courier did a similar thing with this but at least they were honest/smart enough to tell readers these were records that only dated back to 1948:
Here's how the Evansville winter storm compares throughout history
The NWS has collected snowfall data in the Tri-State since 1948. Here's how the latest storm stacks up.
++++++++++++++++++++
I happen to know the actual record snowiest Winter and snowiest January in history FROM MEMORY. It was the Winter of 1917/18 and January 1918 that blew away every other Winter.
I find it horribly incompetent for these sources, serving as our main weather data gatekeepers and messengers to be so oblivious to these facts.
Unfortunately, although I recognized the NWS in Paducah for doing such a wonderful job overall and with this snowstorm, they are part of it. Stacie just copied them.
Previous posts/threads below:
+++++++++++++++
Re: 2025 weather year in review
By metmike - Dec. 26, 2025, 7:17 p.m.
++++++++++++++++++++
They completely missed the snowiest Winter by far.
Record Winter of 1917/18!
Started by metmike - Dec. 8, 2025, 7:21 p.m.
https://www.marketforum.com/forum/topic/116459/
During the December 1917 - January 1918 winter, Evansville experienced its snowiest period ever recorded, with over
66 to 70 inches of snow falling, including a staggering 41-42 inches in January 1918 alone.
However, I feel like they failed to compile snowfall records BEFORE 1950 on the chart above.