Thanks, Larry!
Happy Groundhog Day!
Previous link:
NG 1/18/26
67 responses |
Started by metmike - Jan. 18, 2026, 4:47 p.m.
https://www.marketforum.com/forum/topic/117293/
+++++++++++++++
I'm adding the last several posts and link.
Re: Re: Re: NG 1/18/26
By metmike - Jan. 30, 2026, 5:26 p.m.
Weeks 3 and 4. More cold:
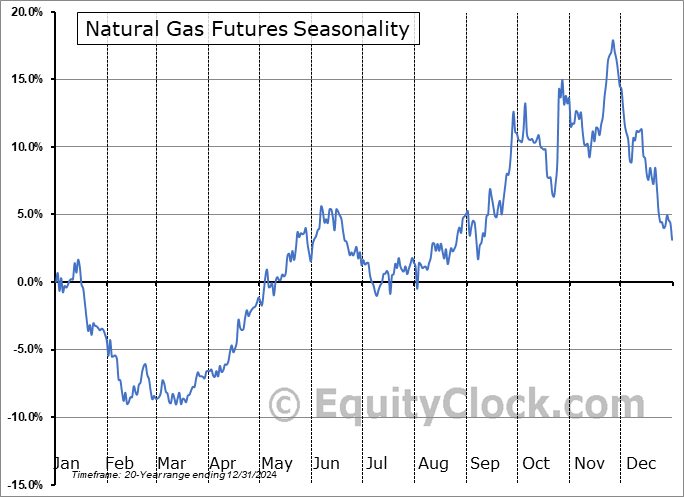
Seasonally, we've past the climatological mid point of Winter and coldest time of year ON AVERAGE. February looks to continue cold compared to average but probably not as cold as what we just experienced.
https://www.cpc.ncep.noaa.gov/products/predictions/WK34/

+++++++++++++++++
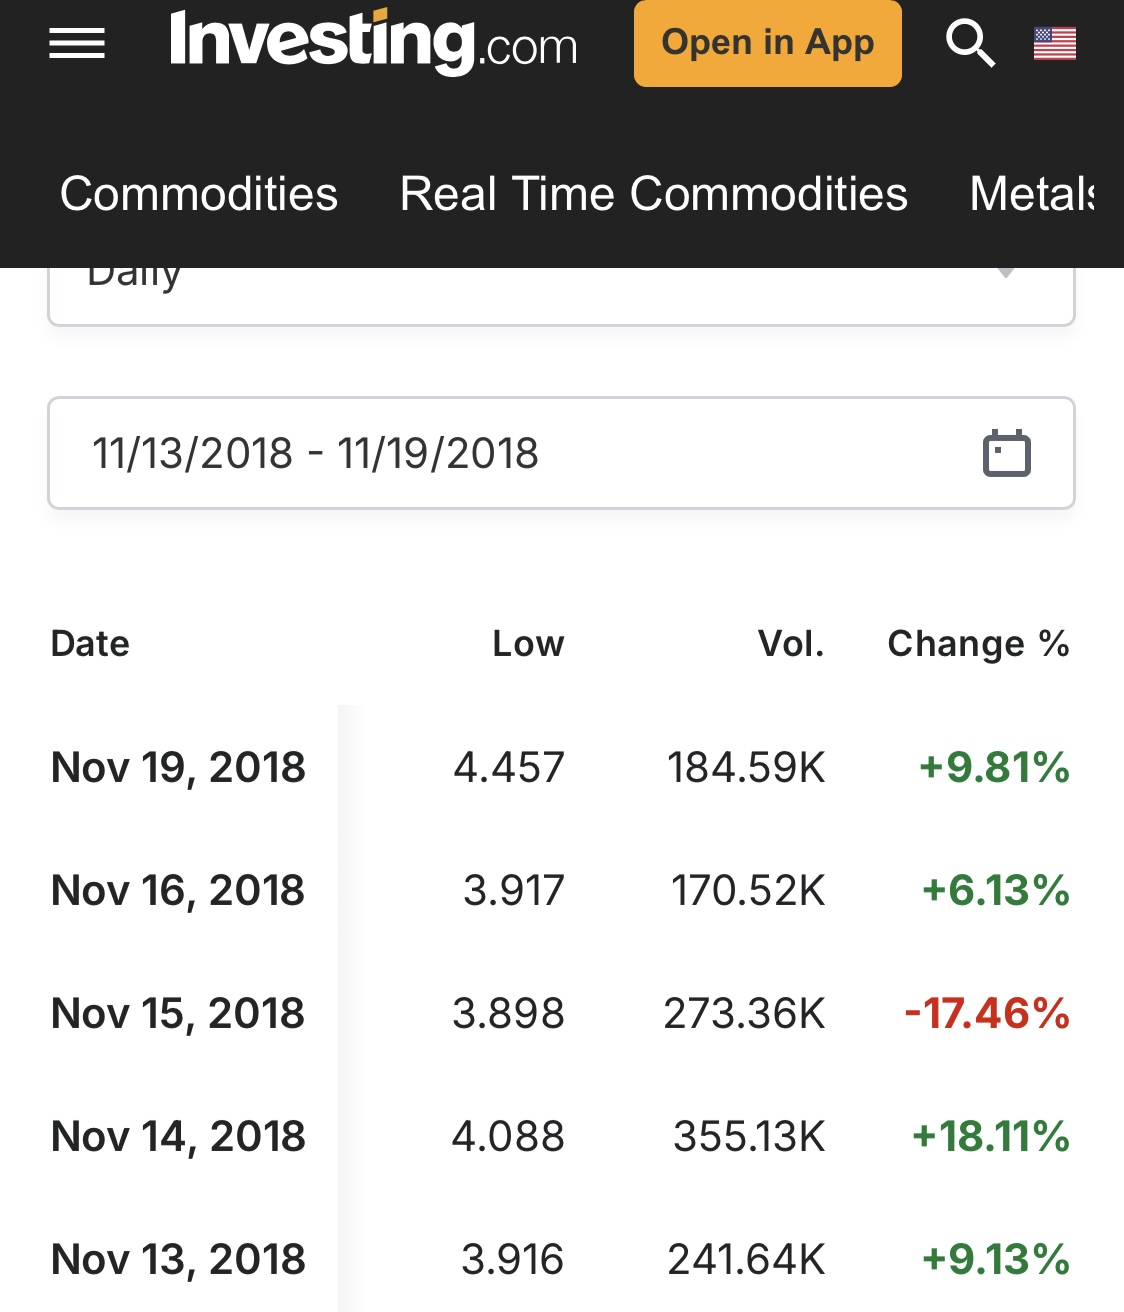
These were the 7 day temperatures for next Thursday's EIA report.
The coldest color bar on the anomaly map(2nd one) is -16 even though this extreme cold had -18 and -20 deg. F isotherms that were colder than the coldest color bar.
Since this was also just past our coldest time of year and the cold impact some high population density regions, the EIA drawdown number next week will be massive.
https://www.cpc.ncep.noaa.gov/products/tanal/temp_analyses.php

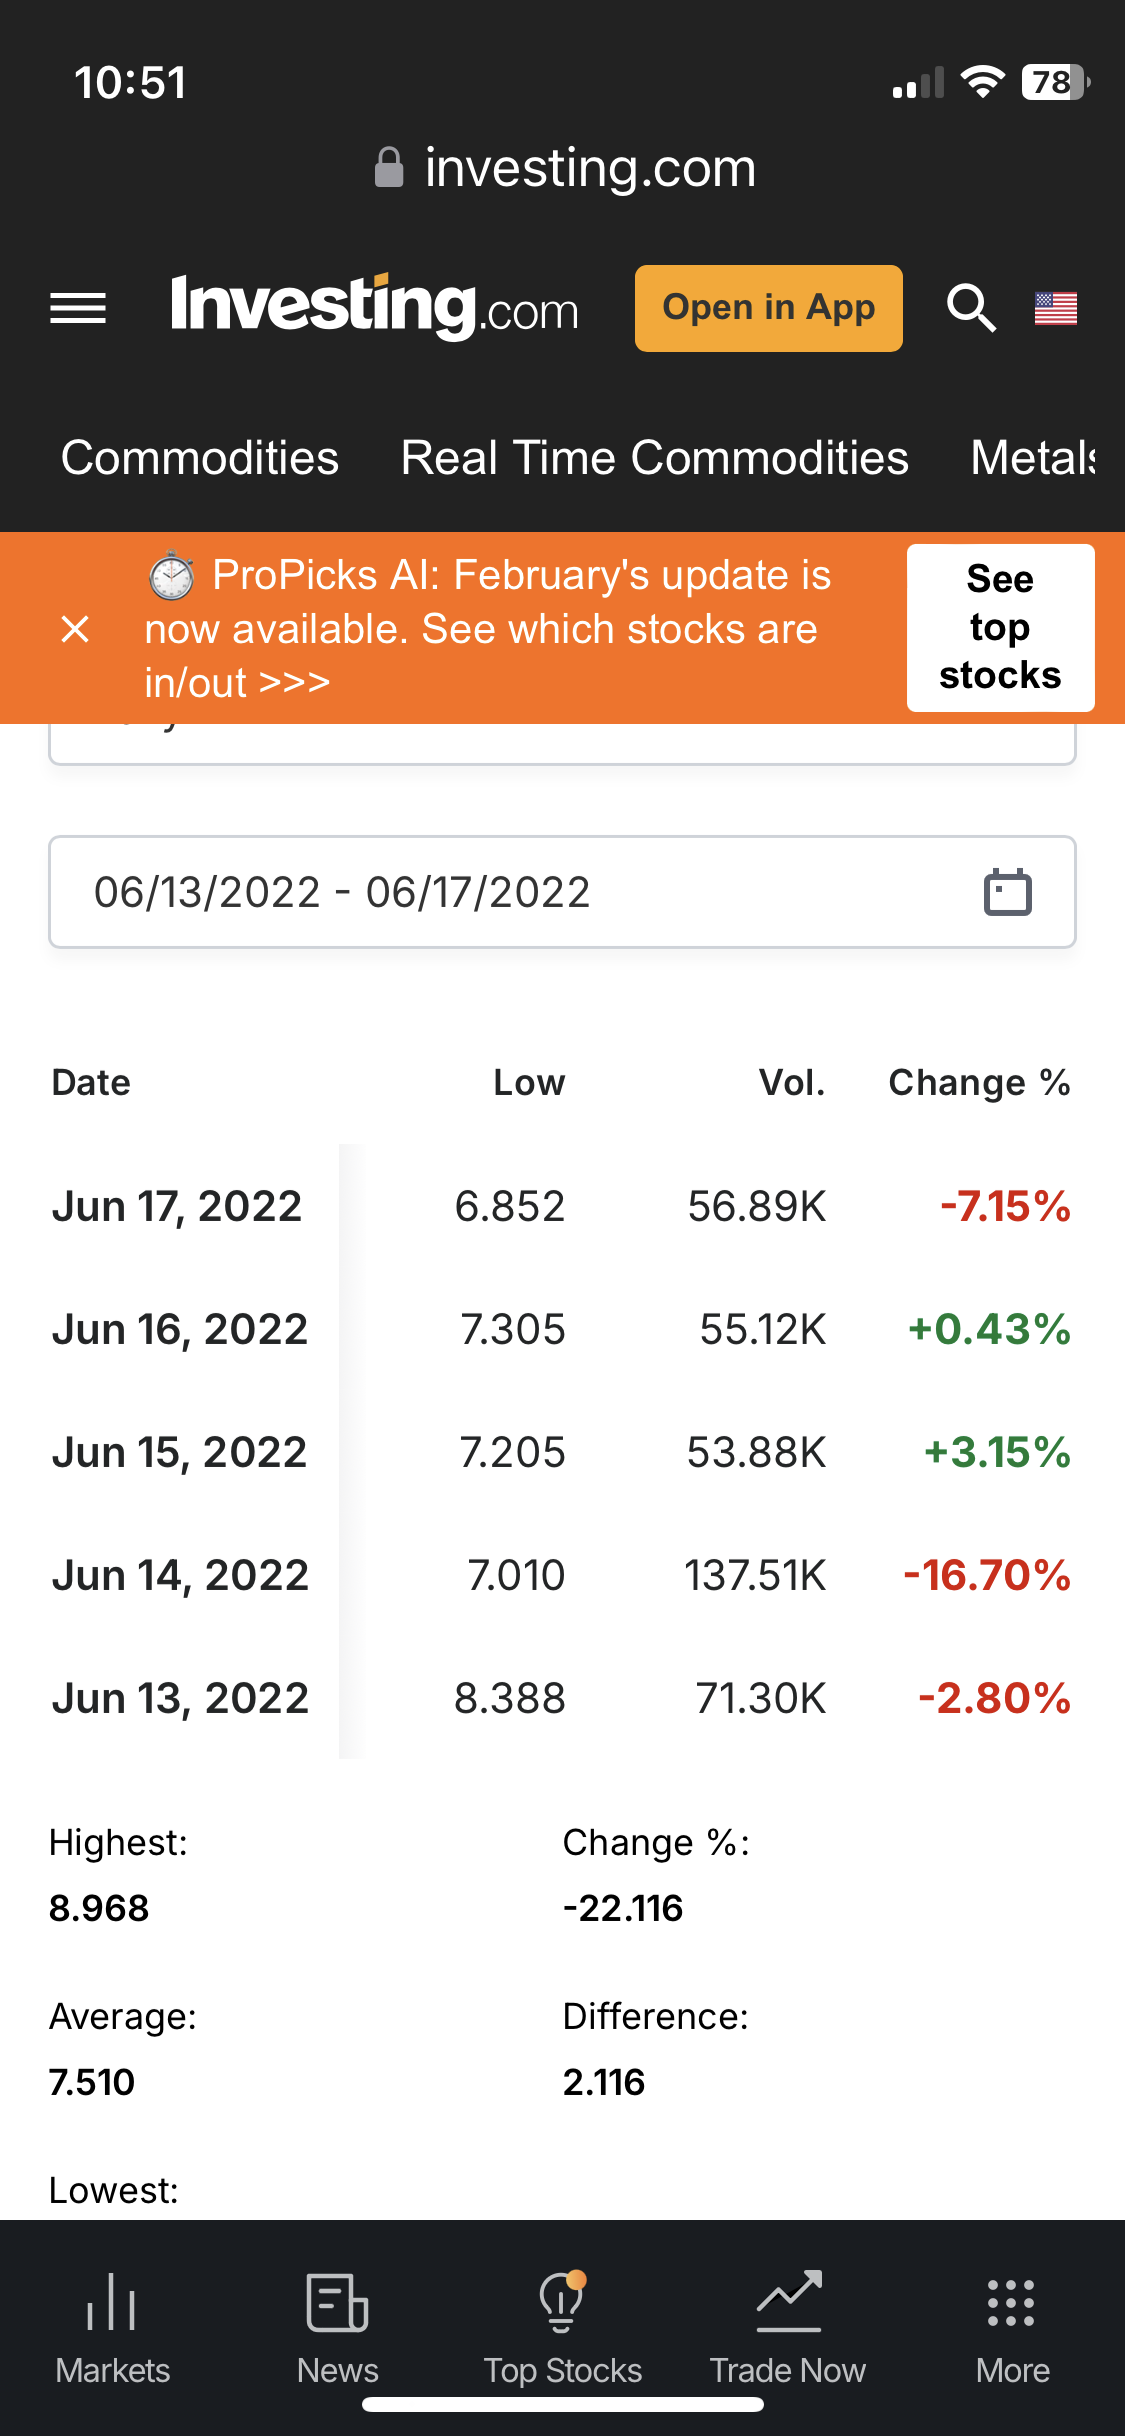
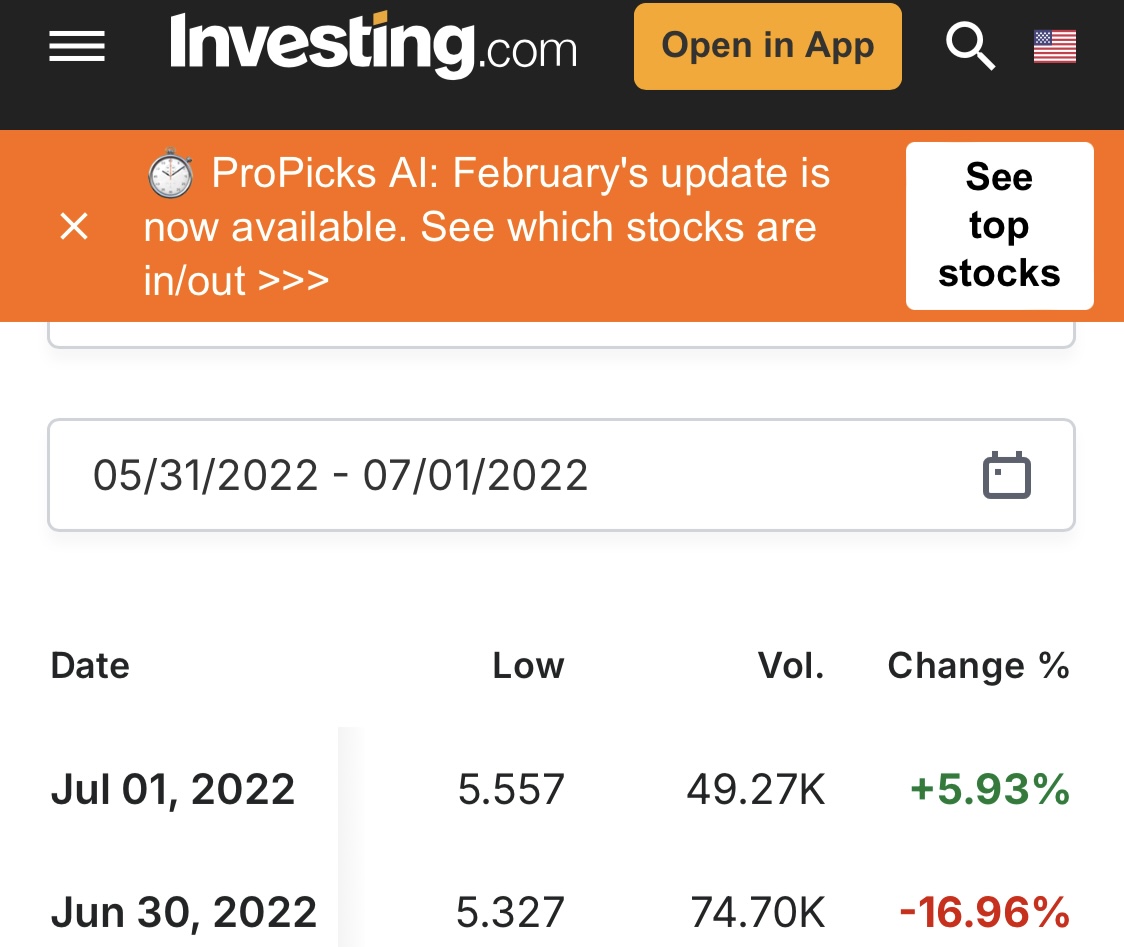
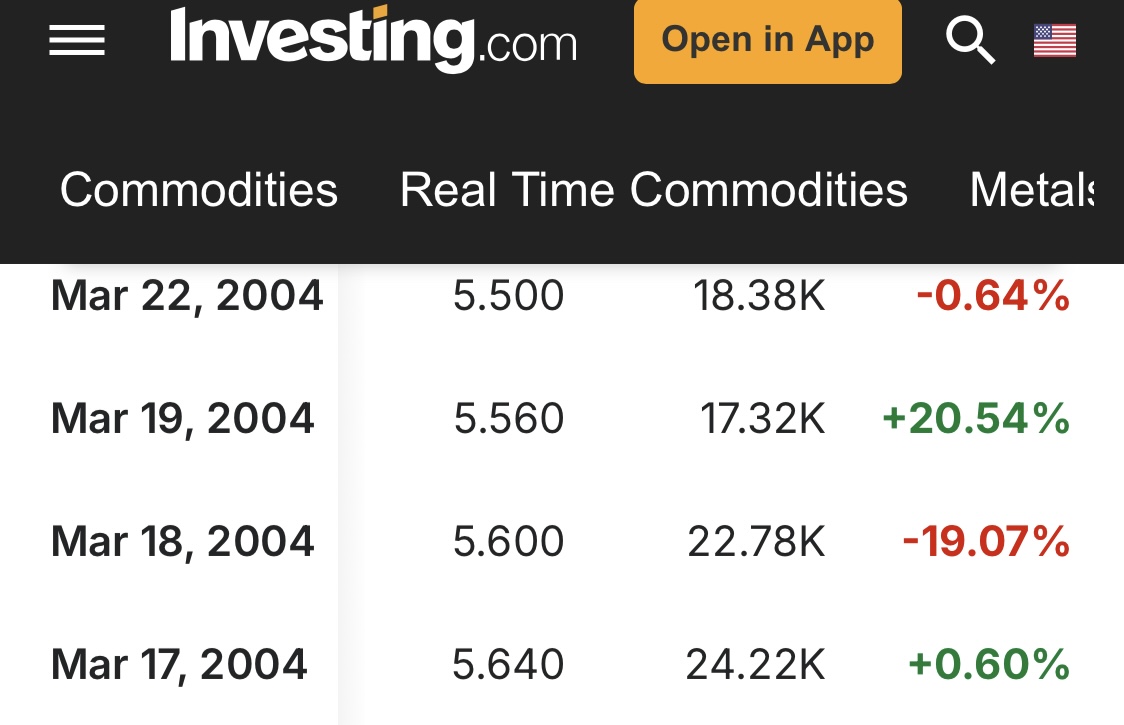
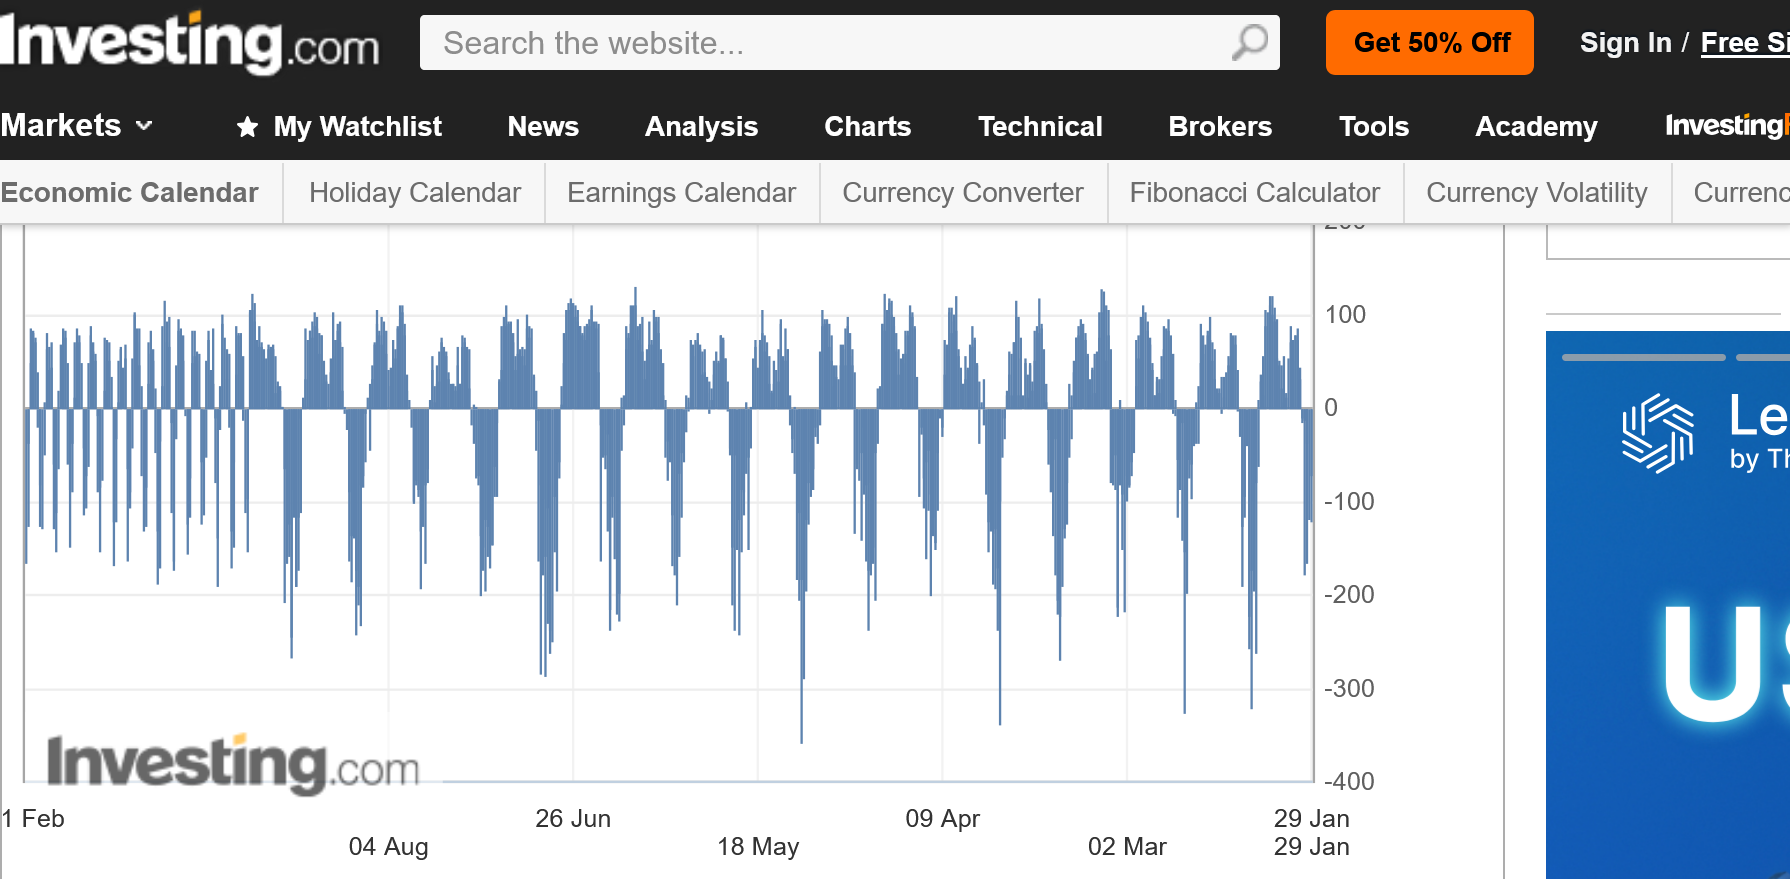
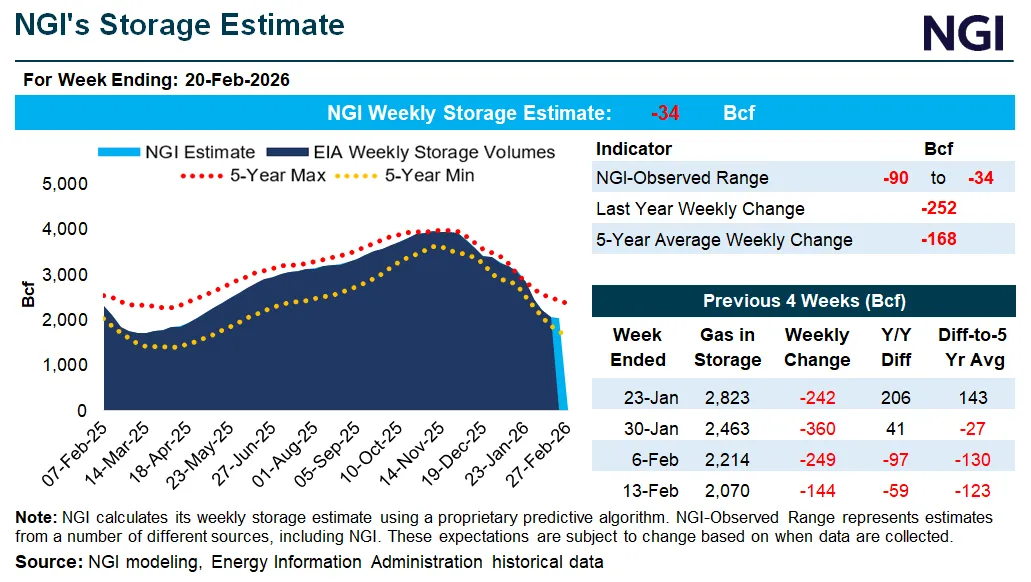
Compare that to temperatures from yesterday's report (below) that featured a -242 Bcf draw down.
Will the EIA next Thursday be more than -300 Bcf? What do you think Larry? How many have been that big before?

++++++++++++++++++
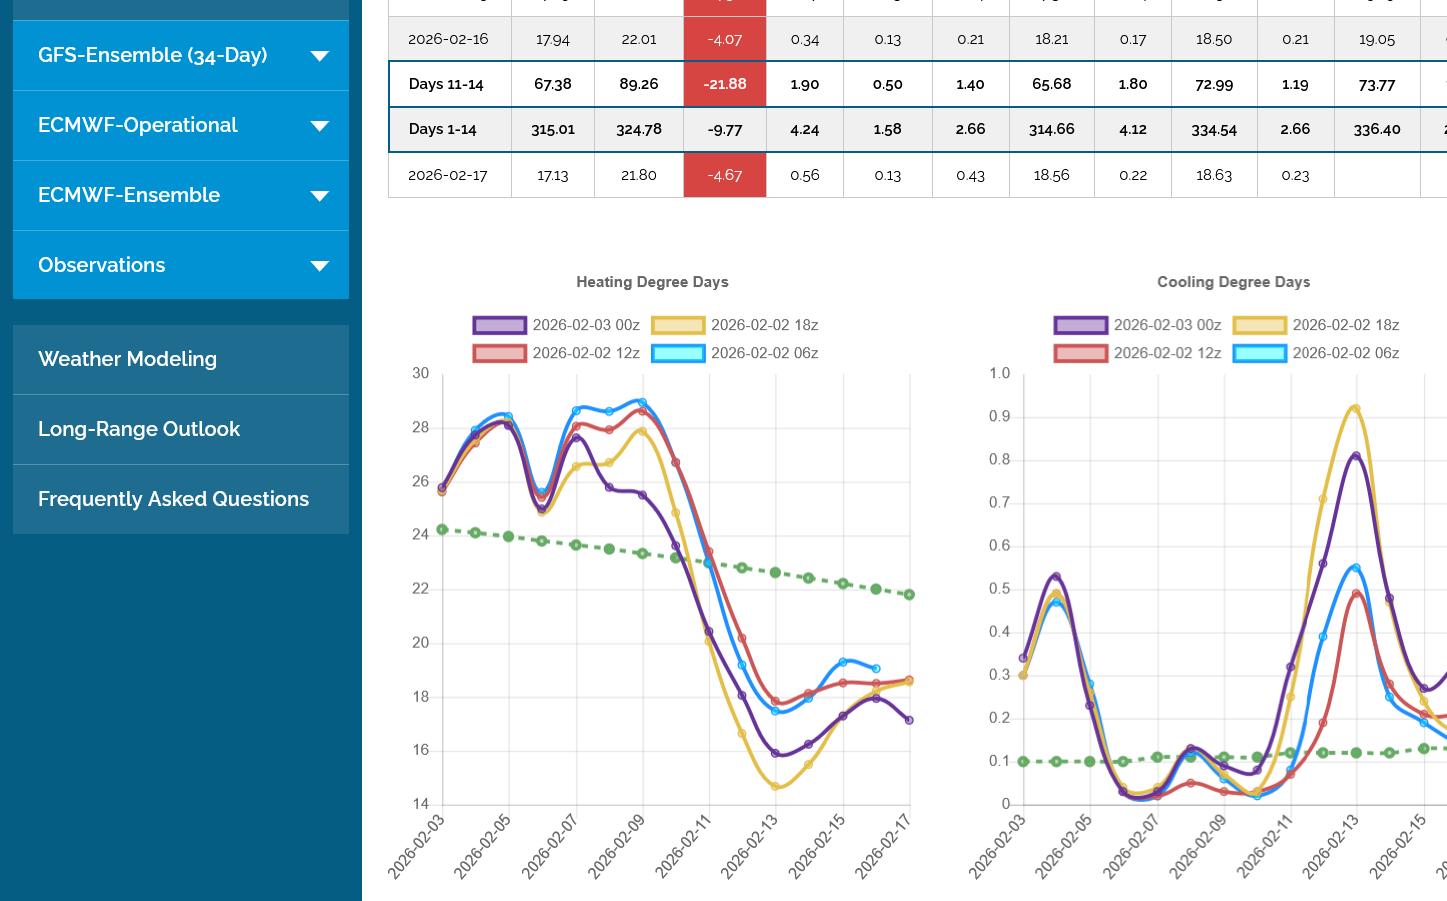
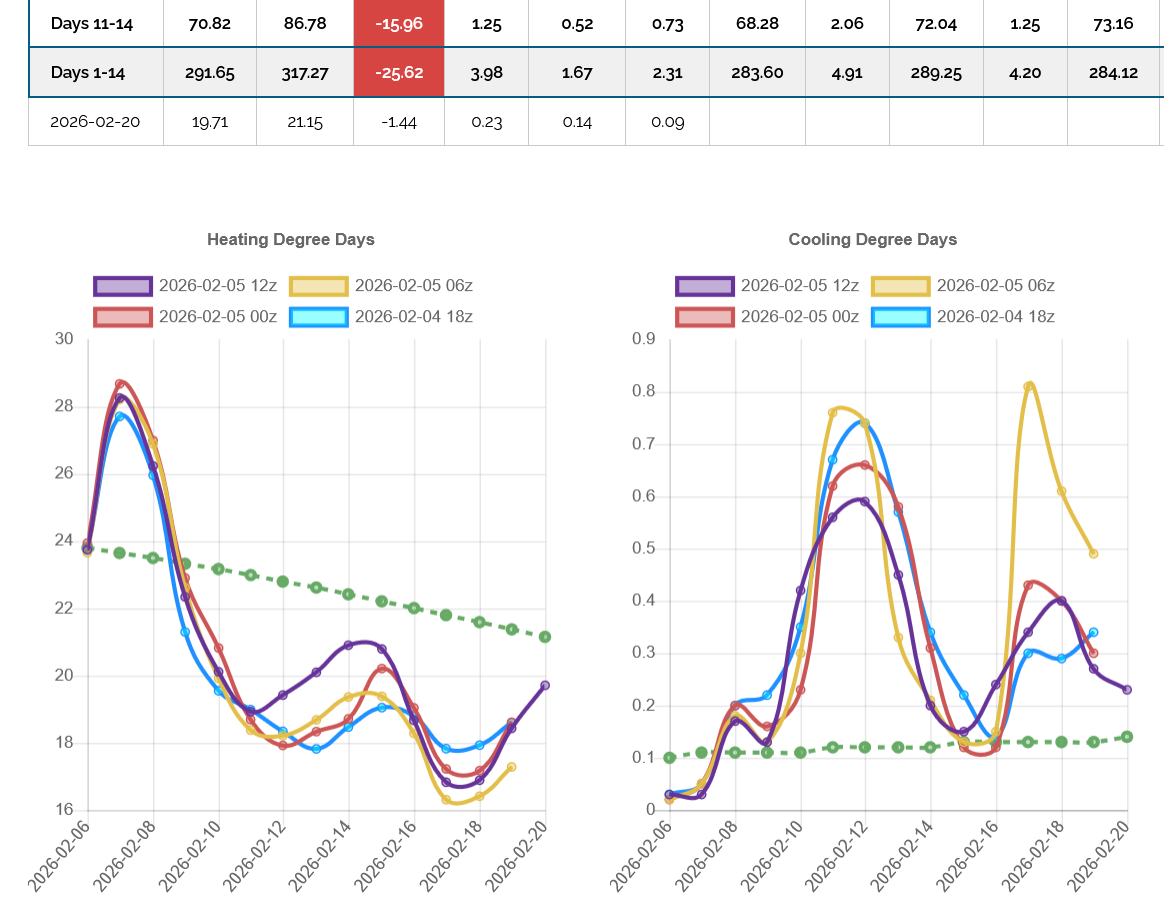
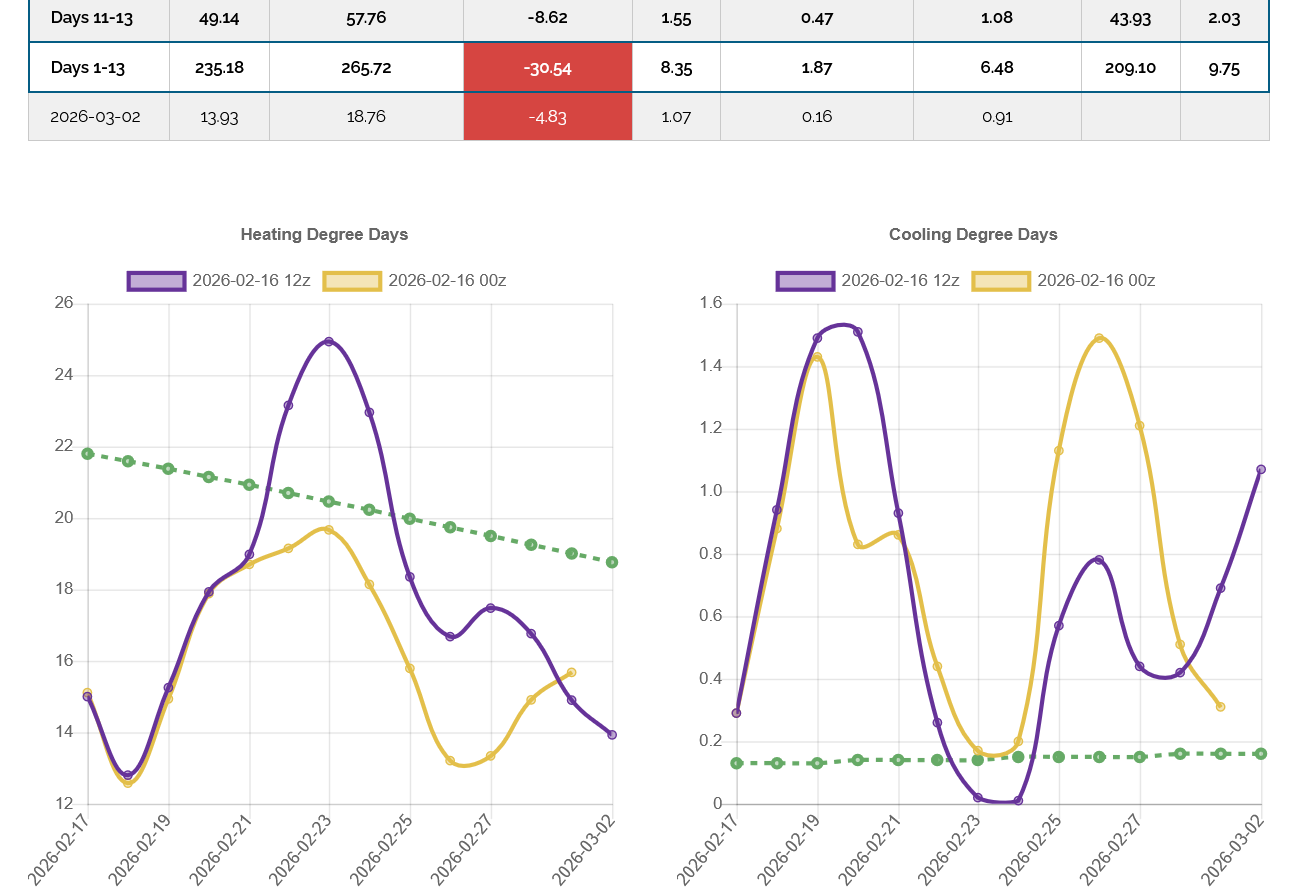
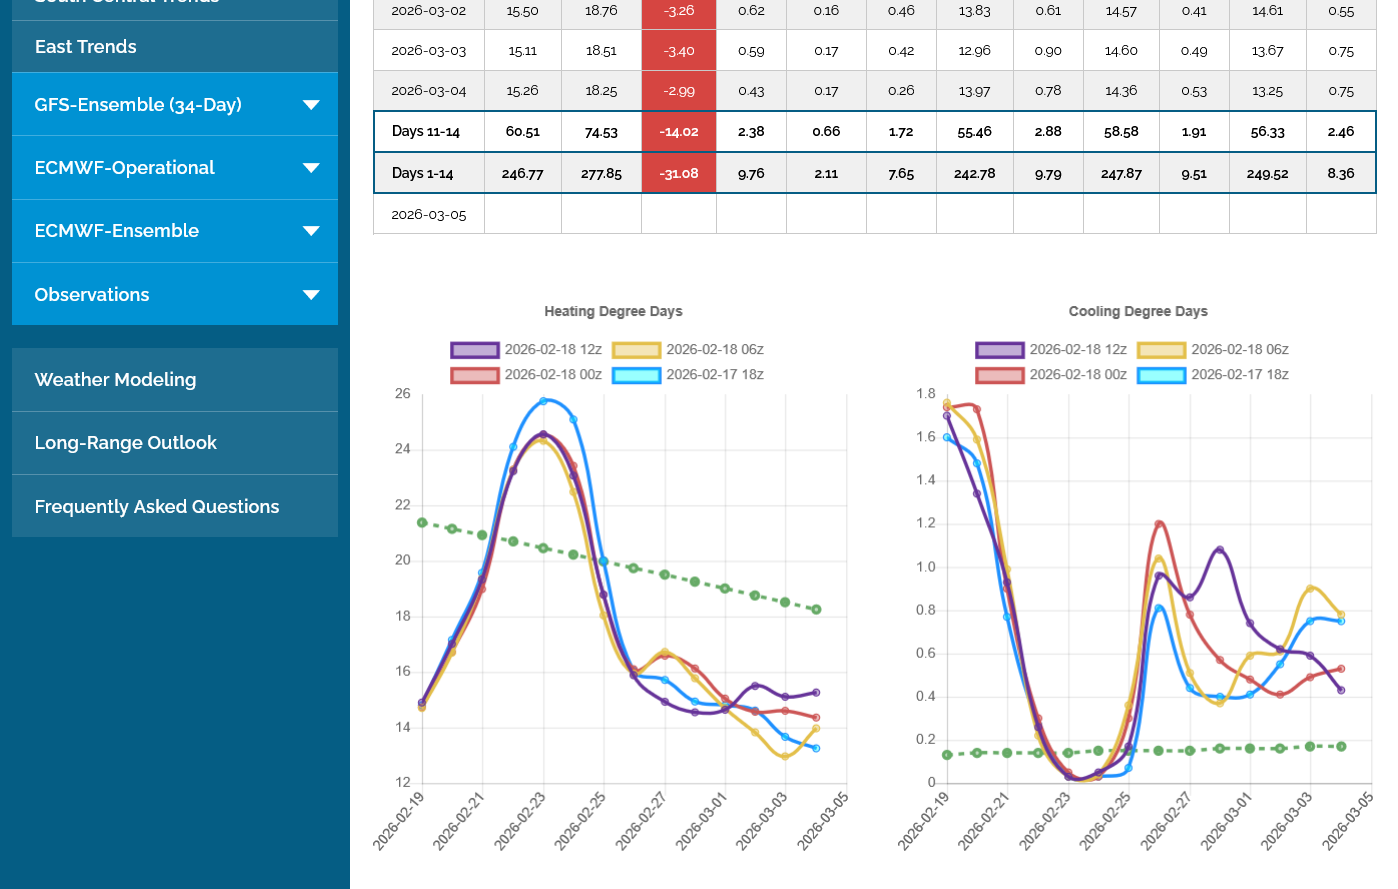
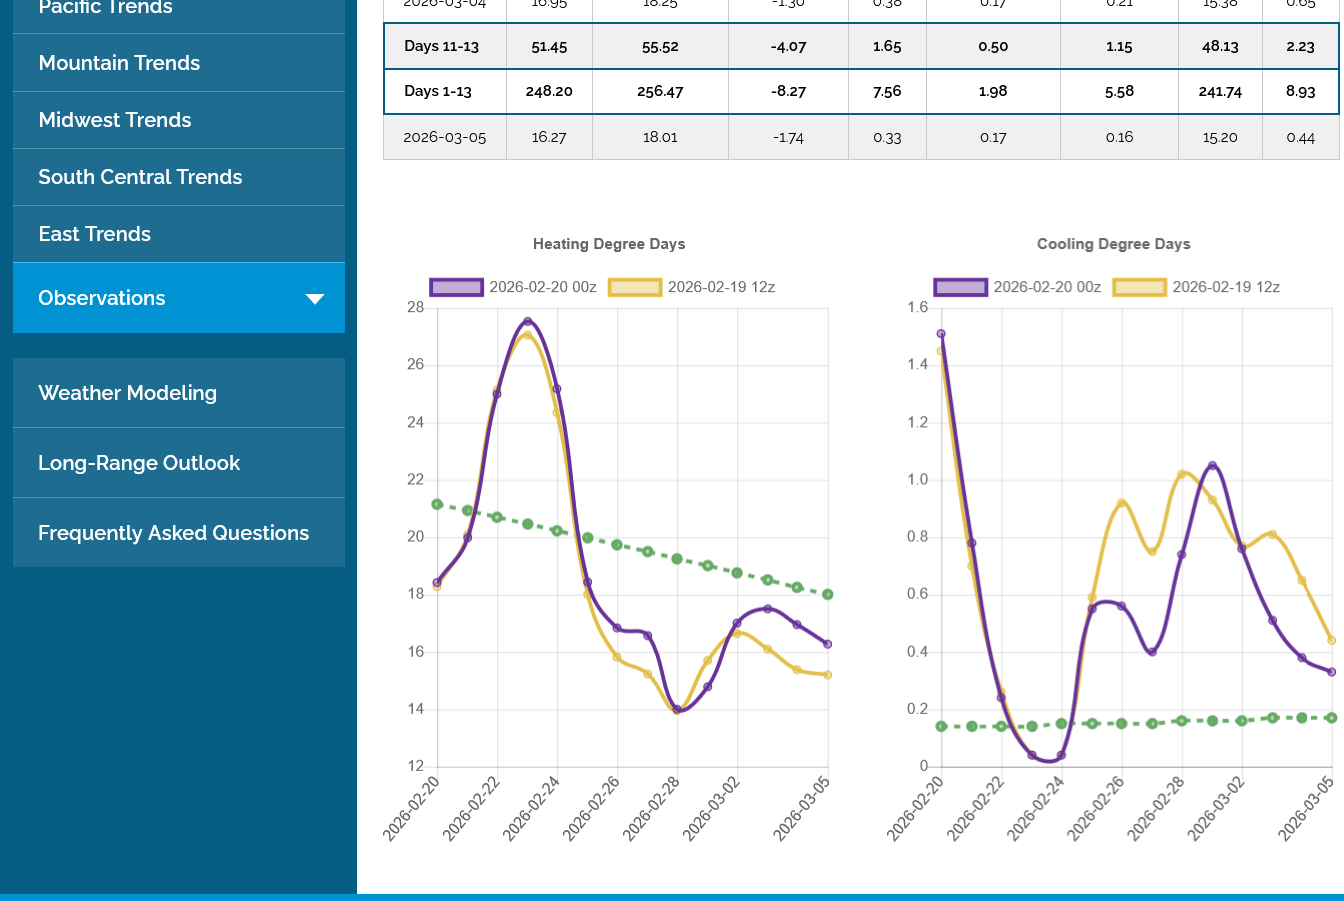
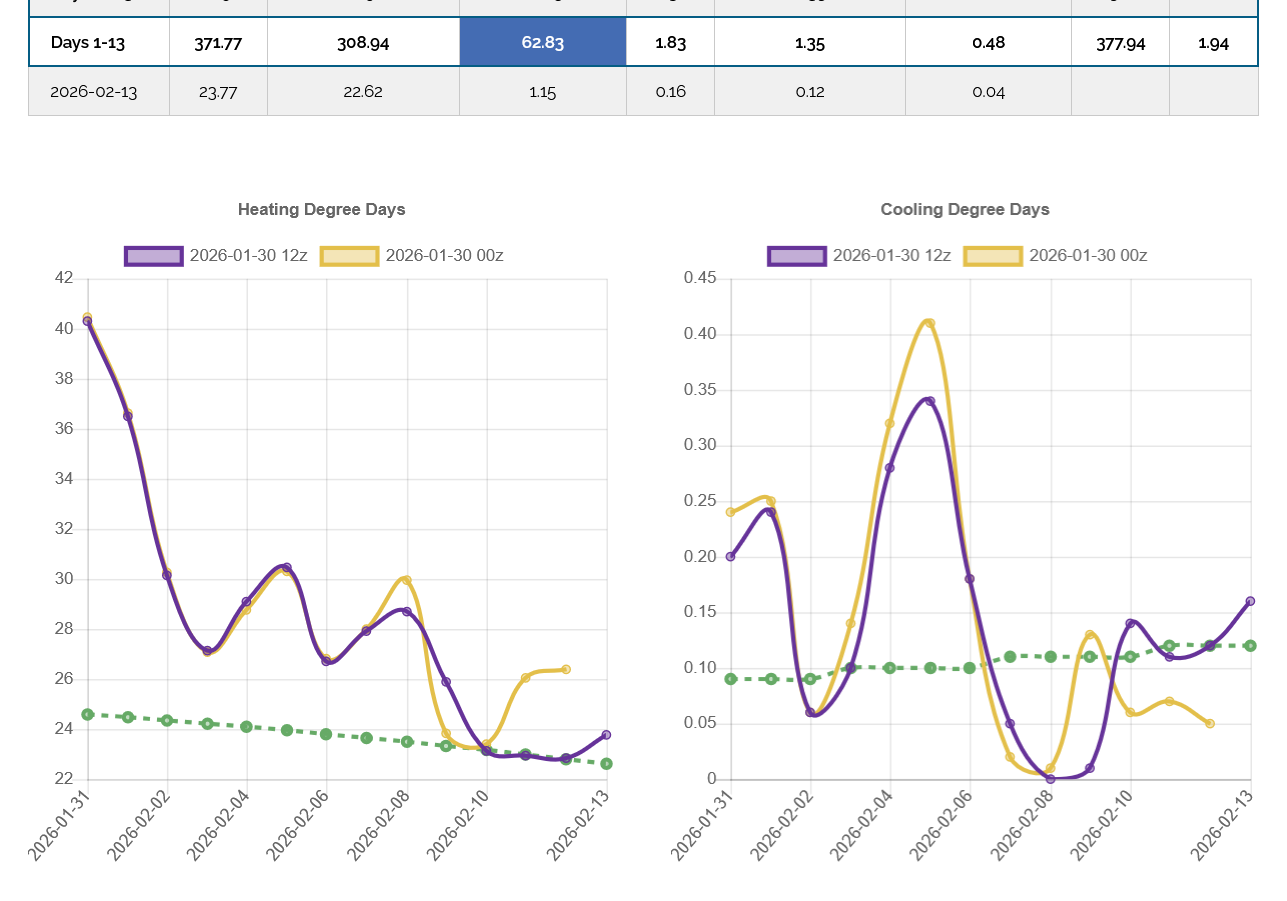
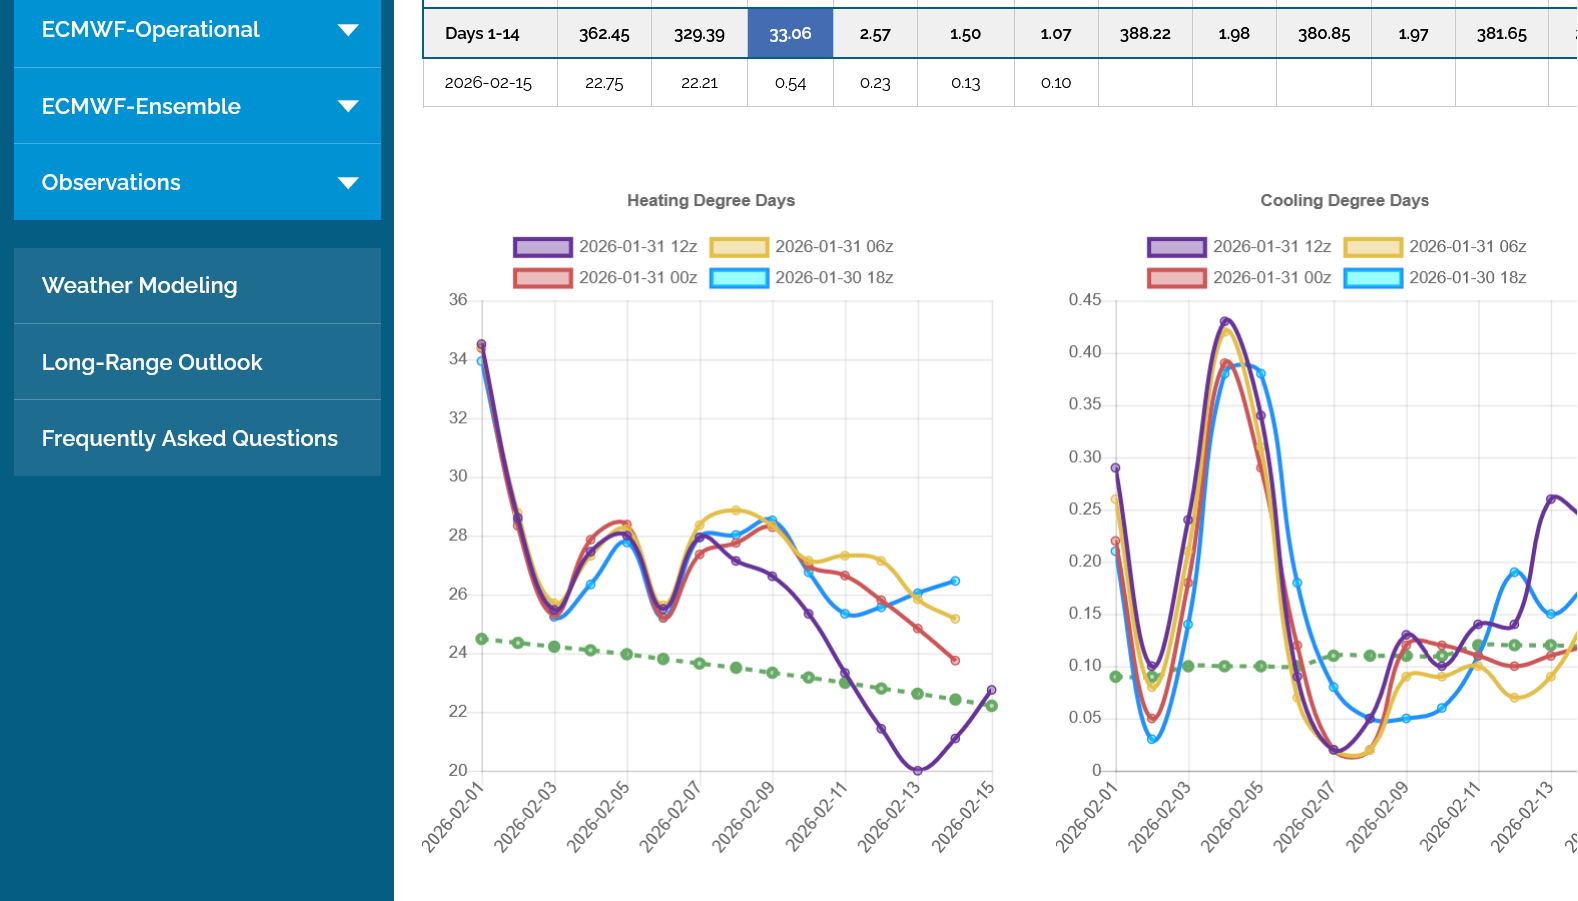
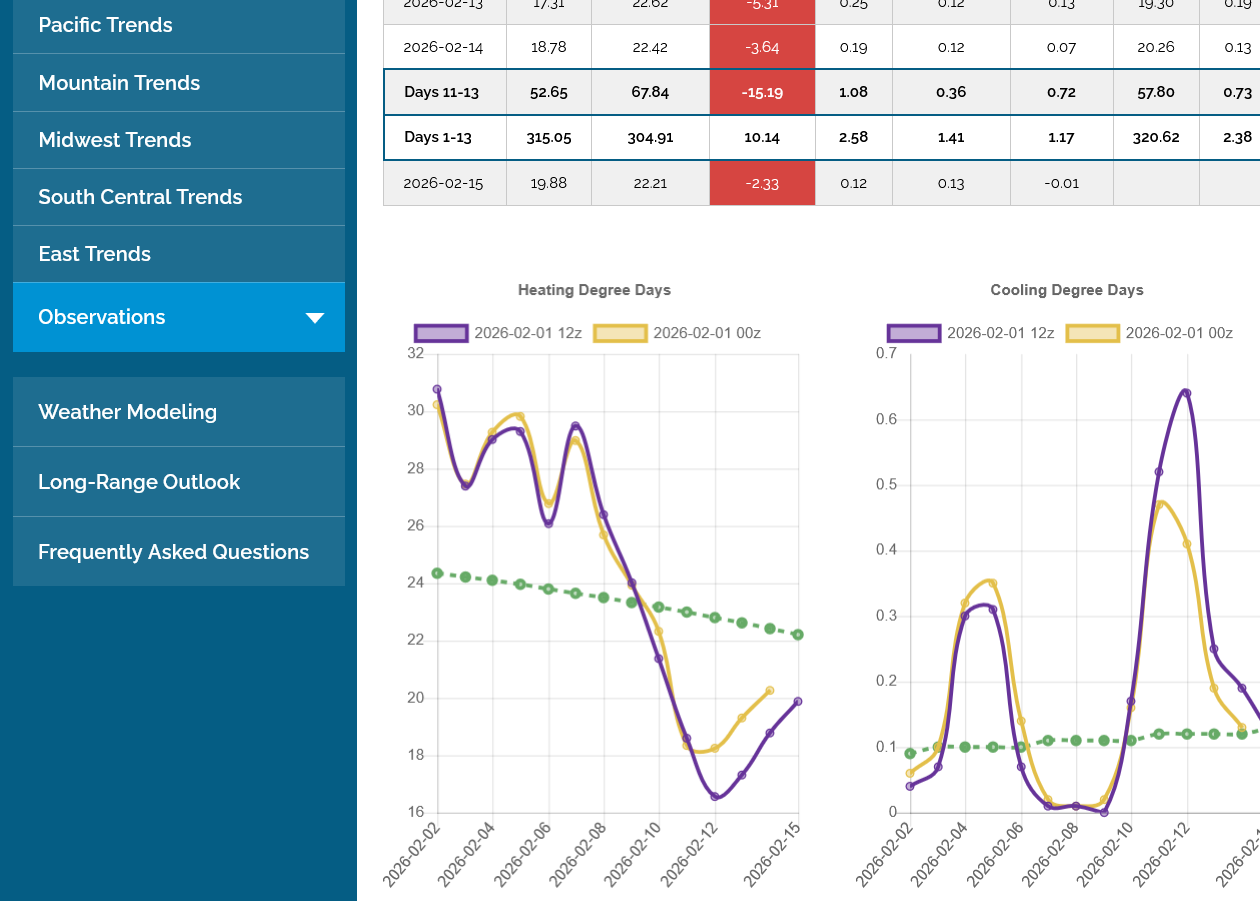
The 12z European Ensemble model (purple/left) had -6 HDDs compared to the previous 0z run, which caused a small drop but NG was on a tear higher today because of the cold February forecast and the fact that March is priced pretty low vs the February that just expired/went off the board.
Next weeks EIA storage number will be a massive draw down.
By metmike - Jan. 31, 2026, 4:12 p.m.
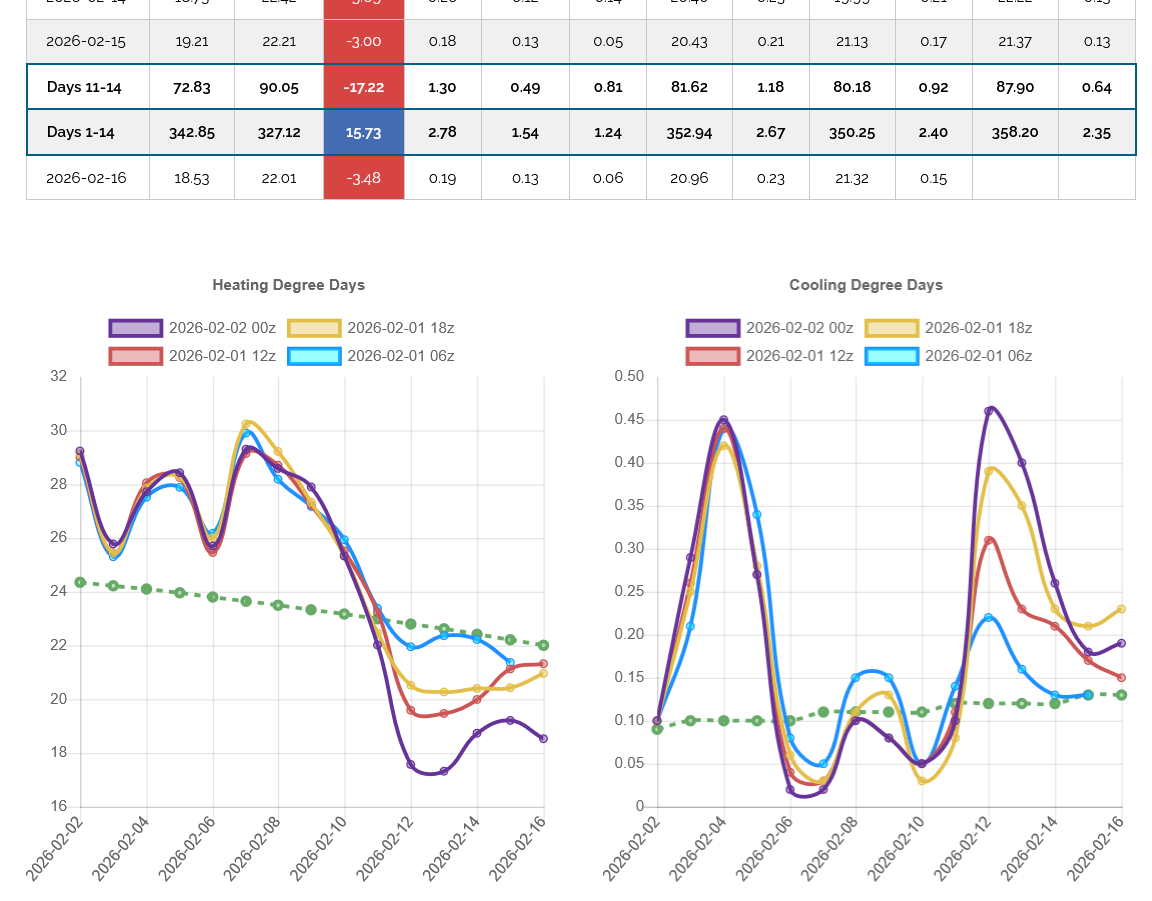
Holy Cow! This last 12z GEFS (purple/left) was incredibly milder in week 2.
The European Ensemble was also milder but not by this magnitude. The NG price was +$5,000/contract and closed on the highs on Friday suggesting a gap higher open on Sunday Night but this change in the weather suggests a MUCH LOWER open..........if it holds.
+++++++++++++++++++
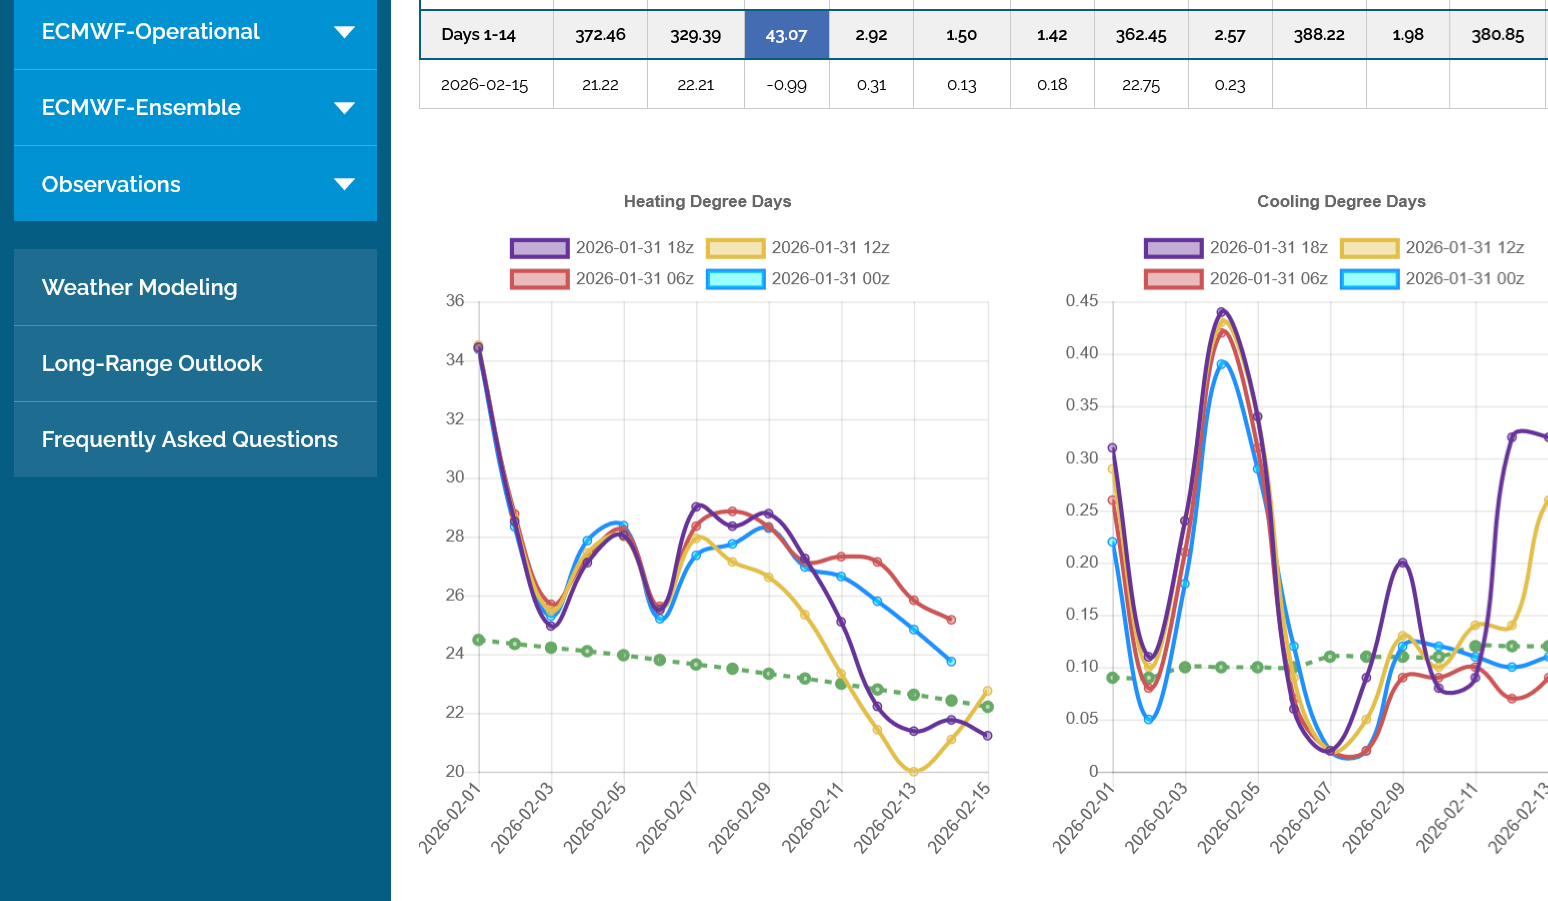
8pm: The last 18z model in purple below, took back some of the warm up(12z run now in yellow/left) but is still MILDER than all the previous runs before that:
+++++++++++++++=
NG 1/18/26
By metmike - Feb. 1, 2026, 5:16 p.m.
SHARPLY lower open!
4:55pm: HUGELY lower open!
++++++++++++++++
Re: NG 1/18/26
By metmike - Feb. 1, 2026, 6:12 p.m.
Even though we were +$5,000/contract higher on Friday, our gap today was a DOWNSIDE gap lower!!!
$6,000/contract lower on the open. The time to short was Saturday, when the models turned much milder............but the markets were closed.
I missed the open because it opened way lower than my selling price. In this sort of market, selling on Friday was too risky.
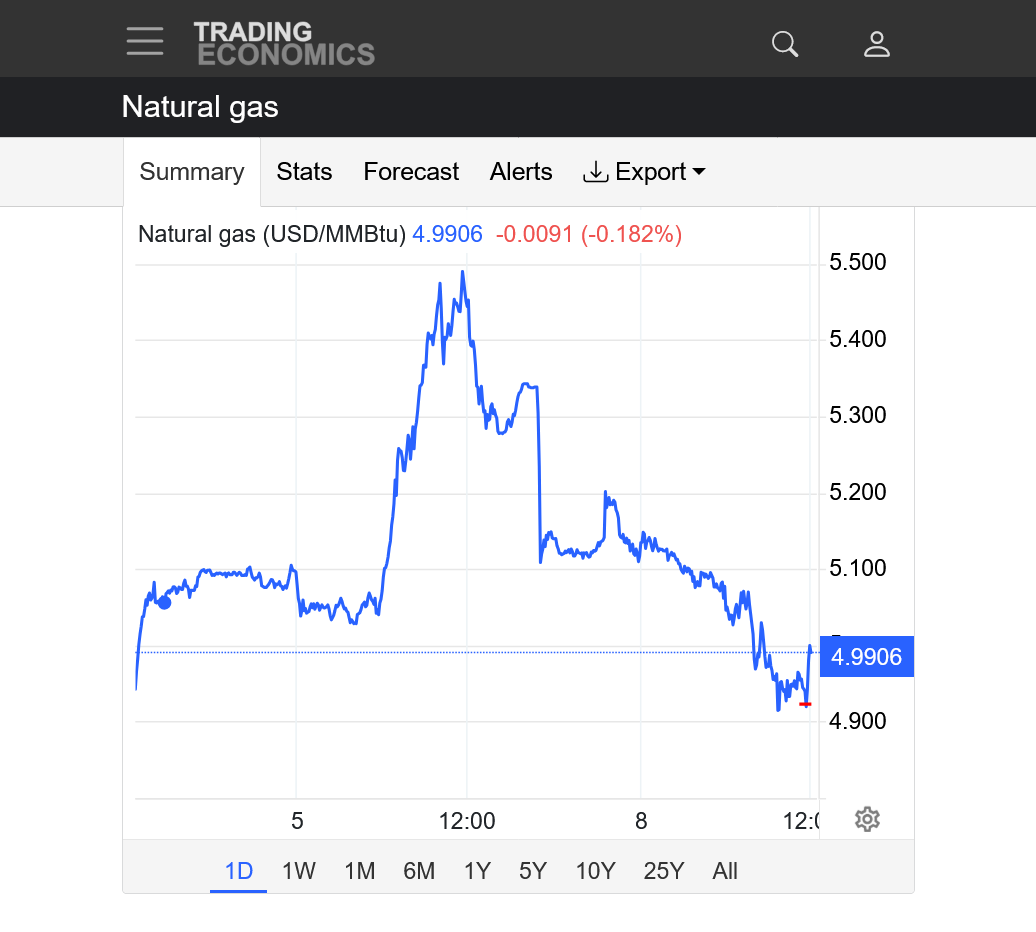
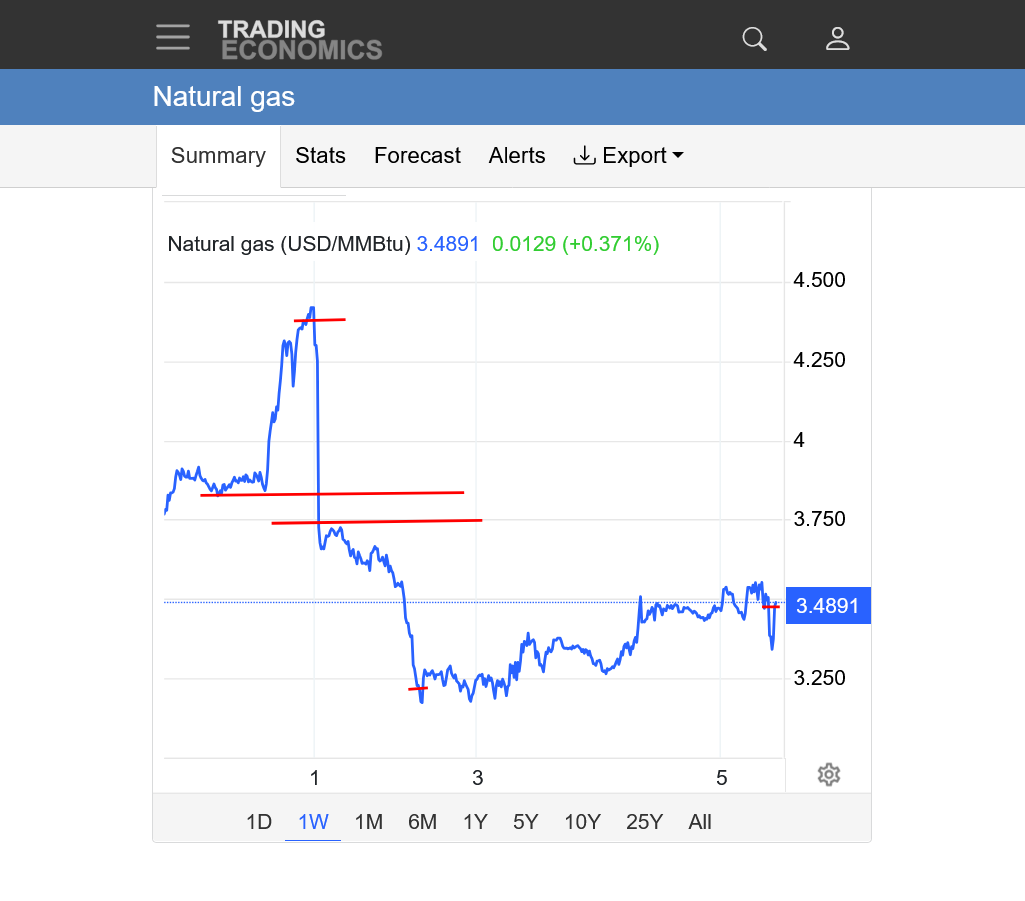
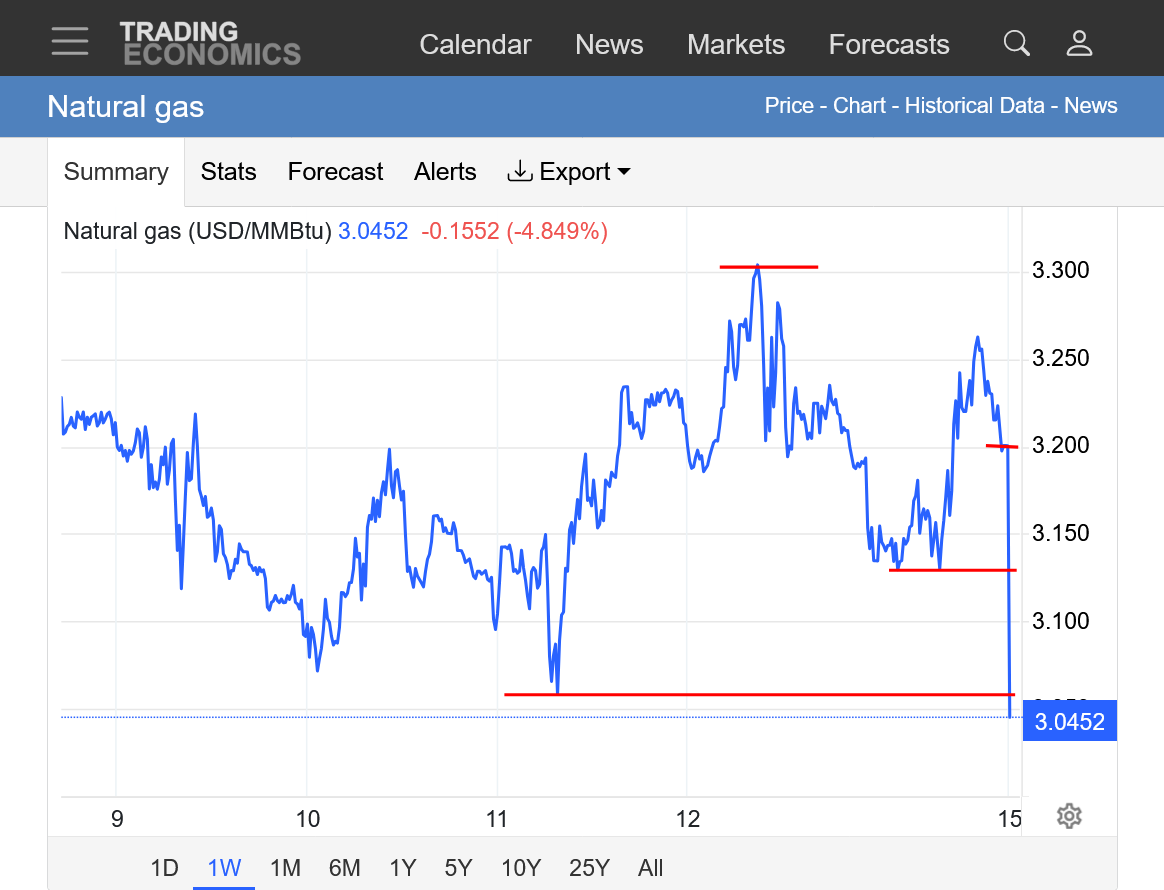
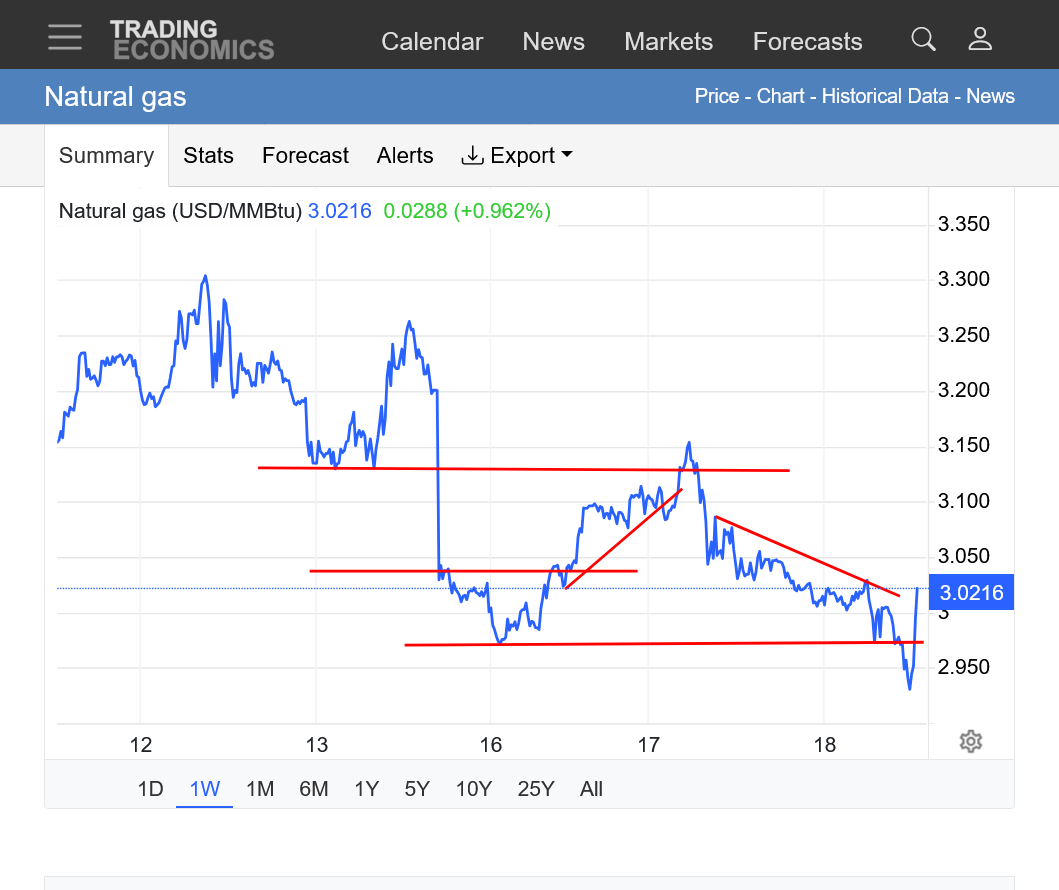
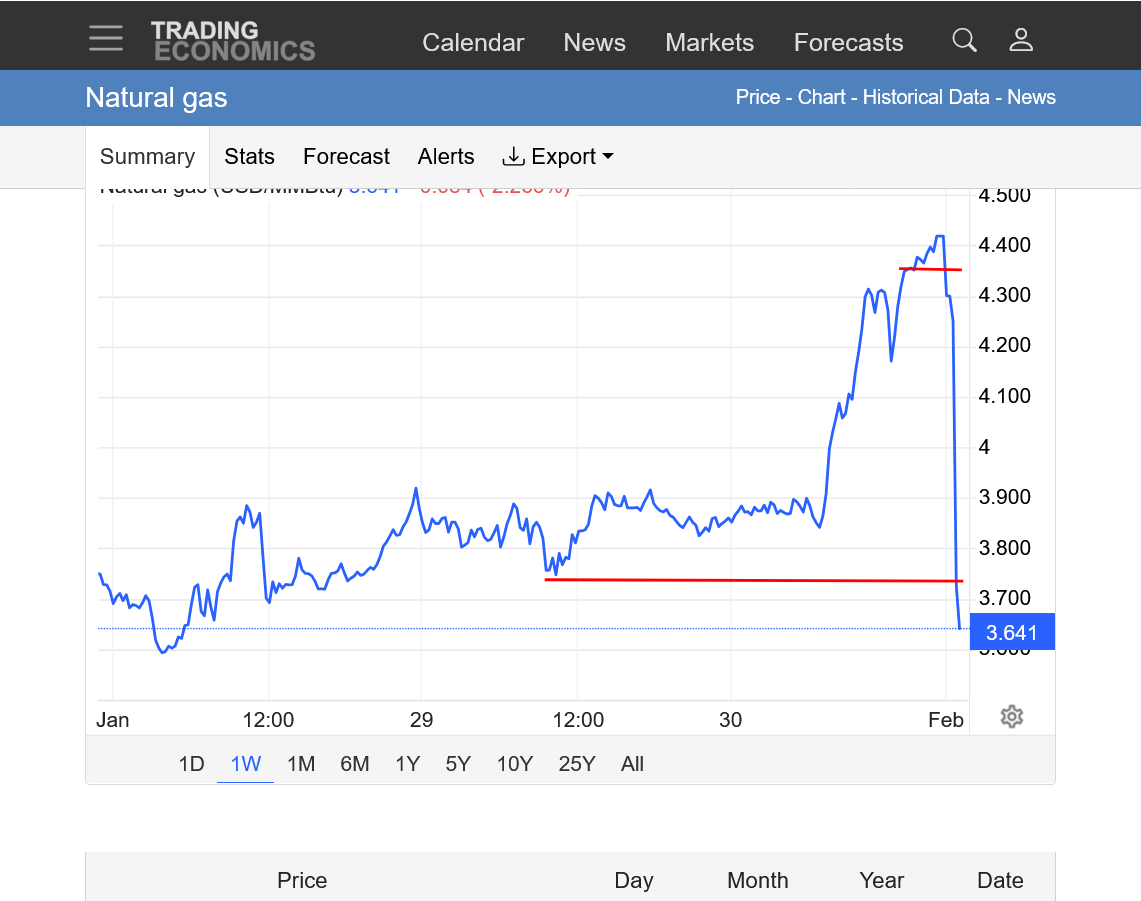
https://tradingeconomics.com/commodity/natural-gas
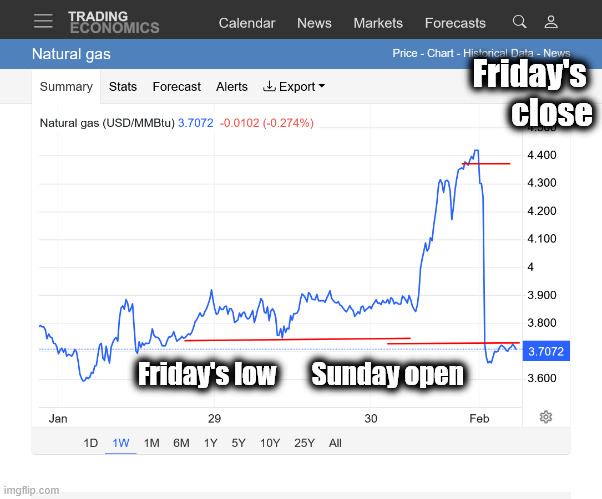
Top RED line was the close on Friday, +5,000/contract.
Bottom line was the open Sunday, BELOW the low on Friday and a GAP LOWER -$6,000/contract. I've never seen this happen before in 34 years of trading!
On Friday, front month March was at a premium of $3,500+ to the April.
Now at just +$700 vs the April. Of course this is overdone and we should get some sort of bounce back.
+++++++++++++++
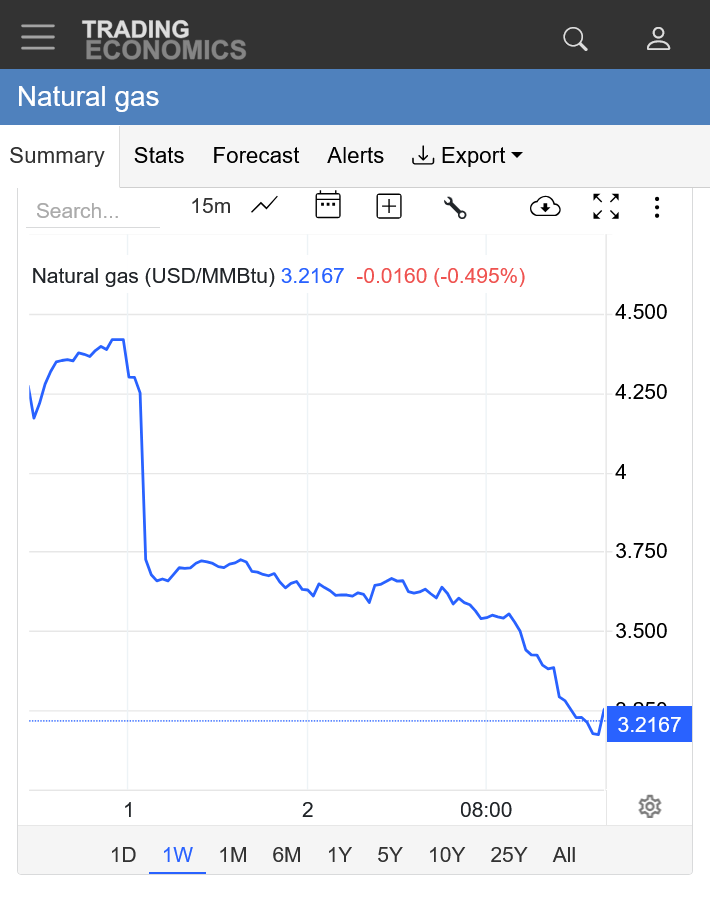
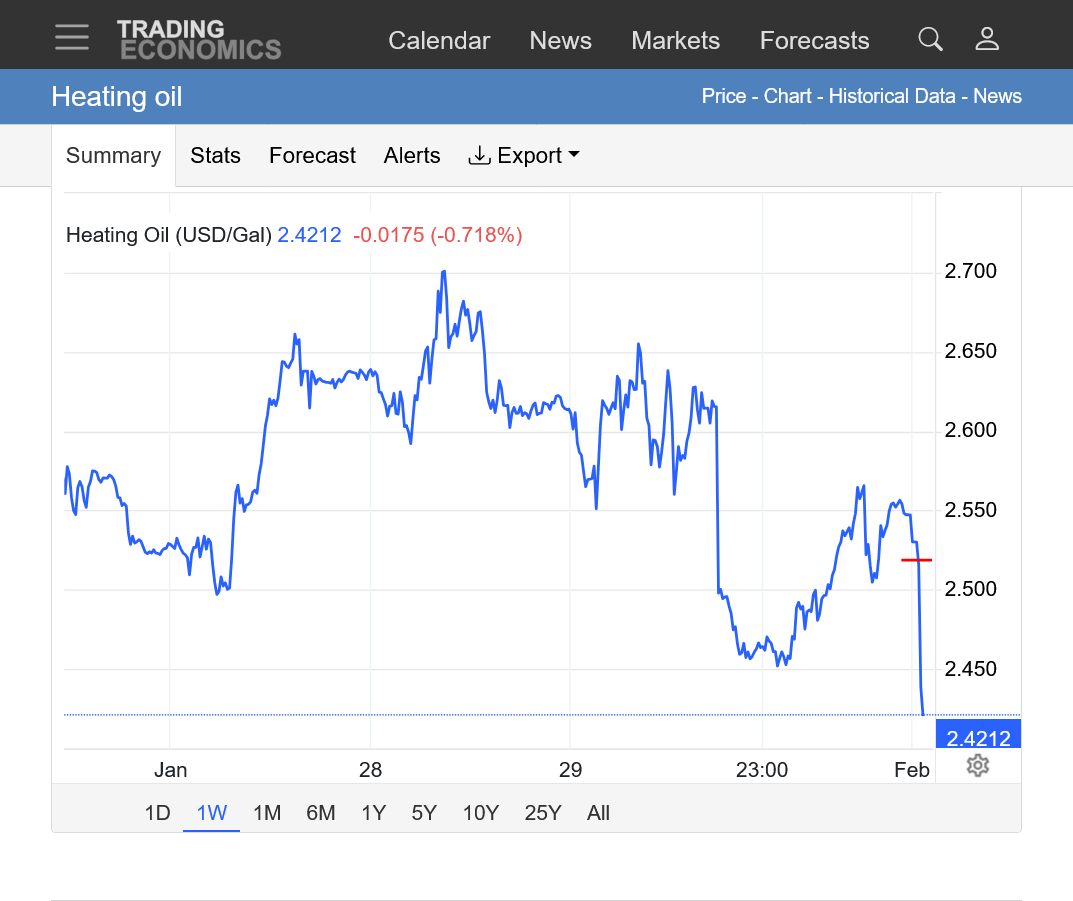
The heating oil market below, actually didn't open that much lower(no gap) red line. Traders that sold that market on the open were able to get more bang for their buck because the NG gap so incredibly low on the open. NG is a much more sensitive weather market by a mile but in this case the delayed reaction by heating oil would have been the way to go. No way would I have been able to know this before the open.
In fact, my trading program would not even show prices the first 5 minutes, other than bids/offers. Not sure if it was overwhelmed or what.
https://tradingeconomics.com/commodity/heating-oil
Re: Re: NG 1/18/26
By metmike - Feb. 1, 2026, 7:17 p.m.
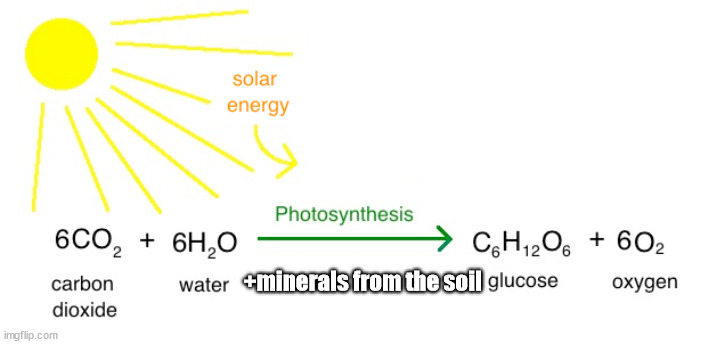
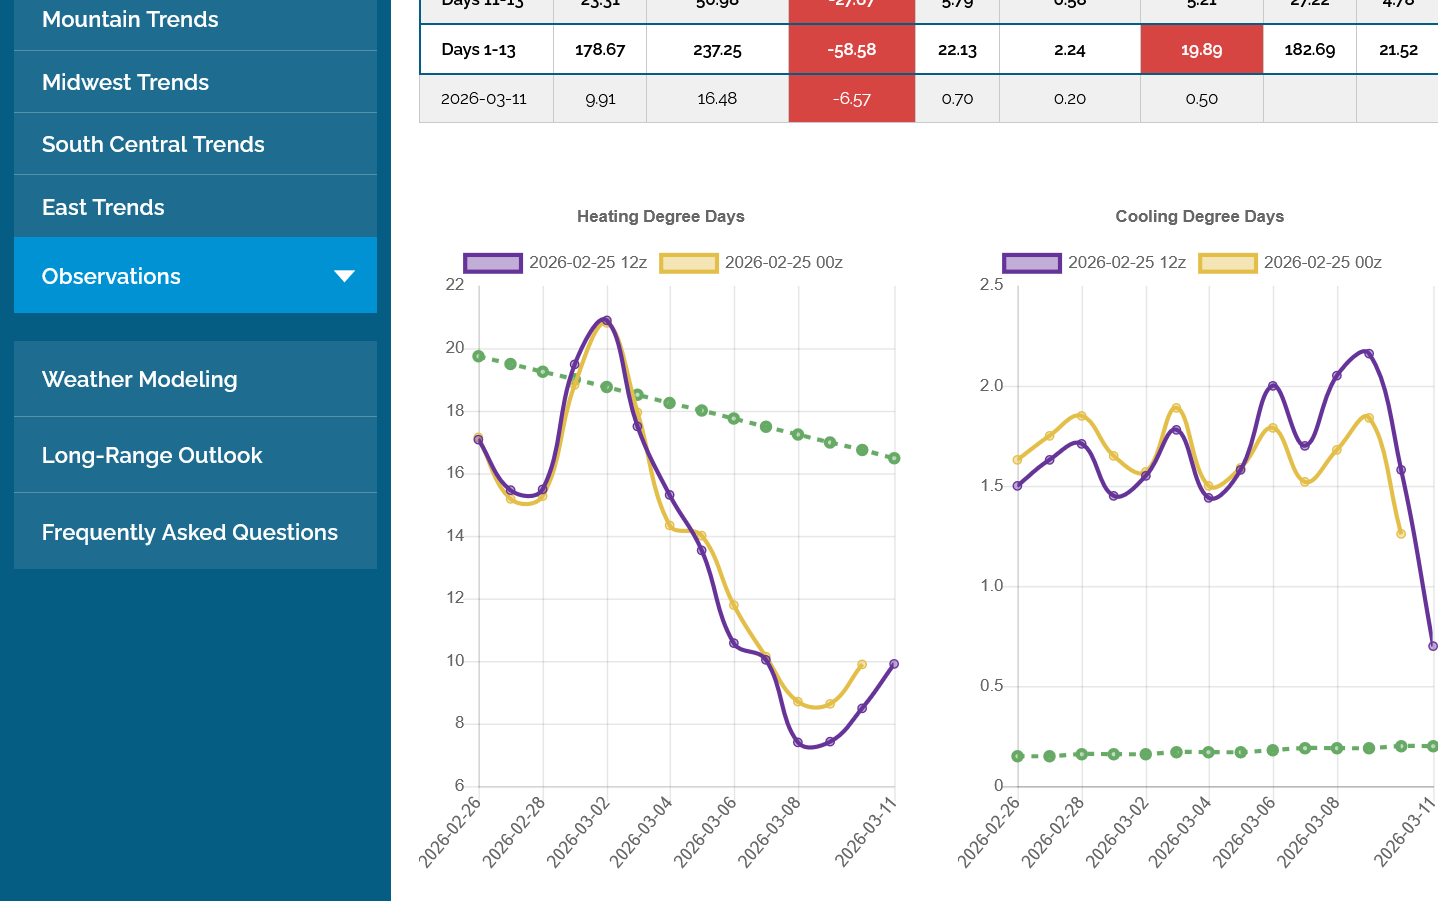
1. This was the last 12z European Ensemble model on Sunday(purple/left). HDDs in week 2 are now BELOW average(much milder temps)
2. This was the last 12z EE model on Friday. It was -6 HDDs BEARISH but the market completely ignored it after a small blip down. I had a selling set up triggered by that milder run and would have been run over by the bulls stampeding upwards Friday afternoon if short. This was actually in the early stage of the models turning milder which amplified over the weekend.
Re: Re: Re: Re: NG 1/18/26
The 12z European Ensemble model (purple/left) had -6 HDDs compared to the previous 0z run,
Re: Re: Re: NG 1/18/26
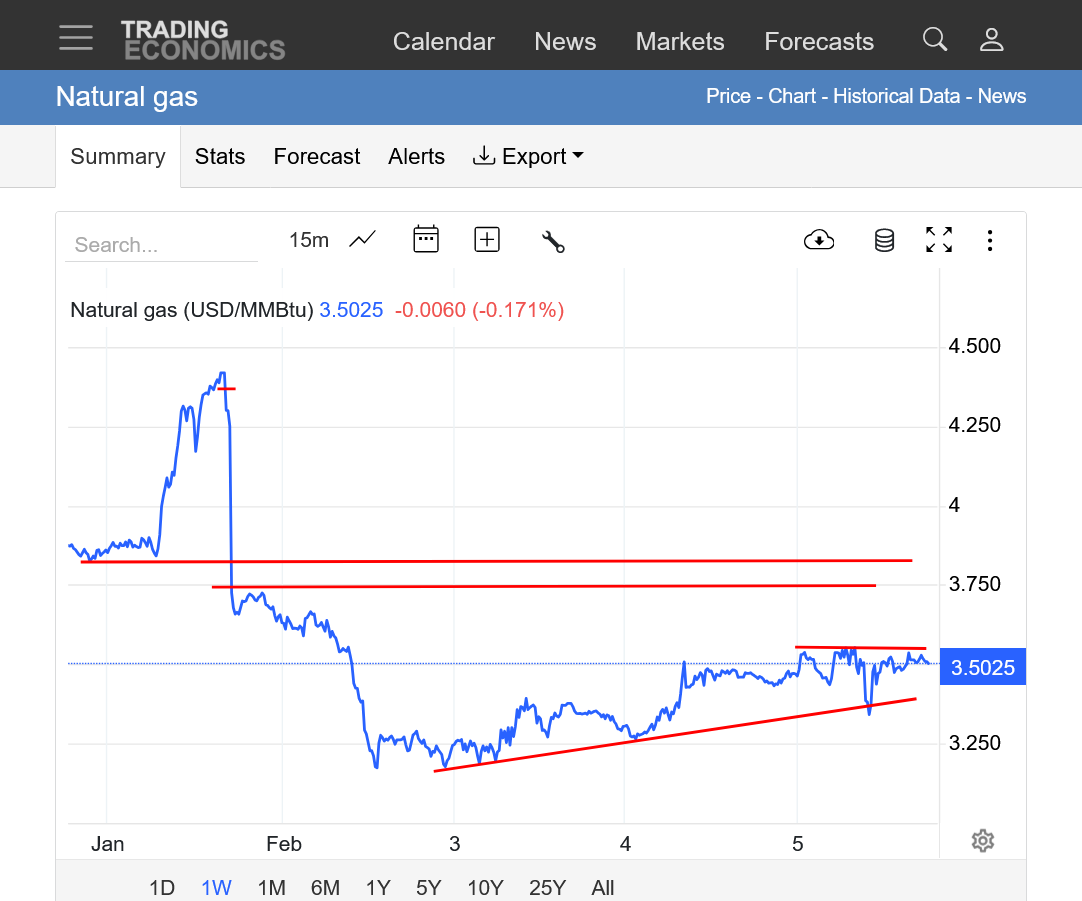
By metmike - Feb. 1, 2026, 10:51 p.m.
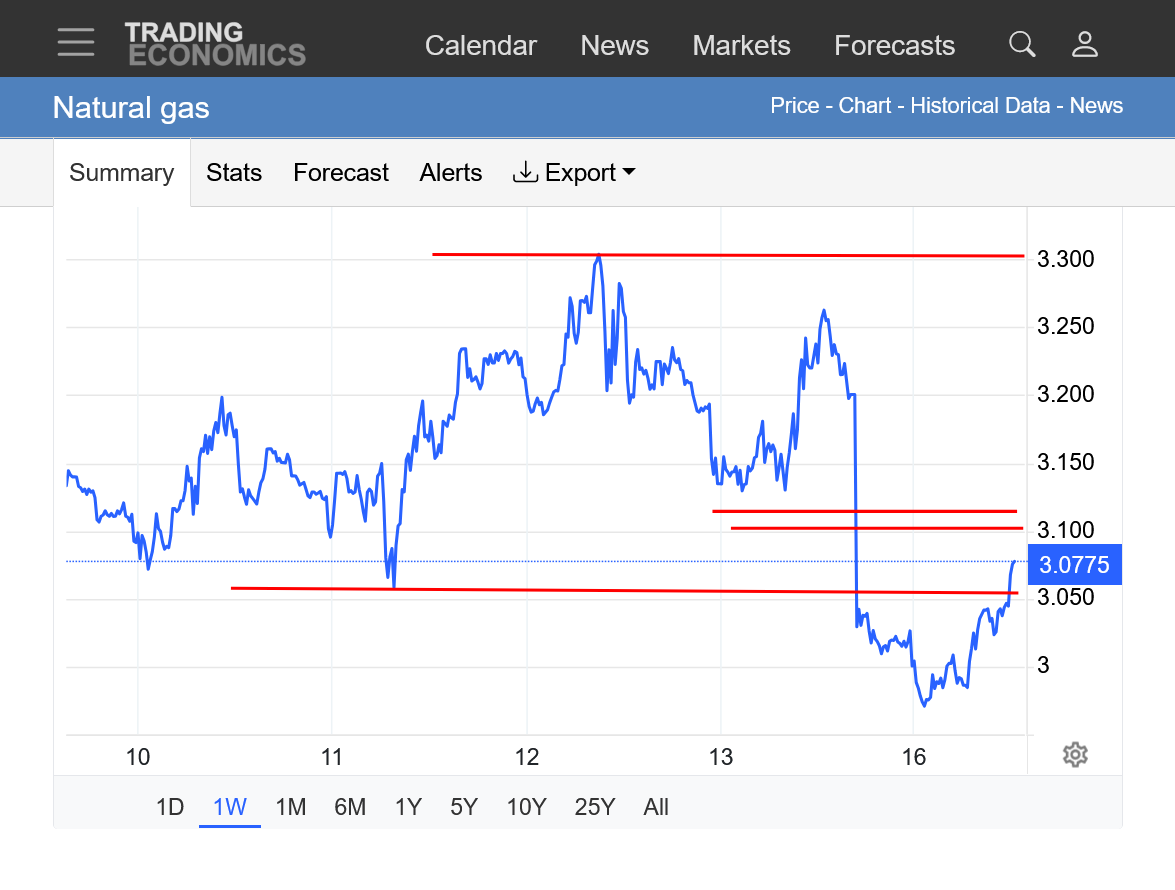
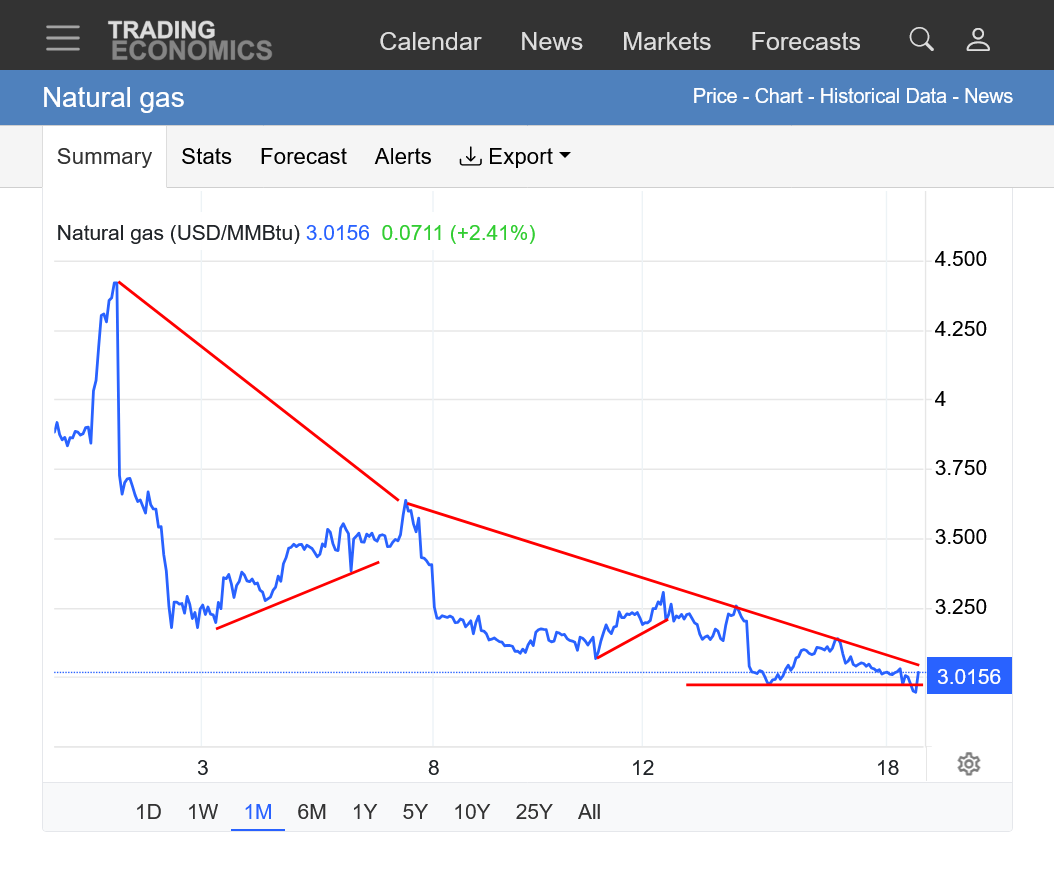
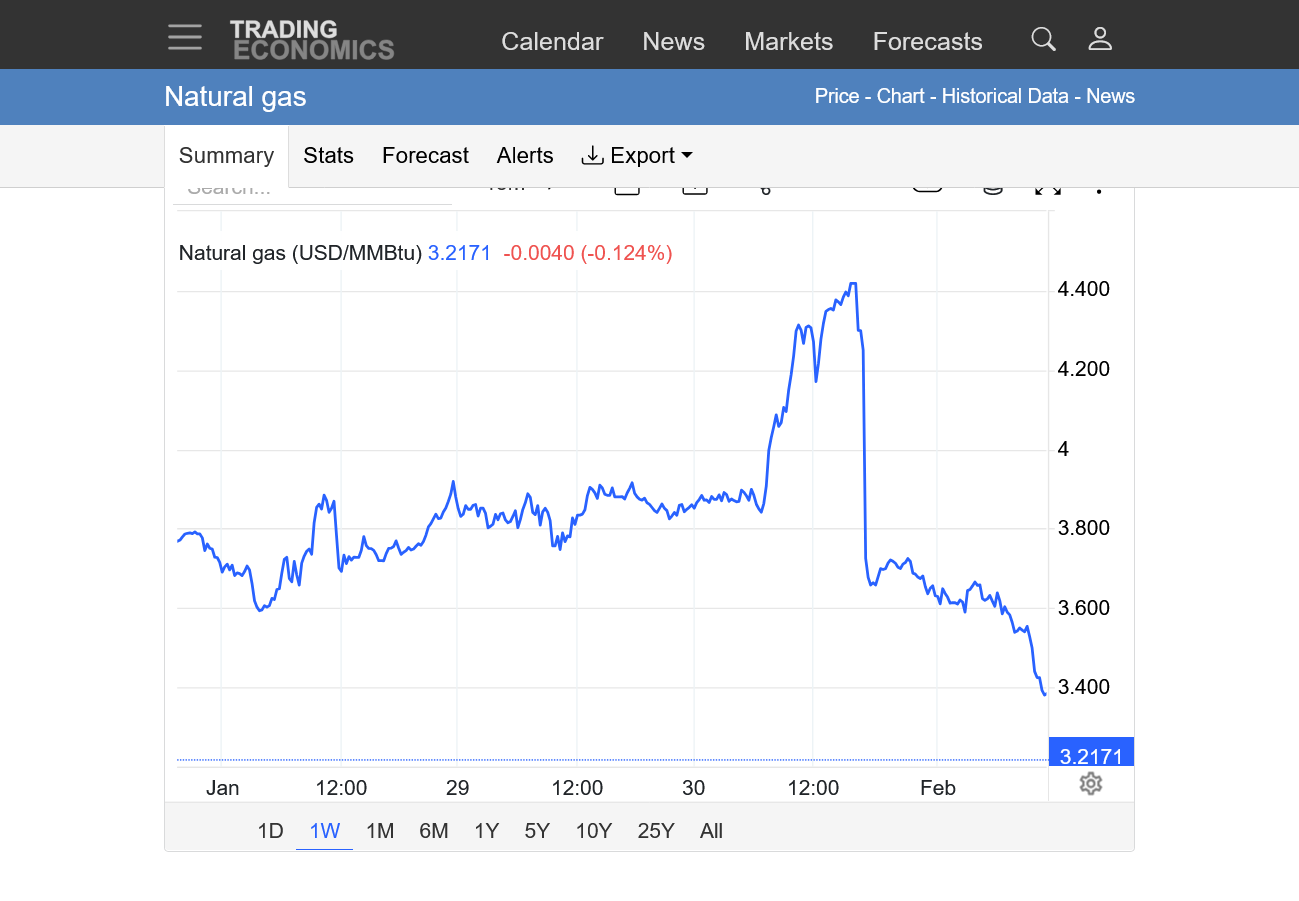
1. Top line was Friday's close = +$5,000/contract
2. 2nd line was Friday's low
3. 3rd line was Sunday's open and high, -$6,000/contract. The space between the 2nd and 3rd line was/is a downside break away gap.
After immediately spiking to -$7,200/contract shortly after the open, we fought back up close to the open, testing the bottom of the gap/high and have fallen back close to mid range as I type.
https://tradingeconomics.com/commodity/natural-gas
Re: NG 1/18/26
By WxFollower - Feb. 2, 2026, 1:08 a.m.
Thanks, Mike.
I wonder if in addition to the Sun 12Z EE having a whopping 24 fewer HDD for 2/8-13 vs the Fri 12Z run if the warmer Sun Euro Weeklies week 3 (for 2/16-22) vs what Fri’s showed was an additional significant factor.
———
Edit at 1:20: I hope MM doesn’t mind but I started a new NG thread.
Re: Re: NG 1/18/26
By metmike - Feb. 2, 2026, 1:20 a.m.
Yes, Larry that probably contributed a bit too.
.png)