Previous robust thread:
silver
91 responses |
Started by cutworm - Dec. 19, 2025, 8:51 a.m.
https://www.marketforum.com/forum/topic/116644/
+++++++++++++++
By metmike - Feb. 6, 2026, 8:49 a.m.
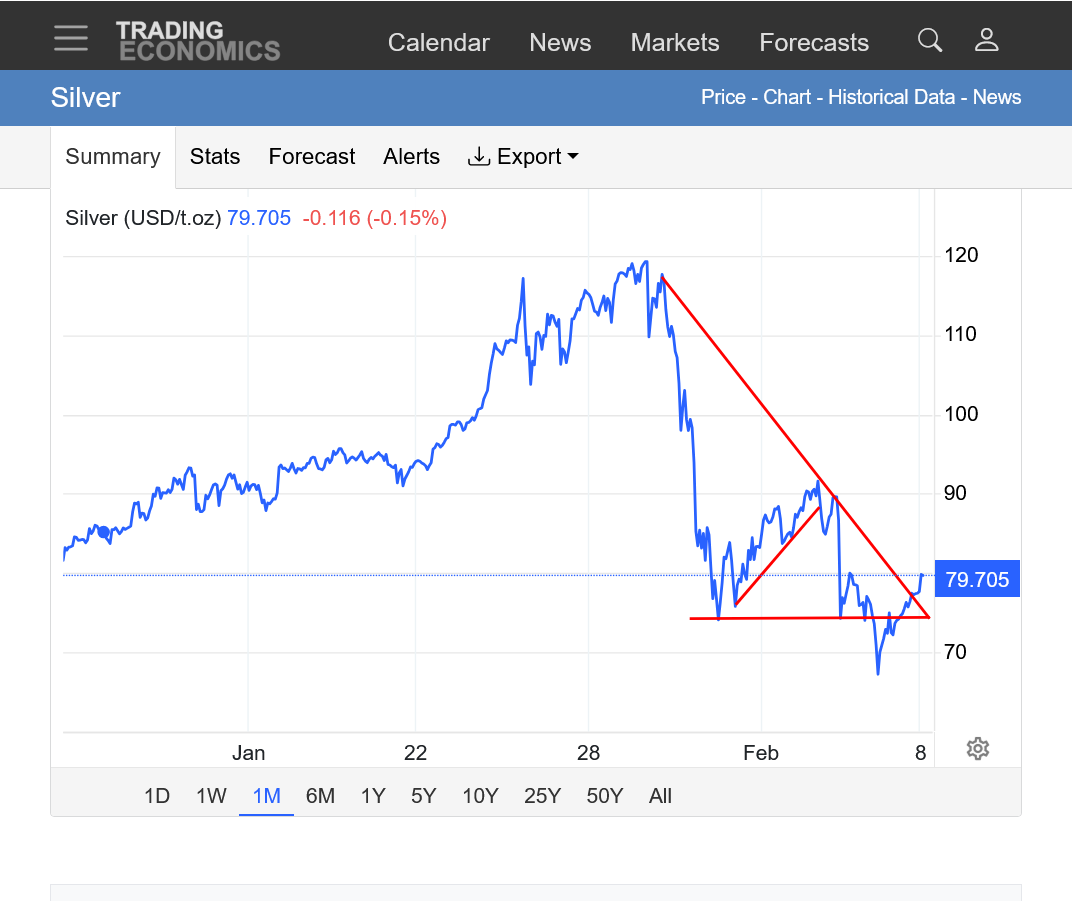
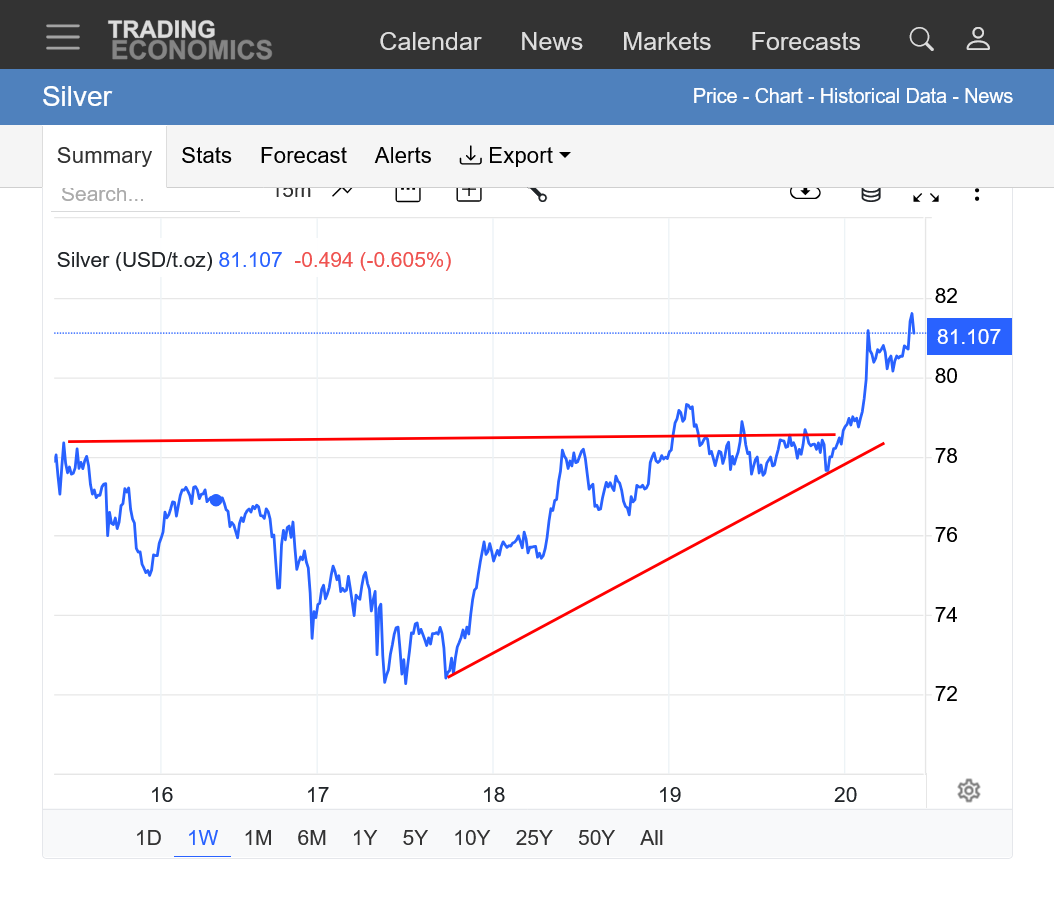
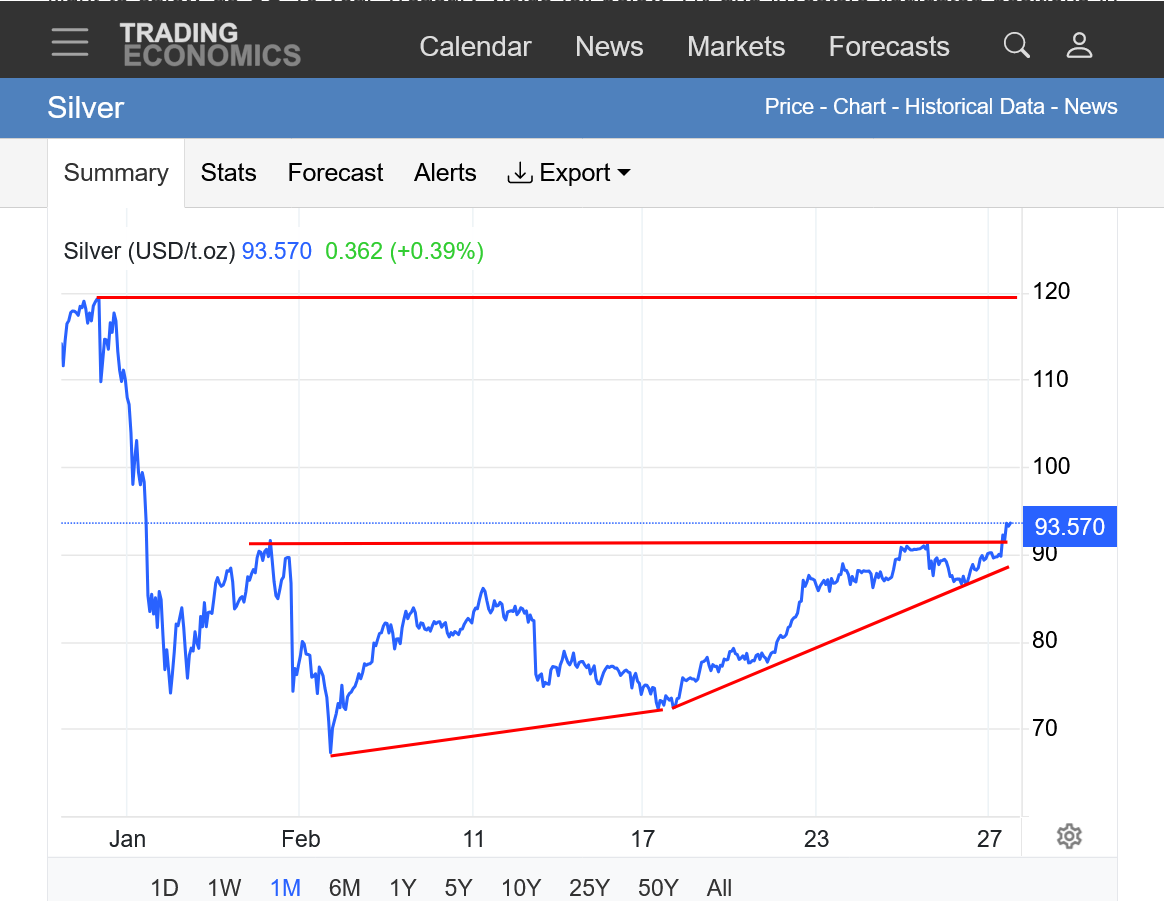
Silver broke thru overnight and spiked down but has reversed back up today. Now just barely above it. Powerful sign of a potential low if we have a solid close higher/above this level today. Incredible volatility.
https://tradingeconomics.com/commodity/silver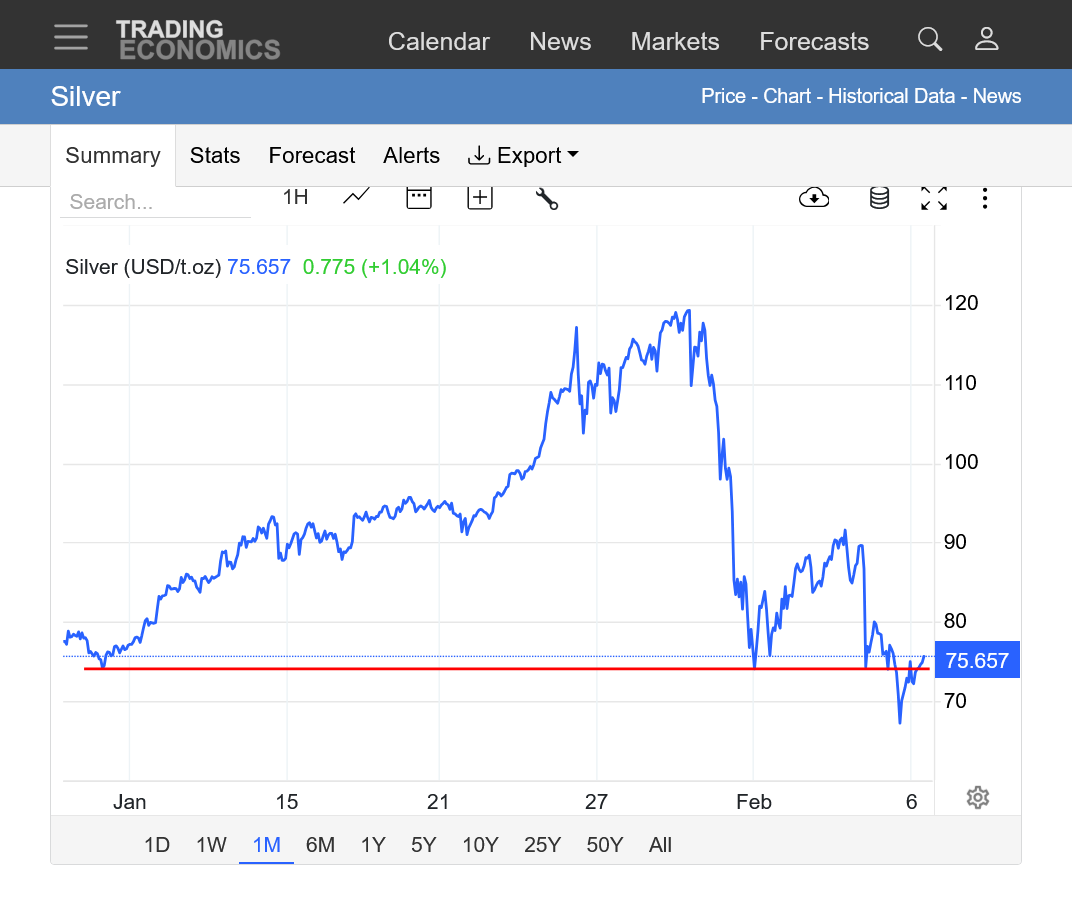
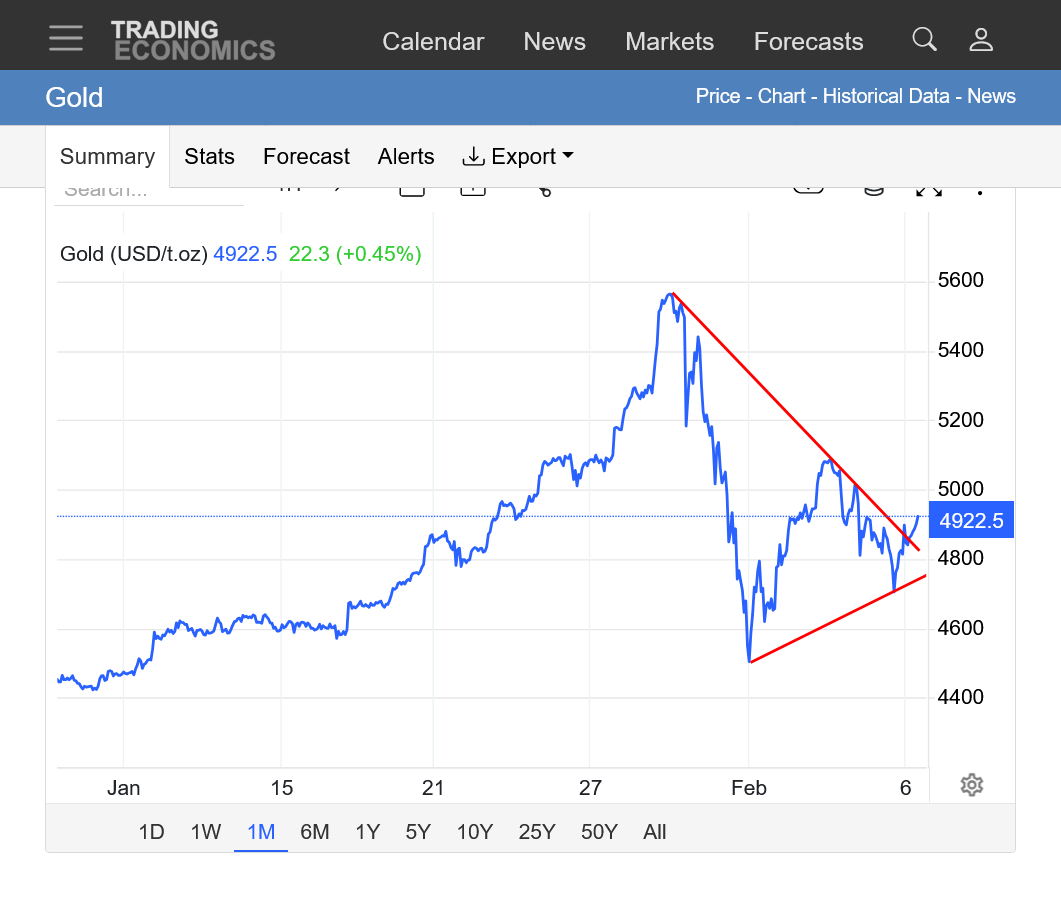
Gold on the other hand has not suffered nearly as much with the recent historic correct as silver. While silver spiked to new lows overnight, gold easily held the recent low and is looking BULLISH again on the price charts. Even breaking above a downtrend line from the highs, then 2nd lower highs and potentially establishing a new uptrend based on last nights HIGHER lows.
This could be an upside break out of a symmetrical triangle/wedge chart formation(higher lows + lower highs).
Regardless, after silver outperformed gold in 2025 by a wide margin, its been the opposite extreme after this historical top in both metals.
Silver down from 120 to 75(which is almost a 38% drop) but gold only down from 5500+ to just below 5000(11% drop).
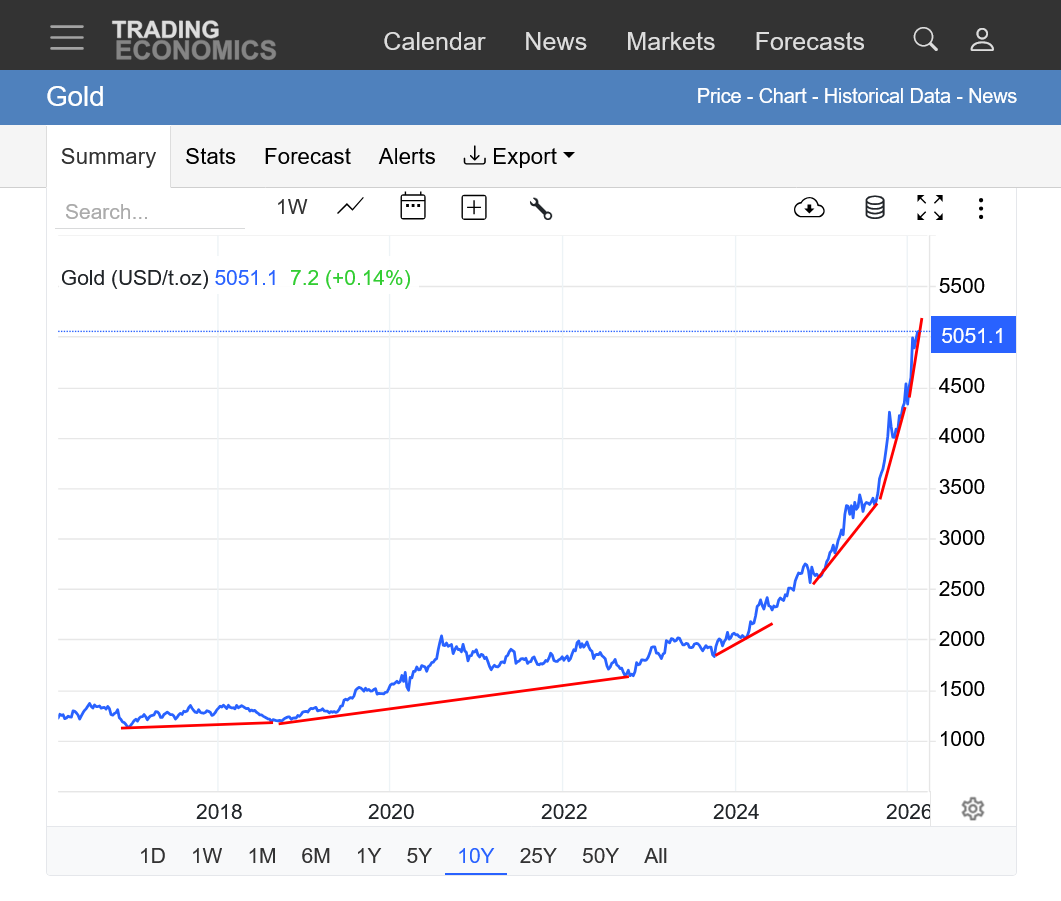
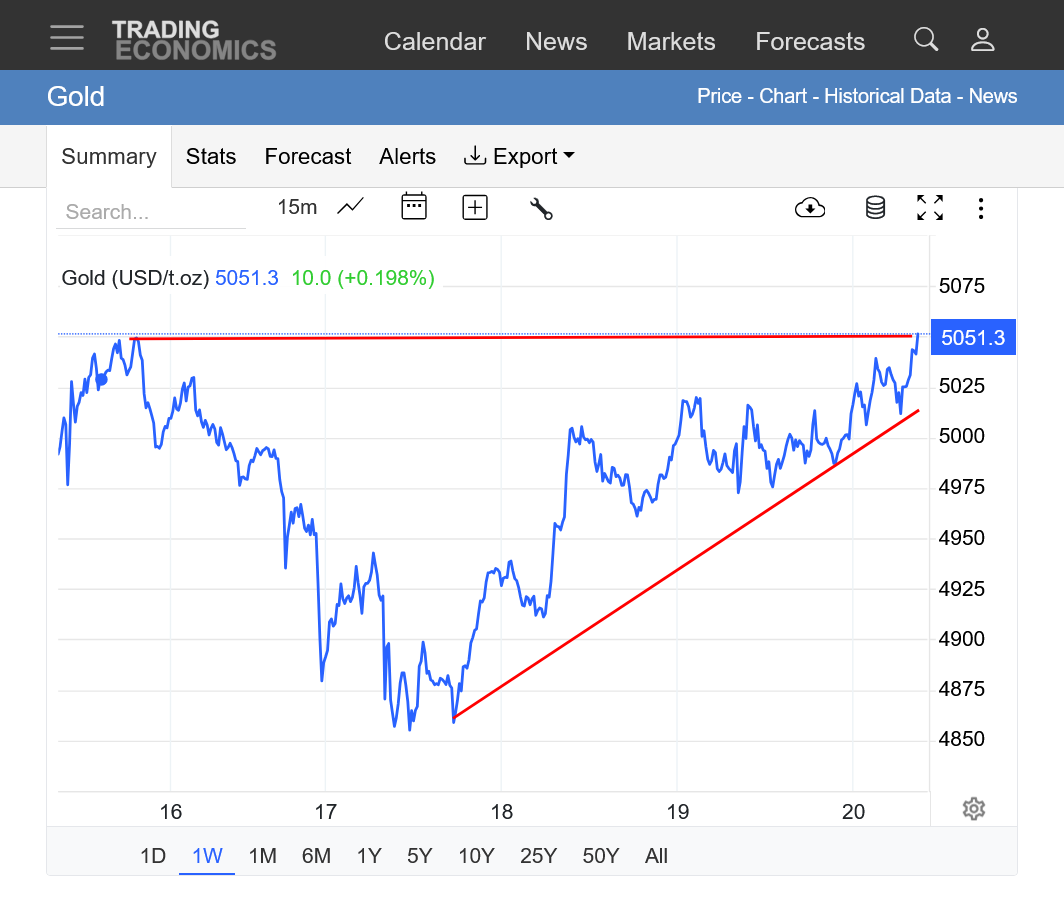
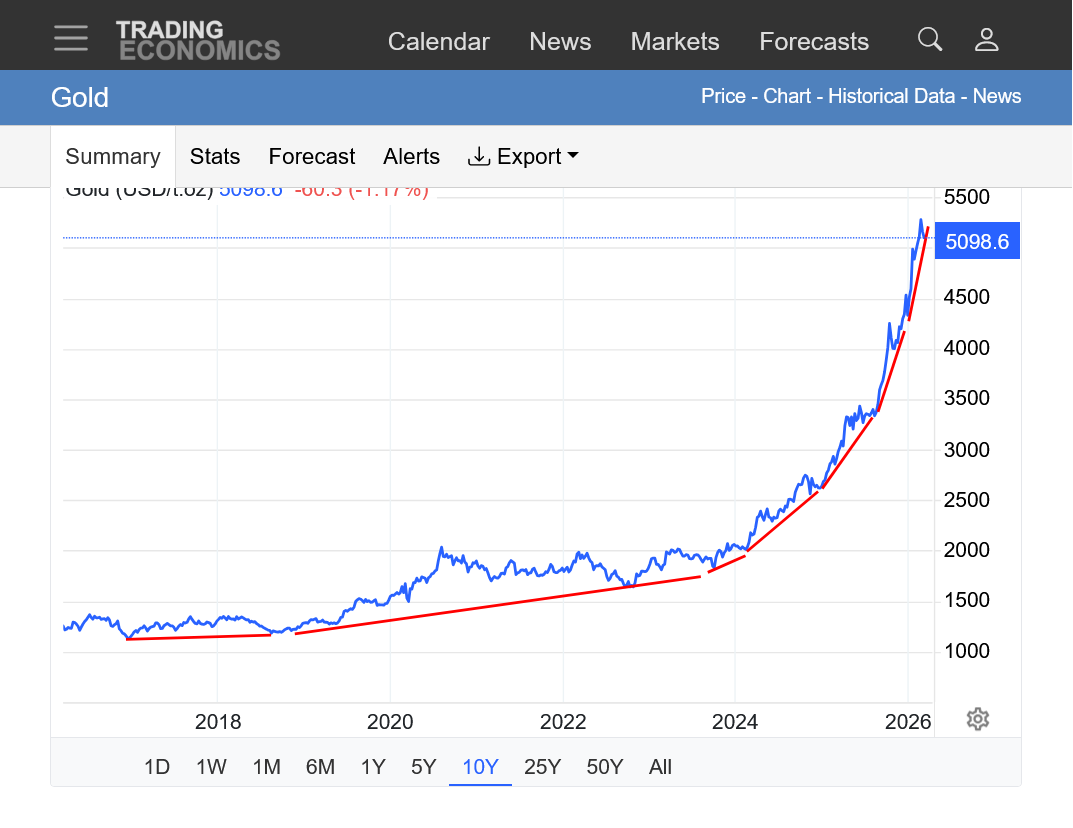
https://tradingeconomics.com/commodity/gold
5000 could be some resistance? Then just below 5100/recent high. Above that, then it's clear sailing up close to the old highs. Looking sooo much more bullish/less bearish than silver. The magnitude of this divergence is NOT going to continue, maybe just a temporary thing from silver being so overdone and having less open interest when specs covered.
For instance, March silver has 80,500 contracts of open interest but April gold has almost 281,000, more than 3 times that amount.
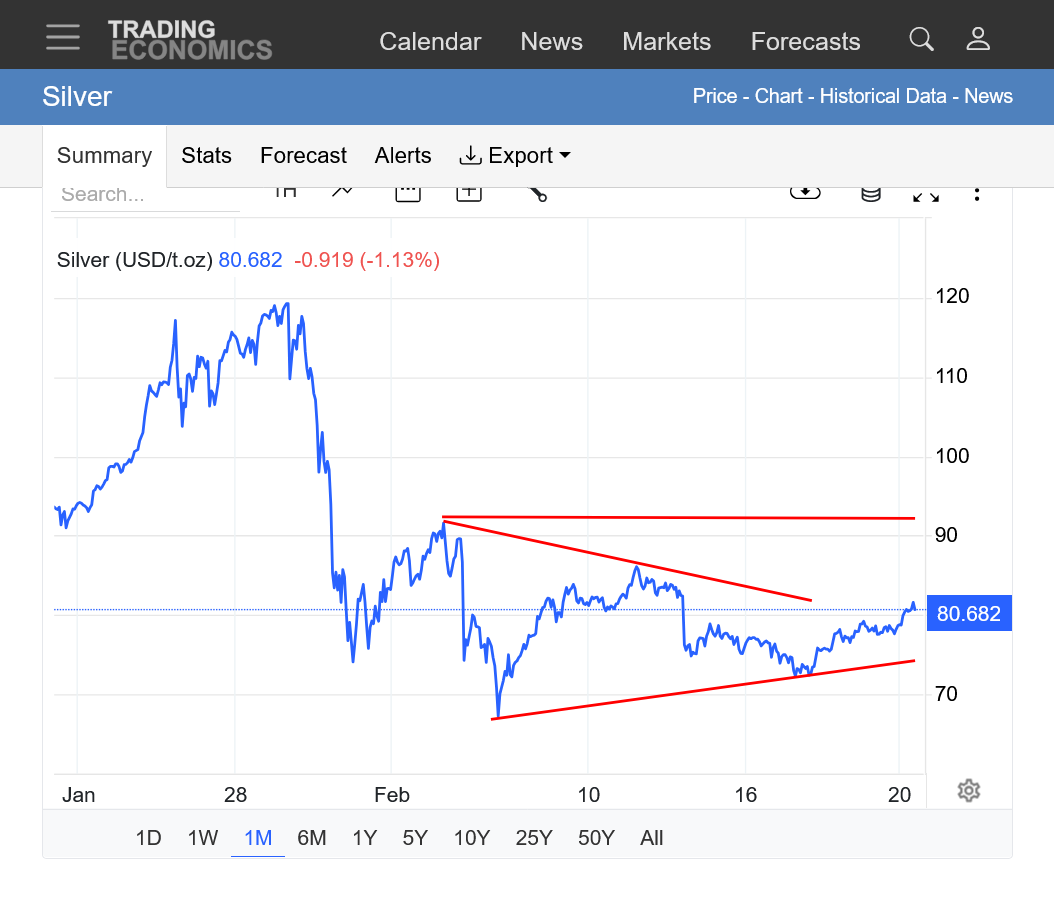
https://tradingeconomics.com/commodity/silver
Historical top at the end of January, followed by historical plunge. Small bounce, then a brief spike to new lows last Thursday evening, followed by a reversal up back above those lows/support and bullish close on Friday.
Tiny gap higher this evening with the chart formation turning more bullish. Are the lows in??
"Looking" for an ugly reversal tonight for a negative close TO BUY
Gold 5008 is Eclipse point
Started by fayq - Feb. 18, 2026, 1:10 p.m.
https://www.marketforum.com/forum/topic/117989/
+++++++++++++++++
Astrology is pseudoscience!
+++++++++++++++++++
Gold has not lost it's bullish technical advantage, despite the huge correction lower earlier this year.
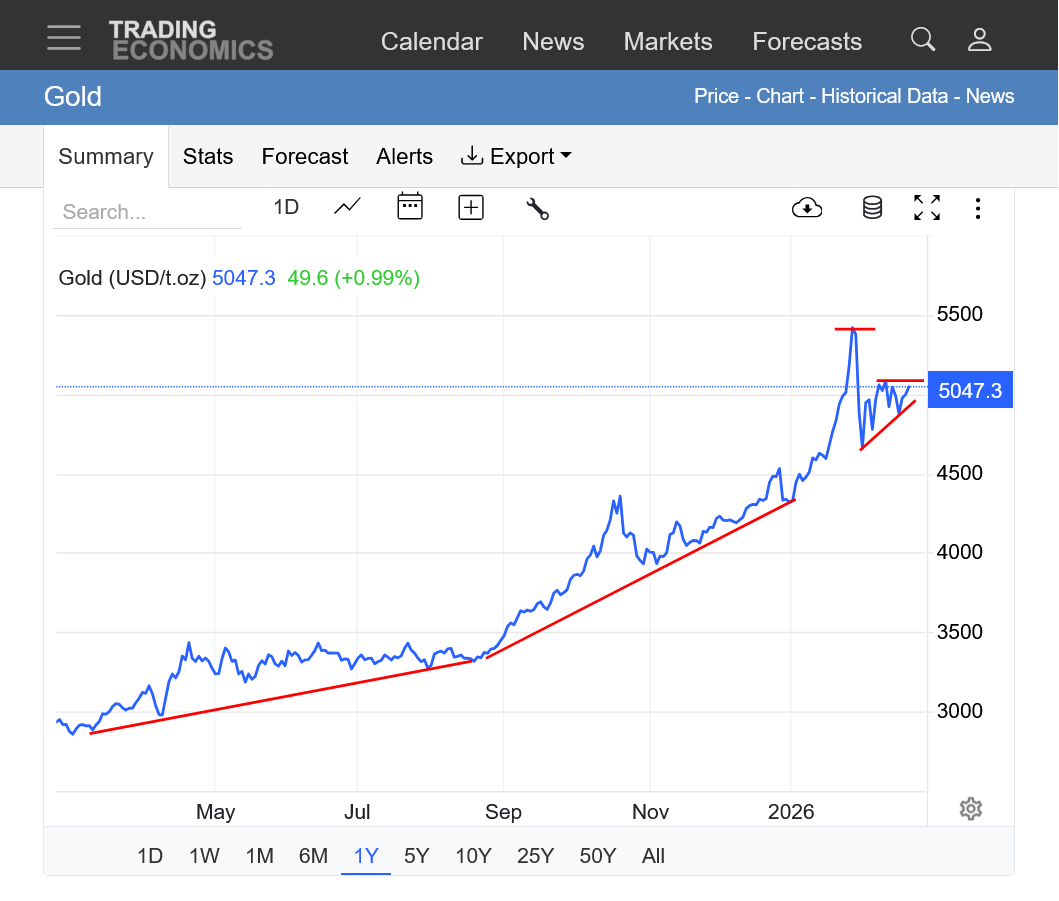
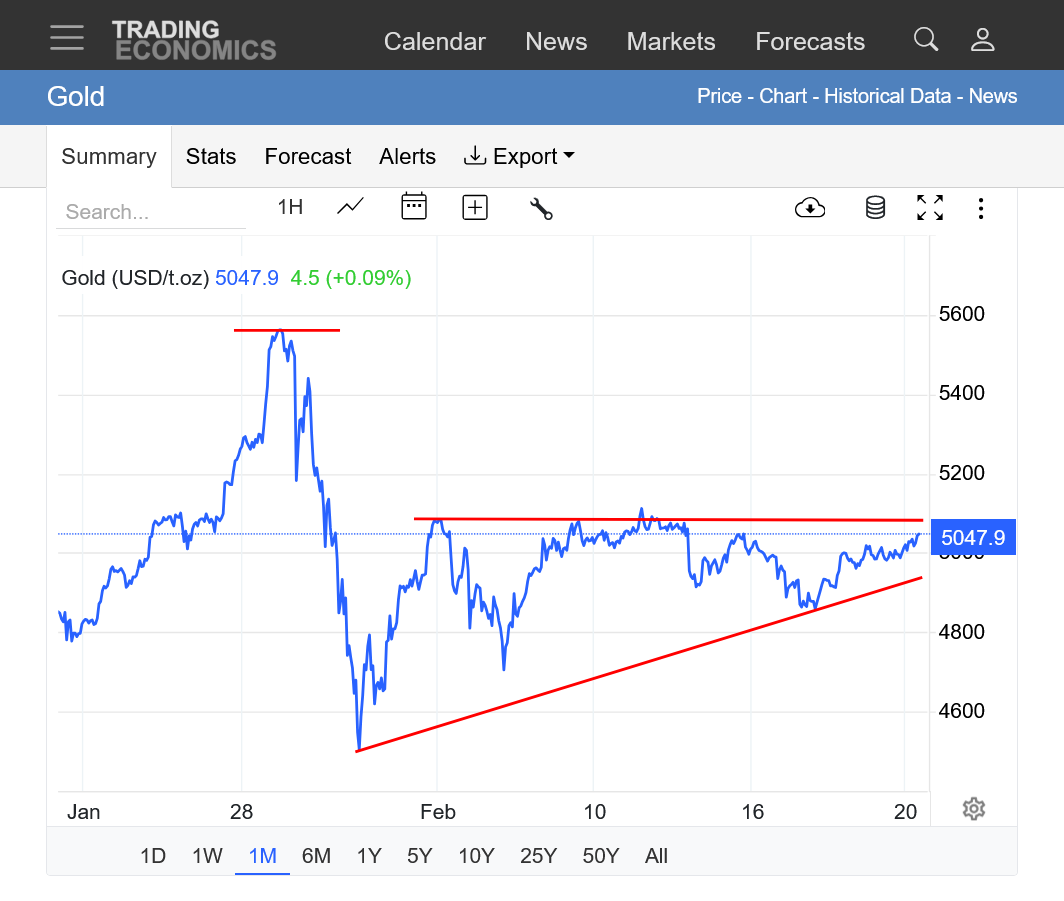
https://tradingeconomics.com/commodity/gold
1. 10 years. Still on the parabolic/exponential slope upwards. After being outperformed by silver in 2025, looking STRONGER than silver in 2026!
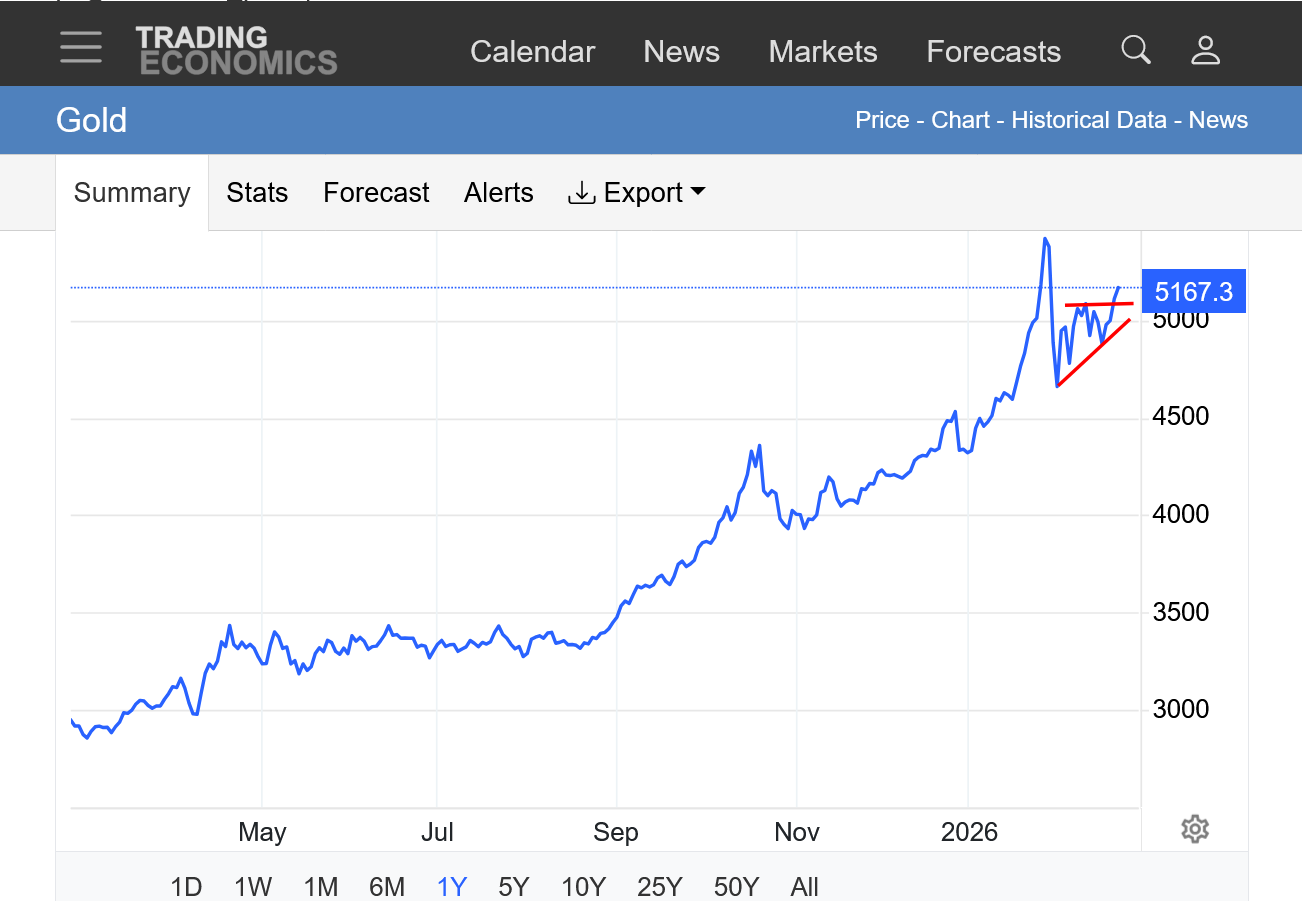
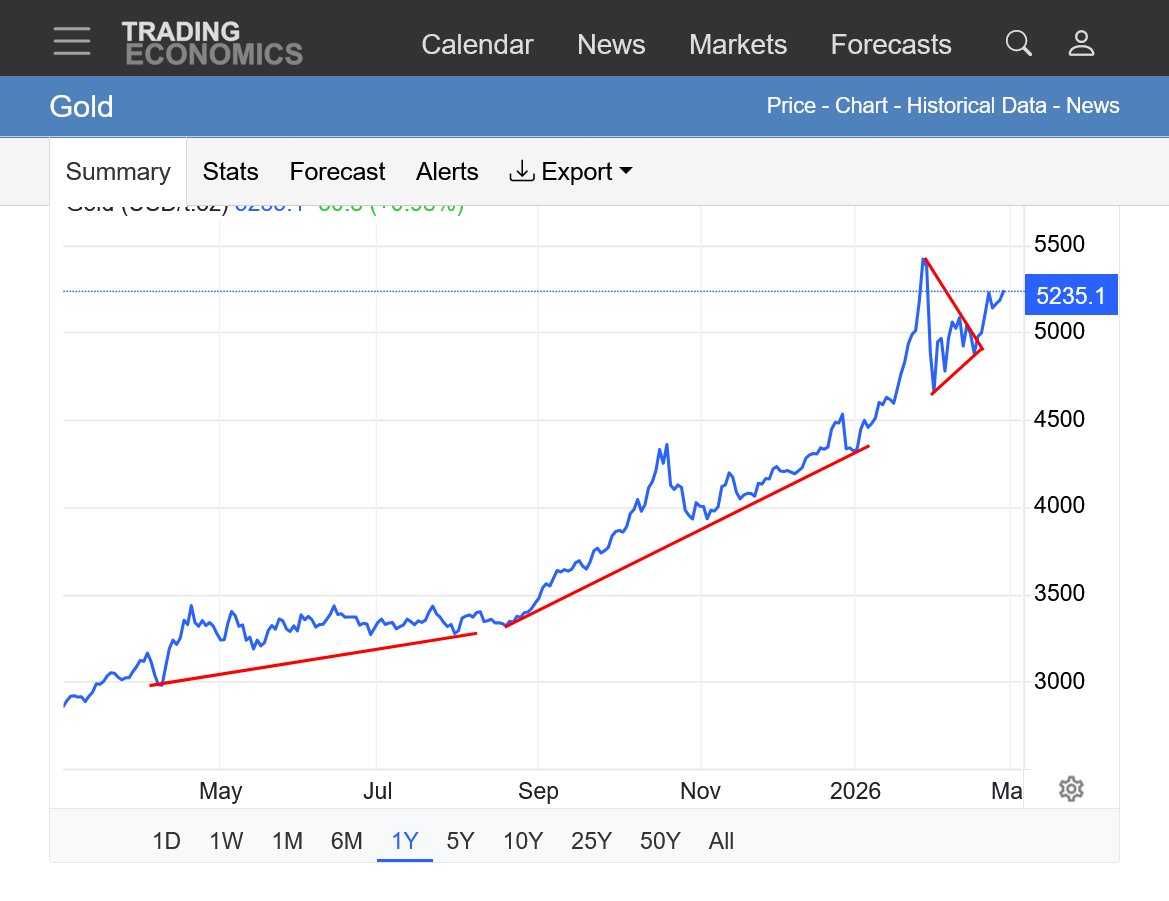
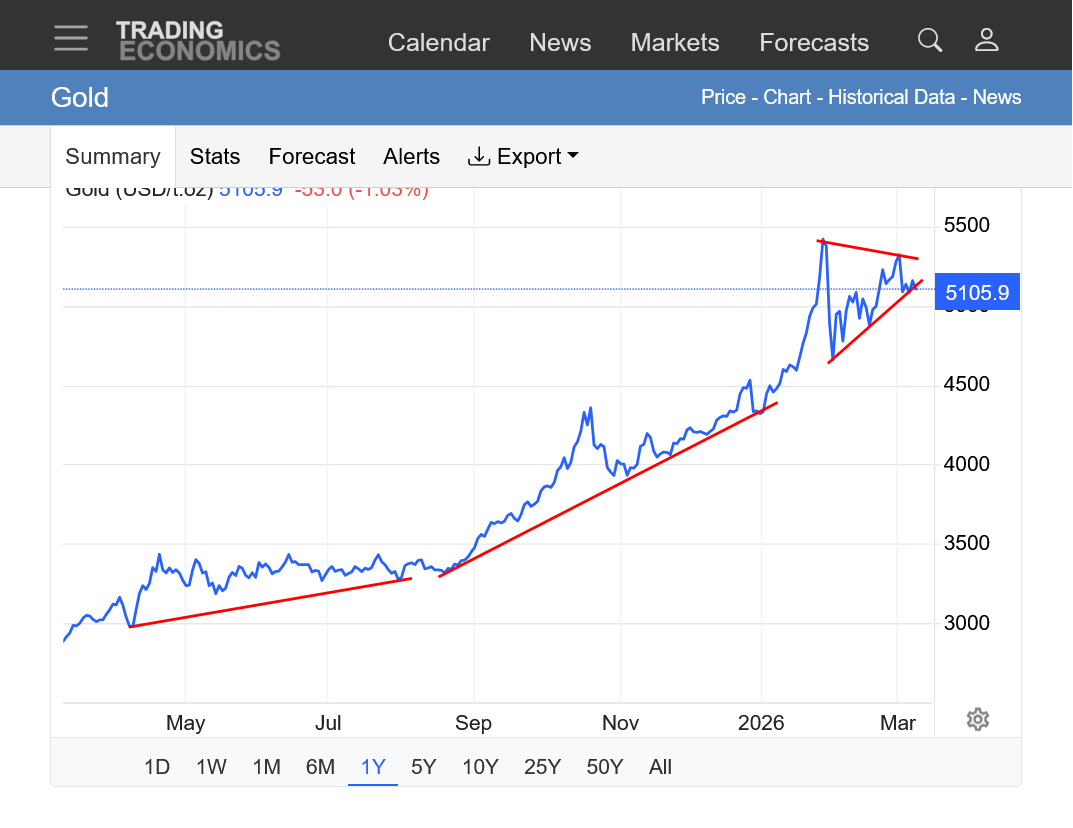
2. 1 year: Major top with spike lower that HELD THE BULLISH trendline. Is this a bear flag? Or a bullish ascending triangle. Market it approaching the apex and potential upside breakout(as well as some resistance).
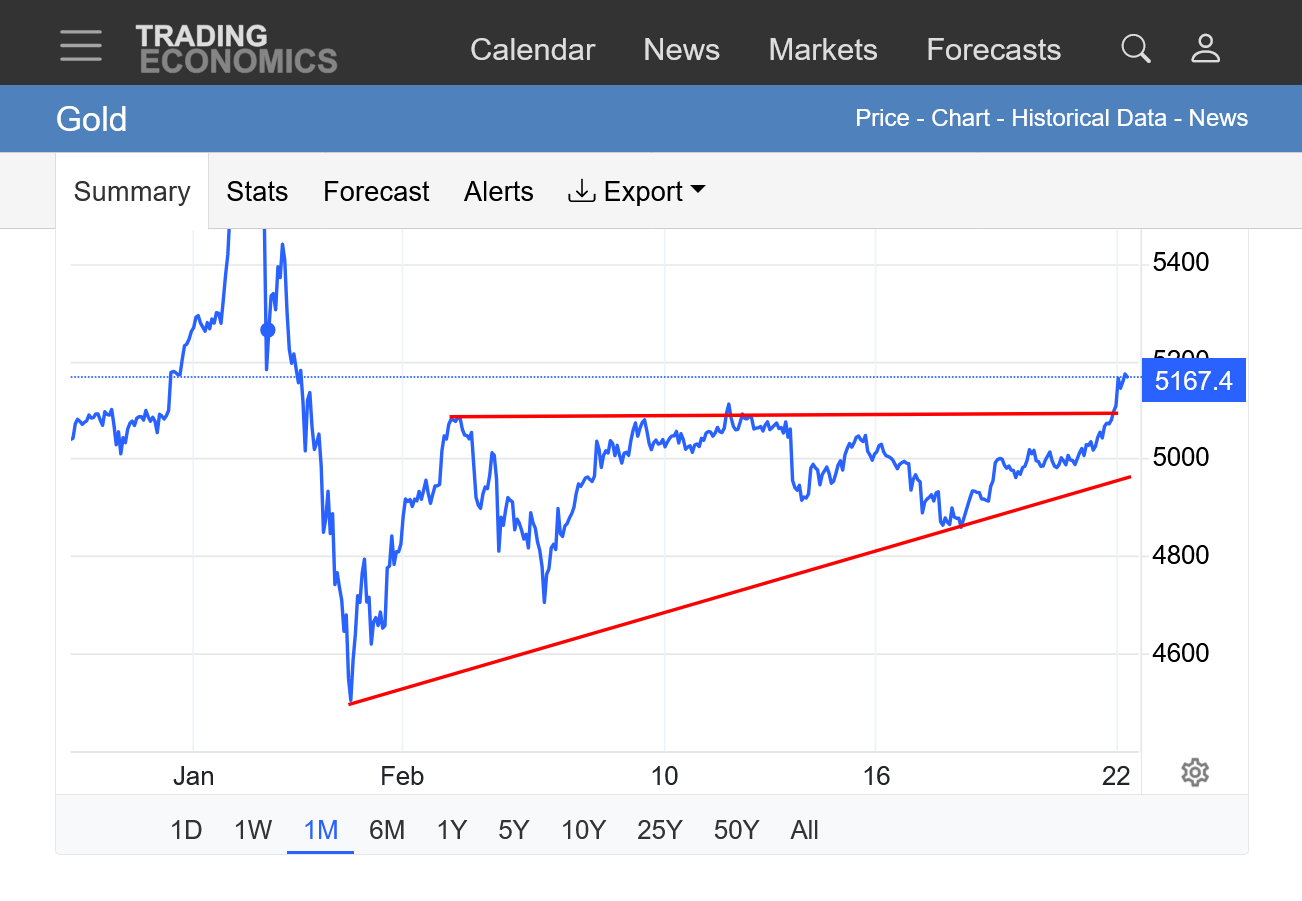
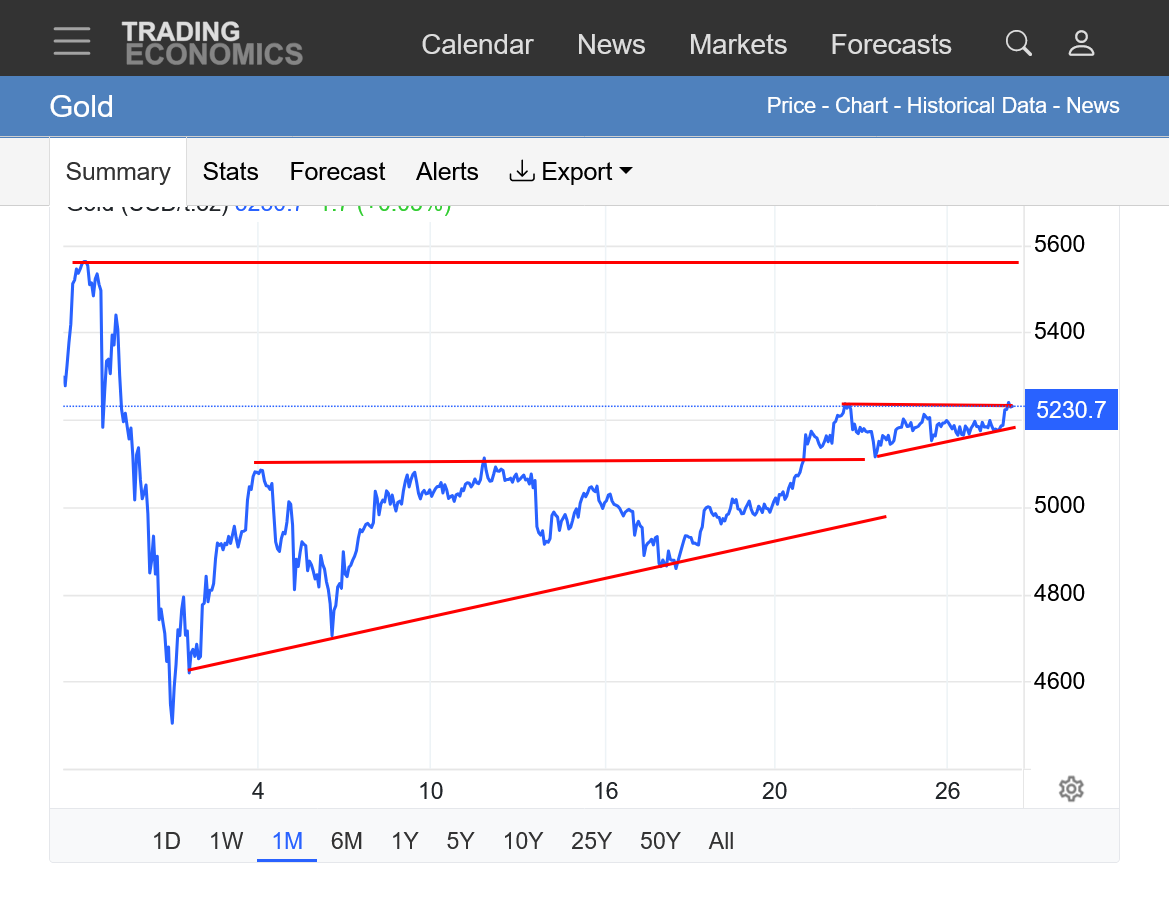
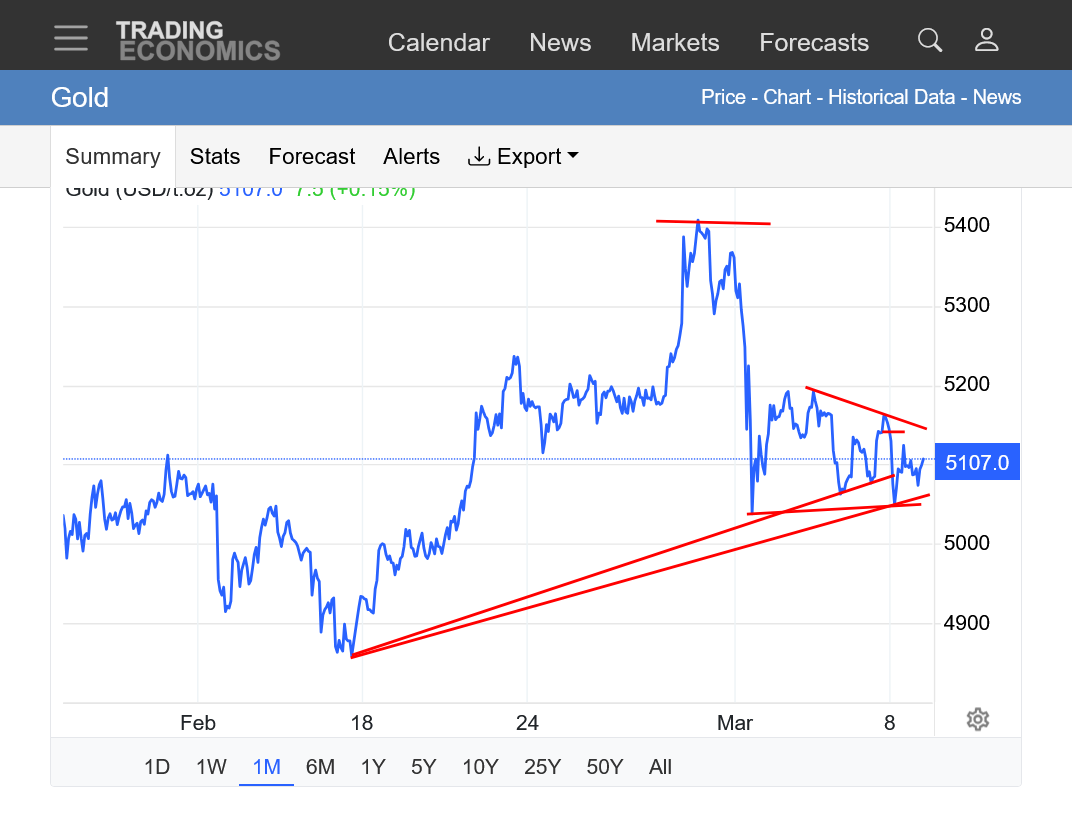
3. 1 month: Possible ascending(bullish) triangle/wedge. Higher lows. Near the apex with a narrowing range(coiling formation). Threatening an upside break out...and resistance.
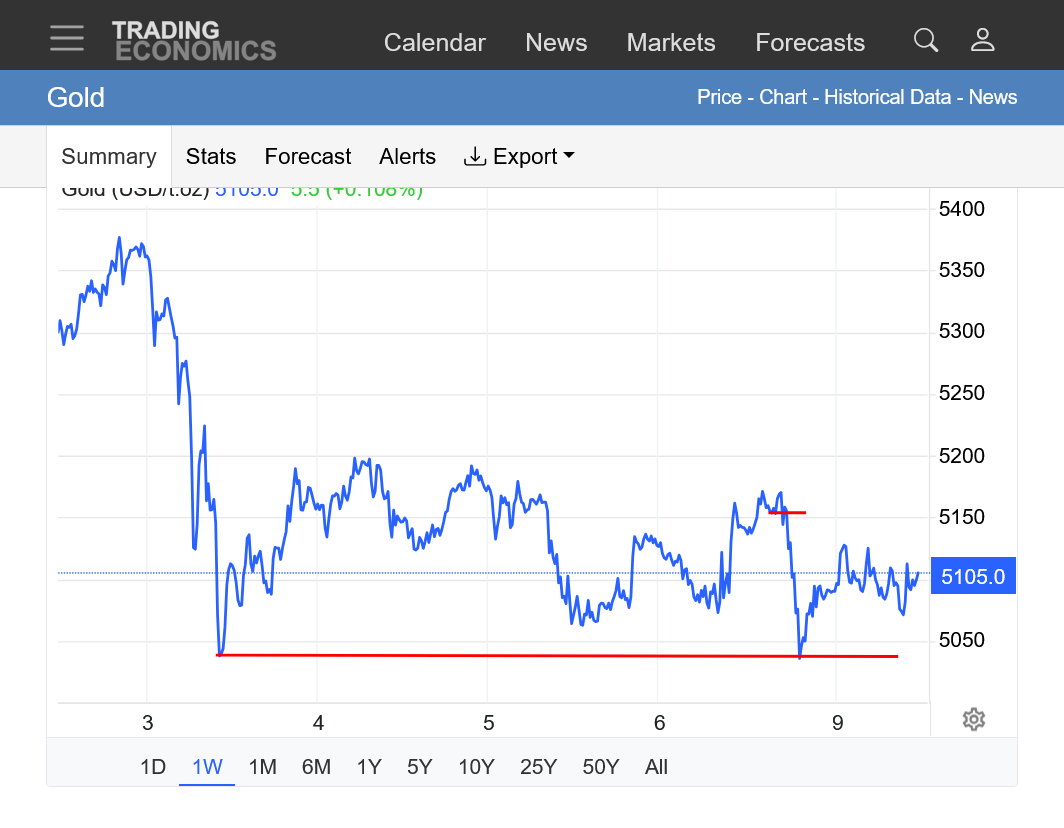
4. 1 week: Ascending triangle. Near the highs of the week, possible upside break out or will this resistance hold.
Silver
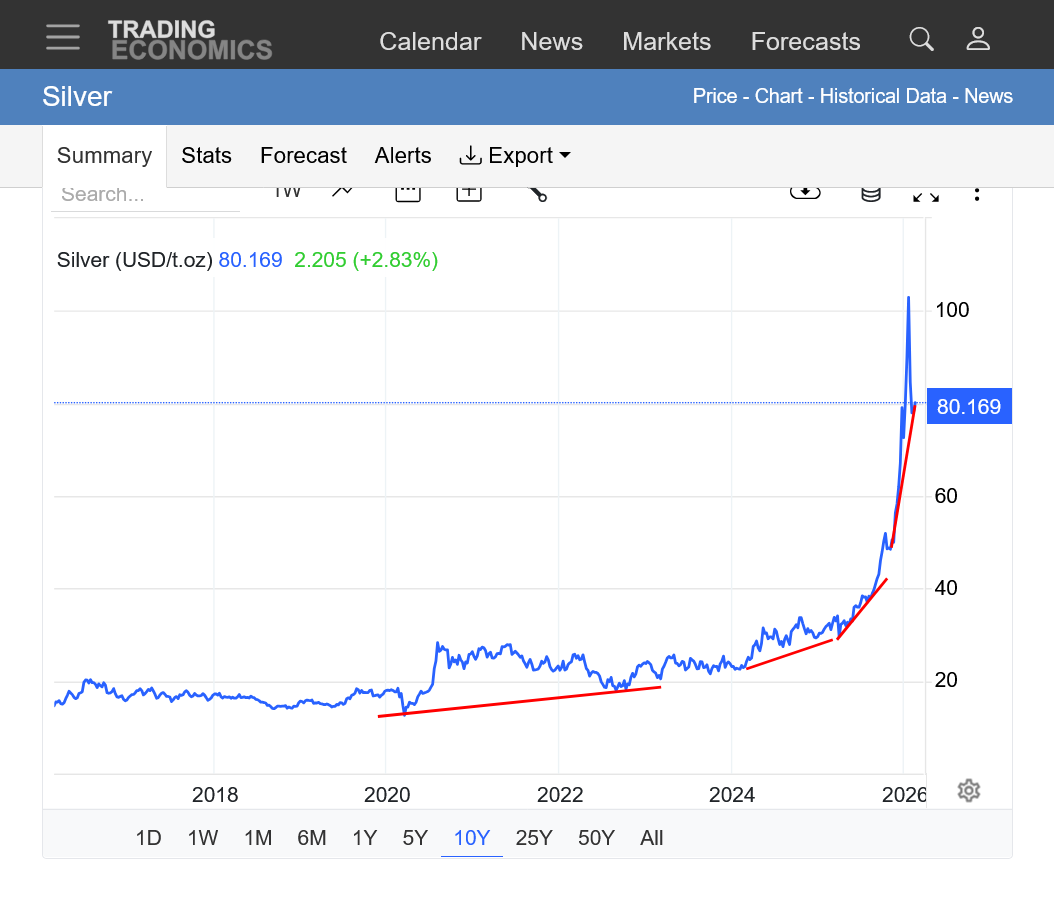
https://tradingeconomics.com/commodity/silver
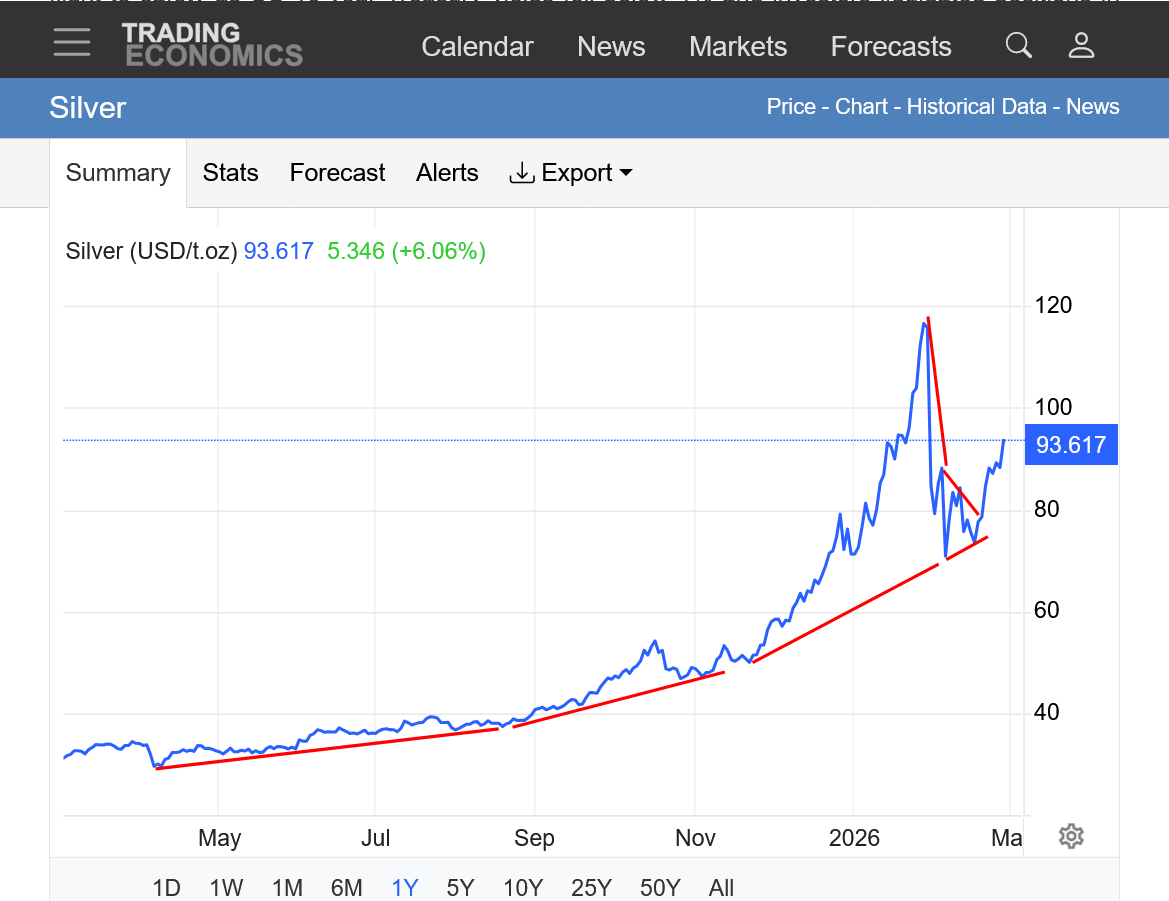
1. 10 years: Parabolic/exponential move with increasing slope and spike high.
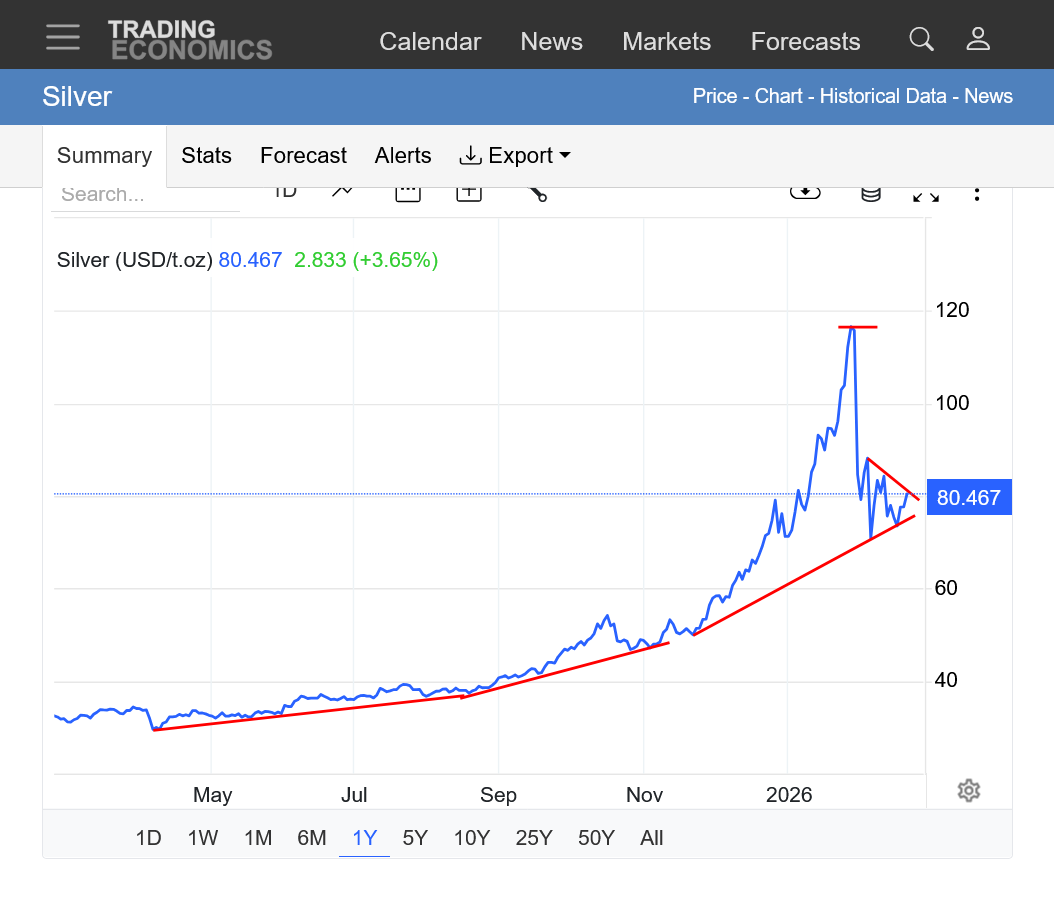
2. 1 year: Major top with new triangle/wedge featuring higher lows and lower highs/symmetrical wedge. Is this a bear flag or bull flag?
3. 1 month: symmetrical triangle/wedge. Higher lows/lower highs. Have we broken out above the apex?
4. 1 week: New highs for the week: bullish week/short term
In gold we have broken higher out of the triangle
Is gold taking aim at the highs earlier this year? Bulls have regained the advantage again.
https://tradingeconomics.com/commodity/gold
1. 1 year: Upside break out from bull flag!
2. 1 month
Silver bulls are also back in the drivers seat!
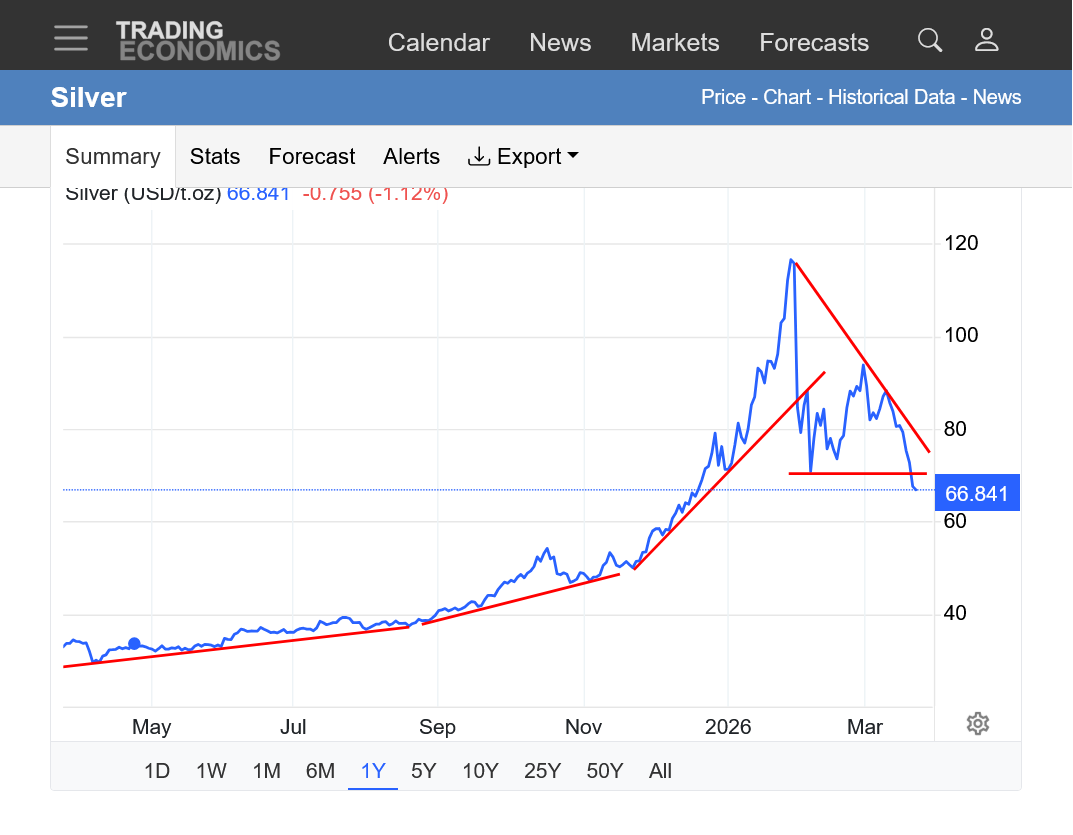
https://tradingeconomics.com/commodity/silver
1. 1 year: upside break out from bull flag which is a continuation pattern.
2. 1 month: Breaking out above resistance and previous reaction highs of the bull flag formation. The way overdone January high is a looooong way up on the price chart.
Gaps higher on the open likely!
I've been neglecting the metals from lack of time.
However, it was extremely significant last evening that gold was actually LOWER, when similar news in the past caused it to be sharply HIGHER. Bull markets that can't react to very bullish news anymore are sending a strong signal!!
https://tradingeconomics.com/commodity/gold
1. 1 week with open last night NOT gapping higher. This also caused us to sell off but enough buying emerged at last weeks spike low to (temporarily?) to prevent a nasty technical formation on the charts for the bulls.
2. 1 month: Numerous lines drawn. This could be a symmetrical triangle(lower highs +higher lows), with several different triangle lines ORRRR it could be a BEARISH descending triangle with lower highs and horizontal lows, which I would be leaning towards after the lack of reaction up on bullish news.
3. 1 year: Uptrend still intact. Potential symmetrical triangle this year. We're approaching the apex. Either we break out or the formation turns into something else beyond the apex.
4. 10 years: Still have the long term exponential/parabolic move but it could be failing here/losing steam from losing momentum and from factors mentioned above.
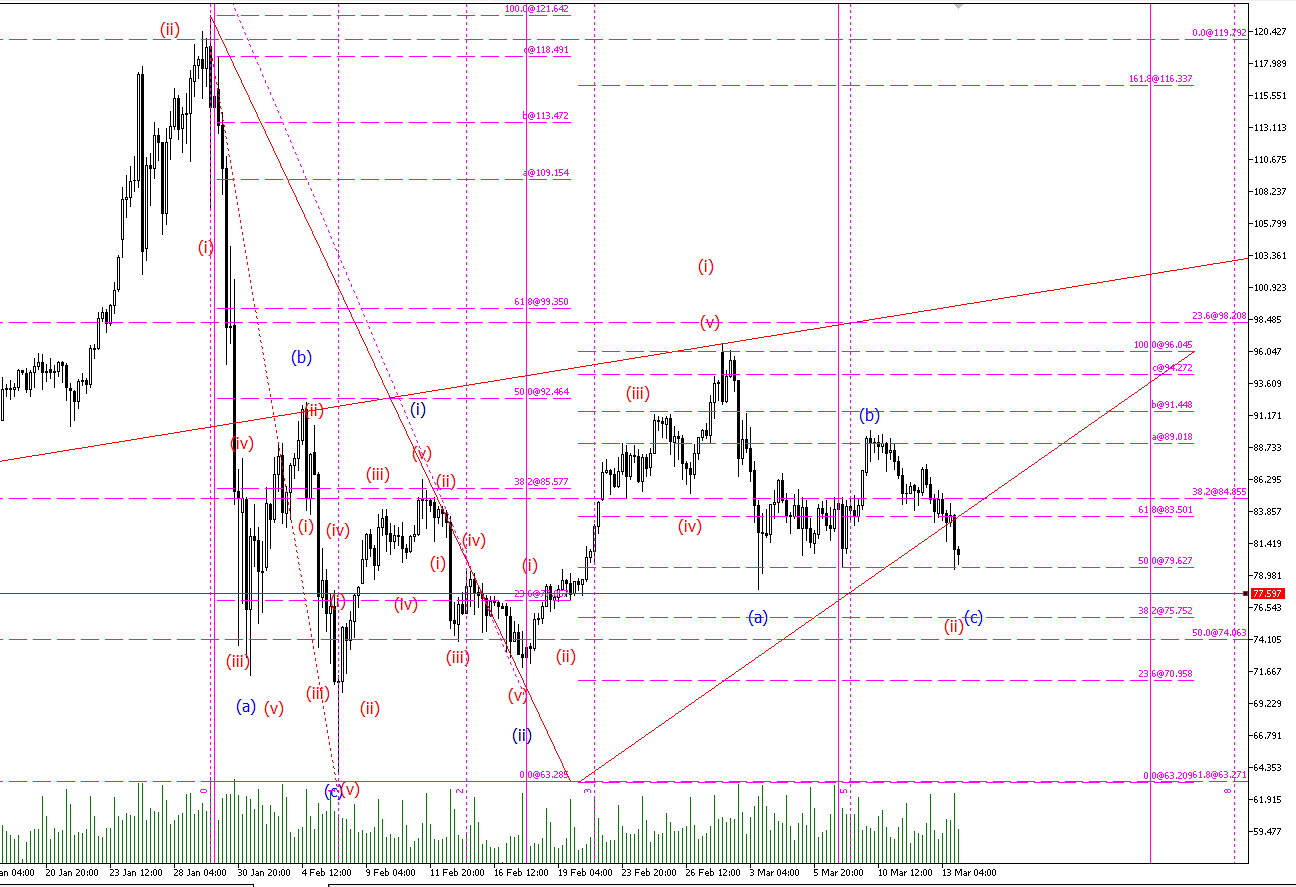
4H Wave cycles and see how market react when New York opens
Thanks much, fayq!
I've been focusing more on weather today and appreciate this.
The metals markets are dialing in an increasingly WORSE RECESSION.
During a recession, industrial demand for silver plunges. The unprovoked, unjustified Netanyahu/Trump war and its huge hike to energy/fuels costs and its inflation imposed on consumers greatly adds to the already floundering economic indicators and make the recession likely.
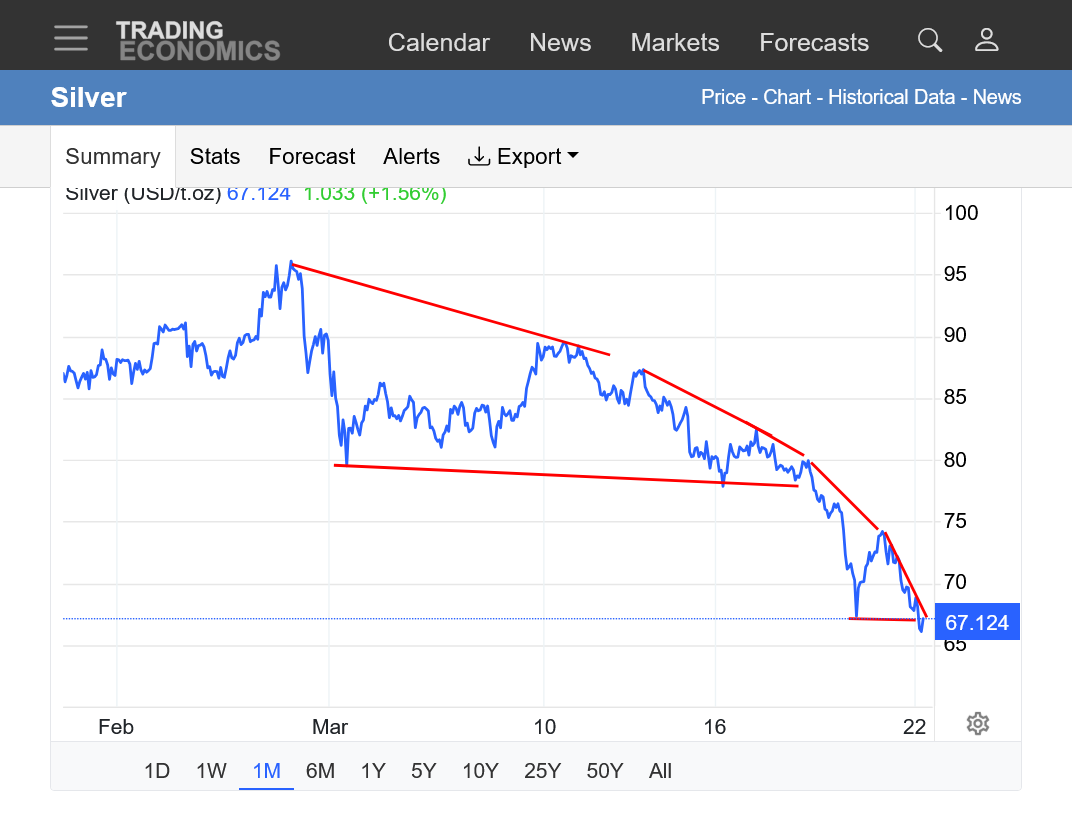
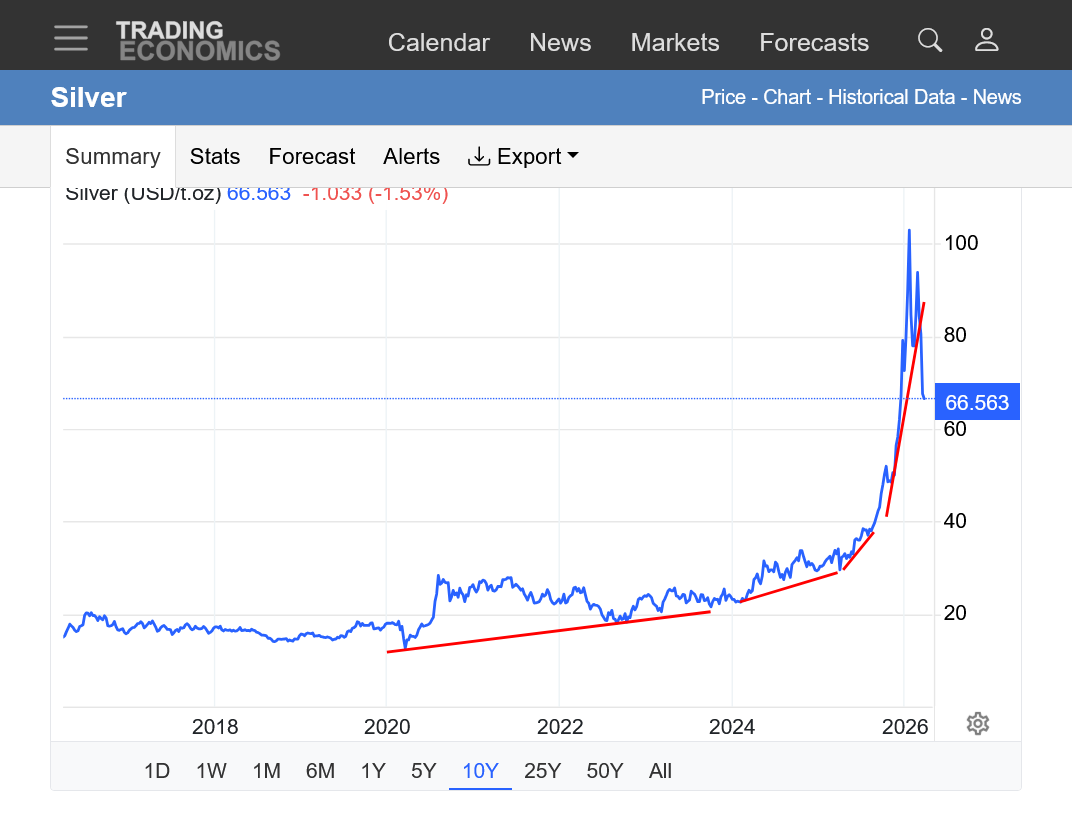
https://tradingeconomics.com/commodity/silver
1. 1 month. ACCELERATING down since the attacks on Iran in proportion to the expectations of economic damage from continuing high fuel/energy prices based on the latest bearish news. We might not recover until the war ends or the Gulf of Hormuz is wide open again.
2. 1 year.: MAJOR all time record high(blow off top) just 2 months ago. We had an incredible gap and crap, buying exhaustion, reversal lower near the end of January. We broke the original parabolic/exponential uptrend with a new downtrend well established. Potential downside break out right now from a descending wedge/triangle
3. 10 Years: The exponential, parabolic part of the move IS OVER!!!! Where will we find enough buying to stop the slide lower which
Gold has been getting hammered too, starting exactly when the unjustified, unprovoked Netanyahu/Trump war in Iran started! The market is trading a potentially, worsening GLOBAL recession as well as Fed rate HIKES to battle energy/fuel market inflation from the huge drop in global crude supplies while the Gulf of Hormuz is shut down.
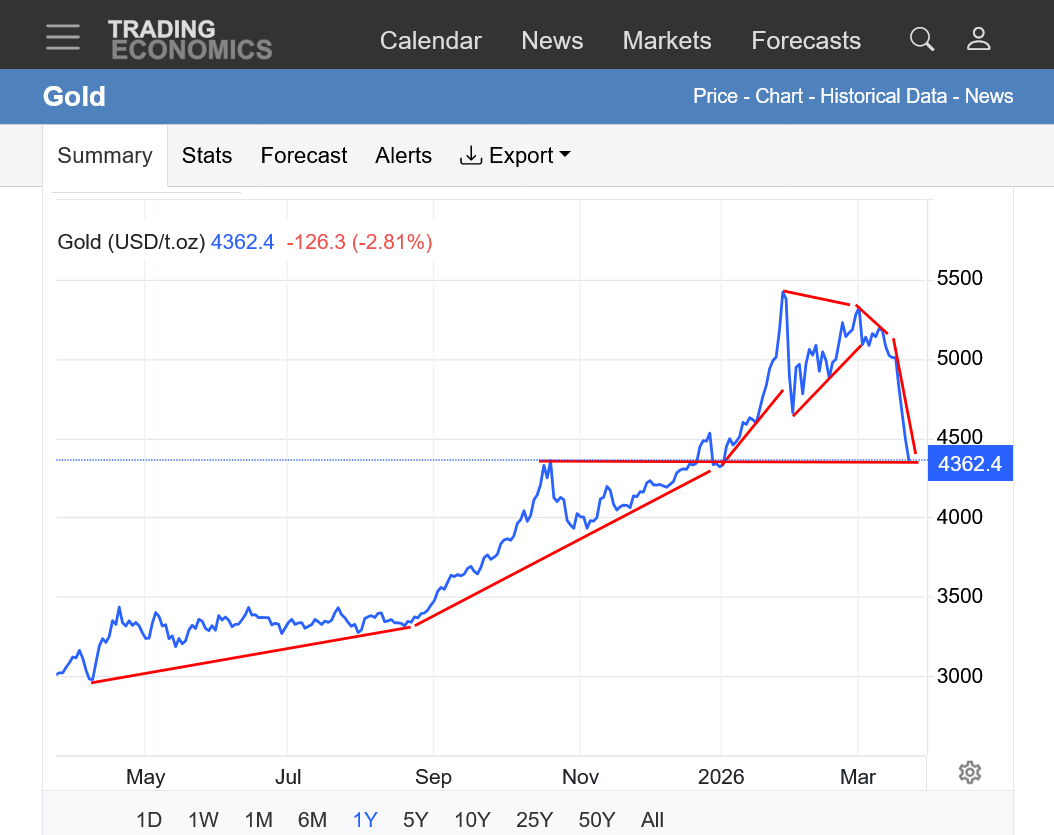
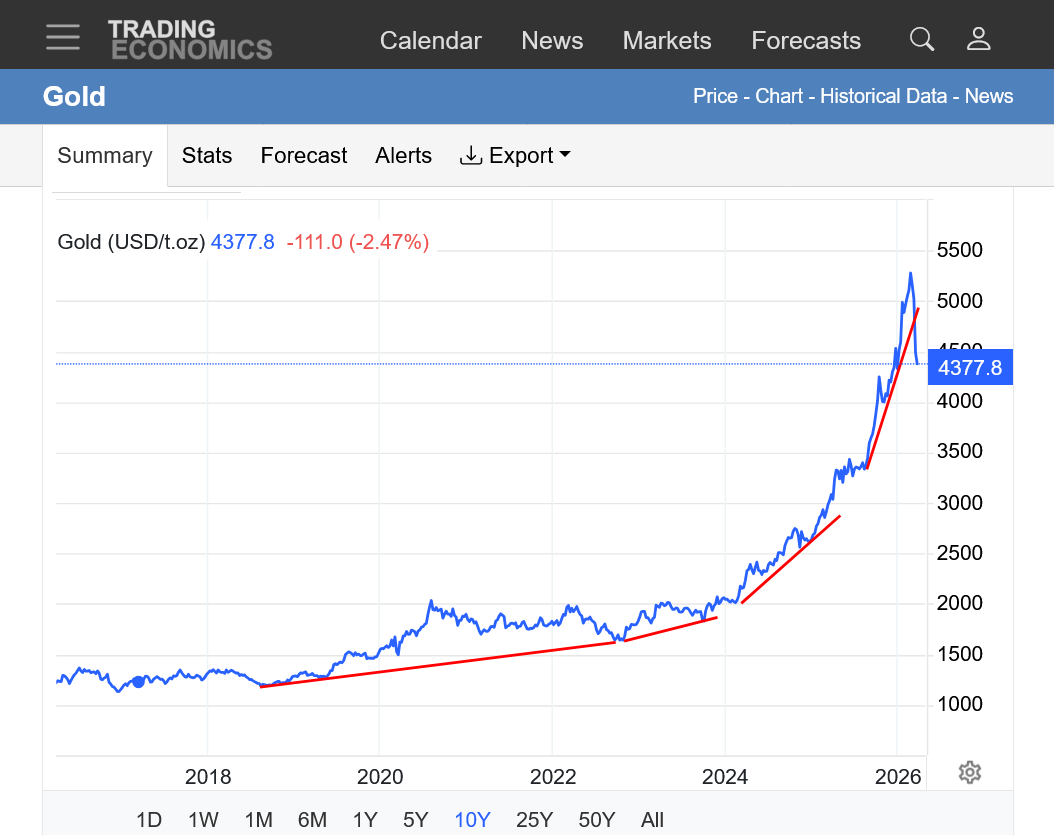
https://tradingeconomics.com/commodity/gold
1. 1 month: March 2nd, Sunday night was the high at this time frame. Since then, the downtrend has been ACCELERATING with a steeper and steeper slope to the down trending channel as the market dials in increasing economic damage from the war.
2. 1 year: Major high at the end of January. What looked like a potential bull flag/correction after that ABORTED abruptly, immediately after the attacks on Iran and is a BEAR flag that failed before testing the previous high. With a rapidly acceleration downtrend(steepening slope. Potential support in this area but a market collapsing lower at this accelerating rate is impossible to trade from the long side.
3. 10 years: The parabolic/exponential move is over!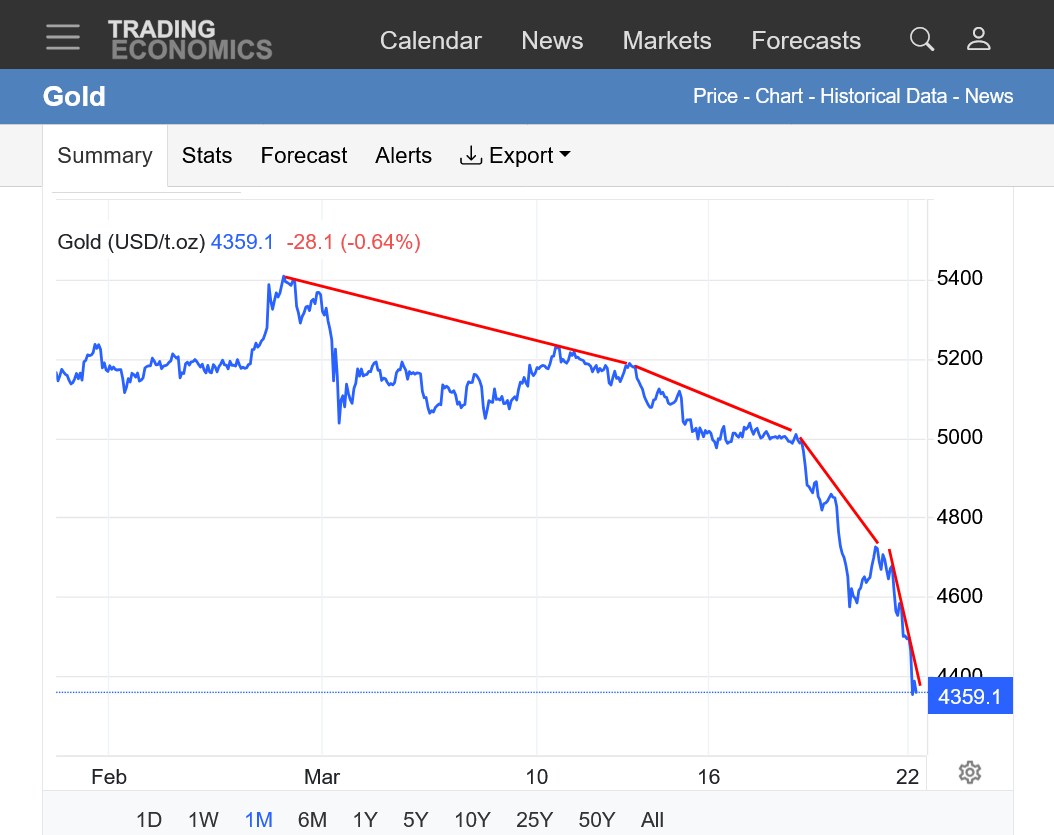
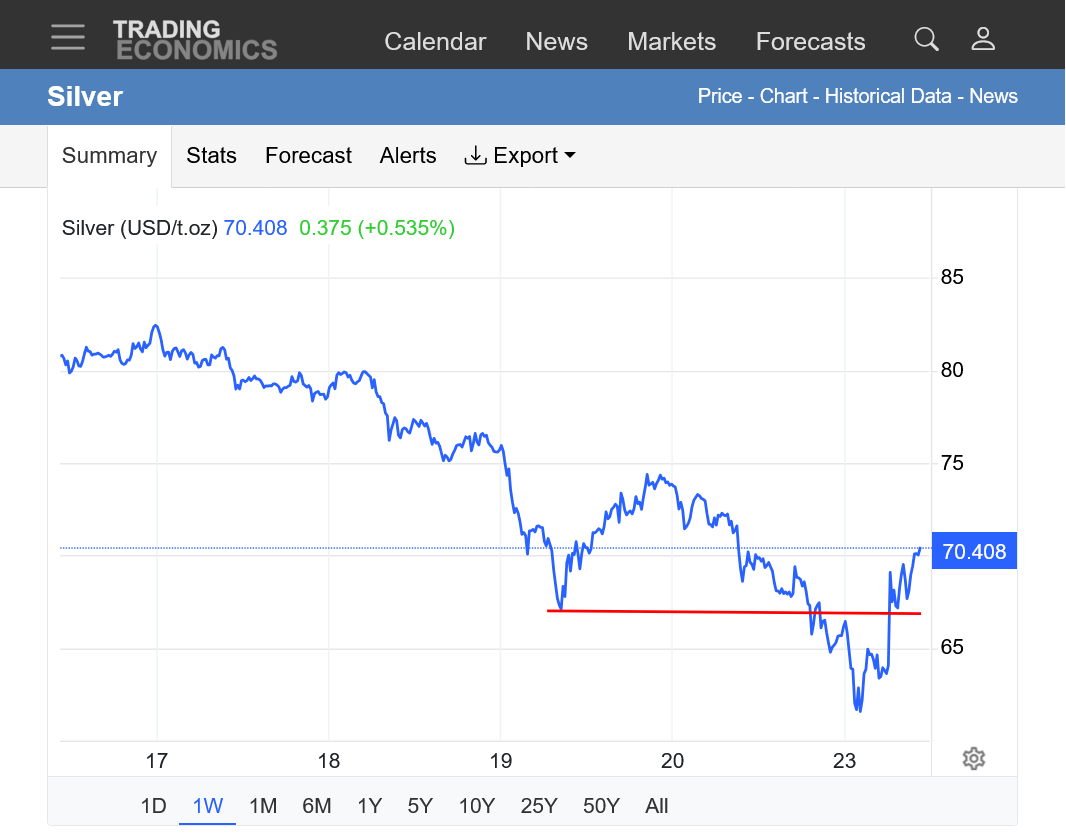
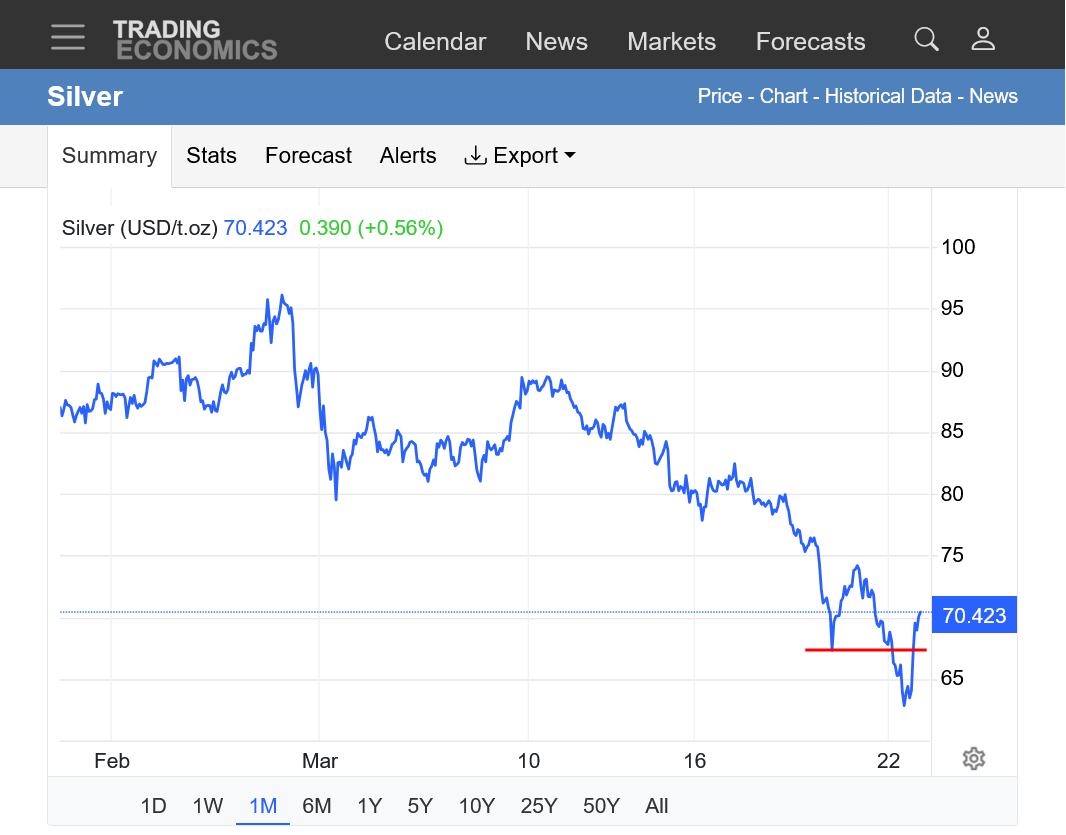
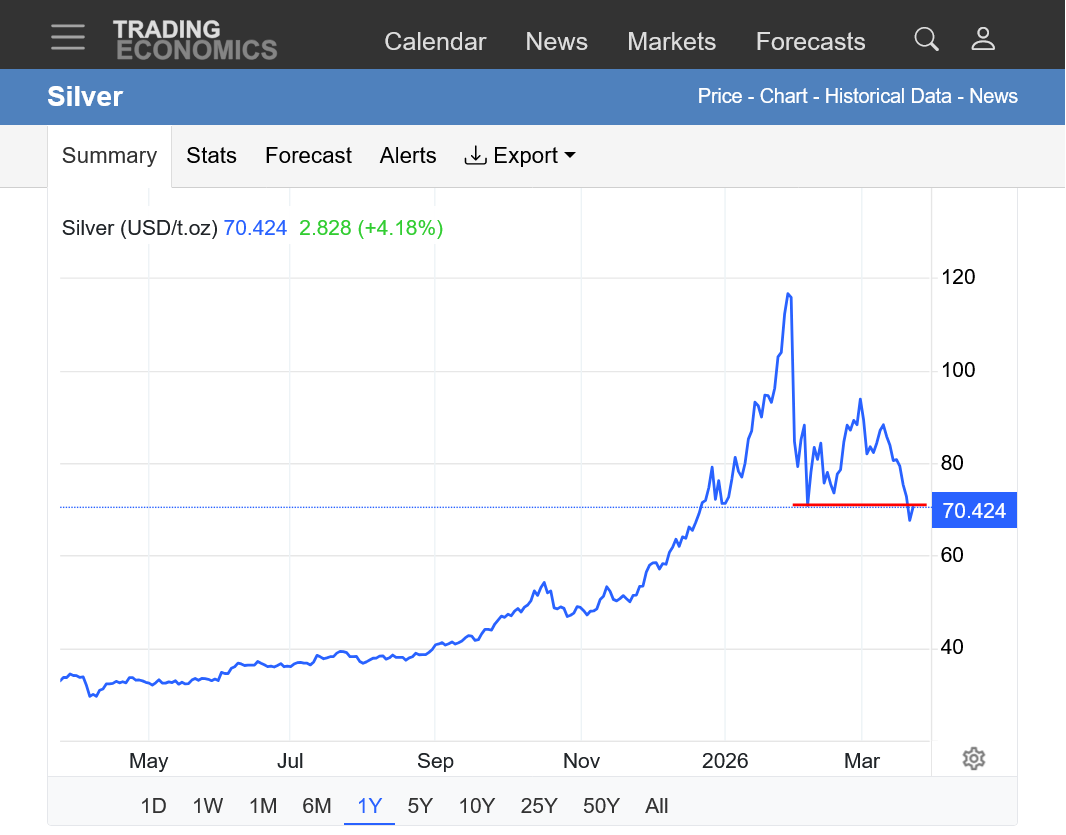
Potential reversal up in silver overnight!
https://tradingeconomics.com/commodity/silver
1. 1 week
2. 1 month
3. 1 year
21 March 1980 and 46 year LAter 2026 and 121-46=? so important chart point !!