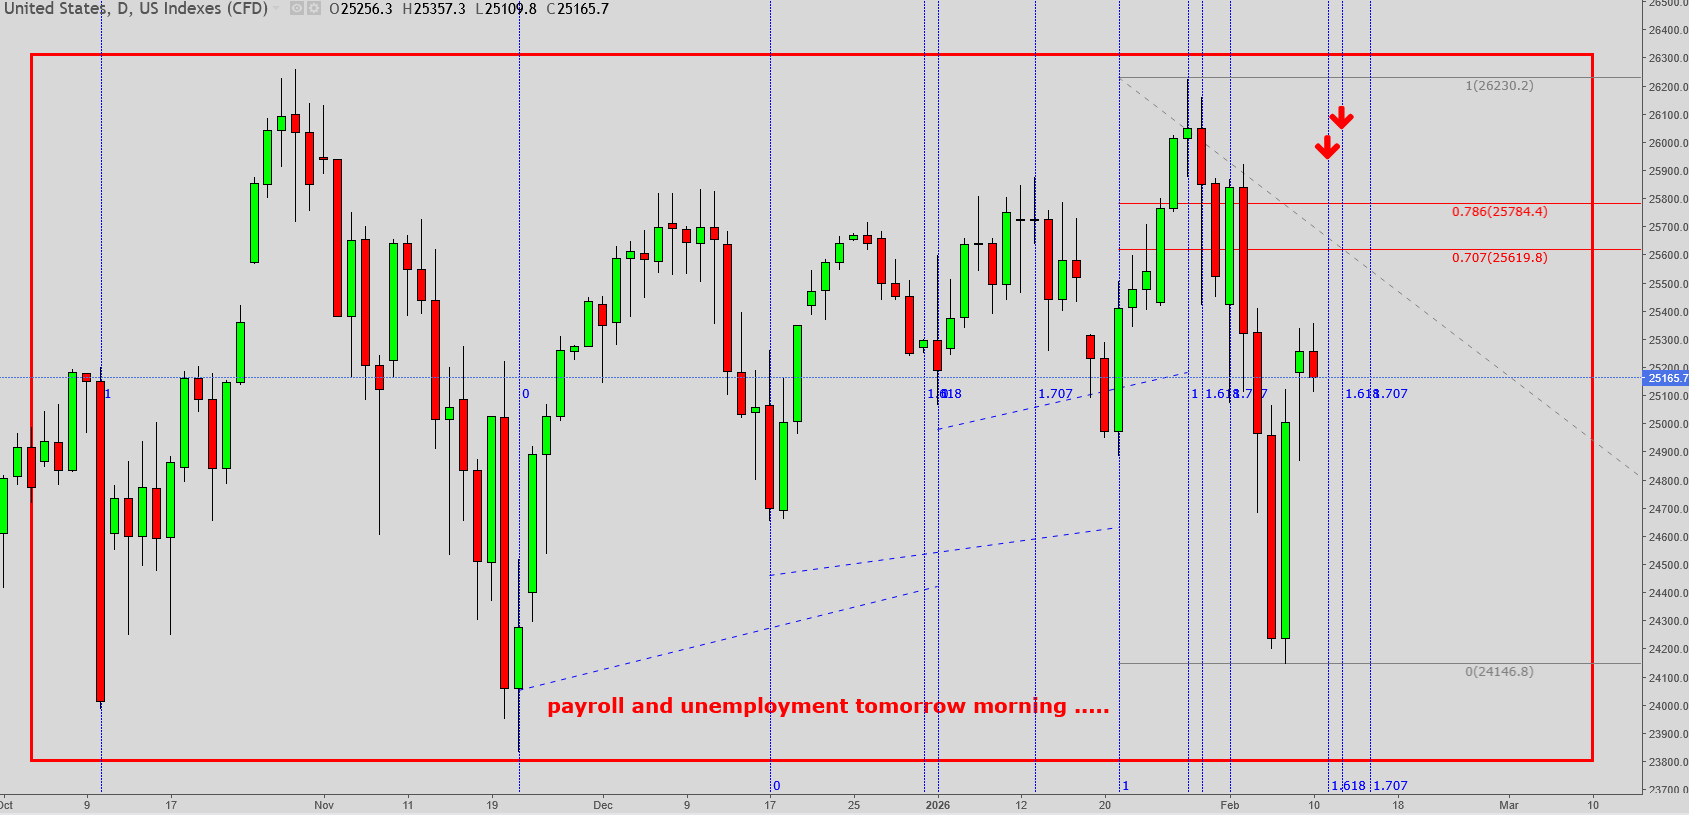
This long term sideways move in the NASDAQ may come to an end in the next day or so ... !
Other indexes DOW and ES may go a bit higher still since the DOW set a new high recently .
Thanks very much, kris!
Are you predicting a direction for the break out? Down I'm guessing based on your posting?
Previous thread:
Short 1 Emini S&P
43 responses |
Started by joj - Jan. 14, 2026, 3:35 p.m.
imho we'll be going down, yes .
Thanks, cutworm!
The case for the rounding top the past SEVERAL months has only gotten stronger this month and week!
https://tradingeconomics.com/united-states/stock-market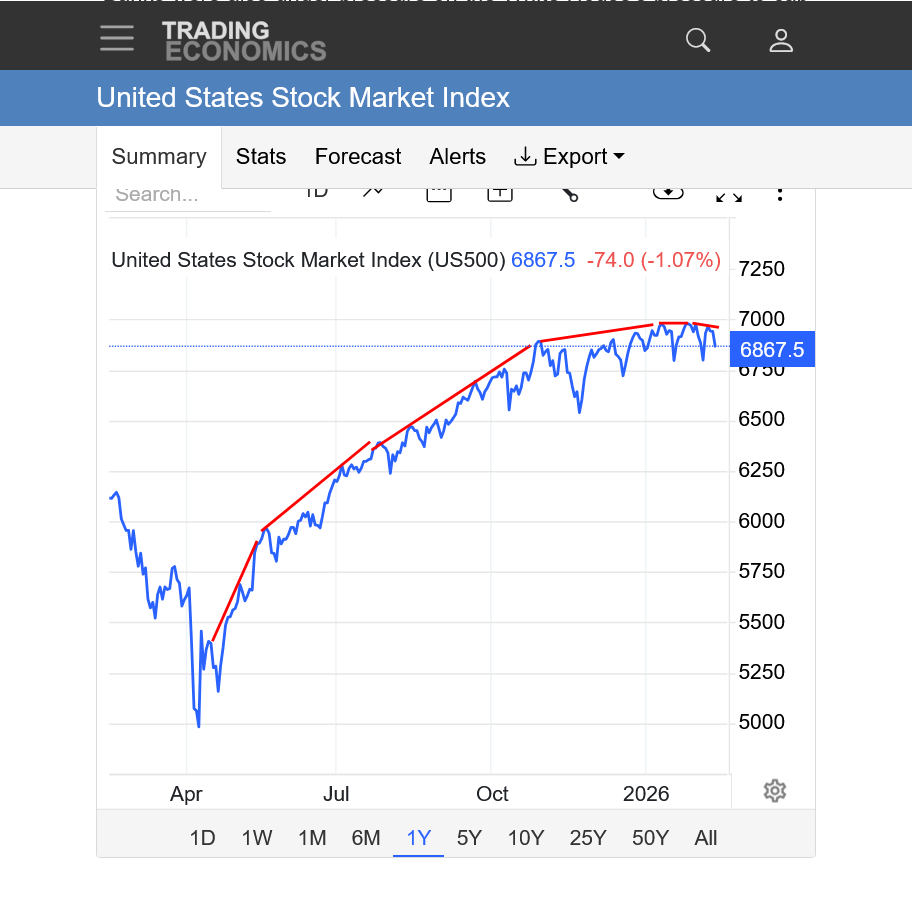
Previous explanation:
By metmike - Jan. 15, 2026, 10:16 a.m.
Rounding Top Pattern Explained: How to Spot Market Reversals
https://www.ebc.com/forex/rounding-top-pattern-explained-how-to-spot-market-reversals

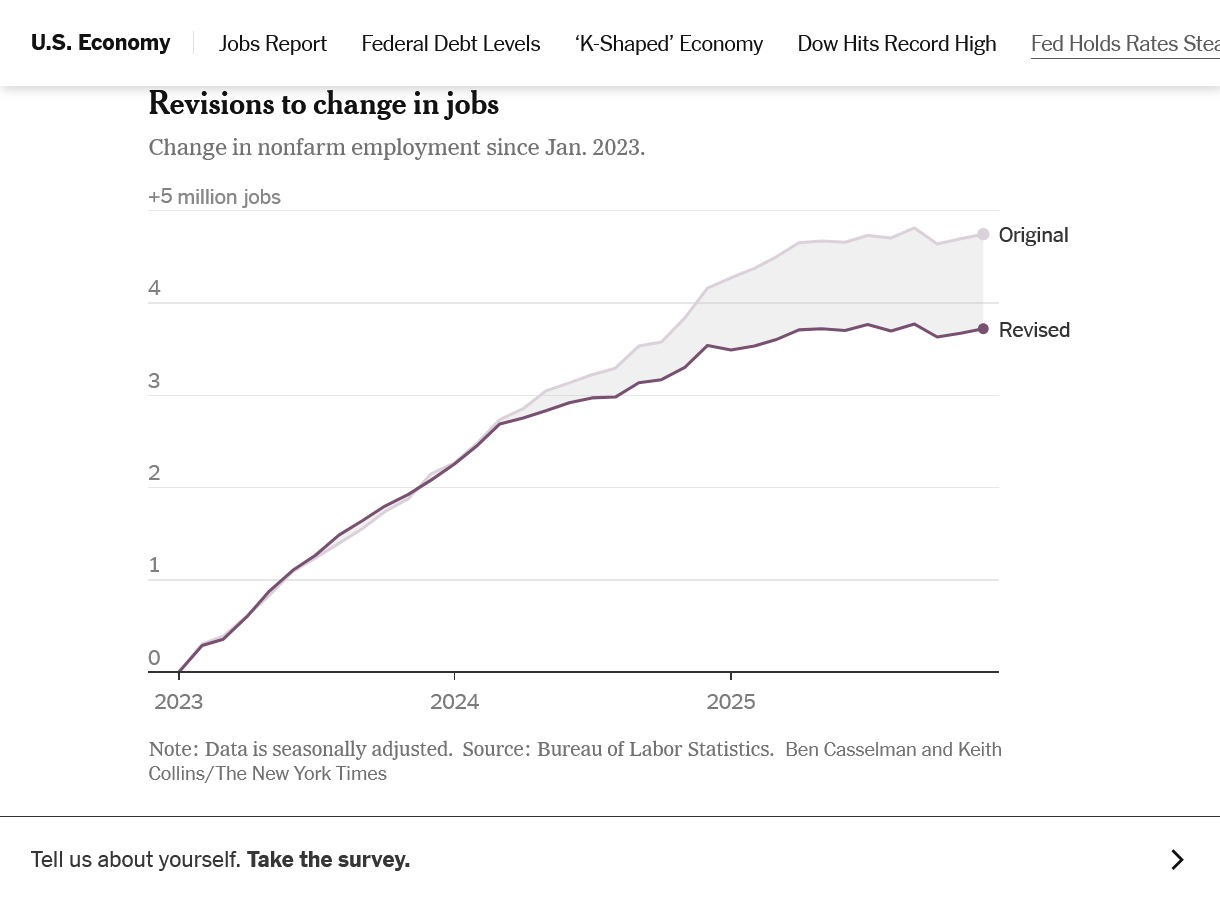
It's extremely likely the jobs number we just got was over stated for the same reason every jobs report last year was over stated......by a lot!
This trend of extremely over stating jobs didn't ramp up until 2025, under Donald Trump.
Annual revisions show that employers added far fewer jobs in 2024 and 2025 than previously estimated.
https://www.nytimes.com/2026/02/11/business/economy/january-jobs-report-revisions.html
Interesting time for sure, kris! A little bounce today so far.
No gains/ losses; another doji on three out of the four majors (russell only one producing anything positive)
Y'all have a great weekend !
Thanks again, kris. You're ON it!
Bad close for the week(but good for you)!
This market trades news but in many markets, that's a set up for a gap lower to start next week.
https://tradingeconomics.com/united-states/stock-market
President's day sale .... 10% off ... ?!?
We will be in bear territory for a few weeks at least, maybe till spring, trade safe friends !
Good one, kris!
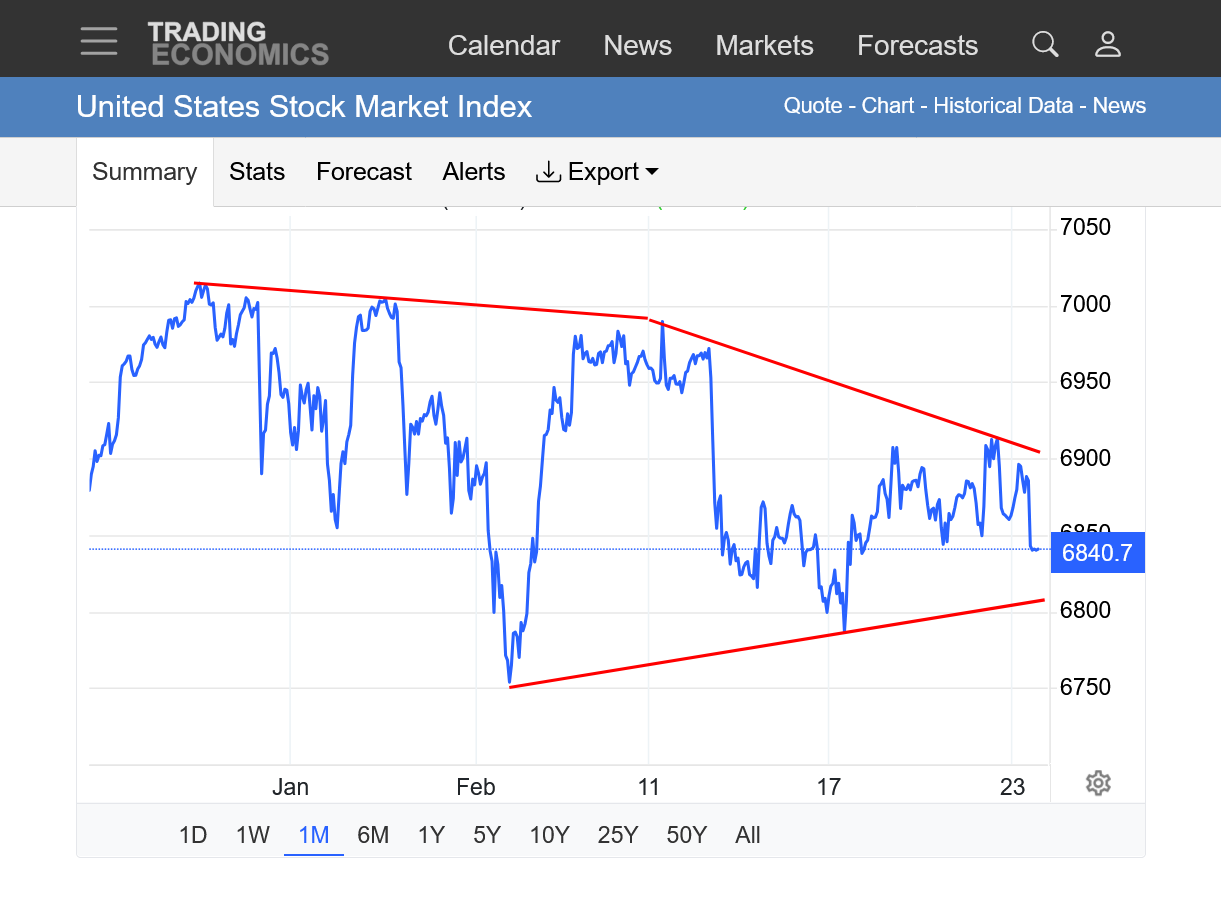
Potentially a very critical area here.
https://tradingeconomics.com/united-states/stock-market
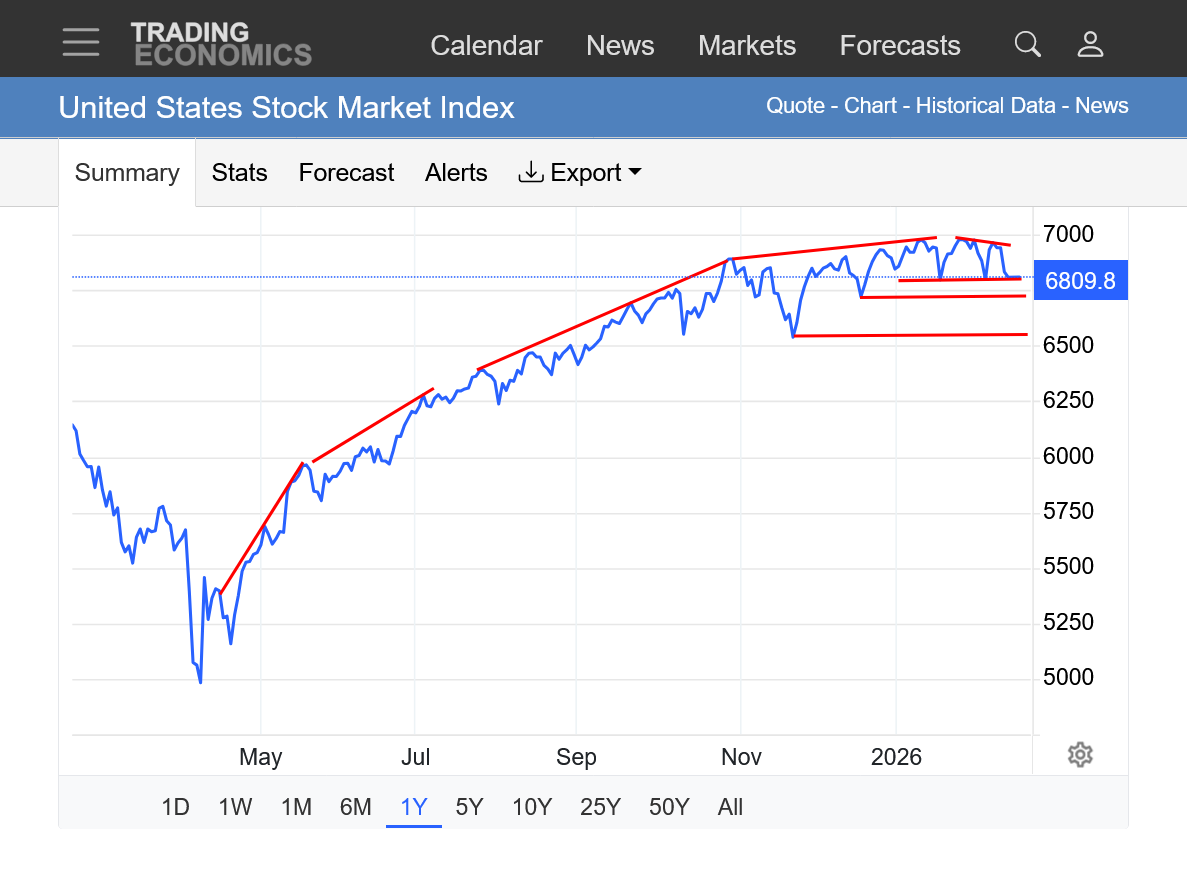
1. Continued rounding top formation as the market runs out of steam with a decreasing slope of the uptrend the past 9 months as the market loses momentum. Potentially turning the corner this month with LOWER highs and the beginning of the downtrend after the trend flattened out last month. This can be quickly violated with decisive new highs that hold.
2. First horizontal line is the 2026 lows. We are sitting there right now about to break them?
3. 2nd horizontal line was the December low/support.
4. 3rd horizontal line was the November low/support.
5. This is the graph of: "The United States Stock Market Index (US500) = 6810.1" As kris has told us numerous times, different indices will give us a different picture based on the type of stocks in it. Some have been making new highs and looked strongest while others not so much. I picked this one a long time ago at random, partly because its free and easy use on MarketForum, not because I know alot about stocks and think this is the best.
I like doing technical analysis but have never traded the stock market, like kris, joj, tjc and cutworm and others here. Energies(NG) and grains are my area of trading expertise using weather.
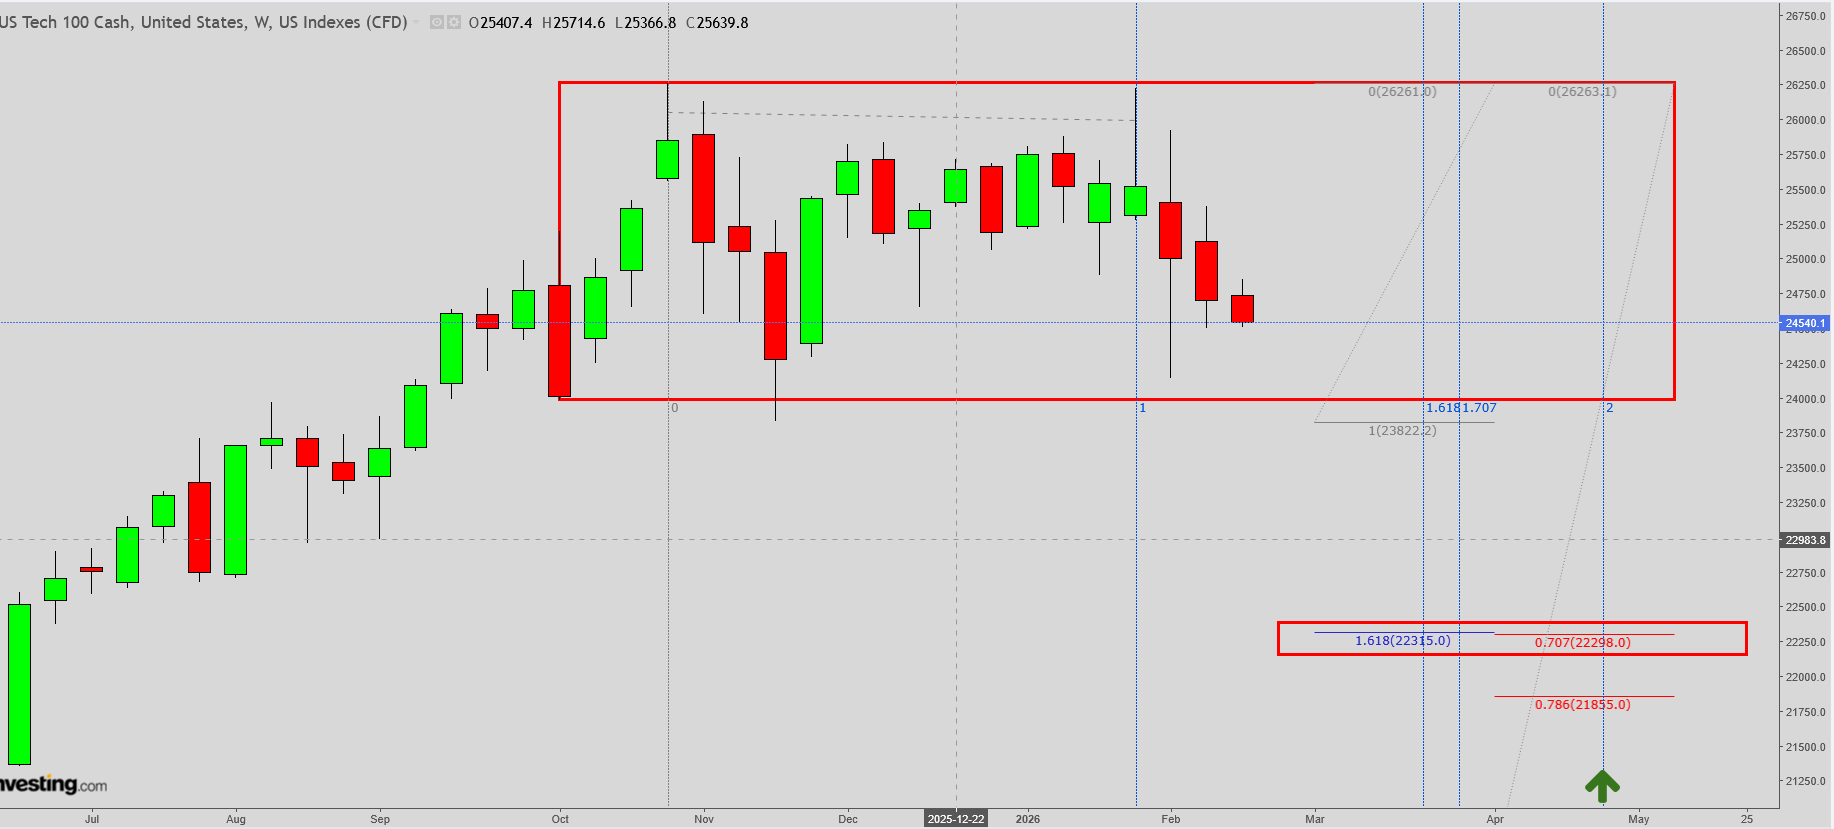
The above chart is the NQ weekly as of now .
When we get out of the rectangle (just a matter of when/not if) all bets are off ... !
The chart above may give some people a road map .
Trade safe my friends !
Very interesting trading continues!
https://tradingeconomics.com/united-states/stock-market
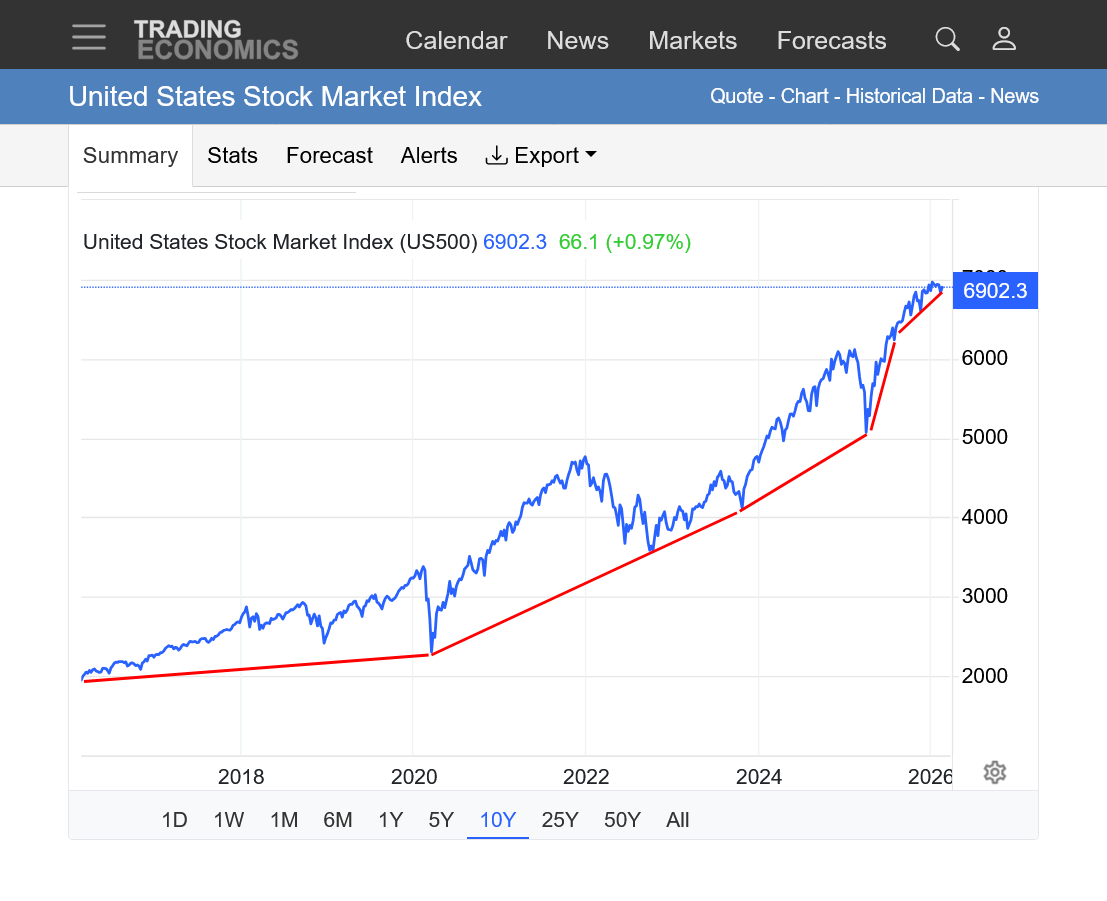
1. 10 years. Previous parabolic/exponential move losing steam but still in an uptrend.
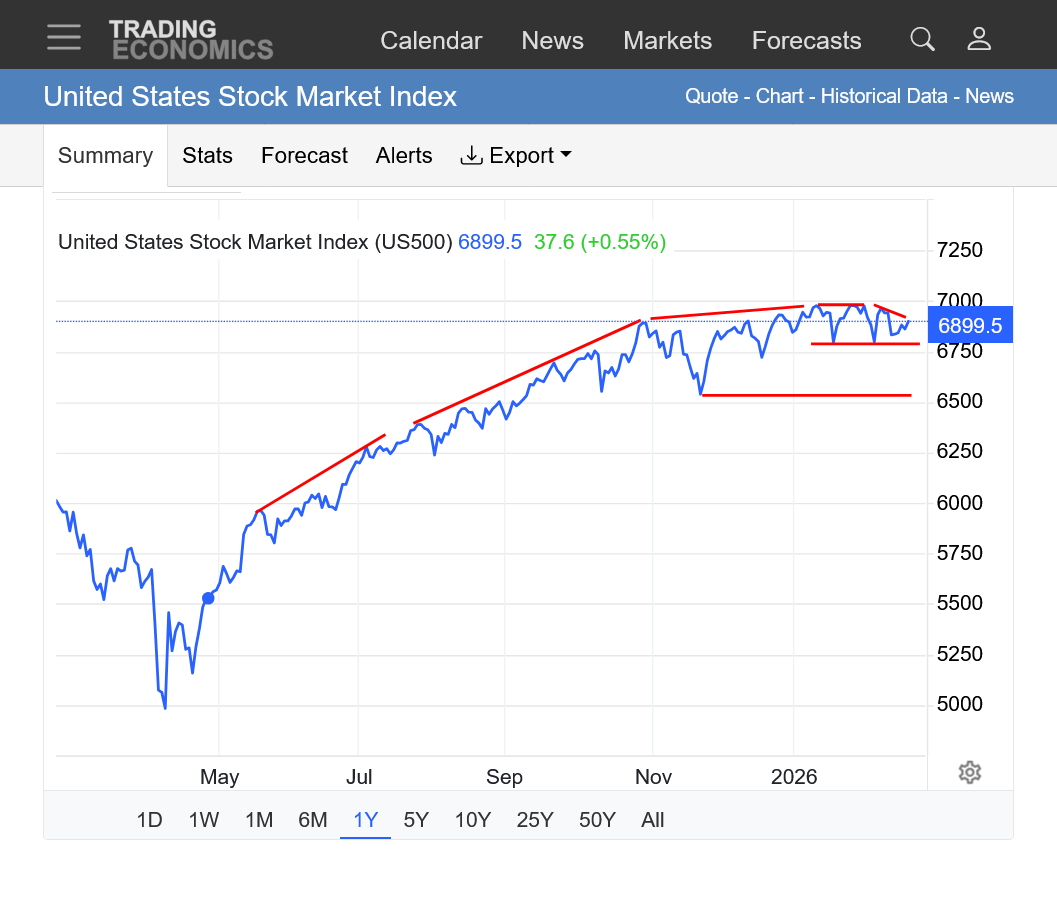
2. 1 year: Rounding top formation(need decisive new highs that hold to violate this formation). Still an uptrend with horizontal support lines for 2026 lows and November 2025 lows.
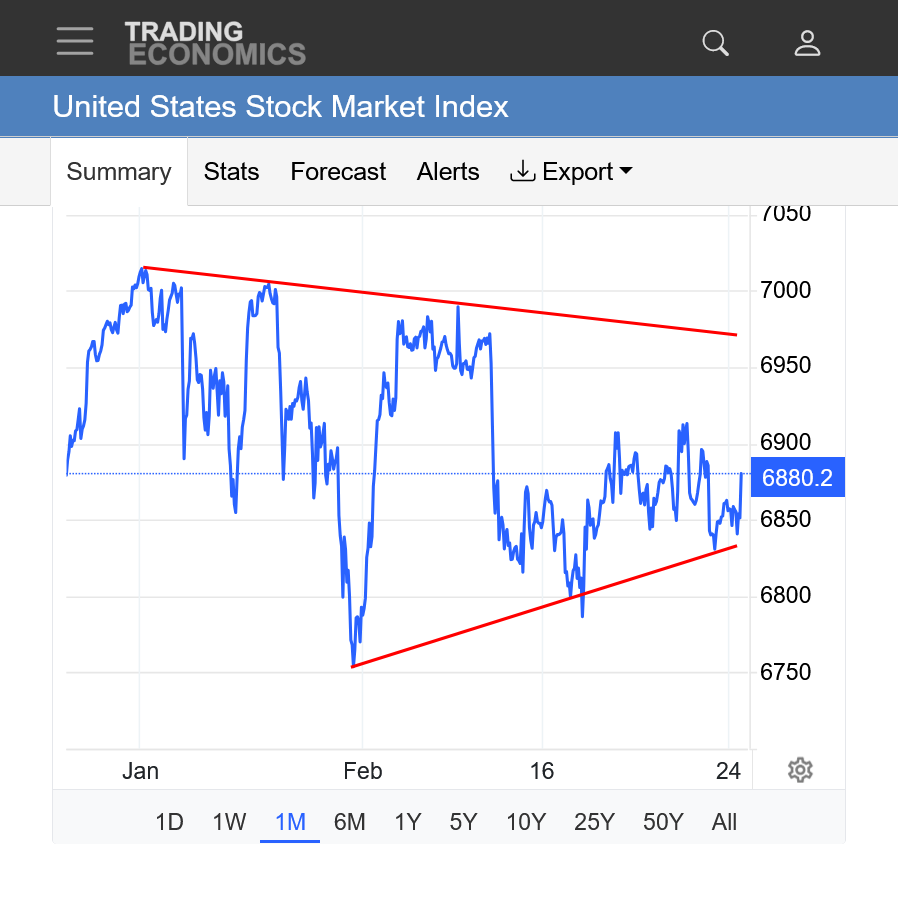
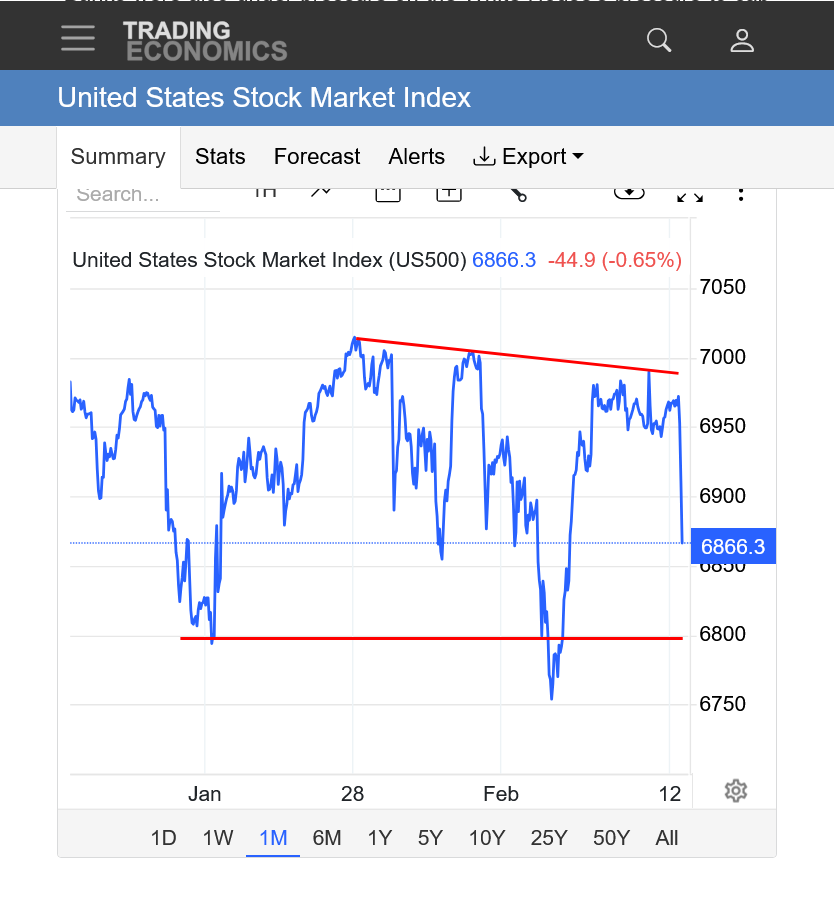
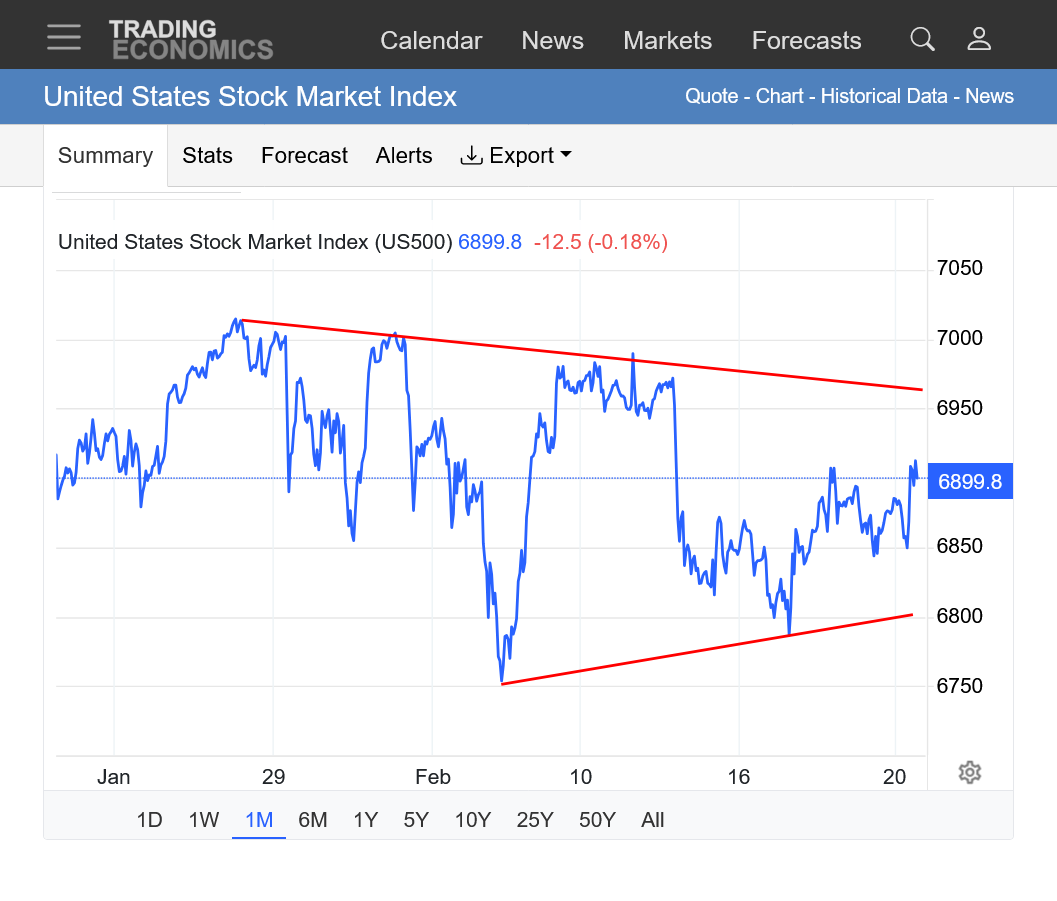
3. 1 month: SYMMETRICAL TRIANGLE! Lower highs and higher lows.
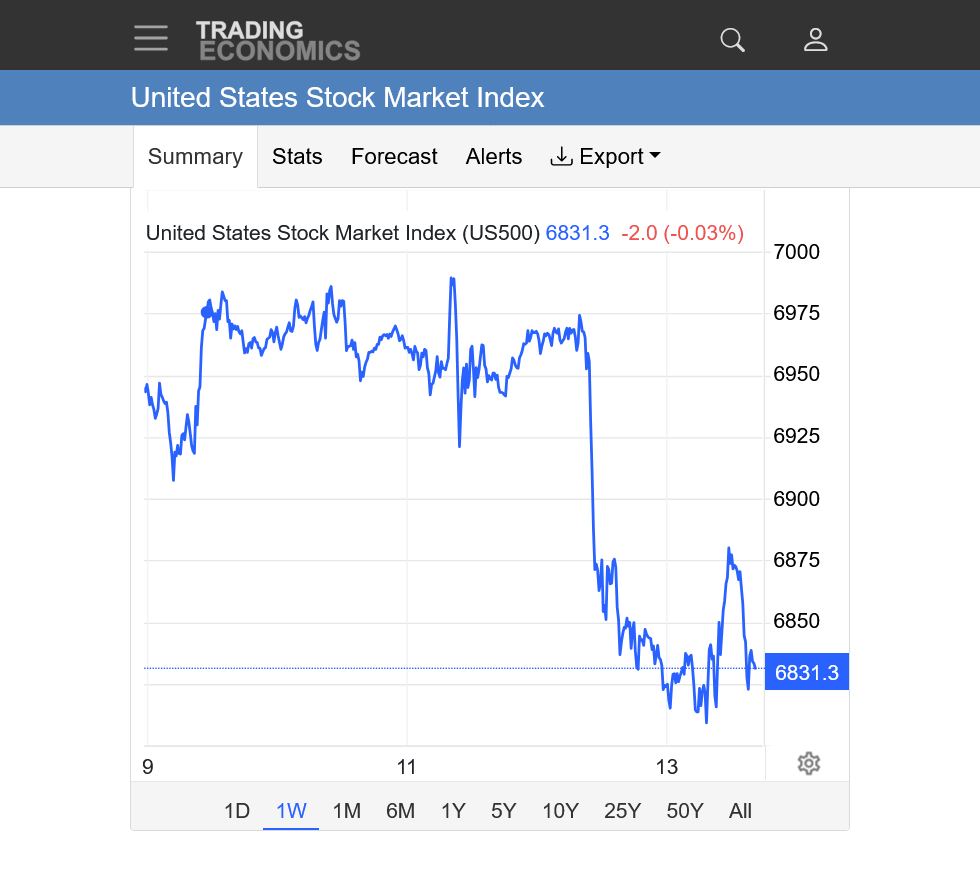
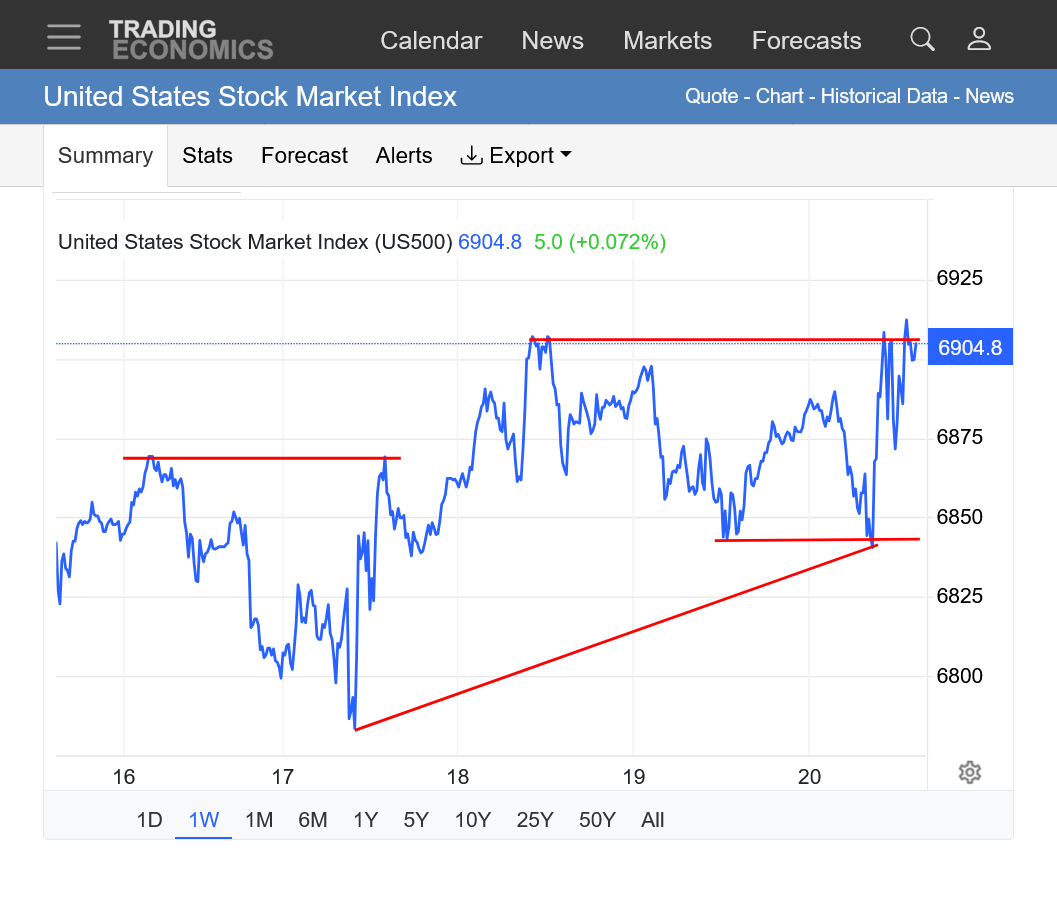
4. 1 week. Bullish close on the high.
The stock market continues to trade the rounding top formation with the market on the BACK SIDE of the top now.
It's lost momentum!
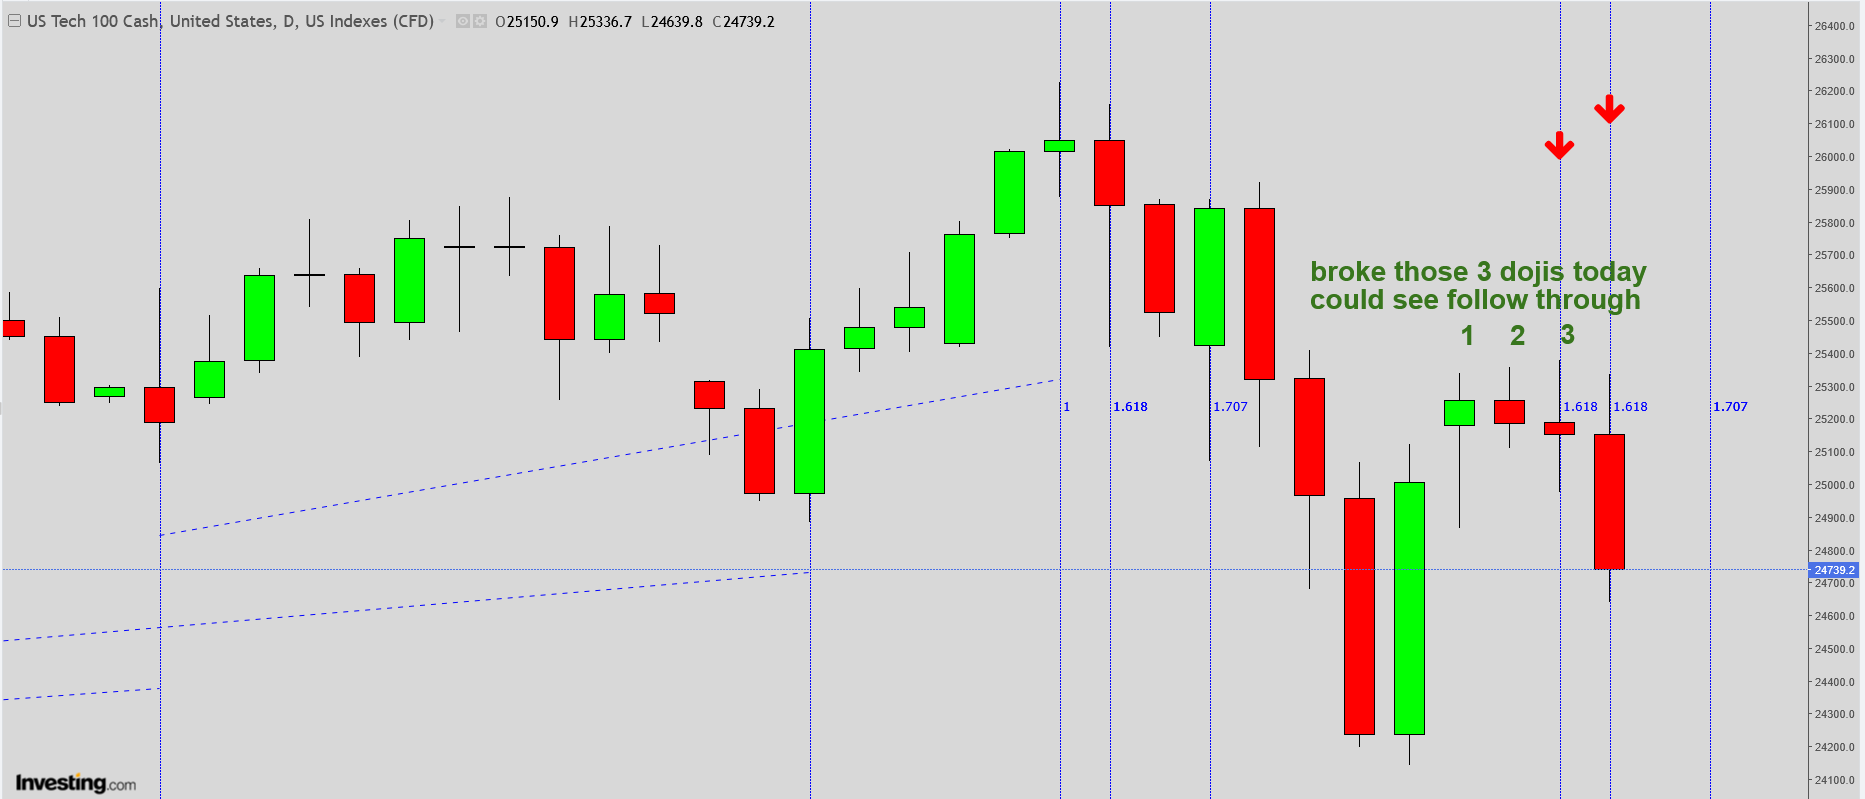
The 1 month chart below is still in the same symmetrical triangle/wedge formation(higher lows +lower highs) from late last week but now with the bears having the advantage and a downside break out from the wedge more likely than the upside after today's strong negative price movement.
To be honest, I'm amazed that the stock market has held up this long considering all the bad news.
If I traded stocks, I would be tempted to short here but no telling what sort of surprising news will hit from the most powerful but most unstable man in the world.
++++++++++++++++++++
Added: The rounding top formation described previously will be violated by decisive new highs that hold. The symmetrical triangle below suggests uncertainty, with the bulls buying at higher lows and the bears selling at lower highs.
A break out does not necessarily mean prices will continue in that direction with so many levels of support and resistance outside of the breakout which is bound to happen because the COILING pattern is approaching an apex and HAS TO break out in 1 direction before that.
https://tradingeconomics.com/united-states/stock-market