Aside from my general bearishness I took note of NVDA earnings being good and the stock getting hit this morning. Bearish action in my view. I usually sell short on weakness not strength.
Risking today's high.
(Please move to TR)
Thanks very much, joj for sharing with us!
Previous thread:
NASDAQ / DOW / S&P
17 responses |
Started by kris - Feb. 10, 2026, 5:55 p.m.
RIsk is ok and i am short @ 6972 l@@king for add on spike and tgt 6832 ish and mid march 6612/6565 area
Great stuff!
https://tradingeconomics.com/united-states/stock-market
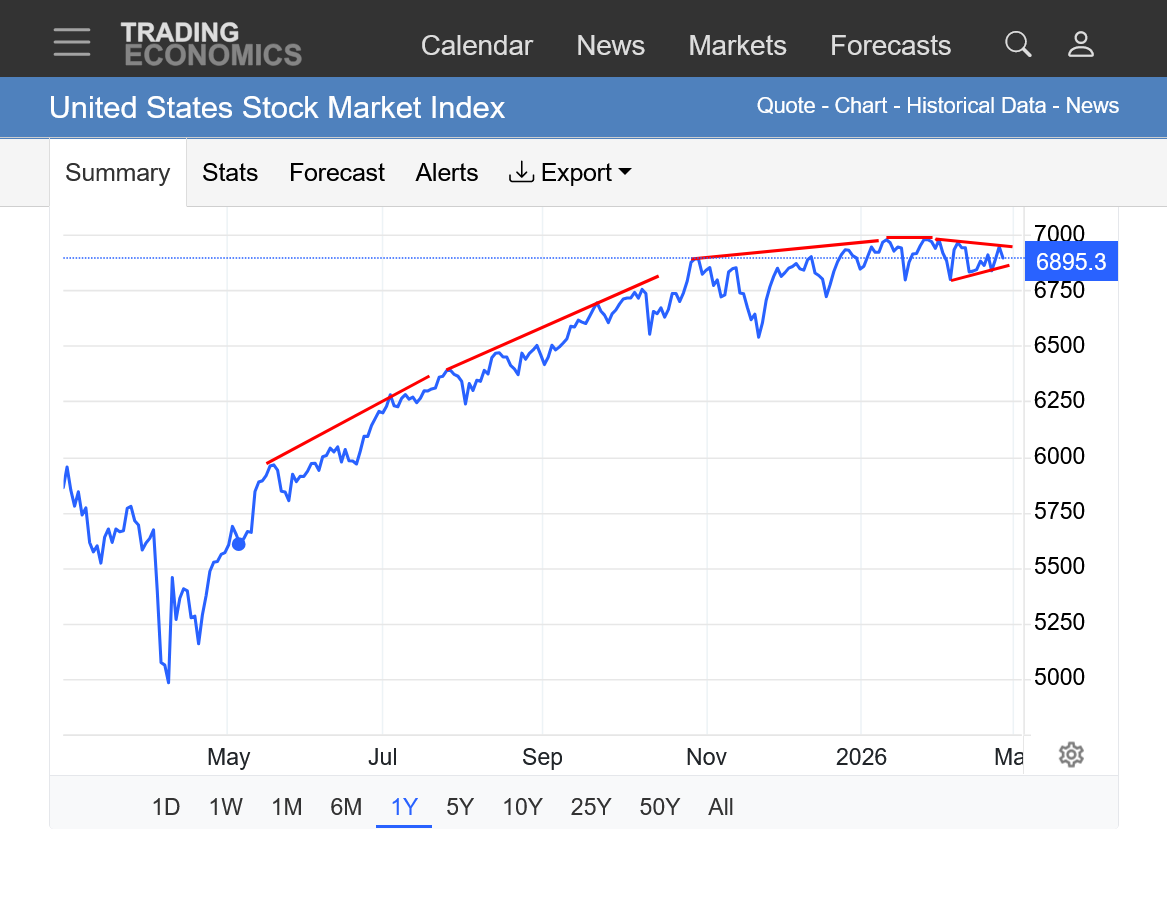
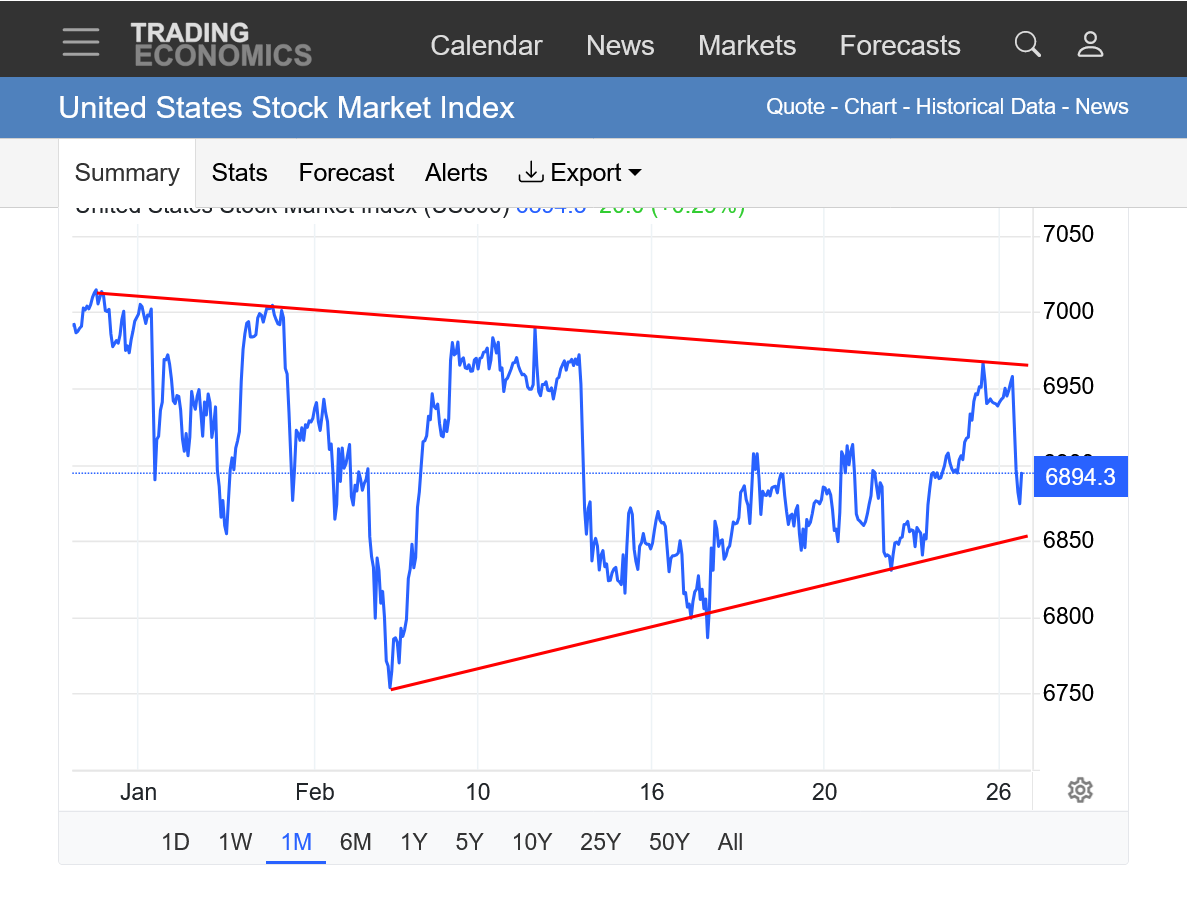
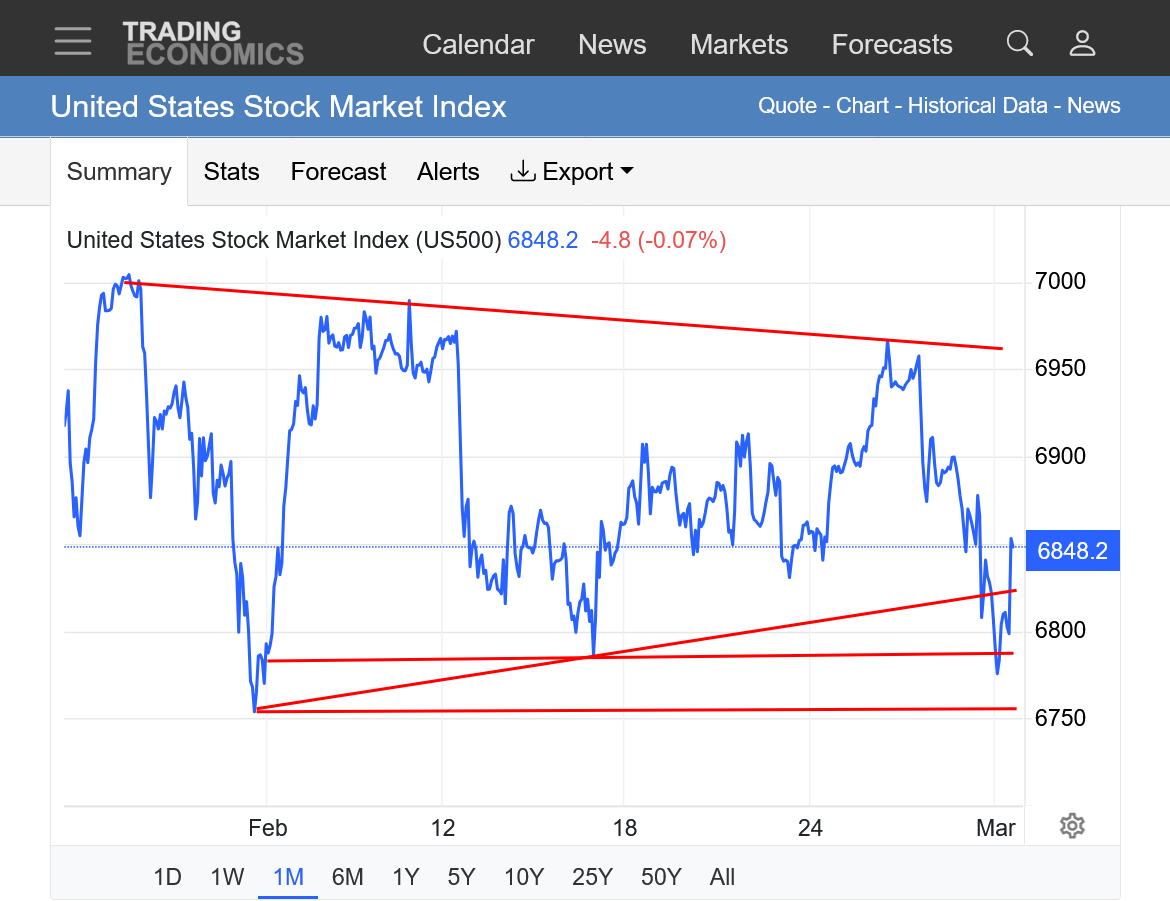
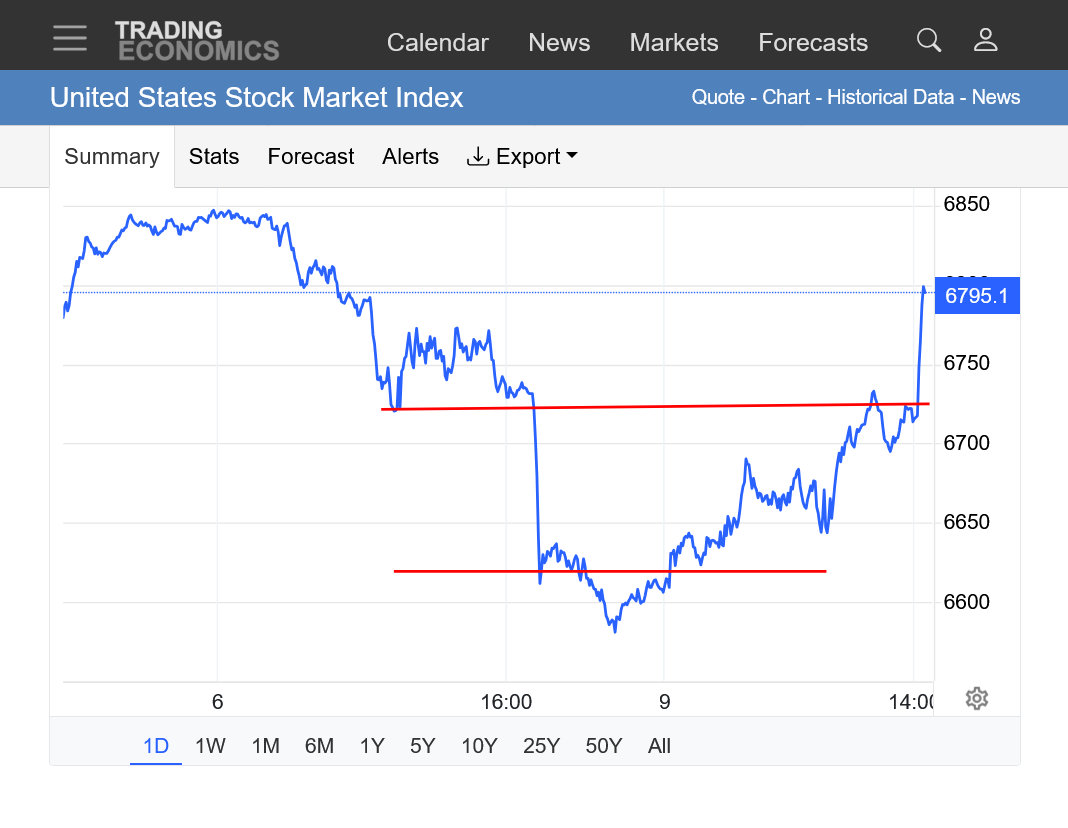
1. 1 year: Rounding top formation with the market coiling this MONTH/symmetrical triangle. The market has lost momentum with a decreasing upslope in 2025 and now, possibly rounding to the other side of the potential top with a downslope favored early in 2026.
2. 1 month: Unusually well defined symmetrical triangle/wedge(lower highs and higher lows). The apex of the triangle is getting closer and closer with the range between highs/lows getting more and more narrow. So either the downtrend OR uptrend will be violated( in this coiling formation) it’s inevitable. There will still be layers of resistance and support to overcome after that as seen from previous highs and lows on the graph. Trendlines only tell us about the past which CAN be helpful in understanding the future. A huge piece of breaking news that the market didn't know in the past can change the outlook. Or as joj stated, the markets REACTION to the news can be a strong indicator by itself. (market goes up on bearish news or down on bullish news, for instance)
Stop moved down to 6902 which would be a scratch trade.
Very nice, joj!
That's how you reduce risk/exposure with a trade in an uncertain trade/market (during trading hours).
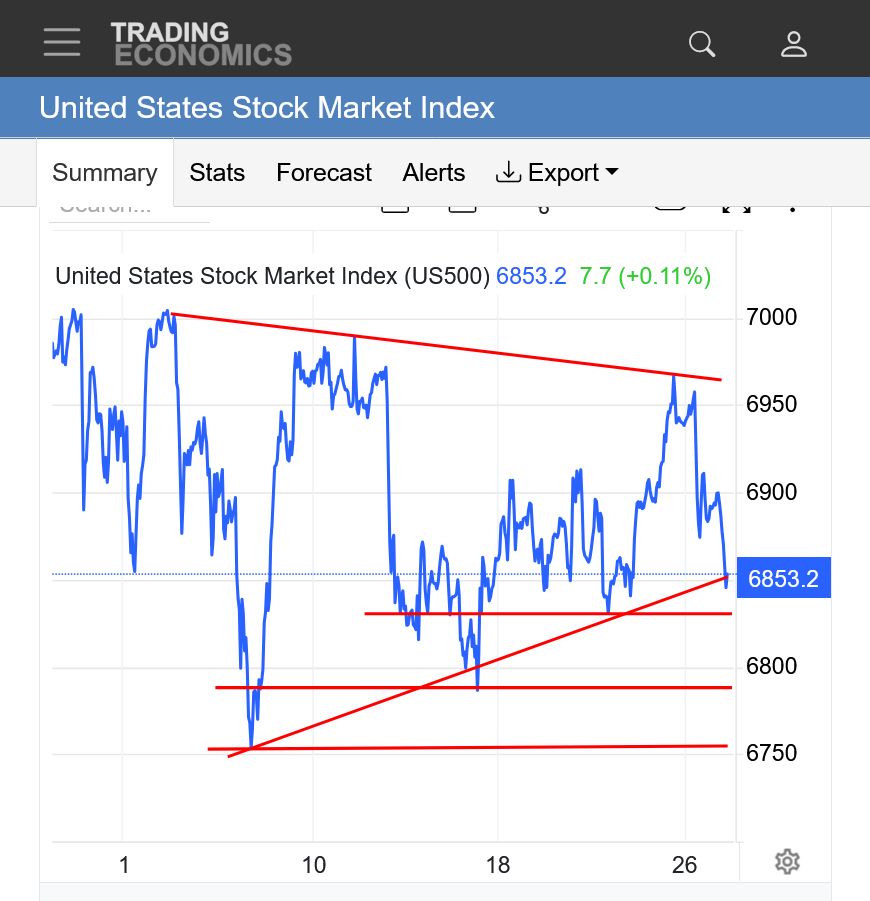
The downside is looking extremely vulnerable here.
I drew in some lines of support on this chart with the SPECULATIVE assumption that the symmetrical triangle/wedge(coiled chart pattern) shows a downside breakout.
https://tradingeconomics.com/united-states/stock-market
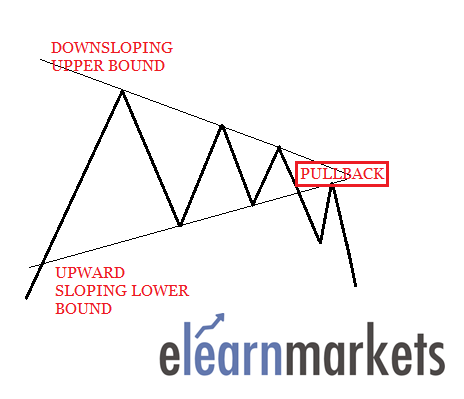
https://www.investopedia.com/terms/c/coiledmarket.asp
A coiled market, or coiled spring, can indicate upcoming price corrections. It a market that has a lot of potential to make a strong move in one direction after being pushed in the opposite direction or held flat over some period of time.
:max_bytes(150000):strip_icc()/fxy112713-5bfc377446e0fb0026048a5a.jpg)
+++++++++++++++
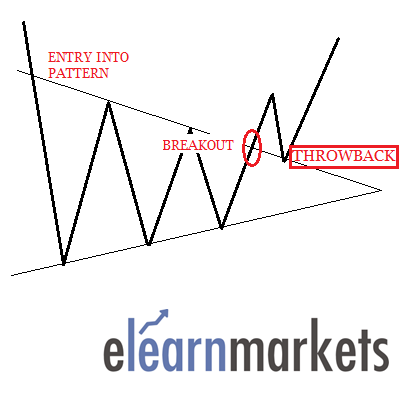
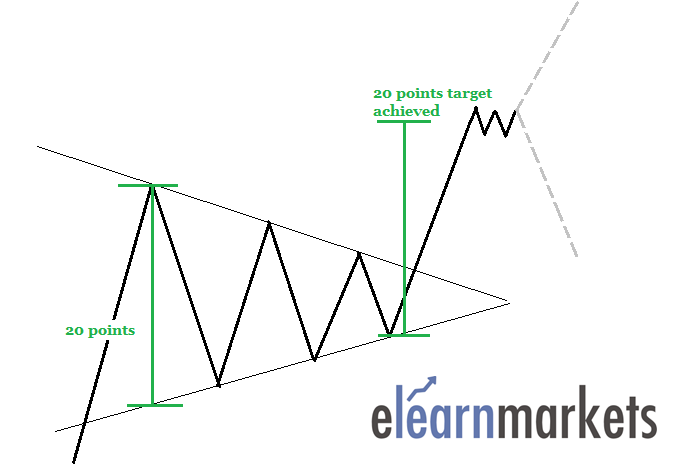
https://blog.elearnmarkets.com/symmetrical-triangle-coil-pattern/
https://changelly.com/blog/chart-patterns-cheat-sheet/
+++++++++++
School's In - Shooting Star Trading
Started by 7475 - Dec. 18, 2022, 8:25 a.m.
If Donald Trump announces something big over the weekend about Iran(or bombs them), the market could gap open Sunday Night.
Since the stock market is such a high priority for him and he wants to look good over Iran, an announcement that they've reached an historic agreement would cause a gap higher.
However, knowing nothing about the future, the close in most markets at the lows and uptrend line like we are seeing is positioned for a gap LOWER.
https://tradingeconomics.com/united-states/stock-market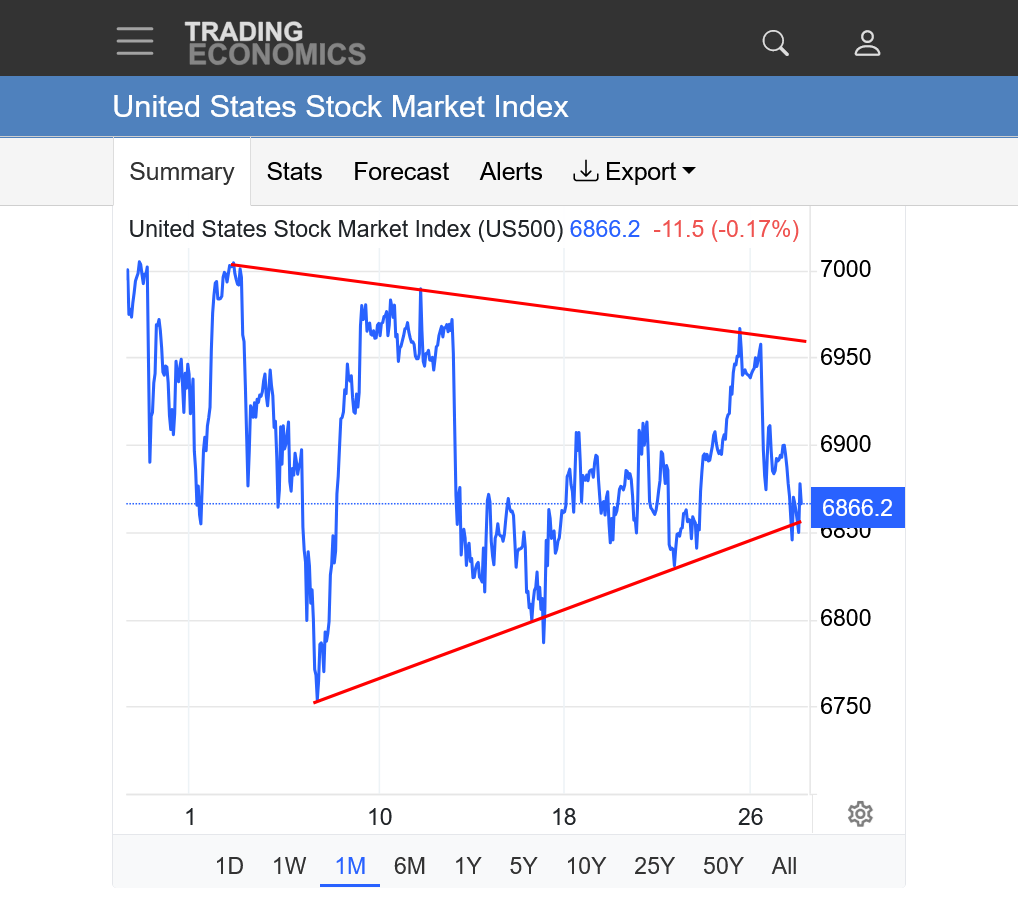
From that source:
Will we have a gap lower on the open?
4:50 pm: I'll say a small gap lower on the open!
Covered on the open at 6821.
Covering on the unexpected windfall profit. ($4000)
Congrats, joj!!!!
You can thank the guy in the White House for the extra spike lower tonight!
Nice trade, joj! And thank you, Mr. President. Well, I’m just a longtime stocks holder. So, not really in my case. <G>
Gap and crap??? trend still sideways?
Thanks, cutworm,
Great minds think alike
I was just going to post about all the gap and crap type action in several markets!
EXTREME reaction on the opens but those ended up being the highs for the energies and metals and the lows for many of the stock market indices.
The NASDAQ has had a gap and crap on the daily bar(on the highs) but still lower.
The smartest guy of all tonight is joj that used the opportunity to cash in, instead of getting greedy.
Gap and crap!
This is a selling exhaustion formation, especially significant at a low in a downtrend.
I would not categorize this as a downtrend but it was at a short term low. However, we should NOT make the HUGE mistake of believing that our charts and lines are all knowing indicators or that they are better at telling the future than what they really are. When I do analysis using them here, it's very helpful for understanding Richard Wyckoff's "Composite Man" which is the market mentality at various points in time. This can be predictive (trends are your friend for instance). But fresh news can(often does) change that. And new prices at new points in time can cause the Composite Man to react much different than he did the last time because FUNDAMENTALS have changed since then.
https://tradingeconomics.com/united-states/stock-market
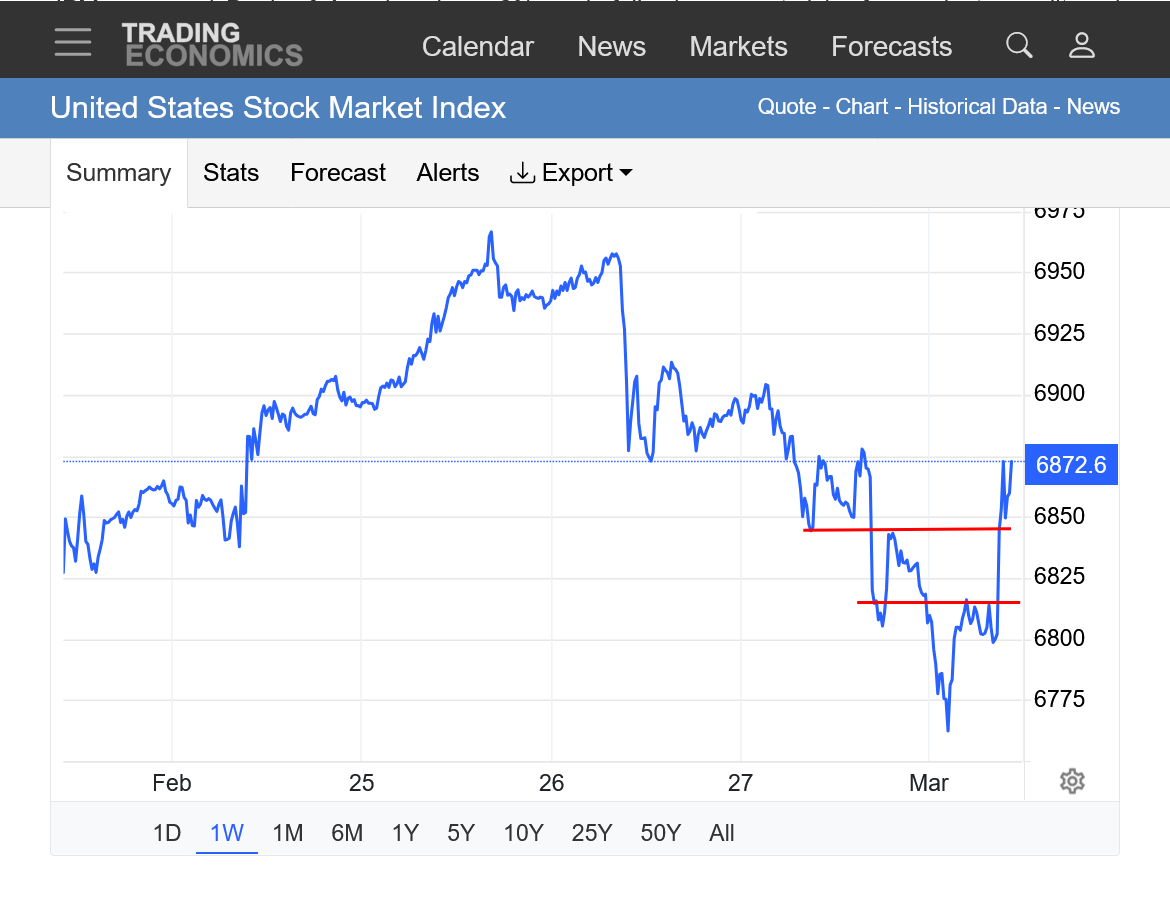
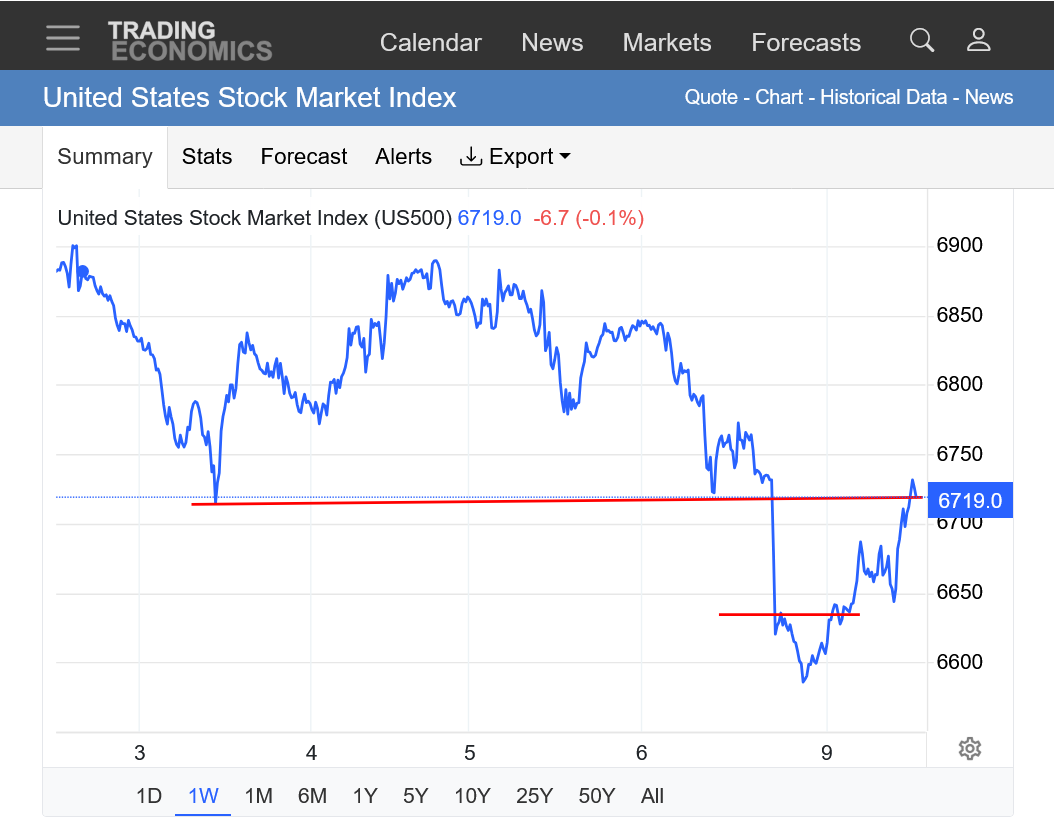
1. 1 week: The lines are the gap between Fridays low and Sunday nights open(the gap). After we almost filled that, the market went down to new lows but found plenty of buying at that price. Prices have reversed up this morning.
2. 1 month: We gapped thru the uptrend on the symmetrical triangle/wedge on the open Sunday night. This was a very bearish signal but is only a snapshot of the market mentality at 1 point in time (pretty EXTREME because of the attack on Iran). Emotions will always be maximized and often be misleading after the dust settles.
The bulls will only be in control when we make new definitive closing highs. This only shows enough buying at lower prices for the bulls to DEFEND their self fulfilling prophesy and Ponzi Scheme because the valuations and fundamentals do NOT support the bulls. This is STILL a rounding top formation on the longer term chart and again, only closing prices at definitive new highs that hold will negate that.
https://medium.com/@Blocksavant/composite-man-ca18c9d2d5a5
+++++++++
Noon: Pretty impressive gap and crap selling exhaustion(reversal up) today!
5pm: Not much follow through. Just enough to put us back inside the symmetrical wedge/triangle.
6912 AND 6957 Possible again ?!?---- one more low before another Serge >>7120 Can be --!!
Thanks, fayq!
This was a great example of the risk of big news breaking while the market is closed.
The news broke in joj’s favor but I really, REALLY like the way that he trades!
1. He made the right call getting short.
2. After the market moved in his favor, he put in a protective stop.
3. When Donald Trump gave him a break by attacking Iran and the market had a knee jerk reaction on the open in his favor, he took the gift and ran with the money.
Traders here can especially appreciate the best feeling of all with trades.
What we did last. In other words, the exit price.
If we got out too soon and left money on the table, especially a lot of money its a LESS satisfying feeling about a profitable trade.
If we got out at a BETTER price than where the market closed that day …..we didn’t make any more money but what happened is that we didn’t give some of it back. That is the BEST feeling.
Nobody can pick the best entry price and/or the best exit price.
All we need to do is get the PRICE DIRECTION right while we hold the trade and apply smart risk reduction strategies if they are offered and with some traders like joj that are tuned into the market be able to sense what is coming next.
In the 1990s, my first 6 years trading, I hand plotted around 15 different markets with price charts and pencil at the end of every trading day. I drew trend lines, support and resistance. It added up being 10s of thousands of chart updates during that time.
Mostly all the energies and anything that grows, including animals(meat markets).
There were so many patterns that repeated and market reactions that happened AFTER the charts gave clues/hints that after awhile, recognizing the pattern formations was immediate on first glance.
And it was fun! Larry, who has a brilliant mind and generously shares his statistics on weather, climate natural gas……..does it for challenging fun and can understand that mindset.
If it’s not fun, find something else to do that fun, challenging and PRODUCTIVE.
It doesn’t have to make money.
It can make you smarter, more enlightened. Even if it’s about how ants make tunnels. Or if it makes you happier or somebody else happier. Listening to your favorite music can make you happier! Or helps make the world a better place.
Up until this last generation and the internet, most people didn’t have many of those opportunities.
In 2026, just about everybody reading this does! Appreciating our wonderful lives compared to our ancestors is another way to be happy.
As mentioned yesterday, the reversal up on the daily bar of the rich people's Ponzi Scheme was impressive but there was no follow thru and the bearish chart formation (rounding top) is still the dominant one.
Now that we're trading a new lows for the week, the bulls are incredibly vulnerable. Violating this level of support, especially so quickly after the reversal up yesterday which completely negates any bullish implications from yesterday's reversal up.
https://tradingeconomics.com/united-states/stock-market
The pattern we've seen this week, looks most similar to the one I posted late last week above:
Re: Re: Re: Sold 1 Emini S&P 6902
By metmike - Feb. 27, 2026, 10:15 a.m.
The market is refusing to go lower.
A person can draw all sorts of lines of support, resistance and formations that are ALL VALID. They are all REACTION POINTS from past and current prices. They can tell us a great deal and are better than flipping a coin for telling the future price.
However, they cannot tell the future with reliable skill in most markets that are trading on changing fundamentals and especially unpredictable news. Snap shots in time and connect the dots to see what recognizable formations are there. Then follow it very closely, along with fundamentals/news to understand what the market is trading. Why its trading that and then use that understanding to project what will be coming next, given everything we know now.
https://tradingeconomics.com/united-states/stock-market
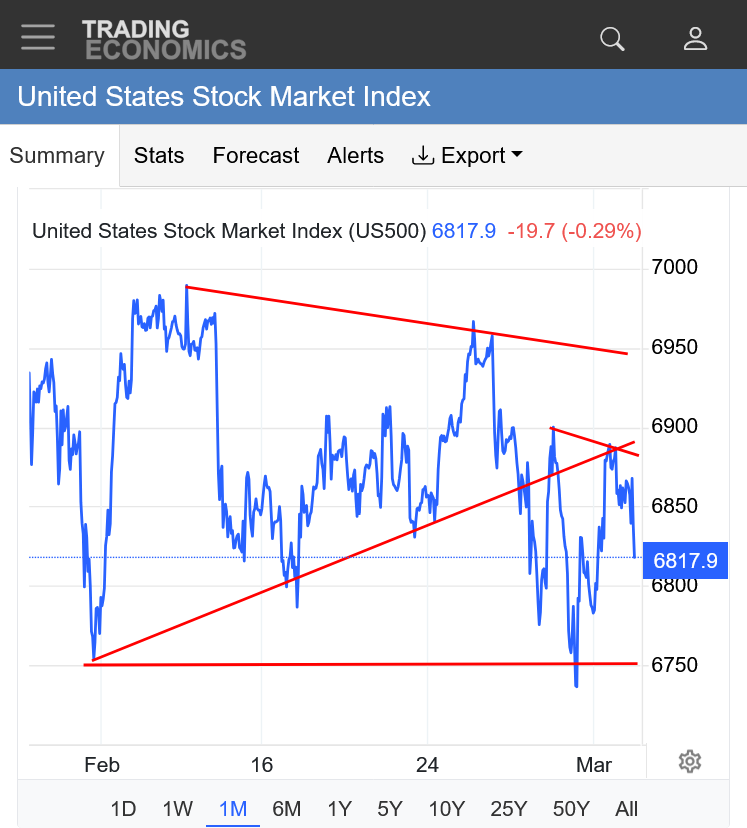
We can see the original symmetrical triangle embedded with the lines below. Additionally, some lines of support and resistance which were significant reaction points which resulted in trading orders to flip from one sides advantage to the other sides and reverse the direction at those points which were likely the result of orders placed because of that price.
At these kinds of times it's best to sit on the sidelines and wait for a clear indication.
Just my 2 cents, which aren't worth anything since the don't make them anymore.
For sure, cutworm!
Your 2c have contributed some valued information here many times. Countless times alerting me to things I wasn't aware of and it's much appreciated!
From Baird, whom I have an account with:
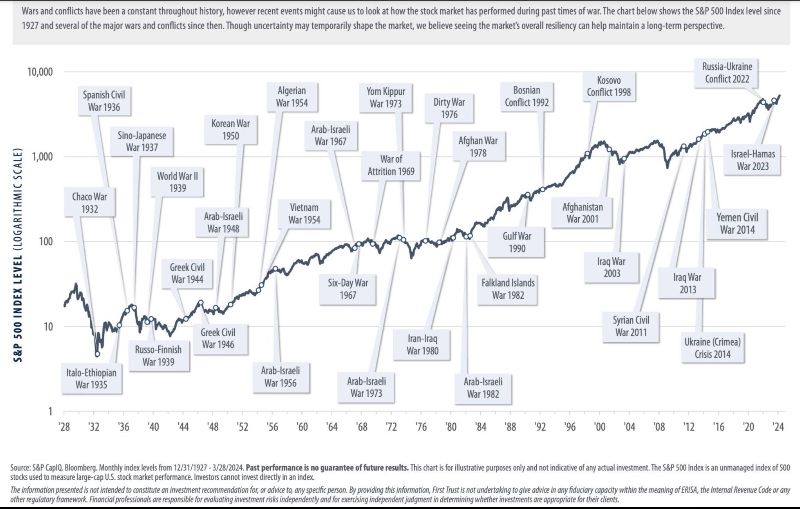
“For those who saw our previous video, Ross and I spent 12 minutes saying: focus on your plan. And if you had, the stock market is up about 65% since then. Now we have another conflict brewing, and this one involves the U.S. directly. The world has always been full of conflict – and yet the stock market has marched relentlessly higher.”
“What matters isn’t the headlines themselves; what matters is what actually moves markets.I wrote a blog earlier this year during the Venezuela Maduro incident about exactly that. The U.S. economy is different today than in past Middle East conflicts. We’re now the world’s largest oil producer, which means oil spikes simply don’t hit us the way they used to. And because we’re a consumer‑driven economy, earnings and interest rates matter far more to markets than a single geopolitical event. Oil even spiked this morning and quickly fell back – a sign of how different the environment is now.
Ross: The key questions don’t change: Does this impact the U.S. consumer? Does it impact corporate earnings? If yes, we dig deeper. If not, we stay focused on fundamentals. This situation is moving quickly, so we’ll continue updating as we learn more. But the long‑term lesson holds: conflicts abroad have always been part of the investing landscape, and over time the market has consistently moved on.”
—————-
So, the message to long time holders of stocks like myself is to continue holding. This message isn’t addressing short term traders, however. And of course, Baird like any major stock broker has a natural bullish bias of course. But the market has been pretty resilient overall, regardless of bias. I’m sticking with it based on the longterm past. Also, the % of my total assets in stocks isn’t all that high. And maybe some of this is due to past messages just like this.
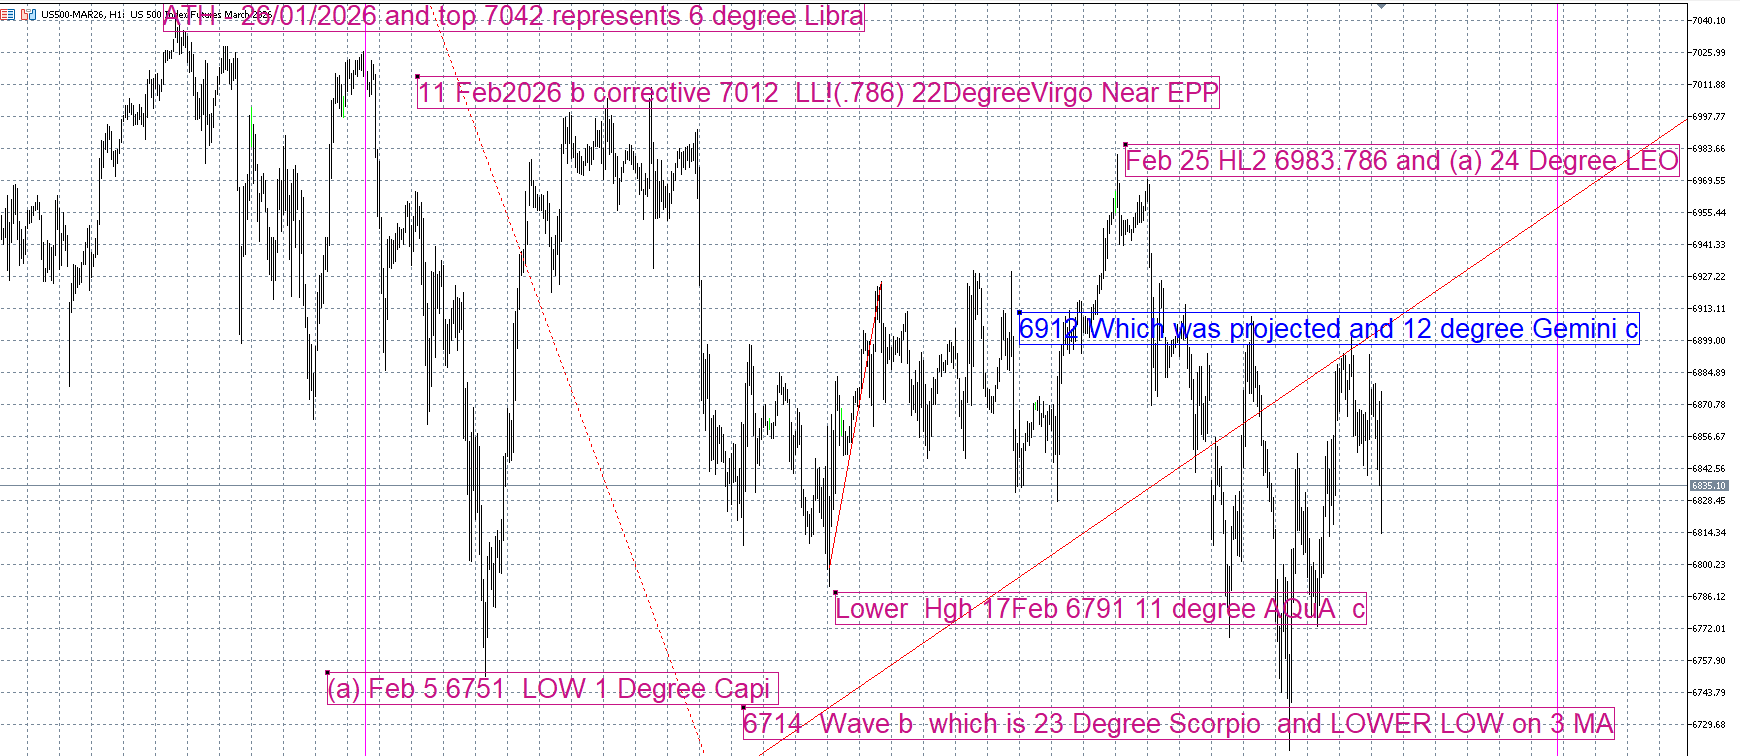
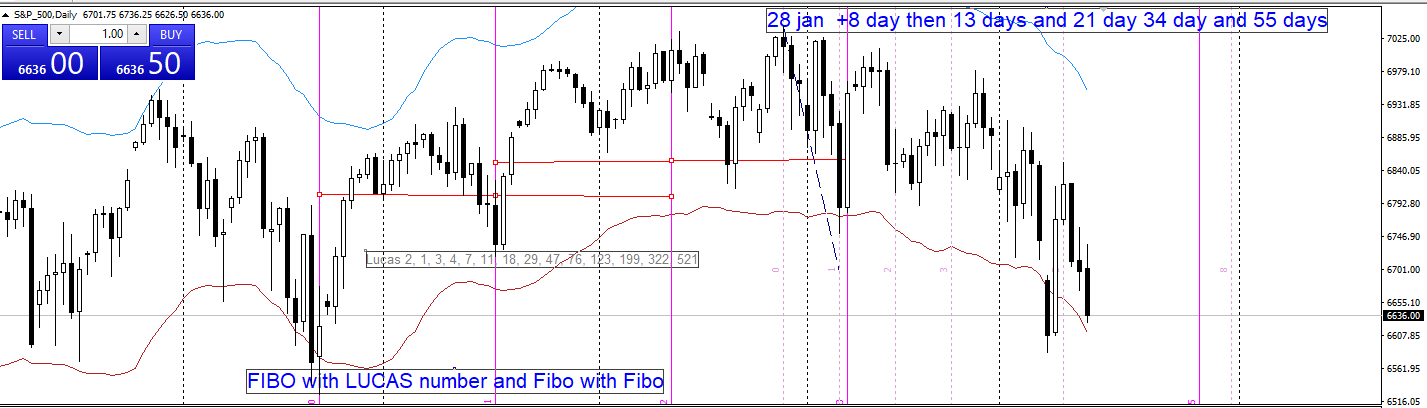
Hi- Planets with wave and 6802 on daily close and break of 6985 important
next turn 10/11 Th MARch then next on 18/22 March something important and see how things Unfolds
Thanks, fayq! Great chart:
Larry, I loved that post a great deal and will make it our post of the week with many more comments in the next post!
This market is being impacted a great deal by NEWS. Enough to give red lines on a chart LESS significant.
Considering the very bearish news, it's holding up extremely well. However, the chart formation has turned pretty bearish.
The long term is still up, as Larry showed but the market has completely lost momentum the last several months with the rounding top formation continuing to be valid.
The chart below shows the original symmetrical triangle/wedge(lower highs +higher lows), which is actually STILL VALID for the following reason.
We had a major downside break out from the wedge, but then reversed higher from a previous line of SUPPORT as the bulls defended.
This resulted in a RETEST of the downside breakout but that completely FAILED to get back inside the wedge.
The bulls were given an ideal opportunity to take the ball on the reversal up and run with it and THEY FUMBLED IT.
The bulls are extremely vulnerable here with crude oil soaring higher and the market being bombarded with REALITIES of the ruinous war with Iran.
How will this self fulfilling prophesy manage to keep believers in the game under this overwhelming bearish, big black cloud if the war lasts for weeks????
Valuations are already overpriced and at unsustainable (forever) levels.
The one thing that can save the market with confidence is if the most powerful man in the world, who focused on and brags about the stock market constantly, sees it crashing lower and does something typical. Reverse his position to keep the market going up.
If Donald Trump suddenly tells us that we've accomplished everything that we wanted to do in Iran(because he realizes the catastrophic evolution taking place from having no clue about where this is going-other than pleasing Netanyahu) and announces the end of the war and that this is the 9th war that he stopped. If that happens, the stock market has a chance to break out to the upside. In the absence of that, the many, MANY stone cold realities of this war will be pounding the market.
BTW, the day before Donald Trump attacked(after Netanyahu told him to) Iran was trying to make a deal with him(which is why Netanyahu did this to sabotage that deal).
So Iran WANTED to make a deal BEFORE the attack. The way that Donald Trump will present this is after its over is that the all powerful US military under his brilliant leadership forced Iran to make a deal with these attacks. You can bet on that even though its the exact opposite of the truth. I mention those objective FACTS to use them on speculating what will come next and how it might impact the stock market.
By metmike - March 4, 2026, 8:09 p.m.
Since 4 January 2020, the S&P 500 has experienced several volatility regimes, with roughly 38–40 trading sessions where the index declined more than 2% in a single day. Most of these events occurred during the 2020 pandemic crash and again during the 2022 tightening cycle, when rising interest rates and liquidity withdrawal created sharp downside pressure across global markets. Outside of those stress periods, the index has often traded in long stretches of relative calm, reflecting strong institutional dip-buying, ETF inflows, and concentrated leadership from large technology stocks. For traders in the E‑mini S&P 500 Futures, these volatility cycles are visible through the daily open, high, low, close, and volume structure. Over the past several weeks the contract has generally traded in structured ranges, with daily movements fluctuating between roughly 40 and 120 points, while average daily volume has ranged from about 900,000 to 1.7 million contracts. The overnight session often sets the directional tone, but the most decisive moves typically occur during the U.S. cash session when institutional order flow enters the market.
From a technical perspective, the 7005 level represents a key upside breakout zone, while 6714 acts as an important structural support area for the ES contract. A sustained move above 7005 could trigger momentum buying and extend the trend higher, whereas a decisive break below 6714 would likely signal a deeper correction and a shift in short-term sentiment. Some traders also incorporate astro-financial timing models, noting that Jupiter Direct Motion March 2026 occurs around 10 March 2026, which historically coincides with shifts in market momentum and narrative cycles. Within that framework, a potential cyclical low window is projected around 20–23 March 2026, aligning with a 55-day Fibonacci time cycle often used to estimate volatility pivots. During such windows markets can experience expanded ranges, sudden reversals, and higher trading volume as positioning resets. In addition, cross-market signals remain important; if Crude Oil were to break decisively above the 8500 level (in futures price terms), it could increase inflation expectations and add another layer of volatility across equities and commodities. Taken together, the interaction of key price levels, macro liquidity conditions, planetary timing cycles, and inter-market relationships suggests that the coming period may remain highly volatile, requiring traders to closely monitor both technical structures and broader macro signals.
Thanks, fayq!
Follow the previous analysis to understand what is about to happen here if we close at new lows for the week.......in the absence of Donald Trump announcing the war is over or some other random, abrupt change typical of his leadership.
All those self fulfilling prophesy, rich people in the Ponzi Scheme will be seeing SELL SIGNALS on their computer screens at the same time and the downside correction would be MASSIVE!!!
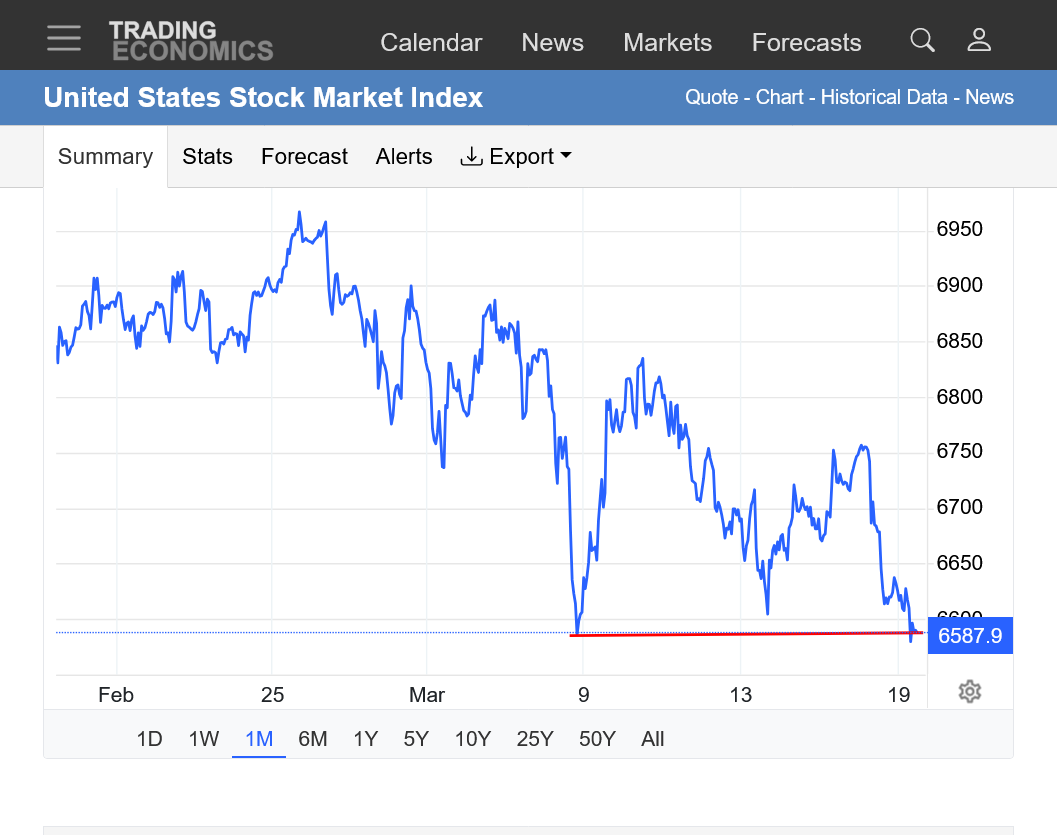
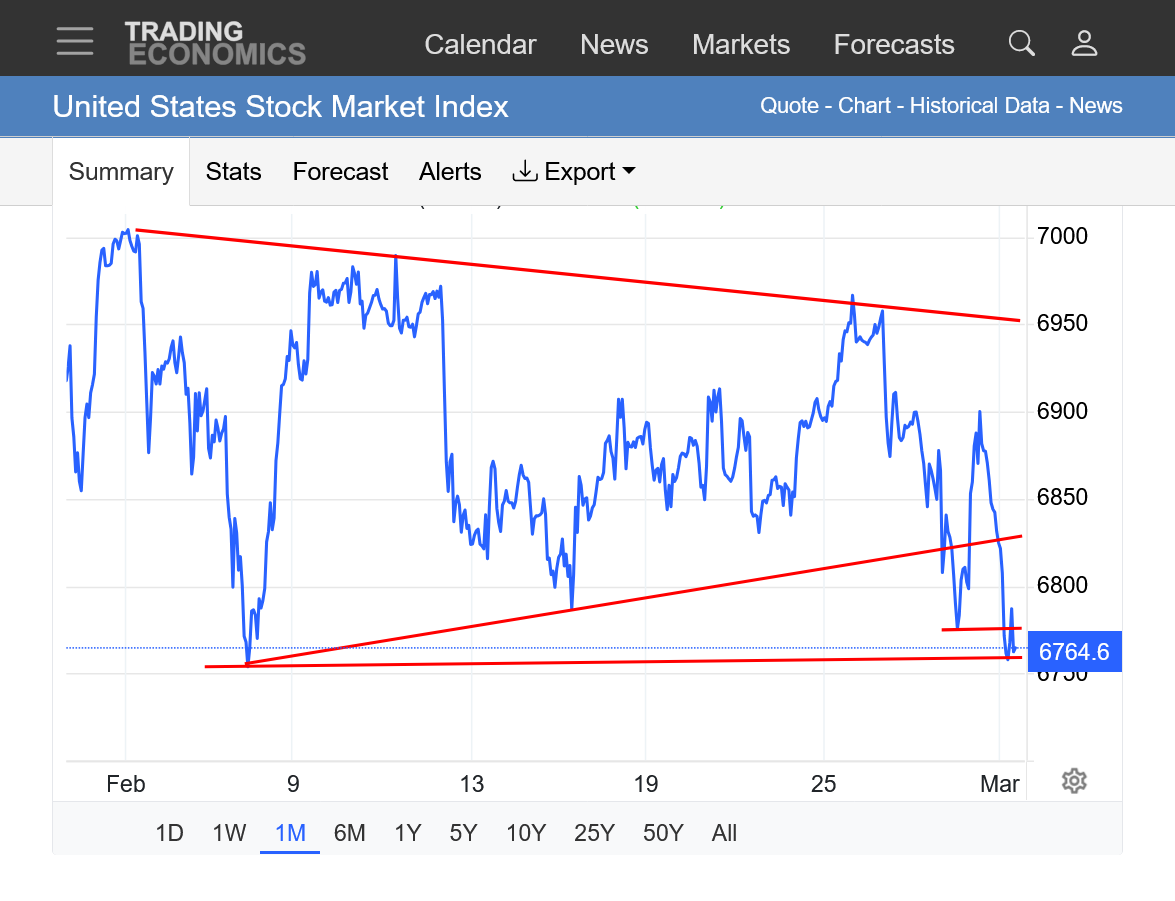
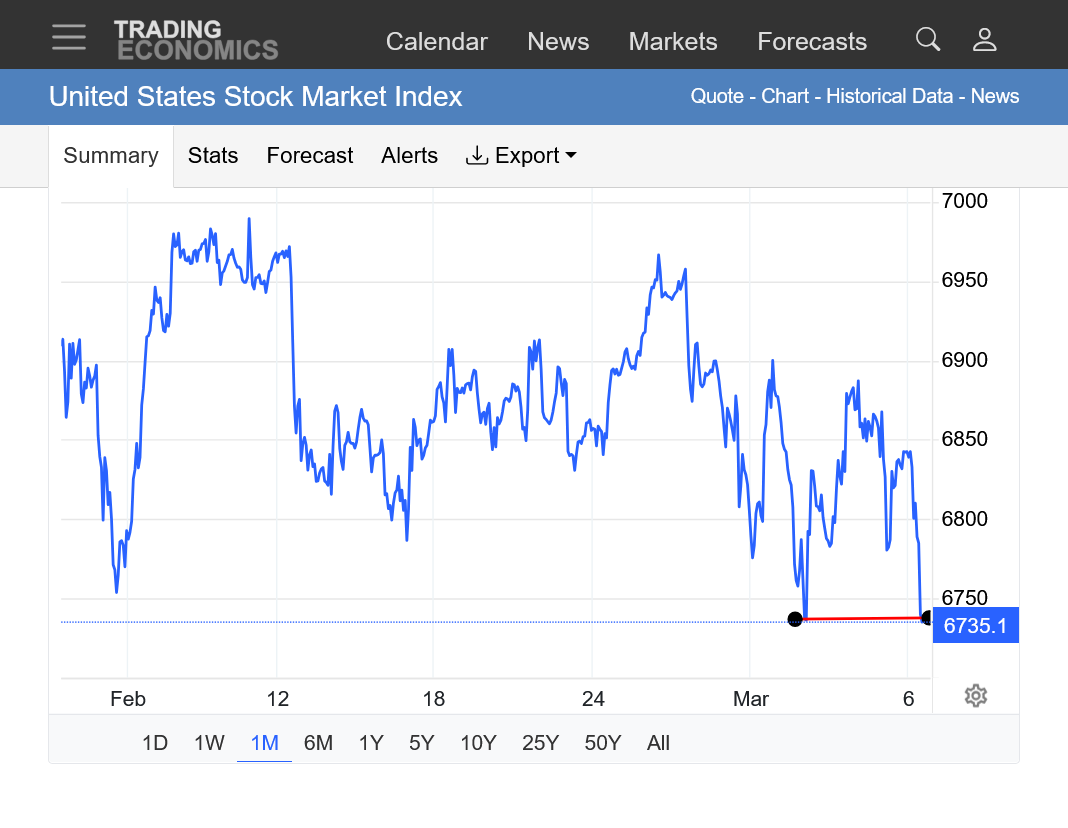
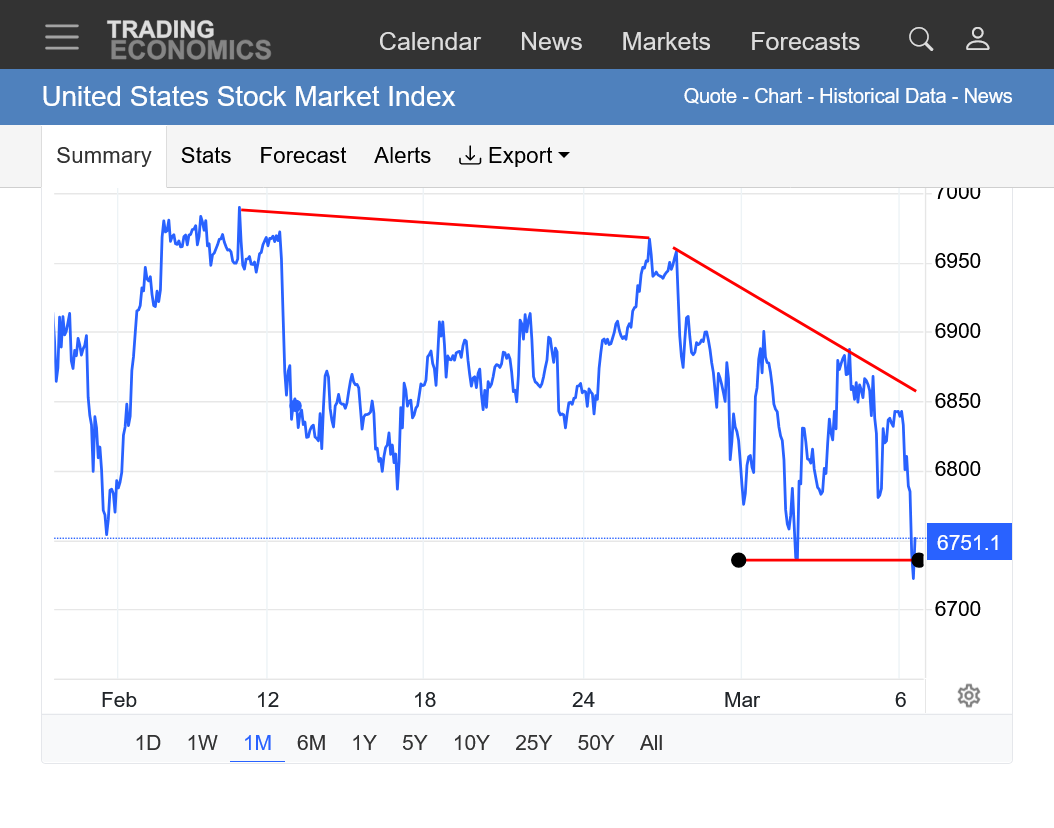
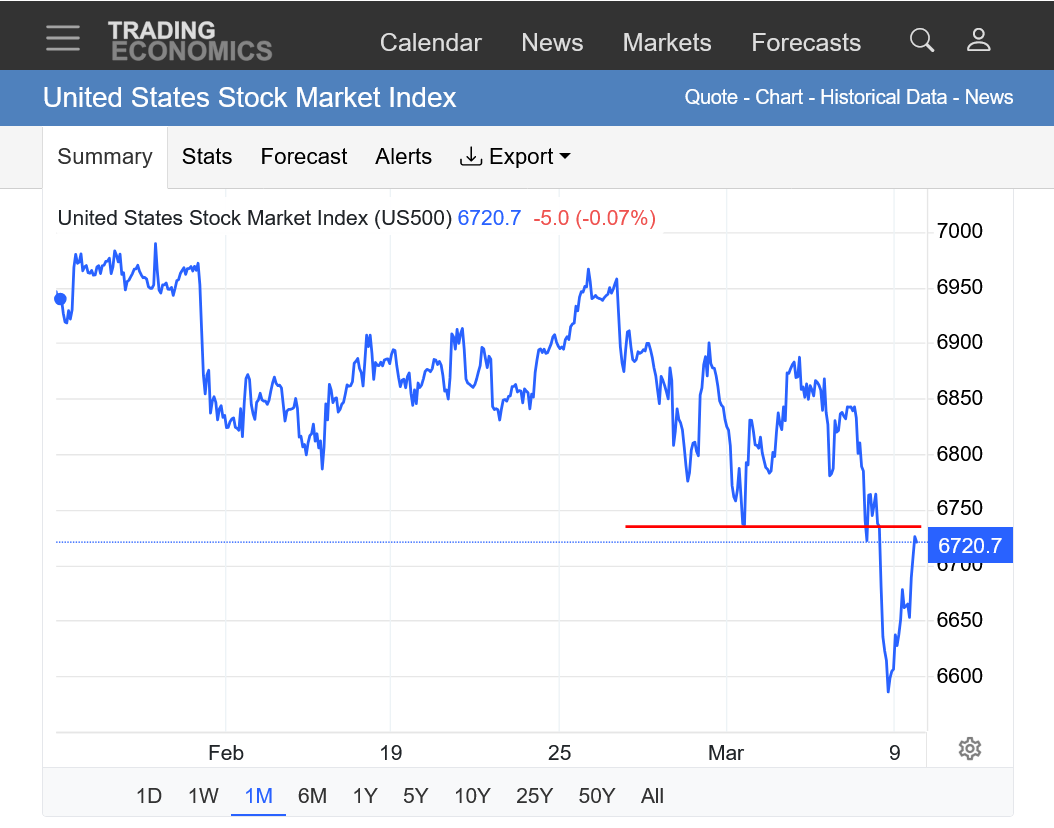
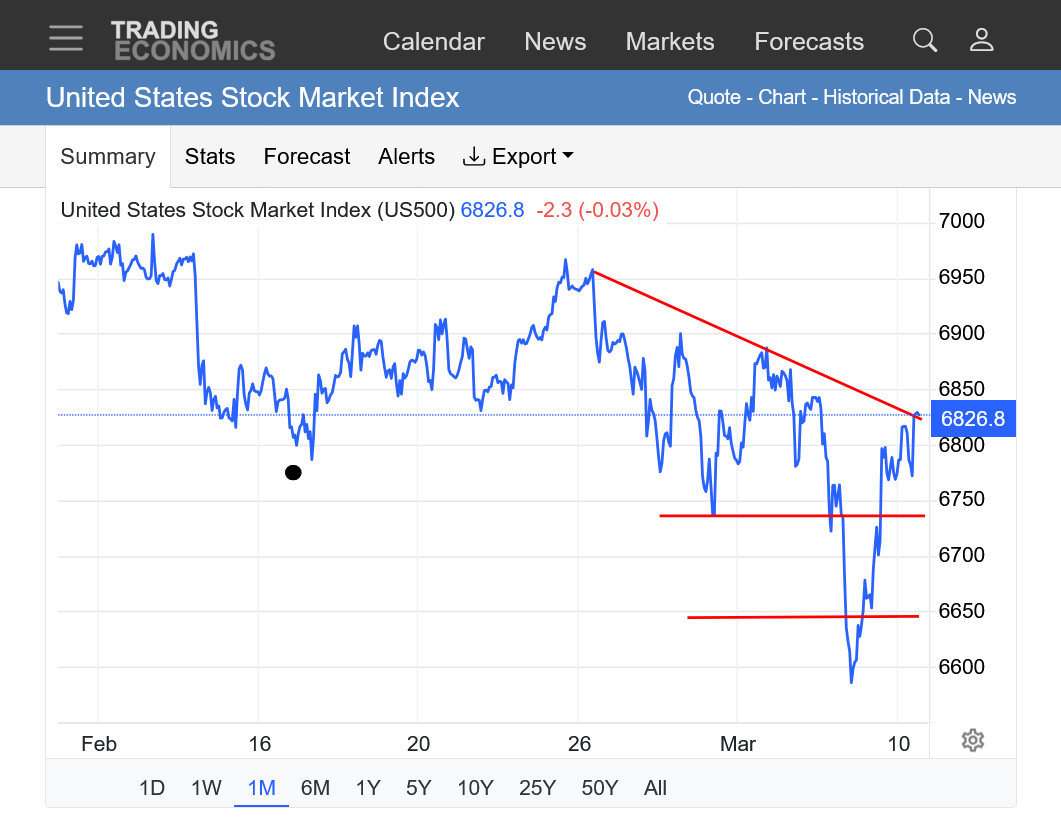
1. 1 month. At MAJOR support. Not just the low this week but also the low of 2026.
2. 1 year. Rounding top formation being validated. First line is the December 2025 low. 2nd line is the November 2025. Closing below the 2nd line, along with no end in sight to the market and economy wrecking war will leave the market vulnerable to a MASSIVE correction lower.
https://tradingeconomics.com/united-states/stock-market
8:48 am: Quick update: There is an enormous amount self fulfilling long positions that
would be vulnerable when everybody heads for the exit ramps at the same time IF the market can't generate enough buying to rescue the bulls.
We've been here dozens of times before but there is 1 thing different this time. Market bulls are being crushed so badly by THE RUINOUS NEWS that they may not be able to exert their impact to save the market as they did after every other negative news event.
Again, Donald Trump can change the news and flip it to bullish after he sees the stock market crashing by suddenly changing his strategy in Iran(again). Tomorrow, he could tweet out on Truth Social that we've accomplished our objectives in Iran and announce that the war in Iran is over(and that he stopped 9 wars).
That is a distinct possibility, now that he can appreciate the damage of his previous really bad decision (to attack Iran in order to please Israel/Netanyahu).
The stock market matters more to Donald Trump than almost anything else! The best chance for the war in Iran to end is if Donald Trump needs to end it to save the stock market.
That is a stone cold fact, living in the Donald Trump reality of 2026!
With that being the case, I'm actually hopeful that this war might end much sooner than what Donald Trump have been telling us( they are just getting started and weeks to go as of yesterday).
9:30am: The market is trying to hold the lows/bulls defending for the gazillionth time in recent years:
Stocks fell Friday, adding to their weekly declines, as oil prices spiked and traders reacted to an unexpected drop in new U.S. jobs data
International Brent crude traded above $91 per barrel as investors weighed the impact of the U.S.-Iran war on global energy supply. Oil prices hit their highs of the day after President Donald Trump said in a Truth Social post that there won't be a deal to end the U.S.-Iran war without an "unconditional surrender" from the Middle Eastern country.
https://www.cnbc.com/amp/2026/03/05/stock-market-today-live-updates.html
Thanks very much, Larry!
Donald Trump could change that overnight or even in an hour for some new, made up reason but for sure that's the NEWS which is dominating today's price action.
What will the latest NEWS be on Sunday Night when we open????
This is a market reacting to news about the war in Iran. If you can read Donald Trump's mind, you can make a lot of money trading right now.
https://tradingeconomics.com/united-states/stock-market
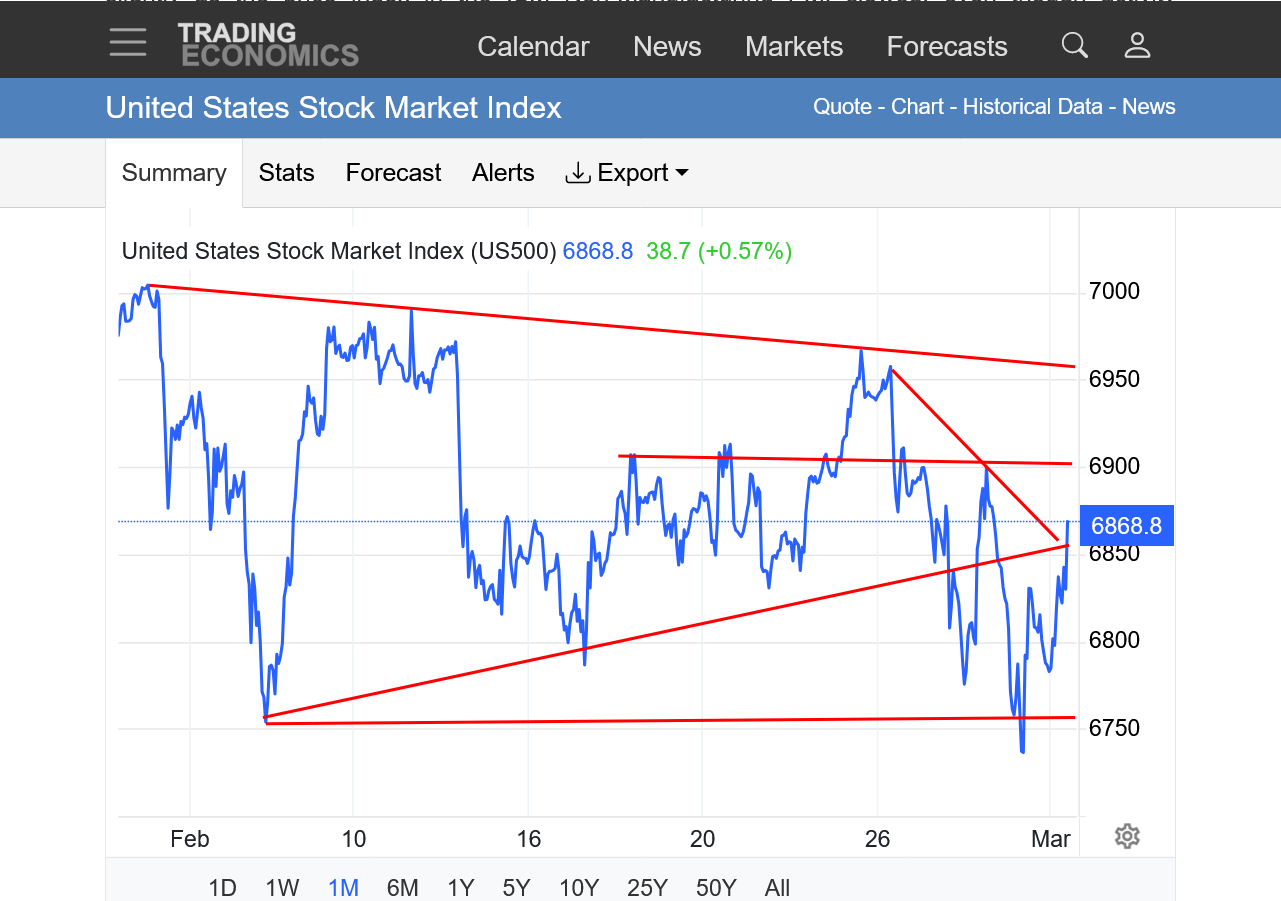
1. 1 month with the original symmetrical triangle we started showing 2 weeks ago. An obvious downside break out which is often not completely clear until after the price has put some distance between the break out and time/price change because we broke out to the downside........BUT THEN came back and TESTED the uptrend of higher lows! The test failed miserably and NOW the configuration shows up as a classical downside break out of a symmetrical triangle with 2 tests that FAILED.
Re: Re: Re: Sold 1 Emini S&P 6902
By metmike - Feb. 27, 2026, 10:15 a.m.
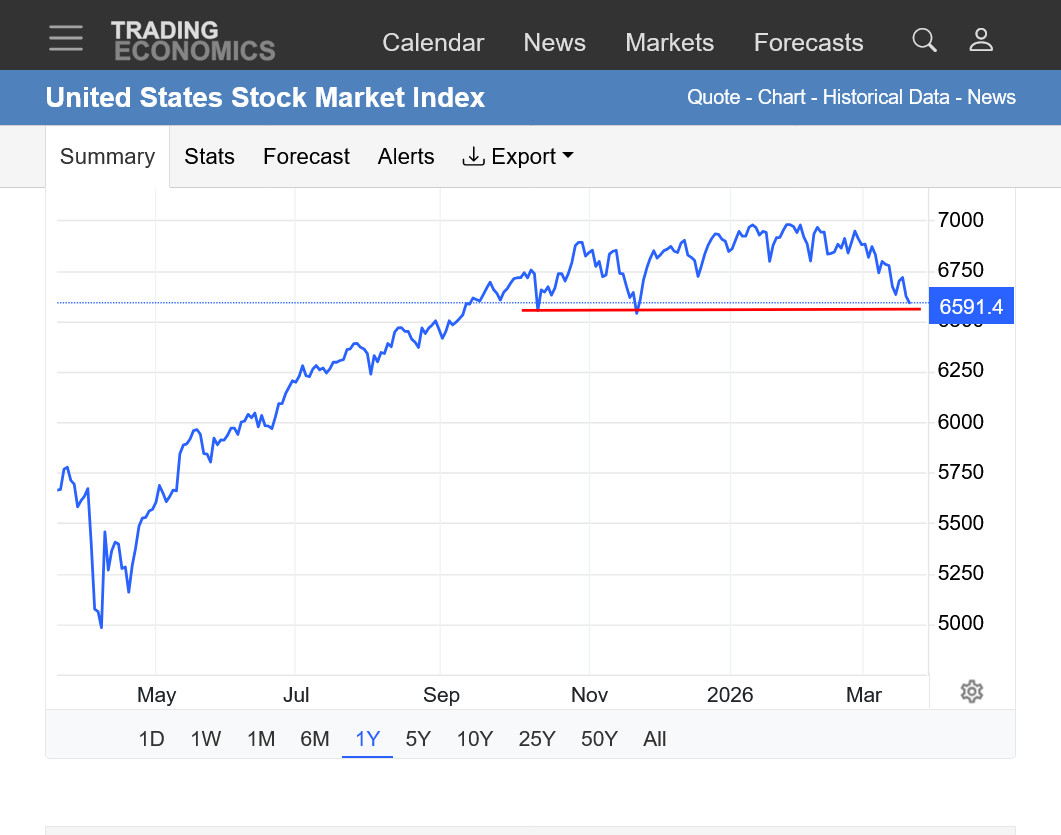
2. 1 year: That rounding top formation we started showing late last year based on the stock market losing momentum and the uptrend slope getting less and less and less steep is looking really good right now. However, it was impossible to predict the war in Iran which is the main determinant of prices right now.
+++++++++++++
By metmike - Jan. 30, 2026, 10:34 a.m.
https://www.ebc.com/forex/rounding-top-pattern-explained-how-to-spot-market-reversals

10:30 am: I forgot to draw in the SIGNIFICANT support line from last November's spike low. The chart from kris reminded me of that. Thanks, kris!
Holy cow, as crude futures gapped way up this evening (and even NG is up a whopping 9%), stock futures gapped way down this evening:
Dow is -1,100/-2.3%
Other major indices are down over 2%.
Any comments?
Edit: I just saw that Mike posted a few minutes ago while I was putting this post together.
Mike, you may delete this if you’d like. Had I seen your new post first, I wouldn’t have posted this.
Larry,
I like your post. I was catching up on things after the chess tournament or would have posted shortly after the gap lower this evening.
s mkt unfolds >>as projected in pervious post tgt 6832 ish and mid march 6612/6565 area !!
This source doesn't always give us accurate numbers/prices but it can demonstrate patterns well and IT'S FREE!!!
Right now, we are seeing a potential gap and crap selling exhaustion formation! Unfortunately, chart patterns are only predictive at that point in time. Right now, THE NEWS coming out of Donald Trump's mouth is the master of the market.
Added: Sometimes, the market will reverse up, fill the gap and then go back down during uncertain times that don't justify one side taking back control..
https://tradingeconomics.com/united-states/stock-market
1. 1 week
2. 1 month
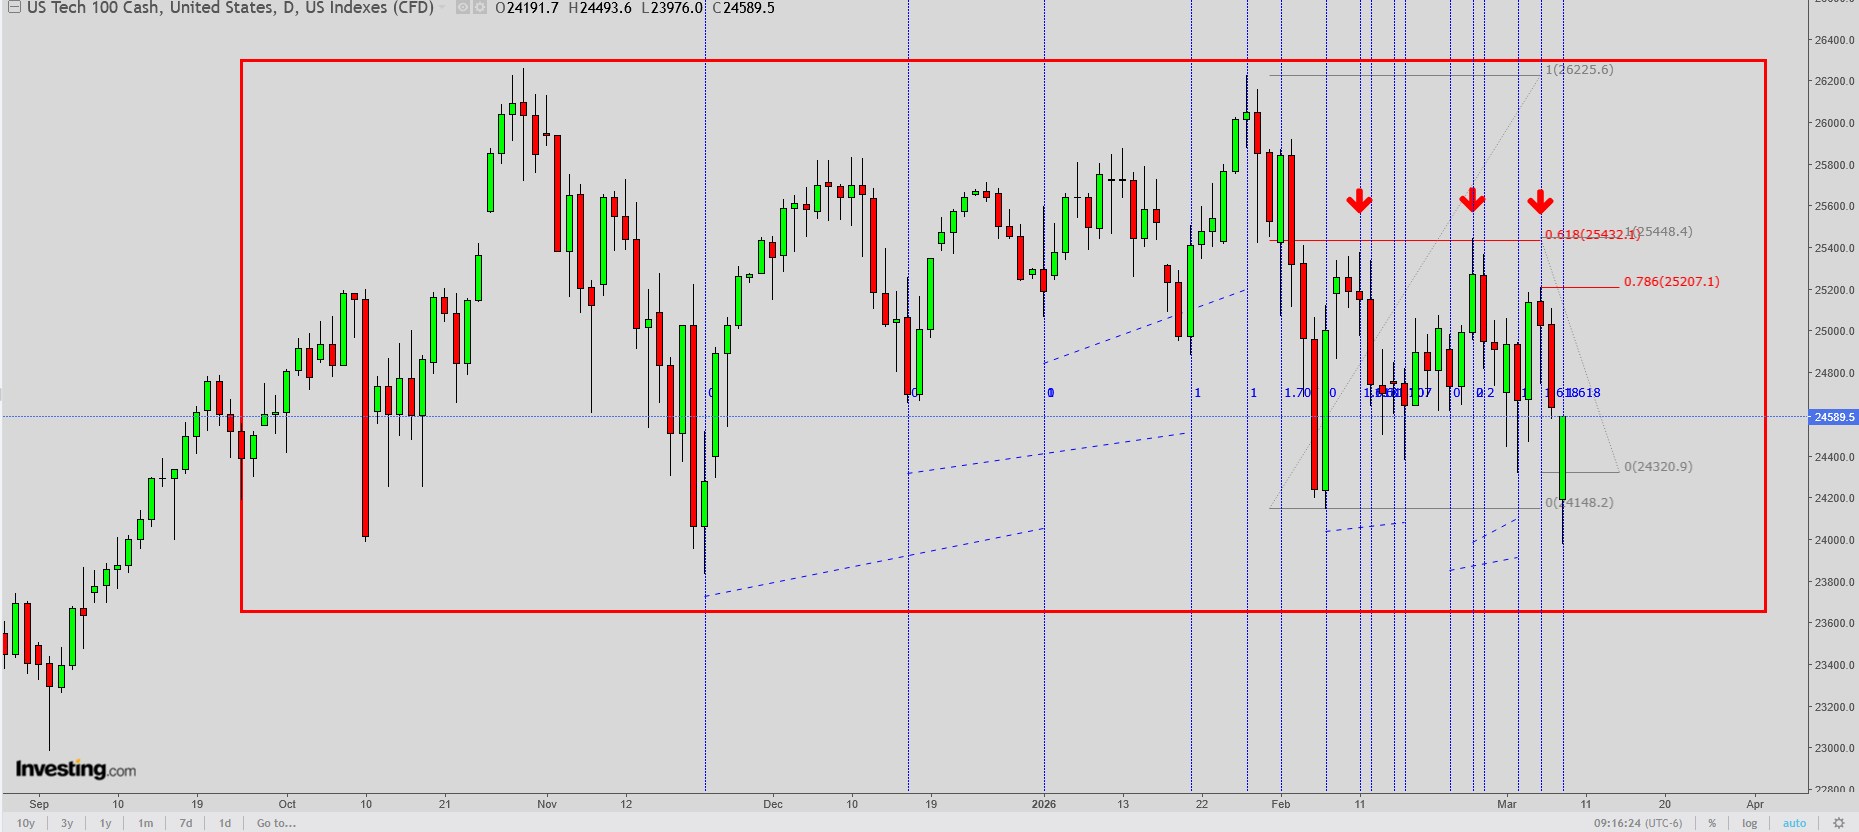
15 min chart Nasdaq as of now, makes me go hmmmmm .... ?!?
Thanks, kris!
We did a gap and crap, filling the gap lower which is a selling exhaustion/reversal up formation, HOWEVER, very often the top of the gap, after being filled servers as RESISTANCE and the market fills the gap...THEN goes back down.
Especially with a market in no mans land dominated by uncertainty that can incentivize the bulls/bears to come out/withdraw based on price levels only vs expectations of a continuation of a move that entices ADDITIONAL buying/bulls to come on board.
https://tradingeconomics.com/united-states/stock-market
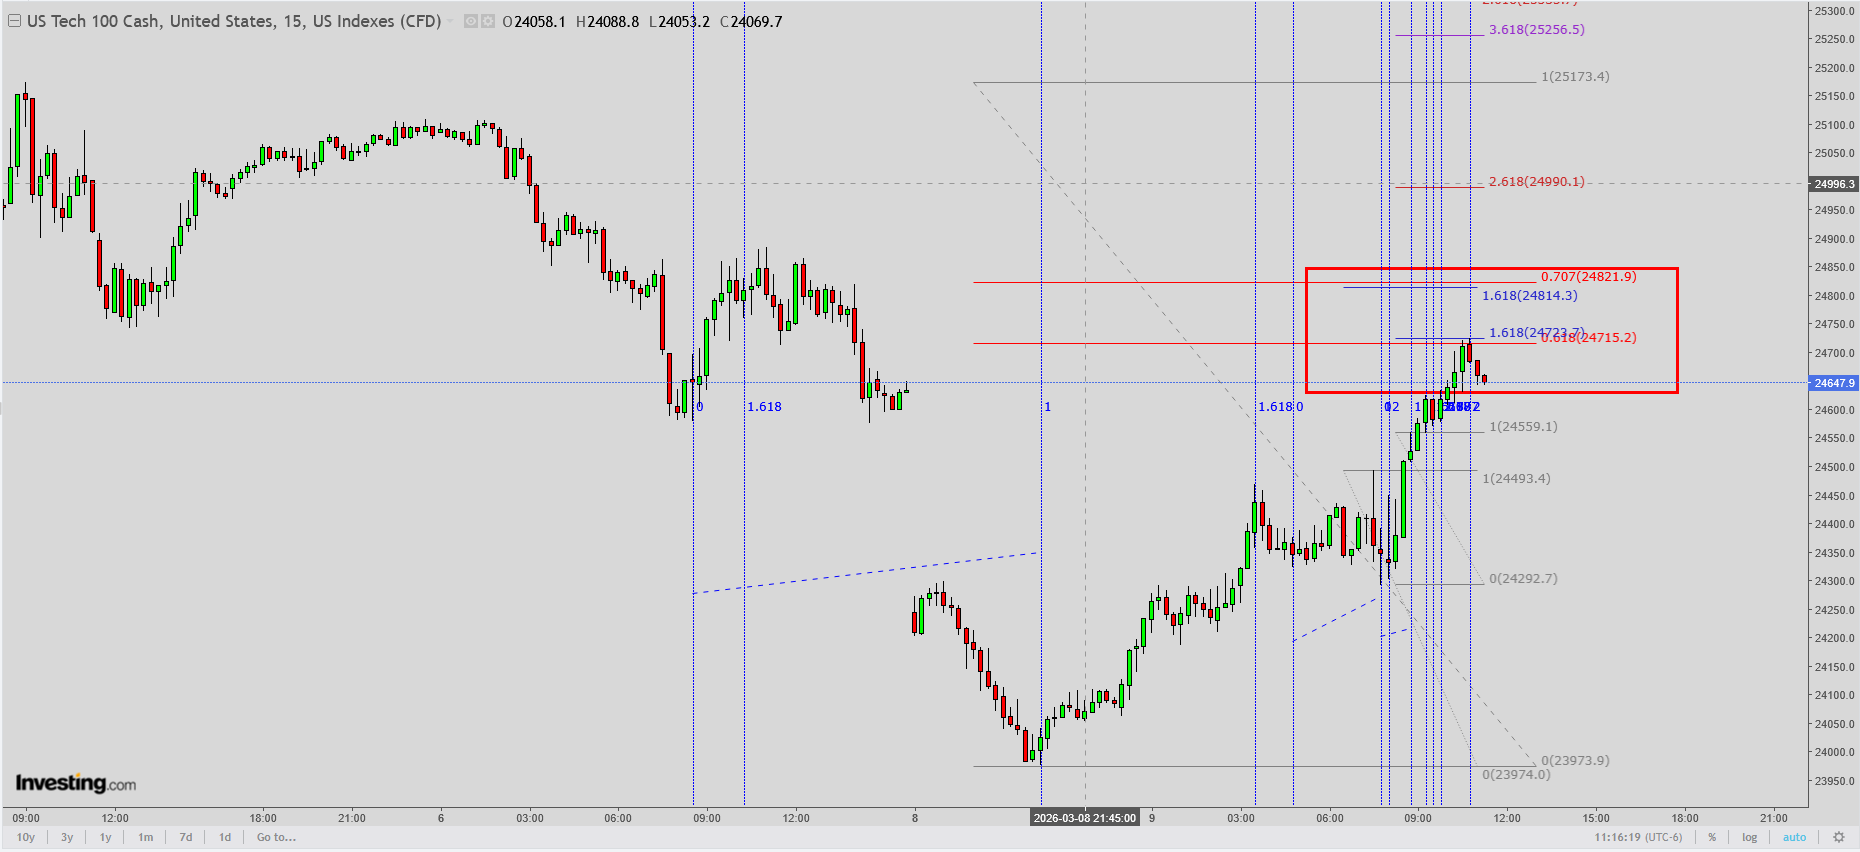
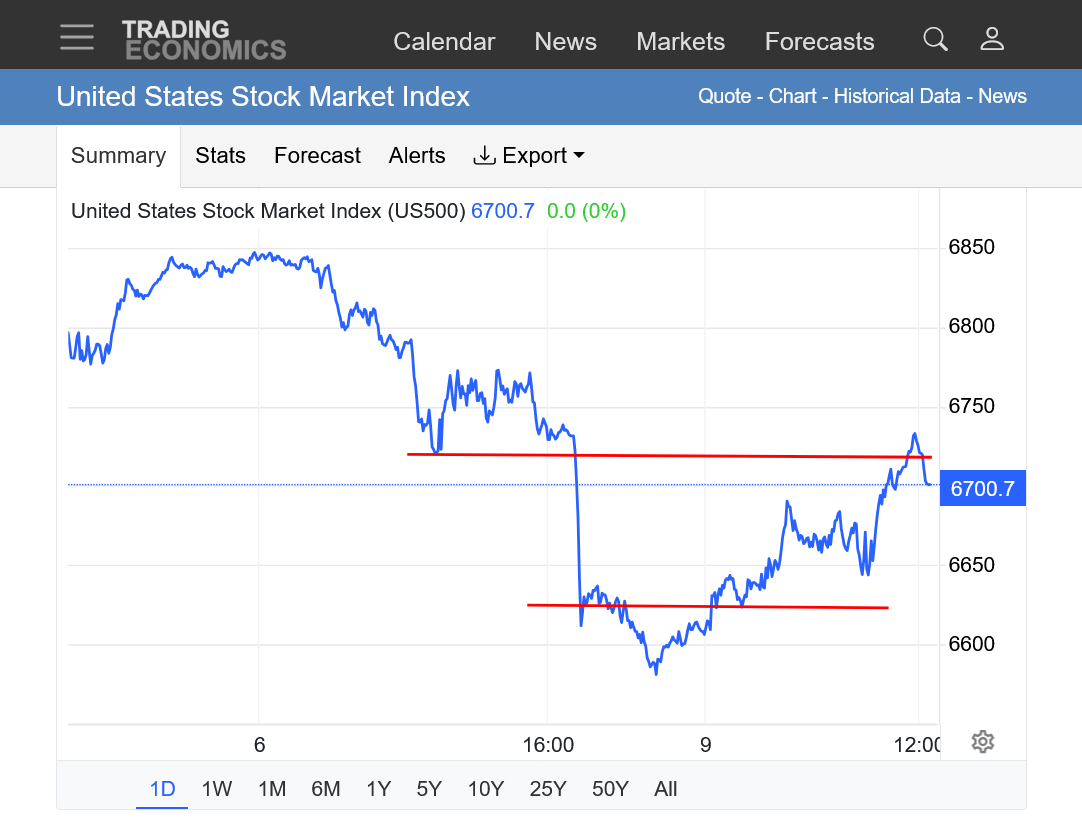
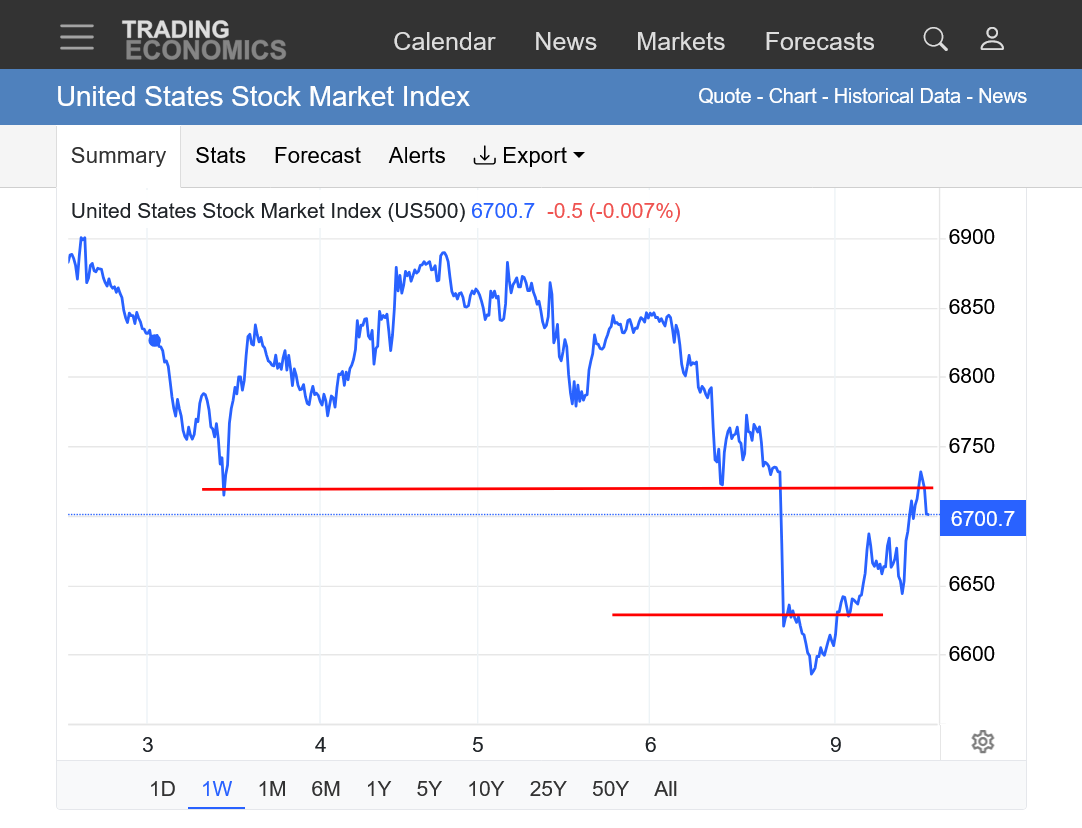
1. 1 day with daily bar gap lower filled.......just barely
2. 1 week with weekly gap filled....just barely.
3. Ask Donald Trump if you want to know where the next MAJOR move is going
Kris/MetMike
IMHO we have set cycle low today. Moreover, MetMike is accurate--the low may very well have been last night BUT the market 'should' test this low which WILL be the time to make investments and/or speculate.
The pattern I have noticed over the years suggests--Monday low, big bounce, Tuesday starts out better, initial buyers fade, market falls during Tuesday, Wednesday not good, then buy Wednesday night/Thursday at a test/retracement.
MetMike is also correct--market sentiment is skiddish, thus another news event during Tuesday session may precipitate a drop. Market tests low Wednesday night/Thursday, holds, rallies and cycle confirmed.
Silver may follow same pattern. Grains the opposite--they will test high and fail.
Thanks much, tjc!
Some sort of news just came out. Trump must have said something.
The crude was already dropping but it spiked to lower on the day and did a gap and crap buying exhaustion formation(very bearish) at the same time we just saw a spike UP in the stock indices to new highs and confirming a gap and crap SELLING exhaustion(bullish).
https://tradingeconomics.com/united-states/stock-market
1. 1 day with gap filled. On the highs
2. 1 month with gap filled.
By tjc
"Kris/MetMike
IMHO we have set cycle low today. Moreover, MetMike is accurate--the low may very well have been last night BUT the market 'should' test this low which WILL be the time to make investments and/or speculate."
Yes: we did set a cycle low today but I doubt we'll successfully retest it, today was a possible retest of the VERY important low on 11/21/2025 which sits at the bottom of the months long rectangle I have highlighted for a while now.
Did we retest that low successfully today: yes. Will this double bottom last more than 3/4 days: I doubt it
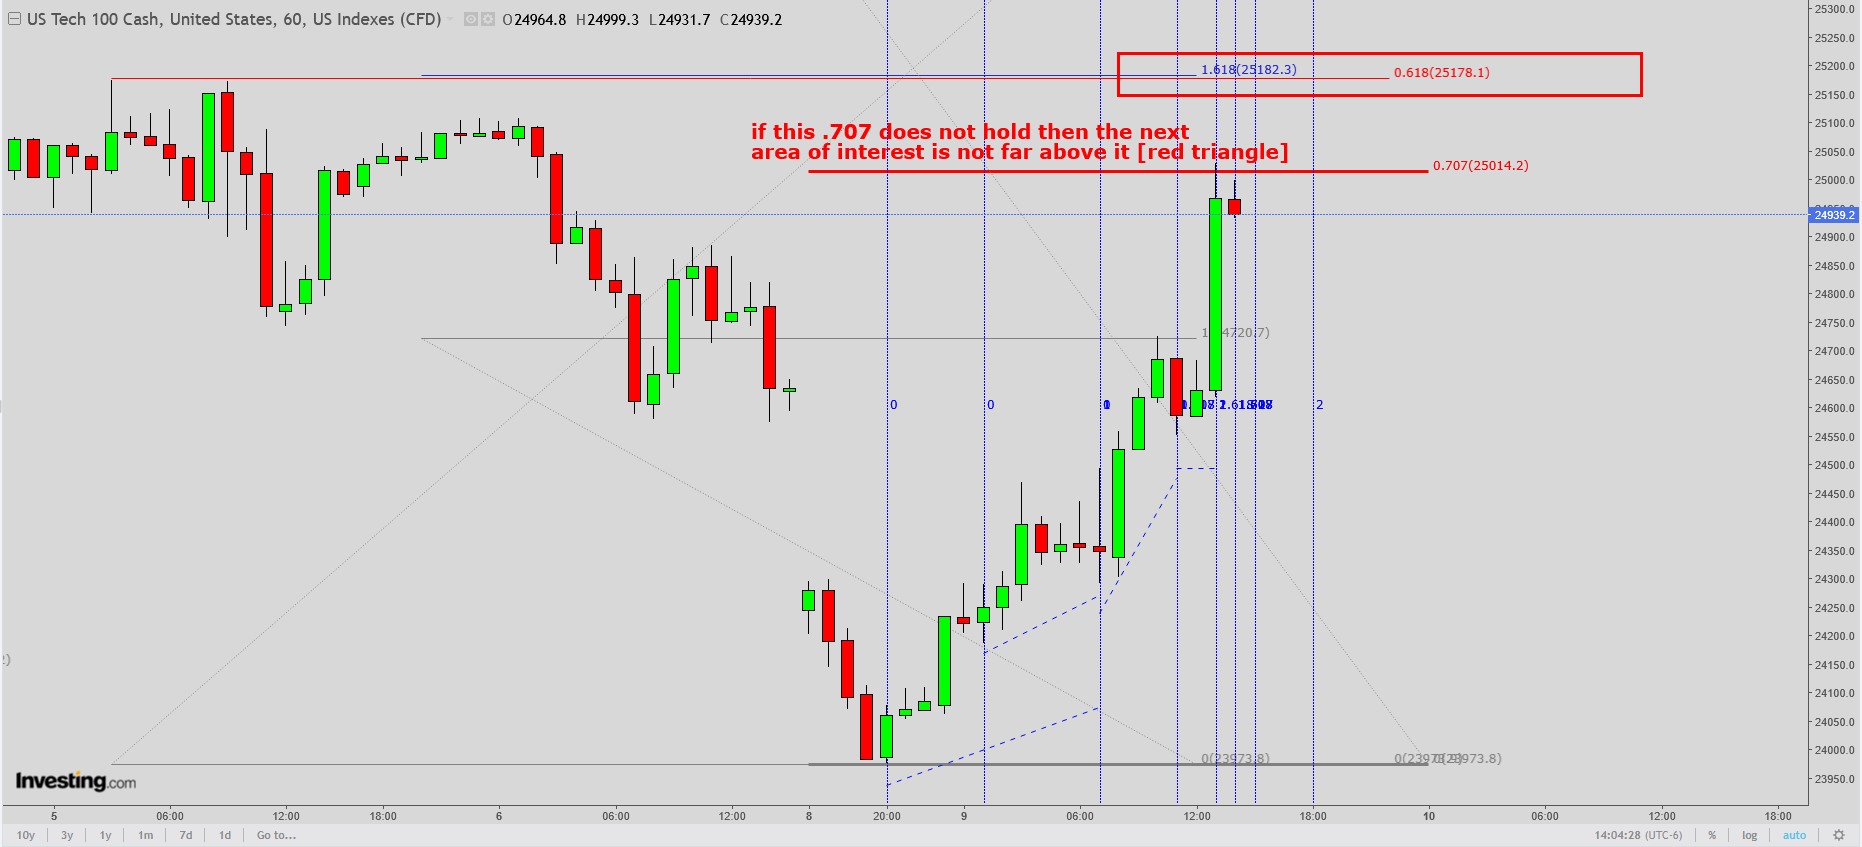
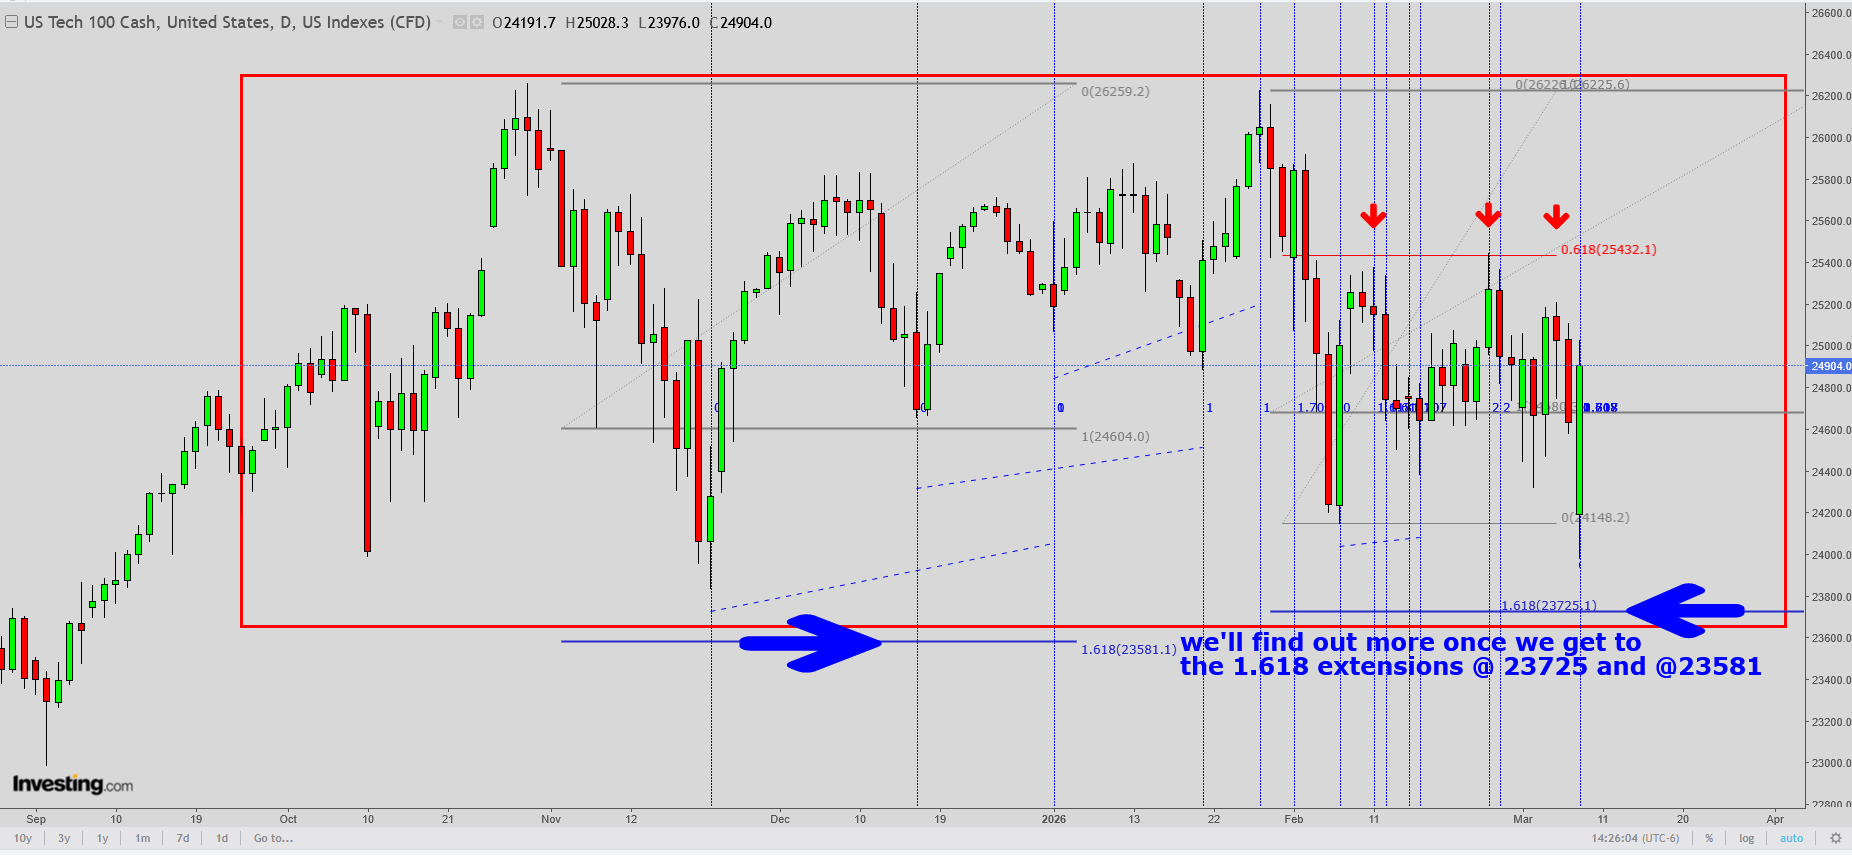
Back to the daily for a longer term view ...
The fact that Donald Trump considers the stock market making news highs as a key part of his legacy helps to establish some guard rails on how extreme he will get in Iran.
He was blindsided by his lack of looking forward last week/Sunday Night but gets it now and will likely try to minimize stock market negative comments as much as possible.
However, this is Donald Trump and nobody(including Donald Trump) can predict what he might say tomorrow(or an hour from now). And there are MANY unintended consequences of wars, including what Iran might do and even more so, what rogue state Israel might do, as they have been the entire impetus for this war.
And Trump's economy is doing very poorly which is another negative on the stock market and there's no way he's going to change his mind on the ruinous tariffs for the next 3 months.
https://tradingeconomics.com/united-states/stock-market
1 month: Horizontal lines were the filled gap (last week's low and the open on Sunday night). Typically this is a selling exhaustion signal as fresh news while the market was closed causing it to open lower than the lowest price of the previous daily/weekly bar because traders all want out at the same time with their sell orders forcing the price much lower to uncover enough bids to match the massive selling orders. When all these panic sellers cover their long positions............shortly after this, all the selling dries up because everybody that wanted to sell/get out........ is out already.
In the absence of additional selling, then the buyers suddenly have to bid up the price to uncover fresh selling which only happens at higher and higher prices since most of the selling was exhausted with the gap lower.
If this continues to the point of completely filling the gap(not being able to uncover enough fresh selling with higher prices in the gap) it's a powerful sign of selling exhaustion. Traders willing to take on new shorts or cover longs have run out.
This is what happened yesterday when we filled the gap below. Despite that, the follow thru today has been meager so far as we are still below previous highs.
This is a news dominated market right now. The news later today and the rest of the week will be 10 times more important that my analysis on this page.
The 1 formation that has remained solidly intact is the rounding top on the 1 year price chart. Only a close to definitive new record highs that holds will negate that rounding top configuration.
That's always possible but seems pretty unlikely in the current environment with OVER valuations, negative economic news/indicators and a war.
The self fulfilling prophesy that has been fueling recent stock market strength has its limitations when being battered with excessively negative news.
I cant stand this!
The left handed basketball player who FUNDED Iran to the tune of billions and the diaper toting mirage of a politian, the face to Bummer's third term, allowed oil sanctions to be lifted from Iran and HAD ample time to prevent nuclear proliferation. Since he IS in favor of USA demise (no doubt due to his real heritage and ideological preferences) he drew a line, but had neither the balls or willingness to address the evil Iranian god/ruler, so he did not cross the line, then allowed the most disgraceful withdrawal ever.
Are you rooting for a continuance or end to the conflict in the Mideast? I do not 'hear' you condemning Iran or its dismissive policies.
Mike, you seem to have had the insight to 'want' to get long crude, predicted a violent end to the 8(?) day massive rally, yet neither promoted trades nor apparently took any trades. THAT I understand--only VERY nimble trading with a massive account could/should have participated.
Had I the willingness to 'listen' only to your tactical decision regarding long, then short positions in crude, my account would have been totally transformed. Yet, I failed to trade. The severity also nearly (partially) overwhelmed my ability to market grain.
CAN we not learn from the last ten days or so and apply it to better trading? Parabolic, gap and crap, high RSI, severely over bought/sold etc are always in your posts--thank you.
Enough from me. Let us all participate in a well reasoned plan for another trade.
Thanks very much, tjc.
For somebody that criticized me for bringing politics into the trading forum(to discuss the politics which is dominating the decisions that are causing market chaos) you seem to be violating your own rule.
And also accused me of making personal attacks(which I asked you to please show me).
I cant stand this!
I totally believe your last statement, tjc.
And the reason you can't stand it is that you have no tolerance for reading things that disagree with your politics. Since the stock market and crude oil are trading politics right now, the politics of what's coming out of Donald Trump's mouth as well as his political actions, it's impossible for me to do an objective analysis of where the markets are going without discussing THE POLITICS that include my opinions of the politics.
I'll just copy the same thing that I responded with to another MAGA poster here a few minutes ago.
By metmike - March 10, 2026, 2:20 p.m.
+++++++++==
Like with mcfarm, you and I have a tremendous amount in common and that's my focus on our friendship. I will always respect you and your views and encourage you to make them here but will be honest with responses and not molly coddle posters with fake sincerity.
Or take anything personal.
Would it just be more objective if you accurately prognosticated, "when the oil traders perceive that the supply of oil will no longer be disrupted, a sudden, violent drop in crude prices WILL take place. Whether this drop is precipitated by comments from the newly anointed Iranian ruler, Trump, an oil minister, Llyods of London, or mere evaporation of buyers, we all know this parabolic move will end".
Then you could have suggested a comment made by trump (President Trump) that the matter "is completely" or almost over is what precipitated the crash.
It would also have been objective to point out Iranian drones causing havoc near the Straits was the reported reason for Sunday night demonstratively higher surge.
WHATEVER, please be grateful OUR ARMED FORCES performed superbly.
Thanks very much, tjc and great points.
I am always eternally grateful to our brave, patriotic soldiers that give up their lives for our country. We owe everything to them.
This has nothing to do with trading or where crude or the stock market will go but I am always appreciative of any points that posters want to make that agrees with me(like this last one) or that disagrees with me(the previous one).
And please realize tjc that I generously make my contributions here for free and have a dozen other priorities in my life.
I am just 1 person and can't possibly cover everything for everyone, especially in the form that they want it.
That's were I count on posters like you to make YOUR points with no censorship. If you think that I missed something, instead of condemning me based on unrealistic expectations of what 1 person doing this for free can do.................post it yourself and help me out.
WELL WRITTEN! Frankly Mike if it were not for the respect I have for you AND your knowledge, I would not challenge your position. Others may 'think' we have great dislike for each other. Oh how so wrong. You would not tolerate my posts, and I would refrain from ever reading/posting if we truly disliked each other.
Now for a market post with no bias other than a trader perspective.
The indexes tried to trade higher today, did so for much of the day, and appear to be headed for a small loss as suggested in Monday's post (above).
Tomorrow, perhaps starting tonight, probably selling. It may or may noy be a modest selloff. If pressed, I would suggest some 'negative' comment from Iran or perhaps retaliatory missile/drone action. And/or, to some poster's observation, an outburst from our President. (Fairly predictable market behavior with fairly predictable prospective 'news'.
IF,IF, Monday were 'the' low, Wednesday night/Thursday 'dip' will be the time to initiate a long position---a March 20 call might be a method rather than an outright long--use stop. IF Monday proves to be 'the' low, it comes 16 weeks after the last weekly low November 21, 2025, 6525 futures. Thus SP remains in upward trend.
My two cents!
Outstanding post, tjc!
The mouth of the most powerful man in the world will determine where we go from here!
https://tradingeconomics.com/united-states/stock-market
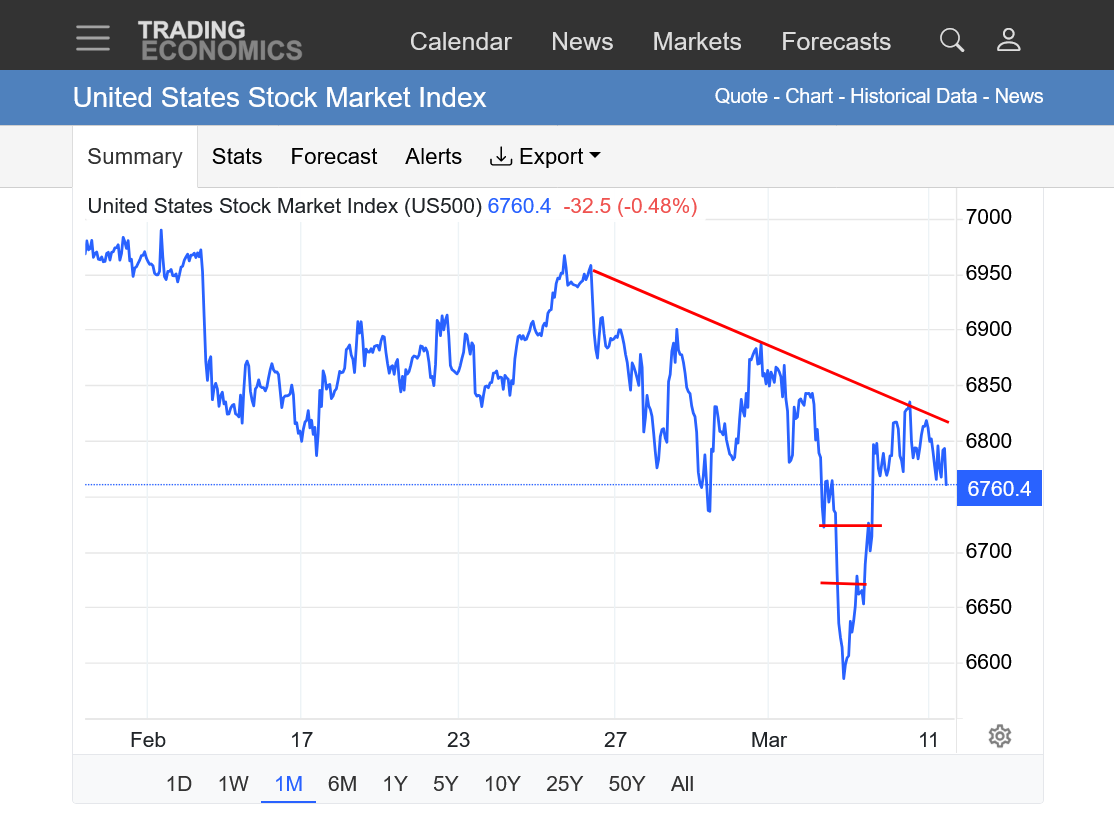
Horizontal lines are the gap between last weeks low and the open this week(after Donald Trump's war escalated and caused a crude spike higher). We had a spike lower right after that, then a reversal up that filled the gap/gap and crap(after Donald Trump suddenly changed his verbiage to tell the market that the war was almost over).
Despite that powerful, BULLISH technical formation (reversal up from a selling exhaustion) the market has been unable to generate any follow thru. In fact, the market FAILED at a lower high than the previous high and is showing a short term DOWN trend here late on Wednesday morning.
Stay tuned. The lines on the graph below are excellent in describing how the market(Composite Man from Wyckoff) has been thinking and reacting to what it knows but nobody has a clue about what Donald Trump will do next(including Donald Trump.
5pm: Actually we are in a realm of unintended consequences from this unprovoked war as Trump's jawboning to rally the market today was ineffective. He needs to end the war to really have a more lasting positive impact. I think this is likely because the stock market means everything to Donald Trump.
Even after the war ends, the bad economic news(tariffs) will be a huge deterrent to the stock indices making new highs.
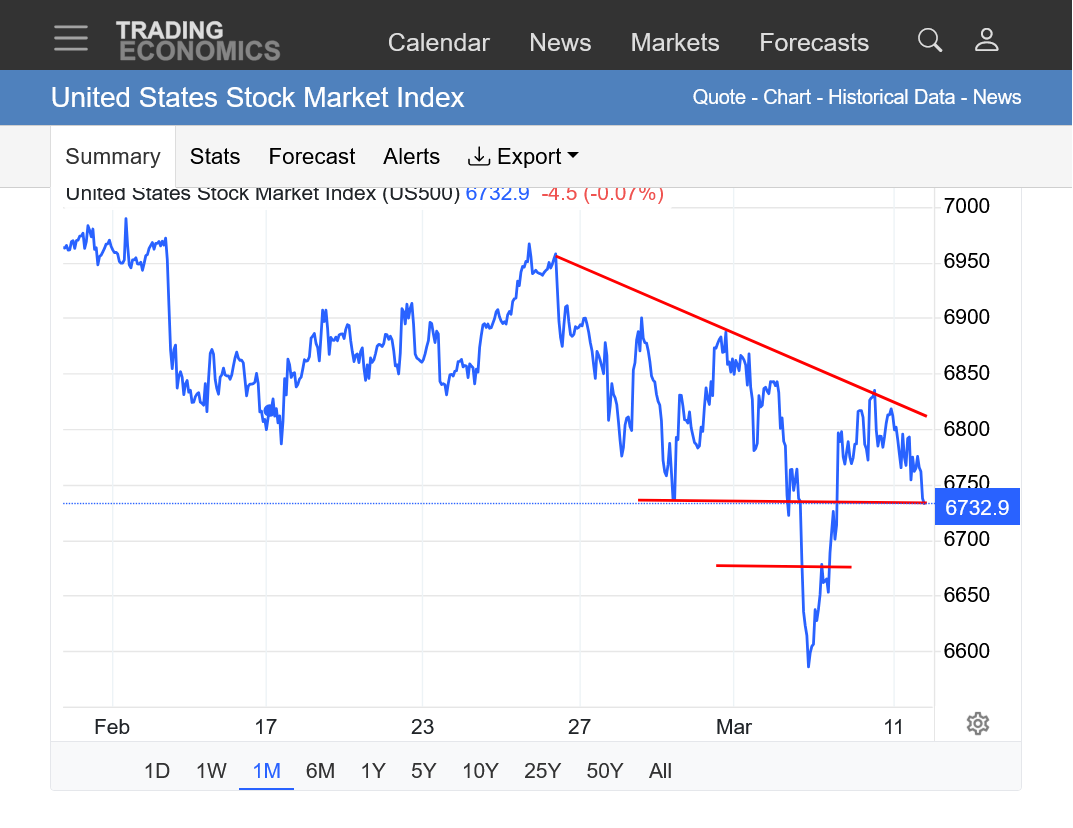
The market below is failing at progressively lower highs. Take away the spike lower to start the week and we have a well defined DESCENDING triangle which would be a continuation pattern in the move down from highs earlier this year.
We're at the top of the gap lower(last weeks lows right now) with the bears in control but maybe this will act as support???
The only chance to turn things around is if the war ends FAST. Good chance for Donald Trump to do that because his top priority is the rich people and stock market. That's based on Donald Trump bragging hundreds of times in the last year about all the new stock market highs(50+ he claims) that he caused.
Same analysis as yesterday on the page above this, except the move down is accelerating a bit.
Now BELOW the entire gap lower on Sunday Night. The bulls gaining brief control with Mondays gap and crap, selling exhaustion reversal up has been totally negated and the bears are in the drivers seat. The spike low on Monday should serve as solid support. If that gives way, the longer term bull market on the charts may start looking very shaky, especially if Donald Trump does not end the war fast(which I expect) and it drives our economy into a recession even quicker.
I think that the market knows that Donald Trumps top priority is the stock market and gasoline prices and he will cave on the war, after causing massive chaos. He will make up things about the greatest victory ever. How he won by a lot, even more and quicker than he planned and accomplished even more than he wanted to. And thanks to him, the world is safer and thanks to him energy prices will be the lowest ever.
Watch for it!!!!
https://tradingeconomics.com/united-states/stock-market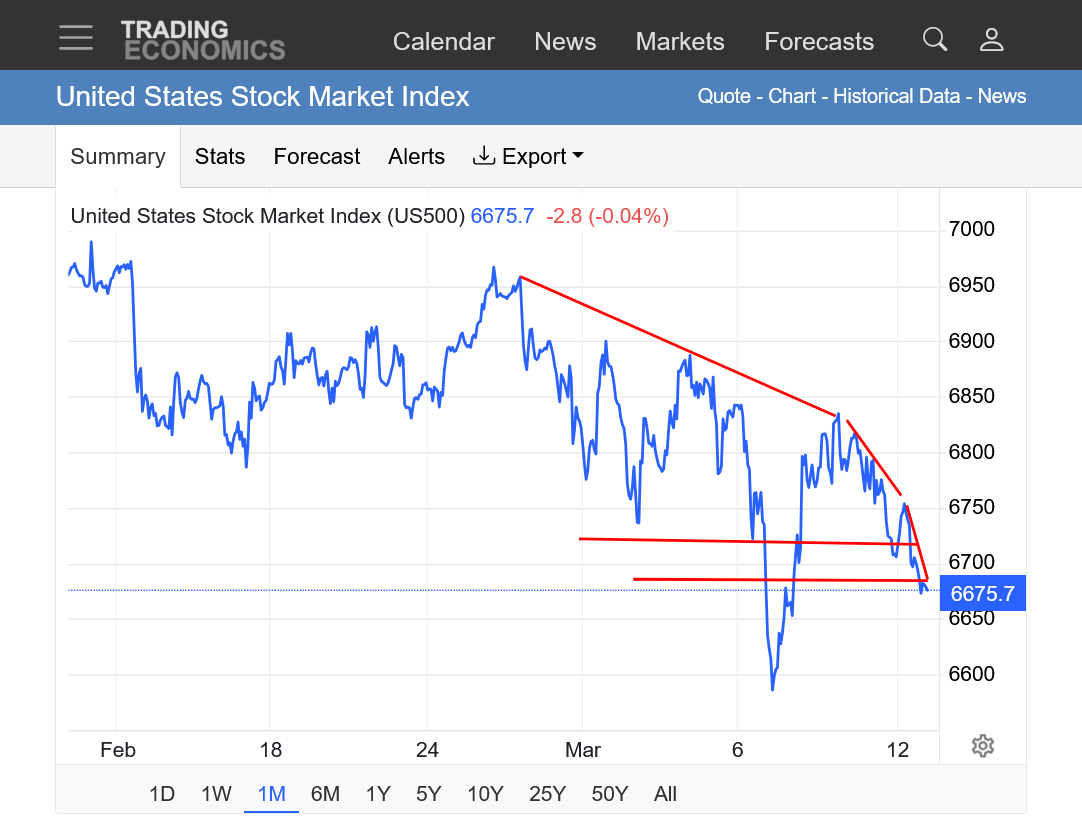
6808 appears to be a critical make-or-break level for the market. A rejection from this zone could trigger another leg down toward the 6530 area. From there, a recovery and a decisive move back above 6808 would be an important signal for bullish momentum to re-emerge, opening the way for a projected move toward 7070.
If the market manages to break and hold above 7070 on a daily closing basis, the next upside projection comes near the 7450 region. However, that zone could act as a major turning point. From that area, there is a strong possibility of a significant decline developing, with downside risk extending back toward the 6200 range, potentially around June 2026.
Overall, the coming months look highly volatile, with key levels likely to decide whether the market stages one more rally before a larger corrective phase unfolds.
so cyclical?? Edit next low 21 march or 28March if unable to break above 6808 and 6478 ish area important and let us see how market reacts 6112 is Altogether hold For massive move down in Panic Scenario
Thanks very much, fayq!
We should probably start a new thread but there's so many great posts on this one, so here's 1 more on this topic:
https://tradingeconomics.com/united-states/stock-market
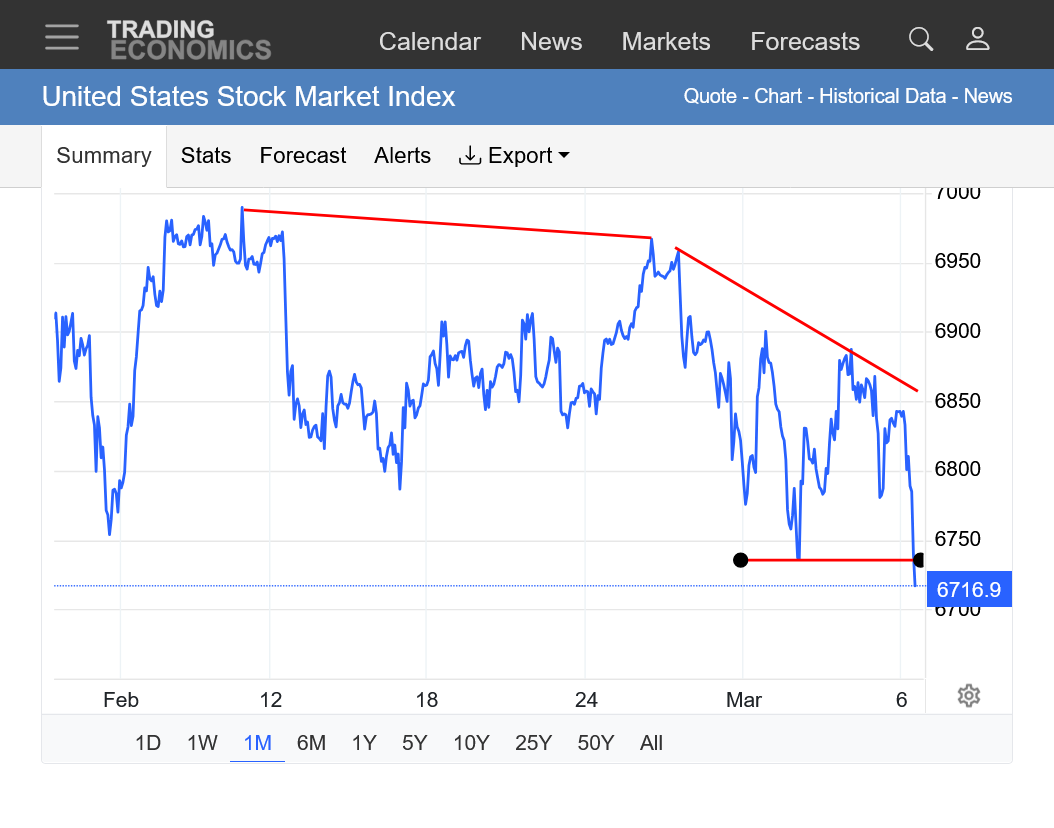
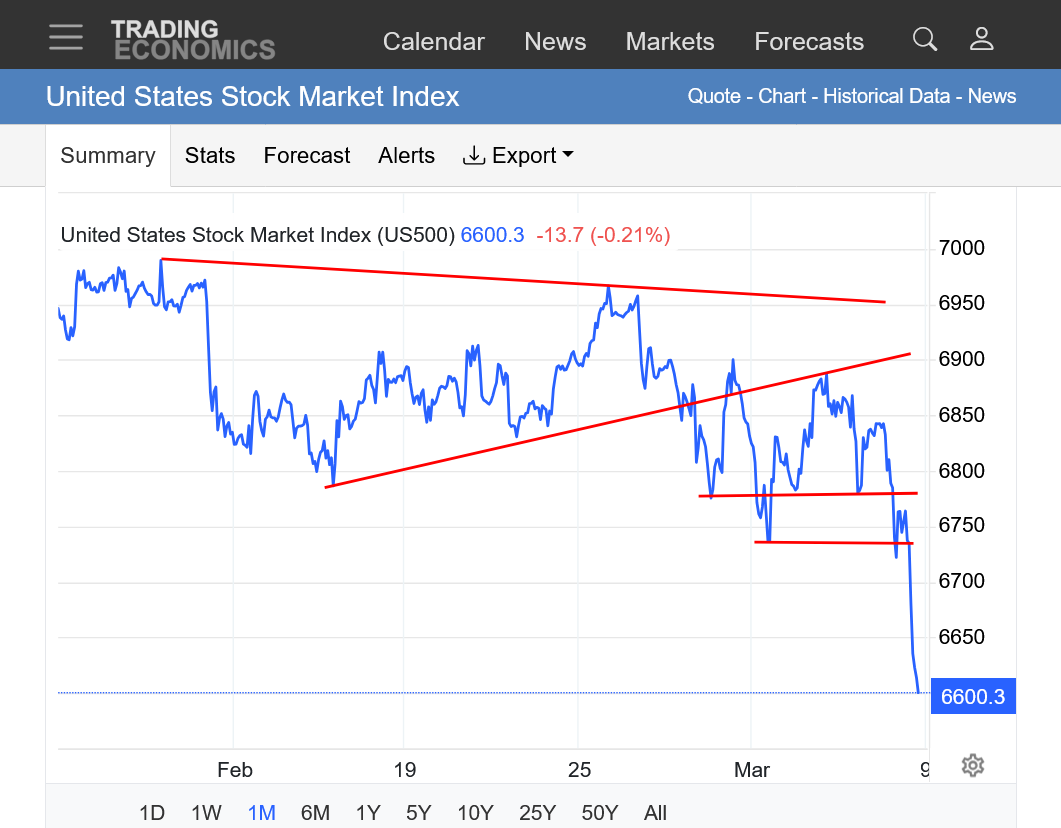
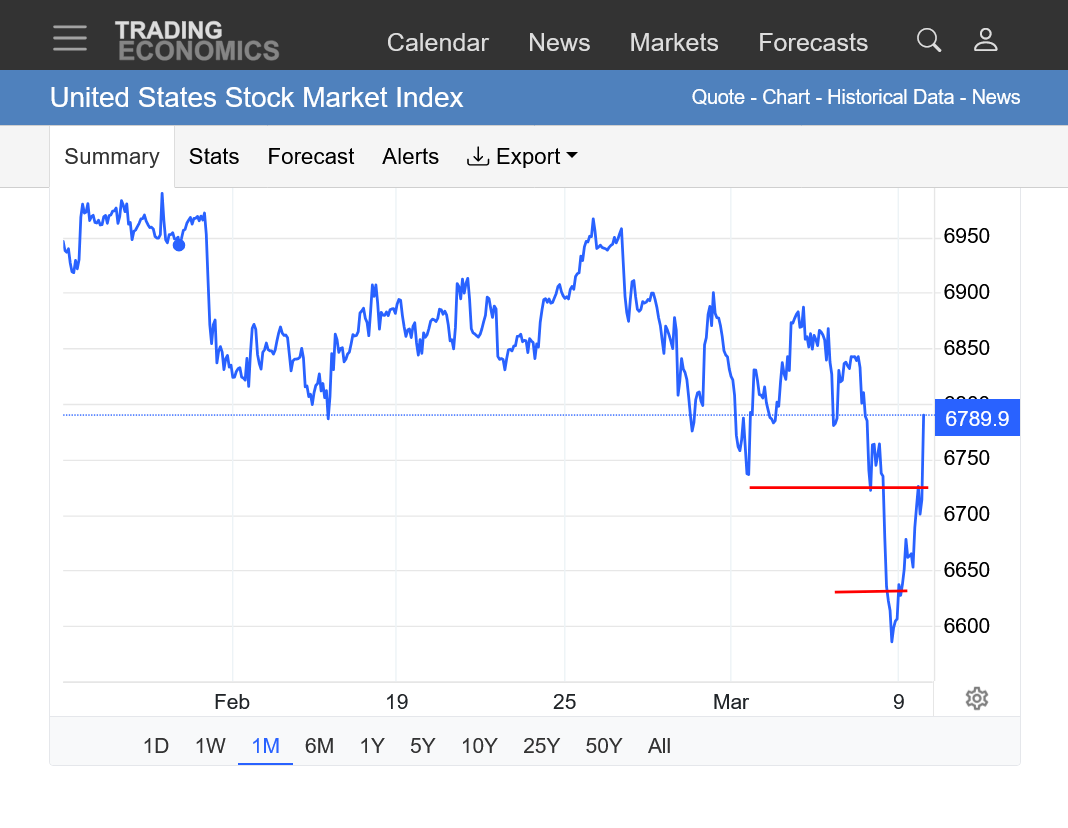
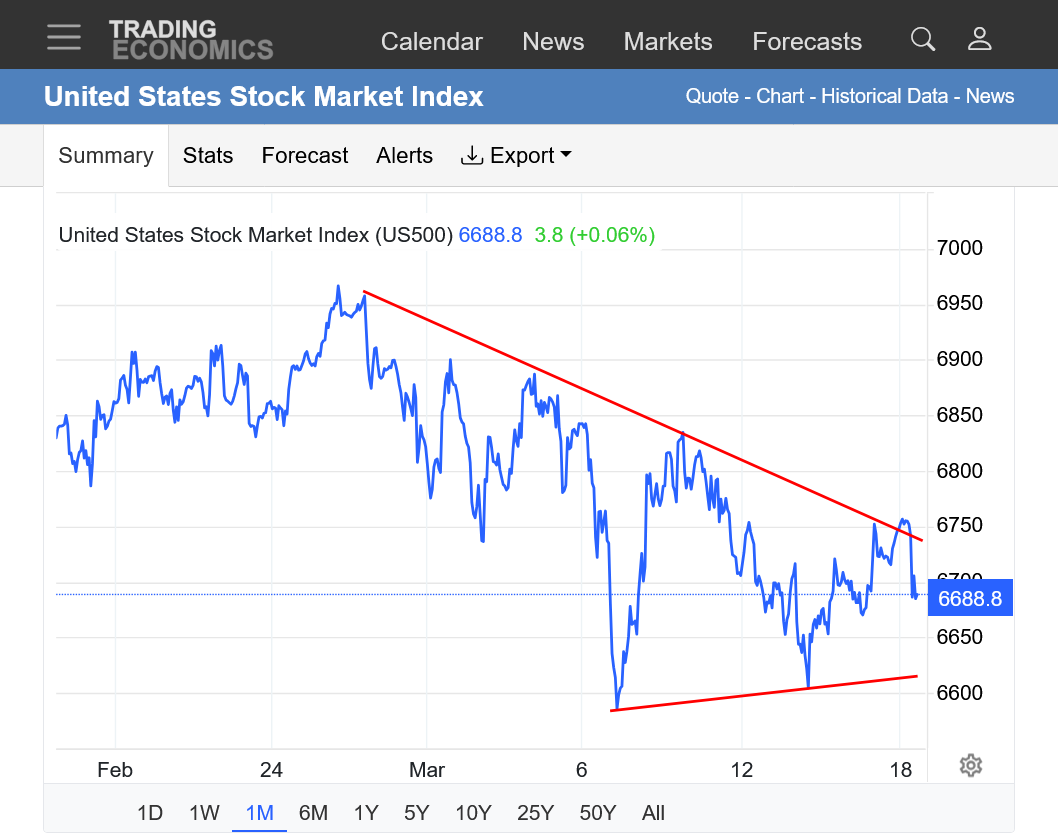
1. 1 month: Strong downtrend that accelerated last week but made a double bottom.......or will this just be a BEAR flag? Also another possible symmetrical triangle. We showed you the break out to the downside of the last symmetrical triangle earlier in this thread.
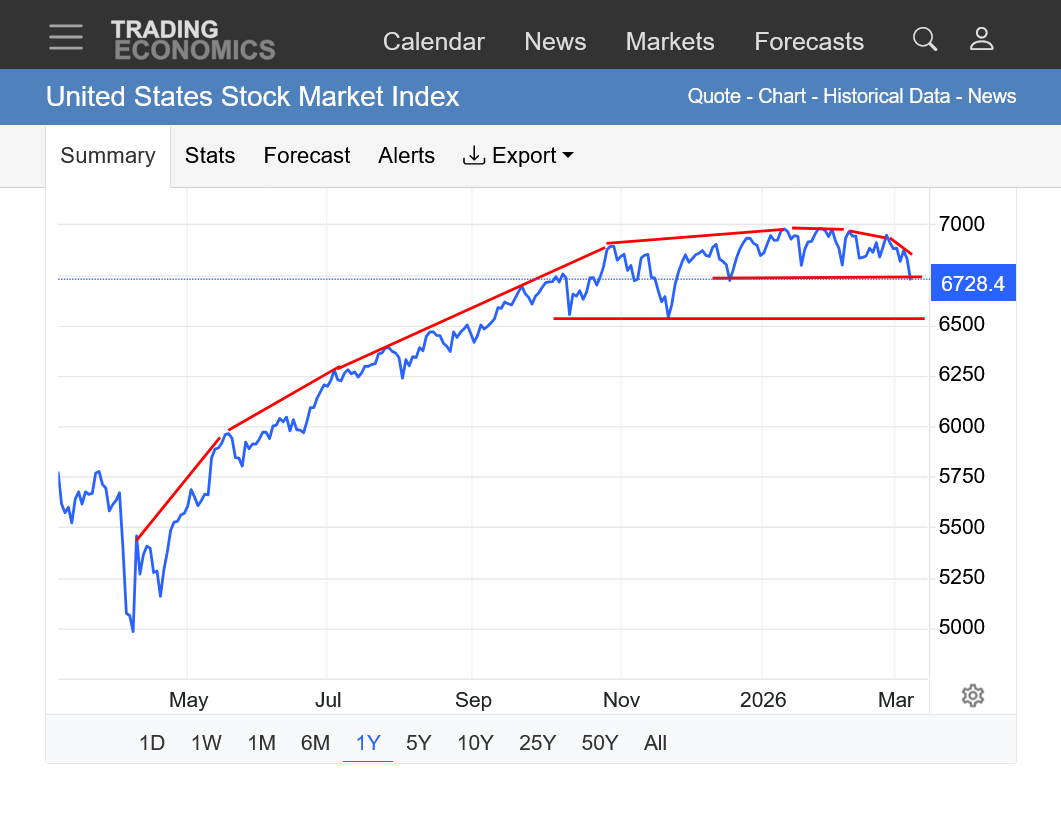
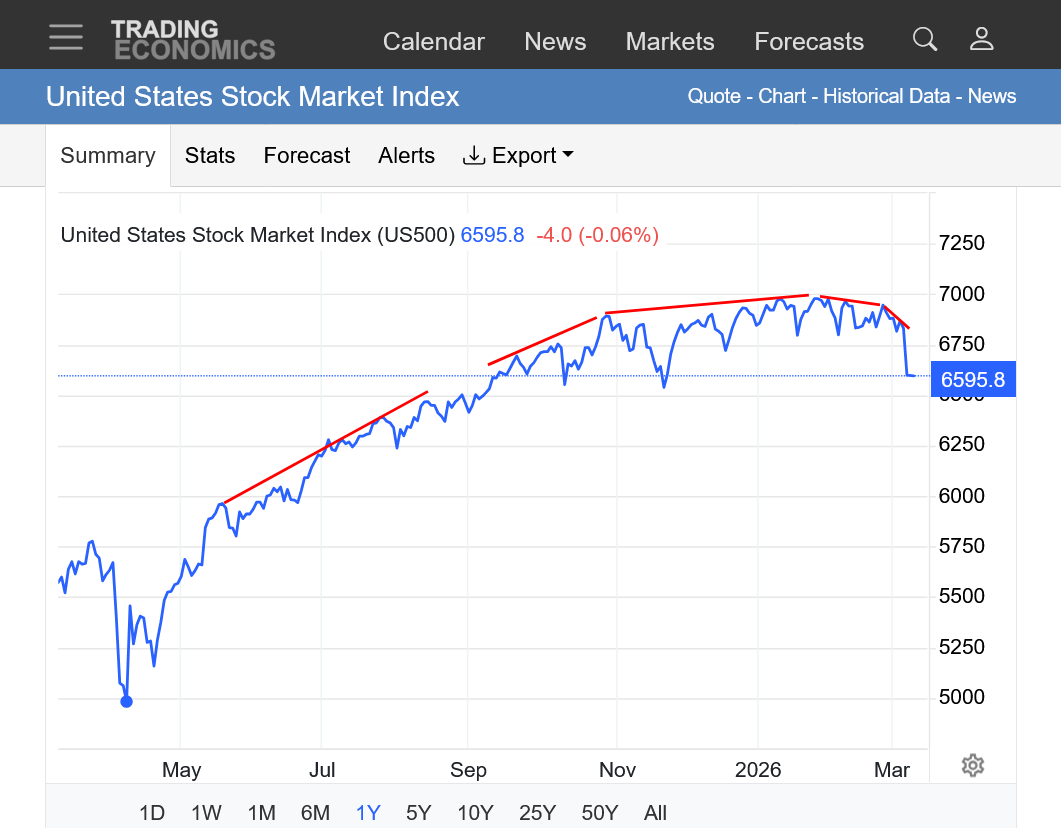
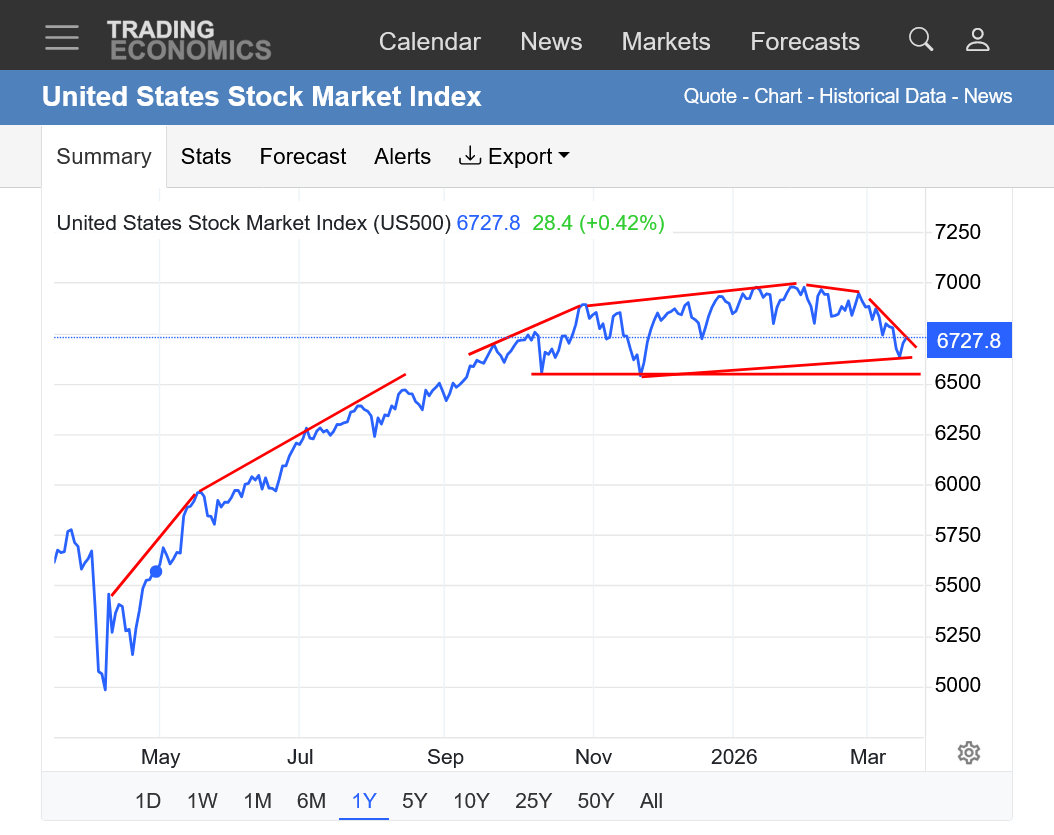
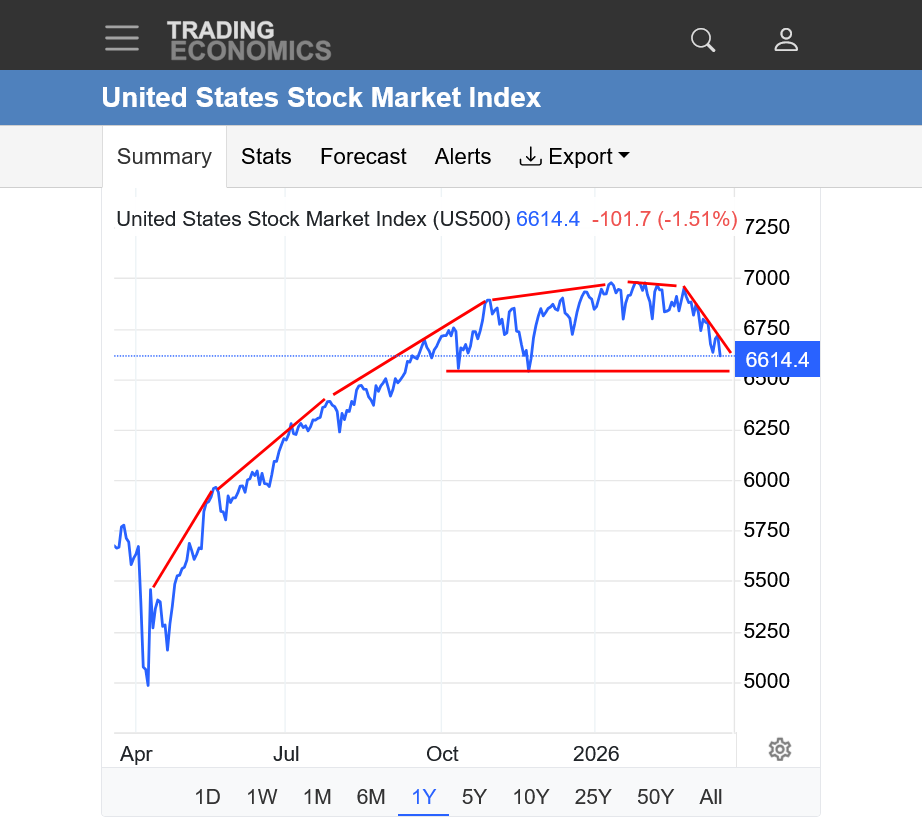
2. 1 year: The rounded top formation continues to be confirmed. The stock market has no only lost steam/momentum from an uptrend that became less and less steep in 2025, we are now in the DOWN trend on the other side of the high/peak. The only thing that will negate this very profound chart pattern is new, definitive highs that continue higher which seems almost possible to imagine with so many dark Donald Trump clouds raining on the economic parade.
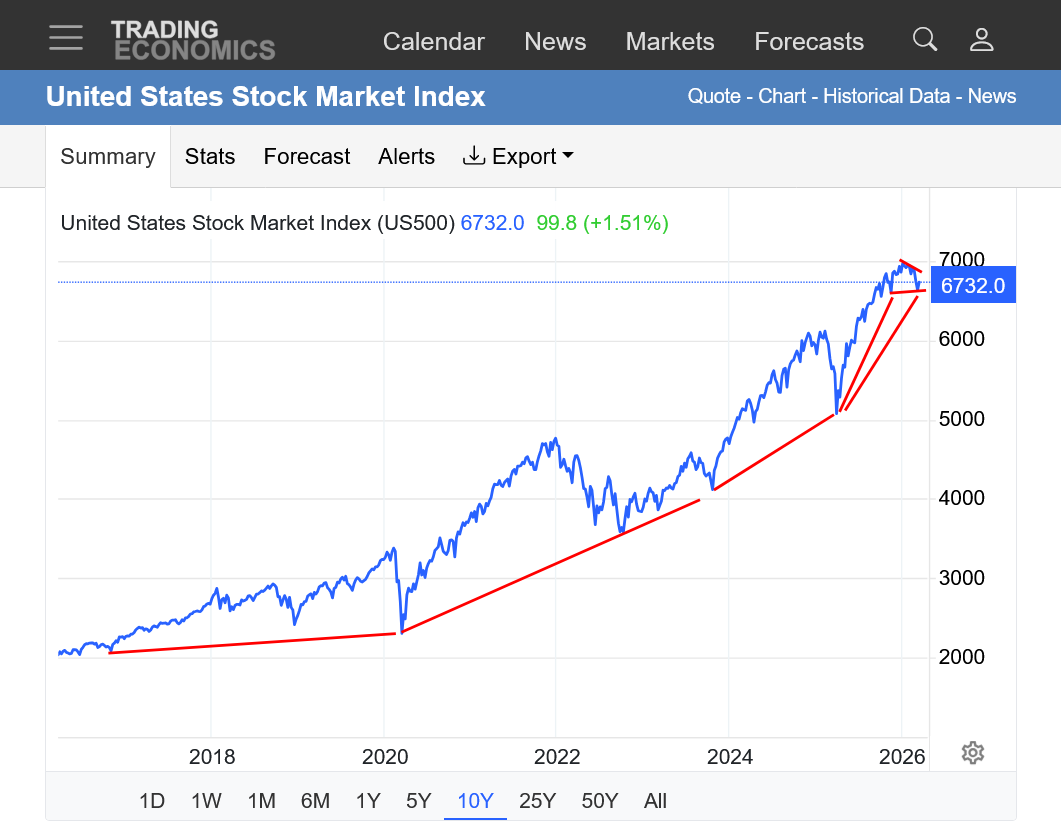
3. 10 years: The exponential/parabolic move higher is breaking down. This COULD be a bull flag but the amount of bearish news pounding the market seems to be overwhelming. The only thing keeping it up is the Ponzi Scheme nature and self fulfilling prophesy that keeps money flows coming by ignoring the fundamentals(extremely overpriced in an economy doing poorly) and instead and instead is based on the desire of enough people for the market to go higher that is strong enough for them to continue to behave, with their money/investments in a way that completely ignores all the reasons for it to go lower. 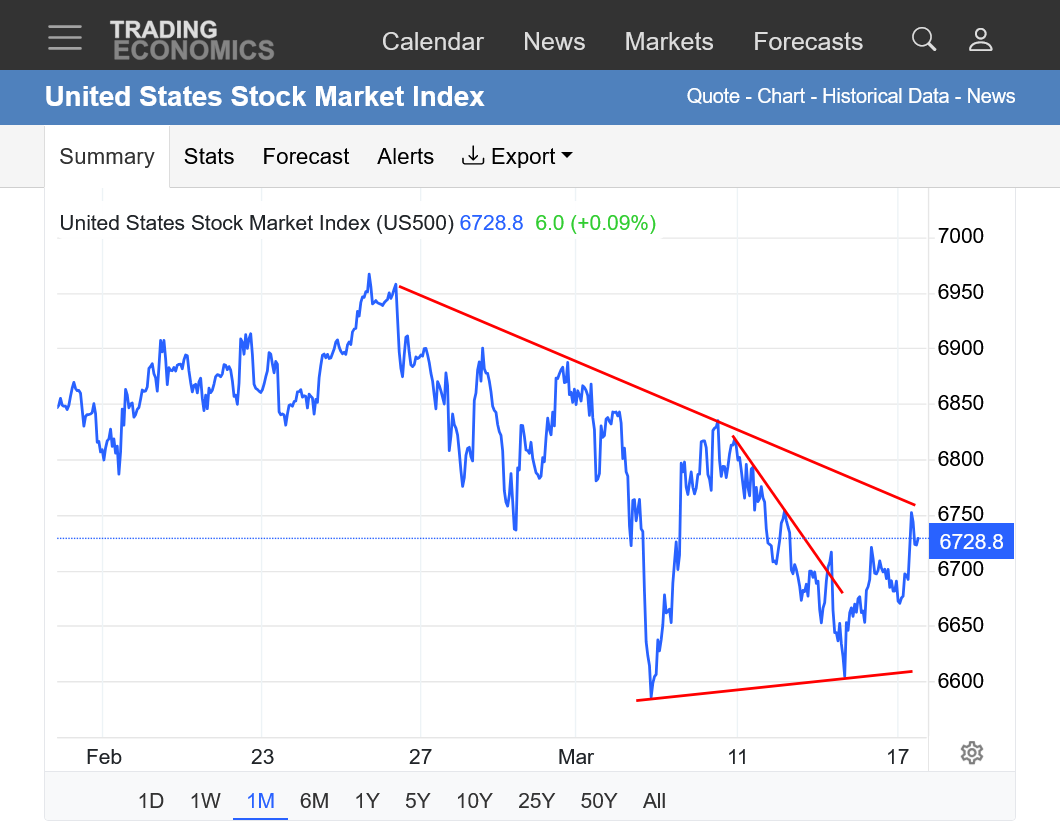
https://tradingeconomics.com/united-states/stock-market
NEWS still rules but the symmetrical triangle noted from yesterday is looking the most likely in the absence of more powerful NEWS. With a strong downside bias. If the war in Iran continues, along with oil supplies disrupted, a downside break out is inevitable.
Donald Trump's top priority is the stock market, along with the rich and powerful people and gas prices, so it also seems inevitable for him to take actions to reverse course and completely make up reasons for those actions(that include a fake victory and accomplishing all his objectives). But now, he's facing the Law of Unintended consequences and has GIVEN IRAN CONTROL of the oil market. So Iran has him by the balls and he killed the person that had agreed to reduce the enriched uranium stockpile the day before he bombed Iran unprovoked.
The US doesn't even have a person in Iran that they can negotiate deals with now!!!
Re: : Market opens tonight, 3-1-2026/crude
By metmike - March 18, 2026, 10:49 a.m.
++++++++++++
1:40 pm: LOWER highs continue. Bears are stepping in to sell at lower and lower prices. Again, NEWS will (Donald) trump everything.
Odds favor Donald Trump suddenly reversing course and making up new reasons that include the greatest military win in US history and him stopping another war and saving the US and world without the help of our despicable allies that have shunned the United States because of psychopath Donald Trump shssting on them for the past year.
Then, psychopath Netanyahu will come out with statements, maybe even another YouTube video, congratulating Donald Trump for his great leadership in eliminating the biggest threat to the world (ask people in Gaza what they think the REAL threat is).
The question is not IF this will happen but WHEN it will happen.
You can really bet on Donald Trump's obsession for vengeance against anybody that doesn't do what he tells them to result in him trying to punish our allies for not supporting this unprovoked, unjustified, ruinous war that is hurting the entire world.
Donald Trump will NOT forget this and he's already decided to punish them any way that he can.
4pm: Market closed on its lows.
https://tradingeconomics.com/united-states/stock-market
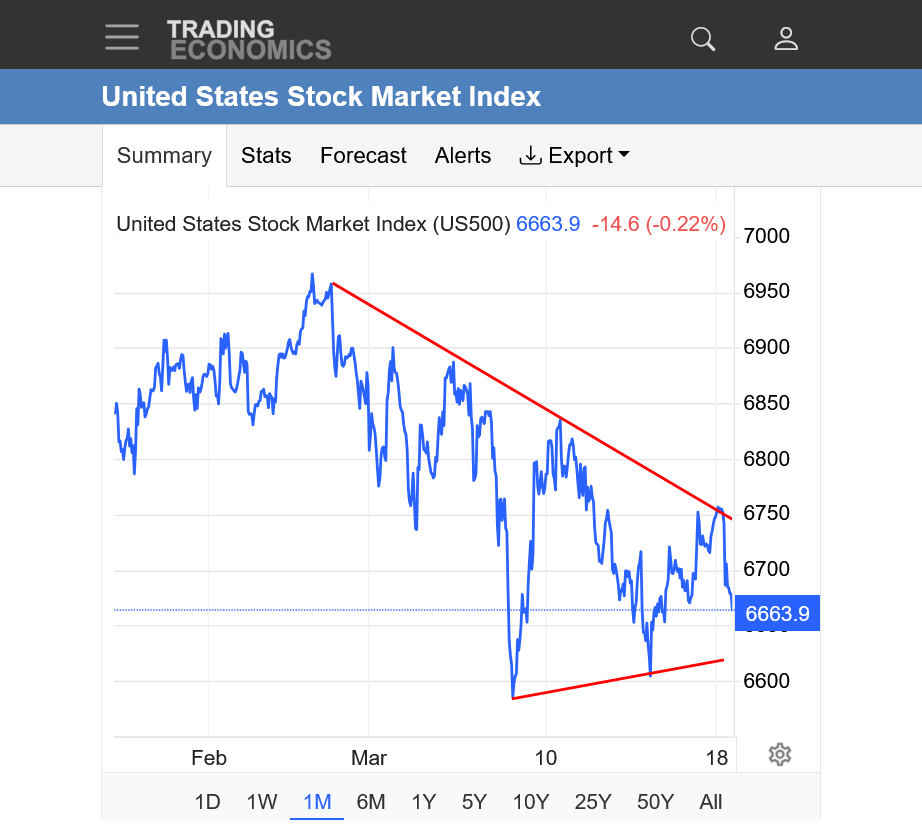
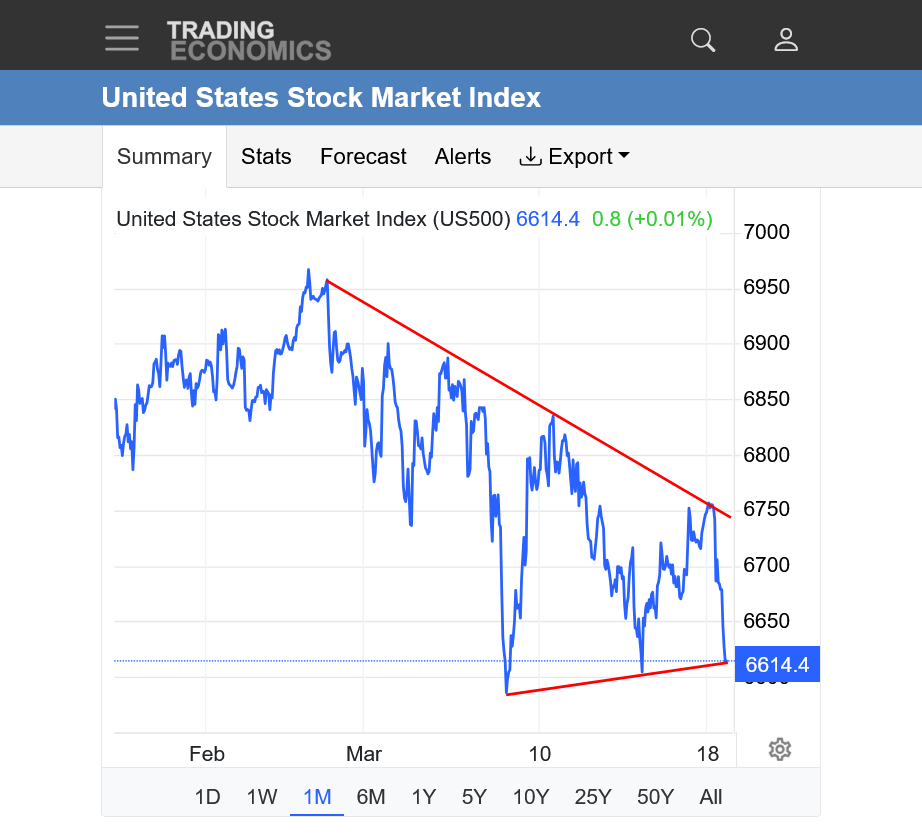
1. 1 month: close to a downside breakout.
2. Rounded top that we identified in late 2025 continues to be validated. Next MAJOR support is last Oct/Nov lows. Below that could cause some big selling signals in trading programs.
It's all about the NEWS regarding the Trump/Netanyahu unprovoked war in Iran. It will end at some point and I strongly suspect the stock market will spike way up immediately after that.
HOWEVER, there is PERMANENT DAMAGE to the US economy that will weigh on the stock market for the rest of this year. Other economic indicators were already flailing.
The biggest surprise for me would be if the way overvalued, rich people's Ponzi scheme can somehow make definitive new highs under this environment after the war is over. Especially since the Ds will be taking over the House with near certainty and the market starts trading THE IMPEACHMENT INVESTIGATION more and more.
https://tradingeconomics.com/united-states/stock-market