Get all the comprehensive weather here:
https://www.marketforum.com/forum/topic/83844/
Previous thread:
2-16-26 active weather week!
28 responses |
Started by metmike - Feb. 16, 2026, 7:04 p.m.
https://www.marketforum.com/forum/topic/117950/
+++++++++++
3-4-26: The constantly updated week 2 map below is now AFTER the period of expected heavy rains that are loaded up in week 1.
A huge pattern change will elevate the risk of flooding rains in parts of the US, starting late in the first week of March.
https://www.cpc.ncep.noaa.gov/products/predictions/threats/precip_probhazards_d8_14_contours.png

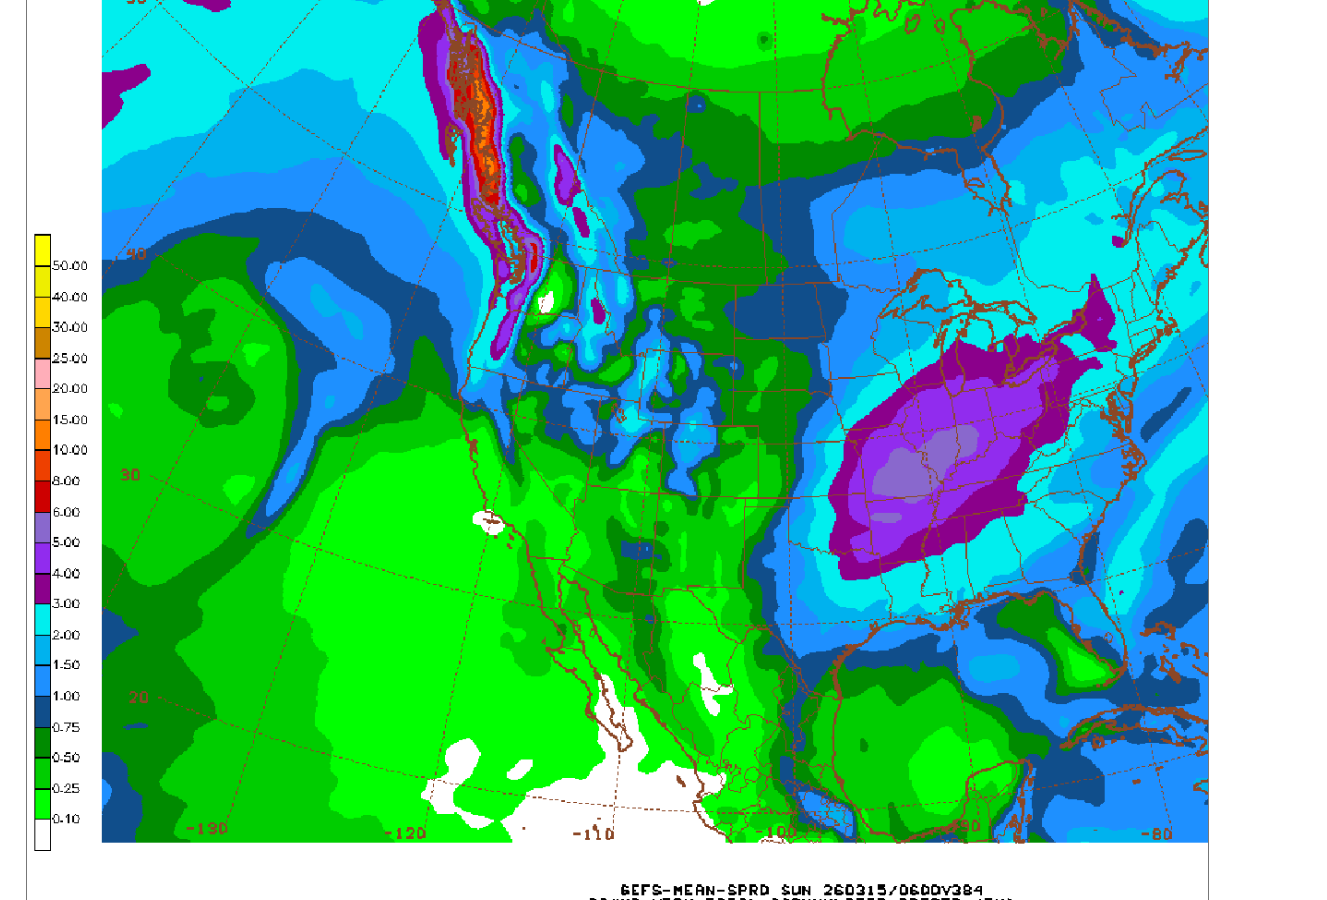
This is likely being UNDER done(especially south and west of the heaviest rains). The center band is 5+ inches of rain. This was the last 6z GEFS model total rain forecast for the next 384 hours(16 days).
https://mag.ncep.noaa.gov/Image.php
This was the total rainfall anomaly from the last 0z European Ensemble model for the same period.
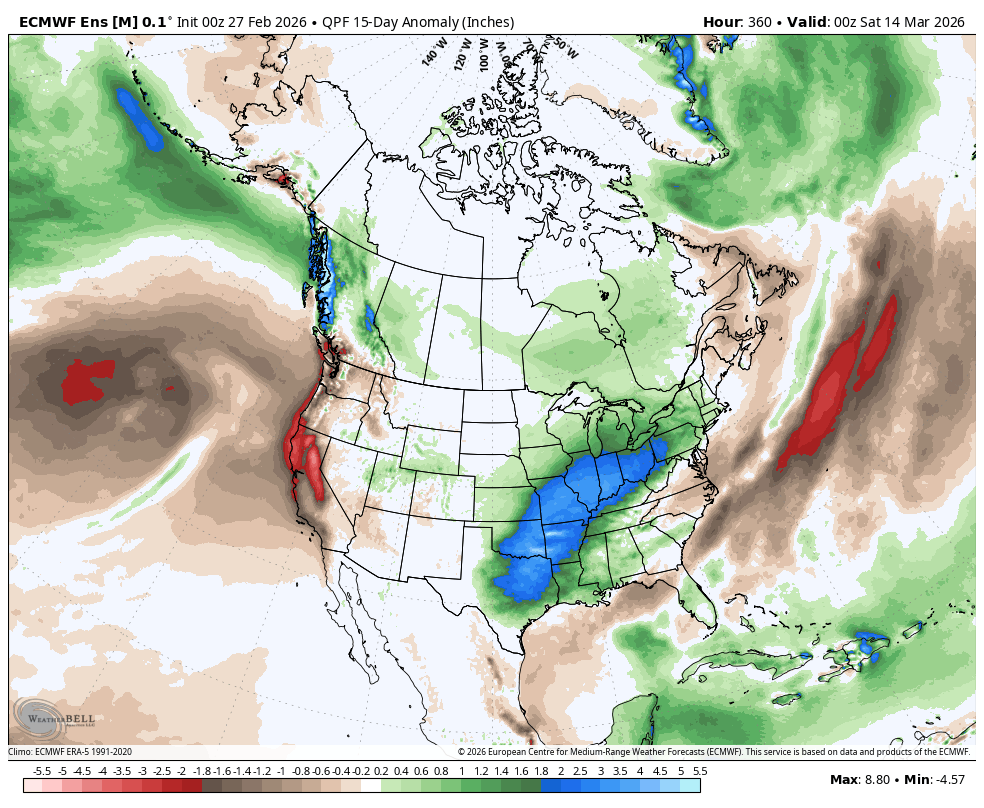
The upper level pattern will take on a completely different pattern than we've seen all Winter, which has been very dry thanks to the La Nina and dry air masses coming down from the north.
https://mag.ncep.noaa.gov/Image.php
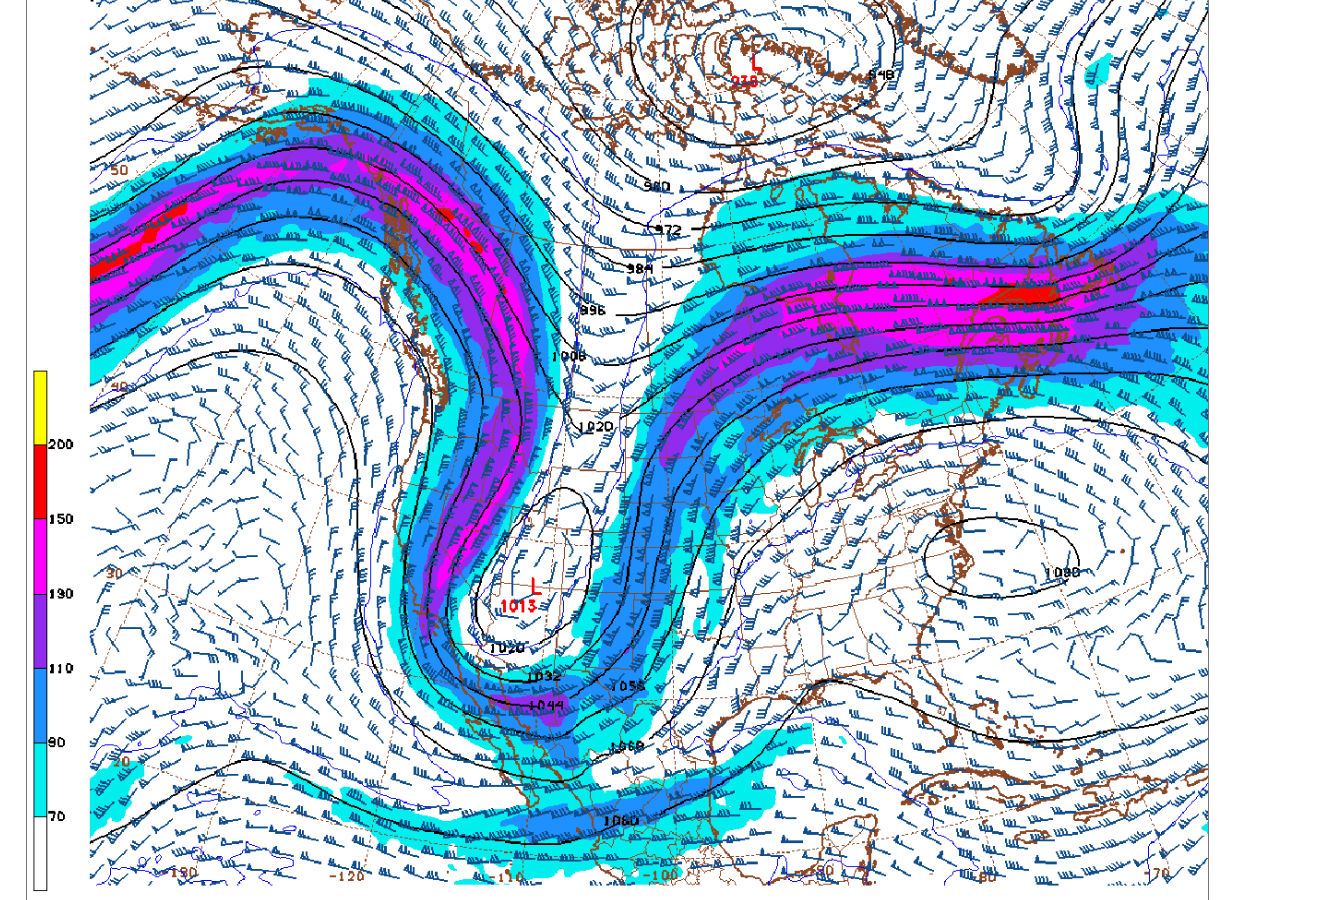
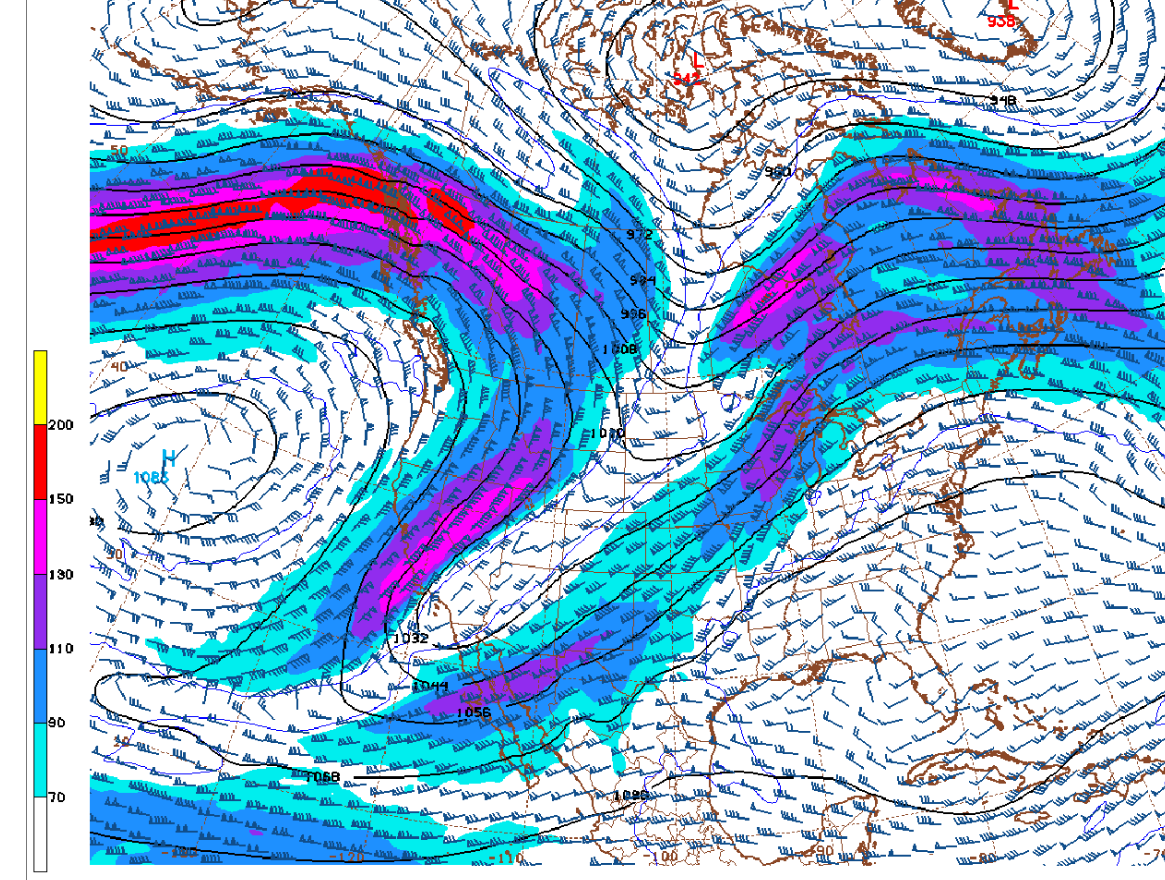
This is the jet stream(steering currents) above 30,000 feet March 9th, 10+ days from now.
The main feature of note that's not been seen in many months is the upper level high in the Southeast. We've had plenty of warm air masses this Winter but they were always dried out PACIFIC air masses that tracked west to east across the country. Lacking significant moisture.
This particular pattern is a textbook Gulf of Mexico, deep moisture air transporting pattern on the backside of the huge upper level high in the Southeast.
Any sort of perturbations in the warm/humid air on the periphery of the high will have unlimited moisture to work with. In this case a deep trough and jet stream will provide the organized lift to a huge area that will be loaded with juicy, unseasonably high precipitable water values. These large scale features in the new pattern many be very slow to move(not very progressive) which increases the risk of excessive rains over numerous states, starting from the South-Central US and extending northeastward to the Ohio River Valley.
This 7 day rainfall map is updated a couple times/day. It will be loaded with rain for the next week+:
7 Day Total precipitation below:
http://www.wpc.ncep.noaa.govcdx /qpf/p168i.gif?1530796126

This rain will be completely wiping out major drought over a very large area.
https://www.marketforum.com/forum/topic/83844/#83853
Soilmoisture anomaly:
These maps sometimes take a day to catch up to incorporate the latest data(the bottom map is only updated once a week).
https://www.cpc.ncep.noaa.gov/products/Soilmst_Monitoring/US/Soilmst/Soilmst.shtml#
![]()

++++++++++++++++++++++++++++
Updated daily below:
https://mrcc.purdue.edu/cliwatch/watch.htm#curMonths

Snapshot below:
NEW LINK:
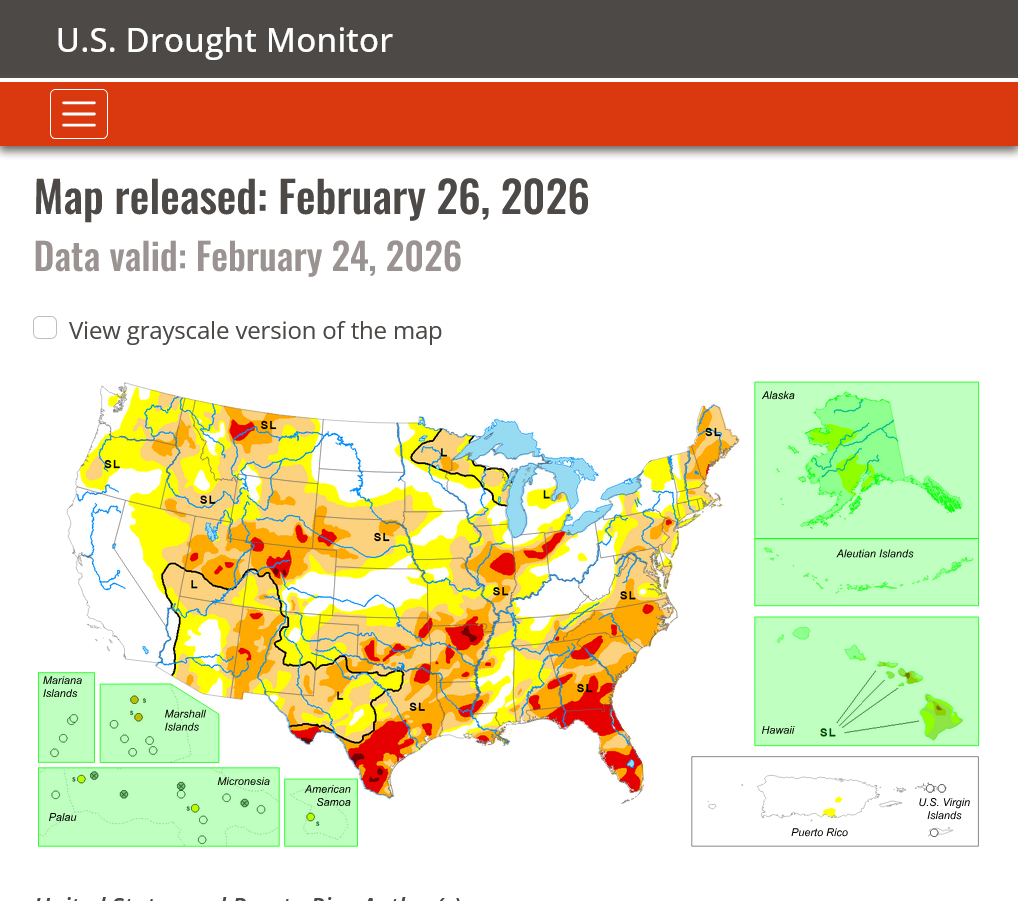
https://www.drought.gov/current-conditions
Thru February 24, 2026
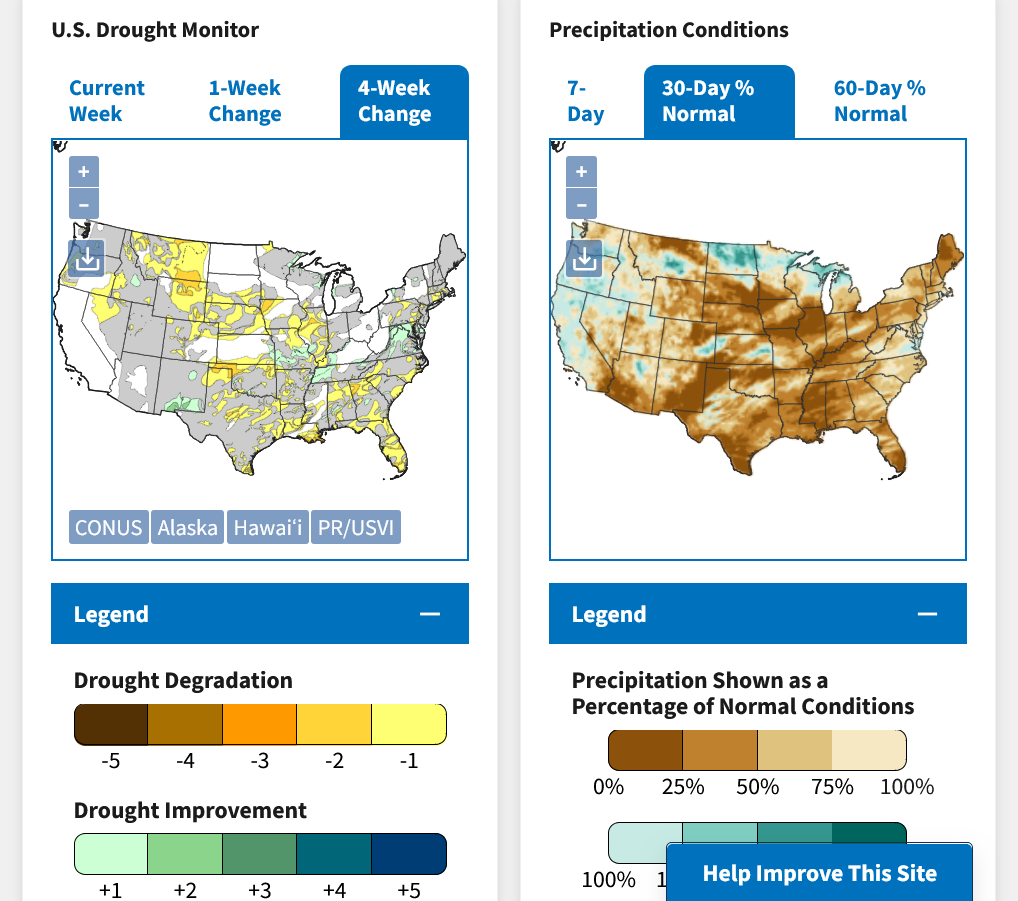
DROUGHT MONITOR
https://droughtmonitor.unl.edu/
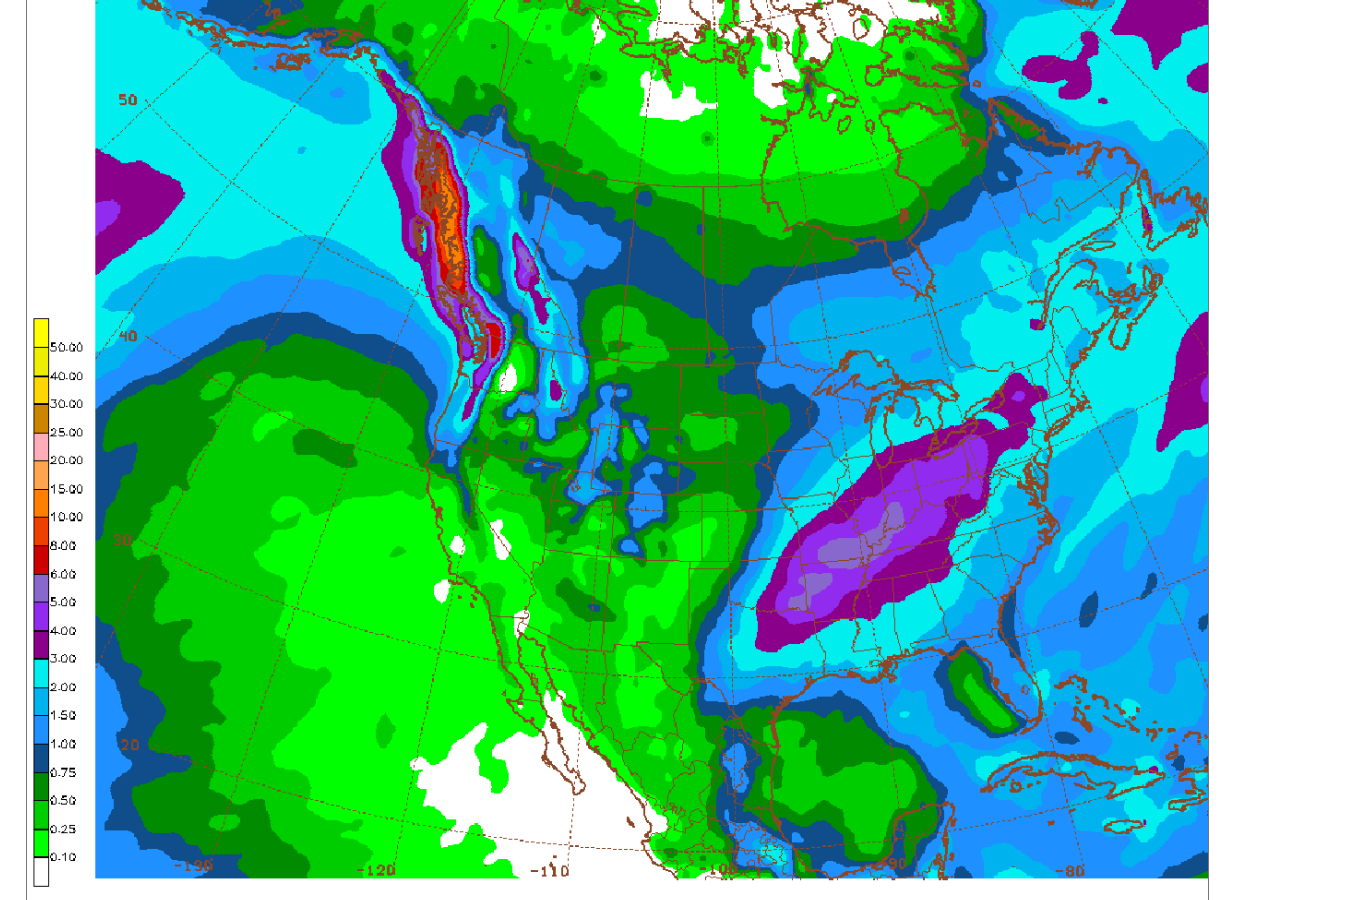
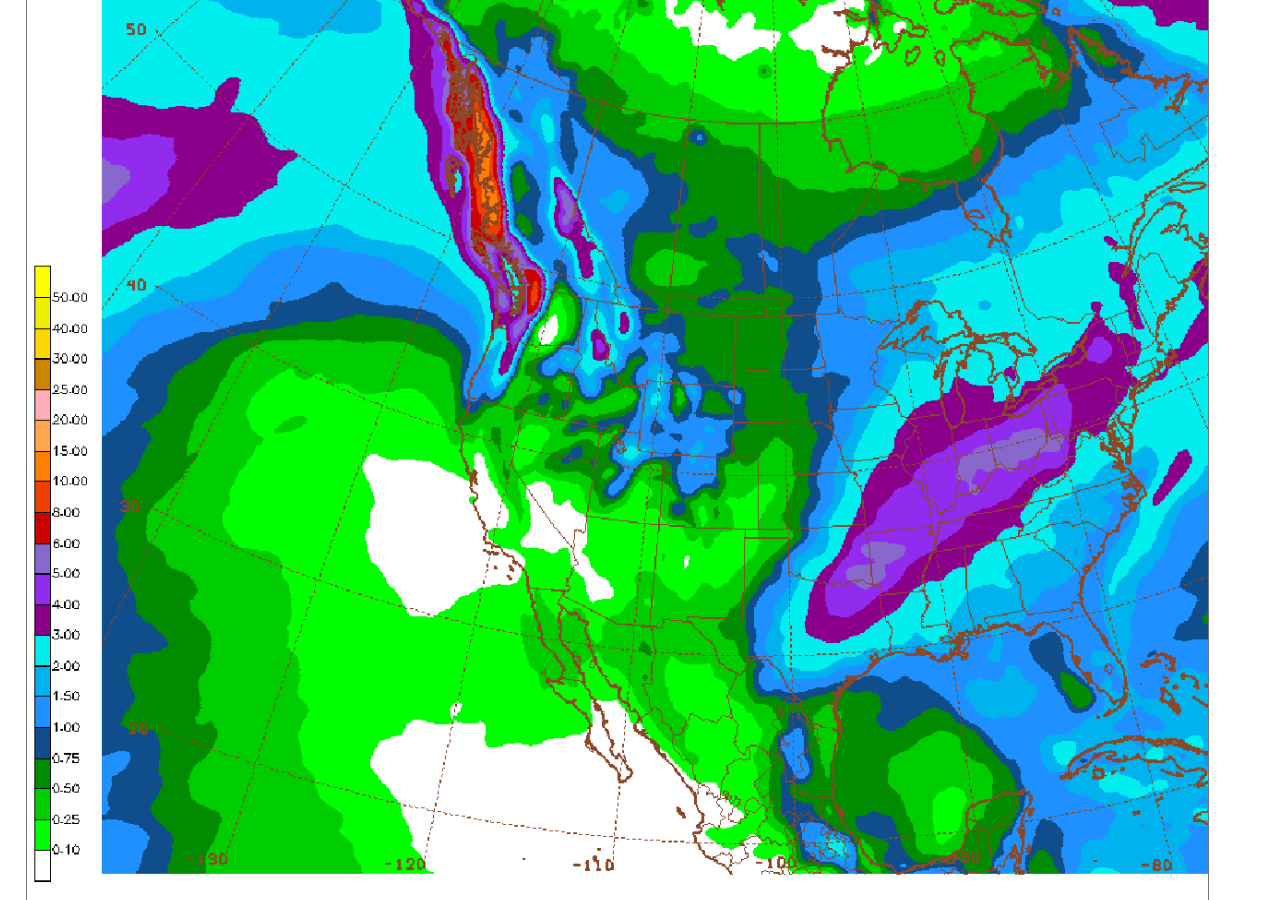
Total rains from the last 18z GEFS model for the next 16 days. The center band is 5+ inches.
If the rains don't ramp up much higher than this(which could happen in this type of pattern if it amplifies) than this will all be WELCOME rains that help restore subsoil moisture in places that have drought right now.
We don't want it to come too much at one time or else that results in excessive runoff instead of it soaking in. At least the ground will NOT be frozen so much of it should soak in.
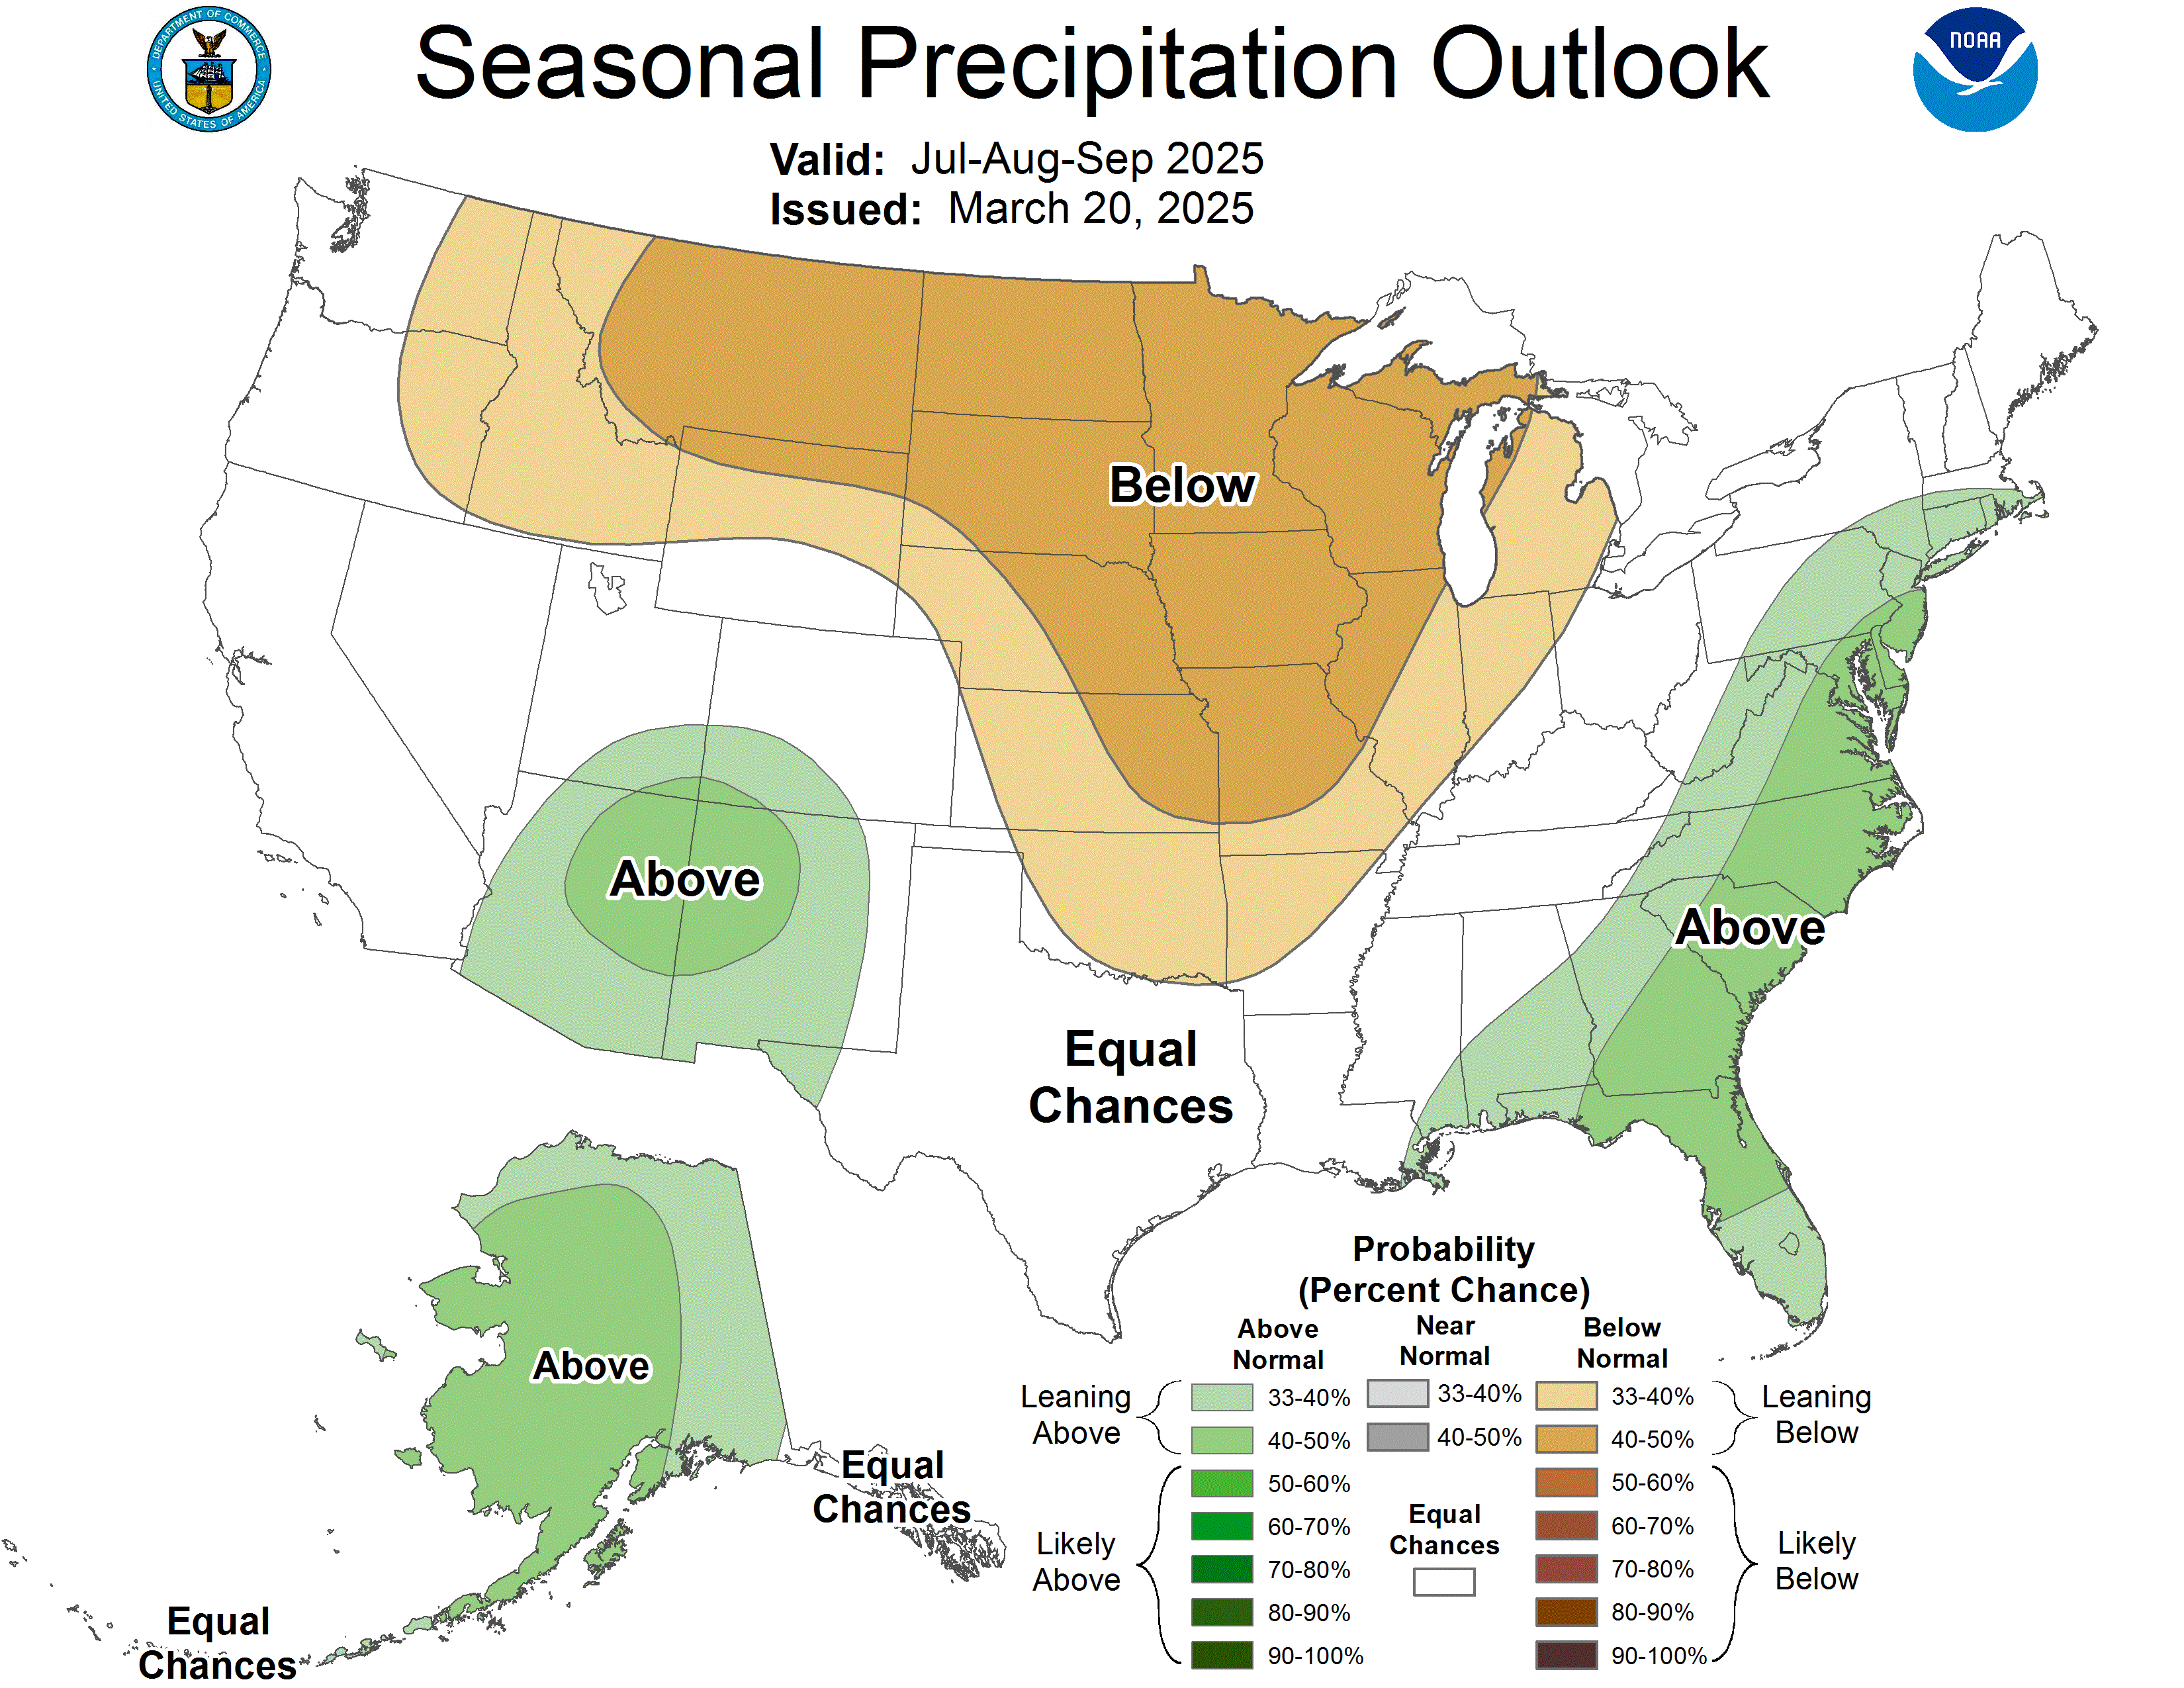
Ideally, we can dry out in April to have early planting with recharged soil moisture. Odds are slightly elevated for us to have a wet Spring from the rapid onset of an El Nino.
The NWS updated the March forecast today. Easy one to make: WARM and WET!
https://www.cpc.ncep.noaa.gov/products/predictions/long_range/lead14/


El Nino Summer's have typically produced good growing weather/decent rain.
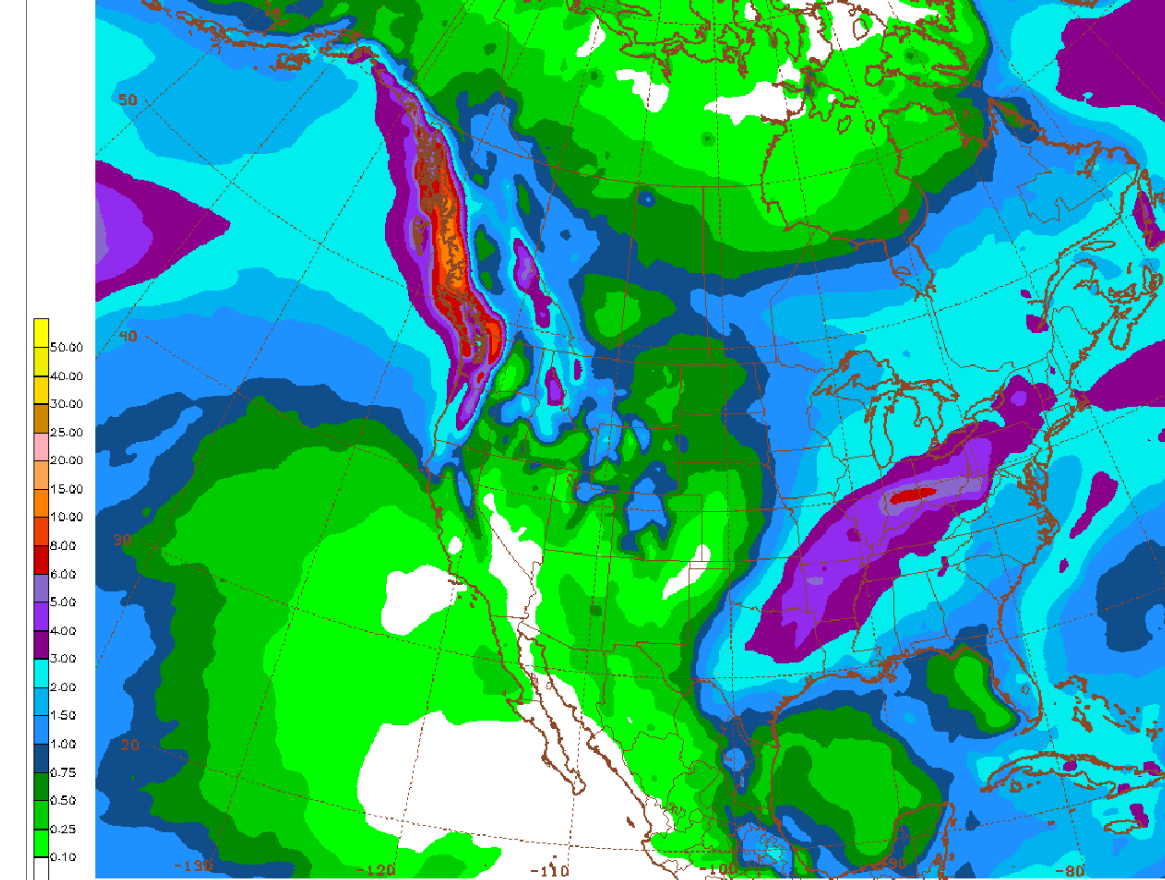
The last GEFS has the same forecast for the next 16 days(384 hours).
The amounts are NOT going higher which is what I thought might happen, which lessens the risk of flooding, especially on dry ground.
However, 5 inches of rain in the lightest purple is around 3 times the average rain for that period.
The sustained nature of the pattern suggests much of this will soak in to recharge soil moisture thru the entire vertical profile.
Total rains the next 2 weeks below from the just out 12z GEFS run. The red band is 6"+.
It does look like we return to a drier and cooler pattern again towards the end of 2 weeks which will be needed for our farmers to plant in April.
If this rain falls in the wettest areas, the drought should be mostly wiped out in those spots, basically in the large area with 4"+ to go (in addition to the rains that we just received).
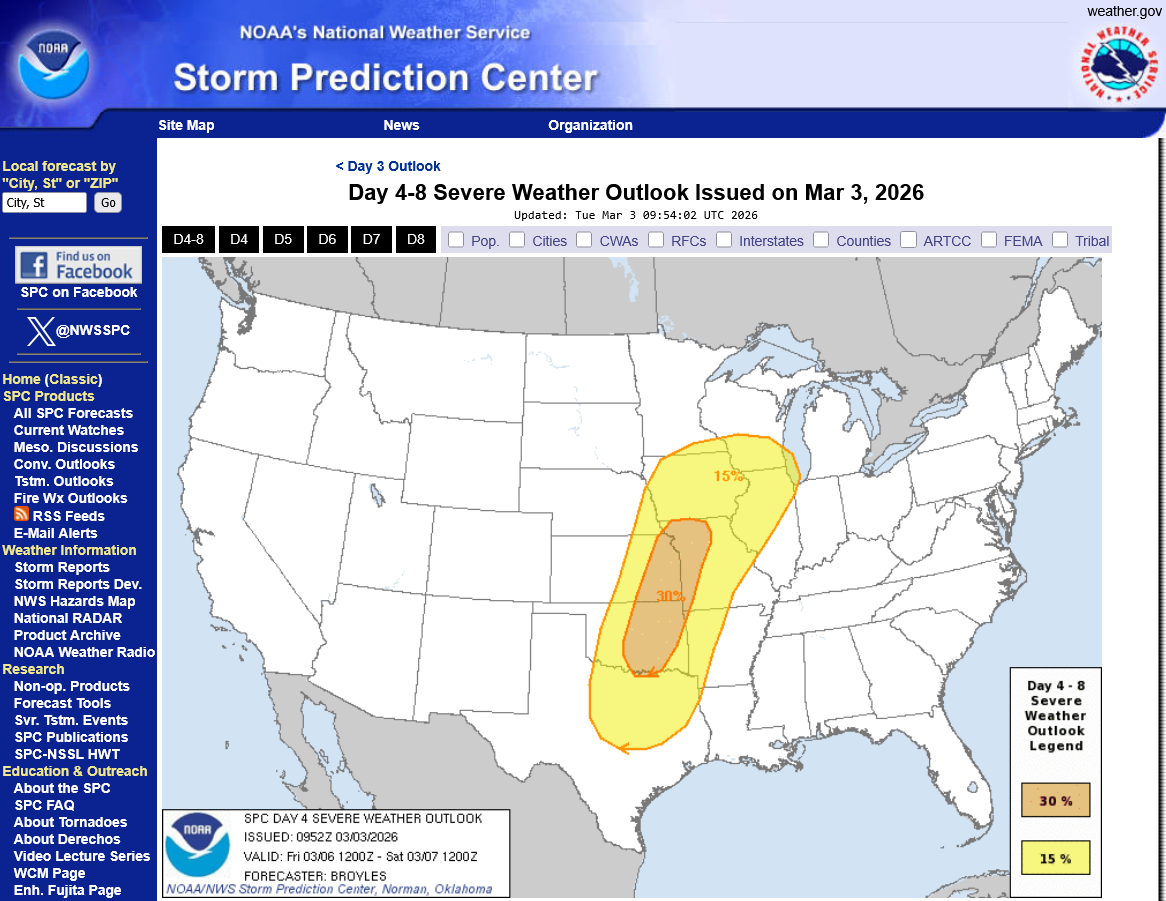
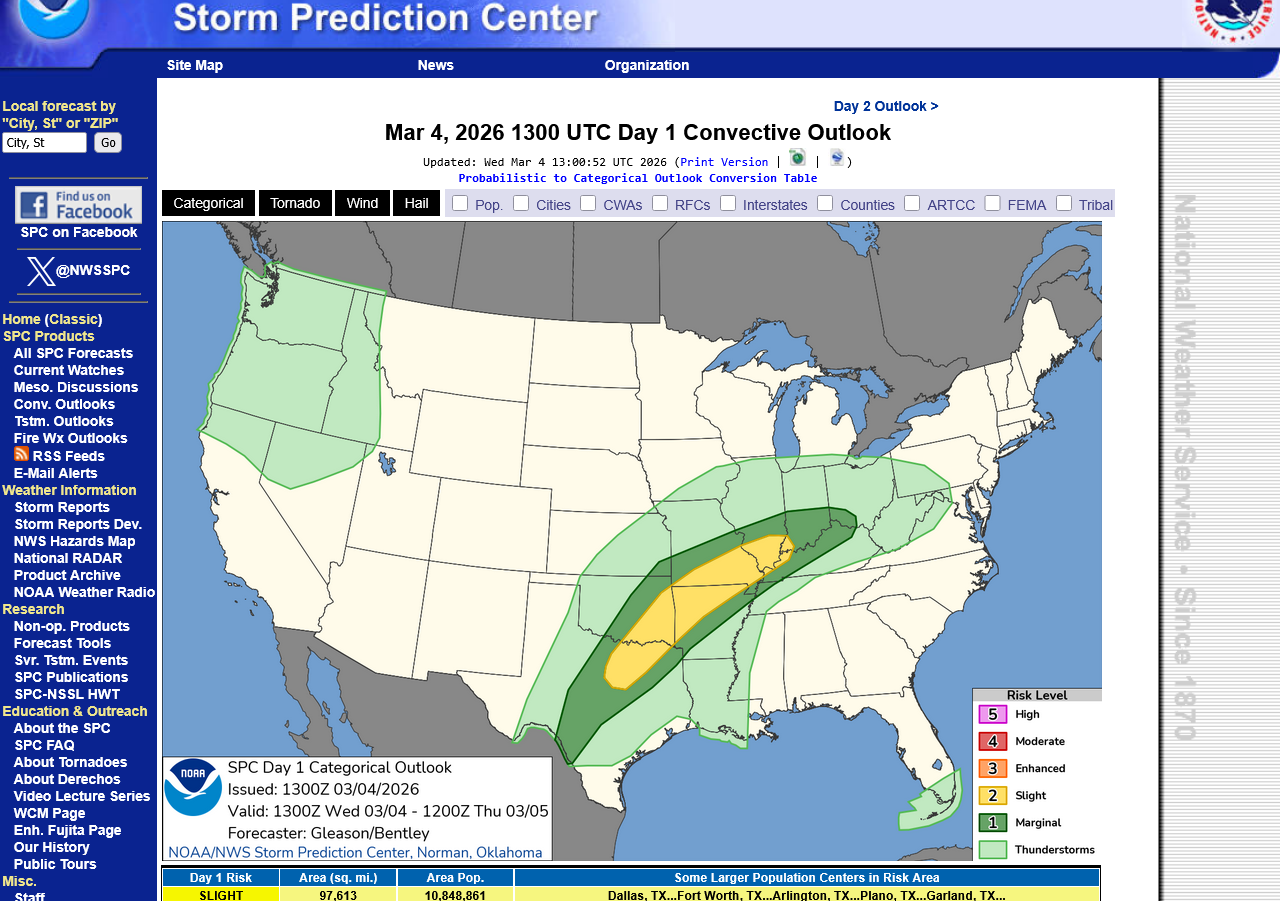
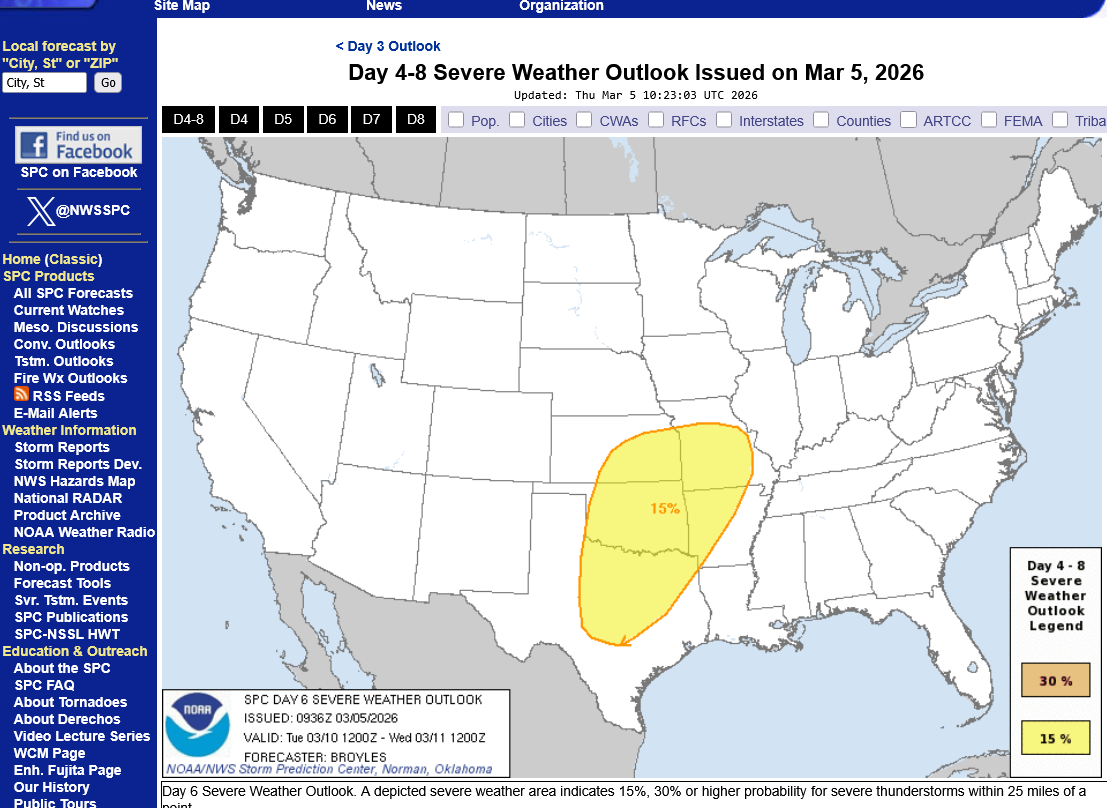
The MAIN day this week with a significant risk for severe weather looks to be Friday/Friday Night in the area below. This includes the chance for tornadoes.
The jet stream below is at a level above 30,000 feet Friday Night. Its not all that impressive and NOT favorable for long lived, particularly dangerous strong/violent tornadoes.
However a modest jet streak will keep the risk of tornadoes, especially in the 30%, brown shaded areas.
https://www.spc.noaa.gov/products/exper/day4-8/#
Global temperature update for February 2026
Started by metmike - March 3, 2026, 12:23 p.m.
https://www.marketforum.com/forum/topic/118356/
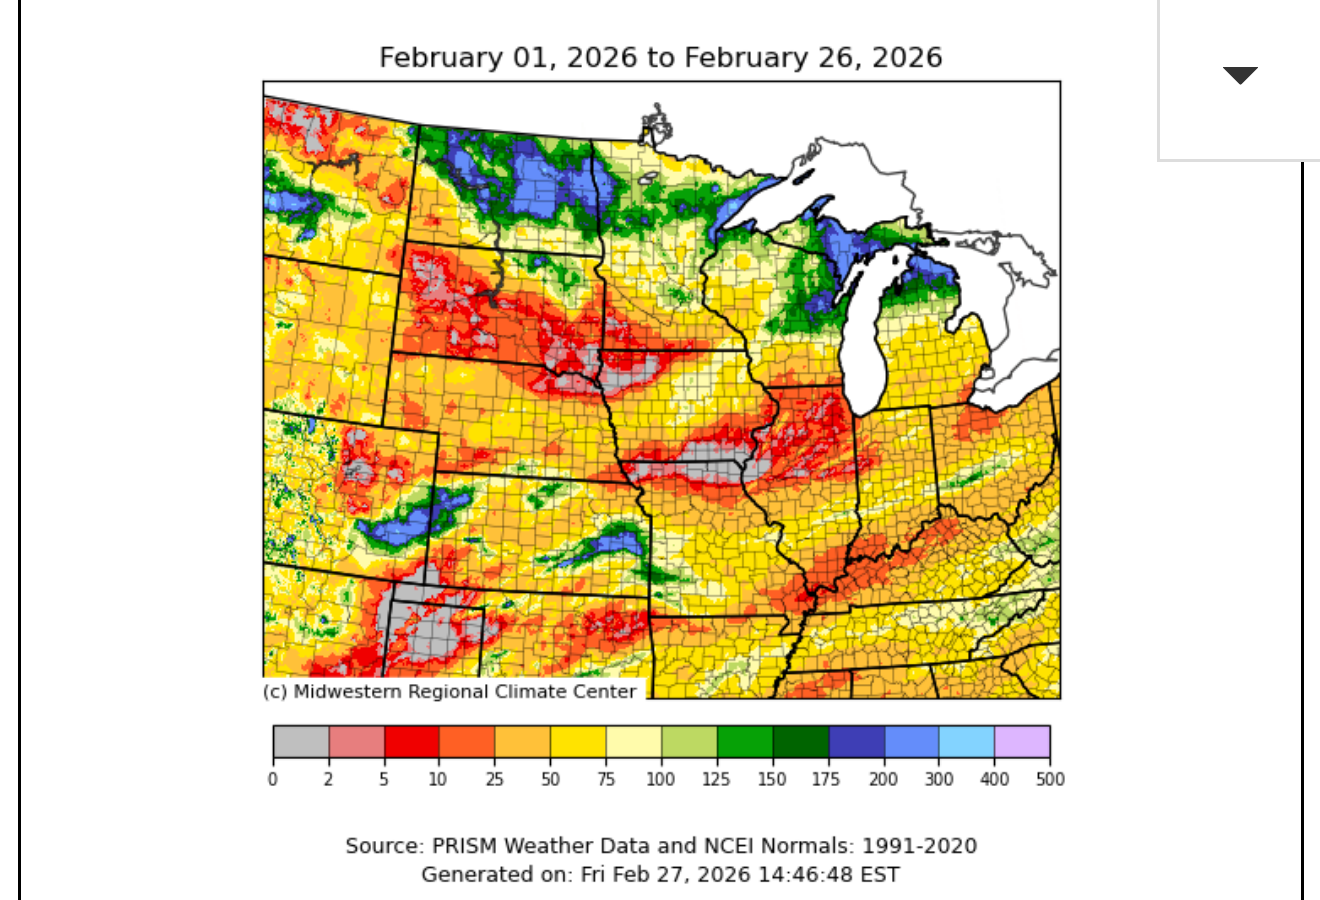
Very dry in the Western Ohio River Valley last month!
Precipitation was much drier than normal, with all 5 climate sites observing one of their top 5 driest February’s on record! Amounts only ranged from 0.25” to 0.75” across much of the region
https://www.weather.gov/pah/February2026ClimateSummary


Heavy rains are setting up in Central Indiana!
++++++++++++
https://www.wunderground.com/maps/radar/current
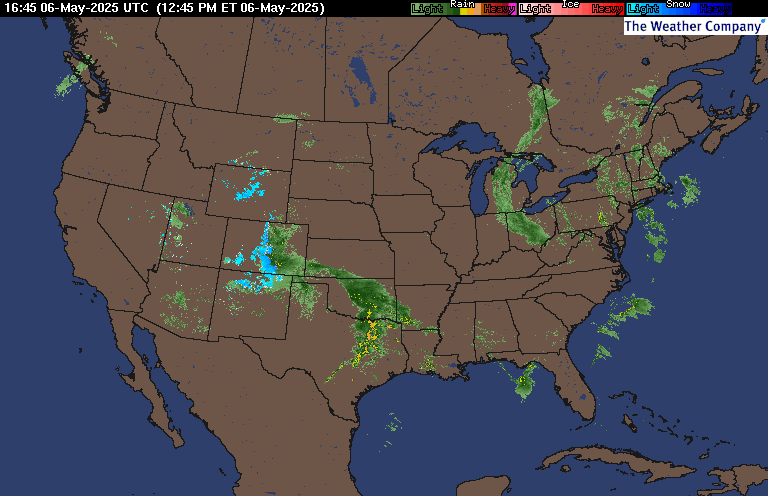
Recent rain amounts:
weathernet.com/total-rainfall-map-24-hours-to-72-hours
+++++++++++++++
Current Hazards at the link below.
For your NWS and county, go to the link below.
Then you can hit any spot on the map, including where you live and it will go to that NWS with all the comprehensive local weather information for that/your county.

New radar product below
Go to: "Select View" then "Local Radar"
Hit the purple circle to see that local radar site
+++++++++++++++++++++++
This link below provides some great data. After going to the link, hit "Mesoanalysis" then, the center of any box for the area that you want, then go to observation on the far left, then surface observations to get constantly updated surface observations or hit another of the dozens of choices.

Slight chance for a severe storm today! Low risk for a tornado.
Top frame is a snap shot. 2nd one is updated.
https://www.spc.noaa.gov/products/outlook/day1otlk.html
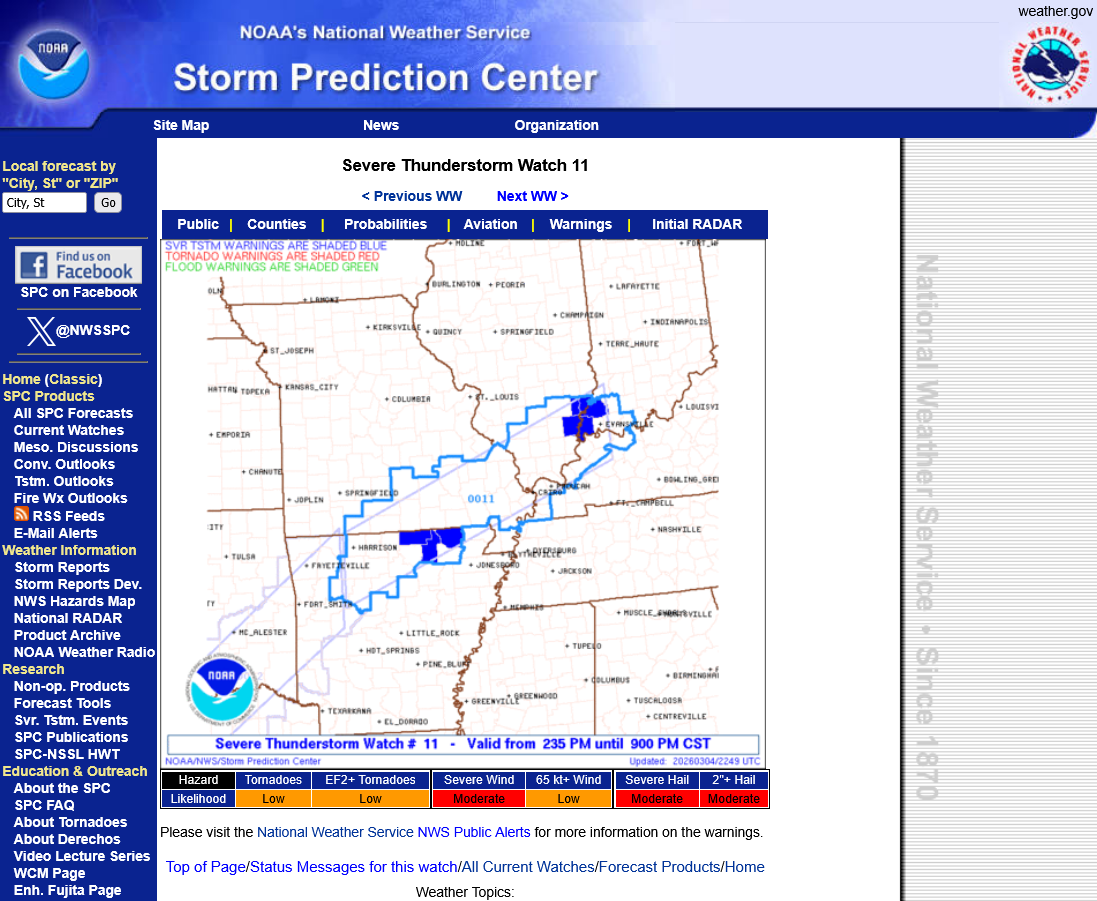
The storm prediction center has a mesoscale discussion that is discussing a potential watch the next 2 hours. I’m at chess practice and can’t post it but go to the link 2 pages up from the storm prediction center and go to their mesoscale discussion. It includes Evansville.
Back from chess practice at NJH/NHS. We got the Severe Thunderstorm Watch mentioned earlier today.
Now we just track the storms and let the local NWS keep us posted, as well as issuing warnings if justified.
3 things to note.
1. Being a severe thunderstorm watch means the risk for tornadoes is too low to issue a watch for tornadoes.
2. Any isolated tornadoes would be WEAK tornadoes NOT the the violent kind that kills most people.
3. If a warning is issued. Stay inside of a permanent structure and away from windows/ Try to not be driving or outside but we know that's impossible so just be careful in an area where flying debris or a tree might topple if you get stuck in a severe storm.
4. This risk will pass pretty fast from the time I'm posting maybe by shortly after 5:30 pm. Our time stamps at the top are in Eastern Time.
+++++++++++
Here the actual watch and counties in blue that have SEVERE THUNDERSTORM warnings.
https://www.spc.noaa.gov/products/watch/ww0011.html
Local radar Super Resolution Base Reflectivity

++++++++++++++
10pm: A perturbation in the upper level flow is triggering a huge wave of heavy rain with some embedded strong storms that are aimed at Evansville , starting close to 11pm. We have a flash flood watch in effect tonight. Interesting how quickly we went from drought to flooding risks! It was expected/predicted over a week ago!
Click a location below for detailed forecast.
These storms are being caused by the thermal contrast between very warm humid air to the south overunning cooler air near the surface.
The jet stream below, at a level of 32,000+ feet is UNfavorable for tornadoes. It's also not that favorable for widespread severe storm coverage. Mostly isolated? Yes!
There is a weak jet streak in blue that's just under 100 mph(the units below are in KNOTS).
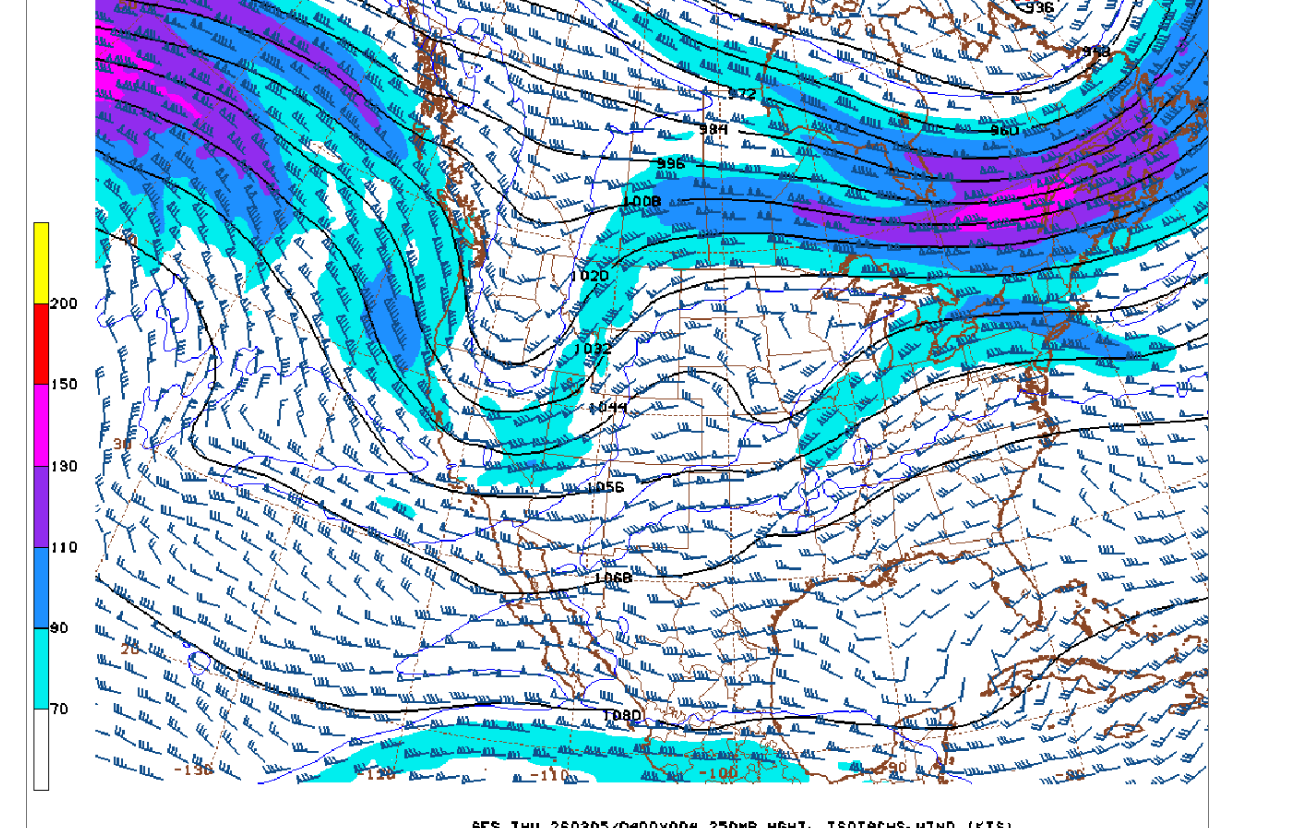
On the weather map above for the light blue:
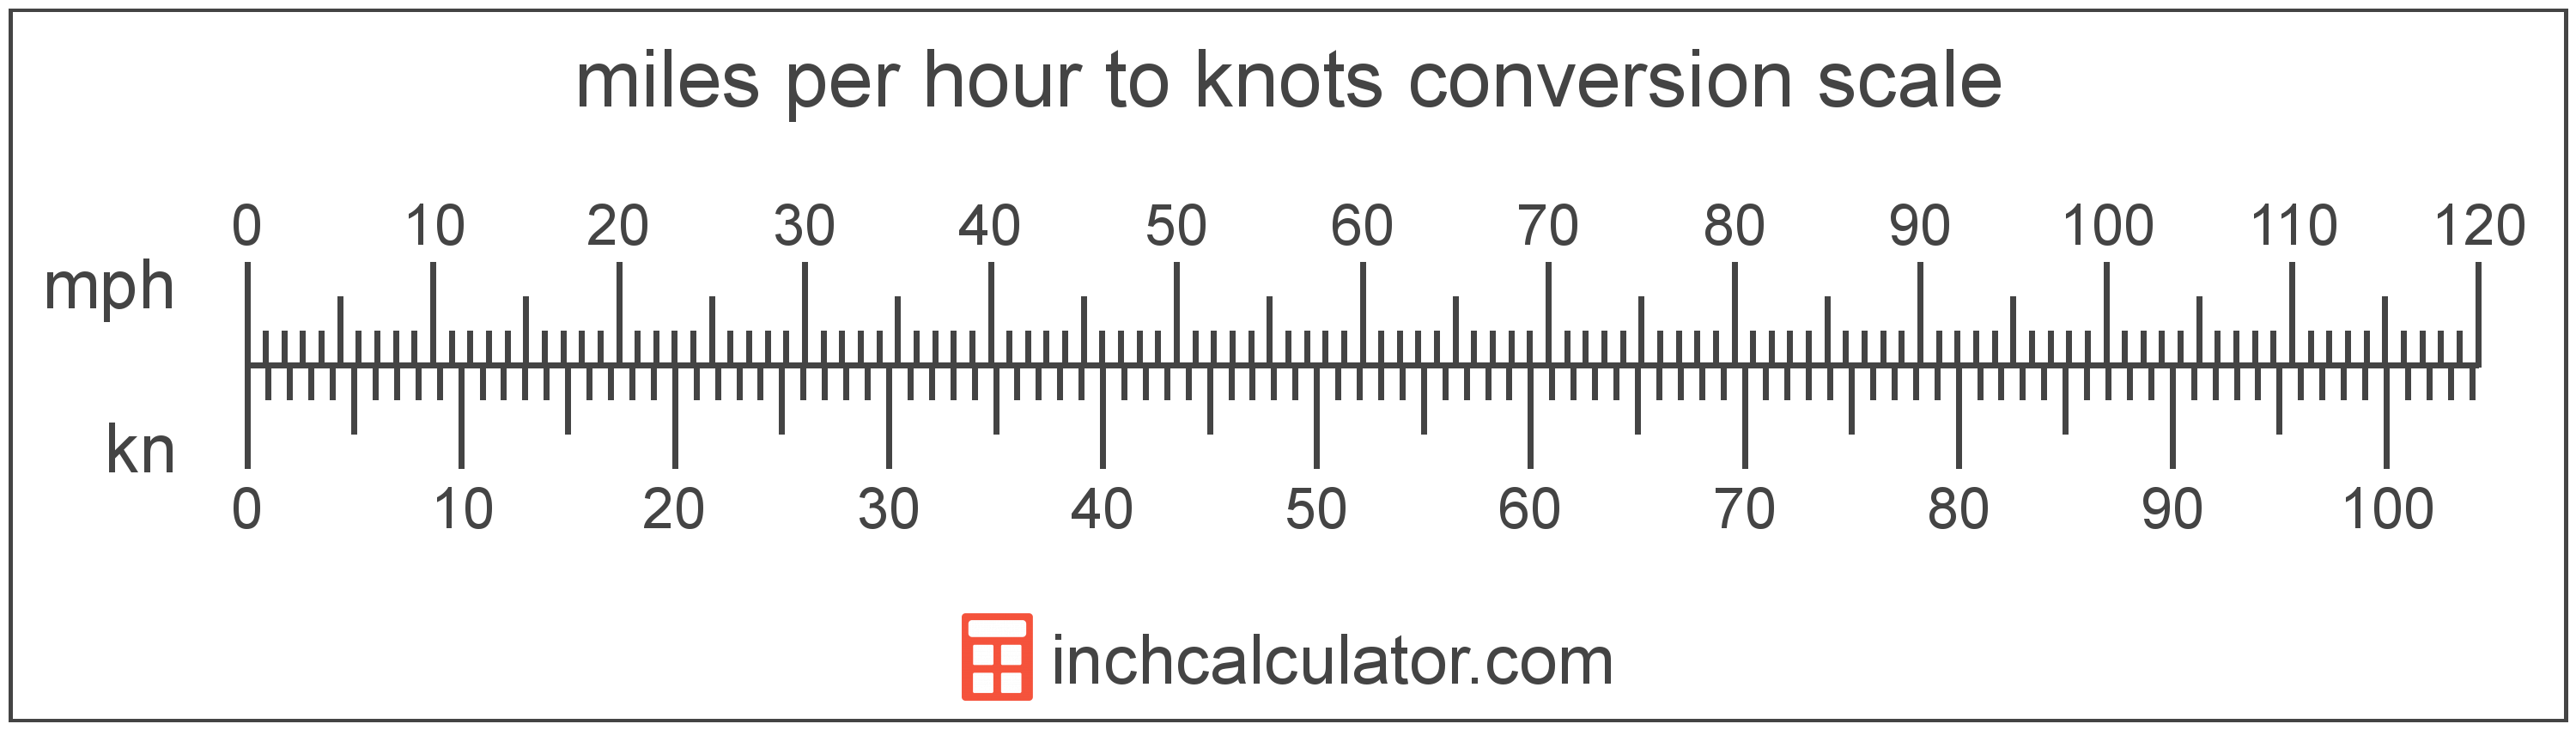
70+ Knots ≈
86.6+ Miles per Hour
https://www.inchcalculator.com/convert/knot-to-mile-per-hour/
miles per hour = (5 kn × 1.150779) = 5.753897 mph
Same places over and over tonight(training) which is the set up for excessive rains.
The very dry Winter has ENDED!
We will have as much rain this week into next week as we had total for the past 3 months.
We received 2.20 inches of rain overnight. The NWS measure 2.27 inches.
Unlike most of our very heavy rain events in the warm season, that can fall in a massive downpour for just an hour or 2 because precipitable water values are so high, this one was an extremely long duration event.
The intensity was not heavy enough to create major runoff and flash flooding. Much of it soaked in.
The exception was between 3-4am when .75 inches fell. THAT was heavy. Otherwise, the heaviest rains in an hour was .27.
The drought is completely over for us.
https://forecast.weather.gov/data/obhistory/KEVV.html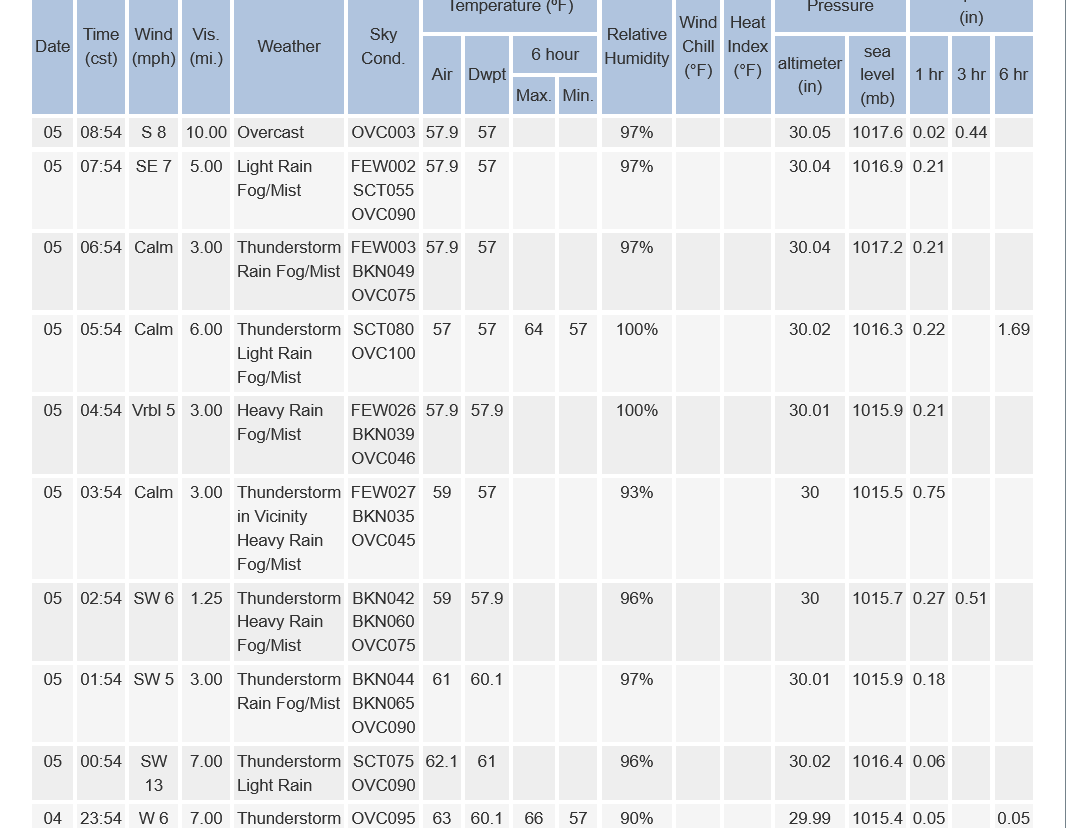
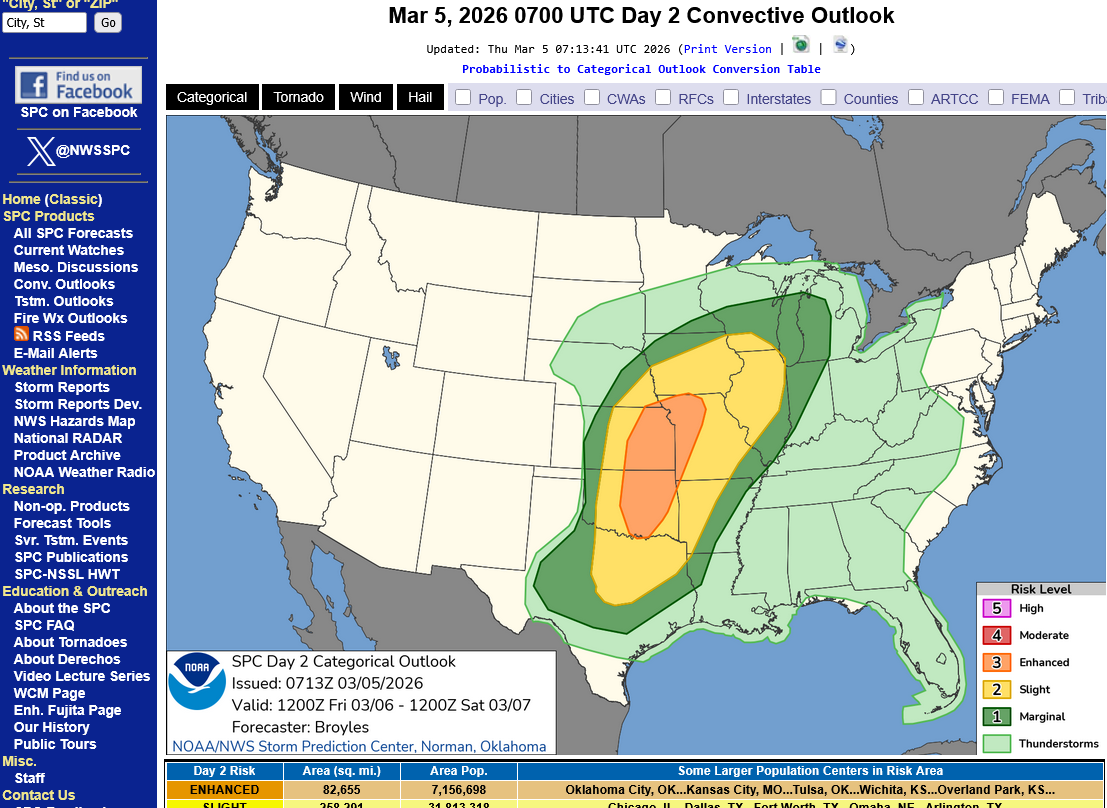
The 2 highest risk days for severe storms and tornadoes are tomorrow is especially tomorrow, Friday in the Plains, weakening headed northeast to St. Louis and Chicago-land. East of those areas will have weakening support.
I copied the freeze frame latest and below that the constantly updated map.
https://www.spc.noaa.gov/products/outlook/day2otlk.html
SUMMARY... Scattered severe thunderstorms are expected from late afternoon Friday through Friday night across parts of the central and southern Plains northeastward into the mid to upper Mississippi Valley. The greatest potential for tornadoes, large to very large hail, and damaging winds is across eastern parts of Kansas and Oklahoma into western Missouri.

Then in the middle of next week. This is a freeze frame(get the update at the link below)
https://www.spc.noaa.gov/products/exper/day4-8/
This 7 day rainfall map is updated a couple times/day. It will continued to be loaded with rain for the next week, although the pattern for week 2 looks to DRY OUT!
7 Day Total precipitation below:
http://www.wpc.ncep.noaa.govcdx /qpf/p168i.gif?1530796126
+++++++++++++
Back to northwest flow and much cooler late in week 2 with a ridge/west, trough/east configuration/couplet!
https://www.psl.noaa.gov/map/images/ens/ens.html#nh
NCEP Ensemble t = 360 hour forecast 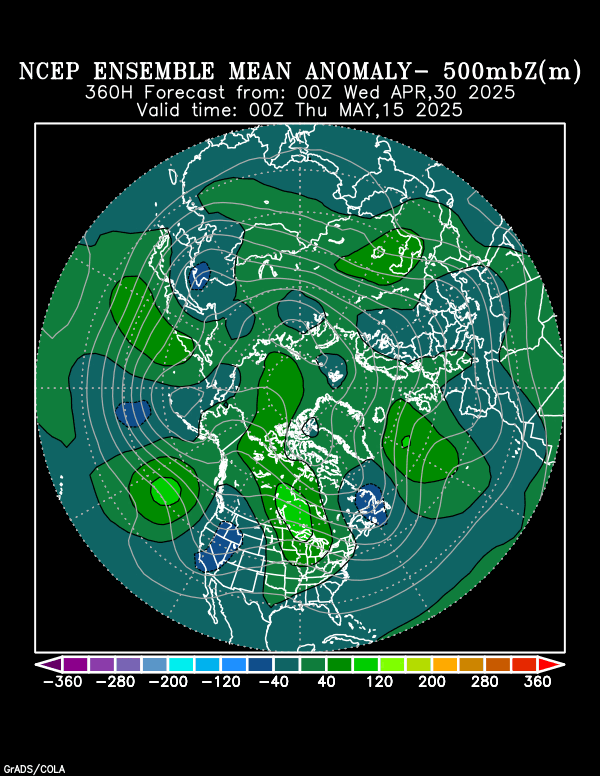
NCEP Ensemble t = 360 hour forecast 
https://www.marketforum.com/forum/topic/83844/#83852
| Click below for information about how to read 6-10 day outlook maps Temperature Precipitation | |
| Click below for archives of past outlooks (data & graphics), historical analogs to todays forecast, and other formats of the 8-14 day outlooks ArchivesAnalogsLines-Only FormatGIS Data | |
Temperature Probability | |
Precipitation Probability | |
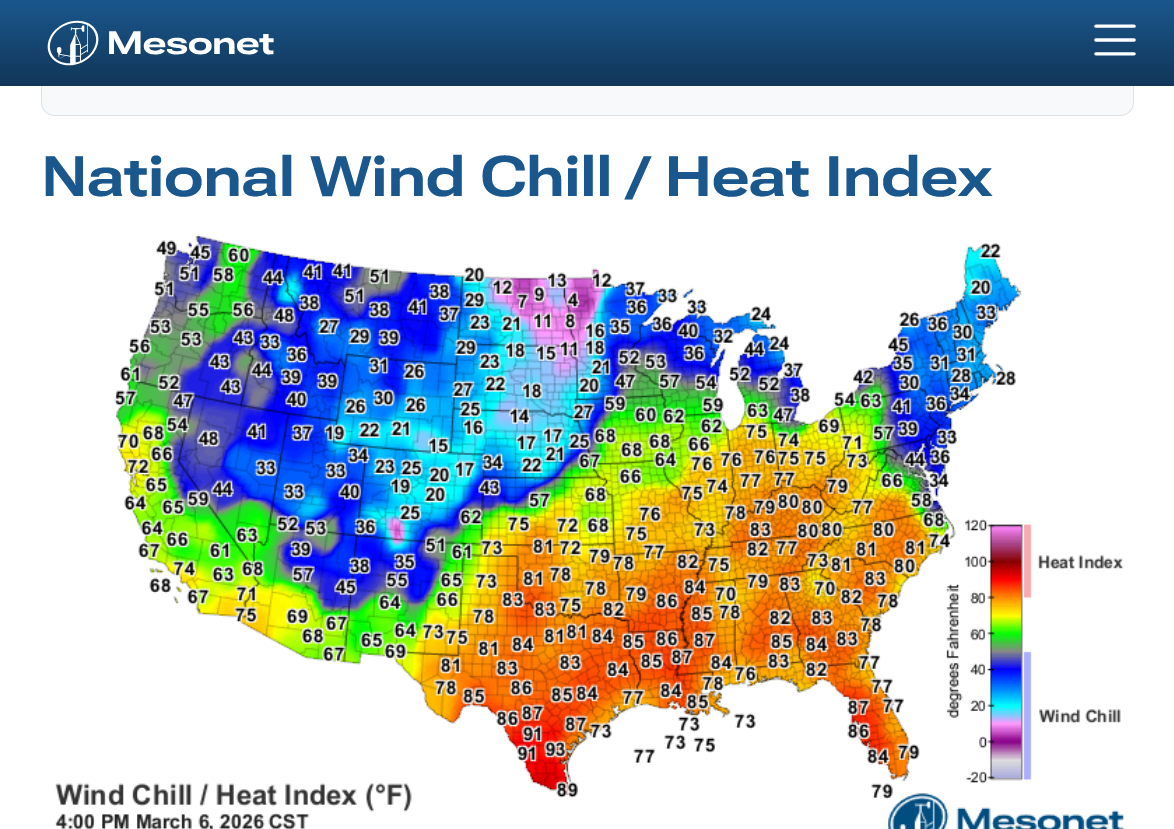
Record high of 81 degrees in Evansville IN today.
https://www.mesonet.org/weather/air-temperature/national-wind-chill-heat-index
Tied up with our chess tournament today and tomorrow.
Local radar Super Resolution Base Reflectivity
Just a minimal/isolated chance for any severe weather today in Evansville.
See the previous post that was just updated with the local radar.