Scroll down to page 2, for today's updated graphs!
Below is a discussion of 2 oscillation indices that are often key indicators of atmospheric conditions favorable or unfavorable for cold air delivery into the Midwest/East. Page 2 has the updated graphs of today's forecast.
A rule of thumb is that the more negative they are(-AO and -NAO), the stronger the potential set up is for cold. The more positive they are(+AO, +NAO), the tougher it is to bring down cold from higher latitudes south to the middle latitudes in sustained fashion.
Here's a great link/explanation/graphics that explain this effect:
https://climate.ncsu.edu/climate/patterns/nao
Negative Arctic Oscillation-cold
500mb Height Anomalies During a Negative AO

Here are the graphics for a negative North Atlantic Oscillation:
500mb Height Anomalies During a Negative NAO |
Surface Temperature Anomalies During a Negative NAO
The forecast for the AO and NAO..........and PNA are updated every morning at this site:
http://www.cpc.ncep.noaa.gov/products/precip/CWlink/daily_ao_index/teleconnections.shtml
The latest updates are below:
We should also keep in mind that the NAO and AO values are forecasts too. The same weather models that predict everything else, predict the AO and NAO............and can be just as wrong. They are wonderful indicators to superimpose on model solutions........especially when they are strongly positive/negative(subtract or add cold) when they are right.


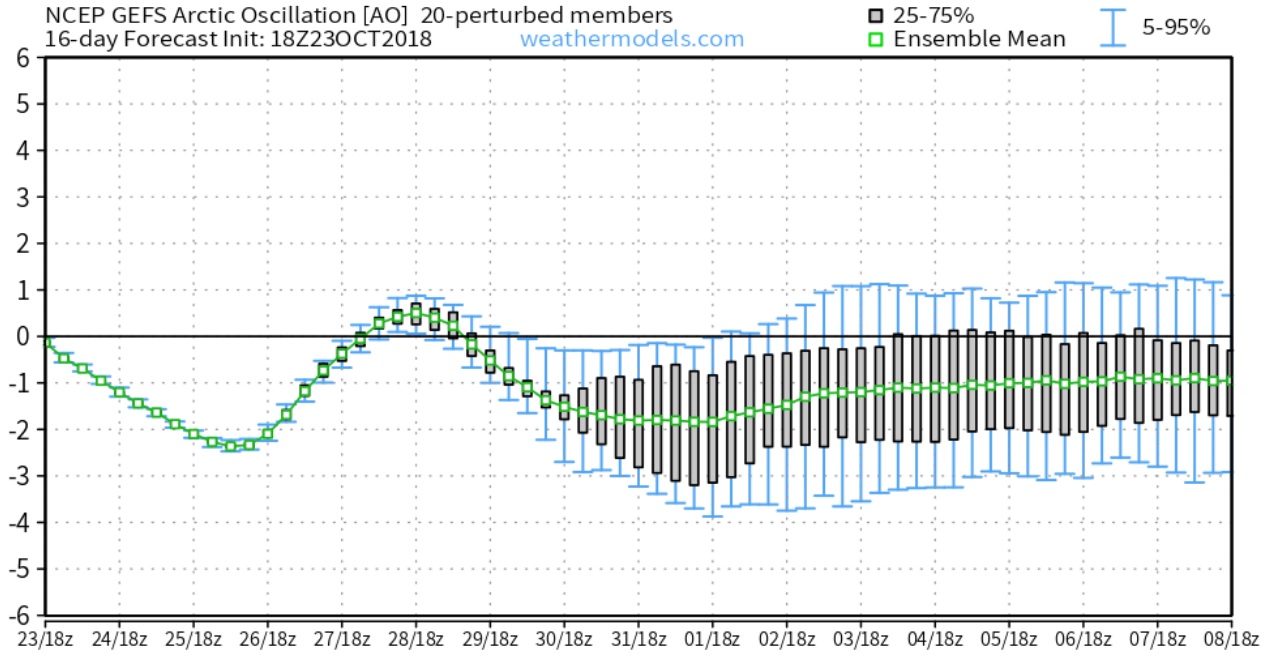
Here is the GEFS 16 day AO:

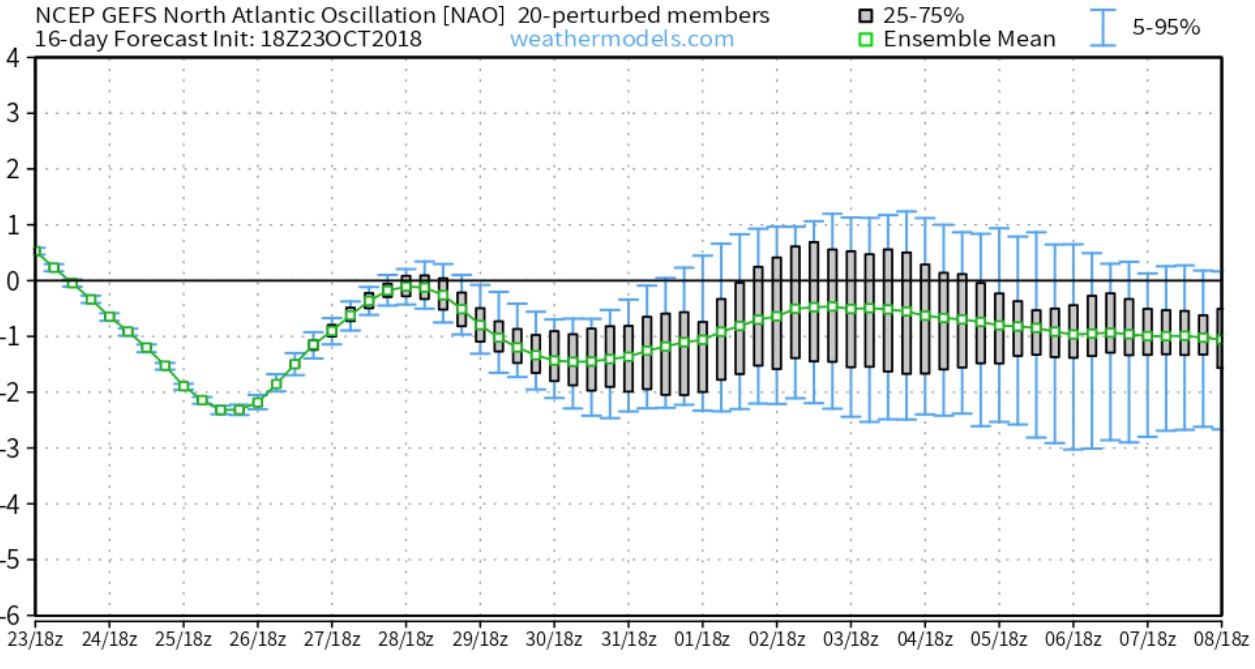
And here is the GEFS 16 day NAO. With both turning negative towards the end of the month it appears a surge of below normal temps would be likely across the eastern half of the U.S.

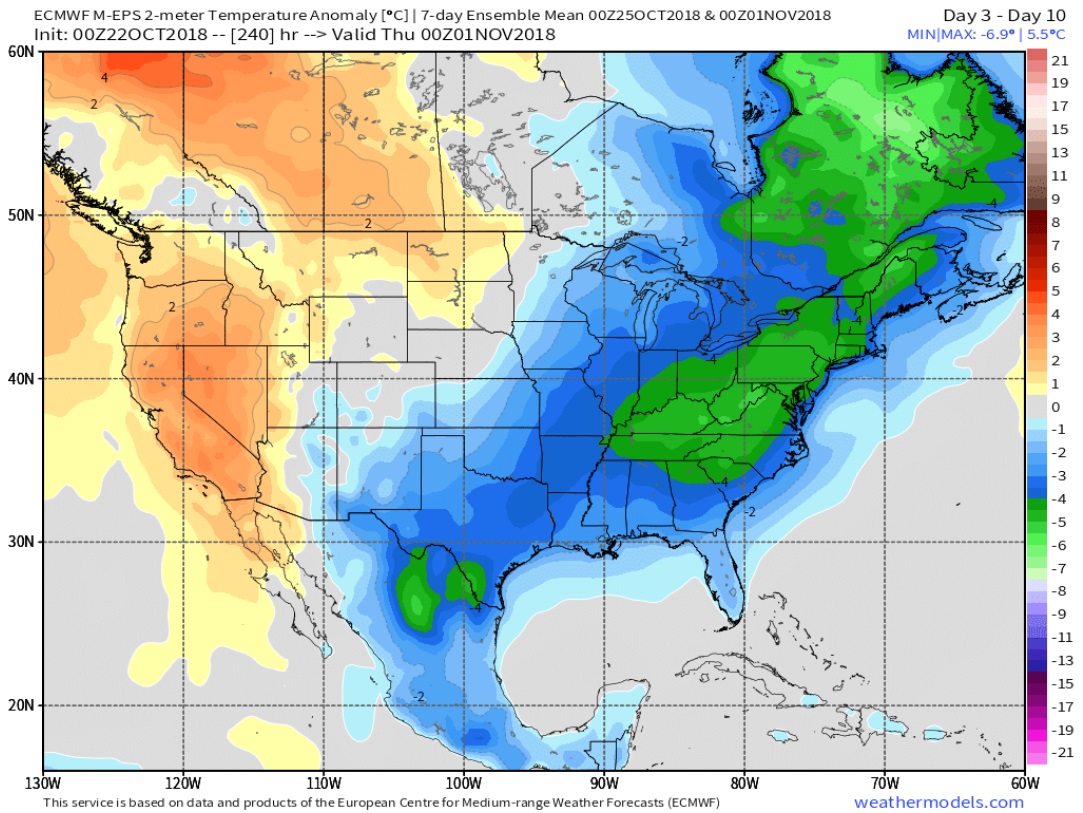
And here is a look at the EURO Ensembles surface temperature anomalies. Large area of 4 to 6 degrees Celsius below average. The Euro Ensembles for the AO and NAO are close to the GFS except they become positive to start the second week of November.

Great stuff, thanks Grant!
This is much colder in the East than the GFS ensembles.