
Happy February 26th! Keep sharing your Valentines love with somebody today. There's enough for every day of the year!
Scroll down and enjoy the latest comprehensive weather to the max. Wild weather of all sorts took place last week.....from the naturally occurring physical laws in our atmosphere. Much more benign weather this week..
Here are the latest hazards across the country.
Purple/Pink/blue on land is cold/Winter weather. Brown is wind, Green is flooding. Gray is fog. Reddish is a red flag advisory.
Go to the link below, then hit the location/county on the map for details.
https://www.spc.noaa.gov/ Go to "hazards"

Wind map Hit this with your cursor:


Wind map Press down on this on the left with your cursor!


Current Jet Stream

Winter Weather
https://www.wpc.ncep.noaa.gov/wwd/winter_wx.shtml
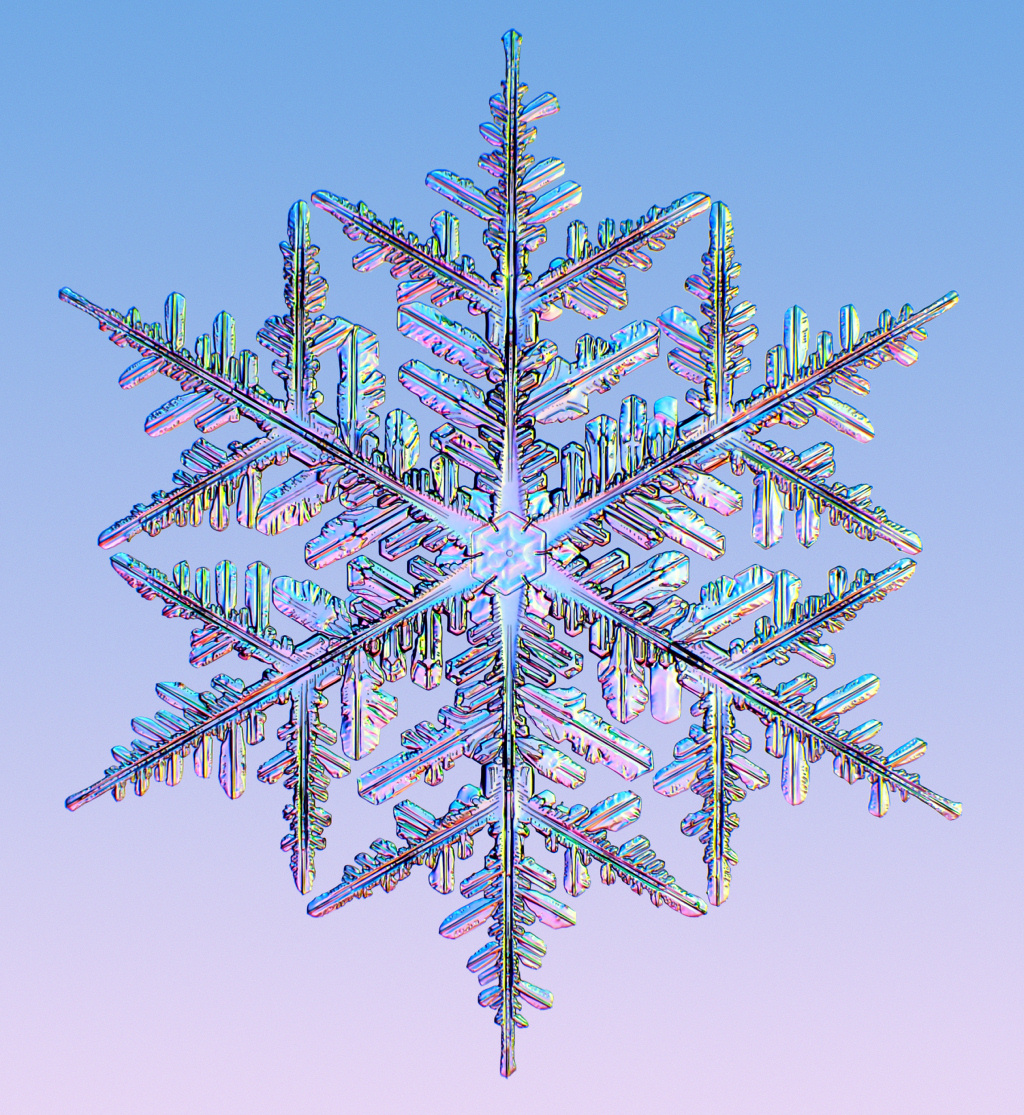
Snowfall the next 3 days:
Forecast Hour: 084
Image URL: http://mag.ncep.noaa.gov/data/nam/12/nam_namer_084_snodpth_chng.gif
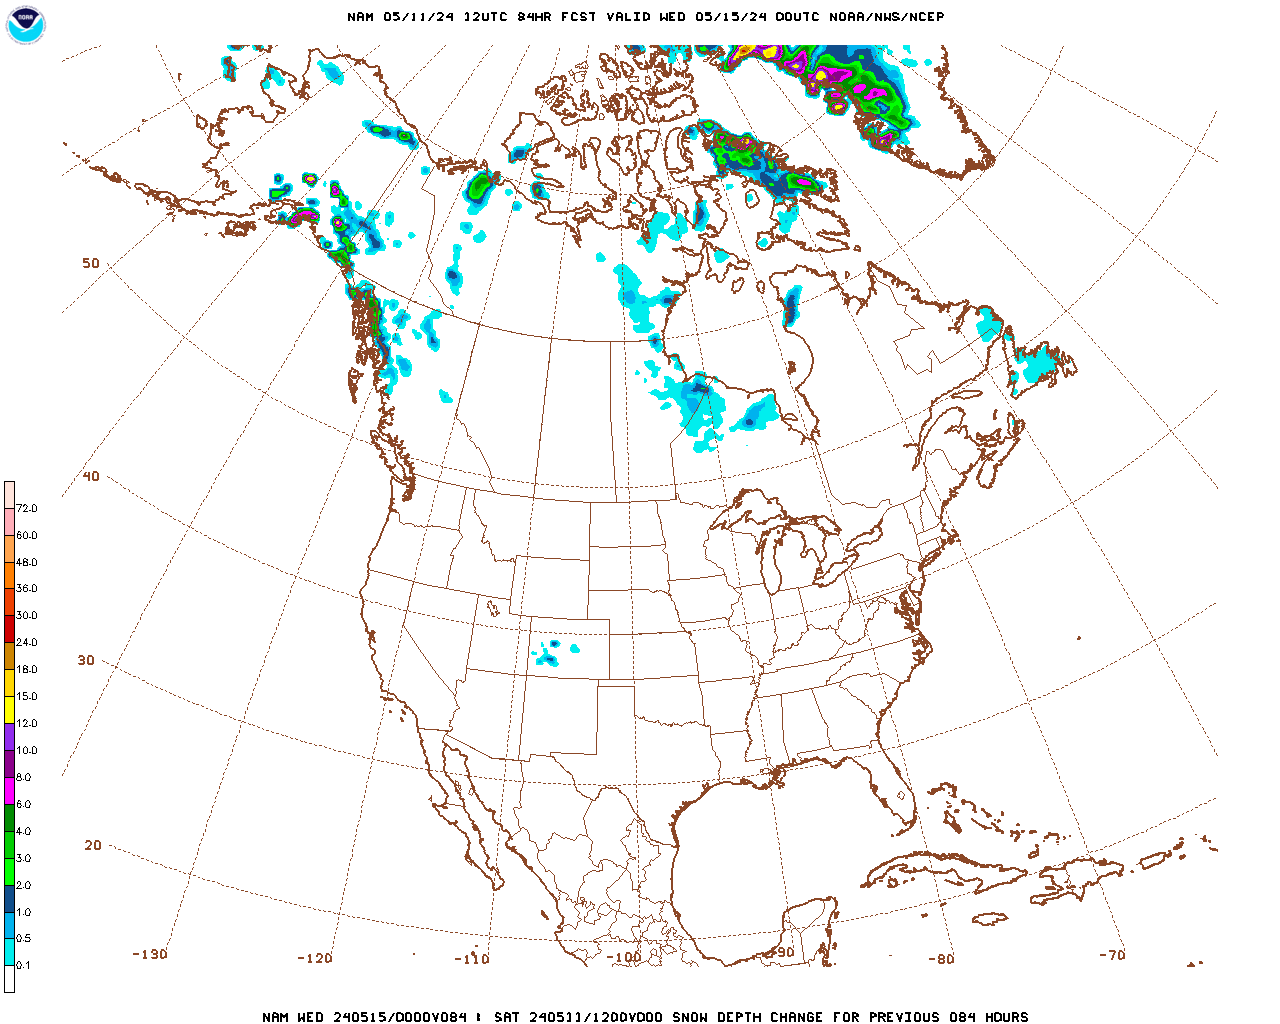
| Low Temperatures Tomorrow Morning |

High Temperatures
Huge Temperature contrast from N.Plains to the southeast.


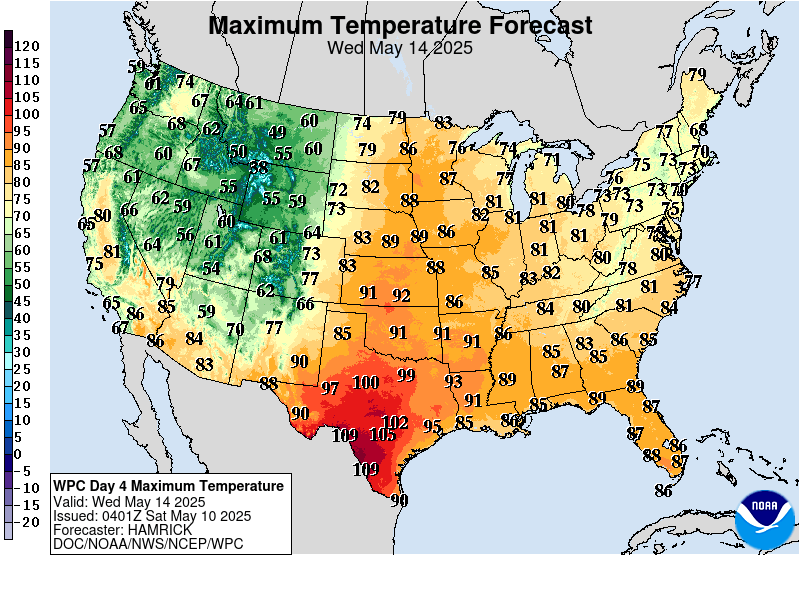
Highs for days 3-7:
Very Cold NorthCentral to N. Rockies to Upper Midwest. Mild far South/Southeast. Rainbow of colors. Cold shifts southeast/east over the weekend. (March starts off cold).



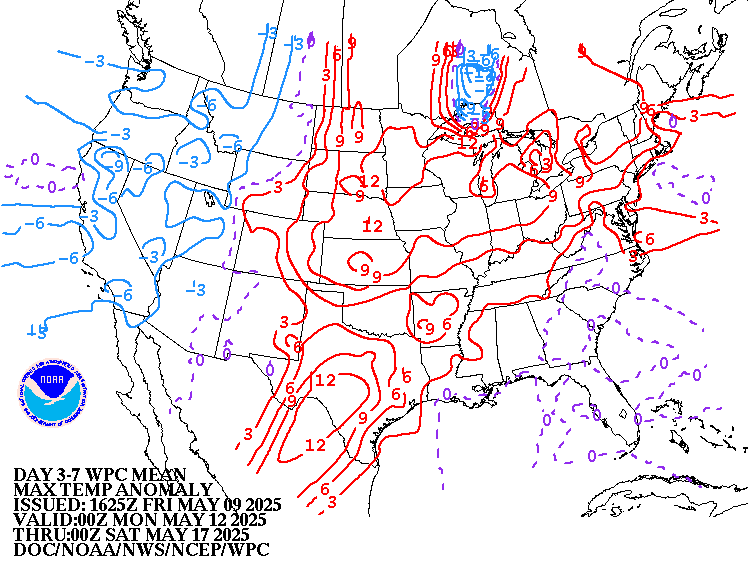
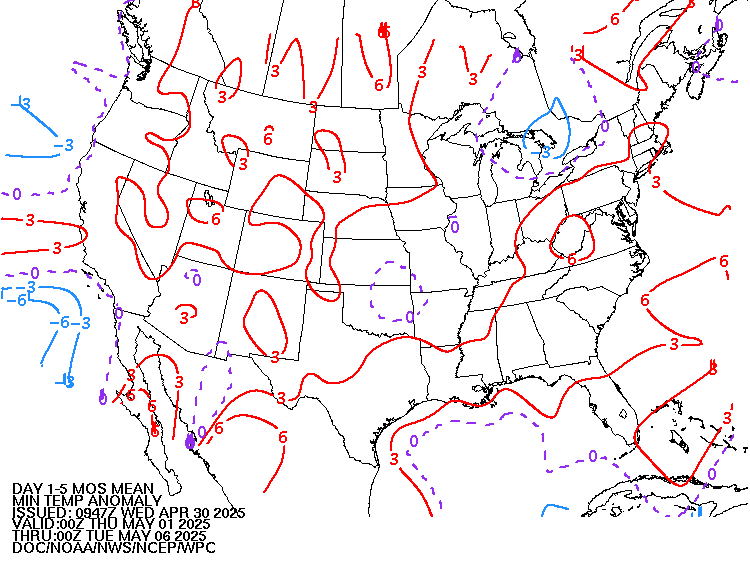
How do these days 3-7 temperatures compare to average at this time of year?
Incredible temperature contrast across the country from frigid Plains/Rockies to warm southeast. Cold moves southeast and east late in the week.
https://www.wpc.ncep.noaa.gov/medr/medr_mean.shtml
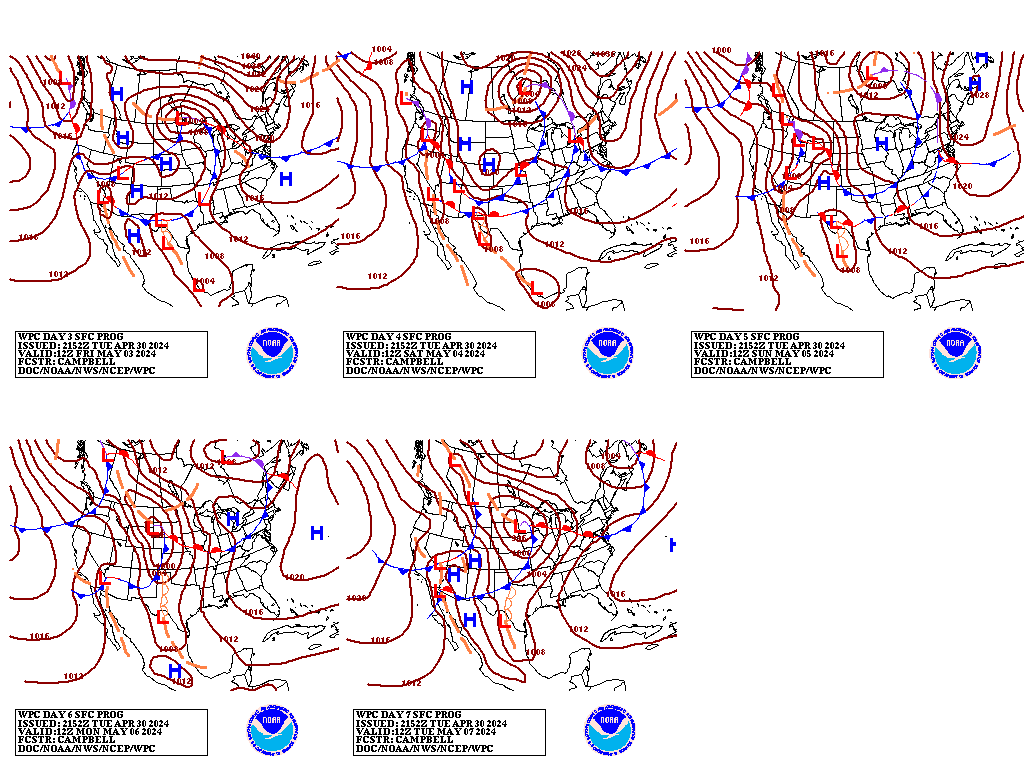
Weather maps for days 3-7 below
Cold High pressure comes in with reinforcing surges/cold fronts.
Liquid equivalent precip forecasts for the next 7 days are below.
Quiet and drier this week Midwest. West Coast gets bombed. Southeast to East to Northeast get heavy precip late week.
Day 1 below:
http://www.wpc.ncep.noaa.gov/qpf/fill_94qwbg.gif?1526306199054

Day 2 below:
http://www.wpc.ncep.noaa.gov/qpf/fill_98qwbg.gif?1528293750112

Day 3 below
http://www.wpc.ncep.noaa.gov/qpf/fill_99qwbg.gif?1528293842764

Days 4-5 below:
http://www.wpc.ncep.noaa.gov/qpf/95ep48iwbg_fill.gif?1526306162

Days 6-7 below:
http://www.wpc.ncep.noaa.gov/qpf/97ep48iwbg_fill.gif?1526306162

7 Day Total precipitation below:
http://www.wpc.ncep.noaa.govcdx /qpf/p168i.gif?1530796126

Current Dew Points
Very dry air in place. Extraordinarily dry in the N.PLains/Upper Midwest.

Latest radar loop
http://www.nws.noaa.gov/radar_tab.php

| Full resolution version loop (3400x1700 pixels - 2.2mb) |

Go to: Most Recent Image
Precipitation the past 24 hours
![]()
You can go to this link to see precipitation totals from recent time periods:
https://water.weather.gov/precip/
Go to precipitation, then scroll down to pick a time frame. Hit states to get the borders to see locations better. Under products, you can hit "observed" or "Percent of normal"
+++++++++++++++++++++++++++++++++++++++++++++++
+++++++++++++++++++++++++++++++++++++
Precipitation compared to average for the last 7, 14, 30 and 60 days.
Usually not updated for previous day until late the next day.
https://www.atmos.illinois.edu/~snodgrss/Ag_Wx.html


The top map is the Canadian ensemble average, the maps below are the individual members that make up the average
+++++++++++++++++++++++++++++++++++++++++
Each member is like the parent, Canadian model operational model.......with a slight tweek/variation in parameters. Since we know the equations to represent the physics of the atmosphere in the models are not perfect, its useful to vary some of the equations that are uncertain(can make a difference) to see if it effects the outcome and how.
The average of all these variations(ensembles) often yields a better tool for forecasting. It's always more consistent. The individual operational model, like each individual ensemble member can vary greatly from run to run.........and represent an extreme end of the spectrum at times. The ensemble average of all the members, because it averages the extremes.............from opposite ends of the spectrum.........changes much less from run to run.
End of week 2....................0z ensembles from TUESDAY:
Analysis starting from a week ago, ending with today:
Last Thursday: MUCH MUCH colder. Northern stream carves out a deep trough into the Great Lakes to Northeast...bringing another polar vortex excursion unusually far south. Upper level ridge in the Southeast is gone.
Friday: Still looks VERY cold with the full latitude, large scale ridge W.Canada and deep trough downstream couplet associated with a strong northern stream flow.
Saturday: Just prior to this period, during week 2, the Canadian ensembles is milder but at the end of week 2 is just as cold as recent solutions. This is becoming a pattern now..........models showing extreme cold near the end of week 2 every day but it never gets any closer. The extremely cold pattern at day 14, described above is still valid for today's analysis. It should be noted that some solutions on some models are trying to undercut this cold pattern with mild Pacific flow. On the maps below, for this model that is not the case, except for a small minority.
Sunday: The Canadian ensembles that stubbornly hung on to the old pattern described above yesterday with almost universal agreement..........is cracking/caving in..........several members are shipping out the polar vortex type low now as milder Pacific flow is showing up on solutions.
Monday: A number of solutions try to go back to the recent pattern, with the upper level ridge building back in the far Southeast and a deep trough somewhere much farther northwest. Too wide of a spread in solutions and changes to make an assessment which provides substantive forecasting skill.
Tuesday: Looking about the same with a good northern stream aimed towards Midwest where the base of the upper level trough is. Highest confidence for cold in this region, especially northern tier. Not enough upper level ridging in the far southeast to block the cold air from penetrating farther southeast than it has recently. Tons of uncertainty on that feature.
Wednesday: Looks just like yesterday. Not noted yesterday but a major feature is the cross polar flow which transports frigid air south through Canada, so the cold that comes further south from Canada into the Northern Tier of the US will be potent cold.
Thursday: The model output guidance is a bit colder but the actual pattern is milder because of several members undercutting the Northern stream and MUCH less cross polar flow. The depth of the Northern Stream trough into the US is also less. Alot of variations and uncertainty.
Friday: The undercutting noted yesterday by several to numerous members is now the majority. This actually showed up for the first time in the GFS operational model over the weekend, suggesting the potential of a pattern change to milder Pacific flow at the end of 2 weeks, which is the period we discuss here. The majority and average show a zonal, west to east flow transporting mild air from the Pacific eastward. This will warm up the West a great deal. How far east the mild air gets, depends on how much northern stream flow coming from Canada affects areas farther downstream(Midwest/Northeast).....but there is great uncertainty here. We could come in tomorrow and find the models changing back to northern stream dominance in 2 weeks vs withdrawing the northern stream today.
Saturday: Very similar to Friday.
Sunday: The average looks somewhat zonal but the individual solutions vary, with the ridge in the far Southeast, a long lived recent pattern, rebuilding. Also, troughing farther west may return.
Monday: A bit colder to me. Slightly more ridging in Alaska leads to a bit more high latitude flow in W.Canada southward, aimed towards a trough with a base somewhere in the US. Southeast ridge is weaker today. Less zonal look to the average but still several members have zonal, mild flow.
Tuesday: Alot of members have a trough in the vicinity of the Plains to just west but some are also farther east. Very cold air supply is cut off so the cold from Canada, will not be like the extreme cold coming early in week 2.
360h GZ 500 forecast valid on Mar 13, 2019 00 UTC
0Z GFS Ensembles at 2 weeks:
Analysis, starting with a week ago:
Last Saturday: The big news here is the sudden introduction of a brand new pattern by some solutions, starting with the 0Z GFS lateFriday evening....seemingly out of nowhere. Instead of the highly amplified ridge W.Canada and deep trough downstream, we suddenly have a powerful Pacific jet stream cutting west to east, zonally across the country and cutting off the extreme cold dropping south(deflecting the northern stream into Canada). Should this pattern verify, temperatures in the NorthCentral US would be 30 degrees warmer than what they would be compared to the previous pattern. WOW! I am skeptical of these solutions for now but they might be picking up on something.
Sunday: Milder Pacific flow showing up with some gusto on several solutions but the northern stream, though being deflected farther north still has enough ooomph on some solutions to potentially drop loads of cold into the northern tier.
Monday: No rebuilding of the Southeast ridge like some Canadian ensembles. Stronger northern stream aimed farther east. Very cold air flows into at least the northern tier. However, a potential new stream from the Pacific blowing west to east is still there on around half of the solutions.......so milder for air trying to come across the country battling a still potent northern stream along the northern tier.
Tuesday: Upper level low/trough in Southeast Canada on enough solutions associated with the northern stream to have good confidence for cold in the Midwest/Northeast. Upper level ridge in the far Southeast is gone.
Wednesday: Same as yesterday.
Thursday: Comments of the Canadian model apply here too. Numerous solutions undercut the cold Northern Stream with mild, west to east zonal flow. So at the end of week 2, mild Pacific air may have more of an opportunity to spread into parts of the US from the west.
Friday: Similar to Canadian. New mild, Pacific, zonal, west to east flow battles uncertain remains of the Northern stream or even tenaciously hanging on Northern Stream on some models. Less cold as we get into late week 2, partly from the progression of days and the cold running out and also because of the potential pattern change.
Saturday: Also similar to Friday. maybe a tad colder Upper Midwest to N.Plains.
Sunday: Ridge in the far Southeast coming back on many solutions. Potential for upper level trough farther west, close to the recent position on a slight majority. Increased chances for warmth in the East, especially the Southeast.
Monday: Milder than the Canadian model because it lacks much northern stream and pretty big changes from run to run...........so uncertainty. Zonal type flow with across much of the country with many solutions having an upper level low in the West.
Tuesday: Trough in the Plains to west, potential ridging southeast to east favored. Lots of precip. Cold will be connected to the trough. Very mild southeast.

Ensemble mean(average of all the individual solutions above)
Wednesday: Upper level low, north of the Great Lakes in the northern stream, has plenty of plenty of cold for the northern tier earlier in week 2.........but weakens on the product below.
The northern stream cold on this 0z solution overnight shows the cold air supply running out at the end of week 2.
However, heights are rebuilding from Alaska to Northwest Canada to the North Pole associated with an upper level ridge...........will that spell more cold in March, with a renewed supply of cold air?
Thursday: Looking MUCH milder(less cold) for 2 weeks out on this product, for the same forecast philosophy above.
Friday: By the end of week 2, all the cold blues that were present up to this period in previous days have vanished, which would be expected with yesterdays big changes and more zonal flow as discussed in the forecast philosophy then. But this is not etched in stone at 2 weeks because of great uncertainty then.
Saturday: Colder Plains, milder southeast.
Sunday: More of yesterday. Upper level ridging returns to the East/Southeast, with warmth. Upper level troughing Plains to West where is will be cold. Precipitation increases again at this end of week 2 period.
Monday: Coldest anomalies in the Plains, warmest in the Southeast to East as we get out to late week 2. Low confidence. Probably a lot of precip.
Tuesday: Same as yesterday. There is some modest upper level ridging in far Northwest Canada that might be able to connect to a northern stream aimed downstream and farther south IF there were amplification of the tough downstream but that's speculative. East looks mild.
Latest, updated graph/forecast for AO and NAO here, including an explanation of how to interpret them.
Previous analysis, with the latest day at the bottom for late week 2 period.
Last Saturday: AO is solidly positive in week 1 still. Then drops in week 2 but only to around zero, with still plenty of spread. NAO has a wide spread with a slight positive bias at the end of 2 weeks. PNA has a slight negative bias. The week 2 and beyond forecast is now extremely chaotic because of the metamorphic solutions which introduce a zonal Pacific flow spreading across the country.........while other solutions maintain the previous, amplified flow(ridge W.Canada/trough downstream, very deeply into the US)
Sunday: AO which is positive, drops in week 2 towards zero. NAO is still positive late in week 2, with the PNA being negative then......this will make it difficult for frigid air, that gets south of the US border, to penetrate deeply into the US.
Monday: AO, which is positive, drops to near 0 at the end of week 2. NAO, which is around zero goes a bit positive. PNA stays a tad negative. Nothing to write home about or use as key indicators ahead. Great uncertainty.
Tuesday. AO which is positive is all over the place with spread at the end of week 2 from strong positive to strong negative. NAO has a wide spread too then from negative to positive. PNA drops to negative at the end of the period. Too much spread and uncertainty to glean good forecasting assessment from, at least for me right now regarding these particular indices. See analysis above on the ensembles for the forecast philosophy.
Wednesday: AO which is positive continues to take a diverging path in week 2. Solutions range from modestly negative to strongly positive. NAO leaning positive with much spread, PNA negative leaning. Overall, a bit less favorable for cold, especially to plunge deeply into the US as we go out to early March.
Thursday: AO stays positive today, NAO slightly positive and PNA a bit negative. This is not favorable for cold to penetrate very deeply into the US at the end of week 2 and beyond.
Friday: AO will be dropping a bit in week 2 has extreme spread from very negative on a couple of solutions to many that stay positive. NAO leans positive, PNA still a tad negative. Nothing powerful with regards to these particular indices.
Saturday: Positive AO and NAO, slight negative PNA not favorable for widespread cold to penetrate deeply in the the US.
Sunday: Noteworthy changes in these indices continue. AO now even more strongly positive.........unfavorable for cold to be transported from high latitudes to low latitudes. NAO is positive and PNA a bit negative, also not favorable for cold in the East. This makes cold air outbreaks late in week 2 and beyond to be less likely in the East.
Monday: More changes. The AO is still solidly positive(not good for cold) but dropping late now. The NAO stays positive, not good for cold in the East but the PNA, which is negative, increases toward zero late in week 2. Tomorrow will likely bring more changes.
Tuesday: AO is positive but falling during week 2 but still just above 0 at the end. NAO stays a bit positive. PNA is negative but almost gets back to 0 at the end. Nothing to use as a strong indicator at the end of week 2..........and these indices are best as indicators during the Winter............which is winding down.
The link below, now has the PNA index added at the bottom:
National Weather Service 6-10 day, 8-14 day outlooks.
Updated this afternoon:
It will start warming up again late in this period in the Southeast. Still waiting for this.
Temperature Probability | |
Precipitation Probability | |
| the 8-14 day outlooks ArchivesAnalogsLines-Only FormatGIS Data | |
Temperature Probability | |
 | |
Early Tuesday from Natural Gas Intelligence:
Expiring March Natural Gas Climbs Early as Forecasts Cool Further Overnight
8:59 AM
Natural gas futures were trading higher early Tuesday, bolstered by an outlook for colder-than-average temperatures to open the month of March. Heading into expiry, the March Nymex contract was up 5.1 cents to $2.887/MMBtu just after 8:30 a.m. ET.