
Lucky March 13th! Do something to warm somebody's heart today. Don't just think about it........do it. Then think about it.............and how you just made somebody's world a tiny bit better.
Our local chess tournament on Saturday got some great coverage:
Scroll down and enjoy the latest comprehensive weather to the max. Here's the latest weather..... occurring because of the natural physical laws in our atmosphere. Time to warm up!!!
Here are the latest hazards across the country.
Purple/Pink/blue on land is cold/Winter weather. Brown is wind, Green is flooding. Gray is fog. Reddish is a red flag advisory.
Go to the link below, then hit the location/county on the map for details.
https://www.spc.noaa.gov/ Go to "hazards"

Wind map Hit this with your cursor:


Wind map Press down on this on the left with your cursor!


Current Jet Stream

Winter Weather
https://www.wpc.ncep.noaa.gov/wwd/winter_wx.shtml
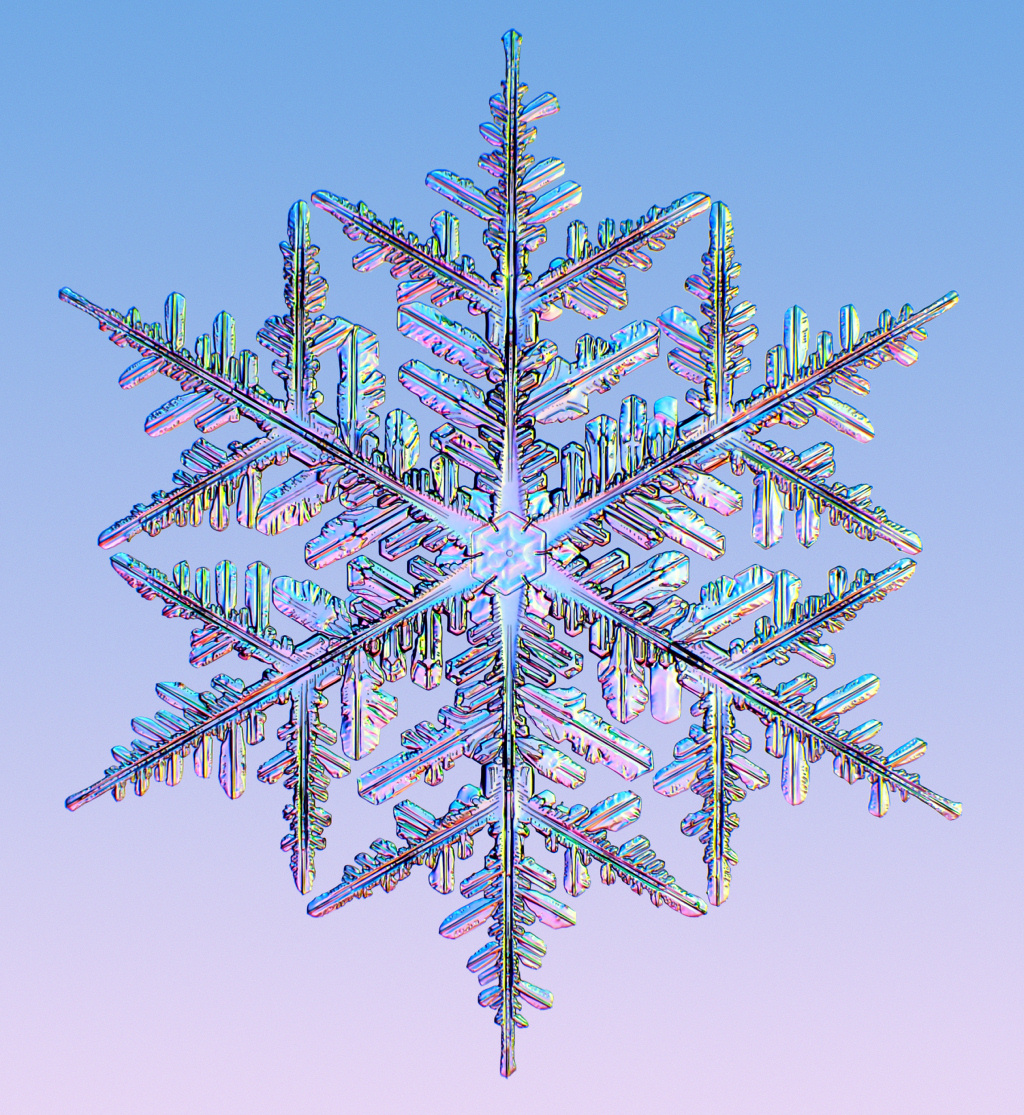
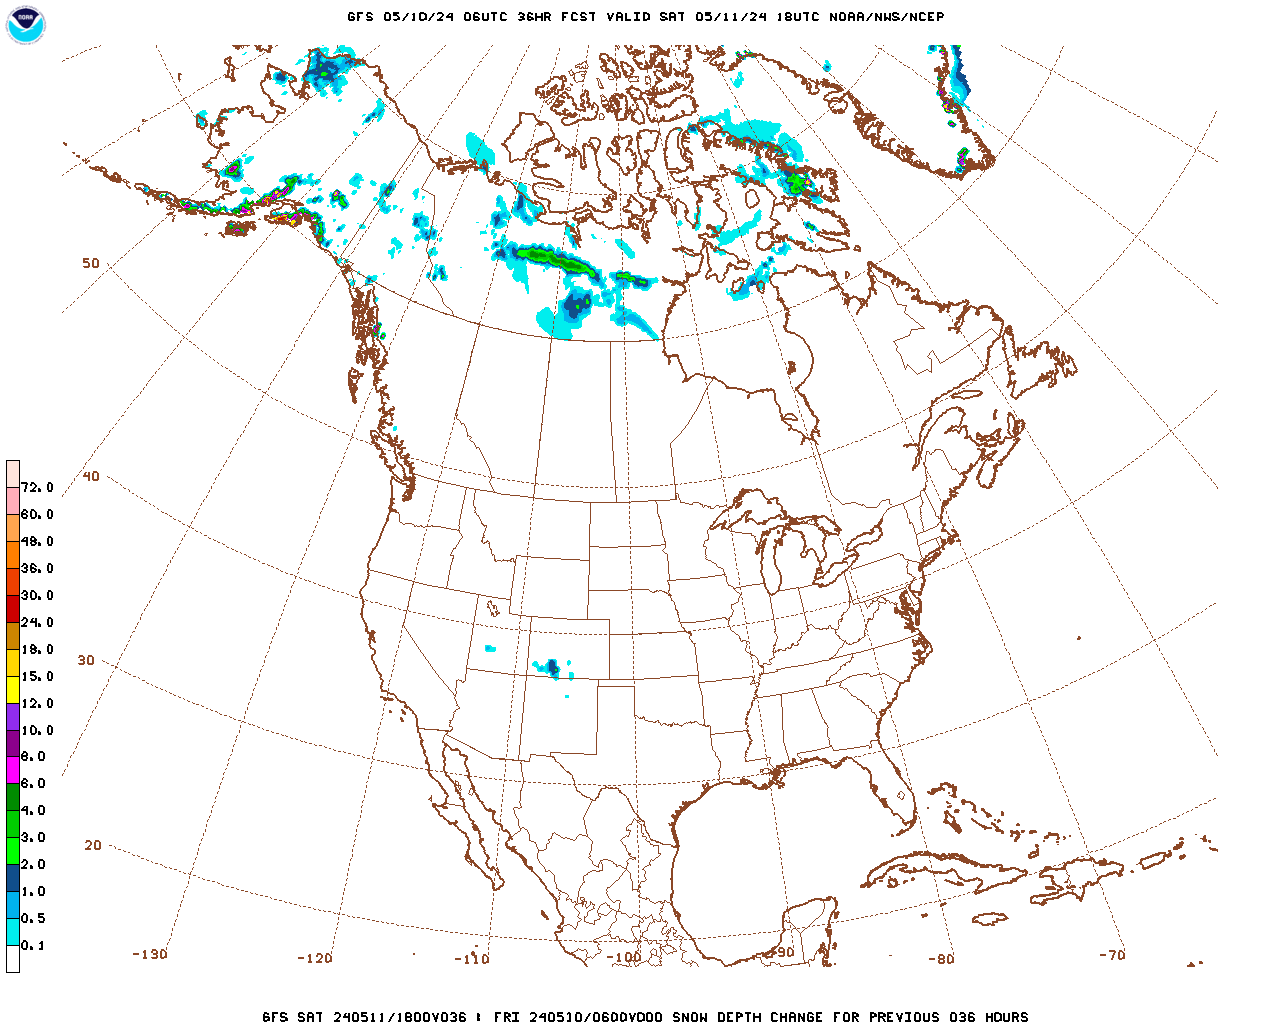
Snowfall the next day:
Forecast Hour: 036
Image URL: http://mag.ncep.noaa.gov/data/gfs/06/namer/snodpth_chng/gfs_namer_036_snodpth_chng.gif
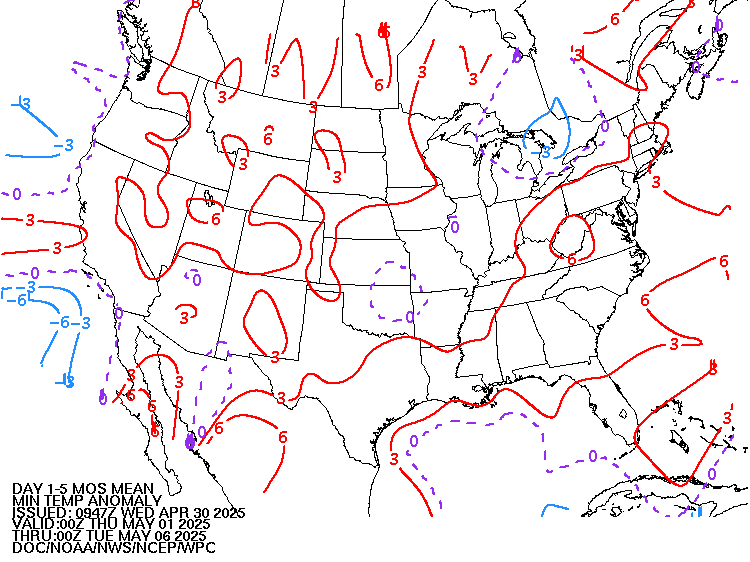
| Low Temperatures Tomorrow Morning |

Much warmer than recent days!


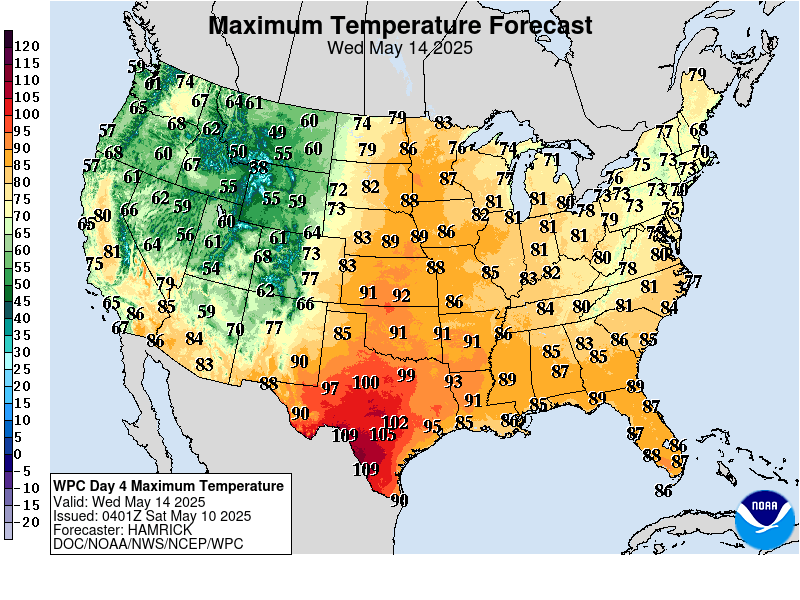
Highs for days 3-7:
Not much change from late this week onward.



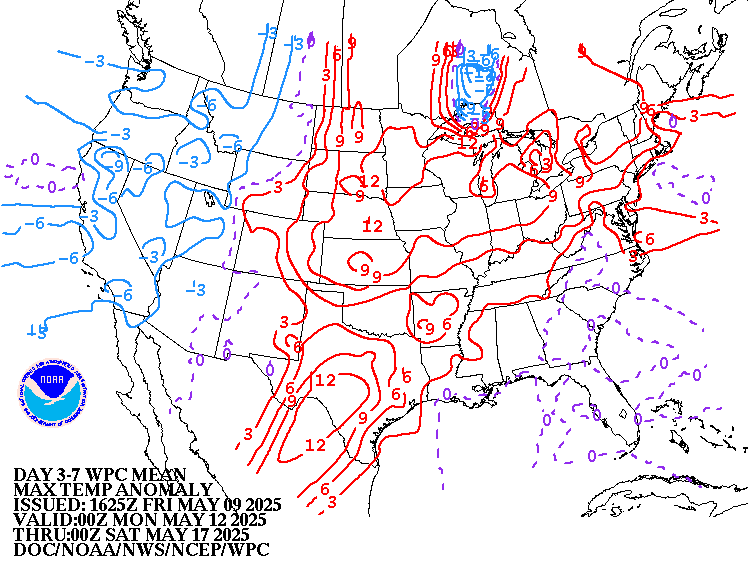
How do these days 3-7 temperatures compare to average at this time of year?
Close to average and minor fluctuations for the first time in awhile.
https://www.wpc.ncep.noaa.gov/medr/medr_mean.shtml
Weather maps for days 3-7 below
After the intense midweek storm..........pretty quiet.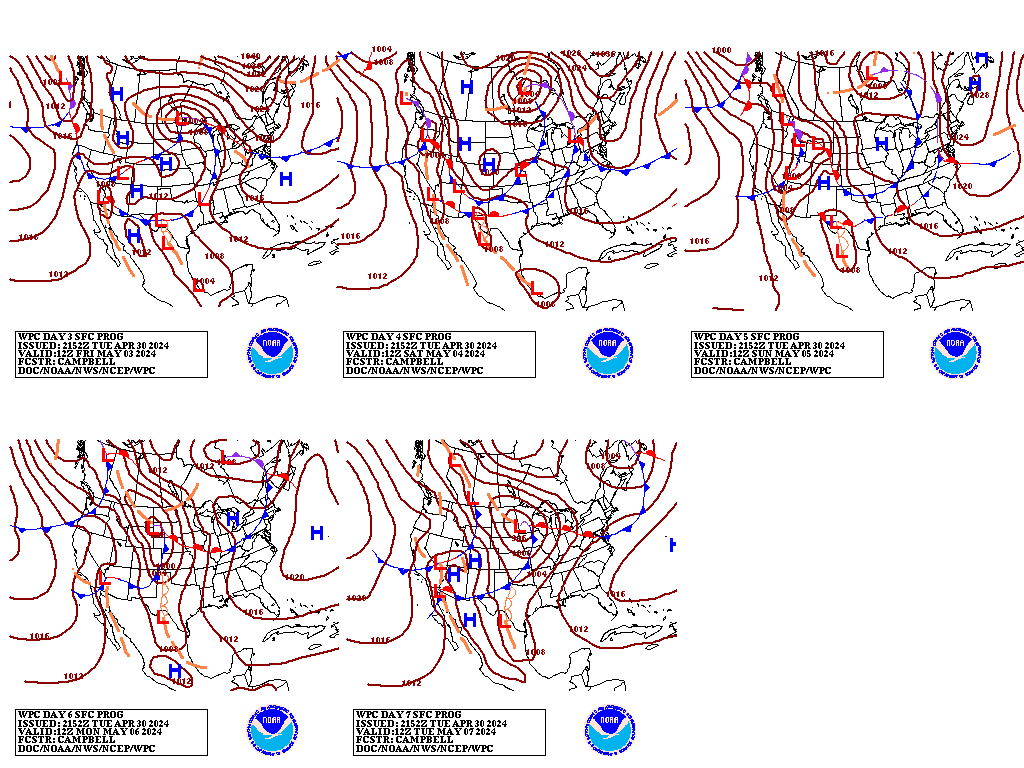
Liquid equivalent precip forecasts for the next 7 days are below.
Tons of precip the next 2 days........then, mostly dry.
Day 1 below:
http://www.wpc.ncep.noaa.gov/qpf/fill_94qwbg.gif?1526306199054

Day 2 below:
http://www.wpc.ncep.noaa.gov/qpf/fill_98qwbg.gif?1528293750112

Day 3 below
http://www.wpc.ncep.noaa.gov/qpf/fill_99qwbg.gif?1528293842764

Days 4-5 below:
http://www.wpc.ncep.noaa.gov/qpf/95ep48iwbg_fill.gif?1526306162

Days 6-7 below:
http://www.wpc.ncep.noaa.gov/qpf/97ep48iwbg_fill.gif?1526306162

7 Day Total precipitation below:
http://www.wpc.ncep.noaa.govcdx /qpf/p168i.gif?1530796126

Excessive Rainfall Forecasts
Mesoscale Precipitation Discussions
Current Day 1 Forecast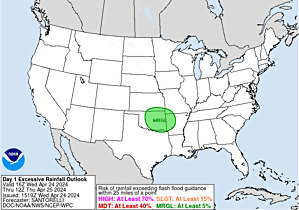 Valid 12Z 03/12/19 - 12Z 03/13/19 |
Day 1 Threat Area in Text Format
| Day 2 and Day 3 Forecasts |
Current Day 2 Forecast Valid 12Z 03/13/19 - 12Z 03/14/19 |
Day 2 Threat Area in Text Format
Current Day 3 Forecast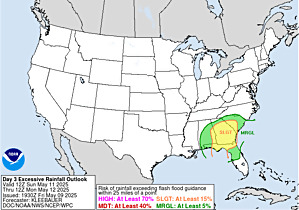 |
Severe Storm Outlook
https://www.spc.noaa.gov/products/outlook/
Current Dew Points
Moisture in green is returning north in a big way!

Latest radar loop
http://www.nws.noaa.gov/radar_tab.php

| Full resolution version loop (3400x1700 pixels - 2.2mb) |

Go to: Most Recent Image
Precipitation the past 24 hours
![]()
You can go to this link to see precipitation totals from recent time periods:
https://water.weather.gov/precip/
Go to precipitation, then scroll down to pick a time frame. Hit states to get the borders to see locations better. Under products, you can hit "observed" or "Percent of normal"
+++++++++++++++++++++++++++++++++++++++++++++++
+++++++++++++++++++++++++++++++++++++
Precipitation compared to average for the last 7, 14, 30 and 60 days.
Usually not updated for previous day until late the next day.
https://www.atmos.illinois.edu/~snodgrss/Ag_Wx.html


The top map is the Canadian ensemble average, the maps below are the individual members that make up the average
+++++++++++++++++++++++++++++++++++++++++
Each member is like the parent, Canadian model operational model.......with a slight tweek/variation in parameters. Since we know the equations to represent the physics of the atmosphere in the models are not perfect, its useful to vary some of the equations that are uncertain(can make a difference) to see if it effects the outcome and how.
The average of all these variations(ensembles) often yields a better tool for forecasting. It's always more consistent. The individual operational model, like each individual ensemble member can vary greatly from run to run.........and represent an extreme end of the spectrum at times. The ensemble average of all the members, because it averages the extremes.............from opposite ends of the spectrum.........changes much less from run to run.
End of week 2....................0z ensembles from WEDNESDSAY:
Analysis starting from a week ago, ending with today:
Last Monday: Still very mild, zonal Pacific flow. Some minor/subtle changes in the Northeast(from a few solutions) that might cause more troughing/cooling that need to be watched to see if they amount to anything down the road.
Tuesday: Several solutions showing more troughing East. The mean still looks zonal and mild but the changes continue to be slight and in the colder direction.
Wednesday: Around the same as Tuesday. Overall a mild zonal look to the mean but with some subtle ridge/west, tough/east tendencies, that on some solutions, is amplified enough to engage northern stream cold.
Thursday: Back to being milder again. Zonal Pacific west to east flow prevalent on the majority but not all solutions. The upper level low in Northeast Canada is too far north on most solutions to impart northern stream cold very far southward into the US.
Friday: The ridge west/trough east(downstream) couplet that was least apparent on the Canadian models shows up better today in Canada, which is where its capable of generating cold air. However, this is offset by several solutions with an undercutting, milder flow. Today's overnight solution is a bit colder than yesterday's.
Sunday: Much milder, west to east, Pacific flow has overwhelmed and is undercutting any northern stream influence. The ridge/west, trough east couplet is barely seen on a small minority.
Monday: Same much milder, west to east, Pacific flow as yesterday.
Tuesday: Similar to the last 2 days. Very mild mean.
Wednesday: The much milder, new pattern featuring mild Pacific flow that spreads from west to east across the country keeps looking impressive.
360h GZ 500 forecast valid on Mar 28, 2019 00 UTC
0Z GFS Ensembles at 2 weeks:
Analysis, starting with a week ago:
Last Monday: Unlike the Canadian ensembles, the GFS ensembles are more bullish with the northern stream. Some of them build a ridge/west, trough/east(downstream) couplet that would usher in the cold from Canada. This was mentioned on Sunday afternoon in a special update when it first started showing up............but that doesn't mean that it will happen. Just an interesting new development for what the models think(guess) will be happening in 2 weeks.
Tuesday: Still moving in the colder direction on the majority of solutions with more troughing in the Northeast noted on all of them now.
Wednesday: Ridge west/trough east is slightly less amplified today on several of the solutions(less northern stream connection) but still the main feature to be watching at the end of week 2.
Thursday: Ridge west/trough east couplet vs undercutting Pacific flow is the battle. Overnight models were a tad milder in the center of the country and shifted to cold from the northern stream farther east, to the far Northeast US from the couplet mentioned.
Friday: The 12z solution yesterday amplified the ridge west/trough east feature and this continued early last night on the 0z solutions seen below..........which is much colder than 24 hours ago. The solutions below are are dominated by the Northern Stream , some are very cold in the Midwest/East. However, the 06z run early this morning was not quite as cold.
Sunday: The trough with any ridge/west, trough east northern stream influence is way up in Central to Northeast Canada, leaving the US in mild Pacific air.
Monday: Similar to yesterday.
Tuesday: Still very mild
Wenesday: Still very mild but with a couple of outliers that want to over amplify a northern stream low/trough and drive it into Southeast Canada from the ridge/west, trough/east couplet in the higher latitudes.

Ensemble mean(average of all the individual solutions above)
Last Monday: Upper level ridge building along the West Coast into Canada with troughing and coolingdownstream......at the end of 2 weeks. This is cooler for that period than the last several days. The Euro ensembles started this on Saturday Night and the Sun PM GFS ensembles caught on as noted on the special Weather Sunday update yesterday ahead of the natural gas open, then following it. This doesn't mean it will happen........just that a few more model solutions show it.........while others still do not.
Tuesday: You can see the modest upper level ridge in W.Canada and trough downstream on the anomaly below. Turning cold again in the east and during the late parts of March if this is right.
Wednesday: Similar to yesterday but the anomalies are a tad weaker.
Thursday: Actually, the ridge/west, trough/east couplet today looks a bit stronger but the downstream upper level trough/low anomaly is much farther east...........in Eastern Canada.......which allows more of the warmth from the western ridge to push farther east and the cold from the downstream trough to be mainly in Southeast Canada vs south of the border.
Friday: This product had not been updated as of Friday Morning.
Sunday: Weak ridging west and troughing in Eastern/Northeastern Canada(where cold will be, just north of Northeast US.
Monday: Far Western North American ridge anomaly is more impressive today, however the down stream trough is in Northeastern Canada as much of the US has positive anomolies, all the way to the East Coast................so the Pacific warmth will likely be widespread.
Tuesday: Still very mild in the US with Pacific flow, with a ridge/west, trough/east couplet way up in Canada that will be much too far north to bring northern stream flow or cold this far south..........but something to watch.
Wednesday: The big upper level ridge in Western North America builds all the way north........to Siberia but the downstream trough is waaaay to far north for any northern stream derived dynamics to get as far south as the US. This may just represent a seasonal migration northward of the jet stream and position of the main weather features. Mild Pacific flow dominates here.
Latest, updated graph/forecast for AO and NAO here, including an explanation of how to interpret them.
Previous analysis, with the latest day at the bottom for late week 2 period.
Last Monday: AO drops faster in week 2, now with numerous solutions solidly negative..........increasing chances for cold in the high latitudes to be transported towards the mid latitudes during the 2nd part of March. However, the very wide spread indicated uncertainty/low confidence. NAO has increasing spread and uncertainty on both sides of zero. PNA too but the trend for the PNA is up and most solutions are now positive at the end of 2 weeks vs previously around zero. This has also elevated the chances for cold to penetrate south vs the last few days using these indices.
Tuesday: AO continues to look more favorable for cold to move from high latitudes to mid latitudes in late March. Going from positive in week 1 and plunging in week 2, to negative by the end. NAO around zero. PNA increasing to positive which enhances the chance of cold penetrating into the US, east of the Rockies.
Wednesday: AO only drops to zero now at the end of week 2..............less favorable for frigid air to travel from high to mid latitudes. NAO stays a bit positive............also less favorable for cold. PNA is a bit positive, which still favors cold. None of the indices are very powerful forecast tools right today.
Thursday: AO which is positive, drops but only close to zero. NAO stays a bit positive, PNA also positive.........favorable for a ridge and warmth in the West. Other than that, nothing profound.
Friday: AO goes from positive to near zero. NAO is a tad positive. PNA is enough positive to favor a ridge West.
Sunday: AO stays positive, NAO positive...........NOT favorable for cold to travel from high to mid latitudes. PNA is positive, favorable for warmth/ridging in the West.
Monday: AO positive, NAO positive..........unfavorable to cold to move southward into the US from higher latitudes. PNA does get solidly positive because of the ridging in the West.
Tuesday: Indices today are becoming volatile at the end of week 2. AO positive but drops to near zero at the end of 2 weeks. NAO also falling but still a bit positive. The wide spread means a bit more uncertainty and a slight increase that cold could return at the end of March(but still unlikely). PNA positive but falling. It's getting too late in the heating season for cold to make a big difference.
Wednesday: Positive AO and NAO make cold air intrusions unlikely. Positive PNA means ridging and warmth in the West.
The link below, now has the PNA index added at the bottom:
National Weather Service 6-10 day, 8-14 day outlooks.
Updated this afternoon.............should continue to turn warmer.
Temperature Probability | |
Precipitation Probability | |
| the 8-14 day outlooks ArchivesAnalogsLines-Only FormatGIS Data | |
Temperature Probability | |
 | |
Previous posts:
By metmike - March 11, 2019, 12:17 p.m.
 Ryan MaueVerified account @RyanMaue 54m54 minutes ago
As powerful Plains storm reaches maximum intensity or lowest pressure, it will have an "eye like" feature similar to a hurricane. The strongest non-tropical storms like the "bomb cyclone" from last winter develop clear areas at center similar to tropical systems Late Wednesday:


Wind gusts surrounding the center -- and in the clear air in North Texas -- will exceed 50-60 knots ... with local gusts in excess of Hurricane Force especially in higher elevations. Blizzard criteria will easily be met where it is snowing heavily.

