
Hello April 3rd! Don't fool around.....do something authentic to make somebody happy today. Don't just think about it........do it. Then think about it.............and how you just made somebody's world a tiny bit greener.
Our local chess tournament 3 weeks ago got some great coverage. I'm extraordinarily proud of the kids and also the adults that helped run this event:
Scroll down and enjoy the latest comprehensive weather to the max. Here's the latest weather..... occurring because of the natural physical laws in our atmosphere. Still looks too wet for early planting.
Here are the latest hazards across the country.
Purple/Pink/blue on land is cold/Winter weather. Brown is wind, Green is flooding. Gray is fog. Reddish is a red flag advisory.
Go to the link below, then hit the location/county on the map for details.
https://www.spc.noaa.gov/ Go to "hazards"

Wind map Hit this with your cursor:


Wind map Press down on this on the left with your cursor!


Current Jet Stream

Winter Weather
https://www.wpc.ncep.noaa.gov/wwd/winter_wx.shtml
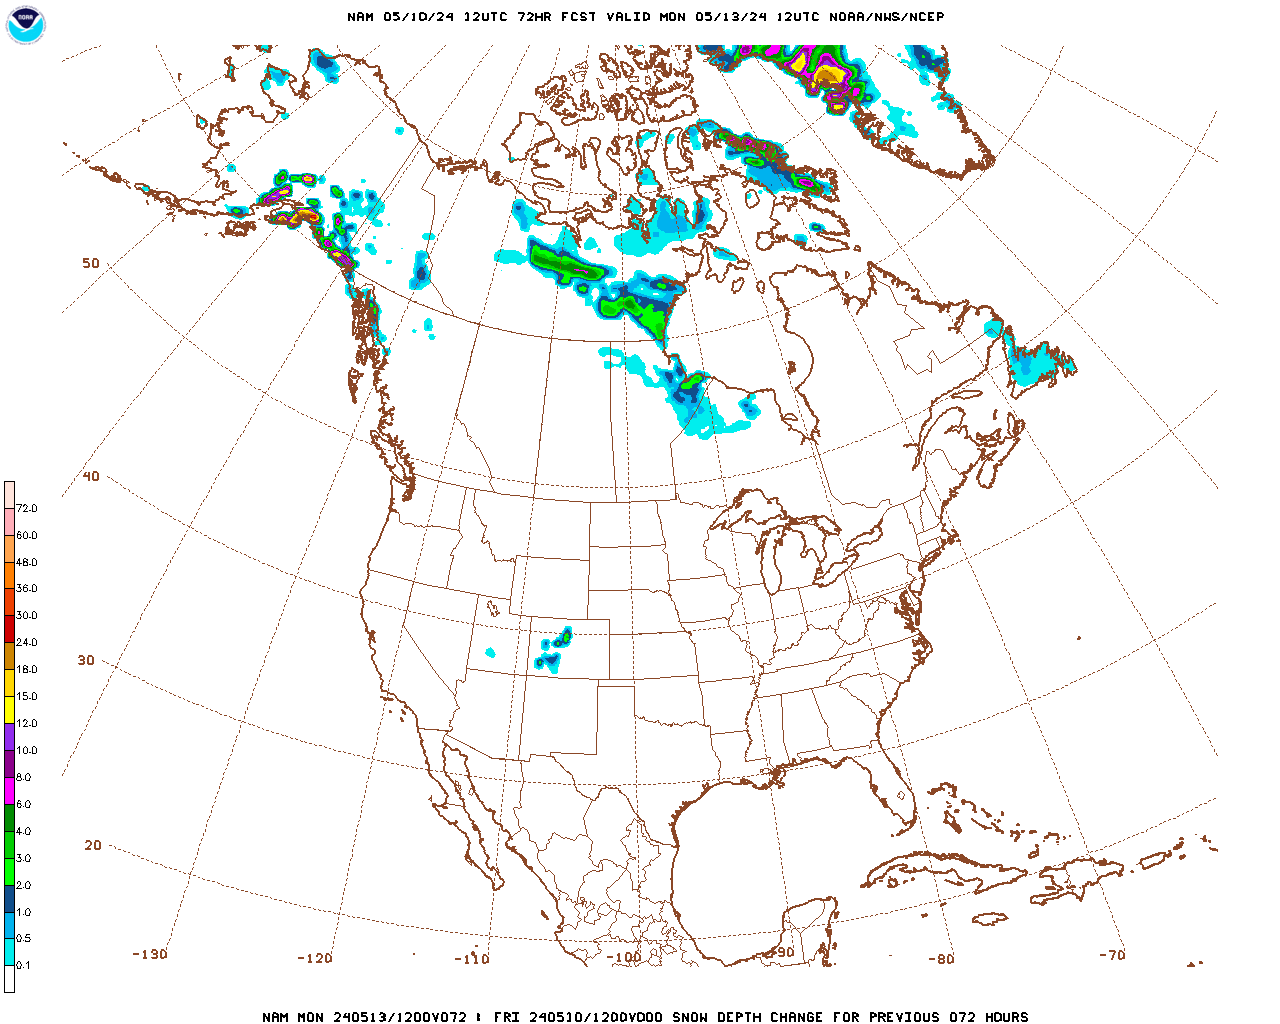
Snowfall the next 3 days:
Forecast Hour: 072
Image URL: http://mag.ncep.noaa.gov/data/nam/12/nam_namer_072_snodpth_chng.gif
| Low Temperatures Tomorrow Morning |

Back close to average!


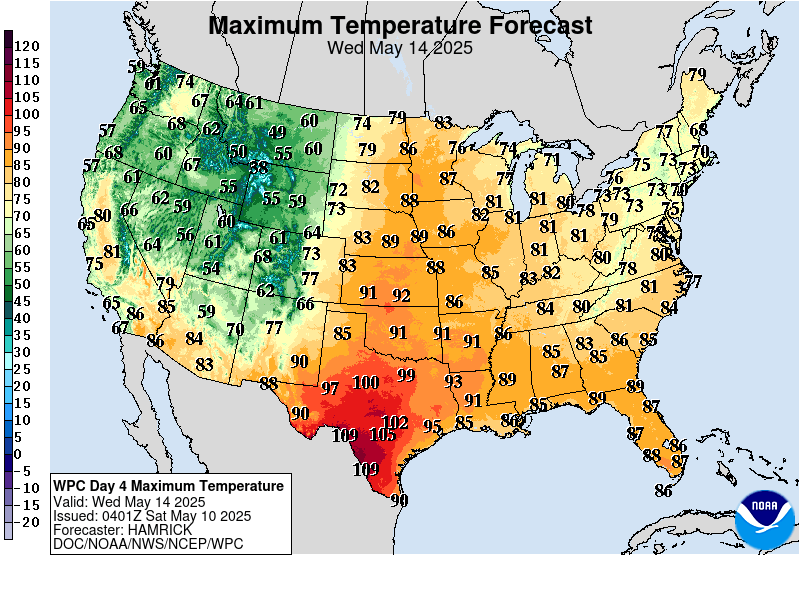
Highs for days 3-7:
Above average this this weekend, then cooling off early next week!



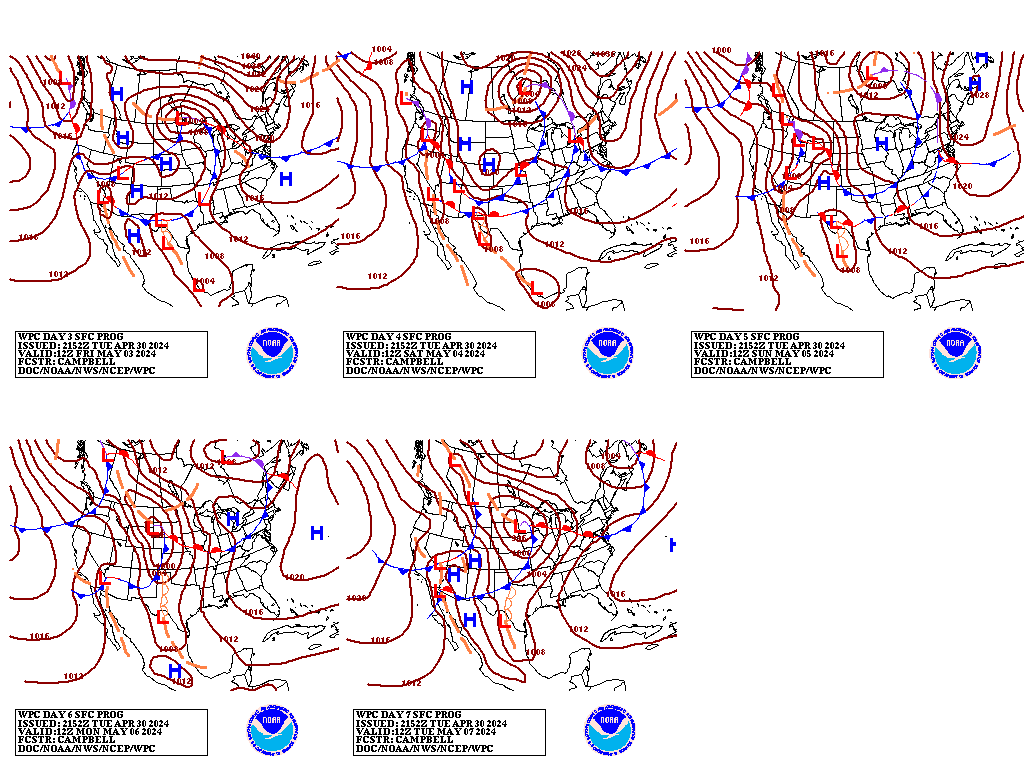
Weather maps for days 3-7 below
Pretty active.
Liquid equivalent precip forecasts for the next 7 days are below.
Not good for early planting prospects. Rains heaviest south and east over the next week.
Day 1 below:
http://www.wpc.ncep.noaa.gov/qpf/fill_94qwbg.gif?1526306199054

Day 2 below:
http://www.wpc.ncep.noaa.gov/qpf/fill_98qwbg.gif?1528293750112

Day 3 below
http://www.wpc.ncep.noaa.gov/qpf/fill_99qwbg.gif?1528293842764

Days 4-5 below:
http://www.wpc.ncep.noaa.gov/qpf/95ep48iwbg_fill.gif?1526306162

Days 6-7 below:
http://www.wpc.ncep.noaa.gov/qpf/97ep48iwbg_fill.gif?1526306162

7 Day Total precipitation below:
http://www.wpc.ncep.noaa.govcdx /qpf/p168i.gif?1530796126

Current Dew Points
Air is moistening a bit but still fairly dry.

Latest radar loop
http://www.nws.noaa.gov/radar_tab.php

| Full resolution version loop (3400x1700 pixels - 2.2mb) |

Go to: Most Recent Image
You can go to this link to see precipitation totals from recent time periods:
https://water.weather.gov/precip/
Go to precipitation, then scroll down to pick a time frame. Hit states to get the borders to see locations better. Under products, you can hit "observed" or "Percent of normal"
+++++++++++++++++++++++++++++++++++++++++++++++
Precipitation compared to average for the last 7, 14, 30 and 60 days.
IT's BEEN DRYING OUT IN THE SOUTH BUT IT WILL GET WET AGAIN THERE!
Usually not updated for previous day until late the next day.
https://www.atmos.illinois.edu/~snodgrss/Ag_Wx.html


Soilmoisture anomaly:
VERY wet but its been drying out in the south.................with lots of rain coming up in the next 2 weeks in the south.
https://www.cpc.ncep.noaa.gov/products/Soilmst_Monitoring/US/Soilmst/Soilmst.shtml#


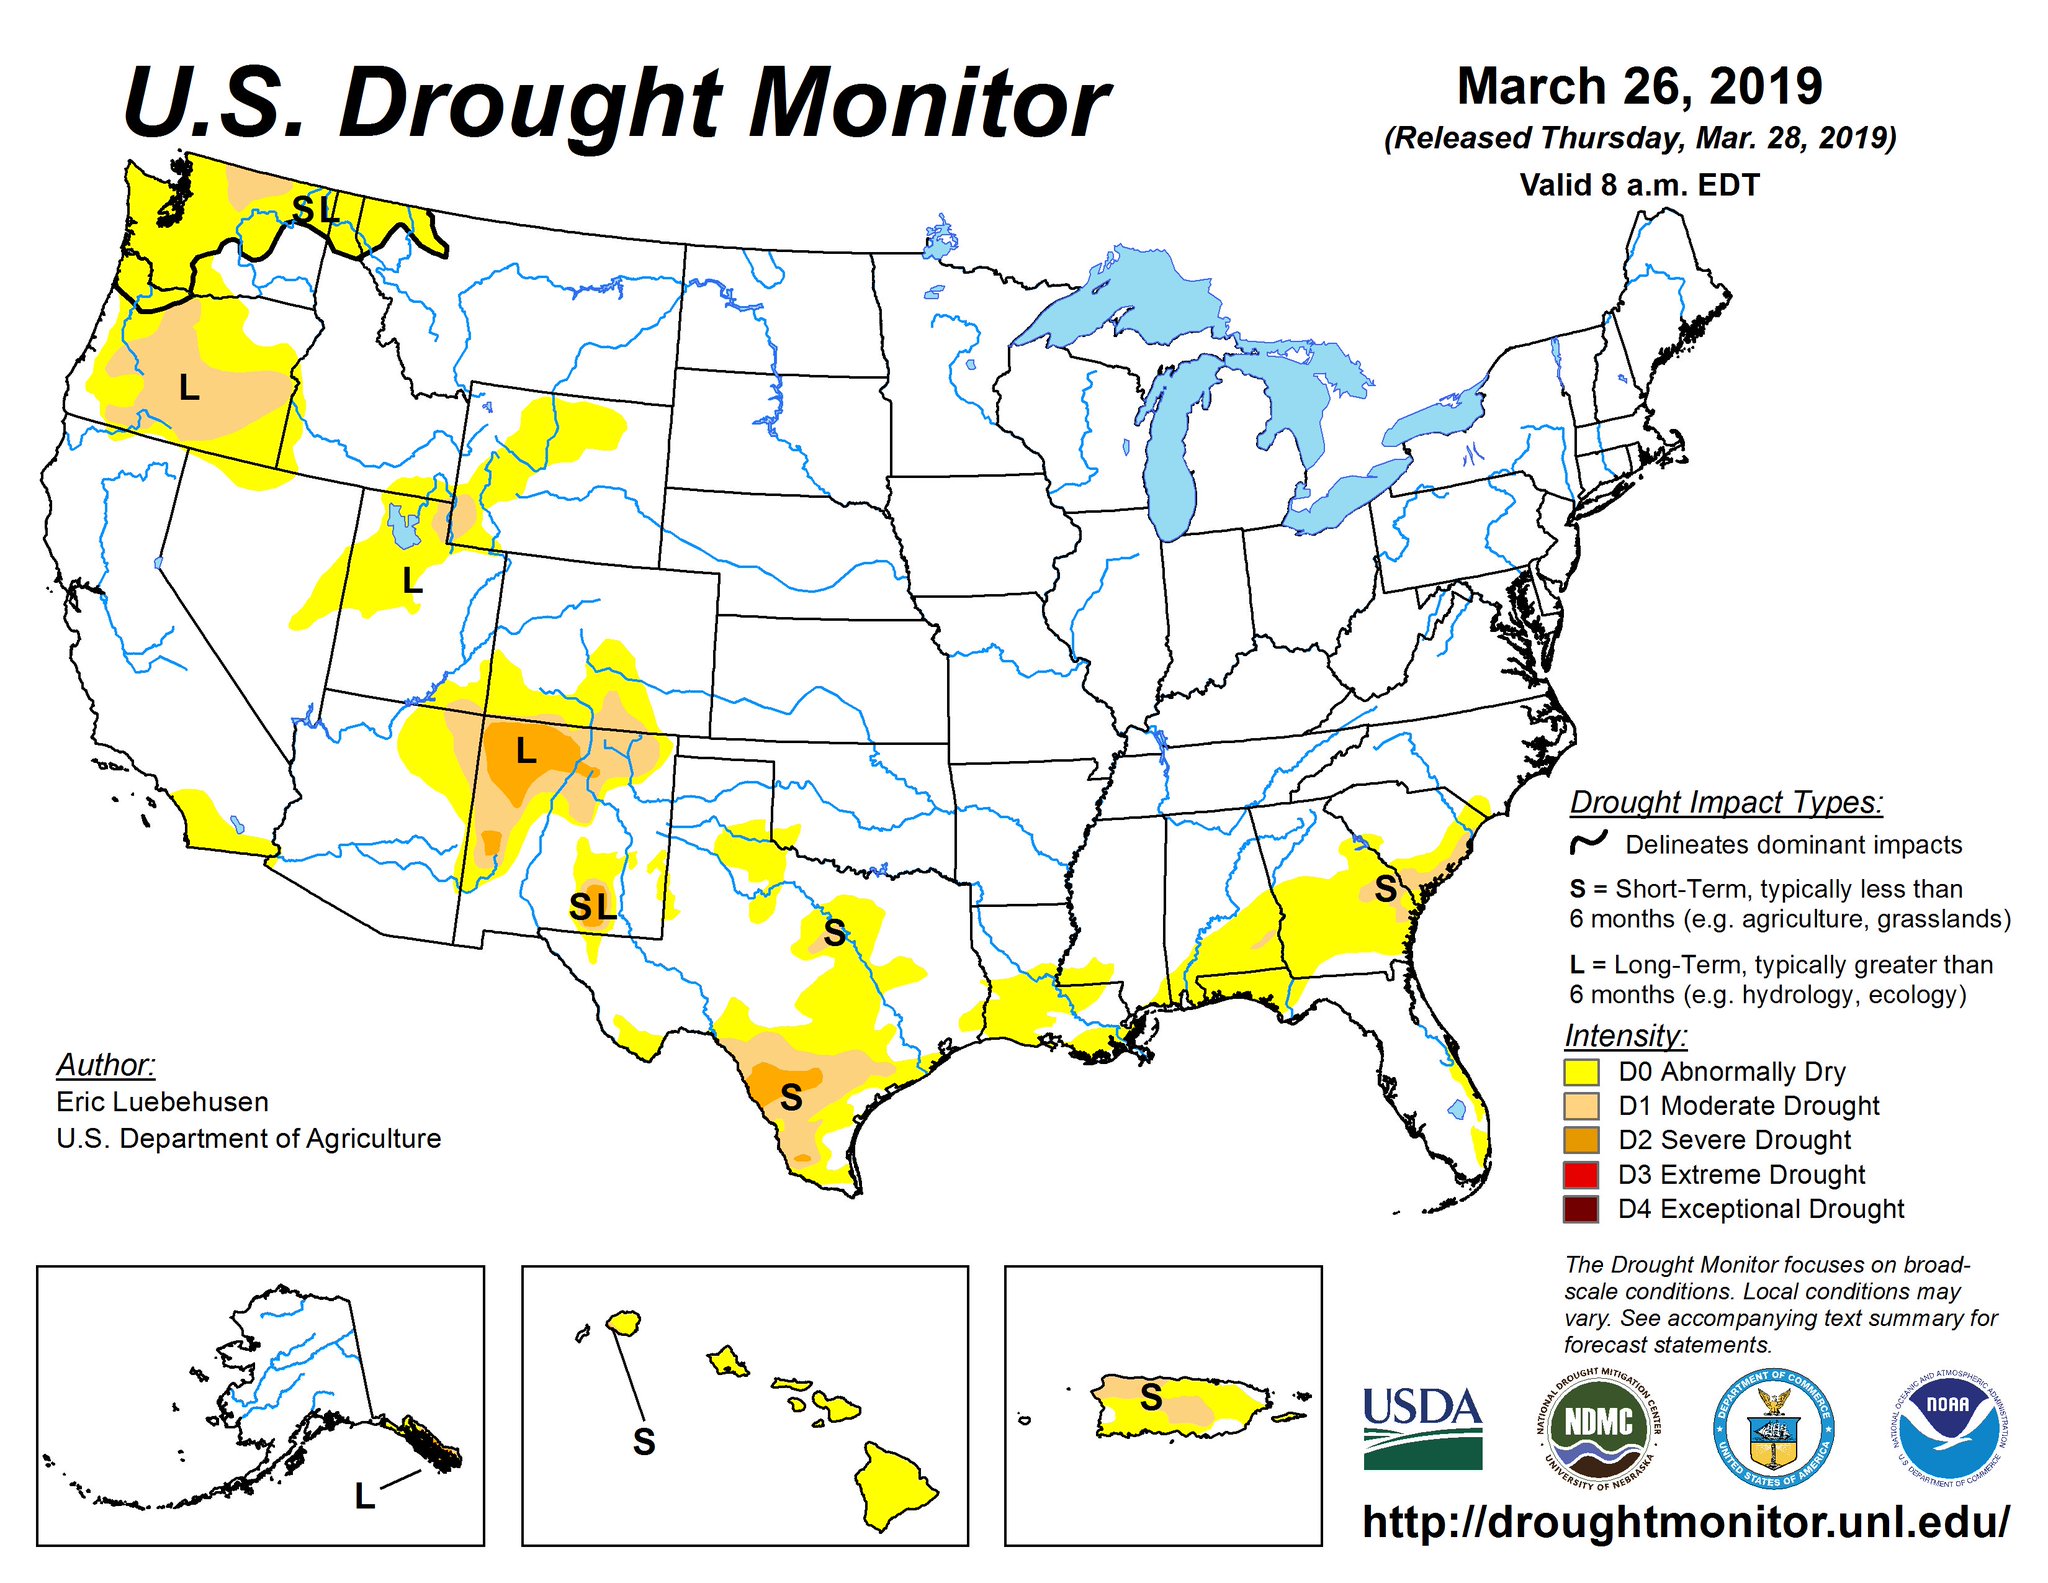
Currently, there is 0% of the Cornbelt/Midwest with drought. There is no place even slightly dry there or east of the Rockies, other than in TX and the far Southeast.
I am pretty sure that this has never happened since records have been kept. The market will be keying on precip forecasts for planting concerns for the next month.
https://droughtmonitor.unl.edu/
The top map is the Canadian ensemble average, the maps below are the individual members that make up the average
+++++++++++++++++++++++++++++++++++++++++
Each member is like the parent, Canadian model operational model.......with a slight tweek/variation in parameters. Since we know the equations to represent the physics of the atmosphere in the models are not perfect, its useful to vary some of the equations that are uncertain(can make a difference) to see if it effects the outcome and how.
The average of all these variations(ensembles) often yields a better tool for forecasting. It's always more consistent. The individual operational model, like each individual ensemble member can vary greatly from run to run.........and represent an extreme end of the spectrum at times. The ensemble average of all the members, because it averages the extremes.............from opposite ends of the spectrum.........changes much less from run to run.
End of week 2....................0z ensembles from WEDNESDAY:
Analysis starting from a week ago, ending with today:
Last week+ of analysis, starting with the day farthest in the past:
Last Monday: It's all southern stream, Energy from the El Nino driven active south Pacific wil be aimed towards the central and souther US. The question is NOT will it be wet with this pattern but HOW WET and HOW FAR north and west will the wet pattern be? The N.Plains and far Upper Midwest will not be as wet.
Tuesday: Similar to yesterday. The mean looks zonal and for sure dials out any northern stream influence, so temperatures should be mild. The individual solutions still show a lot of potential southern stream activity and precipitation but are not quite as wet today.
Wednesday: Potential for heavy precip and possible excessive rain event(s) from the El Nino driven southern stream late week 2.
Thursday: I still see the threat of heavy rains. The more amplified the ridge in the east becomes, the heavier the rains.
Friday: Watching the southern stream for the potential of excessive rain events. Upper level ridge in the Southeast and upper level trough in the West are ideal set up.
Saturday: Setting up for the excessive rain events in week 2 from S.Plains to points east/northeast.
Sunday: Not sure on where the wettest weather will be now but still leaning to S.Plains for heaviest. . Looks active but more progressive.
Monday: Still wet as we go into mid April. Will the upper level ridge in the Southeast be strong enough to keep the flow from being progressive? Any amplification of the ridge or upper level lows/troughs in the southern stream will result in some excessive rains.
Tuesday: Very wet from the southern stream. Looking at the potential for excessive rain events in the S.Plains and points east/northeast again.....depending on how stout the ridge in the Southeast is.
Wednesday: Much drier for this ensemble model and run at the 2 week time frame. Also cooler in the Midwest/East. Will ridge West/trough East couplet in Canada to Upper Midwest take over and suppress the southern stream?
360h GZ 500 forecast valid on Apr 18, 2019 00 UTC
0Z GFS Ensembles at 2 weeks:
Analysis, starting with a week ago:
Last Monday: Active southern stream, high confidence............ for this far out at least.
Tuesday: Some solutions are looking drier.
Wednesday: Southern stream looking especially active late week 2 on this mornings solutions. Deep trough to cut off low in the S.Plains.
Thursday: This particular batch of solutions does not look as wet as the 0z Canadian model ensembles to me but the run after this, 06z GFS ensembles looked wetter.
Friday: Still looking very wet. Widespread and in some places potentially excessive rains.
Saturday: Active Southern stream. Heaviest rains, possible flooding from S.Plains east/northeastward.
Sunday: Active and wet with southern stream dominant.
Monday: Wettest weather in the S.Plains.
Tuesday: Wettest weather in the S.Plains but now with the potential of an upper level low in the Northeast, a possible northern stream and cooler temperatures in mid April.
Wednesday: Southern stream looks more active on this model vs the Canadian , especially the 6z run after this one below.

Ensemble mean(average of all the individual solutions above)
Last Monday: Positive height anomaly in the Great Lakes means mild weather. Extension of that westward....possibly protecting that area from the wet southern stream which will define the (WET) weather over much of the US.
Tuesday: One noteworthy and potentially huge change. The negative anomaly in the West has been shifting farther west............now out in the East Pacific and growing. This could be so far west that it induces downstream ridging farther west and shifts the storm track far enough west so that the Gulf of Mexico is not wide open all the time. This is why my extended range forecast is a bit drier today, taking this into account.
Wednesday: Similar anomalies to yesterday but my analysis, suggesting a potential to turn drier may be flawed. This, because of the new negative anomaly in the S.Plains, induced by energy eminating from an El Nino drive southern stream. This, in combo with the positive anomaly in the Northeast, spells very wet weather for the S.Plains and points northeastward. Potential for excessive rains(more favored in southern locals at this time) with the Gulf of Mexico wide open.
Thursday: A growing new positive anomaly in N/C Canada on this run. Will it mean anything with regards to the northern stream down the road? Southern stream and heavy rain threats are still the main show for the US, especially around the S.Plains and points east.
Friday: Still positive anomalies in the East/Northeast and today's southern stream negative anomaly center in the far Southwest.......favorable for moisture to gush north from the Gulf of Mexico and southern stream energy from the tropics/El Nino to be aimed in that direction.
Saturday: Big change in the positive anomaly centers. The one in the Northeast weakens with a new, greater one from central to Northeast Canada associated with the northern stream that "could" turn things chilly in mid April if it were to strengthen..........speculative. Not much speculating on the southern stream being strong. Just a matter of where its going to be aimed for heavy precip.
Sunday: Active southern stream. Where will it be aimed?
Monday: Anomalies not that impressive.
Tuesday: Anomalies changing quite a bit. A new positive one in Northwest Canada across Alaska(another around Greenland) with the positive anomaly in the Northeast that was the main one last week, being replaced with a negative anomaly in Southeast Canada. This suggests the increasing potential for chilly weather in mid April. It could also dry things out in the Midwest by suppressing the southern stream farther south, into the S.Plains.
Wednesday: New anomaly centers continue from yesterday. Positve Northwest Canada to Alaska, negative downstream to the southeast. Should mean cooler mid April weather. Will it also dry things out in the Upper Midwest/N.Plains and suppress the southern stream south? Watch the upper level ridge in the Southeast. If it holds, it will be very wet in the S.Plains.
Latest, updated graph/forecast for AO and NAO here, including an explanation of how to interpret them.
Previous analysis, with the latest day at the bottom for late week 2 period.
Last Monday: AO drops hard at the end of 2 weeks from positive. NAO stays solidly positive.......making it tough for cold to penetrate deeply into the US and being favorable for wet weather. PNA is barely positive at the end of 2 weeks.
Tuesday: AO drops hard to slightly negative. NAO and PNA are positive at the end of 2 weeks. It's the time of year when these indices are not as powerful as indicators for temperature trends in the US compared to a couple of months ago. However, the NAO/PNA can sometimes suggest a pattern that helps with precip. If we get a strongly negative NAO for instance, it often suppresses Gulf of Mexico moisture from maintaining a constant presence in the Midwest.
Wednesday: AO plunges to negative with very wide spread. NAO is mostly positive but not entirely with wide spread. PNA stays slightly positive with wide spread. Looks like potential for big changes and possibly a lot of action as we get into the 2nd week of April!!!
Thursday: AO drops to a bit negative. NAO drops to a tad positive from strong positive. PNA increases a great deal into positive territory late in the period. If this were January, one might be watching for a change to colder.
Friday: AO drops to negative, NAO to slightly negative, PNA to around 0. Not favorable for any cold.........but its April now people!
Saturday: AO really plunges now, to moderately negative. NAO to around 0 from positive and PNA a bit positive. Keep this up with gusto and the mid April forecast might turn cooler but we're a long ways from that and they indices are not as powerful for northern stream insight/affect on the US in the warmer months.
Sunday: AO drops to negative, not as much as yesterday..............less cold threat. NAO has a very wide spread on both sides of 0. PNA slightly positive.
Monday: AO a bit negative. NAO drops to near 0. PNA a tad positive. Weak.
Tuesday: Stronger signals today. AO more negative......and favorable for cold air to be flushed from high latitudes, towards the mid latitudes. NAO now negative........more favorable for penetrating of cold into the Midwest/Northeast. PNA is slightly positive and increasing which also assists with those indices in increasing some chilly risks in mid April and beyond.
Wednesday: AO goes negative much sooner and in week 1, then drifts to less negative at the end of 2 weeks. NAO spikes to negative then recovers to less negative at the end of week 2. PNA slightly positive. Turning cooler next week.
The link below, now has the PNA index added at the bottom:
National Weather Service 6-10 day, 8-14 day outlooks.
Cooler changes already late in week 1. Will it turn drier in the north?
Temperature Probability | |
Precipitation Probability | |
| the 8-14 day outlooks ArchivesAnalogsLines-Only FormatGIS Data | |
Temperature Probability | |
 | |
Spring outlook from the NWS.
This is a HUGE deal to the grains, especially corn because planting, ideally can get going by the end of April and needs to be done in May.
Many traders/forecasters are drawing similarities to 1993 and the historic flooding of that year because that was the last time conditions were like this.
Each year is different. One thing is certain. The market will NOT be concerned about drought during planting and the early parts of the growing season. Surface and subsoil moisture is completely recharged almost everywhere.

Previous comments/discussion:
By WxFollower - April 2, 2019, 1:07 p.m.
Charlotte apparently received 0.1" of snow/sleet this morning. Assuming that's official, that is the first April measurable snow or sleet there since the 0.1" of 1982 and only the 2nd measured there in April during the last 100 years!
++++++++++++++++++++++++++++++++++++++++++
By metmike - April 2, 2019, 1:09 p.m.
Thanks Larry!
++++++++++++++++++++++++++++++++++++
By metmike - April 2, 2019, 1:12 p.m.
The 12z operational GFS continues to be very wet. Total 2 week precip is below and slightly wetter than the previous run for the Midwest below that:
NOTE: model at the bottom is updated by around 6am CDT every morning and the one above it is updated around Noon........so the comments above refer to older runs of the model.
Forecast Hour: 384
Image URL: http://mag.ncep.noaa.gov/data/gfs/12/namer/precip_ptot/gfs_namer_384_precip_ptot.gif
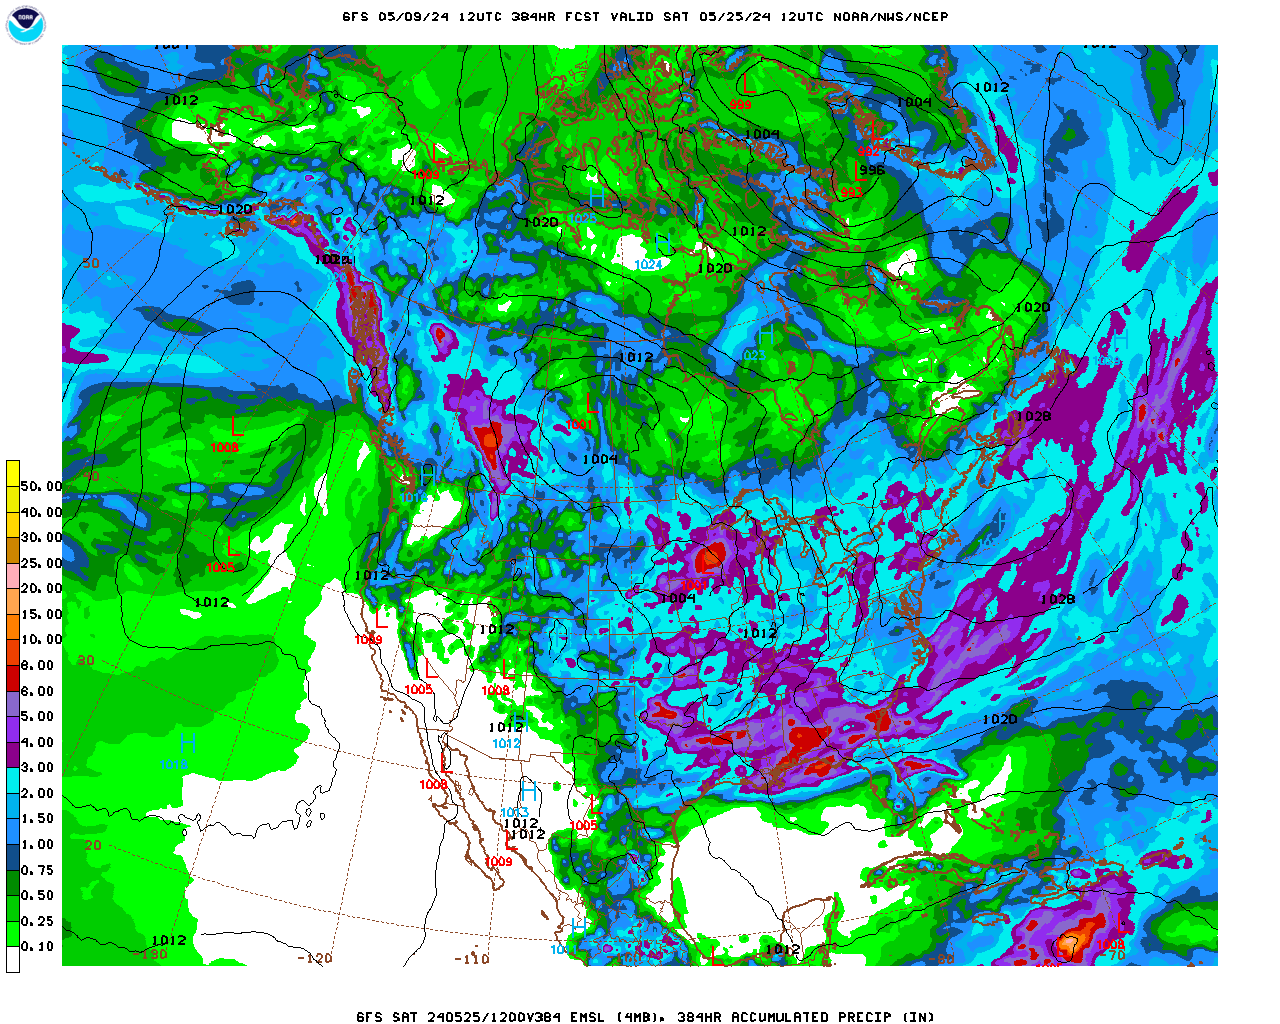
Forecast Hour: 384
Image URL: http://mag.ncep.noaa.gov/data/gfs/06/namer/precip_ptot/gfs_namer_384_precip_ptot.gif
