
It's a holiday weekend May 26th!!! Do something to make somebody feel loved today! Then, after observing the positive results, make a good habit out of it!
Scroll down and enjoy the latest comprehensive weather to the max...... occurring because of the natural physical laws in our atmosphere.
Heat ridge in the Southeast(near 100 degree heat far Southeast this week) The core of the heat ridge is tenacious but the light is at the end of the forecasting tunnel......not as hot late this week but still pretty hot.
Stormy and wet weather the next few days. Heaviest rains will be shifting and around the periphery of the heat ridge but there are LESS week 1 rains today again.
Big pattern change in week 2 as long lived Heat ridge in the Southeast goes bye bye!!!! This should also decrease excessive rains! Will the new pattern just be a progressive, west to east but active flow?
Here are the latest hazards across the country.
Purple/Pink/blue on land is cold/Winter weather. Brown is wind, Green is flooding. Gray is fog. Reddish is a red flag advisory.
Go to the link below, then hit the location/county on the map for details.
https://www.spc.noaa.gov/ Go to "hazards"


Wind map Press down on this on the left with your cursor!


Current Jet Stream

| Low Temperatures Tomorrow Morning |

High heat in the South/Southeast, some of it surging north! Cool in the N.Plains to west.
Temperature colors on the maps below still need to be adjusted down to cooler shades.


Highs for days 3-7:
Major heat wave in the Southeast fading. Hot but not AS hot by late week.
Pattern change later this week. A more zonal, west to east flow with less temperature disparities. Still very warm to hot in the South. Pleasant in the north.


Red very warm anomalies southeast to East(RED HOT temps far Southeast), Chilly blue anomalies N.Plains to Southwest.
Pattern change late THIS week! The magnitude of temperature anomalies will shrink.
https://www.wpc.ncep.noaa.gov/medr/medr_mean.shtml
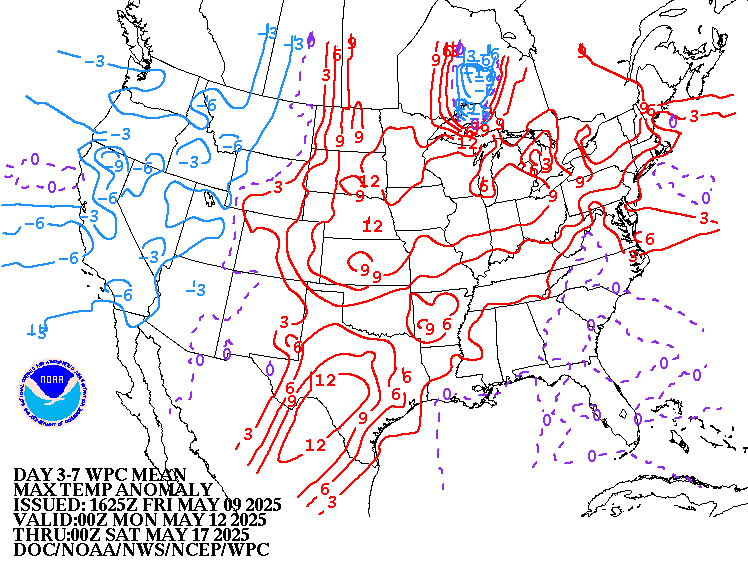
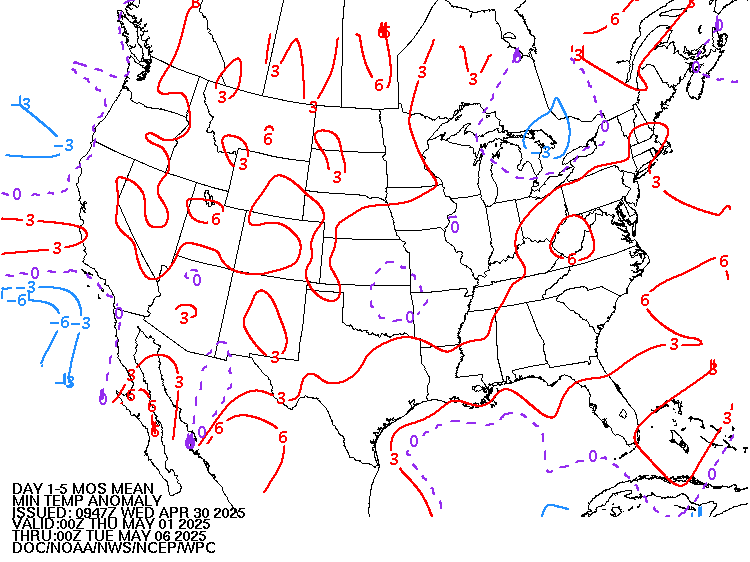
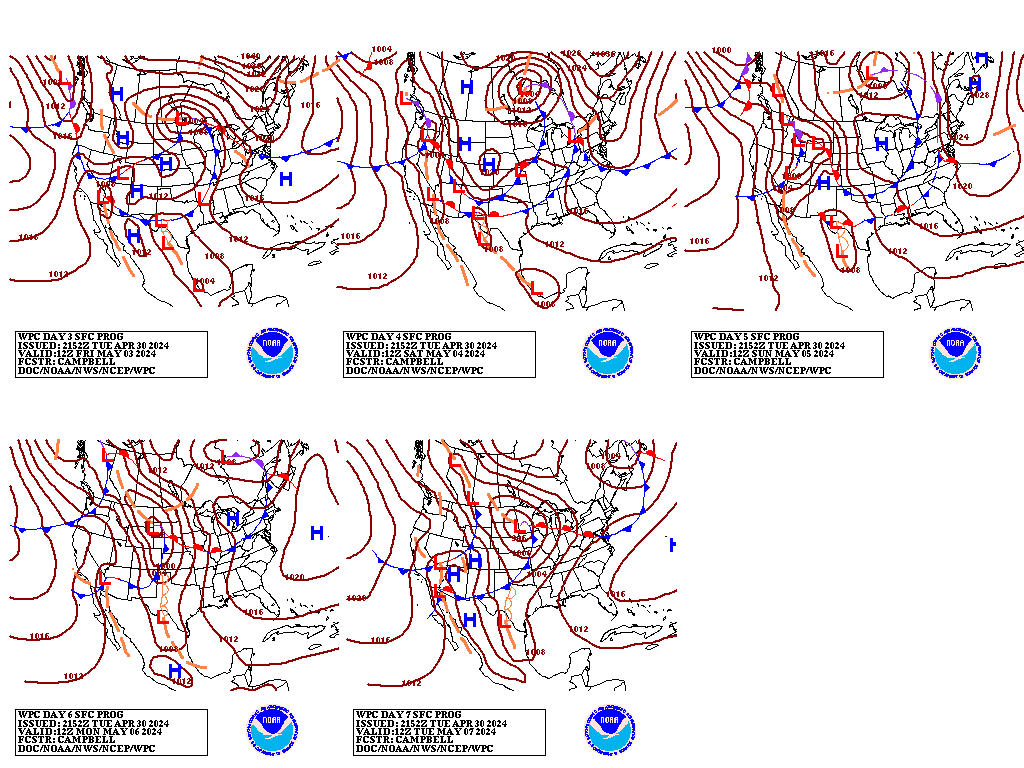
Weather maps for days 3-7 below
Thermal boundary/front acting as a focus for waves of heavy thunderstorms.............around the periphery of the intense heat ridge........will finally get moving. Blistering heat in the Southeast.....will not be quite as intense.
Huge pattern change! Strong, progressive, cold front sweeps southeast in the Midwest, starting midweek............and eventually getting into the Southeast and modifying the intense heat. Reinforcing progressive cold fronts to follow.
Last 24 hour precip top map
Last 7 day precip below that
https://www.wunderground.com/maps/precipitation/daily


Liquid equivalent precip forecasts for the next 7 days are below.
Heaviest rains are behind us!! Still some heavy amounts but not like before and the area of rains will be moving around.
Also, much more progressive pattern, starting in the middle of this week as the blocking heat ridge in the Southeast breaks down.
Day 1 below:
http://www.wpc.ncep.noaa.gov/qpf/fill_94qwbg.gif?1526306199054

Day 2 below:
http://www.wpc.ncep.noaa.gov/qpf/fill_98qwbg.gif?1528293750112

Day 3 below
http://www.wpc.ncep.noaa.gov/qpf/fill_99qwbg.gif?1528293842764

Days 4-5 below:
http://www.wpc.ncep.noaa.gov/qpf/95ep48iwbg_fill.gif?1526306162

Days 6-7 below:
http://www.wpc.ncep.noaa.gov/qpf/97ep48iwbg_fill.gif?1526306162

7 Day Total precipitation below:
http://www.wpc.ncep.noaa.govcdx /qpf/p168i.gif?1530796126

Excessive Rainfall Forecasts-with us into the middle of this week but not as high as recent days. Then the pattern change.
Mesoscale Precipitation Discussions
Current Day 1 Forecast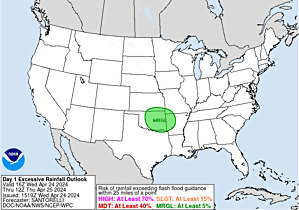 Valid 12Z 04/22/19 - 12Z 04/23/19 |
Day 1 Threat Area in Text Format
| Day 2 and Day 3 Forecasts |
Current Day 2 Forecast Valid 12Z 04/23/19 - 12Z 04/24/19 |
Day 2 Threat Area in Text Format
Current Day 3 Forecast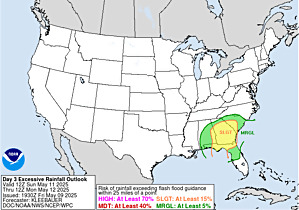 |
Severe Storm risk- with us into the middle of the week!!
Current Dew Points
Decent (but not extremely high) Moisture to north of the Ohio River!

Latest radar loop
http://www.nws.noaa.gov/radar_tab.php


| (3400x1700 pixels - 2.2mb) Go to: Most Recent Image |

Go to: Most Recent Image
You can go to this link to see precipitation totals from recent time periods:
https://water.weather.gov/precip/
Go to precipitation, then scroll down to pick a time frame. Hit states to get the borders to see locations better. Under products, you can hit "observed" or "Percent of normal"
+++++++++++++++++++++++++++++++++++++++++++++++
Precipitation compared to average for the last 7, 14, 30 and 60 days.
The Cornbelt has had way too much rain. We will be drying out(but not completely dry) for the next several days in some places adding in some heat.
Usually not updated for previous day until late the next day.
https://www.atmos.illinois.edu/~snodgrss/Ag_Wx.html


Soilmoisture anomaly:
These maps sometimes take a day to catch up to incorporate the latest data(the bottom map is only updated once a week).
Some places have dried out enough to plant but its still too wet in other places. Heat in the forecast, especially Eastern Cornbelt will help drying but more rains are on the way. Pattern change later this week to progressive flow.
https://www.cpc.ncep.noaa.gov/products/Soilmst_Monitoring/US/Soilmst/Soilmst.shtml#


Surprise, surprise, surprise!! Currently, there is 0% of the Cornbelt/Midwest with drought. There is no place even slightly dry there. It has been dry(and very warm/hot) in the Southeast though which has some drought. The Southeast drought will continue to expand/get worse during the next week.
The map below is updated on Thursdays.
The market will be keying on precip forecasts for planting concerns for the next month.
https://droughtmonitor.unl.edu/

The top map is the Canadian ensemble average, the maps below are the individual members that make up the average at the end of week 2.
+++++++++++++++++++++++++++++++++++++++++
Each member is like the parent, Canadian model operational model.......with a slight tweek/variation in parameters. Since we know the equations to represent the physics of the atmosphere in the models are not perfect, its useful to vary some of the equations that are uncertain(can make a difference) to see if it effects the outcome and how.
The average of all these variations(ensembles) often yields a better tool for forecasting. It's always more consistent. The individual operational model, like each individual ensemble member can vary greatly from run to run.........and represent an extreme end of the spectrum at times. The ensemble average of all the members, because it averages the extremes.............from opposite ends of the spectrum.........changes much less from run to run.
End of week 2....................0z ensembles:
Analysis starting from a week ago, ending with today:
Last week+ of analysis, starting with the day farthest in the past. This is an end of week 2 forecast!
Last Wednesday: Vast majority have the heat ridge in the Southeast, with hot/and dry over the Southern 1/3 of the country. Deep trough or upper level low along the West Coast and strong jet stream aimed towards the middle of the country, over the top of the ridge acting to trigger active weather.
Thursday: Around half of the members keep the huge heat ridge going in the Southeast. Half break it down. They will be one of the keys to determine where the strong Pacific jet stream coming in will travel. Potential for a lot of rain when it encounters warm humid air being pumped in by the heat ridge.
Friday: Majority keep the heat ridge going in the Southeast. Very strong jet stream coming from the Pacific.
Saturday: Canadian ensembles shift the Southeast heat ridge farther to the west. Still a strong jet stream across the country, with possibly more zonal, progressive (but active) flow if the blocking heat ridge is displaced from its long lived home in the Southeast.
Sunday: Some solutions keep the long lasting heat ridge in the Southeast alive...........others, obliterate it.
Monday: Watching to see what happens to the heat ridge in the Southeast. ......and location of the powerful jet stream coming out of the Pacific which will be modulated by the upper level trough along the West Coast and downstream upper level ridge.
Tuesday: Same as Monday. In fact, hard to tell any difference in the ensemble average.
Wednesday: Southeast ridge continues to go away/shift west and be replaced by weak troughing in the new pattern. Much, much cooler in the Southeast. Midsection may still be active with a decent jet stream and numerous systems. .
Thursday: Good agreement on a deep upper level low/trough along or just off the West but wide spread downstream on the upper level ridge and path of the strong jet stream in between them.
Friday: Another day with good/strong agreement on the trough around the West Coast. Strong stream from the Pacific will be coming in under this. Where it's aimed downstream will depend on any upper level ridging or no ridging. The long lived Southeast heat ridge still looks to die in week 2(possibly shifting westward to the W.Gulf to N.Mex/S.TX).
Saturday: Still a trough along the West Coast. Strong flow from the Pacific dipping into the trough and being aimed across the US. Will it be a strong, active jet stream coming going west to east in zonal fashion? Or will the flow pattern buckle at some point and become amplified and extreme beyond 2 weeks?
Sunday: Good agreement on very deep trough/low along to just off the West Coast. What will happen downstream? Strong, active zonal flow or amplification of high pressure and heat?
360h GZ 500 forecast valid on Jun 10, 2019 00 UTC
0Z GFS Ensembles at 2 weeks:
Analysis, starting with the oldest, ending with the most recent:
Last Thursday: Heat ridge in the Southeast still pretty impressive with active weather around its perimeter. Will it erode from the north?
Friday: How strong and how long for the tenacious heat ridge in the Southeast?
Saturday: Will the heat ridge move? Will the jet stream migrate north? Is a pattern change coming up? This is possible.
Sunday: Demise of the long lived Southeast heat ridge on the vast majority late week 2.
Monday: Potential shift in upper level ridge position.........MUCH farther north. This may divert the strong Pacific Jet into Canada and help lessen excessive rain potential.
Tuesday: This model also looks like yesterday............and a pattern change coming in week 2.
Wednesday: The heat ridge in the Southeast is completely dead and replaced by troughing and MUCH cooler temperatures. This will lessen the amount of Gulf moisture for active weather systems. Will we have active northwest flow across the belt as an upper level ridge builds in the Plains?
Thursday: Much different than the Canadian model above and tremendous differences/spread for individual members, so great uncertainty. Best agreement is for the upper level ridge in the Southeast to be replaced by weak troughing.
Friday: Pattern change from what we have now with heat ridge in the Southeast broken down but too much spread on how what it will be to take a serious gander.........other than to think that it will be more progressive than the recent pattern.
Saturday: Several members want to greatly deepen an upper level low in SW Canada and possibly buckle the jet stream with an upper level ridge pumped up downstream, which could be any where from the Midwest to points east and south. Just as many have something different.
Sunday: Uncertainty but the recent pattern of a heat ridge in the Southeast and excessive rains around the periphery is not one of the solutions.

GFS Ensemble mean(average of all the individual solutions above). The first map is a mid/upper level map. The 2nd one is a temperatures map at around 1 mile above the surface. These are anomalies(difference compared to average). The daily analysis starts with the oldest and ends with the latest.
Last Saturday: Modest position anomaly shifts west of Southeast, still decent negative anomaly in the West, a bit farther north now and potentially leading to the jet stream shifting north.
Sunday: Positive anomaly shifting to the Plains out of the Southeast. Still the negative anomaly along the West Coast that will be associated with Pacific jet stream energy.
Monday: Growing positive anomaly from Southeast Canada back to the Great Lakes replacing the long lived heat ridge in the Southeast which is shifting on this model. Negative anomaly on the West Coast is getting washed out. Jet stream shifts/weakens.
Tuesday: A weak NEGATIVE anomaly in the far Southeast,tells us the long lived heat ridge will be going bye bye!!!! Now, we have an extensive positive anomaly along the Canadian border in the new pattern...........which will be drier with the heat ridge not steering Gulf air north and blocking progression. Don't see the negative anomaly along the West Coast here but its there on the Canadian model.
Wednesday: Weak NEGATIVE anomaly in the East is even more confirmation that the long lived heat ridge will be dead. Very cool in the East. Positive anomaly in the Plains to West. This is a major pattern change.
Thursday: Very weak negative anomaly very far Southeast/Florida. Positive anomaly Northeast Canada.
Friday: Exactly like Thursday but much uncertainty though it looks progressive.
Saturday: The greatest positive anomalies are at the higher latitudes but most of the US looks to have slightly above 500 mb height anomalies, which means warm temperatures.
Sunday: Same as Saturday
National Weather Service 6-10 day, 8-14 day outlooks.
Temperature Probability | |
Precipitation Probability | |
| the 8-14 day outlooks ArchivesAnalogsLines-Only FormatGIS Data | |
Temperature Probability | |
 | |
Previous discussions:
By WxFollower - May 17, 2019, 3:41 p.m.
The GFS and Euro suites have been consistent on predicting near all-time record May hottest for much of the SE US on several days late next week into early the following week of upper 90s to low 100s! Drought areas there will likely expand and get more intense.
++++++++++++++++++++++++++++++++++++++++++++++++++++++++++++
By metmike - May 17, 2019, 4:40 p.m.
Thanks Larry!
Intense heat and the currently dry soils will help the air to heat up even more, targeting 100 degrees in the hot spots later next week.
+++++++++++++++++++++++++++++++++++++++++++++++++++++++
By mcfarm - May 19, 2019, 1:52 p.m.
monsoon type rains here again today
https://radar.weather.gov/radar_lite.php?product=NCR&rid=IND&loop=yes round 2 is at my door step for today....severe warnings now out
+++++++++++++++++++++++++++++++++++
By metmike - May 19, 2019, 6:24 p.m.
mcfarm,
These storms are moving fast and will be thru in a flash.
How much rain did you get earlier. Your NWS reported .19.
I got .61.
We've really dried out down here. I haven't been around to check but am sure there's a lot of planting done on high ground and probably elsewhere.
+++++++++++++++++++++++++++++++
By mcfarm - May 19, 2019, 7:22 p.m.
it is raining now....again. multiple warnings is what they say...up to 1.5 inches this afternnonn
+++++++++++++++++++++++++++++++++++
Re: Re: Re: Re: Weather Sunday
By pll - May 19, 2019, 7:42 p.m.
We only got .2 today but we have only had 2 days planting and none fit like you would like it really id say 20% done here ECILL
++++++++++++++++++++++++++++++++++++++++++++++++++++++++
Re: Re: Re: Re: Re: Weather Sunday
By metmike - May 19, 2019, 7:47 p.m.
Thanks pll and mcfarm!
+++++++++++++++++++++++++++++++++++
Re: Re: Re: Re: Re: Weather Sunday
By mcfarm - May 19, 2019, 7:48 p.m.
https://radar.weather.gov/radar.php?rid=IND&product=NCR&overlay=11101111&loop=yes
our latest spring shower
+++++++++++++++++++++++++++++++++++++
Re: Re: Re: Re: Re: Re: Weather Sunday
By metmike - May 19, 2019, 9:31 p.m.
The NWS service in Indy reported .22 with that one along with the .19 earlier in the day.
Hopefully that will be it for a couple of days.
When this front comes back as a warm front, most of the rains will be to the west but its possible they could be in Indiana.........just impossible to know.
If we can get that warm front shoved to the Michigan border, you would be in some heat and dry weather later this week. This heat ridge is definitively going to expand north later this week though into the ECB, high confidence. Thursday and Friday, I wouldn't be surprised to see 90 for you mcfarm, along with a pretty decent sw wind, especially Friday.
+++++++++++++++++++++++++++++
By metmike - May 20, 2019, 1:47 p.m.
Heat ridge will be shifting out of the Southeast in week 2, probably.
Looks likely that it will be shifting west and maybe building up thru the Plains...............but maybe not dry.
The jet stream track around the ridge may cause a "ring of fire" pattern that features clusters of storms that MOVE(not a blocking pattern, from the Plains into the Midwest with much more heat, farther north and west.
This won't show up yet on the NWS guidance today.......maybe the 8-14 it will.
The Southeast WILL be cooling off noticeably in the 8-14. starting soon.
Still a ton of rain before the new pattern shapes up and the new pattern is not necessarily a dry one, especially with these wet soils in early June. The high angled sun will evaporate alot of moisture from the surface to boost rainfall amounts.
However, since this new pattern will feature much LESS rain, if planting progress is better than expected and it continues to look drier, last nights gap higher in corn could be an exhaustion gap. Not my prediction with so much rain on the way but the heavy rains are stale news and we are almost 50c higher.
++++++++++++++++++++++++++++++++++++++++++++++++++++++++++++++++++++
By metmike - May 20, 2019, 4:44 p.m.
Thanks mcfarm,
Sorry you're having a rough time of it. I'll have all the stats in a short while. This(less planted c/s) will cause us to have a higher open tonight.
For the crop condition report/planting progress, go here:
https://www.marketforum.com/forum/topic/30630/
Less planted than expected, so a higher open tonight.
++++++++++++++++++++++++++++++++++++++++++
By metmike - May 21, 2019, 1:04 p.m.
12z GFS was WETTER!
For the 3rd run in a row, it brings an almost unprecedented, for the end of May polar vortex low down to just north or the Great Lakes early in week 2. For now, its at such an extreme that makes one skeptical.
For the last 3 runs, the GFS has been forecasting an unprecedented deep polar vortex low dropping south to just north of the US border early in week 2.
This is the now updated 12z GFS run for May 30.
This is an outlier and such an extreme that means it can't be believed. There would be alot of clouds with it that might keep night temps above freezing. Also, nights are very short, so less cooling time and surface temperatures even at the highest latitudes have warmed enough so its almost impossible to bring enough cold air, moderating on the way down, deeply into the US to cause a widespread freeze in the Cornbelt.
But if it can happen, the pattern below would be favorable.
++++++++++++++++++++++++++++++++++++++++++++++++++++++++++++++
Re: Re: Re: Re: Weather Tuesday
By mcfarm - May 21, 2019, 4:11 p.m.
sunny and mild they said...best day of the week they said....how about pouring rain and 51 degrees for the factual part
+++++++++++++++++++++++++++++++++++++++++++++++++++++++++++
Re: Re: Re: Re: Weather Tuesday
By metmike - May 21, 2019, 7:43 p.m.
+++++++++++++++++++++++++++++++++++++++++++++
By metmike - May 23, 2019, 3:20 p.m.
The last 12z GFS had a pretty impressive heat ridge going on in the Midwest to points east.
Gave the NG a pop higher and put pressure on the corn(improved planting weather)
++++++++++++++++++++++++++++++++++++++++++++++++++++++++++++++++++++++++++++++++++
Re: Re: Re: Re: Re: Weather Friday
By mcfarm - May 24, 2019, 5:09 p.m.
what is going on? we have not had our 2nd rain event of the day yet and its 4pm...had 2 events/day for days
+++++++++++++++++++++++
Re: Re: Re: Re: Re: Re: Weather Friday
By metmike - May 24, 2019, 5:31 p.m.
Sorry to hear your having such bad luck mcfarm,
We've really dried out everywhere here in S.Indiana, I hope we can send some of it your way along with some heat and wind the next couple of days.
Unfortunately, the front between the hot air down here and cooler air farther to the north and some jet stream energy is going to be close enough to you so that more shwrs could happen at any time. Hopefully the heat ridge ends up stronger and shoves it farther north.
I know it sounds crazy but your NWS actually is a tad below average for May rainfall on their climate report
https://w2.weather.gov/climate/index.php?wfo=ind
.THE INDIANAPOLIS IN CLIMATE SUMMARY FOR MAY 24 2019... VALID TODAY AS OF 0400 PM LOCAL TIME. CLIMATE NORMAL PERIOD 1981 TO 2010 CLIMATE RECORD PERIOD 1871 TO 2019 WEATHER ITEM OBSERVED TIME RECORD YEAR NORMAL DEPARTURE LAST VALUE (LST) VALUE VALUE FROM YEAR NORMAL .................................................................. TEMPERATURE (F) TODAY MAXIMUM 86 239 PM 90 1965 75 11 83 1921 MINIMUM 64 513 AM 37 1925 55 9 61 AVERAGE 75 65 10 72 PRECIPITATION (IN) TODAY 0.28 1.55 1981 0.17 0.11 0.00 MONTH TO DATE 3.81 3.95 -0.14 1.03 SINCE MAR 1 13.79 11.32 2.47 10.51 SINCE JAN 1 21.29 16.30 4.99 17.16

++++++++++++++++++++++++++++
Re: Re: Re: Re: Re: Re: Re: Weather Friday
By mcfarm - May 24, 2019, 8:08 p.m.
not crazy MM...our official gathering station is miles away on Indpls SW corner....totally different scenerios many years
++++++++++++++++++++++++
Re: Re: Re: Re: Re: Re: Re: Weather Friday
By becker - May 24, 2019, 9:24 p.m.
Mike,
Whats your guesstimate for number or % of corn acres pp or drowned to date? Are we now presumed to be below trendline yields?
++++++++++++++++++++++++++++++++++++++
Re: Re: Re: Re: Re: Re: Re: Re: Weather Friday
By metmike - May 25, 2019, 1:43 a.m.
Wonderful question becker!
I'll try to answer that in more detail and would appreciate others thoughts on that too tomorrow.
I know that some are insisting trendline yields are impossible now and I would agree that they are unlikely but they ARE possible. The increase in CO2 has been boosting yields tremendously and we have added a tad more beneficial CO2 since last year. No matter how bad everything else is and gets, that is still going to be a huge plus that's been adding something like 15% to corn yields and 25% to bean yields vs what they would be if CO2 had not gone up.
If we dried out the next 2 weeks, then had perfect weather the rest of the growing season, we can certainly have trendline yields. It will be on reduced acres of course, so that is going to cause lower production.
More later.
What are your thoughts?
+++++++++++++++++++++
Re: Re: Re: Re: Re: Re: Re: Re: Re: Weather Friday
By mcfarm - May 25, 2019, 7:04 a.m.
sure good yields are possible. In 1981 we did not plant a seed until June 1st and the summer proceeded to be warm and wet. Stuff grew a foot a wee it seemed. Very unusual.
+++++++++++++++++++++++++++++++
By cliff-e - May 25, 2019, 12:20 p.m.
I talked with a farmer last night who planted/mudded in corn 2 weeks ago...it has a sprout but due severely compacted soil and our cold overnight temps. the corn sprout has made a 90 degree turn and is trying to leaf out under the ground. We have rain forecast again for Sunday night into Monday...maybe an 1" but when we have water running out of hillsides due to our already high water table even .2" makes it look like we had 2".
++++++++++++
Re: Re: Re: Re: Re: Weather Saturday
By mcfarm - May 25, 2019, 2:33 p.m.
here comes big rain event number 1 of the day from the SW like a freight train
++++++++++++++++++++++++++
Re: Re: Re: Re: Re: Re: Weather Saturday
By metmike - May 25, 2019, 3:24 p.m.
Here's hoping that you are in between the scattered heavy cells.
++++++++++++++++++++++++++++
By metmike - May 25, 2019, 3:51 p.m.
Continuing on the yield discussion. The graphs below tell us that this is THE latest planted year and how crops did in previously late planted years.
The bottom line is that the weather still will be the main player and is completely unknown.
However, we can say with high confidence that a record, well above trend yield is almost impossible but who doesn't know that.
2009 was a late planted year(mainly IL) but featured a cool, wettish Summer and the corn crop actually was close to record yields. Beans were around average. Producers remember 2009. The cool Summer featured very low heat units and the crop in late August, we more like early August maturity.........it would have been hurt bad by an early freeze.
Luckily, September was warmer than normal and the first freeze was late everywhere, allowing the crop to mature. Heat units accumulate slowly at that time of year but we got enough of them. However, after the crop matured a few weeks late, it was time for it to dry down in the field and we just ran out of time on the calendar to do this. It was also pretty wet in October so there wasn't much drying going on. Moisture levels were already unusually high and that crop was harvested the wettest and maybe the latest ever. The IA corn was coming out of the field at moisture levels of 22%+, 14% is pretty good. . The ND crop was only 8% harvested in mid November! LP gas/ng demand/use to dry the crop down was a record for a couple of months after that.
http://bpnews.com/archives/2009-12/Harvest-Web.pdf
What is striking to me, is the strong correlation to beans with planting date. Outside of the 1 drought year of the last 30 years, 2012) almost all the low bean yields were in late planted years. Why might this be?
Corn develops/matures based on heat units and in late planted years, we assume it was too wet and the soil profile was saturated. Corn can establish deep roots to tap deep moisture. Beans can't do this and beans have their key developmental period later in Summer.
So if it turns hot and dry, it can hurt beans more than corn. Also beans develop based on daylight hours. If you plant them late, they can't catch up with heat because the length of day never changes, its based on the calendar. A late start, means beans can't cash in on some of the longer days in May/early June ahead of the Summer Solstice and are still hanging around, not mature yet, in September, over 2 months after the sun strength has peaked and they are catching, lower angled weaker sunshine that also contributes less energy to photosynthesis(which can be said to about corn but to a much lesser degree-May sunshine is stronger-has more energy, because of the higher angle- than August sunshine for instance-regardless of temperature)


+++++++++++++++++++++++++++++++++++++++++++++++++
By wglassfo - May 25, 2019, 10:33 p.m.
We had some rain over nite but dried up enouh to plant by noon in wet soil
Heat and wind acrually had dust on the lighter soils by 3 P:M
By 5 P;M we had a gully washer
I don't even want to look at the rain gauge
+++++++++++++++++++++++++++++++++++
By metmike - May 26, 2019, 12:12 a.m.
Thanks for the report Wayne