
I'm thinking that we could rapidly shift to a La Nina or near La Nina this Summer! This contrasts with the models and NOAA forecast below.
La Nina Summers have a strong tendency to be hotter and drier than average. More on that below.
From NOAA: "Summary *Equatorial sea surface temperatures (SSTs) are near average across most of the Pacific Ocean.The tropical atmospheric circulation is consistent with ENSO-neutral.There is a ~65% chance of ENSO-neutral during Northern Hemisphere summer 2020, with chances decreasing through the autumn (to 45-50%)"
metmike: The models keep the odds highest of neutral until late this year, when La Nina odds are slightly higher. Odds of an El Nino are very low from the models and looking at ocean temperatures right now, it would be almost impossible to have an El Nino this Summer.
Here is a summary of the model output and forecast:
.png)
Here are the individual models:
.png)
Why I disagree with that.
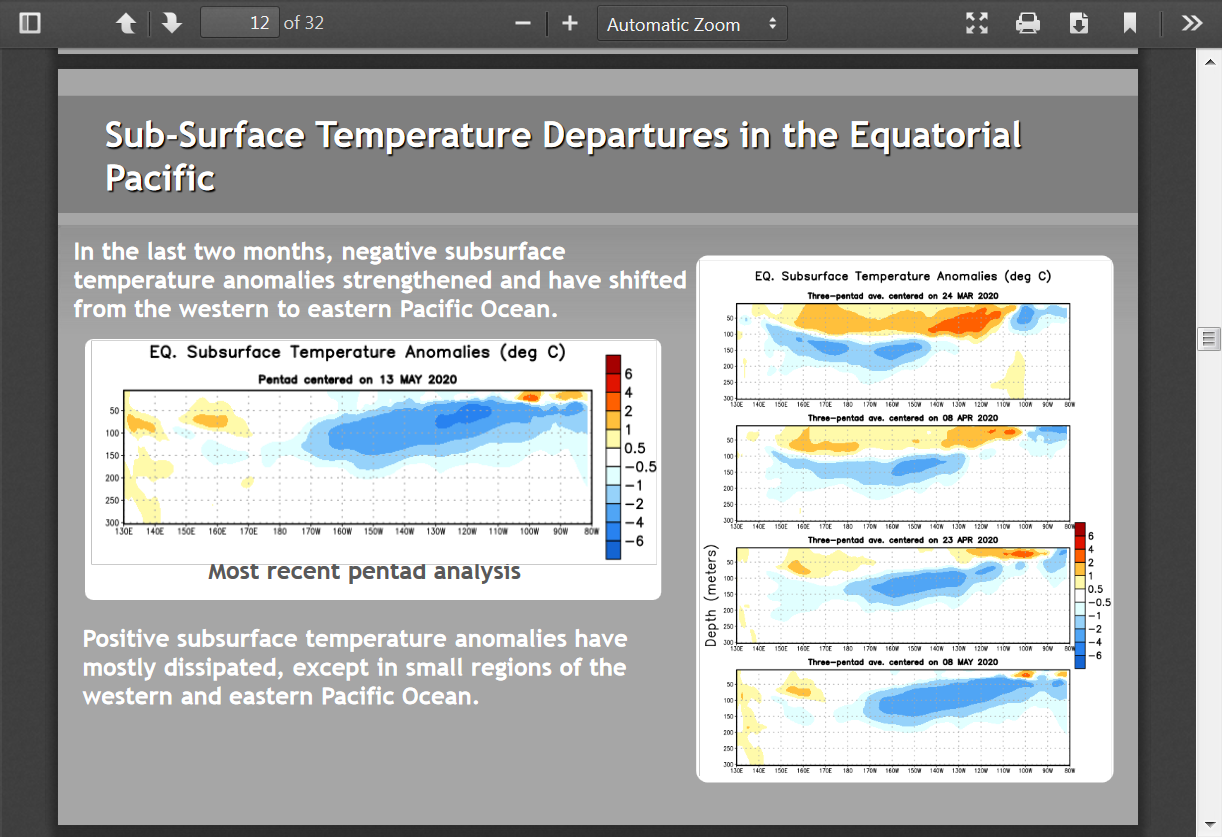
Look at the changes in the upper ocean heat content right now in the Central and Eastern Pacific. WOW! Subsurface temperatures have fallen off a cliff. Much of this colder water is just below the surface but is likely to make it to the surface this Summer.
The 2nd set of graphs below, show the colder water heading towards the surface since March(maps on the right). Note that we have a pretty big -2.0 C contour just below the surface, expanding in size from 80W to 160W. This is the recipe for a La Nina which is defined by surface water temps of -.5 deg C or colder in this part of the Tropical Pacific.
.png)
Why is this potentially a big deal?
https://weatherworksinc.com/news/el-nino-la-nina-summer-2020
1. La Nina Summer's have very strong tendencies to be hot. El Nino Summers tend to be cool.
What Effect does an El Niño or La Niña have on Summer Weather?

Temperature departures during the summer in the last 10 El Niños, left, and La Niñas, right, courtesy of NOAA and ESRL
+++++++++++++++++++++++++++++++++++++++++++++++++++++++++++++++++++++++++++++++++++++++++++
2. During La Nina's the southern half of the country has a strong tendency to be dry to very dry.......into the S.Plains to KS/MO but also to the Mid Atlantic States. During El Nino's the regional patterns are not as clear but El Nino Summers are usually much wetter than La Nina Summers........with the Upper Midwest sometimes an exception.....but even there, the added heat evaporates much more moisture.

Here is the latest NWS outlook for this Summer. Clearly its based on Neutral ENSO conditions continuing and no La Nina. I suspect that La Nina conditions will be present much sooner than the models predict and the lag time for the atmosphere to respond is almost immediate(ocean temperatures affect the atmosphere above right away) vs NOAA waiting for several months of La Nina conditions to officially call it a La Nina.
So I would ADD much more heat to the center of the country and take out most of the above precip, especially in the South.
I never do long range forecasts but that huge blob of cold water coming to the surface in the Central/Eastern Tropical Pacific is very significant.
+++++++++++++++++++++++++++++++++++++++++++++++++++++++++++++++++
From NOAA: Summer outlook (J-J-A) updated May 21st:
Bearish grains(high odds for above rain Cornbelt-Average temps).
Potentially pretty bullish for Natural Gas. Elevated chance for heat in the West and as well as the East and also the deep south.
Take this with an even smaller grain of salt!


Let's look at some previous significant droughts/heat and we can see that they usually correlate with a La Nina. That doesn't mean every La Nina causes a drought and vice versa but the strong tendency is there.
++++++++++++++++++++++++++++++++
In 2010/11, a long lasting drought was present in the S.Plains, likely the result of a nearly 2 year long La Nina. Then, in early 2012, it expanded northeast into the Midwest. This was our last major Cornbelt drought.
The ONI index below is one measure that we use to determine an El Nino or La Nina. At +.5 Deg. C and above it's considered El Nino, -.5 Deg C and below are La Nina.
Zzz
https://origin.cpc.ncep.noaa.gov/products/analysis_monitoring/ensostuff/ONI_v5.php
Year | DJF | JFM | FMA | MAM | AMJ | MJJ | JJA | JAS | ASO | SON | OND | NDJ |
| 2010 | 1.5 | 1.3 | 0.9 | 0.4 | -0.1 | -0.6 | -1.0 | -1.4 | -1.6 | -1.7 | -1.7 | -1.6 |
| 2011 | -1.4 | -1.1 | -0.8 | -0.6 | -0.5 | -0.4 | -0.5 | -0.7 | -0.9 | -1.1 | -1.1 | -1.0 |
| 2012 | -0.8 | -0.6 | -0.5 | -0.4 | -0.2 | 0.1 | 0.3 | 0.3 | 0.3 | 0.2 | 0.0 | -0.2 |
| 2013 | -0.4 | -0.3 | -0.2 | -0.2 | -0.3 | -0.3 | -0.4 | -0.4 | -0.3 | -0.2 | -0.2 | -0.3 |
+++++++++++++++++++++++++++++++++++++++++++++++++++++++++++++++++++++++++++++++++++++
The previous period of a La Nina was 2007/8.
| 2007 | 0.7 | 0.3 | 0.0 | -0.2 | -0.3 | -0.4 | -0.5 | -0.8 | -1.1 | -1.4 | -1.5 | -1.6 |
| 2008 | -1.6 | -1.4 | -1.2 | -0.9 | -0.8 | -0.5 | -0.4 | -0.3 | -0.3 | -0.4 | -0.6 | -0.7 |
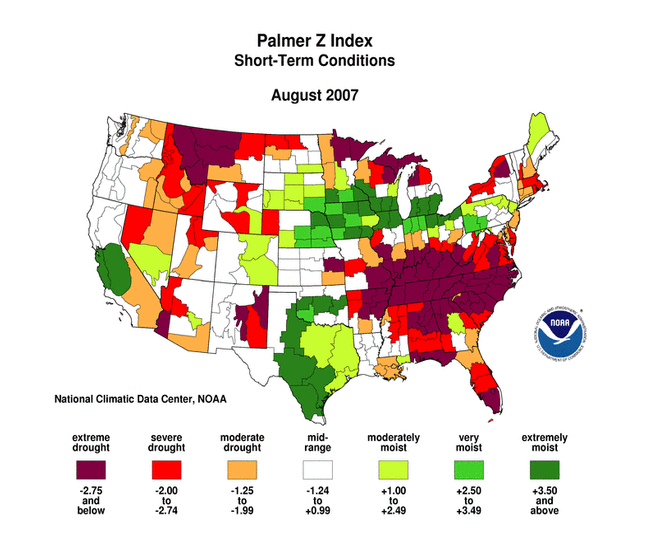
I was able to pull up a drought monitor map for August 2007. Extreme drought in dark red under a long lived, rain suppressing heat ridge. The heat ridge was farther north in 2008 but soybean yields were below trend in both years with that La Nina.
++++++++++++++++++++++++++++++++++++++++++++++++++++++++++++++++++++++++++++++++++++++++++++
Producers may remember the Summers with the previous long lived LaNina before that one. 2nd half of the Summers in 1998/99/2000 were especially hot and dry. Soybean yields were just below trendline in the later 2 years.
| 1997 | -0.5 | -0.4 | -0.1 | 0.3 | 0.8 | 1.2 | 1.6 | 1.9 | 2.1 | 2.3 | 2.4 | 2.4 |
| 1998 | 2.2 | 1.9 | 1.4 | 1.0 | 0.5 | -0.1 | -0.8 | -1.1 | -1.3 | -1.4 | -1.5 | -1.6 |
| 1999 | -1.5 | -1.3 | -1.1 | -1.0 | -1.0 | -1.0 | -1.1 | -1.1 | -1.2 | -1.3 | -1.5 | -1.7 |
Year | DJF | JFM | FMA | MAM | AMJ | MJJ | JJA | JAS | ASO | SON | OND | NDJ |
| 2000 | -1.7 | -1.4 | -1.1 | -0.8 | -0.7 | -0.6 | -0.6 | -0.5 | -0.5 | -0.6 | -0.7 | -0.7 |
| 2001 | -0.7 | -0.5 | -0.4 | -0.3 | -0.3 | -0.1 | -0.1 | -0.1 | -0.2 | -0.3 | -0.3 | -0.3 |
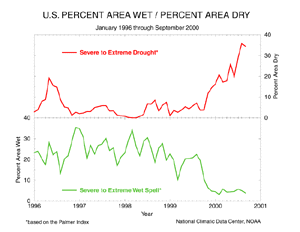
Note the huge drop in soil moisture as we went from the wetter SUPER El Nino in 97/98 to the La Nina in 99/00/01:
+++++++++++++++++++++++++++++++++++++++++++++++++++++++
I have to do this one from memory. 1995 was a wet Spring, then turned very hot/dry late June thru August, then we had the early freeze in September. Did morphing from the El Nino early in 1995 to the La Nina by August have an affect?
| 1995 | 1.0 | 0.7 | 0.5 | 0.3 | 0.1 | 0.0 | -0.2 | -0.5 | -0.8 | -1.0 | -1.0 | -1.0 |
| 1996 | -0.9 | -0.8 | -0.6 | -0.4 | -0.3 | -0.3 | -0.3 | -0.3 | -0.4 | -0.4 | -0.4 | -0.5 |
++++++++++++++++++++++++++++++++++++++++++++++++++++++++++++++++++++++++++++++++++++++++
The historic drought of 1988! That drought started very early in the year, before the "official" value dropped into La Nina zone in May. Sometimes, it appears that a rapidly falling number....towards a La Nina or rising fast towards an El Nino matters before the value gets into the "official" category.
| 1987 | 1.2 | 1.2 | 1.1 | 0.9 | 1.0 | 1.2 | 1.5 | 1.7 | 1.6 | 1.5 | 1.3 | 1.1 |
| 1988 | 0.8 | 0.5 | 0.1 | -0.3 | -0.9 | -1.3 | -1.3 | -1.1 | -1.2 | -1.5 | -1.8 | -1.8 |
| 1989 | -1.7 | -1.4 | -1.1 | -0.8 | -0.6 | -0.4 | -0.3 | -0.3 | -0.2 | -0.2 | -0.2 | -0.1 |
Year | DJF | JFM | FMA | MAM | AMJ | MJJ | JJA | JAS | ASO | SON | OND | NDJ |
++++++++++++++++++++++++++++++++++++
The previous major drought, 1983 was much different. We went from very wet conditions during the first half of the year, to ....as if, somebody flipped an atmospheric switch at the end of June. After that, almost no rain and 90+ every day for the rest of the Summer with many 100 degree temps. That was my first Summer on television forecasting weather for Cornbelt farmers. 7 days above 100 that Summer here in sw. Indiana. Though we didn't hit a La Nina until very late in the Summer, ONI numbers were PLUNGING lower from a SUPER El Nino.
| 1982 | 0.0 | 0.1 | 0.2 | 0.5 | 0.7 | 0.7 | 0.8 | 1.1 | 1.6 | 2.0 | 2.2 | 2.2 |
| 1983 | 2.2 | 1.9 | 1.5 | 1.3 | 1.1 | 0.7 | 0.3 | -0.1 | -0.5 | -0.8 | -1.0 | -0.9 |
| 1984 | -0.6 | -0.4 | -0.3 | -0.4 | -0.5 | -0.4 | -0.3 | -0.2 | -0.2 | -0.6 | -0.9 | -1.1 |
| 1985 | -1.0 | -0.8 | -0.8 | -0.8 | -0.8 | -0.6 | -0.5 | -0.5 | -0.4 | -0.3 | -0.3 | -0.4 |
+++++++++++++++++++++++++++++++++++++++++++++++++++++++++++++++++++++++++++
The Summer of 1980 brought an historic heat ridge to the S.Plains and drought to much of the country.....but with neutral conditions. La Nina's and a cooling Pacific don't always mean widespread heat ridges and widespread heat ridges can happen for reasons different than a La Nina.
Year | DJF | JFM | FMA | MAM | AMJ | MJJ | JJA | JAS | ASO | SON | OND | NDJ |
| 1980 | 0.6 | 0.5 | 0.3 | 0.4 | 0.5 | 0.5 | 0.3 | 0.0 | -0.1 | 0.0 | 0.1 | 0.0 |
 a
a
The early/mid 1970's were near the end of over 2 decades of modest global cooling and a period that strongly favored cooler Pacific Ocean temperatures and La Nina's as a result.
1974 was one of the worst years in history for growing crops in the US.
That was the year of the historic, widespread, crop killing Labor Day freezes. Though we had global cooling, there was record Summer heat and extreme dryness in the Summer of 1974.
https://journals.ametsoc.org/doi/pdf/10.1175/1520-0493%281974%29102%3C0736%3AWACOJ%3E2.0.CO%3B2
102%200736%20WACOJ%202%200%20CO%3B2_JJ3SEaX.png)
102%200736%20WACOJ%202%200%20CO%3B2(1).png)
Note the long lived La Nina and cooler tropical Pacific Ocean temperatures at the time:
https://origin.cpc.ncep.noaa.gov/products/analysis_monitoring/ensostuff/ONI_v5.php
| 1973 | 1.8 | 1.2 | 0.5 | -0.1 | -0.5 | -0.9 | -1.1 | -1.3 | -1.5 | -1.7 | -1.9 | -2.0 |
| 1974 | -1.8 | -1.6 | -1.2 | -1.0 | -0.9 | -0.8 | -0.5 | -0.4 | -0.4 | -0.6 | -0.8 | -0.6 |
| 1975 | -0.5 | -0.6 | -0.7 | -0.7 | -0.8 | -1.0 | -1.1 | -1.2 | -1.4 | -1.4 | -1.6 | -1.7 |
The time previous to that with a long lived La Nina was the mid 1950's. This also was in the middle of a decade of modest global cooling.
Again, you can find the La Nina data here:
https://origin.cpc.ncep.noaa.gov/products/analysis_monitoring/ensostuff/ONI_v5.php
| 1954 | 0.8 | 0.5 | 0.0 | -0.4 | -0.5 | -0.5 | -0.6 | -0.8 | -0.9 | -0.8 | -0.7 | -0.7 |
| 1955 | -0.7 | -0.6 | -0.7 | -0.8 | -0.8 | -0.7 | -0.7 | -0.7 | -1.1 | -1.4 | -1.7 | -1.5 |
| 1956 | -1.1 | -0.8 | -0.6 | -0.5 | -0.5 | -0.5 | -0.6 | -0.6 | -0.5 | -0.4 | -0.4 | -0.4 |
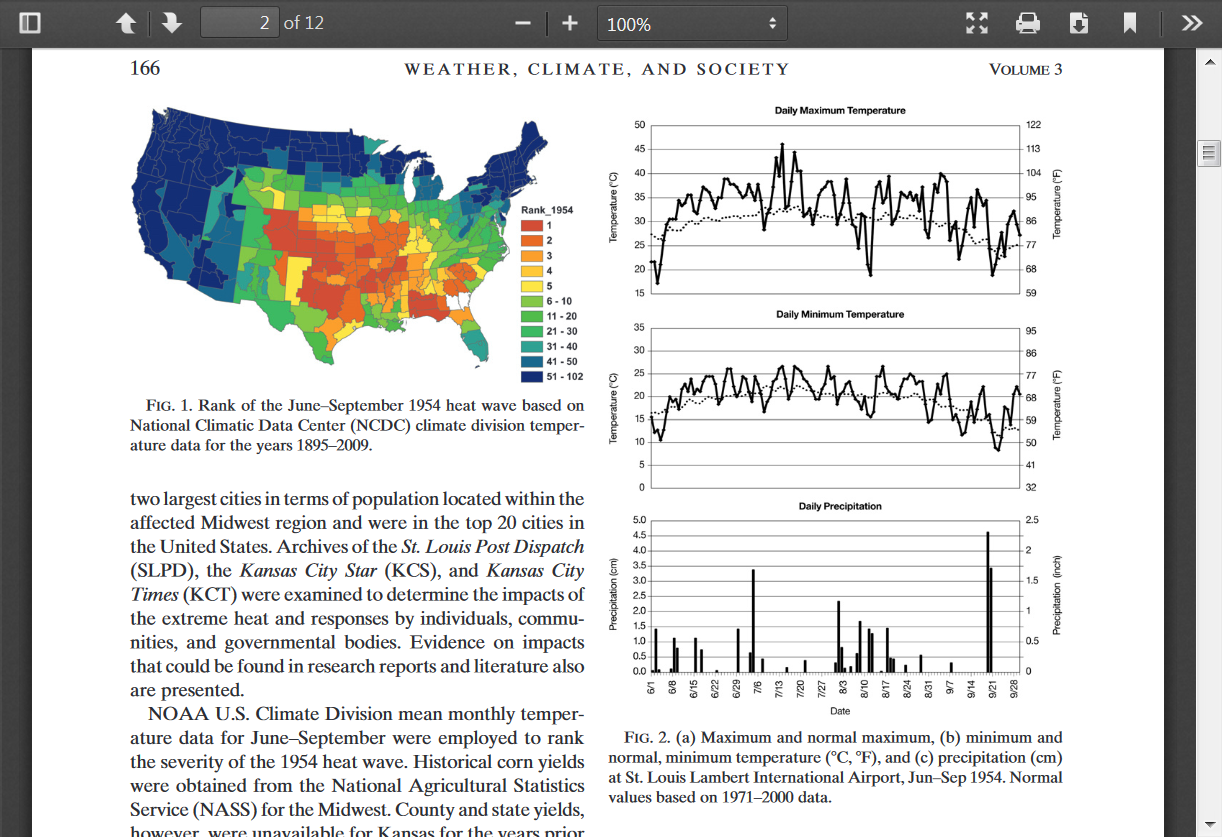
I remember from my weather history, that the Summer of 1954 featured the driest/hottest weather since the Dust Bowl, record hot/dry 1930's........in some places even hotter!
https://journals.ametsoc.org/doi/pdf/10.1175/WCAS-D-10-05002.1
The Prolonged 1954 Midwestern U.S. Heat Wave: Impacts and Responses NANCYE. WESTCOTT Midwestern Regional Climate Center, Illinois State Water Survey, Prairie Research Institute,University of Illinois at Urbana–Champaign, Urbana, Illinois(Manuscript received 29 September 2010, in final form 18 August 2011)ABSTRACTThe highest recorded temperature in Illinois, 117F (47.28C) occurred on 14 July 1954 in East St. Louis. This occurred in the midst of a widespread, long-lasting heat wave covering significant parts of 11 states: from eastern Colorado through Kansas, Oklahoma, part of Texas, Missouri, and Arkansas, southern Illinois, andextending to western Tennessee, Alabama, Georgia, and parts of the Carolinas. According to historical cli-mate data, this event ranked as one of the top five extended periods of heat in these states since 1895. No such prolonged heat wave has occurred in the Midwest since 1954. It stands to reason that since prolonged widespread heat waves have occurred in the last 100 years, there is a distinct possibility that they will occur again, and reviewing past impacts could help us plan for future events.
_h4OSHFE.png)
There are several things that we can learn by going back and looking at past weather/climate and La Nina's/El Nino's.
1. One of them is that La Nina's and cooler Pacific Ocean water temperatures increase the chances for extreme weather in the Midwest, especially widespread heat and dryness during the growing season. Major, long lived blocking heat ridges often set up during La Nina Summers. If the heat ridge in in the Southeast or South, we can see a ring of fire storm pattern around the periphery of the "dome" which results in heavy rains in those locations, just outside of the rain defeating, warm air aloft associated with the heat ridge.
2. El Nino's and warmer Tropical Pacific water temperatures increase the chances for favorable weather in the Cornbelt during the growing season........the opposite of a La Nina.
3. Global warming/climate change has correlated with increased tropical Pacific Ocean water temperatures, with the occurrence of El Nino's also going up the last few decades and it's one of the reasons that climate change has resulted in the best weather in recorded history for growing crops in the US Cornbelt. This includes just 1 widespread severe Midwest drought since 1988(that one in 2012), when historically, 4 widespread, severe droughts would have been expected during that period (with the old climate).
4. This does not take into account the law of photosynthesis which is also adding greatly to crop yields.
5. Additionally, we plant and grow crops like corn in tightly packed rows that are now twice as dense as they were 40 years ago. This has resulted in a micro climate in the Midwest, several weeks after the majority of the corn plants have emerged. The massive increase in evapotranspiration from these plants, has increased low level moisture, with dew points in some situations, more than 5 deg. higher over several states.
Here's more:
Corn and climate change
13 responses |
Started by metmike - Dec. 6, 2018, 10:43 a.m.
https://www.marketforum.com/forum/topic/18987/
6. There is much more to it than just the temperatures in the Pacific Ocean and the benefits of climate change(CO2). Any one Summer can feature influencing factors that are completely independent of these factors and weather that turns out to be the complete opposite of the historical tendency(1980). Related to this, the current forecast for the potential upcoming La Nina is also uncertain. There is a much lower skill for seasonal forecasts compared to forecasts on shorter time scales. Please call keep that in mind with this Summer forecast that calls for widespread above normal temperatures and at least some areas with increasing drought.
+++++++++++++++++++++++++++++++++++++++++++++++++++++++++++++++
Thanks to WxFollower, I'm adding these 2 key points that I forgot to mention.
7. There is a solid correlation/causation between hurricane frequency and ENSO. Unfortunately, La Nina hurricane seasons are usually more active. More on that later in this thread.
8. The oceans have 1,000 times more heat capacity than the atmosphere and the Pacific has something like 2/3rds of that. When this massive heat source(Pacific) warms up during an El Nino(in the tropical Pacific), it burps out massive amounts of heat into the atmosphere, which results in a spike in the atmospheric global temperature during that time frame. During a La Nina, the exact opposite happens............less heat is transferred from this massive heat source to the atmosphere. So if we do have a La Nina later this year, it could temporarily offset greenhouse gas warming with global temperatures cooling by a couple tenths of a degree from the La Nina. Biased skeptics will celebrate this as evidence of warming not being as bad as predicted without acknowledging the affect of the La Nina. One should note, however that during the global cooling of the 50's-70's, La Nina's dominated. Then, when warming kicked in, El Nino's dominated. This suggests the potential that the oceans may be more of a source of the cooling and heating vs being affected by it because, again they have 1,000 times more stored heat in them than the atmosphere. You might think of, the other way around being like the tail wagging the dog (-: With that being the case, there is a strong case to be made for these massive blobs of heat(and cooler temps) in the Pacific to be modulated by geological(geothermal) heat eminating from the active ocean floor. This could be responsible for a larger share of the global warming than recognized, especially in global climate models that give it no weighting.
Hi Mike
Something I noticed with your maps
If I read them correctly, we seem to always get some rain in the Great Lakes region, even if the mid west is burning up. not super high yields as we vary with rain amounts.
that is why we can grow crops with no crop insurance. Our average yield won't give us a ROI
The closest we came to disaster was 2012. We travelled to Ohio for a stock car race, Arriving early I had a chance to walk some fields near by. What I saw was terrible. I estimated we missed that drought by a mere 50 miles. We had an average crop that yr as we did miss some summer rains, but nothing that crop insurance would pay for. if we get rain during pollination that usually means plus or minus 20 bu/acre. We are usually good until pollination time, then rain either makes or breaks the crop. A 40 bu. swing in yield is huge for us.
Thankfully we don't burn up early in the season like the mid west can some yrs
So far this year, the weather story has been the insane heat in Russia.
I haven't heard any explanations, just a lot of "Wow! That's hot"
https://climatereanalyzer.org/wx/fcst/#gfs.arc-lea.t2
Wayne'
Very astute observation!
Wayne farms just northeast of Detroit in Ontario, Canada.
During La Niña Summers big heat ridges set up in different places from the Plains to Southeast to parts of the Midwest that often feature you on the periphery of the heat ridge. .......outside the zone of rain defeating warm air aloft.
Perturbations in the flow traveling around the blocking heat ridge will have tons of heat and humidity to feed on as they traverse outside the perimeter of the 'dome of death". So just outside of a drought caused by a long lived heat ridge in the summer, you will often see excessive rain events.
In your location, more of a northwest flow at times can be seen in La Niña Summers, north and east of the upper level ridge, which provides breaks from shorter duration heat.
Don't let my sort of detailed description and numerous analog's/historical example fool you. The summer weather of 2020 is very uncertain and a heat ridge that is as far east as the Great Lakes would obviously be bad news for you.
Unlike shorter term forecasts, where we can say things like, up to a 90 % chance that temps will be above/below average for a huge swath of the country 2 weeks from now.......with a seasonal forecast, you might just be saying something like "a 20% higher chance than average of a certain kind of weather happening". Temperatures can be predicted with much more skill.
Regarding the likely oncoming of La Niña this summer, I agree with Mike:
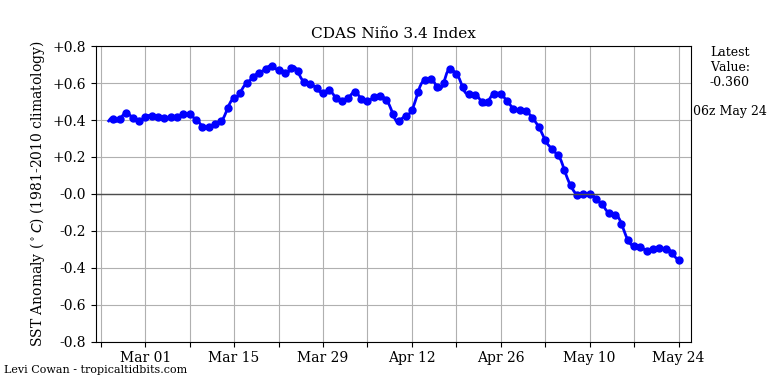
1. This chart from tropical tidbits (based on CDAS water temperatures) suggests the strong and rapid cooling trend in Niño 3.4, the region in the equatorial Pacific most often used to determine La Niña vs neutral vs El Niño. If there end up being sub -0.5 C sea surface temperature anomalies for 5 straight trimonthly periods (doesn’t necessarily match up with CDAS/tropical tidbits by the way but it is a decent indicator), that would get an ONI based La Niña designation in retrospect:
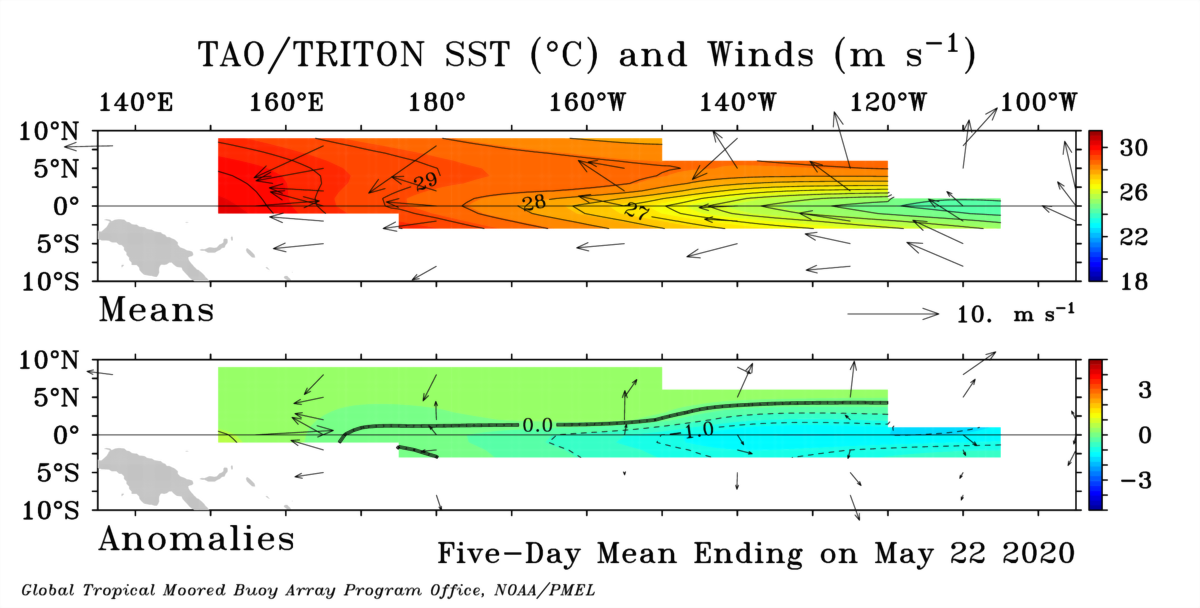
2. This chart is based on TAO-TRITON buoys and it shows La Niña signature with solid cooler than normal between 5N and 5S latitudes, especially east of 150W:
3. The SOI, which is based on barometer reading comparisons at Tahiti and Darwin has recently turned positive (which favors an oncoming La Niña) after having been mainly negative (which favored El Niño) for quite awhile:
https://www.longpaddock.qld.gov.au/soi/
4. The equatorial Pacific OHC anomalies, which Mike talked about and are the subsurface sea temperatures there, have plunged over the last few months from positive anomalies and appear to now be down to around -0.75 C in the 100W to 180 longitudes. The only May anomalies about this cool or cooler than this since 1979 are 1984, 1988, 1998, 1999, 2003, 2010, and 2016 per this link:
https://www.cpc.ncep.noaa.gov/products/analysis_monitoring/ocean/index/heat_content_index.txt
Out of these 7 years, only 2003 didn’t lead to ONI based La Niña by autumn:
https://origin.cpc.ncep.noaa.gov/products/analysis_monitoring/ensostuff/ONI_v5.php
5. So, based on items 1-4, I’d say there’s an 80% chance for an official La Niña (ONI based) to retroactively be declared to have started at some point in 2020.
6. In addition to Mike’s excellent points about what La Niña would portend for the summer, it also likely means an active Atlantic hurricane season, unfortunately. The chances of an active season are even higher because of the warm Atlantic based on what’s classified as a +AMO. If this active season were to verify, we can hope that land areas get lucky and aren’t hit too hard. The SE US has been hit very hard since 2016 and is due for a break. However, unfortunately the danger of a bad season is enhanced.
In the past, an active Gulf of Mexico season, which is common with La Niña, would alone be potentially quite bullish for NG. However, now that Gulf production is so much lower than it was 15+ years ago, Gulf hurricanes are no longer the very bullish factors they used to be. However, they still are potentially quite bullish for OJ if they threaten central or south Florida. Also, hurricanes threatening the SE US or US Gulf coast, especially just prior to or at the start of harvest, are often short term bullish for cotton.
7. If we do get La Niña later in 2020, it would very likely carry over into the winter. What are the typical correlations of moderate to strong La Niña and US winters? Mild SE US to south central to Mid Atlantic to lower Midwest but cold upper Midwest to N Plains to Rockies/west coast. These tend to be bearish for natural gas due to large cities like Atlanta, Cincinnati, DC and NYC often being mild even if Chicago is normal to cold though they vary widely on that front.
However, every La Niña is different and other seasonal factors sometimes override the typical La Niña winter climatology. This would especially be the case if La Niña is a fairly weak version, which is quite possible. Weak to moderate El Niño winters have on average been the coldest SE US winters by a good margin and moderate to weak La Niña winters have correlated on average to the warmest SE US winters by a good margin. However, oddly enough, weak La Niña winters have resulted in the second most likely type of winter to be cold in the SE. So, assuming La Niña actually comes, it will also be important to see how strong it gets, especially for areas like the SE US. If we were to end up with a weak La Niña along with a cold SE US, it could potentially be bullish for natural gas.
8. One last point: Especially if this were to be a moderate to strong La Niña next fall/winter, there’d be a pretty good chance for a temporary global cooling based on the past, especially with it having followed two winters in a row of El Niño. Perhaps this in combination with the current very weak solar minimum would finally result in at least a temporary decent drop in global temperatures though that would remain to be seen.
**This post edited last at 11:20 AM**
The real WxFollower has returned to MarketForum (-:
This is a great contribution Larry on every point Larry.
2 of them, that I totally agree with, I overlooked mentioning in my summary. I will add those and credit you for pointing those correlations out. Hurricanes and temporary global cooling.
Maybe we can find a good source/link to post with analogs between La Nina and tropical activity. On that note, 25 years ago, when so much more ng production was in the GOM, this would be an expecially bullish forecast for natural gas. Potential heat with its increased CDD demand AND the threat of supply disruption.
thanks mike and WX
i hope you are correct. an el nino year usually means a summer that is drier (less monsoon rain). a la nina year often means a normal monsoon (more summer moisture). it'd be nice to have a normal rainy season.
we've had a 20 yr drought in the desert, it may have ended this last winter (a nice wet one), and a wet summer would be great.
YW cutworm and bear!
I need to find some hurricane La Nina analogs for you.
Thanks for sharing your work ! When I want to get a real forecast, this is the place I come !
Thanks bowyer!
June will certainly start out like a La Nina year......at least the first week of it.
Finished planting corn about an hour ago. Started planting April 22. Things were going good except for the cold ! About 2 weeks ago we had huge rains. Looked a lot like last year. The flat fields have big areas where the corn rotted from sitting in water too long. Had seed delivered this morning for replant
Thanks bowyer,
I was wondering how much you were affected by those huge rains in IL 2 weeks ago.
How much rain did you measure?
Great that you got it all replanted that needed to be!
It's not replanted yet ! Still too wet to get in. I had around 4 inches at my house. Anywhere from 5 to 7+ inches in the area. We were actually getting a little too dry before the heavy rain !
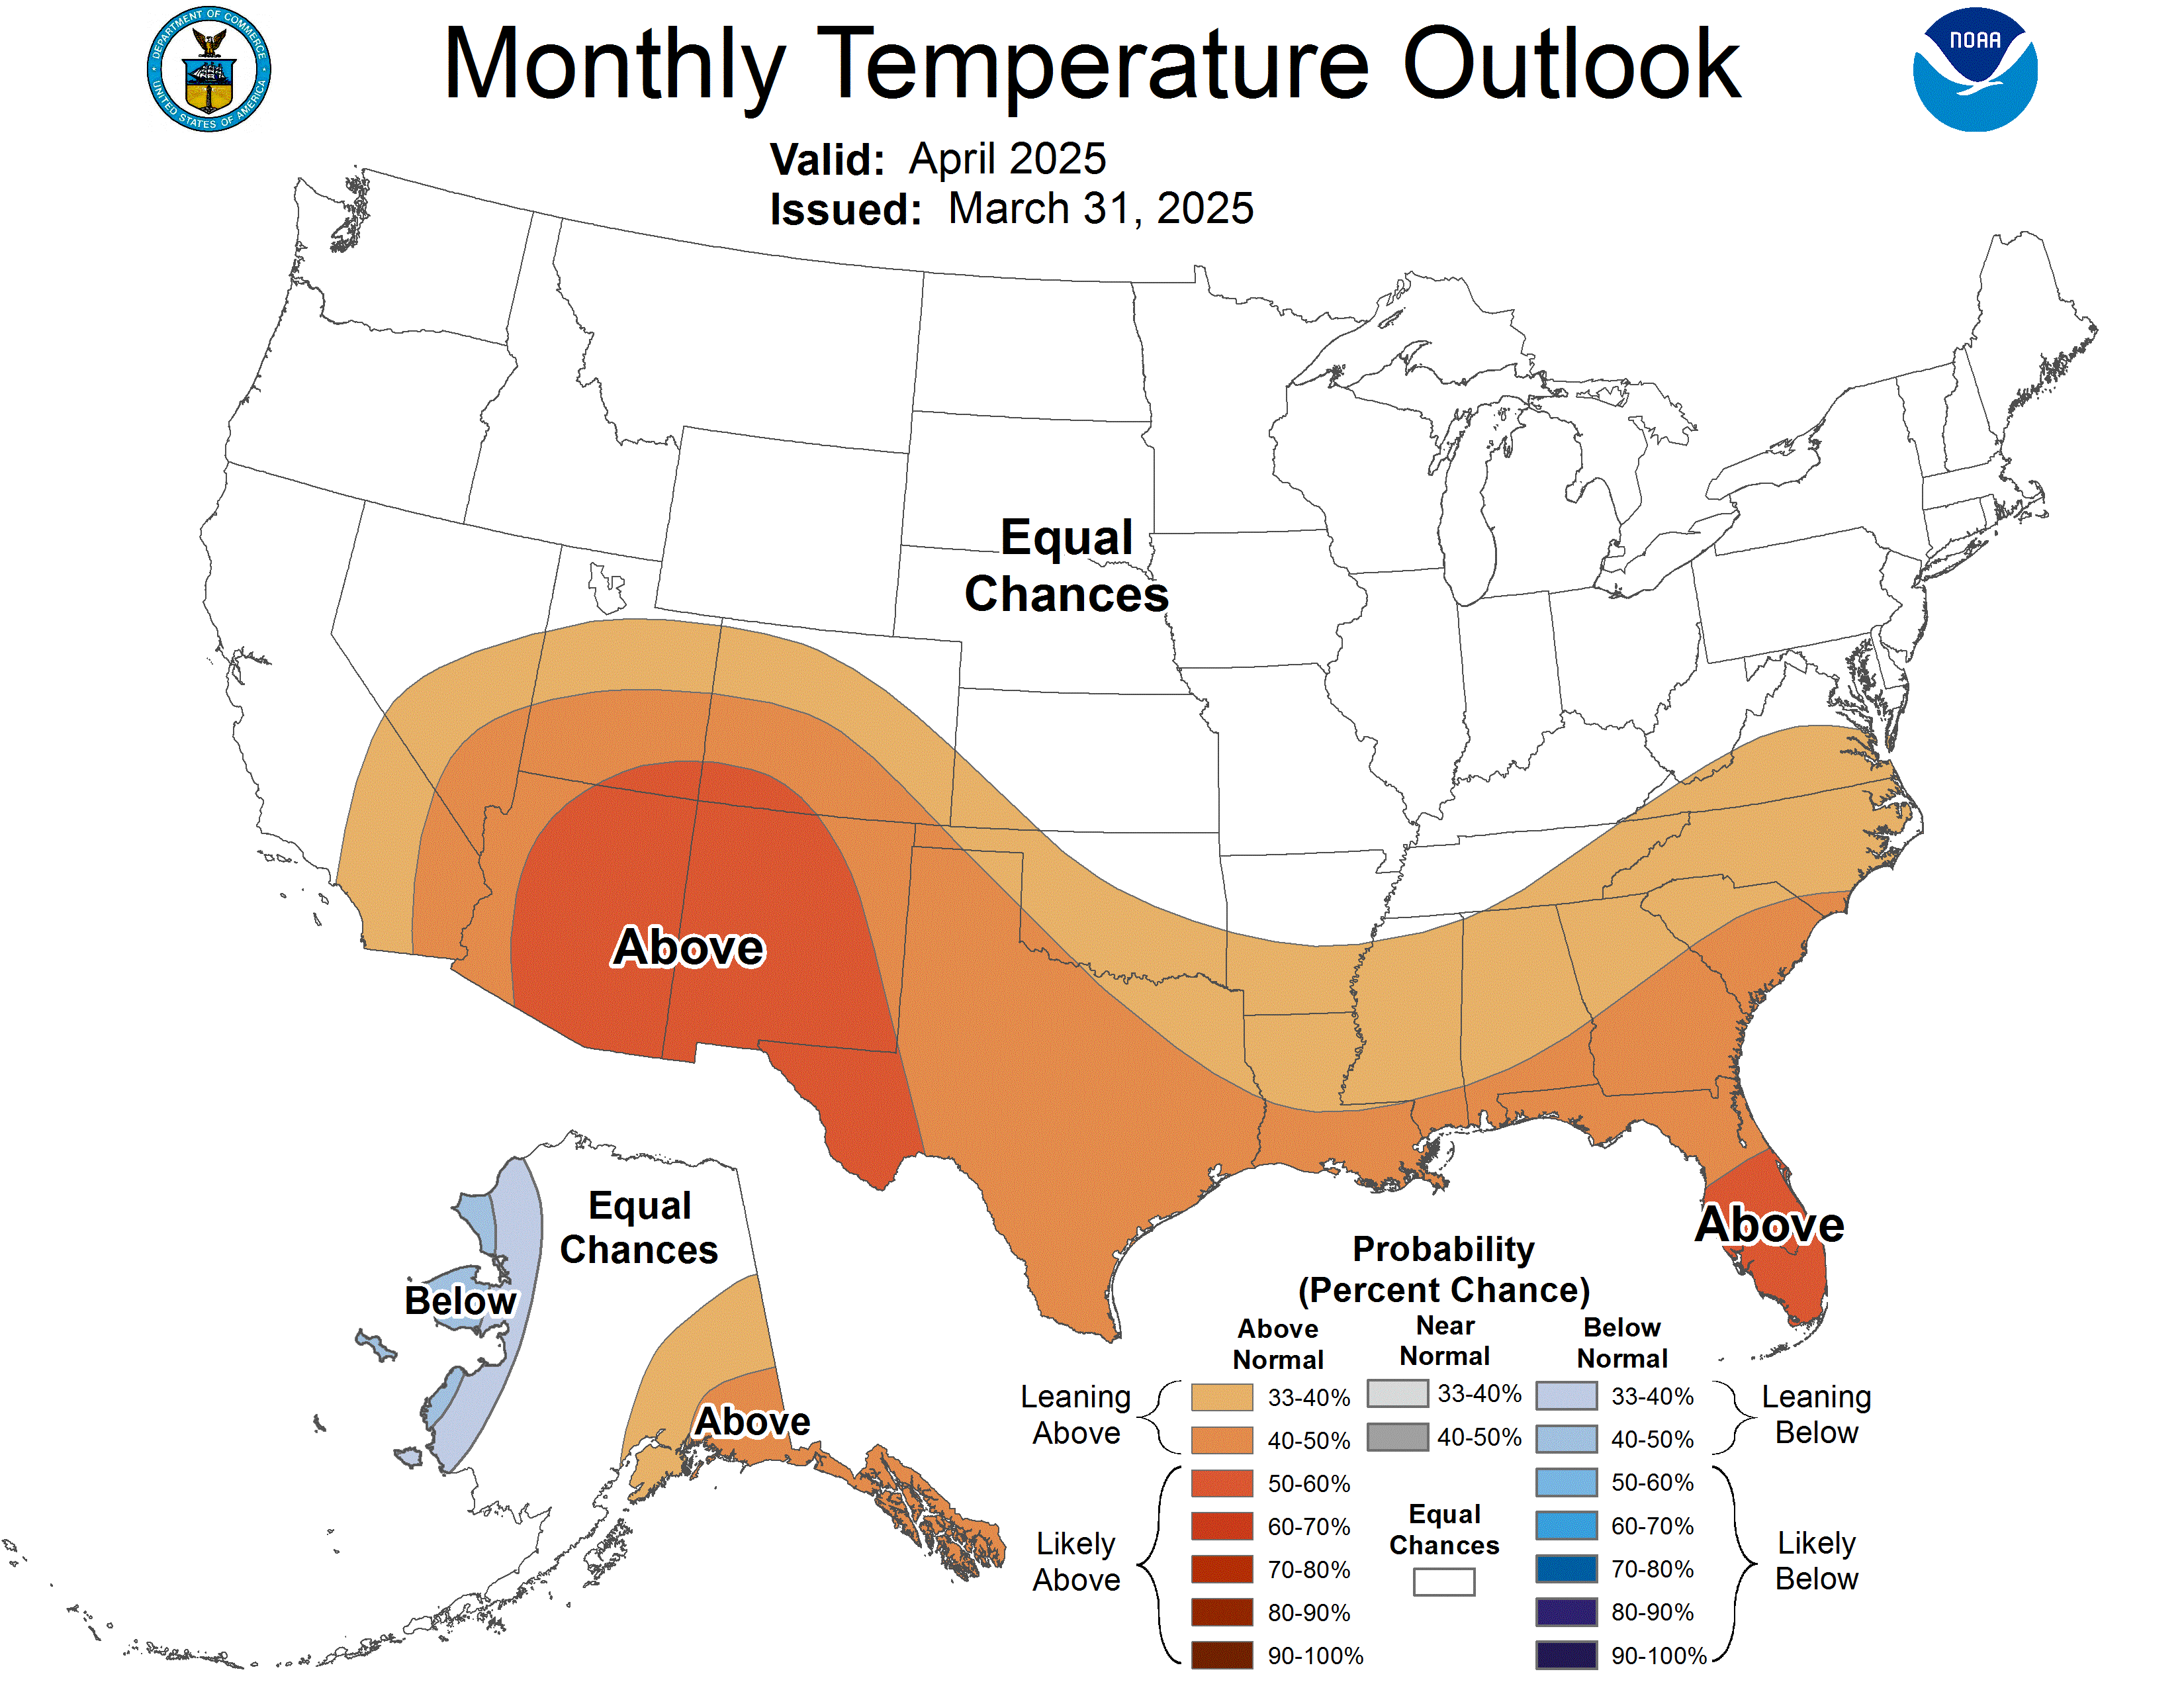
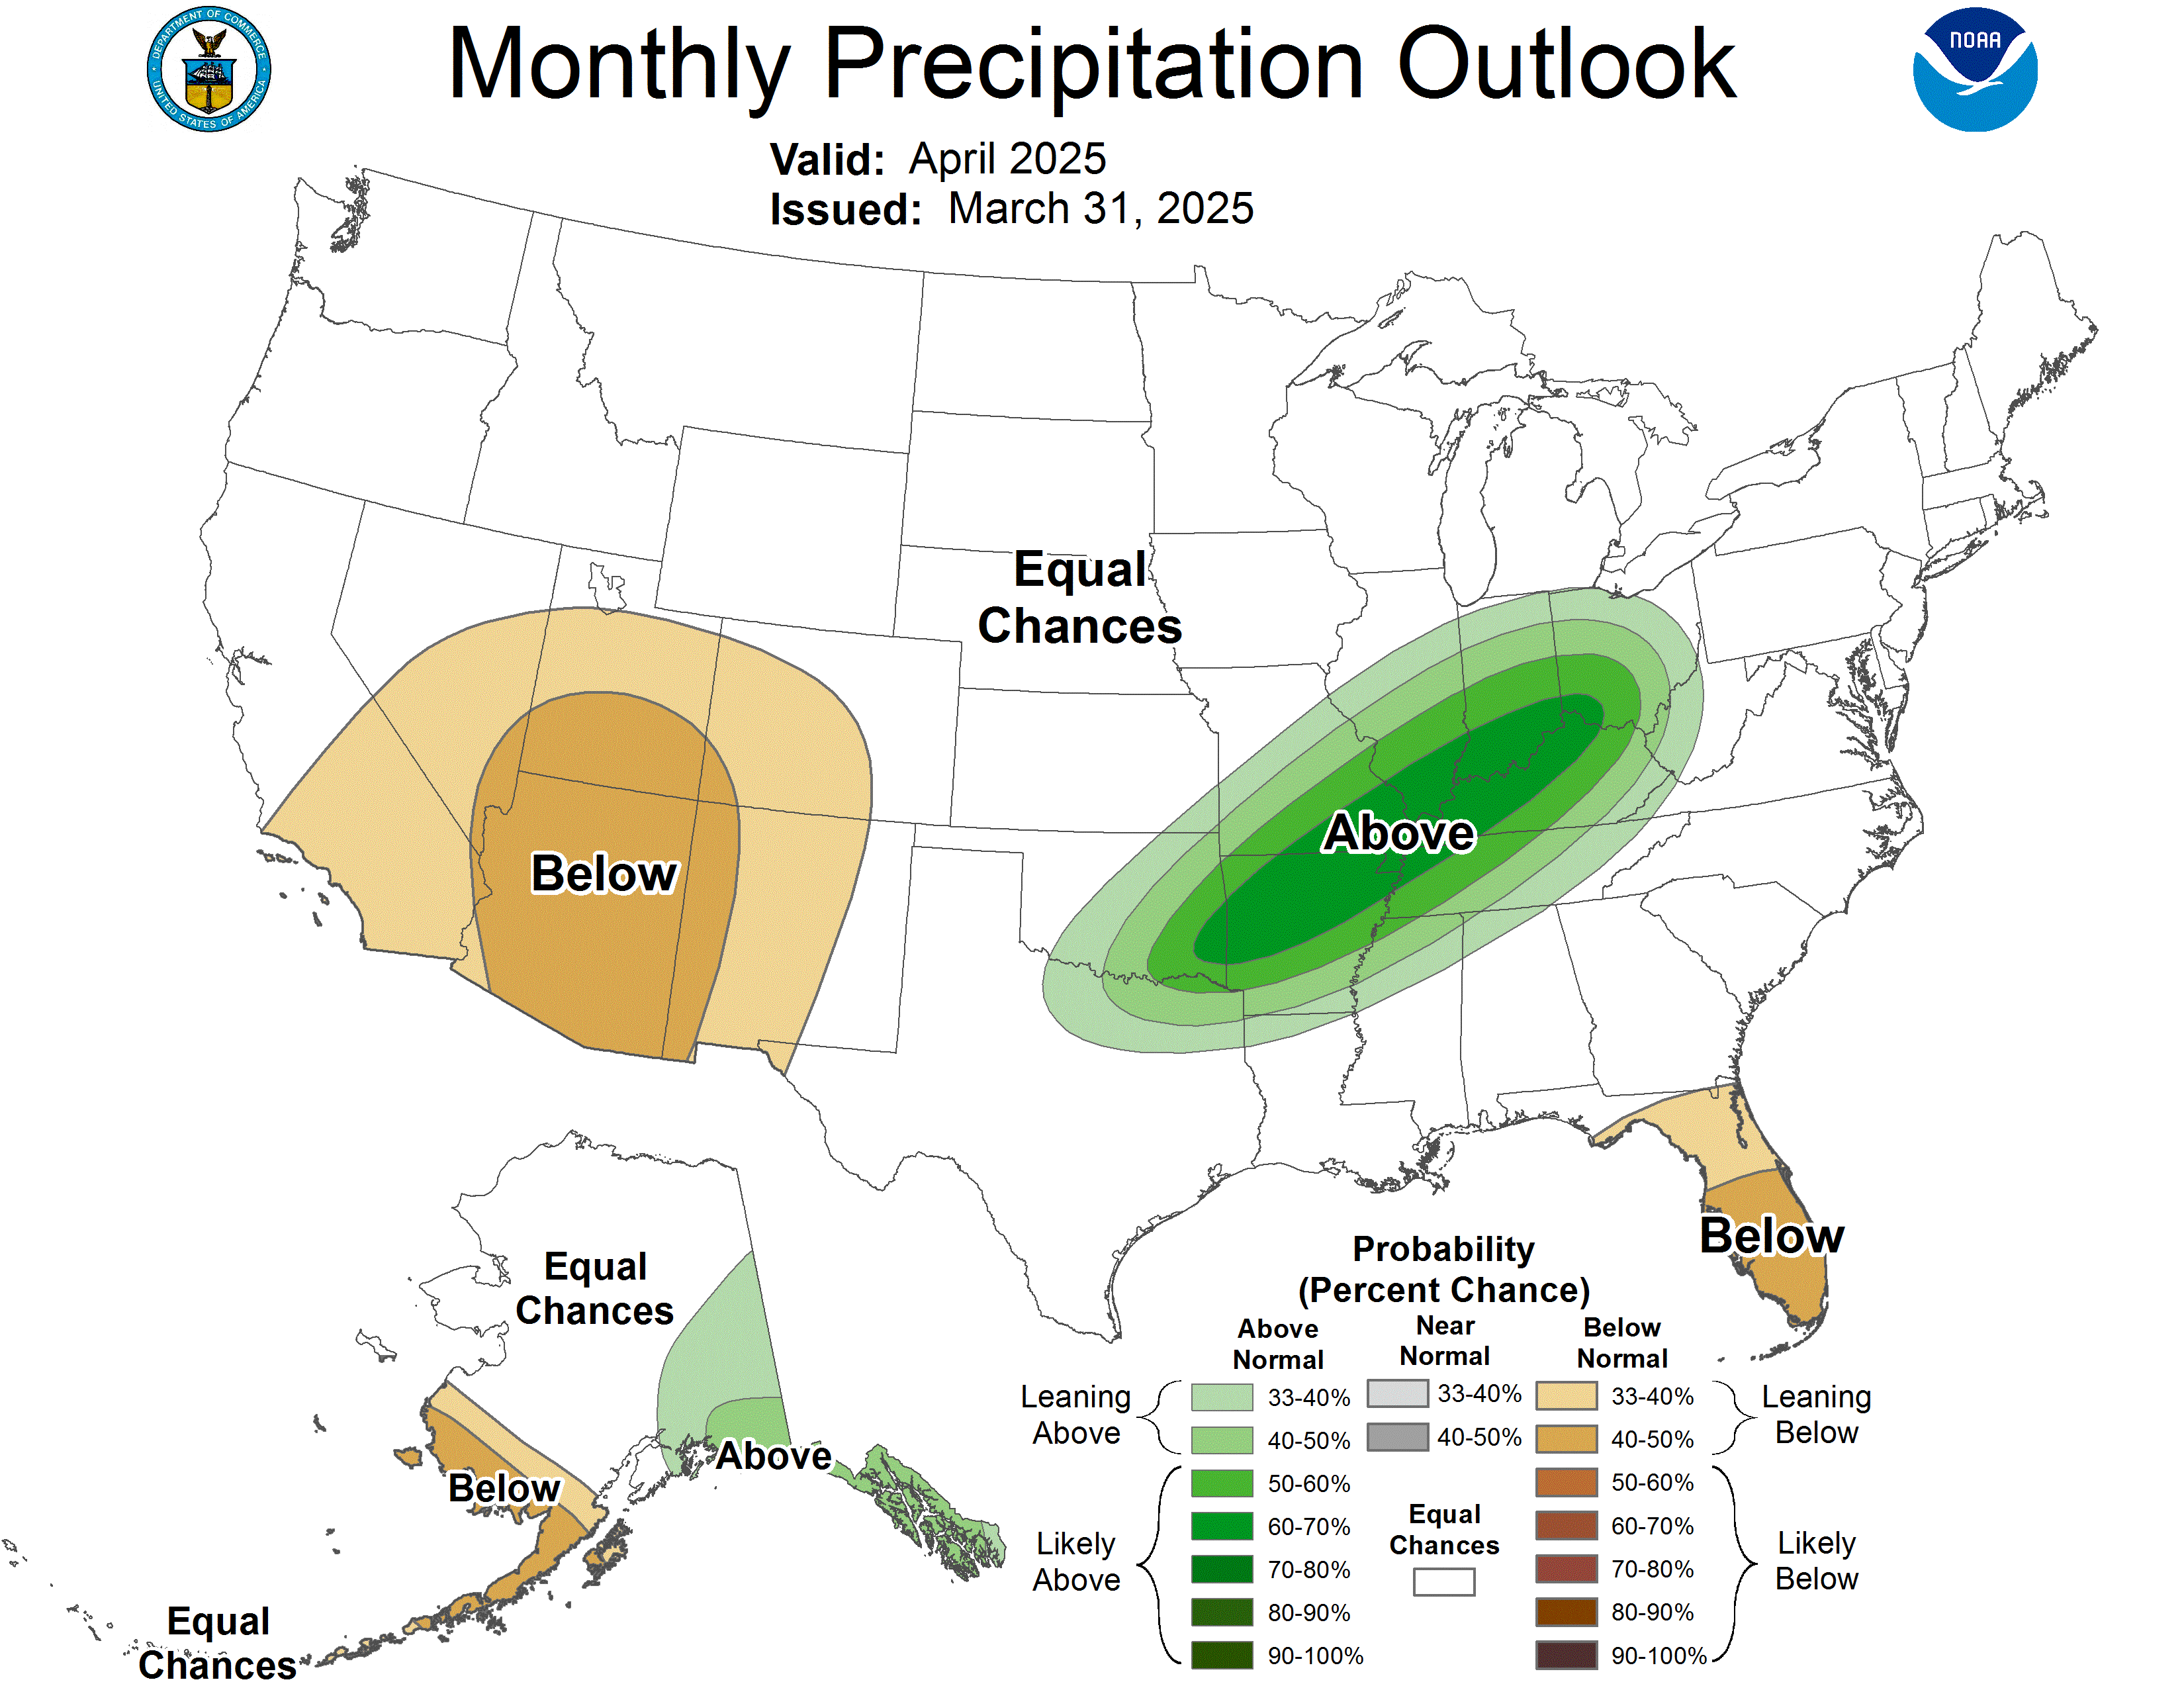
e NWS made HUGE changes to the June forecast. REALLY HUGE!
Previously, the Cornbelt had average temps(equal chances of above and below) and above average rains everywhere.
The new forecast has a high chance of above temps and a large pocket of drier than average, surrounded by average. This is HUGE!
This now agrees with my forecast from over a week ago!!!
| Revised OFFICIAL 30-Day Forecasts | |||
| Issued: May 31, 2020 | |||
  | |||
| | ||||
Makes sense. Looks like we are heading into a La Nina forecast to me. You pointed out all the elements that point to it. If the La Nina pattern lasts through the entire summer, this will be an interesting Hurricane season. Already up top the C storm although the first two were really weak. Cristobal has the potential to have a significant impact to the Gulf Coast.
Thanks bowyer!
Hopefully you'll get it all done.
May only had rains a little above average for you..........but all of it fell in 1 weekend!!
Could make for an interesting meteorological Summer for us Grant!
I need to find some good hurricane analog years, though we know they will show alot of tropical activity in La Nina's (non El Nino years).
How about the NWS updating their June outlook 2 days ago?
The one from 10 days earlier was much cooler and wetter.
Wow, adding tons of heat and taking out tons of rain................ because of weather models changing.............then, 2 days later, today the weather models changed again and their old forecast doesn't look as bad.
Those are the perils of long range(anything over 2 weeks and even sometimes over a week) forecasting.
Regardless of models changing back and forth, I think La Nina influences will greatly increase the odds of hot and dry.
The updated June temperature outlook indicates increased probabilities of above
normal average temperatures for the month over most of the CONUS under a
persistent ridge through at least the first half of the month. Probabilities
exceed 60 percent for parts of the Central Plains, where the probabilities of
above normal temperatures during weeks 1 and 2 are greatest and predicted to
persist in the CPC week 3-4 outlook.
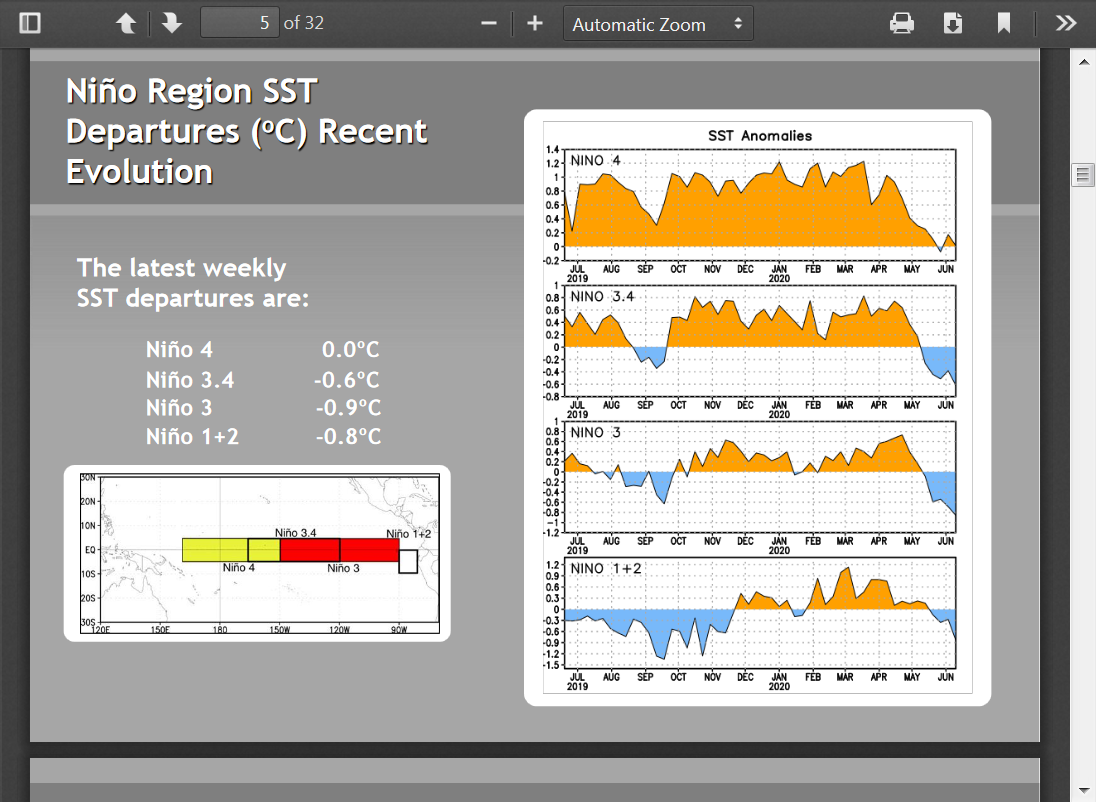
The case for a La Nina this Summer is becoming overwhelming, despite the majority of NOAA models still forecasting neutral thru the Fall. Based on current sea surface temps currently, I contend that early La Nina conditions are already present!
Look at the HUGE plunge lower in SST departures on the right part of the charts below in every region. From El Nino oranges to La Nina blues.........and things are only going to get colder with even colder sub surface temps.
.png)
You can see the actual change at the surface over the last month below. Note the blues, even dark blues along the equator in the Central to Eastern Pacific. This is the key area we are watching for the La Nina. I say it's there already!
.png)
Below the surface, we have a massive blob of cooler water that provides the reservoir for surface cooling the next several months.
.png)
The graphs on the right show progression with time going from top to bottom. The evolution to colder is unmistakable, as the colder water anomalies spread east, rise to the surface and increase. The latest map, on the left, even has a tiny -6 Deg C anomaly. As a reminder, we need surface temps in this region to be -.5 or lower for 3 consecutive months to qualify as a La Nina. Again, I contend that we are there right now but the "official" La Nina can't be declared until we are there for 3 consecutive months(since values can fluctuate from month to month). With this much cold water tracking to the surface, it seems less likely that surface temps will suddenly reverse and get warmer again the next few months(which is the only way that we WON'T have a La Nina this Summer).
_yVqo5Ej.png)
Update coming later today............we are now in the early stage of a La Nina!!
My forecast philosophy remains unchanged and is being confirmed. Note the updated Tropical Pacific temperatures below continue to plunge..........now below the La Nina threshold of -.5 Deg C.
1. NOAA waits for these conditions to be present for 3 consecutive months before declaring it a La Nina.
2. The atmosphere does not wait around for NOAA to tell it we have a La Nina........it responds immediately to the conditions, so the atmosphere right now, is being affected by weak La Nina conditions.
3. With alot of even colder sub surface water, the surface could cool a bit more but this is uncertain.
4. Weak La Nina conditions are not as powerful in affecting the weather as strong La Nina's(or El Nino's).
5. There is more going on than just a weak La Nina. Other factors, like a strong northern stream can interfere with or deflect the teleconnection affect from the southern stream direction/La Nina.
6. Even in moderate/strong La Nina years, the typical heat ridge can vary in location in the US. Some years in the S.Plains, some in the South, other years in the Midwest or even farther west. Regardless, we now have an atmosphere that will want to make a heat ridge somewhere in the US(downstream) if the La Nina influence is allowed to dominate.
Eric Snodgrass long range forecast discussion June 17 2020
Thanks a million cutworm!
Eric is the best. Whenever you have one of his presentations it would be wonderful if you can pass them on.
He thinks July will feature pretty normal weather with low confidence.
I almost never predict beyond 2 weeks but am making an exception right now and with low confidence, predicting a significant heat ridge with hot/dry weather somewhere.
We should note how quickly the S.Plains dried out under this regime the past month. Tomorrows drought monitor will show a big expansion of the drought in that area.
Nice rains coming up though which could help to replenish some of the flash drought deficits that quickly happened.
After seeing the latest SST's which are not quite as cool as last month, my forecast philosophy remains close to the previous views. It looks unlikely that surface temps will plunge lower, so we may be on the border of weak La Nina and neutral for several months.
Regardless, this still increases the chances of a large heat ridge somewhere downstream in the US vs during an El Nino year that has the opposite affect.
Considering the heat in the latest 2 week models, we can be confident that July will start out very warm to hot in much of the country and very few cool places.
No change in the forecast philosophy.
SST's have continued below average in the Eastern Tropical Pacific.
Not low enough for this to be a La Nina yet but enough to induce an atmospheric reaction downstream that greatly favors a major heat ridge/dome over a large part of the country.

As always, great stuff Mike. I would say that your predictions have been spot on.
Thanks much Jim!
Seasonal forecasts don't display a tremendous amount of skill for obvious reasons but they do have value. In some cases, more than others, especially with regards to unique situations where a few things or even one thing jumps out as being important enough to push the odds strongly in one direction.
La Nina or near La Nina Summers have an extremely high correlation and CAUSATION with massive heat ridges downstream in the US............so I couldn't pass this opportunity up, despite, as you know being a meteorologist that does not issue seasonal forecasts.
Also, NOAA and others are not forecasting an official La Nina until later in the year but the atmosphere, is not waiting for their designation and most importantly, they define a specific temperature for 3 months to call it a La Nina. The atmosphere does NOT follow this manmade designation of the La Nina rule. When temperatures in the East, Equatorial Pacific drop, the atmosphere above reacts right away.
As ocean temperatures drop towards the human designated La Nina, the atmosphere is abiding by the laws of nature, which is telling it to act just LIKE a human designated La Nina BEFORE the humans tell everyone "We have a La Nina everybody!"
Bottom line is that even slightly cooler than average temps in this key area can have a powerful influence.
Another key element. It's not just the absolute temperature in this region that matters. Its the contrast between that temperature and surrounding Pacific Ocean water temps.
If the entire Pacific Ocean got very cool and we designated it as being a La Nina but surrounding areas were even COOLER than the East Tropical Pacific, they would probaly negate much of the La Nina affect.
Right now, the warmth surrounding this key cooler area is likely enhancing the affect because of the contrast.
GREAT FORECAST MIKE ....
I dont know if you have or use twitter but I have been on the HIT dry JULY AUG train since APRIL as well.
-pdo
+AO
+AMO
LA nINA
Thanks and congrats to you Dave!
#LaNina is expected to develop later in 2020 and persist at least thru early 2021. The last La Nina was in 2017-18 & it coincided with terrible harvests of #corn and #soybeans in #Argentina and far southern #Brazil. Drought also set in for S. U.S. Plains (HRW #wheat country).
But, there was also technically a La Nina over the N. Hem winter of 2016-17, and crops in both South America and the U.S. were fine. That La Nina was weaker and had a lot of features that actually resembled El Nino-type conditions. La Nina isn't ALWAYS bad, but the risk rises.
The 2016-17 La Nina was more focused on 2016 and was fading by very early in 2017. I think that might have been a factor in why it didn't negatively impact crops. The 2017-18 episode carried well into March-April. So the timing will be very important, too.